 Amal Boukteb1,2†
 Shota Sakaguchi3†
 Yasunori Ichihashi4
 Mohamed Kharrat2
 Atsushi J. Nagano5
 Ken Shirasu6*
 Mariem Bouhadida2*
- 1Faculty of Science of Tunis, University of Tunis El Manar, Tunis, Tunisia
- 2Field Crop Laboratory, National Institute of Agricultural Research of Tunisia, Carthage University, Tunis, Tunisia
- 3Graduate School of Human and Environmental Studies, Kyoto University, Kyoto, Japan
- 4RIKEN BioResource Research Center, Tsukuba, Japan
- 5Faculty of Agriculture, Ryukoku University, Otsu, Japan
- 6RIKEN Center for Sustainable Resource Science, Yokohama, Japan
Orobanche foetida Poiret is a holoparasitic plant that lacks chlorophyll and totally depending on its host for its growth. Orobanche foetida parasitizes host plant roots and extract nutrient and water via a haustorium. Although O. foetida distributes in the Mediterranean region as a wild plant parasite, it parasitizes faba bean causing serious damages which may reach 90% yield losses in Tunisia. Analysis of genetic diversity of the parasite is important to better understand its evolution and spread, remained largely unknown. In this work, we present the first study on genetic diversity and population structure using the robust technique Restriction-site-Associated DNA sequencing (RADseq) for Orobanche spp. We collected 244 samples of O. foetida from 18 faba bean fields in the north of Tunisia including 17 populations from the north-west and one population form the north-east. To overcome the difficulty of SNP discovery in O. foetida genome as a non-model and tetraploid plant, we utilized three different informatics pipelines, namely UNEAK, pyRAD and Stacks. This study showed that genetic differentiation occurred in the Tunisian O. foetida emphasizing the isolation by distance effect. However, no strong population clustering was detected in this work basing on the three data sets and clustering methods used. The present study shed the light on the current distribution and the genetic variation situation of the fetid broomrape in Tunisia, highlighting the importance of understanding the evolution of this parasite and its genetic background. This will aid in developing efficient strategies to control this parasite and its expansion in Tunisia and worldwide.
Introduction
Orobanche is the largest genus among the holoparasitic members of Orobanchaceae with about 170 species (Uhlich et al., 1995). Orobanche foetida Poiret (common name: fetid broomrape) is one of the most virulent species of Orobanche; it is an obligate holoparasite, devoid of chlorophyll, parasitizing plant roots and totally depending on its host for its growth. It establishes a connection at host root level via a haustorium to extract nutrient and water. Poiret described the fetid broomrape for the first time in North Africa during his surveys on 1783 (Poiret, 1922). It is a tetraploid plant (2n = 4x = 76) (Román et al., 2003; Schneeweiss et al., 2004) characterized by a red color and a fetid smell. It was generally considered as a wild plant parasite widespread in natural habitats in the western Mediterranean countries; Tunisia, Algeria, Morocco, Spain and Portugal (Pujadas-Salvá et al., 2003).
In Tunisia, two Orobanche species were noticed by Chabrolin since 1939 (Chabrolin, 1939) on faba bean field, O. foetida Poir. and O. crenata Forsk (called at that time O. speciosa). At that period, the main constraint on faba bean crop in Tunisia was caused by O. crenata, while O. foetida was observed with insignificant damage. Currently, O. foetida is representing a real threat causing severe damages in Tunisia mainly on faba bean. In fact, O. foetida populations are more aggressive on faba bean than on other food legume crops (Kharrat and Halila, 1994). Whereas, in Spain and Portugal O. foetida was only observed on wild legumes, while O. crenata was highly damaging faba bean fields (Román et al., 2007b). Moreover, O. foetida in Morocco, was detected only on wild legumes such as Scorpiurus and on only one cultivated species Vicia sativa (common vetch), but never on faba bean, even when this legume crop was in close proximity, or even in the same O. foetida-infested field (Rubiales et al., 2005). Thus, the damages of O. foetida on faba bean have been reported only in Tunisia according to all researches conducted till now on this parasite.
Regarding the geographical distributions of O. crenata and O. foetida in Tunisia, differences have been reported. Orobanche crenata is observed mainly in the northern and central-eastern regions, whereas O. foetida is reported in the central and western north of Tunisia (Kharrat et al., 1992).
The potential of O. foetida to become a real threat to agriculture exists and has to be taken into account. Indeed, O. foetida may display a rapid host-differentiation, shifting from wild to cultivated legume hosts, as the case cited by Vaz Patto et al. (2008) in Morocco. Moreover, the increasing infestation of legume growing area with O. foetida in Tunisia is also of great interest from an evolutionary aspect, since this species is especifically parasitizing wild hosts in the other Mediterranean countries as mentioned above. Indeed, the fetid broomrape was described as a real threat on faba bean crop for the first time on 1992 in the north-west of Tunisia (Kharrat et al., 1992), causing severe damages with yield losses more than 90% (Abbes et al., 2007a) and ever since, O. foetida was detected on different crops such as chickpea (Cicer arietinum), grass pea (Lathyrus sativus), lentil (Lens culinarus), vetch (Vicia sativa) and fenugreek (Trigonella foenum-graecum) (Kharrat, 2002; Amri et al., 2009). The long-term persistence of O. foetida seeds in the field have impelled farmers to renounce to faba bean, the most grown pulse in Tunisia, thus, having a negative impact on soil fertility and farmer benefit.
Various methods were developed and adopted to control the parasitic plant at different stages. Some methods were adopted to reduce the parasitic seed production and its dispersal mainly via hand weeding, transplanting and deep sowing or by enhancing chemical soil fertility (Goldwasser and Rodenburg, 2013). Nevertheless, it is not possible to completely eliminate the parasite seed bank in the soil (Goldwasser and Rodenburg, 2013). Other methods had to deal with the existing seed bank using solarization method and cropping system (Trap crops ‘false host’, Catch crops and Crop rotations) (Abebe et al., 2005; Goldwasser and Rodenburg, 2013; Abbes et al., 2019). Chemical control was also adopted and the best result for O. foetida was obtained by the application of Glyphosate at budding stage and 15 days later (Kharrat and Halila, 1996). However, this herbicide suppress phytoalexin biosynthesis in legumes (Lévesque and Rahe, 1992; Sharon et al., 1992), which affects the crop immunity system leading to diseases (Foy et al., 1989). Additionally, biological control approaches were conducted mainly, using insects such as Phytomyza orobanchia for broomrape (Linke et al., 1990; Klein and Kroschel, 2002) and fungal pathogens such as Fusarium sp. for O. foetida and O. crenata, which decreased the parasite emergence and biomass about 70-100% (Boutiti et al., 2008). All the above methods revealed to be well-functioning in some cases, but approving an integrate strategy using several methods in the same time showed to be more efficient. Improving the genetic capacity of the plant host to deal with the parasite attacks through breeding for resistance, seems to be the most appropriate and cost-effective means of managing. Many progresses have already been achieved in this topic. Cubero and Moreno (1999) reported that the broomrape resistance is of polygenic nature and controlled by a quantitative genetic system with strong additive effects. Studies of quantitative trait loci (QTL) for O. crenata resistance in legumes using molecular markers have strengthen its complex inheritance (Román et al., 2002; Valderrama et al., 2004). Moreover, the aggressiveness of different broomrape biotypes is highly variable. Thus, better understanding of the evolution of Orobanche is primordial to better estimate their aggressiveness and their capacity to attack other crops. Indeed, several sources of resistance to broomrape mainly for O. crenata from Egypt (Giza 402), Spain (VF172), ICARDA (BPL2210) were used in crosses to release new faba bean varieties with good tolerance to O. crenata and O. foetida such as Giza 429, Giza 674, Giza 843, etc. from Egyptian breeding programs (El-Shirbini and Mamdouh, 2004); Baraca, Alameda, Brocal, Quijote, and Navio from Spain (Cubero et al., 1992; Nadal et al., 2004; Rubiales et al., 2014). In Tunisia, the faba bean breeding program released two varieties “Najeh” (Kharrat et al., 2010) and “Chourouk” (Amri et al., 2019) tolerant to O. foetida and O. crenata (Abbes et al., 2007b) from the different sources of resistance cited above and used in crosses as genitors with local lines selected for their agronomic performances.
In order to establish efficient strategies in Breeding programs, it is required to investigate the genetic variability within and among O. foetida populations. Genetic diversity studies gives a wise information about the target populations particularly on their appartenance to one or many gene pools. In fact, several studies were conducted to analyze the genetic diversity in Orobanche genera for several species using different techniques mainly; isoenzymes for O. crenata (Verkleij et al., 1986) and O. cumana (Castejon Munoz et al., 1991), RAPD for O. crenata (Román et al., 2001b), O. cumana (Gagne et al., 1998), O. gracilis (Román et al., 2007a) and O. ramosa (Brault et al., 2007), ISSR for O. minor (Westwood and Fagg, 2004), AFLP for O. cumana (Gagne et al., 2000). Ever since, specific markers were developed for some species such SSR for O. cumana by Pineda-Martos et al. (2014b) which offers the opportunity to study O. cumana diversity in many countries; Spain (Pineda-Martos et al., 2013; Martín-Sanz et al., 2016), Tunisia (Jebri et al., 2017) and Turkey (Bilgen et al., 2019). These markers were also used recently to study the genetic diversity of O. crenata populations from Ethiopia (Belay et al., 2020). Besides, SRAP markers were used to study O. crenata populations from Morocco (Ennami et al., 2017). Regarding O. foetida, the first study was performed using RAPD markers (Román et al., 2001a) focusing on Tunisian and Spanish populations, later AFLP markers were used to study the genetic diversity of Moroccan populations (Vaz Patto et al., 2008) of O. foetida collected from wild plants and one crop showing a genetic variation between them. Moreover, Bouhadida et al. (2015) studied the Tunisian populations of O. foetida collected from five legume crops using the universal markers RAPD. Thus far, no specific markers have been developed for O. foetida.
The ongoing progress of sequencing technologies offers the possibility to conduct advanced research on non-model plant. Restriction-site-Associated DNA sequencing (RADseq) (Davey and Blaxter, 2010) is a promising technique for population genetics particularly for species with limited genetic resources. Single nucleotide polymorphisms (SNPs) obtained by RADseq proved to be more informative than microsatellites in the matter of inferring population structure and relatedness estimation between individuals (Bruneaux et al., 2013; Thrasher et al., 2018; Lemopoulos et al., 2019). However, challenges arise for polyploidy species during data analysis in order to differentiate true alleles at a single locus from those generated by paralogs and duplicates (McMullen et al., 2009).
The purpose of the present study is to investigate genetic diversity and population structure of the Tunisian O. foetida populations collected from 18 natural infested faba bean fields using RADseq. To deal with the tricky SNP calling task, we used three different pipelines previously applied for polyploidy species; pyRAD (Eaton, 2014) a de novo assembler for RADseq loci, UNEAK developed especially for species without a reference genome (Lu et al., 2013) and Stacks (Catchen et al., 2013) which presumes the studied species as diploid.
Materials and Methods
Sample Collection
We conducted several surveys from 2010 to 2016 covering large areas in the north, the center and the south of Tunisia, known as habitats of different Orobanche species. In total, we sampled 18 populations of O. foetida from naturally infested faba bean field representing 244 samples of O. foetida plants from the north of Tunisia. The geographic location of the collected population is depicted in Figure 1.
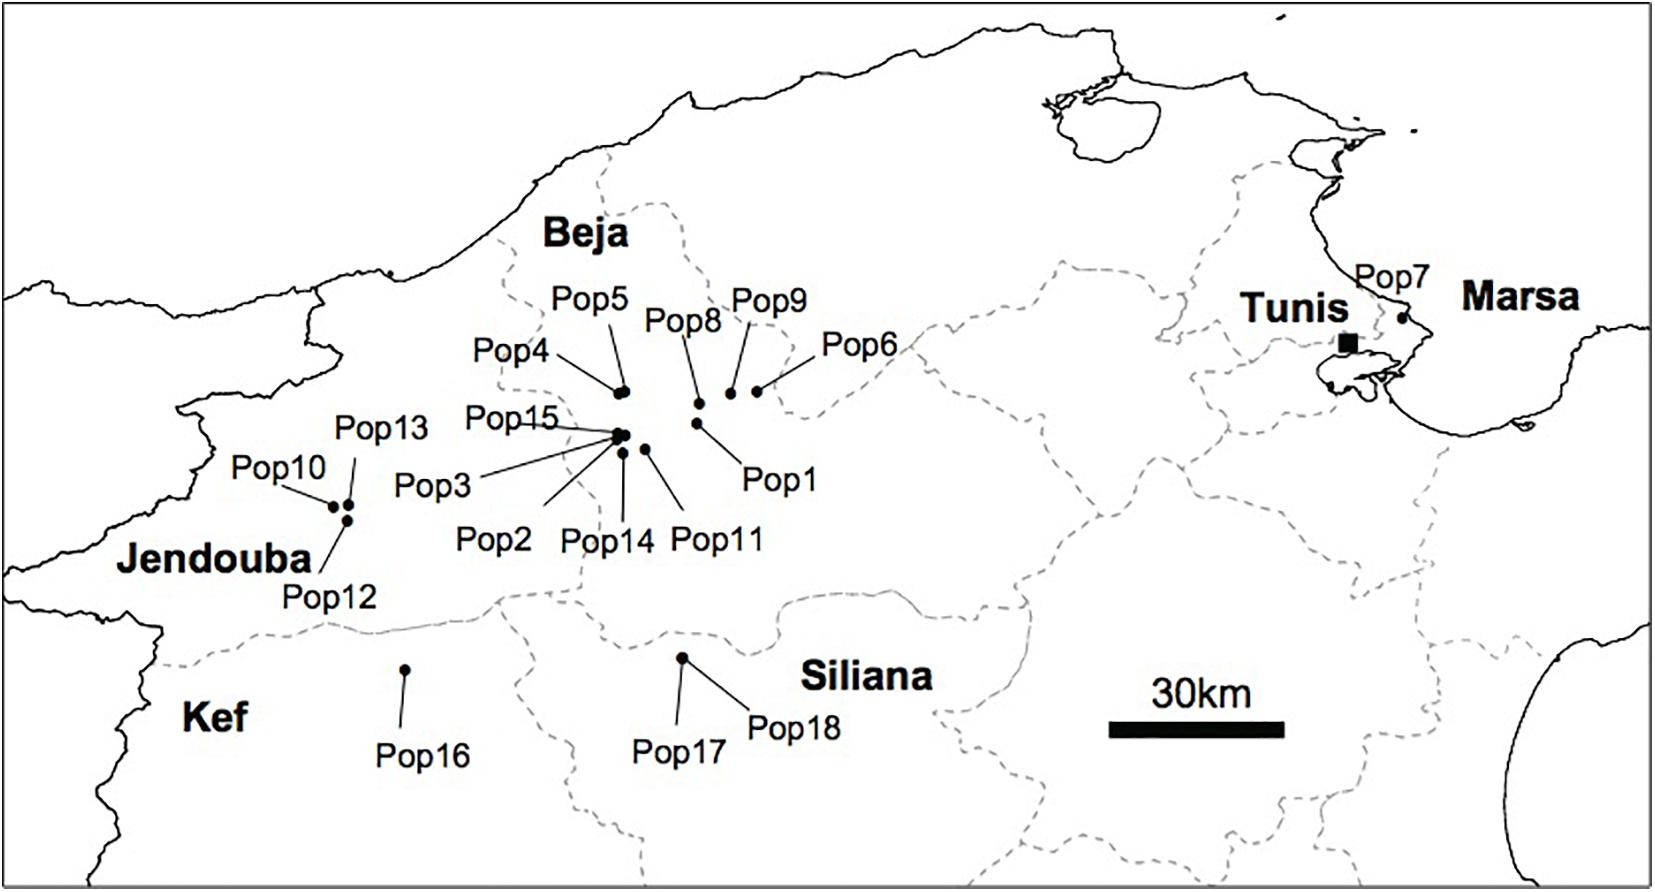
Figure 1. Geographic distribution of the 18 O. foetida collected from faba bean field in the North of Tunisia.
DNA Extraction, Library Prep and Sequencing
DNA was extracted from fresh floral buds (180 mg per sample) using innuPREP Plant DNA Kit (AnalytikJenaInd, Berlin, Germany) following the manufacturer’s instructions. Restriction-site-Associated DNA (RAD) libraries were prepared following the protocol according to Sakaguchi et al. (2015). In brief, we performed an enzymatic digestion using BglII and EcoRI and ligation with Y-shaped adaptors followed by a PCR with KAPA HiFi HS ReadyMix (KAPA BIOSYSTEMS). Size selection for fragments of approximately 350 base pairs (bp) was carried out using the E-Gel size select (Life technologies, CA, United States). We conducted a single-end sequencing with a read length of 51bp with the Illumina HiSeq 2500 platform (Illumina, CA, United States).
Bioinformatic Analysis
The SNP calling was a challenging task due to the absence of a reference genome and the tetraploidy of O. foetida. We used three different software or workflows for comparison; (1) The Universal Network-Enabled Analysis Kit (UNEAK) implemented on TASSEL v3.0 software characterized by its ability to resolve the paralog, repeat issues and to analyze ploidy organisms (Lu et al., 2013), (2) Stacks, which distinguishes between sequence polymorphism and sequencing errors by the inclusion of a maximum likelihood statistical model (Catchen et al., 2013), and (3) pyRAD (Eaton, 2014), which allows a better identification of homology across highly divergent samples by the incorporation of indel variation (Qi et al., 2015).
We started our analysis by trimming raw reads with TRIMMOMATIC v.0.32 software (using the commands LEADING:19, TRAILING:19, SLIDINGWINDOW:30:20, AVGQUAL:20 and MINLEN:51). For the UNEAK pipeline, Tag counts were generated from FastQ files with the FastqToTagCountPlugin, then were merged with the MergeMultipleTagCountPlugin, the minimum count of a tag that must be present was defined to five. Tag pair was identified for SNP calling with UTagCountToTagPairPlugin and the error tolerance rate was specified as 0.03. Then, UTagPairToTBTPlugi and UTBTToMapInfoPlugin were applied before generating the HapMap file with UMapInfoToHapMapPlugin by fixing minimum and maximum allele frequency on mnMAF = 0.05 and –mxMAF = 0.5,–mnC = 0.5 and –mxC = 1. For Stacks, we set the minimum number of identical reads required to create a stack (m = 3), the nucleotide mismatches between loci within a single individual (M = 2), and the mismatches between loci when building the catalog (n = 1). The SNP genotype for each individual was exported with a minimum read depth of 6, using the ‘populations’ program implemented in Stacks. Finally, we set the following parameters for pyRAD workflow; 0.95 similarity, MinCov = 108, MaxSH p.50 and ploidy = 4.
Population Analysis
To infer the genetic structure of studied populations, we used 4 different methods. Firstly, we used two Bayesian clustering programs relying on Markov Chain Monte Carlo algorithms (MCMC) to explore genetic structure in the genetic data; fastSTRUCTURE, a non-spatial method and TESS3 a spatial admixture analysis (Caye et al., 2016). Firstly, fastSTRUCTURE (Raj et al., 2014), can perform model-based inference of genetic ancestry by assuming random mating and linkage equilibrium within genetic clusters, and have been used for a broad range of sexually reproducing organisms (Falush et al., 2003; Harter et al., 2004). The model was set to allow admixture and correlated allele frequencies between genetic clusters, with an option of specifying sampled site (“LOCPRIOR” model). The 20 independent runs with 50000 burn-in and 100000 MCMCs were performed for each K value from 1 to 10 on a Linux workstation. Secondly, TESS3 provides ancestry coefficients estimations by combining matrix factorization and spatial statistical methods (Caye et al., 2016). It was developed in order to improve the inference of admixture proportions when they are variable across space (Durand et al., 2009). We applied a geno format file to run TESS3 in the Linux R environment according to the following parameters; K = 1:18, method = “projected.ls”, ploidy = 2, max.iteration = 1000, rep = 20, keep = “best.” The visualization of barplots was performed using the R package “Pophelper” v2.3.0 (Francis, 2017) in R v3.5.3 (R Core Team, 2019). To complement the fastSTRUCTURE and TESS3 analysis, we carried out a discriminant analysis of principal components (DAPC), which does not assume any population models using the “adegenet” v2.1.1 (Jombart and Ahmed, 2011) package in R v3.5.3 (R Core Team, 2019). Additionally, we performed the principal component analysis (PCA) using the “adegenet” v2.1.1 (Jombart and Ahmed, 2011) package in R v3.5.3 (R Core Team, 2019), to extract the synthetic variables in order to represent major genetic variations.
Genetic diversity and genetic variance were estimated within and among the 18 collected populations. We used “hierfstat” v0.04-22 package (De Meeûs and Goudet, 2007) in the R v3.5.3 (R Core Team, 2019) to determine genetic diversity parameters including the allelic richness (Ar), the observed heterozygosity (Ho), the expected heterozygosity (He), the inbreeding coefficient (FIS) and the fixation index (FST). The analysis of molecular variance (AMOVA) was carried out to examine patterns of genetic variation and to estimate variance components for the 18 collected populations using “poppr” v2.8.2 (Kamvar et al., 2014) package in R v3.5.3 (R Core Team, 2019) (using poppr.amova function). Furthermore, we tested the isolation by distance (IBD) by performing a Mantel test for correlation between Edwards’ distances and Euclidean geographic distances for the 18 collected populations with “adegenet” v2.1.1 (Jombart and Ahmed, 2011) package in R v3.5.3 (R Core Team, 2019) (using mantel.randtest function) by conducting 999 permutations for significance assessment.
Results
Population Structure
According to our surveys conducted in several regions known as natural habitats for Orobanche spp., we detected the presence of O. foetida populations only in the north of Tunisia as mentioned in Figure 1. To investigate population structure of this fetid broomrape collected from the north of the country, we applied three different clustering methods including model-based methods (TESS3 and fastSTRUCTURE) and non-model-based method (DAPC) to the three genetic data sets generated by pyRAD, Stacks and UNEAK pipelines. For a better comparison among the clustering patterns, we superimposed the pie charts of the average membership probabilities of each population (estimated Q values) on geographic maps (Figure 2). We defined the parameter K, which describes the number of subpopulations that make up the total population (Verity and Nichols, 2016), as the minimum values of Ks that can capture biologically interpretable genetic structure (Pritchard et al., 2000). In fact, this criterion considers the appropriate Ks, after which, any increase in K contributes to a new cluster assigned to any population at very low proportion, while admitting other statistic methods (e.g., delta K method), they may indicate smaller values of Ks (Supplementary Figure 4). Thus, we adopted the above criterion since manual inspection of the clustering patterns for sequential Ks merits in grasping the effective genetic structure within the data sets. Overall, while we recognize certain levels of differences in genetic clustering, our comparison of clustering patterns revealed some populations that were differentiated from others across the genetic data and clustering methods. Pie charts represented in the Figure 2 with different color patterns were variable and pointed out the ancestral contribution in each studied population. It is important to mention the predominance of the light blue in population 7 (Pop7) (Figure 2). Moreover, the black was depicted mainly among Jendouba populations (Pops 10, 12, 13) in TESS3 (Figure 2C) using the three data set and in DAPC and fastSTRUCTURE using UNEAK data set (Figures 2A,B). Furthermore, the green was detected mainly among populations of Beja Governorate, with some differences in its proportion depending on the genetic data sets and the clustering methods. It’s necessary to highlight the grouping of populations 16, 17 and 18 using TESS3 [pyRAD (K = 6) and Stacks (K = 6) data sets] (Figure 2C) showing similar color patterns and the predominance of the yellow, however, DAPC and fastSTRUCTURE (Figures 2A,B) failed to detect any meaningful clusters with different frequencies among these populations using the same data sets. Eleven populations form Beja Governorate (Pops 1, 2, 3, 4, 5, 6, 8, 9, 11, 14, 15) showed similar color patterns using the several clustering methods through the three data set.
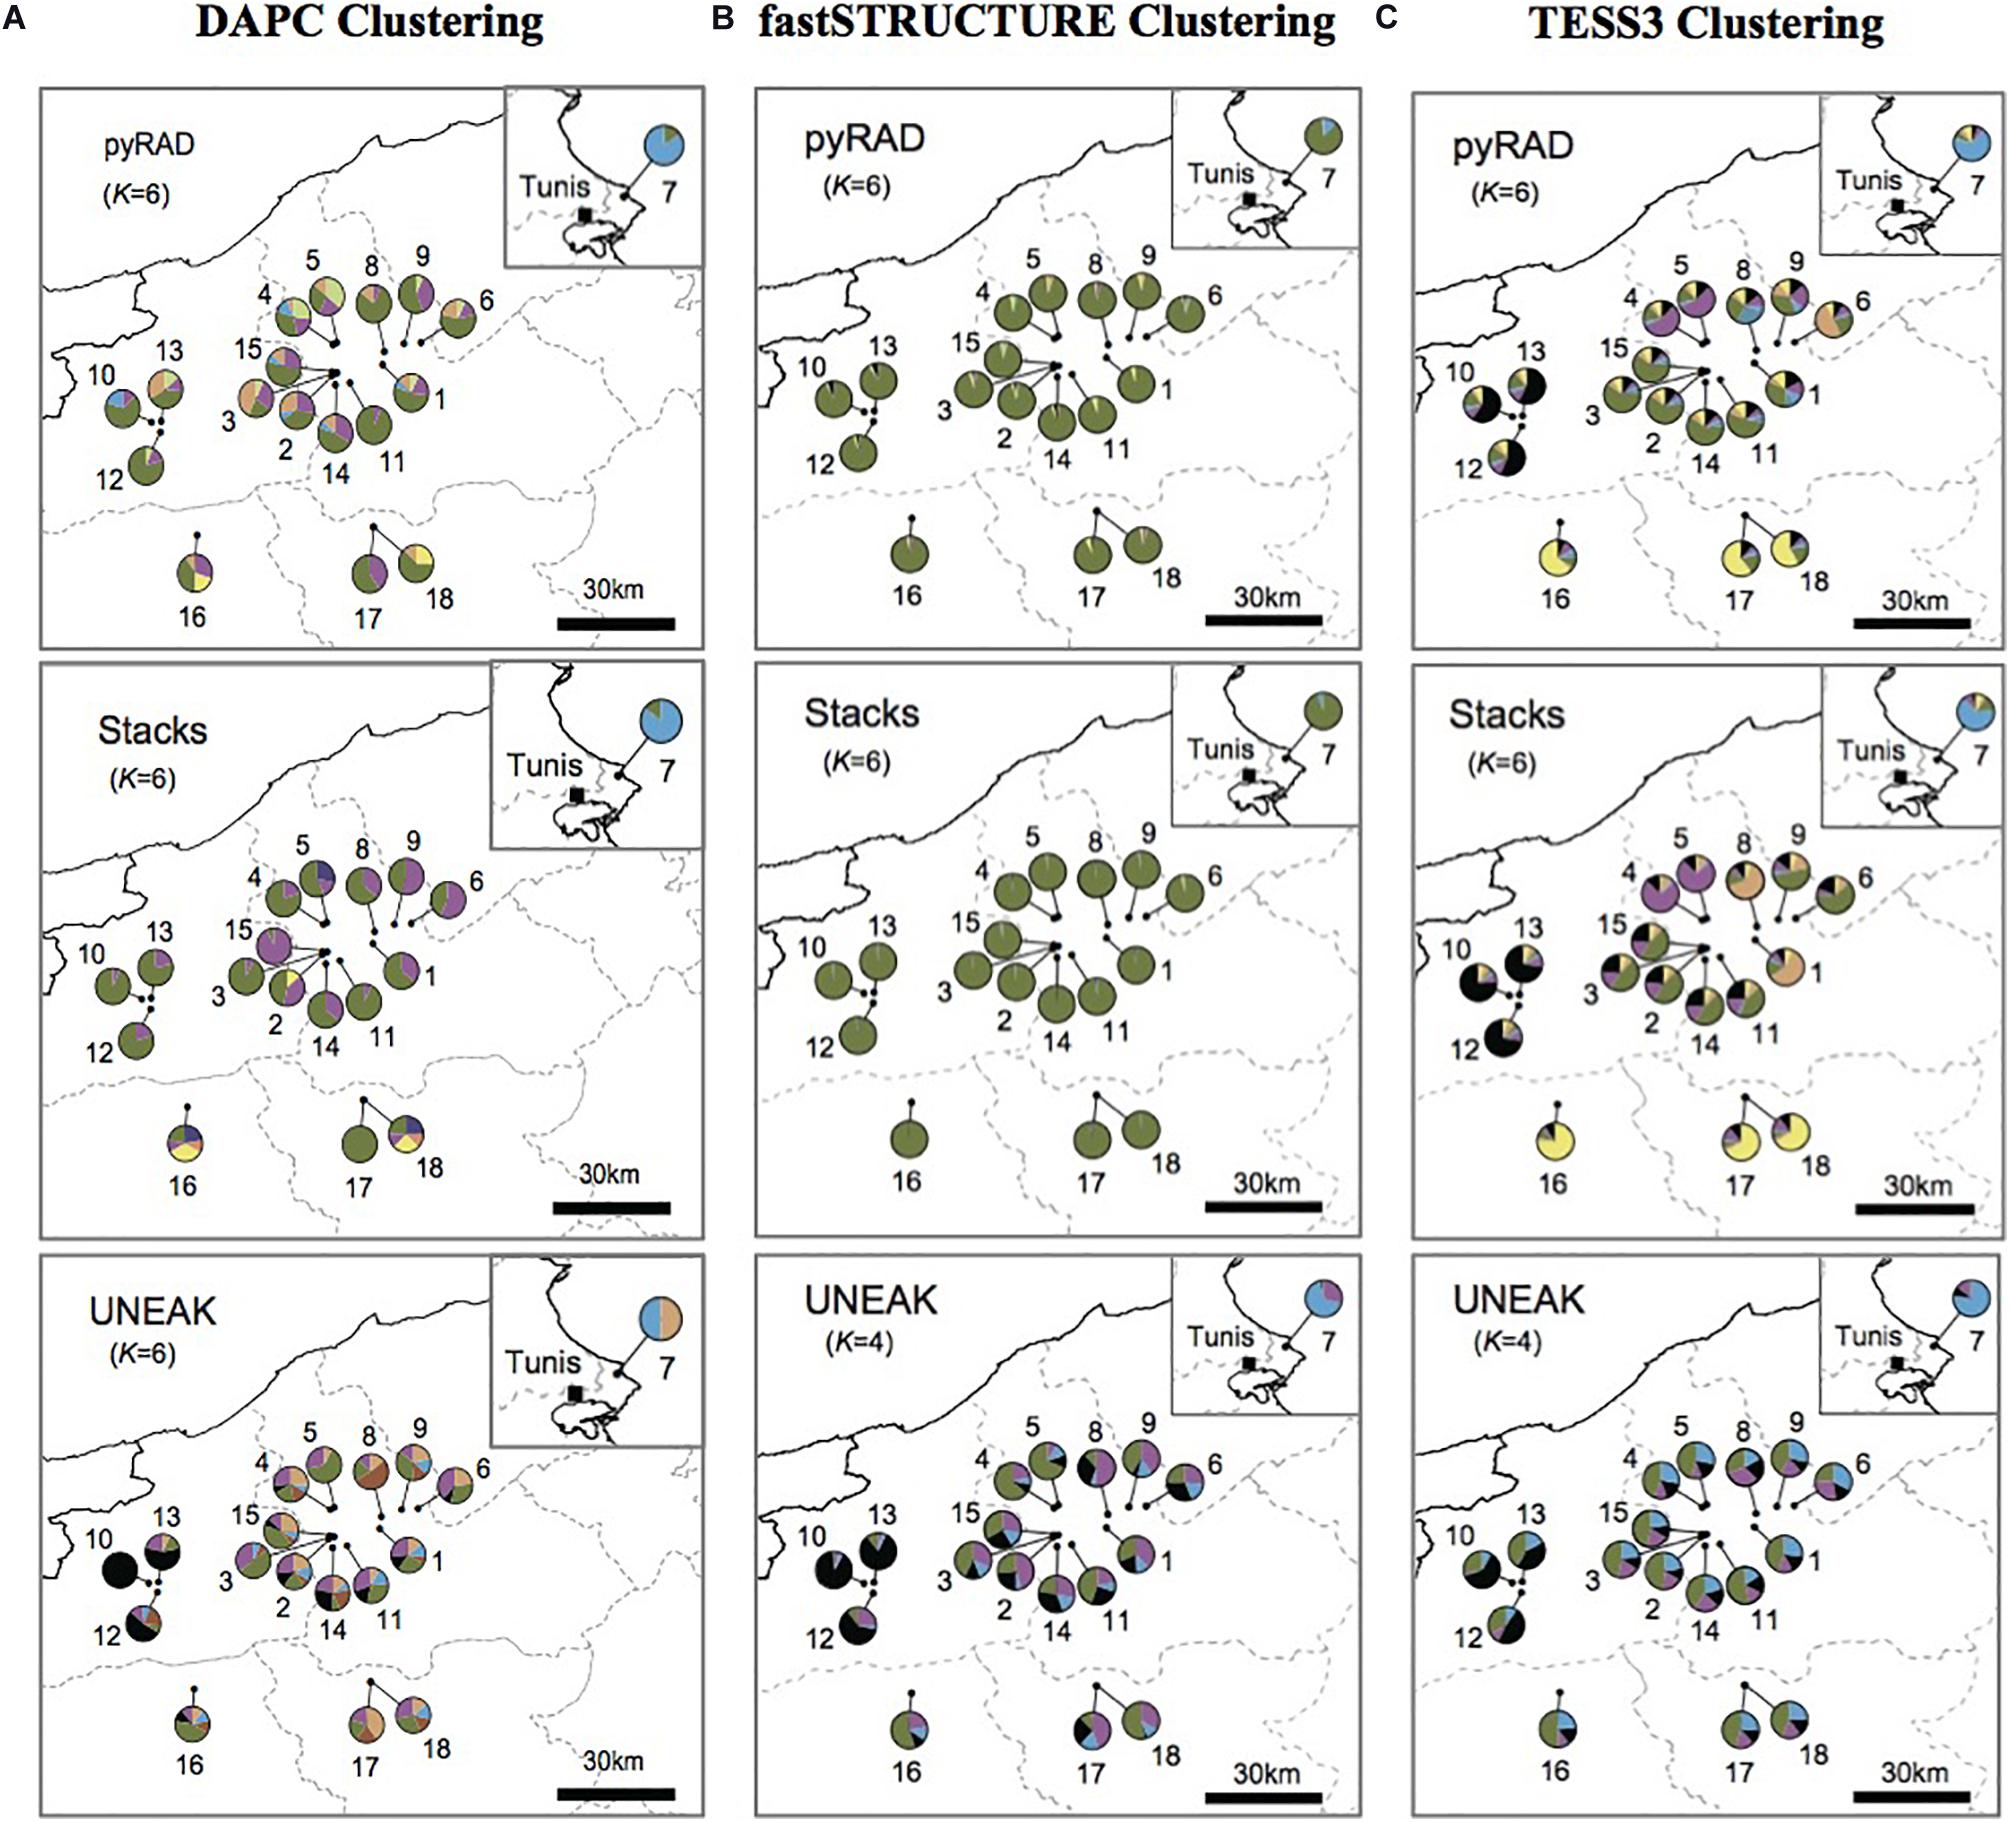
Figure 2. The average membership probabilities of each population (estimated Q values), inferred by (A) discriminant analysis of principal components (DAPC), (B) fastSTRUCTURE and (C) TESS3, as pie charts superimposed onto the location map. This is a comparison of the three used data sets: pyRAD, Stacks, and UNEAK.
Basing on Figure 2, we noticed a differentiation among the collected populations indicating a potential grouping pattern. Thus, we suggested the distribution of the 18 populations accordingly in four groups as follows; Group 1 representing the population 7 collected from Tunis Governorate; Group 2 including 11 populations form Beja Governorate (Pops 1, 2, 3, 4, 5, 6, 8, 9, 11, 14, 15); Group 3 representing populations from Jendouba Governorate (Pops 10, 12, 13) and finally Group 4 composed by populations from Kef Governorate (Pop 17) and Siliana Governorate (Pops 17, 18). We used the clustering methods TESS3 and PCA for testing the robustness of population structure. Firstly, we presented the TESS3 clustering on barplot using the three data sets for K = 4 since we assumed four groups among the studied populations, and K = 6 in order to show further inferred clusters (Figure 3). PyRAD and Stacks data sets showed almost similar clustering patterns without confirming the existence of a strong genetic structure among the studied populations (Figures 3A,B). However, UNEAK did not show any clear clustering (Figure 3C). Secondly, for further investigation of the population grouping, we analyzed the PCA plots using the three data sets pyRAD, Stacks and UNEAK (Figure 4). To simplify the comparison among them, we used specific colors for ellipses for each potential group; red for Group1, gray for Group 2, orange for Group 3 and blue for Group 4. The divergence of the population 7 (Group 1, red), located at Tunis Governorate, from the others was clear using the three data sets and more emphasized with Stacks data set. Moreover, we recognized a slight divergence among the assessed groups. However, we observed an overlapping especially among the three groups representing populations from the north-west using the three data sets.
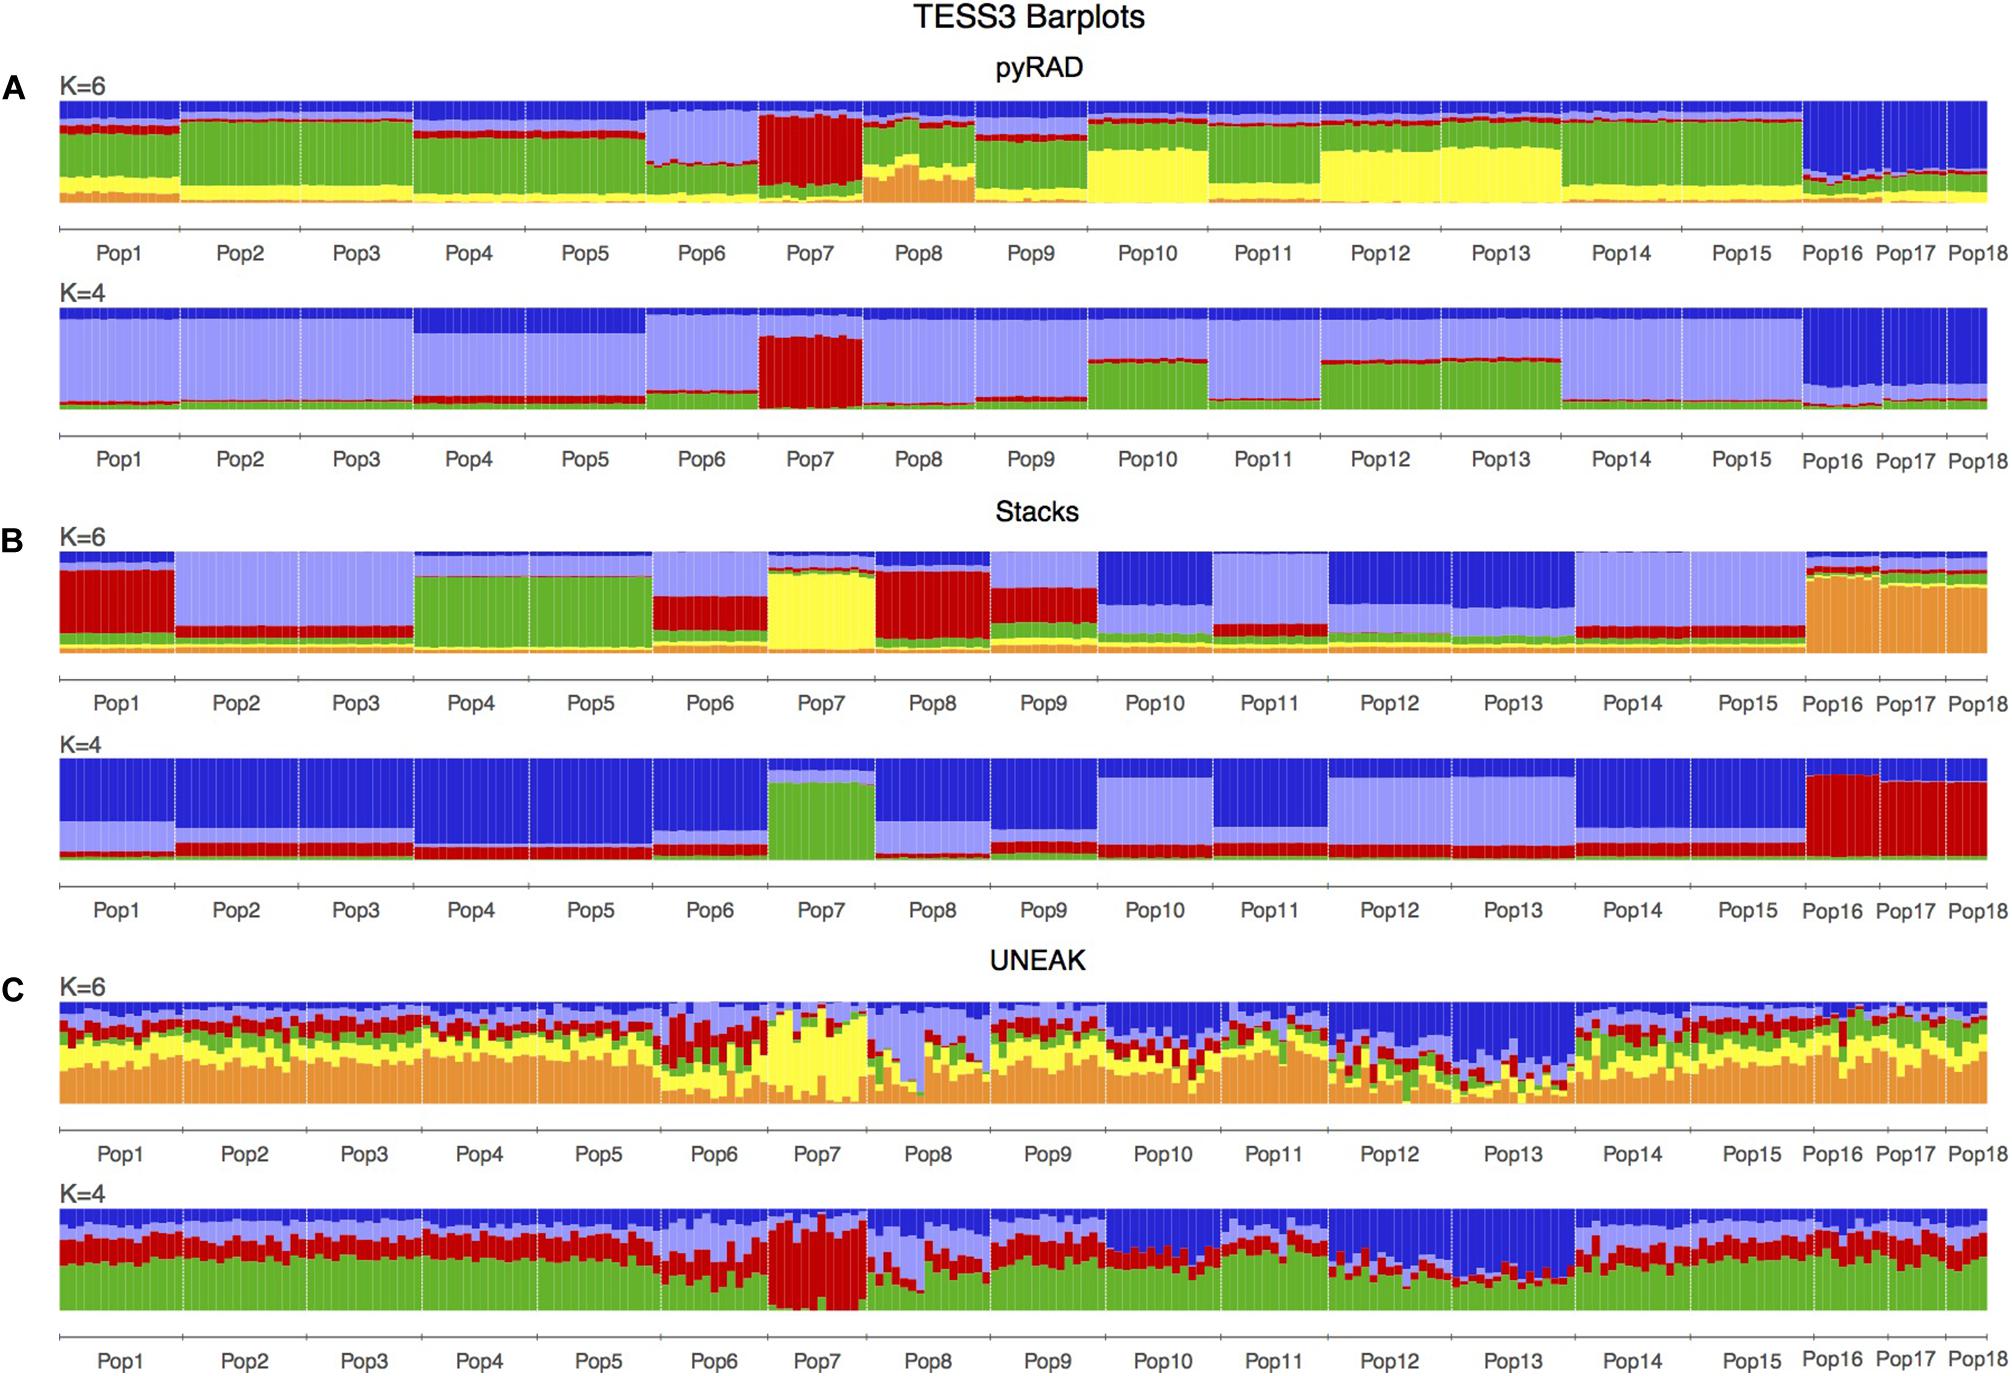
Figure 3. TESS3 clustering presented as barplots including 18 populations of O. foetida. This is a comparison of the three used data sets: (A) pyRAD, (B) Stacks and (C) UNEAK. The number of genetic clusters (K) are given above each barplot, while the populations are indicated in below of each barplot and divided by white lines.
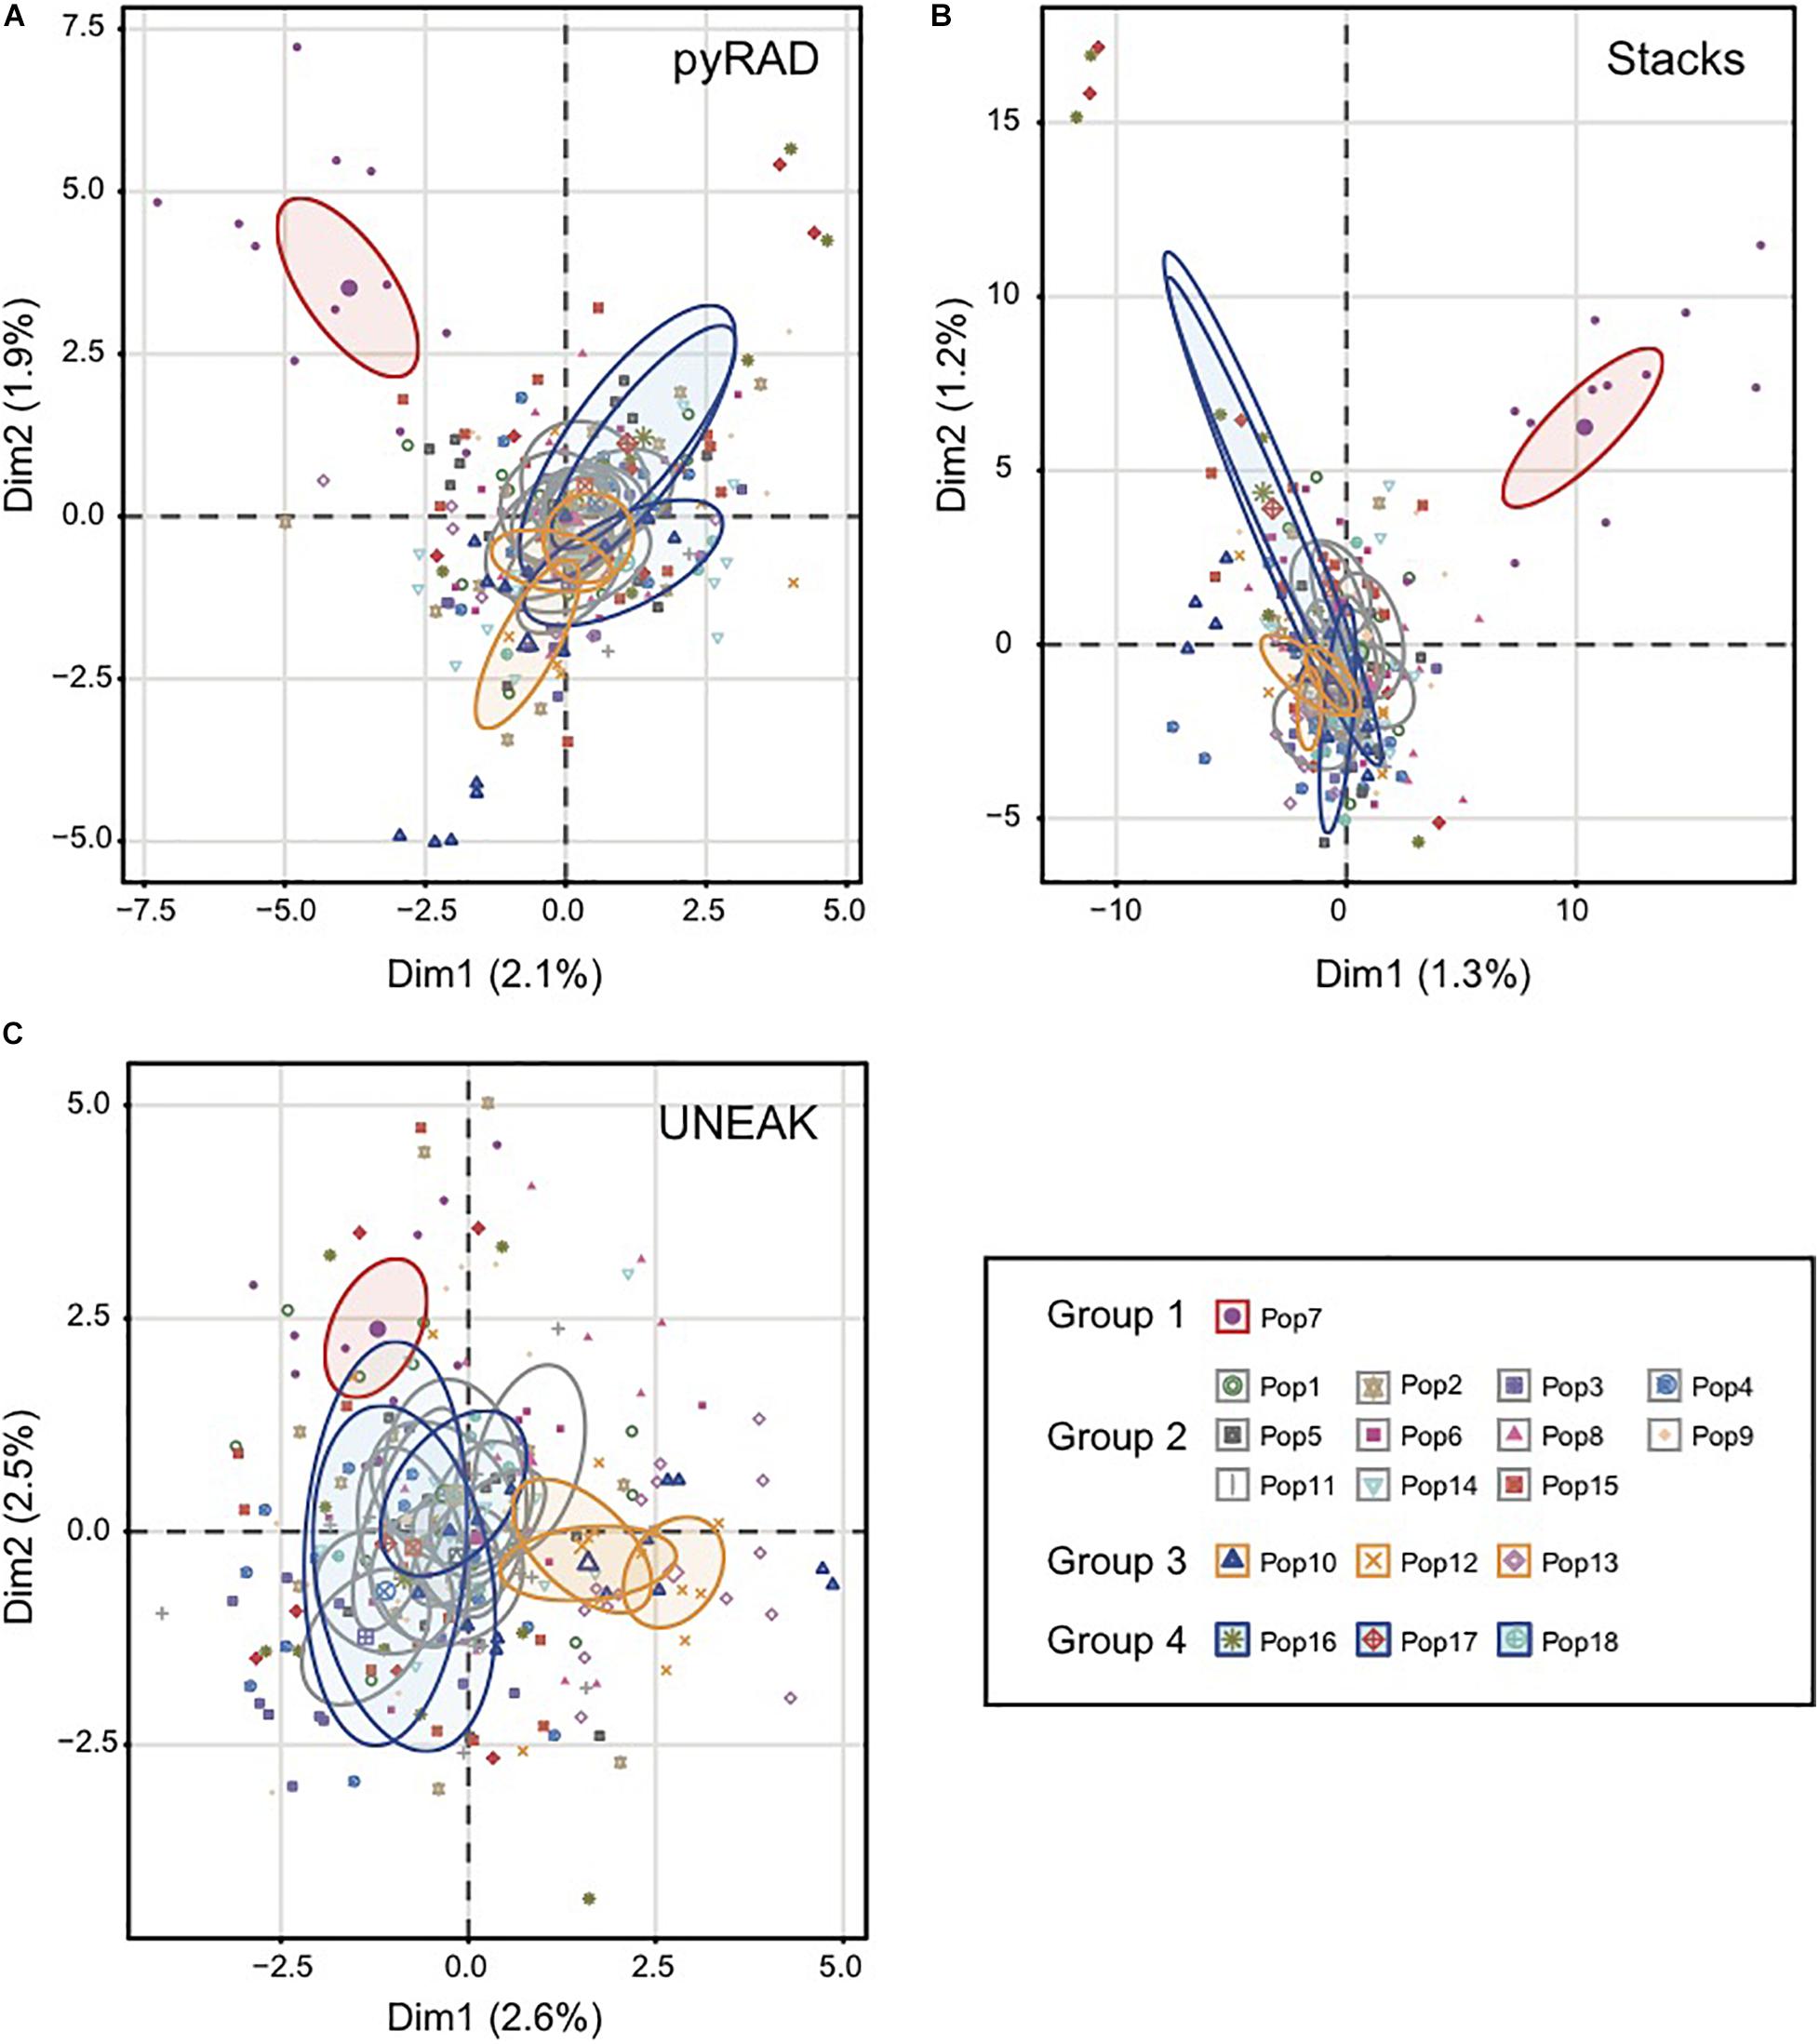
Figure 4. Principal coordinate analysis (PCA) based on SNP generated by the three data set; (A) pyRAD, (B) Stacks and (C) UNEAK. Colored ellipses showed the belonging of each population to one of the four detected groups (Group1:Red; Group 2:Gray; Group 3:Orange; Group 4:Blue). The ellipses represent 95% confidence range.
Additionally, we calculated the pairwise FST among the four groups in order to investigate the genetic distance among them. As expected, the highest FST values were observed between Group 1 (north-east) and the other Groups (north-west) using the three datasets (Table 1). Whereas, the lowest FST values were detected firstly between Group 2 and Group 3 using Stacks data set (FST = 0.0078), secondly, between Group 2 and Group 4 using pyRAD (FST = 0.0109) and UNEAK (FST = 0.0080) data sets as shown in Table 1. Overall, we detected a low FST values among the four potential groups using the three data sets.
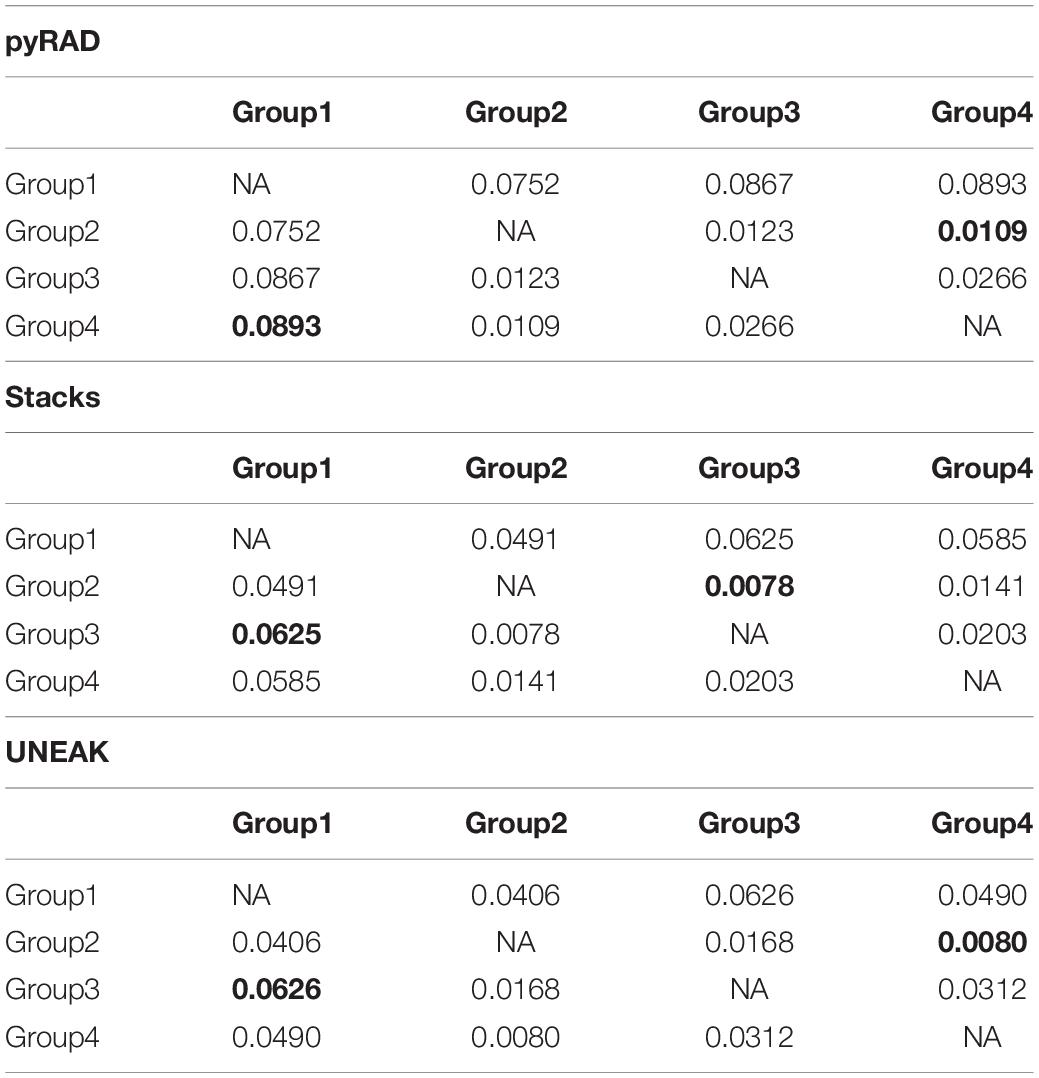
Table 1. Pairwise Fixation index FST among the four assigned groups of the studied O. foetida populations using the three data sets; pyRAD, Stacks and UNEAK.
Furthermore, the IBD analysis (Figure 5) revealed significant and positive association between genetic and geographic distances among the 18 collected populations using the three data sets (UNEAK: Mantel’s r = 0.573, p = 0.001; Stacks: Mantel’s r = 0.558, p = 0.018; pyRAD: Mantel’s r = 0.596, p = 0.007).
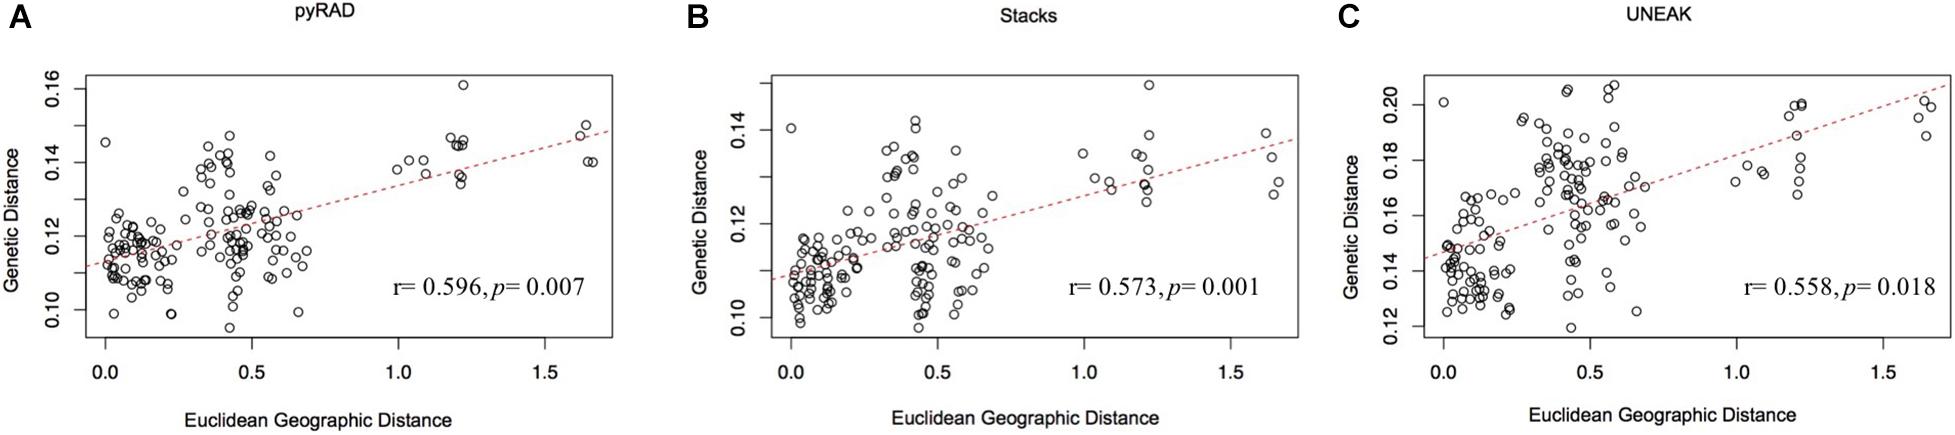
Figure 5. Mantel test for matrix correlation between Edwards’ distances and Euclidean geographic distances for 18 O. foetida populations using the three data sets: (A) pyRAD, (B) Stacks, and (C) UNEAK.
Genetic Diversity
The genetic diversity within and among populations was estimated basing on the 18 collected populations. According to Table 2, we observed that the variability parameters values (Ar, Ho, He and FIS) are similar among the 18 populations for each data set. Although, differences arise when comparing these parameters among the three data sets. However, UNEAK data set revealed higher values compared to those from pyRAD and Stacks data sets. Moreover, the mean values of allelic richness (Ar) among the 18 populations were similar using pyRAD and Stacks data sets (1.06), while it was slightly higher using UNEAK data set (1.28). Furthermore, the observed heterozygosity (Ho) was lower than the expected heterozygosity (He) for the three data sets excepting for Pops 6, 8, 12, 13 using UNEAK data set and Pop 13 using Stacks data set. The Ho values were ranged from 0.192 to 0.348 with a mean value of 0.253 for UNEAK data set, from 0.044 to 0.059 with a mean value of 0.048 for Stacks data set and varied from 0.032 to 0.046 with a mean value of 0.039 for pyRAD data set. While the He mean values were 0.28, 0.062, and 0.058 for UNEAK, Stacks and pyRAD, respectively. Regarding the inbreeding coefficient (FIS), UNEAK data set generated FIS values ranged from −0.131 to 0.240 (mean value = 0.097), while for Stacks, FIS values were comprised between −0.017 and 0.259 (mean value = 0.166) and they were ranged from 0.092 to 0.279 (mean value = 0.208) for pyRAD data set.
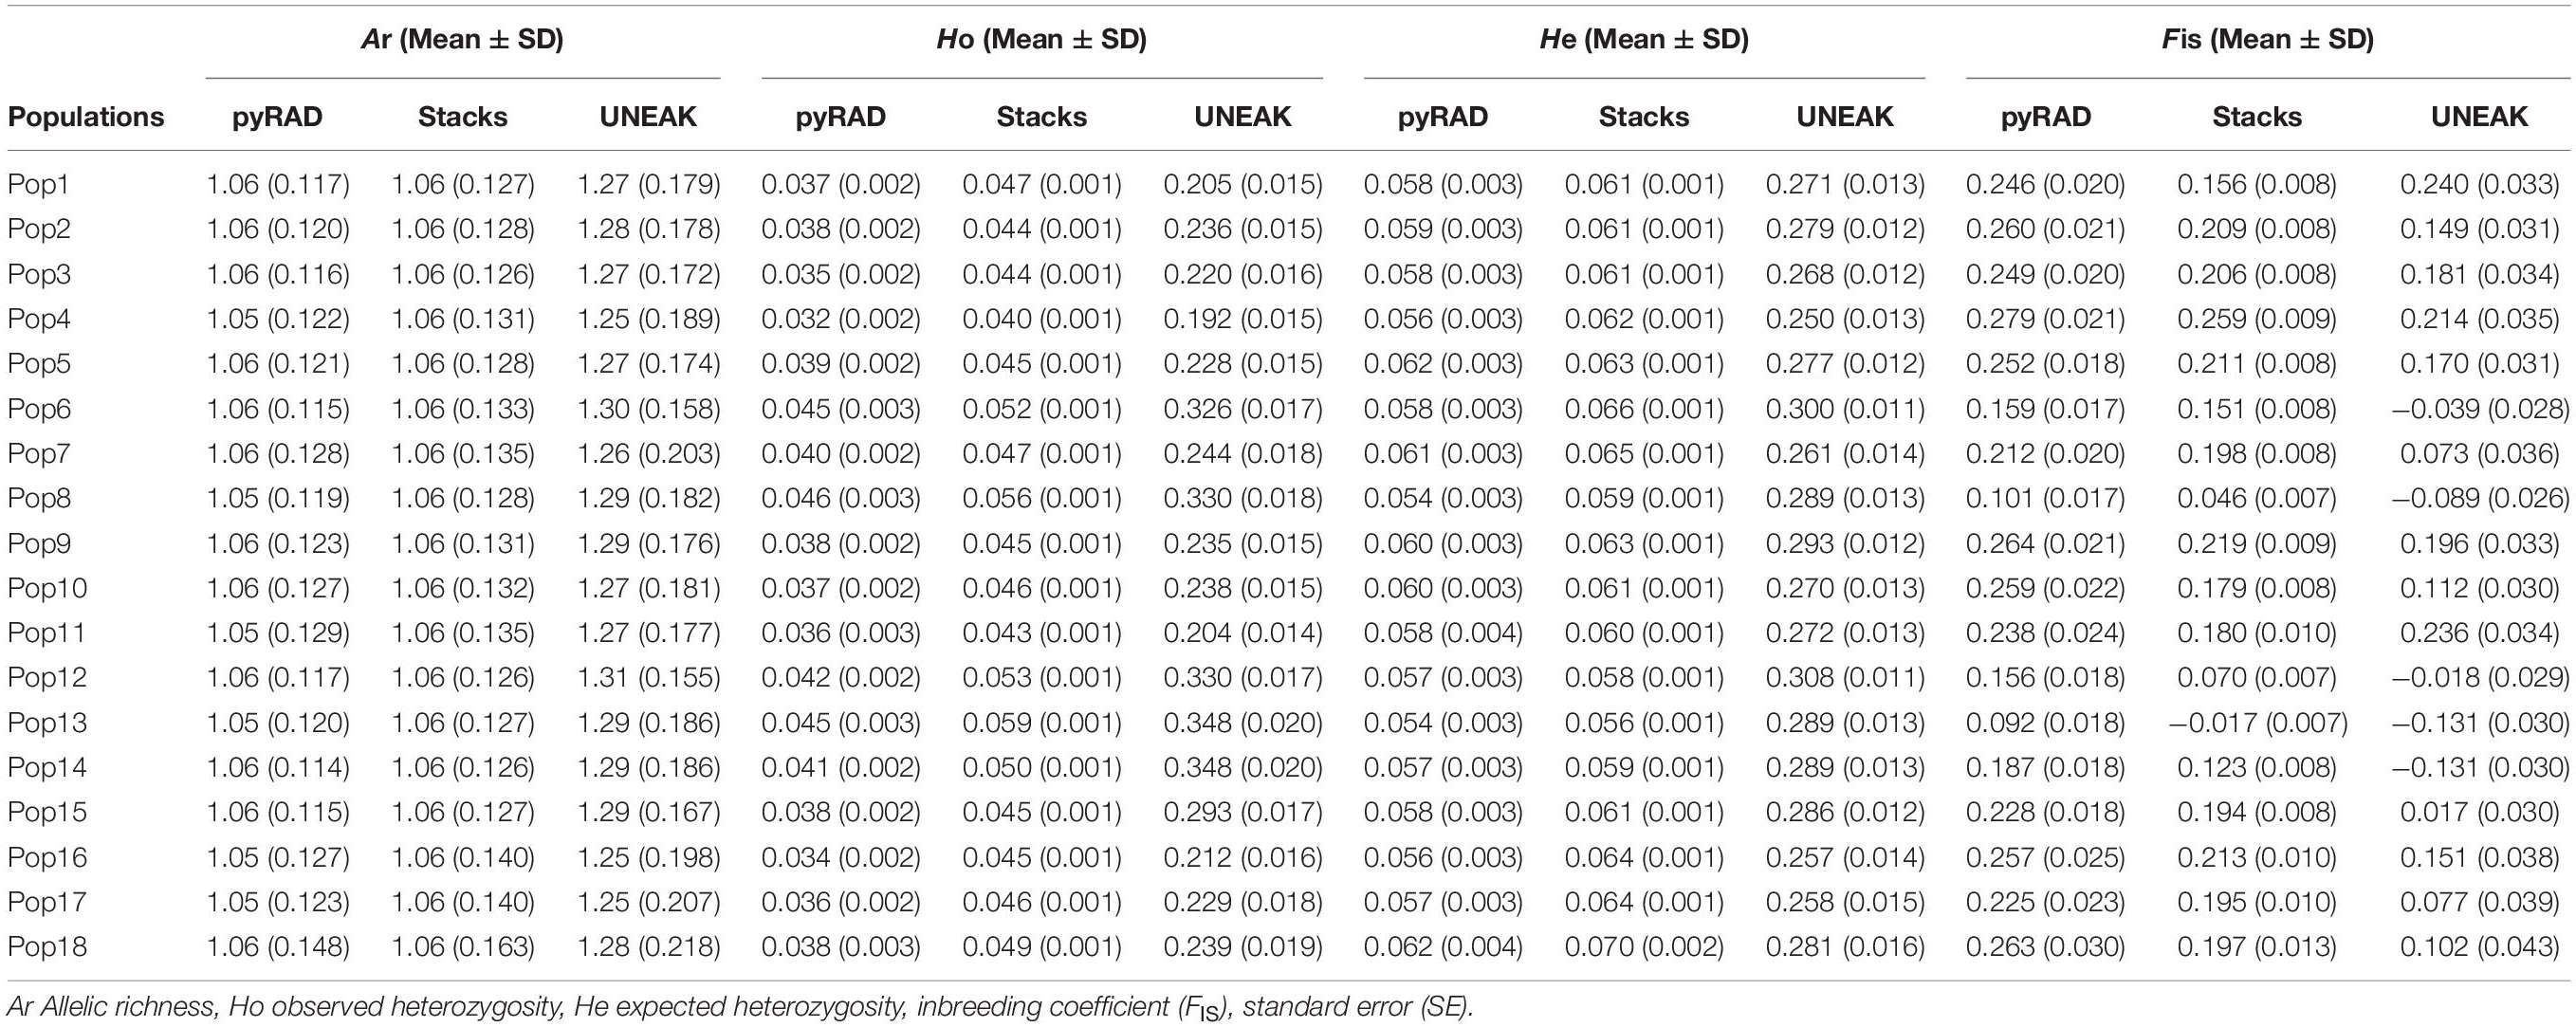
Table 2. Summary of genetic variability parameters at the populations level using the three data sets; pyRAD, Stacks, and UNEAK.
The AMOVA analysis revealed a significant level of genetic differentiation (Monte Carlo test p < 0.05) using the three data sets. At populations level, the molecular variance within populations was comprised between 96.29% and 96.74%, whereas among populations it varied from 3.25% to 3.70%.
Discussion
In the present study, we used RADseq technique to investigate the genetic diversity and population structure of the Tunisian O. foetida biotype consisting of 244 samples collected from 18 different fields belonging to the main faba bean crop area in Tunisia. The population structure and the evaluation of genetic diversity of O. foetida represent the first step to understand the phylogenetic relationships within and among Orobanche populations, and to improve faba bean breeding program as well as pest management. Previously, three main genetic studies were conducted on O. foetida using dominant markers to evaluate the genetic diversity. Firstly, Román et al. (2007b), used 10 RAPD primers generating 168 polymorphic bands among 35 samples collected from legume crops in Tunisia. Secondly, Vaz Patto et al. (2008), studied five O. foetida populations from Morocco using three AFLP primers combinations where the proportion of polymorphic loci varied from 54.6% to 80%. Thirdly, Bouhadida et al. (2015), performed a genetic diversity study on Tunisian O. foetida populations (35 samples) collected from five crops (faba bean, chickpea, annual alfalfa, vetch and Narbonne vetch) using 10 RAPD primers, revealing 75 polymorphic bands. Due to the absence of specific markers and a reference genome for O. foetida, we chose the RADseq as a technique that did not require a gene set reference. To the best of our knowledge, this is the first study using RADseq technique to evaluate the genetic diversity of one of the most harmful Orobanche spp. in Tunisia, which represent a real threat worldwide.
Comparison of RADseq Pipelines Used for SNP Calling
In the present study, we adopted a de novo assembly approach due to the absence of a reference genome, but the choice of the pipeline remains a relevant decision. Indeed, pipelines differ in the applied algorithms and the possibility to change some parameters. Besides for several pipelines, some intermediate files are not accessible; these files are temporary and deleted in the end of the analysis, which does not allow to track the evolution of the workflow and to detect some possible issues. For that purpose, we used three different software pipelines UNEAK, pyRAD and Stacks, which generate different numbers of SNP as expected.
The number of the detected SNPs varied among the three data sets. Indeed, Stacks generated the highest number (10,755 SNPs) followed by pyRAD (1,785 SNPs), however, UNEAK detected only 206 SNPs. This last result could be explained by the ability of UNEAK to eliminate paralogs, which are highly present in polyploidy species. Differences noticed in our results when applying different pipelines for the same dataset are also reported in various studies. In fact, the work of Torkamaneh et al. (2016) on the comparison of seven pipelines and two sequencing technologies, reported that UNEAK generated 82% more SNPs than Stacks. Moreover, Qi et al. (2015) found differences in phylogenetic patterns using pipelines requiring or not a reference genome (Stacks, TASSEL, UNEAK and pyRAD). Additionally, they obtained higher number of SNPs (25,000 to 54,000 SNPs) for reference genome pipelines than without a reference genome (13,000 to 24,000) which emphasizes the importance of a whole genome sequencing. In the present work, we performed a series of filtering of the generated SNP for the three data sets; nevertheless, we noticed a better population structure without filtering for Stacks and pyRAD. Therefore, we decided to maintain the filtering only for UNEAK data set since our main objective is to explore the population structure of the collected O. foetida populations.
Regarding the population structure analysis for the studied populations, the distribution and the number of the clusters revealed by the DAPC analysis varied among the three pipelines, but even that, a common cluster characterizing the population 7 was detected using the three data sets. TESS3 revealed a clear genetic structure using Stacks and pyRAD data sets comparing to fastSTRUCTURE which was not able to detect any meaningful clusters using these two data sets. Regarding UNEAK data set, we detected an informative clustering pattern only with fastSTRUCTURE. In fact, TESS3 was not able to detect a clear one.
Population Structure
The population structure analysis was conducted using different clustering methods. Among them, TESS3 and fastSTRUCTURE, which are two Bayesian clustering models in population genetics that compute allele frequencies in each gene pool and estimate the proportions of an individual genome that originate from multiple ancestral gene pools (ancestry coefficients) (Frichot et al., 2014; Caye et al., 2016). In the present work, TESS3 outperformed fastSTRUCTURE by revealing clearer population structure pattern. This is due to the ability of TESS to provide better estimations of ancestry coefficients, when the levels of ancestral population divergence are low, by incorporating spatial arrangement of sampling localities in its analysis (Durand et al., 2009). Moreover, it has been already reported that the use of spatial models allowed detecting biologically meaningful clusters comparing to a non-spatial model such as STRUCTURE, which failed to detect any population structure especially when the ancestral level of differentiation was low (Barr et al., 2008; Lavandero et al., 2009; François and Durand, 2010). Indeed, basically according to the clustering maps presetting in Figure 2, we assigned the 18 collected populations into four groups, where three groups were assigned to a specific governorate (Tunis, Beja or Jendouba), while group 4 is representing a population from Kef governorate and two populations from Siliana governorate. The PCA plots, the DAPC (using pyRAD and Stacks data sets) and the fastSTRUCTURE (using only UNEAK data set) showed globally a similar clustering tendency. Nevertheless, all the methods used for population structure analysis in this study, TESS3 included, were unable to detect a strong population clustering. Additionally, the calculated pairwise FST among the four groups showed very low values in Table 1, which support the absence of a robust population clustering.
The population 7 (Group 1) from the north-east of Tunisia was the most genetically divergent one in comparison to the other three assigned groups representing populations from the north-west of the country, using the three data sets (UNEAK, pyRAD and Stacks), and four populations structure methods (TESS3, fastSTRUCTURE, DAPC, PCA). Additionally, the highest pairwise FST was observed between Group 1 and the other groups. This finding is consistent with a study on Striga hermonthica from Ethiopia (Welsh and Mohamed, 2011), in which populations located over 100 km from others were genetically divergent pointing out a comparable pattern with our data, since our population 7 is collected at 110-185 km from the other population locations. A similar situation of genetic separation between populations of Cuenca and Guadalquivir Valley has been reported for O. cumana in Spain by Pineda-Martos et al. (2013). Likewise, Westwood and Fagg (2004) reported two clearly different groups of O. minor populations in US, suggesting that they are developed from two distinct introduction events, as is probably the case for population 7 and the rest of populations of O. foetida studied in this present work. It is essential to report that the expanding urbanization and encroachment on rural areas in Tunis governorate these last decades significantly limited the faba bean cropping area, which affects the number of populations collected from this location of Tunisia (only population 7 from Tunis Governorate). Furthermore, about 60% of the collected populations are classified in Group 2 from Beja Governorate, known as the main growing area of faba bean in Tunisia which might reflect a narrow genetic background. In fact, the close geographic distance among these populations could be explained by the spread of high number of long-lived tiny seeds of Orobanche through this area. Indeed, seeds dissemination is highly facilitated by different factors as wind, machinery, cultivation practices, as well as the use of contaminated faba bean seed stocks (Satovic et al., 2009). All these factors may contribute to the expansion of Orobanche infestation through the faba bean growing area in Beja Governorate, showing a low genetic diversity and suggesting that they may belong to the same gene pool. Moreover, the genetic divergence of populations 10, 12 and 13 seems to be related to the geographic distance separating these populations from the others (located from 26 to 76 km from the other north-west populations). These observations are in concordance with the positive and significant correlation between the genetic and the geographic distance revealed by the IBD analysis. In fact, isolation by distance may play a key role in shaping the genetic variation among populations. Consistently, Unachukwu et al. (2017), reported that the genetic variation among the parasitic plant Striga hermonthica is monitored by geographic isolation.
Genetic Diversity
In this work, we recorded genetic variability among the 18 populations of O. foetida in Tunisia according to the variability parameters Ar, Ho, He and FIS. These parameters were higher using UNEAK data set comparing to Stacks and pyRAD data sets. We recorded an average of 1.28 regarding the allelic richness for UNEAK data set and an average of 1.06 for Stacks and pyRAD data sets as reported in Table 2. Overall, the observed heterozygosity was lower than the expected heterozygosity among the three data set, which generate a positive FIS value for the majority of the studied populations indicating an inbreeding behavior of the O. foetida populations in Tunisia. Similar results were also recorded among O. cumana populations from Turkey (Bilgen et al., 2019), Spain and Bulgaria (Pineda-Martos et al., 2013, 2014a) using SSR markers, pointing out a deviation from Hardy-Weinberg equilibrium. Furthermore, studies conducted on Orobanche spp. using co-dominant markers such as SSR markers on O. cumana, allowed to figure out these parameters. Indeed, Genetic variation of O. cumana populations from Spain was investigated using 15 SSR markers, the variability parameters were averaged as follows; Ae (1.6), Ho (0.04), and He (0.33) (Pineda-Martos et al., 2013). These values are similar to our average values using UNEAK pipeline (Ae 1.28), Ho (0.25) and He (0.277), this could be explained by the co-dominance nature of markers used in both studies. Nevertheless, comparison among diversity studies is more conclusive using the same species and the same type of markers. Indeed, Bilgen et al. (2019) used 8 SSR markers to study O. cumana populations from Turkey. They reported a variation regarding mean values of Ne (1.67), Ho (0.21), He (0.34) and the Fixation index (F) (0.34) and were able to compare their results with those of Pineda-Martos et al. (2013) in terms of heterozygosity levels in populations of O. cumana from Spain, Bulgaria and Turkey. For the case of O. foetida, up to now, few genetic diversity researches were performed, and the molecular markers used were dominant such as RAPD and AFLP markers (Román et al., 2007a; Vaz Patto et al., 2008; Bouhadida et al., 2015). These kinds of markers are not enough informative and did not allow to compute all the variability parameters cited above, thus, preventing a robust analysis of genetic diversity among populations and an accurate comparisons among diversity studies on O. foetida.
The results of AMOVA analysis were consistent among the three data sets showing a high genetic variation within the 18 populations (from 96.29% to 96.74%) while the remaining part was assigned to interpopulation variation. Consistently, in the study of Vaz Patto et al. (2008) using AFLP for O. foetida populations parasitizing wild plants and crop in Morocco, 86.63% of the variation was due to within-population variations, whereas only 13.75% was due to among-population variations. Moreover, in a study performed on fetid broomrape populations using RAPD markers by Román et al. (2001a), reported that 75.4% of the variation was due to within-population variations for Tunisian populations collected on legume crops (faba bean and chickpea).
The high genetic variation observed within populations lead us to consider that O. foetida may be an autogamous species. Furthermore, Román et al. (2001a) also suggested an autogamous behavior for Tunisian crop-infected populations and an allogamous behavior for Spanish wild-infected populations based on the genetic variation analysis. Similarly, difference between wild and weedy populations was also detected among the autogamous Striga gesnerioides populations parasitizing the wild legume Indigofera hirsuta L. and cultivated cowpea (Botanga and Timko, 2006). By contrast, no difference was detected between O. cumana populations growing on sunflower and those on wild plants, suggesting a potential gene flow between these populations in Bulgaria (Pineda-Martos et al., 2014a). According to Vaz Patto et al. (2008) reports, no clear separation was detected basing on cluster analysis between O. foetida population infecting common vetch and the population infecting wild legumes in Morocco. Furthermore, it is important to point out that the sampled populations in Morocco were collected from a predominant faba bean growing area where O. foetida was only detected on common vetch (Vaz Patto et al., 2008), while in Tunisia the major host of O. foetida is faba bean. This may be explained by host differentiation effect previously reported by Román et al. (2007b) between O. foetida populations infecting chickpea and faba bean in Tunisia. Moreover, the Moroccan O. foetida populations are all considered as O. foetida var. broteri (Vaz Patto et al., 2008) while populations used in our study are considered as O. foetida Poir. (Domina G, pers. Comm.). In the same context, Thorogood et al. (2008) observed a variability between O. minor var. minor and O. minor spp. Maritiama which were classified in distinct clusters using SCAR markers.
The attack of O. foetida on legumes and wild relatives was assumed for several years as an adaptation event (Román et al., 2007a; Vaz Patto et al., 2008; Satovic et al., 2009) while it was recorded as a crop parasite in Tunisia since 1905 on Medicago truncatula (Boeuf, 1905). Presumably, during the double infection of faba bean in Tunisia by O. foetida and O. crenata (Chabrolin, 1939), the fetid broomrape succeeded to eliminate O. crenata, due to the fact that, as an autogamous species it has a higher chance to survive and maintain than an allogamous one (Román et al., 2001a). This may explain the abundance of O. foetida and the absence of O. crenata in the main faba bean growing area in the north-west of Tunisia. Moreover, according to the literature, O. foetida was recorded attacking wild legumes since 1896 in the north-east of Tunisia (Bonnet and Barratte, 1896), but currently this species is totally absent in this area in Tunisia. Román et al. (2001a) supposed that O. foetida populations infecting wild plants are allogamous, and due to the growth of urbanization, these populations could not persist, and its presence has been decreased through time, which may explain the absence of this species in the north-east of Tunisia during this decade. Furthermore, as suggested by Vaz Patto et al. (2008), the O. foetida population infecting wild plants may give rise to new populations able to highly damage cultivated species as vetch in Morocco, faba bean in Tunisia and may affect other legume crops such as chickpea.
This present study traces the real situation of distribution of O. foetida populations in Tunisia and could be a valuable reference for the upcoming research projects focusing on O. foetida. Indeed, further research should be undertaken to explore different ecotypes of the fetid broomrape in the Mediterranean area with the perspective to understand the evolution of this parasite. Additionally, the evaluation of the parasitic potential of the studied populations should be carried out in order to analyze a possible correlation with their genetic diversity. On a wider level, a whole genome and transcriptome sequencing of O. foetida, as seen for Striga asiatica (Yoshida et al., 2019), will be of interest to better understand the genetic background allowing this species to overcome host defense mechanisms and became a serious threat to agriculture. Indeed, for a longtime, the damage caused by O. foetida on faba bean was limited in Tunisia until 1992 (Kharrat et al., 1992). Currently, O. foetida is considered as a real risk for faba bean but also start being for other legume crops such as chickpea. With this in prospect, it would be recommendable to prepare new efficient strategies to anticipate the potential danger of this parasite for several crop legumes in Tunisia and worldwide.
Data Availability Statement
The original contributions presented in the study are publicly available. This data can be found here: NCBI’s Sequence Read Archive (Accession: PRJNA719284).
Author Contributions
AB, YI, MB, and KS conceived and designed the experiments. AB, YI, and AN performed the experiments. AB and SS analyzed the data. AB, YI, SS, and MB wrote the manuscript. All authors contributed to the article and approved the submitted version.
Funding
This study was funded by the Ministry of Education, Culture, Sports, Science and Technology of Japan KAKENHI grants (15H05959, 17H06172, and 20H05909) to KS. The Ministry of Higher Education and Scientific Research of Tunisia and the Ministry of Agriculture of Tunisia provided a financial support for this study to AB.
Conflict of Interest
The authors declare that the research was conducted in the absence of any commercial or financial relationships that could be construed as a potential conflict of interest.
Acknowledgments
The authors would like to thank Satoko Kondo, from Faculty of Agriculture, Ryukoku University, Otsu, Shiga 520-2194, Japan, for her technical support during the generation of RAD-seq data, and Hanen Sakouhi from Field Crop Laboratory (INRAT-Tunisia) for her technical support during sample collection.
Supplementary Material
The Supplementary Material for this article can be found online at: https://www.frontiersin.org/articles/10.3389/fpls.2021.618245/full#supplementary-material
References
Abbes, Z., Kharrat, M., Delavault, P., Simier, P., and Chaïbi, W. (2007a). Field evaluation of the resistance of some faba bean (Vicia faba L.) genotypes to the parasitic weed Orobanche foetida Poiret. Crop Prot. 26, 1777–1784. doi: 10.1016/j.cropro.2007.03.012
Abbes, Z., Kharrat, M., Simier, P., and Chaïbi, W. (2007b). Characterization of resistance to crenate broomrape (Orobanche crenata) in a new small-seeded line of Tunisian faba beans. Phytoprotection 88, 83–92. doi: 10.7202/018953ar
Abbes, Z., Trabelsi, I., Kharrat, M., and Amri, M. (2019). Intercropping with fenugreek (Trigonella foenum-graecum) enhanced seed yield and reduced Orobanche foetida infestation in faba bean (Vicia faba). Biol. Agric. Hortic. 35, 238–247. doi: 10.1080/01448765.2019.1616614
Abebe, G. G., Sahile, A., and Al-Tawaha, A. (2005). Evaluation of potential trap crops on Orobanche soil seed bank and tomato yield in the central rift valley of ethiopia. World J. Agric. Sci. 1, 148–151.
Amri, M., Sellami, F., Kharrat, M., and Karray, R. H. (2009). First report of the parasitic plant Orobanche foetida on fenugreek (Trigonella foenum-graecum) in Tunisia. Tunis. J. Plant Protect. 4, 235–238.
Amri, M., Trabelsi, I., Abbes, Z., and Kharrat, M. (2019). Release of a new faba bean variety “chourouk” resistant to the parasitic plants Orobanche foetida and Orobanche crenata in Tunisia. Int. J. Agric. Biol. 21, 499–505.
Barr, K. R., Lindsay, D. L., Athrey, G., Lance, R. F., Hayden, T. J., Tweddale, S. A., et al. (2008). Population structure in an endangered songbird: maintenance of genetic differentiation despite high vagility and significant population recovery. Mol. Ecol. 17, 3628–3639. doi: 10.1111/j.1365-294X.2008.03868.x
Belay, G., Tesfaye, K., Hamwieh, A., Ahmed, S., Dejene, T., and de Oliveira Júnior, J. O. L. (2020). Genetic diversity of Orobanche crenata populations in ethiopia using microsatellite markers. Int. J. Genomics [Epub ahead of print]. doi: 10.1155/2020/3202037
Bilgen, B. B., Barut, A. K., and Demirbaş, S. (2019). Genetic characterization of Orobanche cumana populations from the Thrace region of Turkey using microsatellite markers. Turk. J. Bot. 43, 38–47. doi: 10.3906/bot-1807-71
Bonnet, E., and Barratte, G. (1896). Catalogue Raisonné des Plantes Vasculaires de la Tunisie: Exploration Scientifique de la Tunisie. Available online at: https://gallica.bnf.fr/ark:/12148/bpt6k6434093w (accessed September 7, 2020).
Botanga, C. J., and Timko, M. P. (2006). Phenetic relationships among different races of Striga gesnerioides (Willd.) Vatke from West Africa. Genome 49, 1351–1365. doi: 10.1139/g06-086
Bouhadida, M., Ben Jannet, R., Abbes, Z., Amri, M., and Kharrat, M. (2015). Analysis of genetic diversity of Orobanche foetida population parasitizing crops legume. J. Agric. Vet. Sci. 15:82015.
Boutiti, M. Z., Souissi, T., Kharrat, M. M., Julien, M. H., Sforza, R., Bon, M.-C., et al. (2008). “Evaluation of fusarium as potential biological control against Orobanche on Faba bean in Tunisia,” in Proceedings of the XII International Symposium on Biological Control of Weeds, La Grande Motte.
Brault, M., Betsou, F., Jeune, B., Tuquet, C., and Sallé, G. (2007). Variability of Orobanche ramosa populations in France as revealed by cross infestations and molecular markers. Environ. Exp. Bot. 61, 272–280. doi: 10.1016/j.envexpbot.2007.06.009
Bruneaux, M., Johnston, S. E., Herczeg, G., Merilä, J., Primmer, C. R., and Vasemägi, A. (2013). Molecular evolutionary and population genomic analysis of the nine-spined stickleback using a modified restriction-site-associated DNA tag approach. Mol. Ecol. 22, 565–582. doi: 10.1111/j.1365-294X.2012.05749.x
Castejon Munoz, M., Suso, M. J., and Romero Munoz, F. (1991). Isoenzymatic Study of Broomrape (Orobanche cernua) populations infesting sunflower (Helianthus annuus). in (CIMMYT). Available online at: https://agris.fao.org/agris-search/search.do?recordID=QY9200051 (accessed July 26, 2020).
Catchen, J., Hohenlohe, P. A., Bassham, S., Amores, A., and Cresko, W. A. (2013). Stacks: an analysis tool set for population genomics. Mol. Ecol. 22, 3124–3140. doi: 10.1111/mec.12354
Caye, K., Deist, T. M., Martins, H., Michel, O., and François, O. (2016). TESS3: fast inference of spatial population structure and genome scans for selection. Mol. Ecol. Resour. 16, 540–548. doi: 10.1111/1755-0998.12471
Chabrolin, C. H. (1939). Contribution à l’étude de la germination des graines de l’Orobanche de la fève. Ann. Serv. Bot. Agron. Dir. Aff. Écon. Tunis. 6, 91–145.
Cubero, J. I., and Moreno, M. T. (1999). Studies on resistance to Orobanche crenata in Vicia faba. Resist. Broomrape 99, 9–15.
Cubero, J. I., Moreno, M. T., and Hernandez, L. (1992). A faba bean cultivar resistant to Orobanche crenata Forsk. Angers: Springer, 41–42.
Davey, J. W., and Blaxter, M. L. (2010). RADSeq: next-generation population genetics. Brief. Funct. Genomics 9, 416–423. doi: 10.1093/bfgp/elq031
De Meeûs, T., and Goudet, J. (2007). A step-by-step tutorial to use HierFstat to analyse populations hierarchically structured at multiple levels. Infect. Genet. Evol. J. Mol. Epidemiol. Evol. Genet. Infect. Dis. 7, 731–735. doi: 10.1016/j.meegid.2007.07.005
Durand, E., Jay, F., Gaggiotti, O. E., and François, O. (2009). Spatial inference of admixture proportions and secondary contact zones. Mol. Biol. Evol. 26, 1963–1973. doi: 10.1093/molbev/msp106
Eaton, D. A. R. (2014). PyRAD: assembly of de novo RADseq loci for phylogenetic analyses. Bioinformatics 30, 1844–1849. doi: 10.1093/bioinformatics/btu121
El-Shirbini, E. H., and Mamdouh, O. (2004). “Integrated management of Orobanche in food legume systems: the Egyptian experience in IPM of Orobanche, Nile Valley and Red Sea Program,” in Integrated Management of Orobanche in Food Legumes in the Near East and North Africa. Proceedings of the Expert Consultation on IPM for Orobanche in Food Legume Systems in the Near East and North Africa, (Rabat: ICARDA/INRA/FAO), 32–54.
Ennami, M., Briache, F. Z., Mansi, J. M., Gaboun, F., Ghaouti, L., Belqadi, L., et al. (2017). Genetic diversity of moroccan Orobanche crenata populations revealed by sequence-related amplified polymorphism markers. J. Agric. Sci. 9:164. doi: 10.5539/jas.v9n4p164
Falush, D., Stephens, M., and Pritchard, J. K. (2003). Inference of population structure using multilocus genotype data: linked loci and correlated allele frequencies. Genetics 164, 1567–1587.
Foy, C. L., Jain, R., and Jacobsohn, R. (1989). Recent approaches for chemical control of broomrape (Orobanche spp.). Rev. Weed Sci. 4, 123–152.
Francis, R. M. (2017). pophelper: an R package and web app to analyse and visualize population structure. Mol. Ecol. Resour. 17, 27–32. doi: 10.1111/1755-0998.12509
François, O., and Durand, E. (2010). Spatially explicit Bayesian clustering models in population genetics. Mol. Ecol. Resour. 10, 773–784. doi: 10.1111/j.1755-0998.2010.02868.x
Frichot, E., Mathieu, F., Trouillon, T., Bouchard, G., and François, O. (2014). Fast and efficient estimation of individual ancestry coefficients. Genetics 196, 973–983. doi: 10.1534/genetics.113.160572
Gagne, G., Roeckel-Drevet, P., Grezes-Besset, B., Shindrova, P., Ivanov, P., Grand-Ravel, C., et al. (1998). Study of the variability and evolution of Orobanche cumana populations infesting sunflower in different European countries. Theor. Appl. Genet. 96, 1216–1222. doi: 10.1007/s001220050859
Gagne, G., Roeckel-Drevet, P., Grezes-Besset, B., Shindrova, P., Ivanov, P., Grand-Ravel, C., et al. (2000). Amplified fragment length polymorphism (AFLP) as suitable markers to study Orobanche cumana genetic diversity. J. Phytopathol. 148, 457–459. doi: 10.1046/j.1439-0434.2000.00528.x
Goldwasser, Y., and Rodenburg, J. (2013). “Integrated Agronomic Management of Parasitic Weed Seed Banks,” in Parasitic Orobanchaceae: Parasitic Mechanisms and Control Strategies, eds D. M. Joel, J. Gressel, and L. J. Musselman (Berlin: Springer), 393–413. doi: 10.1007/978-3-642-38146-1_22
Harter, A. V., Gardner, K. A., Falush, D., Lentz, D. L., Bye, R. A., and Rieseberg, L. H. (2004). Origin of extant domesticated sunflowers in eastern North America. Nature 430, 201–205. doi: 10.1038/nature02710
Jebri, M., Khalifa, M. B., Fakhfakh, H., Perez-Vich, B., and Velasco, L. (2017). Genetic diversity and race composition of sunflower broomrape populations from Tunisia. Phytopathol. Mediterr. 56, 421–430. doi: 10.14601/Phytopathol_Mediterr-20839
Jombart, T., and Ahmed, I. (2011). adegenet 1.3-1: new tools for the analysis of genome-wide SNP data. Bioinformatics 27, 3070–3071. doi: 10.1093/bioinformatics/btr521
Kamvar, Z. N., Tabima, J. F., and Grünwald, N. J. (2014). Poppr: an R package for genetic analysis of populations with clonal, partially clonal, and/or sexual reproduction. PeerJ 2:e281. doi: 10.7717/peerj.281
Kharrat, M. (2002). “Étude de la virulence de l’écotype de Béja d’ Orobanche foetida sur différentes espèces de légumineuses,” in Proceedings of the Devenir des légumineuses alimentaires dans le Maghreb, GTZ Tunis.
Kharrat, M., Abbes, Z., Amri, M., and Karray, R. H. (2010). A new faba bean small seeded variety najeh tolerant to Orobanche registered in the tunisian catalogue. Tunis. J. Plant Protect. 5, 125–130.
Kharrat, M., and Halila, M. H. (1994). “Orobanche species on faba bean (Vicia faba L.) in Tunisia: problem and management. in Biology and management of Orobanche,” in Proceedings of the third international workshop on Orobanche and related Striga research, Amsterdam.
Kharrat, M., and Halila, M. H. (1996). “Control of Orobanche foetida on Vicia faba comparison between different control measures,” in Advances in parasitic plant research, Proceedings of the 6th International on Parasitic Weed Symposium, Cordoba, 733–738.
Kharrat, M., Halila, M. H., Linke, K. H., and Haddar, T. (1992). First report of Orobanche foetida Poiret on faba bean in Tunisia. Fabis Newsl. 30, 46–47.
Klein, O., and Kroschel, J. (2002). Biological control of Orobanche spp. with Phytomyza orobanchia, a review. BioControl 47, 245–277. doi: 10.1023/A:1014862302818
Lavandero, B., Miranda, M., Ramírez, C. C., and Fuentes-Contreras, E. (2009). Landscape composition modulates population genetic structure of Eriosoma lanigerum (Hausmann) on Malus domestica Borkh in central Chile. Bull. Entomol. Res. 99, 97–105. doi: 10.1017/S0007485308006196
Lemopoulos, A., Prokkola, J. M., Uusi-Heikkilä, S., Vasemägi, A., Huusko, A., Hyvärinen, P., et al. (2019). Comparing RADseq and microsatellites for estimating genetic diversity and relatedness — Implications for brown trout conservation. Ecol. Evol. 9, 2106–2120. doi: 10.1002/ece3.4905
Lévesque, C. A., and Rahe, J. E. (1992). Herbicide interactions with fungal root pathogens, with special reference to glyphosate. Annu. Rev. Phytopathol. 30, 579–602. doi: 10.1146/annurev.py.30.090192.003051
Linke, K.-H., Vorlaender, C., and Saxena, M. C. (1990). Occurrence and impact of Phytomyza orobanchia [Diptera: Agromyzidae] on Orobanche crenata [Orobanchaceae] in Syria. Entomophaga 35, 633–639. doi: 10.1007/BF02375097
Lu, F., Lipka, A. E., Glaubitz, J., Elshire, R., Cherney, J. H., Casler, M. D., et al. (2013). Switchgrass genomic diversity, ploidy, and evolution: novel insights from a network-based SNP discovery protocol. PLoS Genet. 9:e1003215. doi: 10.1371/journal.pgen.1003215
Martín-Sanz, A., Malek, J., Fernández-Martínez, J. M., Pérez-Vich, B., and Velasco, L. (2016). Increased virulence in sunflower broomrape (Orobanche cumana Wallr.) populations from Southern Spain is associated with greater genetic diversity. Front. Plant Sci. 7:589. doi: 10.3389/fpls.2016.00589
McMullen, M. D., Kresovich, S., Villeda, H. S., Bradbury, P., Li, H., Sun, Q., et al. (2009). Genetic properties of the maize nested association mapping population. Science 325, 737–740. doi: 10.1126/science.1174320
Nadal, S., Moreno, M. T., and Cubero, J. I. (2004). Registration of ‘Baraca’ Faba Bean. Crop Sci. 44, 1864–1865. doi: 10.2135/cropsci2004.1864a
Pineda-Martos, R., Pujadas-Salvà, A. J., Fernández-Martínez, J. M., Stoyanov, K., Velasco, L., and Pérez-Vich, B. (2014a). The Genetic Structure of Wild Orobanche cumana Wallr. (Orobanchaceae) Populations in Eastern Bulgaria Reflects Introgressions from Weedy Populations. Sci. World J. 2014:150432. doi: 10.1155/2014/150432
Pineda-Martos, R., Velasco, L., and Pérez-Vich, B. (2014b). Identification, characterisation and discriminatory power of microsatellite markers in the parasitic weed Orobanche cumana. Weed Res. 54, 120–132. doi: 10.1111/wre.12062
Pineda-Martos, R., Velasco, L., Fernández-Escobar, J., Fernández-Martínez, J. M., and Pérez-Vich, B. (2013). Genetic diversity of Orobanche cumana populations from Spain assessed using SSR markers. Weed Res. 53, 279–289. doi: 10.1111/wre.12022
Poiret, L. (1922). Voyage en Barbarie, ou Lettres Écrites de L’ancienne Numide. The Bronx, NY: Library of the New York Botanical Garden.
Pritchard, J. K., Stephens, M., and Donnelly, P. (2000). Inference of population structure using multilocus genotype data. Genetics 155, 945–959.
Pujadas-Salvá, A. J., Fraga, I., Aguinbau, P., Sanchez-gullón, E., and Molina-Mahedero, N. (2003). Orobanche crinita Viv. and Orobanche foetida Poir. (Orobanchaceae) in the West Mediterranean area. Bocconea 16, 737–744.
Qi, Z.-C., Yu, Y., Liu, X., Pais, A., Ranney, T., Whetten, R., et al. (2015). Phylogenomics of polyploid Fothergilla (Hamamelidaceae) by RAD-tag based GBS—insights into species origin and effects of software pipelines. J. Syst. Evol. 53, 432–447. doi: 10.1111/jse.12176
R Core Team (2019). R: A Language and Environment for Statistical Computing. Vienna: R Foundation for Statistical Computing. Available online at: https://www.R-project.org/
Raj, A., Stephens, M., and Pritchard, J. K. (2014). fastSTRUCTURE: variational inference of population structure in large SNP data sets. Genetics 197, 573–589. doi: 10.1534/genetics.114.164350
Román, B., Alfaro, C., Maria, T. A., Šatović, Z., Kharrat, M., Pujadas, A., et al. (2001a). “An analysis of genetic variation in natural populations of Orobanche foetida from Spain and Tunisia,” in Proceedings of the 7th Int. Parasit. Weed Symp, Nantes, 57–60.
Román, B., Alfaro, C., Torres, A. M., Moreno, M. T., Satovic, Z., Pujadas, A., et al. (2003). Genetic relationships among Orobanche species as revealed by RAPD analysis. Ann. Bot. 91, 637–642. doi: 10.1093/aob/mcg060
Román, B., Hernandez, R., Pujadas-Salva, A. J., Cubero, J. I., Rubiales, D., and Satovic, Z. (2007a). Genetic diversity in two variants of Orobanche gracilis Sm. [var. gracilis and var. deludens (Beck) A. Pujadas] (Orobanchaceae) from different regions of Spain. Electron. J. Biotechnol. 10:166. doi: 10.2225/vol10-issue2-fulltext-6
Román, B., Rubiales, D., Torres, A. M., Cubero, J. I., and Satovic, Z. (2001b). Genetic diversity in Orobanche crenata populations from southern Spain: theor. Appl. Genet. 103, 1108–1114. doi: 10.1007/s001220100644
Román, B., Satovic, Z., Alfaro, C., Moreno, M. T., Kharrat, M., Pérez-de-Luque, A., et al. (2007b). Host differentiation in Orobanche foetida Poir. Flora Morphol. Distrib. Funct. Ecol. Plants 202, 201–208. doi: 10.1016/j.flora.2006.07.003
Román, B., Torres, A. M., Rubiales, D., Cubero, J. I., and Satovic, Z. (2002). Mapping of quantitative trait loci controlling broomrape (Orobanche crenata Forsk.) resistance in faba bean (Vicia faba L.). Genome 45, 1057–1063. doi: 10.1139/g02-082
Rubiales, D., Flores, F., Emeran, A. A., Kharrat, M., Amri, M., Rojas-Molina, M. M., et al. (2014). Identification and multi-environment validation of resistance against broomrapes (Orobanche crenata and Orobanche foetida) in faba bean (Vicia faba). Field Crops Res. 166, 58–65. doi: 10.1016/j.fcr.2014.06.010
Rubiales, D., Sadiki, M., and Román, B. (2005). First report of Orobanche foetida on common vetch (Vicia sativa) in morocco. Plant Dis. 89, 528–528. doi: 10.1094/PD-89-0528A
Sakaguchi, S., Sugino, T., Tsumura, Y., Ito, M., Crisp, M. D., Bowman, D. M. J. S., et al. (2015). High-throughput linkage mapping of Australian white cypress pine (Callitris glaucophylla) and map transferability to related species. Tree Genet. Genomes 11:121. doi: 10.1007/s11295-015-0944-0
Satovic, Z., Joel, D. M., Rubiales, D., Cubero, J. I., and Román, B. (2009). Population genetics in weedy species of Orobanche. Australas. Plant Pathol. 38, 228–234. doi: 10.1071/AP08100
Schneeweiss, G. M., Palomeque, T., Colwell, A. E., and Weiss-Schneeweiss, H. (2004). Chromosome numbers and karyotype evolution in holoparasitic Orobanche (Orobanchaceae) and related genera. Am. J. Bot. 91, 439–448. doi: 10.3732/ajb.91.3.439
Sharon, A., Amsellem, Z., and Gressel, J. (1992). Glyphosate suppression of an elicited defense response. Plant Physiol. 98, 654–659. doi: 10.1104/pp.98.2.654
Thorogood, C. J., Rumsey, F. J., Harris, S. A., and Hiscock, S. J. (2008). Host-driven divergence in the parasitic plant Orobanche minor Sm. (Orobanchaceae). Mol. Ecol. 17, 4289–4303. doi: 10.1111/j.1365-294X.2008.03915.x
Thrasher, D. J., Butcher, B. G., Campagna, L., Webster, M. S., and Lovette, I. J. (2018). Double-digest RAD sequencing outperforms microsatellite loci at assigning paternity and estimating relatedness: a proof of concept in a highly promiscuous bird. Mol. Ecol. Resour. 18, 953–965. doi: 10.1111/1755-0998.12771
Torkamaneh, D., Laroche, J., and Belzile, F. (2016). Genome-Wide SNP calling from genotyping by sequencing (GBS) data: a comparison of seven pipelines and two sequencing technologies. PLoS One 11:e0161333. doi: 10.1371/journal.pone.0161333
Uhlich, H., Pusch, J., and Barthel, K.-J. (1995). Sommerwurzarten Europas. Available online at: https://agris.fao.org/agris-search/search.do?recordID=US201300020633 (Accessed July 25, 2020).
Unachukwu, N. N., Menkir, A., Rabbi, I. Y., Oluoch, M., Muranaka, S., Elzein, A., et al. (2017). Genetic diversity and population structure of Striga hermonthica populations from Kenya and Nigeria. Weed Res. 57, 293–302. doi: 10.1111/wre.12260
Valderrama, M. R., Román, B., Satovic, Z., Rubiales, D., Cubero, J. I., and Torres, A. M. (2004). Locating quantitative trait loci associated with Orobanche crenata resistance in pea. Weed Res. 44, 323–328. doi: 10.1111/j.1365-3180.2004.00406.x
Vaz Patto, M. C., Díaz-Ruiz, R., Satovic, Z., Román, B., Pujadas-Salvà, A. J., and Rubiales, D. (2008). Genetic diversity of Moroccan populations of Orobanche foetida: evolving from parasitising wild hosts to crop plants. Weed Res. 48, 179–186. doi: 10.1111/j.1365-3180.2008.00621.x
Verity, R., and Nichols, R. A. (2016). Estimating the number of subpopulations (K) in structured populations. Genetics 203, 1827–1839. doi: 10.1534/genetics.115.180992
Verkleij, J. A. C., Janssen, J., and Pieterse, A. H. (1986). “A preliminary study on isoenzyme variation in Orobanche crenata and Orobanche aegyptiaca from Syria,” in Proceedings of a workshop on biology and control of Orobanche, Wageningen.
Welsh, A. B., and Mohamed, K. I. (2011). Genetic diversity of striga hermonthica populations in ethiopia: evaluating the role of geography and host specificity in shaping population structure. Int. J. Plant Sci. 172, 773–782. doi: 10.1086/660104
Westwood, J. H., and Fagg, C. M. (2004). “ISSR characterization of Orobanche minor populations in the U.S,” in Proceedings of the 8th International Parasitic Weeds Symposium, Durban.
Keywords: parasitic plant, Orobanche foetida, RADseq, genetic diversity, population structure, Tunisia
Citation: Boukteb A, Sakaguchi S, Ichihashi Y, Kharrat M, Nagano AJ, Shirasu K and Bouhadida M (2021) Analysis of Genetic Diversity and Population Structure of Orobanche foetida Populations From Tunisia Using RADseq. Front. Plant Sci. 12:618245. doi: 10.3389/fpls.2021.618245
Received: 16 October 2020; Accepted: 10 February 2021;
Published: 13 April 2021.
Edited by:
Nina Rønsted, National Tropical Botanical Garden, United StatesReviewed by:
Emily Bellis, Arkansas State University, United StatesNnanna Unachukwu, International Institute of Tropical Agriculture (IITA), Nigeria
Copyright © 2021 Boukteb, Sakaguchi, Ichihashi, Kharrat, Nagano, Shirasu and Bouhadida. This is an open-access article distributed under the terms of the Creative Commons Attribution License (CC BY). The use, distribution or reproduction in other forums is permitted, provided the original author(s) and the copyright owner(s) are credited and that the original publication in this journal is cited, in accordance with accepted academic practice. No use, distribution or reproduction is permitted which does not comply with these terms.
*Correspondence: Mariem Bouhadida, bWFyaWVtYm91aGFkaWRhNzZAZ21haWwuY29t; Ken Shirasu, a2VuLnNoaXJhc3VAcmlrZW4uanA=
†These authors have contributed equally to this work