 Anis Meschichi1†
 Mathieu Ingouff2†
 Claire Picart3
 Marie Mirouze2,4
 Sophie Desset5
 Franck Gallardo6Kerstin Bystricky7Nathalie Picault3
 Stefanie Rosa1
 Frédéric Pontvianne3*
- 1Department of Plant Biology, Swedish University of Agricultural Sciences, Uppsala, Sweden
- 2Université de Montpellier, DIADE, Montpellier, France
- 3CNRS, Laboratoire Génome et Développement des Plantes (LGDP), Université de Perpignan Via Domitia, Perpignan, France
- 4Institut de Recherche pour le Développement, DIADE, Montpellier, France
- 5iGReD, CNRS UMR 6293, Université Clermont Auvergne, INSERM U1103, Clermont–Ferrand, France
- 6NeoVirTech SAS, 1 Place Pierre Potier, Toulouse, France
- 7Laboratoire de Biologie Moléculaire Eucaryote (LBME), Centre de Biologie Intégrative (CBI), CNRS, UPS, University of Toulouse, Toulouse, France
Together with local chromatin structure, gene accessibility, and the presence of transcription factors, gene positioning is implicated in gene expression regulation. Although the basic mechanisms are expected to be conserved in eukaryotes, less is known about the role of gene positioning in plant cells, mainly due to the lack of a highly resolutive approach. In this study, we adapted the use of the ANCHOR system to perform real-time single locus detection in planta. ANCHOR is a DNA-labeling tool derived from the chromosome partitioning system found in many bacterial species. We demonstrated its suitability to monitor a single locus in planta and used this approach to track chromatin mobility during cell differentiation in Arabidopsis thaliana root epidermal cells. Finally, we discussed the potential of this approach to investigate the role of gene positioning during transcription and DNA repair in plants.
Introduction
In eukaryotes, genetic information is encoded in the chromatin, a complex structure composed of DNA packed around an octamer of histones in the nucleus. Chromosome territories form large compartments in the nucleus, themselves containing chromatin domains harboring different epigenetic signatures (Nguyen and Bosco, 2015; Pontvianne and Grob, 2020; Santos et al., 2020). In these domains, the positioning and accessibility of genes are very dynamic in response to several key biological processes that include gene transcription, genome replication, and DNA repair. Fluorescence in situ hybridization (FISH) approaches, such as padlock-FISH, enable to detect a single-copy locus using the fixed plant material (Feng et al., 2014). However, imaging techniques using non-living organisms are insufficient to track spatial and temporal dynamics of loci. The live-cell imaging approaches allow gene positioning visualization during these different processes, providing key elements for their understanding (Dumur et al., 2019; Shaban and Seeber, 2020).
Microscopic detection of genomic loci in plants is possible through the use of different strategies, such as zinc-finger-based imaging, transcription activator-like effectors (TALEs), and CRISPR/Cas9 (Lindhout et al., 2007; Fujimoto et al., 2016; Khosravi et al., 2020). Unfortunately, these techniques have been restricted to follow the dynamics of highly repeated regions (i.e., centromeric repeats, telomeric sequences, and ribosomal RNA genes). Monitoring a single locus in living plants is possible due to the addition of lacO motifs to which the transcription factor LacI, fused to a fluorescent protein, can bind (Kato and Lam, 2003; Fang and Spector, 2007). Live-cell imaging of Flowering Locus C (FLC) alleles associated with lacO (FLC-LacO) could be performed to demonstrate that FLC-LacO repression during vernalization provokes their physical clustering (Rosa et al., 2013). In addition, the Tet repressor protein fused to a fluorescent protein could also be used to label a genomic region containing numerous Tet operator sequences (Matzke et al., 2005). In both cases, amplification of the signal is directly linked to the multiplicity of the targeted sequences. However, these repetitions often affect local chromatin organization and can trigger silencing of the reporter gene (Watanabe et al., 2005). Thus, a standardized and robust technique for tracking the dynamics of a single locus is still not available.
The ANCHOR system is a DNA-labeling tool derived and optimized from chromosome partitioning complex of bacteria. A single-copy of parS−1-kb-long fragment—serves as a binding platform for ParB proteins (Dubarry et al., 2006). Natural parS sequence is composed of four canonical inverted repeat sequences that are bound via the helix-turn-helix motif present in ParB (Funnell, 2016). Upon binding, oligomerization of ParB proteins then propagates over the parS sequence and adjacent DNA (Figure 1A). Importantly, oligomerized ParB proteins are loosely associated and can be displaced transiently and easily upon transcription or DNA repair (Saad et al., 2014). This phenomenon is also described as the caging step (Funnell, 2016). This system has been adapted successfully to monitor a unique locus in living yeast and human cells using a fluorescent-tagged ParB (Germier et al., 2017). This approach is also able to visualize DNA viruses in human cells (Komatsu et al., 2018; Mariamé et al., 2018; Blanco-Rodriguez et al., 2020; Gallardo et al., 2020; Hinsberger et al., 2020). In this study, we demonstrated that the ANCHOR system can also be used to visualize a single locus in fixed and living plant tissues. Using this approach, we also revealed that chromatin mobility is distinct in differentiated cells compared with meristematic cells of plants.
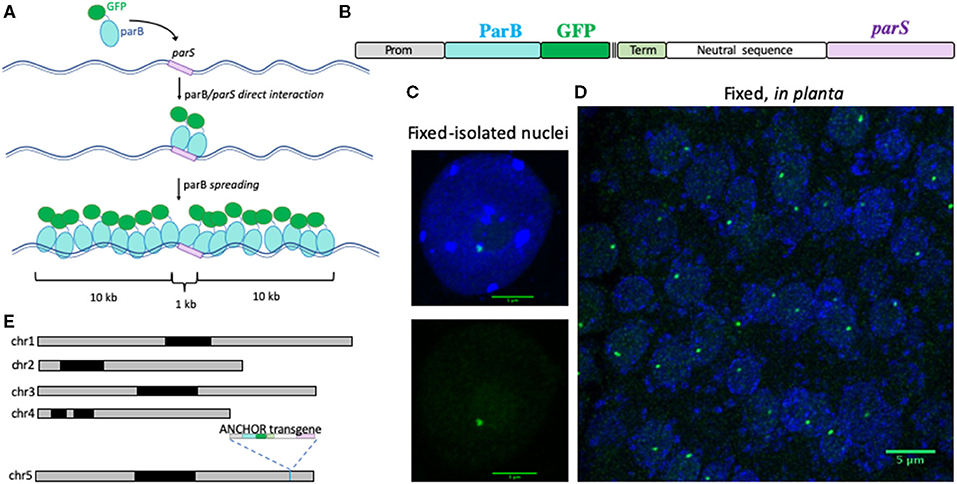
Figure 1. Description of the ANCHOR system in planta. (A) Schematic representation of the ANCHOR system. ParB proteins fused to GFP can directly bind to parS sequence as a dimer. parS-ParB interactions provoke a conformational change in ParB proteins that induce their oligomerization along the flanking genomic region. (B) Cassette used to transform Arabidopsis thaliana Col-0 plants to test the ANCHOR system in planta. A strong and ubiquitous promoter is used to express the ParB protein fused to GFP and three FLAG tags. After a terminator sequence, a 1.5 kb-long spacer sequence has been added to separate the ParB:GFP open reading frame and the 1 kb-long parS sequence. Detection of a parS-ParB:GFP focus (green) in an isolated leaf nucleus (C) and in fixed root tissues (D) of A. thaliana plants containing the ANCHOR cassette described in (B). Nuclear DNA is labeled with DAPI (blue). Bar = 5 μm. (E) Position of the transgene in the ANCHOR line T2F in the Arabidopsis genome using nanopore sequencing. The transgene presented in (B) is inserted on chromosome 5, position 23.675.998 bp.
Materials and Methods
Plant Materials and Growth Conditions
Arabidopsis thaliana ecotype Col-0 was used in this study. lacO/LacI line used was obtained from the study by Matzke et al. (2005). To test the ANCHOR system, A. thaliana (Col-0) plants were transformed by agroinfiltration using the floral dip protocol (Clough and Bent, 1998), using Agrobacterium tumefaciens GV3101 strain. Transformants were grown on soil and sprayed with Basta herbicide for selection (10 mg/L). All the plant materials used here was grown in control growth chambers on soil at 21°C with a daylight period of 16 h/day. The transformant 2F (T2F) line was crossed to Col-0 wild-type plants expressing the histone variant H2A.W fused to a red fluorescent protein (RFP) (Yelagandula et al., 2014). The T2F line used in this study is heterozygote for the ANCHOR transgene, except in the data shown in Figure 2, where homozygous lines have been used.
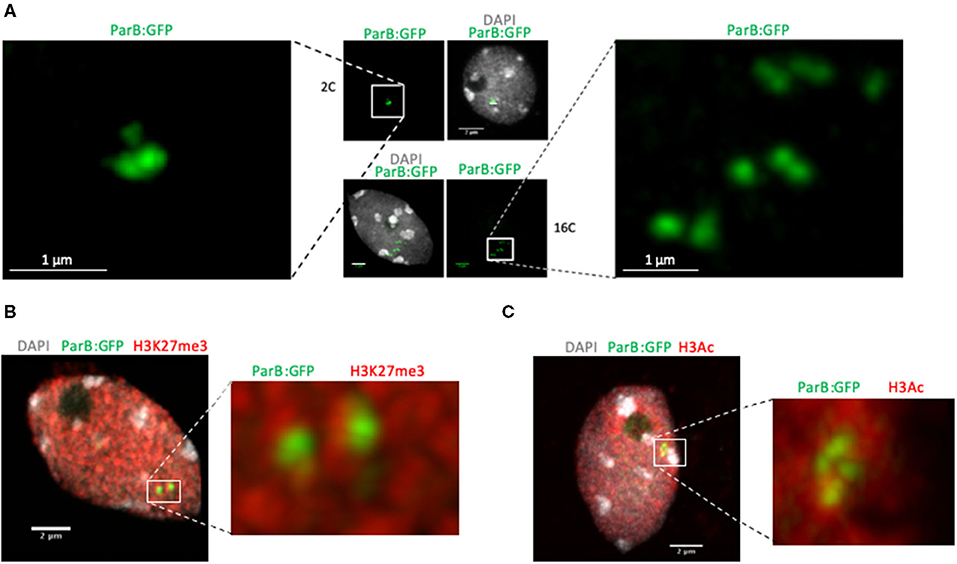
Figure 2. Detection of parS-ParB foci in cells with different ploidy levels and after immunolocalization experiments. (A) Detection of parS-ParB:GFP foci (green) in fixed and sorted nuclei according to their ploidy levels by fluorescent-assisted cell sorting. Nuclear DNA is labeled with DAPI (gray). Enlarged view of the parS-ParB:GFP foci is presented to facilitate signal visualization. Bar = 1 μm. (B,C) Detection of parS-ParB:GFP foci (green) and posttranslationally modified histones (red) in fixed and isolated nuclei from A. thaliana Col-0 plants T2F. The image corresponds to a confocal 2D stack. Nuclear DNA is labeled with DAPI (gray). Trimethylated H3K27 signals are shown in (B), while acetylated H3 are shown in (C). Enlarged views of the parS-ParB:GFP foci are presented to facilitate signal visualization. Bar = 2 μm.
For in vitro growth, seeds were surface sterilized in 5% v/v sodium hypochlorite for 5 min and rinsed three times in sterile distilled water. Seeds were stratified at 4°C for 48 h in the darkness and plated on the Murashige and Skoog (MS) medium. Seedlings were placed in a growth cabinet (16 h light, 22°C) for 1 week in a vertically oriented Petri dish before imaging.
Plasmid Construction
A cassette allowing the expression of ParB has been synthetized by GenScript (USA). The nature and sequences of the ANCHOR system and the property of NeoVirTech SAS are confidential. The cassette was cloned into the pEarleyGate302 vector (Earley et al., 2006).
Nanopore Sequencing
Genomic DNA preparation was performed as previously described by Picart-Picolo et al. (2020). Library preparation was performed using the 1D genomic DNA with ligation kit SQK-LSK109 (Oxford Nanopore Technologies, UK), following the instructions of the manufacturer. The R9.5 ONT flow-cell FLO-MIN106D (Oxford Nanopore Technologies, UK) was used. We obtained 1.93 GB of sequences (11 × coverage) with an average read length of 3,675 kb for ANCHOR T2F line. ONT reads mapping the transgene were mapped, filtered, and aligned using Geneious® software (Kearse et al., 2012).
Cytogenetic Analyses
For cytogenetic analyses, nuclei were isolated from 3- or 4-week-old plants as previously described (Pontvianne et al., 2012). In brief, fresh leaves were fixed in 4% formaldehyde in Tris buffer (10 mM Tris–HCl at pH 7.5, 10 mM EDTA, and 100 mM NaCl) for 20 min and then chopped with a razor blade in 0.5 mL of LB01 buffer (15 mM Tris–HCl at pH 7.5, 2 mM NaEDTA, 0.5 mM spermine, 80 mM KCl, 20 mM NaCl, and 0.1% Triton X-100). The lysate was filtered through a 30-μm cell strainer (BD Falcon, USA), and 12 μL of sorting buffer (100 mM Tris–HCl at pH 7.5, 50 mM KCl, 2 mM MgCl2, 0.05% Tween-20, and 5% sucrose) was added per 3 μL of cell/nuclei suspension (Pontvianne et al., 2012) and spread on a polylysine slide. After air-drying, the samples were postfixed in 2% formaldehyde in phosphate buffer (PBS) for 5 min and then washed twice with water before being air-dried. The slides were then mounted in Vectashield at 1 μg/mL of DAPI and sealed them with nail polish.
Nuclei with different levels of ploidy were isolated as described by Pontvianne et al. (2016), except that propidium iodide was used to stain the nuclei, together with RNase to a final concentration of 10 μg/mL. A S3 cell sorter (Biorad, USA) with 488 nm and 561 nm 100 mW dual-lasers was used to sort the nuclei. Immunolocalization experiments were performed as described previously (Durut et al., 2014) using anti-H3K27me3 or anti-H3Ac antibodies (Abcam, USA) to a 1/1,000 dilution. Zeiss LSM 700 confocal was used to generate images as shown in Figure 1, while Zeiss LSM 800 with an Airyscan module was used to generate images as shown in Figures 2–4A with a 63 × objective, N.A. 1.4 and pixel size of 0.028 × 0.028 × 0.160 μm3. Live-cell imaging shown in Figure 4B were performed using a spinning disk Zeiss Cell Observer equipped with a high-speed Yokogawa CSUX1 spinning disk confocal, an ORCA-flash 4.0 digital camera Hamammatsu (Japan) and a 40 × water objective N.A. 1.2. Green fluorescent protein (GFP) was excited at 488 nm.
Live-Cell Imaging
In Figure 5, time-lapse imaging of A. thaliana roots has been carried out using a Zeiss LSM 780 confocal microscope with a 63 × water immersion objective (1.20 N.A.). For visualization of root cell contours stained with propidium iodide, an excitation line of 488 nm was used, and the signal was detected at wavelengths of 580–700 nm. For the observation of GFP expression, we used a 488-nm excitation line and a band-pass filter of 505–550 nm. For all experiments, the images were acquired every 6 s, taking a series of three optical sections with a Z-step of 2 μm for 5 min. Each movie has a format of 512 × 512 pixels and a 3 × zoom factor.
The 7-day-old seedlings were mounted in water, or propidium iodide, between slide and cover slip and sealed with a 0.12-mm-thick SecureSeal adhesive tape (Biorad, USA), to avoid root movements and drying during imaging.
Mean Square Displacement Analysis
All the movies have been analyzed with Fiji software (NIH, Bethesda, MD, USA, http://rsb.info.nih.gov/ij/) and with the plugin SpotTracker 2D (obtained from www.epfl.ch/sage/soft/spottracker). The mean square displacement (MSD) analysis was performed as described by Meschichi and Rosa (2021). All quantitative measurements represent averages from at least nine cells. From the MSD plot, we calculated the radius of constraint by the square root of the plateau of the MSD curve multiplied by 5/4. Data sets were tested for normality using the Shapiro–Wilk test. The parametric analyses were done using the standard Student's t-test to determine the statistical significance of the results. For the statistical analysis, we used the GraphPad Prism 8.3 software.
Results
Development of the ANCHOR System
Our aim was to adapt and facilitate the use of the ANCHOR system in plants. We, therefore, combined the two elements of the ANCHOR system (ParB and its target sequence parS) into a single transgene. A ParB gene, whose coding sequence has been optimized for A. thaliana, was fused in a frame to a GFP and triple FLAG-tag (ParB:GFP:3XFLAG) to allow detection in living and fixed nuclei (Figure 1B). ParB:GFP:3XFLAG expression was placed under the control of a promoter allowing ubiquitous expression. At the 3′ end of the ParB construct, we added the 1-kb-long ParB target sequence parS separated by a 1.5-kb-long spacer sequence to prevent the potential interference of ParB gene transcriptional activity. Such design allows a rapid selection of transgenic plants containing the two linked ANCHOR elements. In addition, detection of parS-ParB:GFP signals would suggest that ParB:GFP transcription is possible even in the case of local caging of ParB:GFP proteins.
Wild-type Col-0 plants were transformed with the transgene and selected using Basta herbicide by spraying. Fixed nuclei isolated from eight different T1 transformants revealed the presence of parS-ParB:GFP foci in five of them (Figure 1C). To test the robustness of the detection approach, we then analyzed the entire root-tip from one ANCHOR line comprising a single-copy insertion at generation T2 (T2F; Figure 1D). One parS-ParB:GFP signal was detectable in almost all nuclei analyzed. Importantly, the signal-to-noise ratio is high, which allows easy detection of the specific signal (Figure 1D).
To further characterize the ability of the ANCHOR system to follow a single-locus in planta, it is important to know the exact location of the transgene. We performed long-read nanopore sequencing on an ANCHOR line with one single insertion (T2F) and extracted all long reads corresponding to the transgene to map its location in the genome. The sequence analyses revealed that the transgene could be located on the lower arm of chromosome 5, at position 23.675.998 bp, in an intergenic region (Figure 1E). This position is flanked by a region enriched in active chromatin marks and a region enriched with histone 3 trimethylated lysine 27 (H3K27me3), a repressive mark deposit by the polycomb repressive complex 2 (PRC2) (Supplementary Figure 1) (Sequeira-Mendes et al., 2014).
Detection of parS-ParB Foci in Fixed Cells
As shown in Figure 1D, one unique focus was usually detected in root tip cells, sometimes appearing as a doublet. Since the ANCHOR system is based on protein aggregation, we checked whether analyzing ANCHOR signals in endoreplicated cells would lead to an increased number of detected foci. We isolated 2C, 4C, and 16C cells by fluorescent-assisted cell sorting after propidium iodide labeling and RNase treatment. We stained sorted nuclei with DAPI and observed parS-ParB:GFP signals in sorted nuclei. We could see a higher amount of parS-ParB:GFP signals in sorted nuclei presenting a higher endoreplication rate (Figure 2A and Supplementary Figure 2A). Although these data suggest that the ANCHOR system is suitable to detect multiple loci simultaneously, additional experiments are required to fully demonstrate that this reporting system does not lead to aberrant locus aggregation.
In the T2F line, the transgene is located on an arm of the chromosome 5, in a region enriched in H3K27me3 deposited by the PRC2 but flanked by a genomic region enriched with active chromatin marks (Supplementary Figure 1). Although T-DNA transgene insertion may affect this peculiar chromatin environment locally (Rajeevkumar et al., 2015), we tested the possibility to combine both immunostaining and parS-ParB:GFP signal detection. Immunostaining experiments were performed on isolated leaf nuclei from 3-week-old plants using either an antibody against histone 3 acetylated (H3Ac) active mark or H3K27me3 repressive mark. As expected, the tested histone marks and parS-ParB:GFP signals are excluded from heterochromatic foci stained by DAPI, corresponding to the centromeric, pericentromeric, and nucleolus organizer regions (Figures 2B,C). Although no clear overlap could be detected between parS-ParB:GFP signals and H3K27me3 marks, at least partial overlap can be seen between parS-ParB:GFP signals and H3Ac marks (Figures 2B,C and Supplementary Figure 4). This result is expected since active transcription is necessary to produce ParB:GFP proteins. Although we cannot conclude about the specific chromatin state surrounding the transgene insertion site in T2F, this experiment demonstrates our ability to detect parS-ParB:GFP signals and immunodetection approach simultaneously.
Detection of parS-ParB Foci in Live-Cell Imaging
Previous studies demonstrate that global genome organization can be cell specific and vary during plant development (Pontvianne and Liu, 2019). Therefore, we tested our ability to detect parS-ParB:GFP signals in different cell-types, directly in planta. To allow simultaneous visualization of heterochromatin and parS-ParB:GFP signals directly in living cells, we crossed the T2F line with another A. thaliana Col-0 line expressing the histone 2A variant H2A.W, fused to the RFP (Yelagandula et al., 2014). Plants were grown on MS media directly in Petri dish compatible with confocal imaging. We analyzed several tissues, including meristematic and differentiated root cells, leaf cells, and trichome cells, and also pollen grains from plants grown on soil. We were able to detect parS-ParB:GFP signals in all cell types tested (Figure 3 and Supplementary Figure 3). As expected, parS-ParB:GFP signals are excluded from the heterochromatin area, labeled by H2A.W:RFP signals. It is noted that in certain cell types, the nuclear area can be seen due to non-associated ParB proteins that diffuse in the nucleoplasm.
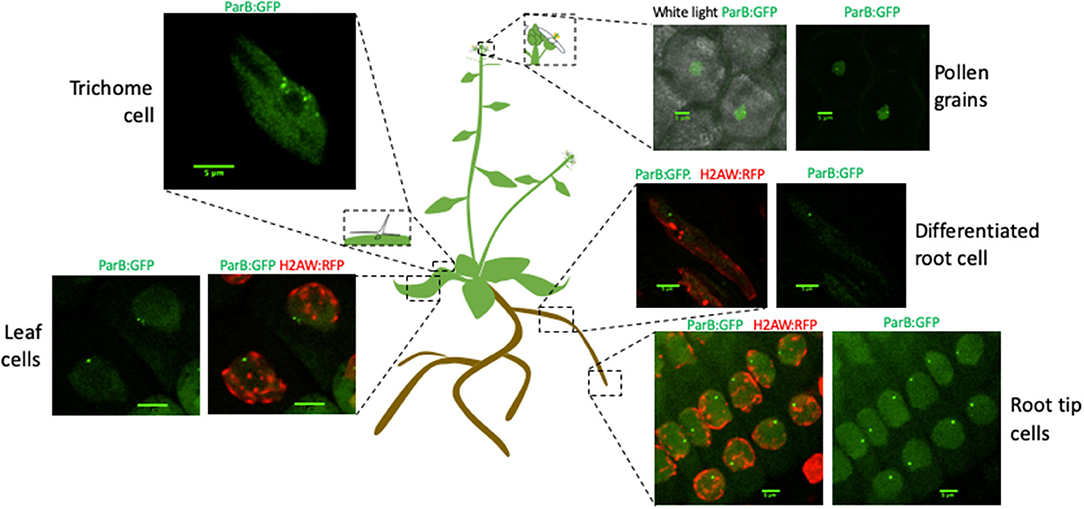
Figure 3. ANCHOR system is suitable to monitor a single-copy locus in live cell and different tissues. Schematic representation of an A. thaliana plant illustrating the different tissues in which parS-ParB:GFP signals have been detected by live-cell imaging. ParB:GFP signals are shown in green and H2A.W:RFP is shown in red. Scale bars = 5 μm.
The ANCHOR system does not require high DNA accessibility to allow the visualization of parS-ParB:GFP signals. In a highly condensed chromatin context, such as during mitosis, we could still detect parS-ParB:GFP signals in condensed chromosomes, even though the signal is usually less bright than in the neighboring cells (Figure 4A).
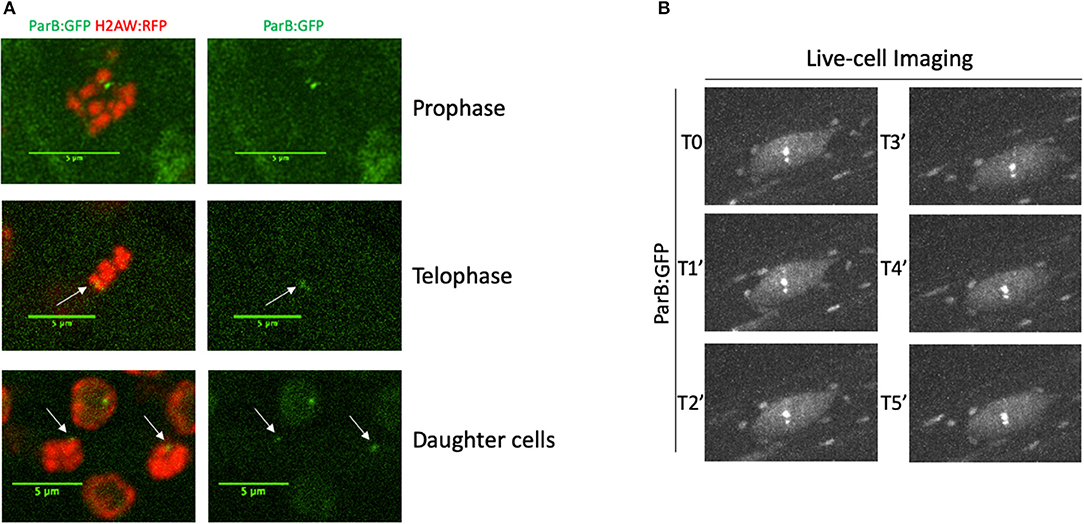
Figure 4. Monitoring parS-ParB:GFP in live cell during mitosis or during a time-course. (A) Detection of parS-ParB:GFP foci (green) and H2A.W:RFP (red) in mitotic cells. Scale bars = 5 μm. (B) ANCHOR system enables time-lapse tracking of a single locus in live roots by confocal imaging. Time-lapse acquisition of parS-ParB:GFP signals (gray) in an endoreplicated root cell over 5 min.
Finally, we tested our ability to perform live-cell imaging of the parS-ParB:GFP signals in planta. We analyzed parS-ParB:GFP dynamics in living roots using a Zeiss Cell Observer spinning disk microscope (Figure 3B). Although bleaching can alter the signal detection over time, we were able to detect the ParB:GFP signals at multiple time points and track its relative nuclear position, as reported earlier in human and yeast cells (Saad et al., 2014; Germier et al., 2017). Movies showing the detection of parS-ParB:GFP signals in live meristematic or elongated cells can be found in Supplementary Material (Supplementary Movies 1, 2). Altogether, our data demonstrated that the ANCHOR system is suitable for live-cell imaging in planta.
Studying Chromosome Mobility Using the ANCHOR System
It is now clear that higher-order organization of the chromatin exerts an important influence on genomic function during cell differentiation (Arai et al., 2017). For instance, in A. thaliana, histone exchange dynamics were shown to decrease gradually as cells progressively differentiate (Rosa et al., 2013). However, how chromosomes and the chromatin fiber move during cell differentiation is not well-studied in plants. We took advantage of our ANCHOR DNA labeling system to monitor chromatin mobility changes upon cell differentiation in the T2F line. In particular, we measured the mobility of parS-ParB:GFP foci in meristematic and differentiated cells from the root epidermis (Figure 5A) through live-cell imaging using confocal microscopy and quantified the mobility using the MSD analysis (Meschichi and Rosa, 2021). Interestingly, the chromatin mobility on meristematic cells was higher than in differentiated cells (Figure 5B and Supplementary Movies 1, 2). These differences were statistically significant as shown by a much higher radius of constraint (Figure 5C). These results may support the idea that the chromatin in undifferentiated cells holds a more dynamic conformation (Meshorer et al., 2006; Rosa et al., 2013; Arai et al., 2017). However, additional experiments would be required to further validate the biological relevance of this result.
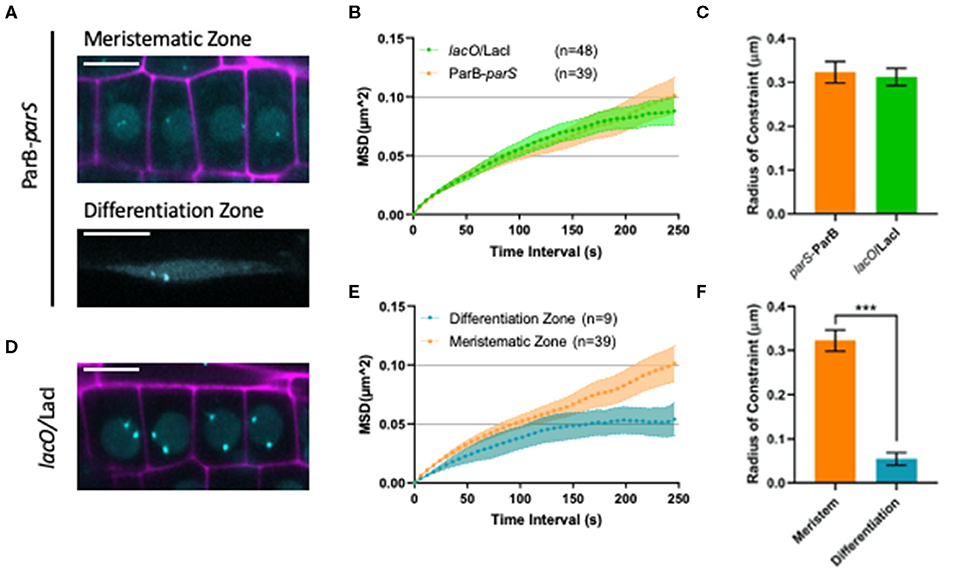
Figure 5. Analyzing chromatin mobility using the ANCHOR system. (A) Representative images of ParB-parS line in meristematic (upper panel) and differentiation zone (bottom panel)showing nuclear signal with spots (cyan). Propidium iodide (PI) staining is shown in magenta. Bars = 10 μm. (B) The MSD analysis for lacO/LacI and ParB-parS lines based on time lapse experiment of nuclei in the meristematic zone. The values represent means ± SEM from 48 and 39 cells, respectively. (C) Calculated radius of constraint for MSD curves depicted in (B). The values represent means ± SEM. Student's t-test, ***P < 0.001. (D) Representative image of lacO/LacI line in meristematic region showing nuclear signal with spots (cyan). PI staining is shown in magenta. Scale bar = 10 μm. (E) The MSD analysis for ParB-parS lines based on time-lapse experiments of nuclei in the meristematic and differentiated zone. 3D stacks were taken at 6 s intervals for 5 min. The values represent mean ± SEM from 39 and 9 cells, respectively. (F) Calculated radius of constraint for MSD curves depicted in (E). The values represent means ± SEM.
Since single-locus dynamics in plants was mostly possible through the use of the lacO/LacI system (Figure 5D), we thought to compare chromatin mobility in meristematic cells using the ANCHOR and the lacO/LacI systems. Interestingly, both methods revealed a very similar MSD curve. In fact, a MSD curve, where the maximum values asymptotically reach a plateau, indicates that chromatin moves in a subdiffusive manner, which is typical for chromosomal loci tracked in interphase nuclei (Seeber et al., 2018). Additionally, the curves resulted in comparable measurements of the radius of constraint (Figures 5E,F), showing that the chromatin environment for these two insertion lines may be similar. While the comparison of additional lines with different chromosomal locations would be interesting, the results presented here illustrate that the ANCHOR system can be used to monitor single-locus and is suitable to study chromosome organization and dynamics in plants.
Discussion and Perspectives
In this study, we described a novel method to monitor a single-copy locus in planta. In comparison with existing strategies, the advantage of the ANCHOR system is the absence of repeated elements in the target sequence. This aspect is especially important in plants due to the existence of plant-specific silencing systems (Watanabe et al., 2005; Matzke et al., 2015; Grob and Grossniklaus, 2019). In fact, the parS sequence is only 1-kb-long and could potentially be shortened to 200 bp (NeoVirtech, personal communication). In addition, several reports in yeast and animal cells have already demonstrated the innocuity of the ANCHOR system to endogenous processes such as transcription and replication (Germier et al., 2018). This particularity makes the ANCHOR system very suitable to monitor single-copy genes in its native genomic environment. In this study, ANCHOR lines were generated by T-DNA insertion. Five out of eight independent lines showed strong ANCHOR signals. This could indicate that ANCHOR insertion site is important to be functional. However, we cannot conclude whether the ANCHOR system is suitable to monitor a genomic locus located in a heterochromatic environment. The absence of parS-ParB:GFP foci could in fact be a consequence of a lack of ParB:GFP expression, which does not mean that parS accessibility is compromised. Having a separate transgene for ParB:GFP expression and parS detection would be necessary to address this point. In addition, T-DNA transgenes and Agrobacterium-directed transformation can be a source of genomic and epigenomic instability, both in cis and in trans (Rajeevkumar et al., 2015). Moreover, they can also modify the nuclear architecture of their insertion site (Grob and Grossniklaus, 2019). To specifically monitor the dynamics of selected single loci, the parS sequence would need to be inserted at a precise position within the desired locus. A recent approach that combine CRISPR-Cas9 technology and a homologous recombination-donor cassette can generate knock-in A. thaliana plants (Miki et al., 2018; Wolter et al., 2018; Merker et al., 2020). The implementation of the parS knock-in strategy will really improve the innocuity of this approach on the local chromatin state and should strongly reduce any bias on its nuclear positioning.
Another advantage of the ANCHOR approach is the possibility to use simultaneously different combinations of parS-ParB. In fact, ParB binding on parS sequence is species-specific, and several combinations have successfully been used separately or simultaneously so far. In this study, we used a specific parS-ParB, but an additional specific combination could be used. In theory, up to three combinations could be used simultaneously (Saad et al., 2014, NeoVirTech peronnal communication), although an important preliminary work would be required for plant material preparation. For instance, two alleles from the same gene could be differently labeled to monitor their potential associations while being expressed or silenced. This is an important question since previous observations suggest that allele aggregation could participate in gene transcriptional regulation (Rosa et al., 2013). These color combinations could also be used to follow the distance of two proximal regions during DNA repair, for example, as already shown in yeast (Saad et al., 2014) or to label borders of a genomic regions that can undergo different chromatin states during stress or development. This system will provide a useful tool to study the spatial organization and the dynamic behavior of chromatin at the single locus level.
Data Availability Statement
The sequencing data presented in this study are not readily available due to proprietary restrictions. The remaining original contributions presented in the study are included in the article/Supplementary Material, and further inquiries can be directed to the corresponding author.
Author Contributions
MI, FP, and SR designed the experiments. AM, MI, CP, and FP performed the experiments. AM, MI, NP, SR, and FP analyzed the data. SD, FG, KB, and MM participated in material preparation or analyzing tools. FP wrote the paper and acquired main funding. SR edited the paper. All authors contributed to the article and approved the submitted version.
Funding
FP was supported by the Agence Nationale de la Recherche (ANR), JCJC NucleoReg (ANR-15-CE12-0013-01), and the French Laboratory of Excellence project TULIP (ANR-10-LABX-41 and ANR-11-IDEX-0002-02). MI was supported by the French National Research Agency (ANR-15-CE12-0012). MM is a member of the European Training Network EpiDiverse that receives funding from the European Union Horizon 2020 Program under Marie Skłodowska-Curie grant agreement No. 764965. AM and SR were supported by the Swedish Research Council (Vetenskapsrådet) grant number 2018-04101. SD was supported by the Region Auvergne-Rhône-Alpes as Pack Ambition Recherche project NOYAU-HD. AM, MI, CP, NP, SD, SR, and FP are part of the European Cooperation in Science and Technology COST ACTION CA16212 INDEPTH.
Conflict of Interest
FG is an employee and FG and KB are shareholder of NeoVirTech. NeoVirTech did not have any scientific or financial contribution to this study. ANCHOR system is the property of NeoVirTech SAS, Toulouse, France.
The remaining authors declare that the research was conducted in the absence of any commercial or financial relationships that could be construed as a potential conflict of interest.
Acknowledgments
We thank Guillaume Moissiard, Christophe Tatout, and Aline Probst for fruitful discussions. We thank Chritel Llauro for her help with nanopore sequencing. We also thank the Flow Cytometry Facility, the Microscopic Facility, and the Sequencing Facility of platform BioEnvironnement of Perpignan University Via Domitia (Perpignan, France) and also the Clermont-Ferrand Imagerie Confocale platform (Clermont-Ferrand, France). We acknowledge Rodolphe Dombey for technical assistance and the imaging facility MRI, member of the National Infrastructure France-BioImaging Infrastructure supported by the French National Research Agency (ANR-10-INBS-04, Investments for the future). We thank Marion Orsucci for the help with the statistical analysis.
Supplementary Material
The Supplementary Material for this article can be found online at: https://www.frontiersin.org/articles/10.3389/fpls.2021.677849/full#supplementary-material
Supplementary Figure 1. Chromatin states flanking the insertion site in T2F ANCHOR line. (A) Snapshot of the chromatin states enriched in the region flanking the transgene insertion site in the line T2F (https://jbrowse.arabidopsis.org/). (B) Histogram representing the relative enrichment of each chromatin state in the 5 kb upstream and downstream region of the transgene insertion site in the line T2F.
Supplementary Figure 2. Detection of parS-ParB foci in cells with different ploidy levels. Detection of parS-ParB:GFP foci (green) in fixed and sorted nuclei according to their ploidy levels by fluorescent-assisted cell sorting. Nuclear DNA is labeled with DAPI (gray).
Supplementary Figure 3. Pollen grain and trichome cell. Confocal images of the parS-ParB:GFP signal in a trichome cell (top panels) or in pollen grains (bottom panels). Images on the right are saturated to show the trichome contour or the pollen grains.
Supplementary Figure 4. Co-localization of parS-ParB foci with H3Ac and H3K27me3 marks. Detection of parS-ParB:GFP foci (green) and posttranslationally modified histones (red) in fixed and isolated nuclei from A. thaliana Col-0 plants T2F. Nuclear DNA is labeled with DAPI (gray). Trimethylated H3K27 signals are shown in the (A), while acetylated H3 are shown in (B). (C,D) show the relative intensity of each signal.
References
Arai, R., Sugawara, T., Sato, Y., Minakuchi, Y., Toyoda, A., Nabeshima, K., et al. (2017). Reduction in chromosome mobility accompanies nuclear organization during early embryogenesis in Caenorhabditis elegans. Sci. Rep. 7:3631. doi: 10.1038/s41598-017-03483-5
Blanco-Rodriguez, G., Gazi, A., Monel, B., Frabetti, S., Scoca, V., Mueller, F., et al. (2020). Remodeling of the core leads HIV-1 preintegration complex into the nucleus of human lymphocytes. J. Virol. 94. doi: 10.1128/JVI.00135-20
Clough, S. J., and Bent, A. F. (1998). Floral dip: a simplified method for Agrobacterium-mediated transformation of Arabidopsis thaliana. Plant J. 16, 735–743. doi: 10.1046/j.1365-313x.1998.00343.x
Dubarry, N., Pasta, F., and Lane, D. (2006). ParABS systems of the four replicons of Burkholderia cenocepacia: new chromosome centromeres confer partition specificity. J. Bacteriol. 188, 1489–1496. doi: 10.1128/JB.188.4.1489-1496.2006
Dumur, T., Duncan, S., Graumann, K., Desset, S., Randall, R. S., Scheid, O. M., et al. (2019). Probing the 3D architecture of the plant nucleus with microscopy approaches: challenges and solutions. Nucleus 10, 181–212. doi: 10.1080/19491034.2019.1644592
Durut, N., Abou-Ellail, M., Pontvianne, F., Das, S., Kojima, H., Ukai, S., et al. (2014). A duplicated NUCLEOLIN gene with antagonistic activity is required for chromatin organization of silent 45S rDNA in Arabidopsis. Plant Cell 26, 1330–1344. doi: 10.1105/tpc.114.123893
Earley, K. W., Haag, J. R., Pontes, O., Opper, K., Juehne, T., Song, K., et al. (2006). Gateway-compatible vectors for plant functional genomics and proteomics. Plant J. 45, 616–629. doi: 10.1111/j.1365-313X.2005.02617.x
Fang, Y., and Spector, D. L. (2007). Identification of nuclear dicing bodies containing proteins for microRNA biogenesis in living Arabidopsis plants. Curr. Biol. 17, 818–823. doi: 10.1016/j.cub.2007.04.005
Feng, C.-M., Qiu, Y., Van Buskirk, E. K., Yang, E. J., and Chen, M. (2014). Light-regulated gene repositioning in Arabidopsis. Nat. Commun. 5:3027. doi: 10.1038/ncomms4027
Fujimoto, S., Sugano, S. S., Kuwata, K., Osakabe, K., and Matsunaga, S. (2016). Visualization of specific repetitive genomic sequences with fluorescent TALEs in Arabidopsis thaliana. J. Exp. Bot. 67, 6101–6110. doi: 10.1093/jxb/erw371
Funnell, B. E. (2016). ParB partition proteins: complex formation and spreading at bacterial and plasmid centromeres. Front. Mol. Biosci. 3:44. doi: 10.3389/fmolb.2016.00044
Gallardo, F., Schmitt, D., Brandely, R., Brua, C., Silvestre, N., Findeli, A., et al. (2020). Fluorescent tagged vaccinia virus genome allows rapid and efficient measurement of oncolytic potential and discovery of oncolytic modulators. Biomedicines 8:543. doi: 10.3390/biomedicines8120543
Germier, T., Audibert, S., Kocanova, S., Lane, D., and Bystricky, K. (2018). Real-time imaging of specific genomic loci in eukaryotic cells using the ANCHOR DNA labelling system. Methods 142, 16–23. doi: 10.1016/j.ymeth.2018.04.008
Germier, T., Kocanova, S., Walther, N., Bancaud, A., Shaban, H. A., Sellou, H., et al. (2017). Real-time imaging of a single gene reveals transcription-initiated local confinement. Biophys. J. 113, 1383–1394. doi: 10.1016/j.bpj.2017.08.014
Grob, S., and Grossniklaus, U. (2019). Invasive DNA elements modify the nuclear architecture of their insertion site by KNOT-linked silencing in Arabidopsis thaliana. Genome Biol. 20:120. doi: 10.1186/s13059-019-1722-3
Hinsberger, A., Graillot, B., Blachère Lopez, C., Juliant, S., Cerutti, M., King, L. A., et al. (2020). Tracing baculovirus AcMNPV infection using a real-time method based on ANCHOR(TM) DNA labeling technology. Viruses 12. doi: 10.3390/v12010050
Kato, N., and Lam, E. (2003). Chromatin of endoreduplicated pavement cells has greater range of movement than that of diploid guard cells in Arabidopsis thaliana. J. Cell Sci. 116, 2195–2201. doi: 10.1242/jcs.00437
Kearse, M., Moir, R., Wilson, A., Stones-Havas, S., Cheung, M., Sturrock, S., et al. (2012). Geneious Basic: an integrated and extendable desktop software platform for the organization and analysis of sequence data. Bioinformatics 28, 1647–1649. doi: 10.1093/bioinformatics/bts199
Khosravi, S., Dreissig, S., Schindele, P., Wolter, F., Rutten, T., Puchta, H., et al. (2020). Live-Cell CRISPR imaging in plant cells with a telomere-specific guide RNA. Methods Mol. Biol. 2166, 343–356. doi: 10.1007/978-1-0716-0712-1_20
Komatsu, T., Quentin-Froignant, C., Carlon-Andres, I., Lagadec, F., Rayne, F., Ragues, J., et al. (2018). In vivo labelling of adenovirus DNA identifies chromatin ANCHORing and biphasic genome replication. J. Virol. 92:e00795-18. doi: 10.1128/JVI.00795-18
Lindhout, B. I., Fransz, P., Tessadori, F., Meckel, T., Hooykaas, P. J. J., and van der Zaal, B. J. (2007). Live cell imaging of repetitive DNA sequences via GFP-tagged polydactyl zinc finger proteins. Nucleic Acids Res. 35:e107. doi: 10.1093/nar/gkm618
Mariamé, B., Kappler-Gratias, S., Kappler, M., Balor, S., Gallardo, F., and Bystricky, K. (2018). Real-time visualization and quantification of human cytomegalovirus replication in living cells using the ANCHOR DNA labeling technology. J. Virol. 92:e00571-18. doi: 10.1128/JVI.00571-18
Matzke, A. J. M., Huettel, B., van der Winden, J., and Matzke, M. (2005). Use of two-color fluorescence-tagged transgenes to study interphase chromosomes in living plants. Plant Physiol. 139, 1586–1596. doi: 10.1104/pp.105.071068
Matzke, M. A., Kanno, T., and Matzke, A. J. M. (2015). RNA-directed DNA methylation: the evolution of a complex epigenetic pathway in flowering plants. Annu. Rev. Plant Biol. 66, 243–267. doi: 10.1146/annurev-arplant-043014-114633
Merker, L., Schindele, P., and Puchta, H. (2020). Using CRISPR/ttLbCas12a for in planta gene targeting in A. thaliana. Curr. Protoc. Plant Biol. 5:e20117. doi: 10.1002/cppb.20117
Meschichi, A., and Rosa, S. (2021). Visualizing and measuring single locus dynamics in Arabidopsis thaliana. Methods Mol. Biol. 2200, 213–224. doi: 10.1007/978-1-0716-0880-7_10
Meshorer, E., Yellajoshula, D., George, E., Scambler, P. J., Brown, D. T., and Misteli, T. (2006). Hyperdynamic plasticity of chromatin proteins in pluripotent embryonic stem cells. Dev. Cell 10, 105–116. doi: 10.1016/j.devcel.2005.10.017
Miki, D., Zhang, W., Zeng, W., Feng, Z., and Zhu, J.-K. (2018). CRISPR/Cas9-mediated gene targeting in Arabidopsis using sequential transformation. Nat. Commun. 9:1967. doi: 10.1038/s41467-018-04416-0
Nguyen, H. Q., and Bosco, G. (2015). Gene positioning effects on expression in eukaryotes. Annu. Rev. Genet. 49, 627–646. doi: 10.1146/annurev-genet-112414-055008
Picart-Picolo, A., Grob, S., Picault, N., Franek, M., Llauro, C., Halter, T., et al. (2020). Large tandem duplications affect gene expression, 3D organization, and plant-pathogen response. Genome Res. 30, 1583–1592. doi: 10.1101/gr.261586.120
Pontvianne, F., Blevins, T., Chandrasekhara, C., Feng, W., Stroud, H., Jacobsen, S. E., et al. (2012). Histone methyltransferases regulating rRNA gene dose and dosage control in Arabidopsis. Genes Dev. 26, 945–957. doi: 10.1101/gad.182865.111
Pontvianne, F., Boyer-Clavel, M., and Saez-Vasquez, J. (2016). Fluorescence-activated nucleolus sorting in Arabidopsis. Methods Mol. Biol. 1455, 203–211. doi: 10.1007/978-1-4939-3792-9_15
Pontvianne, F., and Grob, S. (2020). Three-dimensional nuclear organization in Arabidopsis thaliana. J. Plant Res. 133, 479–488. doi: 10.1007/s10265-020-01185-0
Pontvianne, F., and Liu, C. (2019). Chromatin domains in space and their functional implications. Curr. Opin. Plant Biol. 54, 1–10. doi: 10.1016/j.pbi.2019.11.005
Rajeevkumar, S., Anunanthini, P., and Sathishkumar, R. (2015). Epigenetic silencing in transgenic plants. Front. Plant Sci. 6:693. doi: 10.3389/fpls.2015.00693
Rosa, S., De Lucia, F., Mylne, J. S., Zhu, D., Ohmido, N., Pendle, A., et al. (2013). Physical clustering of FLC alleles during Polycomb-mediated epigenetic silencing in vernalization. Genes Dev. 27, 1845–1850. doi: 10.1101/gad.221713.113
Saad, H., Gallardo, F., Dalvai, M., Tanguy-le-Gac, N., Lane, D., and Bystricky, K. (2014). DNA dynamics during early double-strand break processing revealed by non-intrusive imaging of living cells. PLoS Genet. 10:e1004187. doi: 10.1371/journal.pgen.1004187
Santos, A. P., Gaudin, V., Mozgová, I., Pontvianne, F., Schubert, D., Tek, A. L., et al. (2020). Tiding-up the plant nuclear space: domains, function and dynamics. J. Exp. Bot. 71, 5160–5178. doi: 10.1093/jxb/eraa282
Seeber, A., Hauer, M. H., and Gasser, S. M. (2018). Chromosome dynamics in response to DNA damage. Annu. Rev. Genet. 52, 295–319. doi: 10.1146/annurev-genet-120417-031334
Sequeira-Mendes, J., Araguez, I., Peiro, R., Mendez-Giraldez, R., Zhang, X., Jacobsen, S. E., et al. (2014). The functional topography of the arabidopsis genome is organized in a reduced number of linear motifs of chromatin states. Plant Cell 26, 2351–2366. doi: 10.1105/tpc.114.124578
Shaban, H. A., and Seeber, A. (2020). Monitoring global chromatin dynamics in response to DNA damage. Mutat. Res. 821:111707. doi: 10.1016/j.mrfmmm.2020.111707
Watanabe, K., Pecinka, A., Meister, A., Schubert, I., and Lam, E. (2005). DNA hypomethylation reduces homologous pairing of inserted tandem repeat arrays in somatic nuclei of Arabidopsis thaliana. Plant J. 44, 531–540. doi: 10.1111/j.1365-313X.2005.02546.x
Wolter, F., Klemm, J., and Puchta, H. (2018). Efficient in planta gene targeting in Arabidopsis using egg cell-specific expression of the Cas9 nuclease of Staphylococcus aureus. Plant J. 94, 735–746. doi: 10.1111/tpj.13893
Keywords: chromatin, nuclear organization, real-time imaging, microscopy, single-locus analysis, chromatin mobility
Citation: Meschichi A, Ingouff M, Picart C, Mirouze M, Desset S, Gallardo F, Bystricky K, Picault N, Rosa S and Pontvianne F (2021) ANCHOR: A Technical Approach to Monitor Single-Copy Locus Localization in Planta. Front. Plant Sci. 12:677849. doi: 10.3389/fpls.2021.677849
Received: 08 March 2021; Accepted: 09 June 2021;
Published: 06 July 2021.
Edited by:
Jean Molinier, UPR2357 Institut de biologie moléculaire des plantes (IBMP), FranceReviewed by:
Ales Pecinka, Max Planck Institute for Plant Breeding Research, GermanyFredy Barneche, INSERM U1024 Institut de biologie de l'Ecole Normale Supérieure, France
Copyright © 2021 Meschichi, Ingouff, Picart, Mirouze, Desset, Gallardo, Bystricky, Picault, Rosa and Pontvianne. This is an open-access article distributed under the terms of the Creative Commons Attribution License (CC BY). The use, distribution or reproduction in other forums is permitted, provided the original author(s) and the copyright owner(s) are credited and that the original publication in this journal is cited, in accordance with accepted academic practice. No use, distribution or reproduction is permitted which does not comply with these terms.
*Correspondence: Frédéric Pontvianne, ZnJlZGVyaWMucG9udHZpYW5uZUB1bml2LXBlcnAuZnI=
†These authors have contributed equally to this work