 Yuyang Lian1,2†
 Aqiang Wang1,2†Sihua Peng1†Jingjing Jia3†Xiaofeng Yang1†Jinlei Li2Shuyan Yang1Rongjiao Zheng2
 Shihao Zhou1,2*
- 1Sanya Nanfan Research Institute of Hainan University, Sanya, Hainan, China
- 2Key Laboratory of Germplasm Resources Biology of Tropical Special Ornamental Plants of Hainan Province, College of Forestry, Hainan University, Haikou, Hainan, China
- 3Institute of Plant Protection, Hainan Academy of Agricultural Sciences (Research Center of Quality Safety and Standards for Agricultural Products of Hainan Academy of Agricultural Sciences), Haikou, Hainan, China
Climate change affects the population distribution of pests and their natural enemies, and predicting these effects is necessary for pest monitoring and green control. Lipaphis erysimi is an important vegetable pest, and its natural enemy, the Eupeodes corollae Fabricius has a strong predatory effect on the L. erysimi. To assess the spread trends of L. erysimi and its natural enemy, the hoverfly, E. corollae under current (1970-2000) and future climates (2041-2060), based on the MaxEnt model, this paper uses data on the geographical distribution of the historical occurrence of L. erysimi and E. corollae to speculate on their potential distribution areas worldwide and analyze the key environmental factors affecting the survival and spread of both. The results showed that the Representative Concentration Pathway (RCP) 2.6 and RCP4.5 climatic conditions are favorable for the spread of L. erysimi, the RCP8.5 climatic conditions are unfavorable for the spread of L. erysimi, and all three future climatic conditions are unfavorable for the spread of E. corollae. The highest fitness of L. erysimi was found at the annual average temperature of 18 °C and the annual average precipitation of 900 mm, while the highest fitness of E. corollae was found at the annual average temperature of 10 °C and the lowest temperature in the coldest month of 0 °C. This study can provide a reference basis for monitoring and early warning and biological control of L. erysimi.
Introduction
Lipaphis erysimi (Kaltenbach) (Homoptera: Aphididae) mainly harms cruciferous crops such as radish, rape, and cabbage, and is particularly harmful to Brassica crops such as mustard and rape (Rana, 2005). It was first discovered in the United States by Davis (1914) and is now widely distributed worldwide. L. erysimi are reproduce quickly and usually cluster in groups on the young stems and abaxial surface of leaves to feed on sap, seriously affecting the growth and development of vegetables, the secreted honeydew can cause sooty blotch, prevent the leaves from photosynthesis. In addition, L. erysimi can act as a mediating insect to transmit a variety of plant viruses, resulting in slow growth, yellowing and wilting of leaves, and even death of the entire plant (Koramutla et al., 2016). Rape is one of the major oil crops in the world, and the L. erysimi’s damage has caused huge losses to the economy (Chattopadhyay et al., 2005). The larvae of Eupeodes corollae Fabricius (Diptera: Syrphidae) are an important predatory natural enemy of L. erysimi (He et al., 1990), they feed heavily and are the dominant species in many locations, making them ideal for control of the L. erysimi (Pekas et al., 2020).
Global warming has become one of the main features of today’s climate change, and the Earth’s climate is expected to become hotter and more humid in the coming century than it is today (Barreca, 2012). Insects are sensitive to environmental changes because of their small size, thin body walls, rapid heat exchange with the environment, and poor ability to self-regulate body temperature (Yamamura et al., 2006). Temperature and humidity are important factors affecting the growth, development, survival, and reproduction of individual insects and populations, and adaptation to temperature and humidity is a key condition necessary for insects to carry out their life activities (Khaliq et al., 2014). The maximum and minimum temperatures of 27.37°C and 14.62°C, maximum and minimum relative humidity of 95.28% and 62.28%, respectively, were detected at the peak of L. erysimi occurrence, and the population density of L. erysimi decreased with the increase of humidity (Reza et al., 2004). The developmental starting temperatures for eggs, the first instar larvae, the second instar larvae, the third instar larvae, and pupae of the E. corollae are 9.69°C, 12.39°C, 6.97°C, 2.03°C, and 2.35°C, respectively, and temperatures above 30°C result in mass mortality of larvae and failure of pupae to fledge (Dong et al., 2004). The fledge rate can reach 90% when the soil humidity is 75%-90%, and lower than 60% will remarkably reduce the fledge rate (Li et al., 1996). Temperature and humidity are crucial to the population dynamics of L. erysimi and E. corolla. Therefore, we selected E. corolla as predatory natural enemies of L. erysimi to study the changes of their potential distribution area in different climatic conditions.
Ecological niche models are based on ecological niche theory, which analyzes known species distribution data and their associated environmental variables to predict the potential distribution of species (Sillero, 2011; Yackulic et al., 2013). The maximum entropy (MaxEnt) ecological niche model is a machine learning modeling approach based on the maximum entropy principle that uses only data related to environmental variables and habitat suitability to simulate species ecological niche, and estimates the distribution of potential fitness zones of specie’s by determining the maximum entropy distribution constrained by environmental variables (Elith et al., 2011; Warren and Seifert, 2011), the output of which is a distribution map reflecting different fitness levels of species (Zhao et al., 2022b). MaxEnt’s principle-based algorithm can obtain the most uniform potential distribution of species and can provide highly accurate predictions compared to other prediction models, even when species distribution data are small or incomplete. In addition, the output of the MaxEnt model combined with GIS can describe the weight of each environmental factor affecting the expected distribution of species, so that the dominant environmental parameters affecting species distribution can be obtained (Phillips et al., 2006; Pearson et al., 2007; Liu et al., 2018). Dong et al. (2022) used the MaxEnt model to predict the change of potential suitable areas of Bactrocera dorsalis (Hendel). The results showed that the suitable areas for B. dorsalis will increase, and the range will likely expand northward from existing locations in the future. Using MaxEnt to predict the distribution of Bactrocera correcta, it was concluded that its potential suitable areas include India and neighboring countries in Asia, pacific islands, and North Australia, Central and South America, central Africa. Water vapor pressure and solar radiation were the most influential variables for B. correcta, the rising temperature could lead increasing of suitable area slightly (Zhang et al., 2022b). How will the potential global distribution areas of L. erysimi and E. corollae change under future climates? What are the key environmental factors for the survival and dispersal of both? Is it possible to introduce the E. corollae for biological control in areas with serious L. erysimi damage? These questions are not yet clear. Therefore, we used the MaxEnt model and Arc GIS to construct an ecological niche model to analyze the potential distribution areas of L. erysimi and its natural enemy, E. corollae under current (1970-2000) and future climates (2041-2060) in our study to clarify the weights of different environmental variables on the ecological distribution of both, and to determine the key environmental parameters for the survival and dispersal of both. This study will provide theoretical and data support for the monitoring and early warning of L. erysimi and its biological control.
Materials and methods
Collection and screening of geographic distribution data
A total of 707 L. erysimi and 26173 E. corollae geographic coordinates of historical occurrence were obtained by visiting the GBIF (https://www.gbif.org/) (Beck et al., 2014) and CABI (https://www.cabi.org/) (Pasiecznik et al., 2005) websites. To avoid overfitting, we created a 2 km × 2 km raster, took only one coordinate point data in each raster, and removed duplicate points and coordinate points on the sea surface (Welch and Harwood, 2014). Finally, we filtered 570 L. erysimi and 9775 E. corollae coordinates data and saved them in “.CSV” format.
Climate data acquisition and screening
The current 19 environmental variables data (Table 1) used in this study were obtained from the WorldClim (https://www.worldclim.org) (Fick and Hijmans, 2017) database, which was released in January 2020 and spans the period 1970-2000 with a precision of 2.5 arc-minutes. Using the knife cut method in MaxEnt 3.4.4 (Phillips and Dudík, 2008) software to rank the contribution of environmental factors, and then using SPSS 26.0 to analyze the correlation between environmental factors, when the absolute value of the correlation between two ecological factors was greater than or equal to 0.8, only one representative environmental factor will be kept (Li et al., 2022), meanwhile, the heat map for correlation analysis of environmental factors in L. erysimi (Figure 1) and E. corollae (Figure 2) was constructed. Finally, we removed the nine environmental variables factors for the L. erysimi (Bioclimatic (Bio) 6, Bio7, Bio9, Bio10, Bio11, Bio13, Bio14, Bio16) and the nine environmental variables for the E. corollae (Bio4, Bio7, Bio9, Bio10, Bio11, Bio12, Bio13, Bio17), and obtained 11 L. erysimi (Bio1, Bio2, Bio3, Bio4, Bio5, Bio8, Bio12, Bio15, Bio17, Bio18, Bio19) and 11 environmental variable factors of E. corollae (Bio1, Bio2, Bio3, Bio5, Bio6, Bio8, Bio14, Bio15, Bio16, Bio18, Bio19).
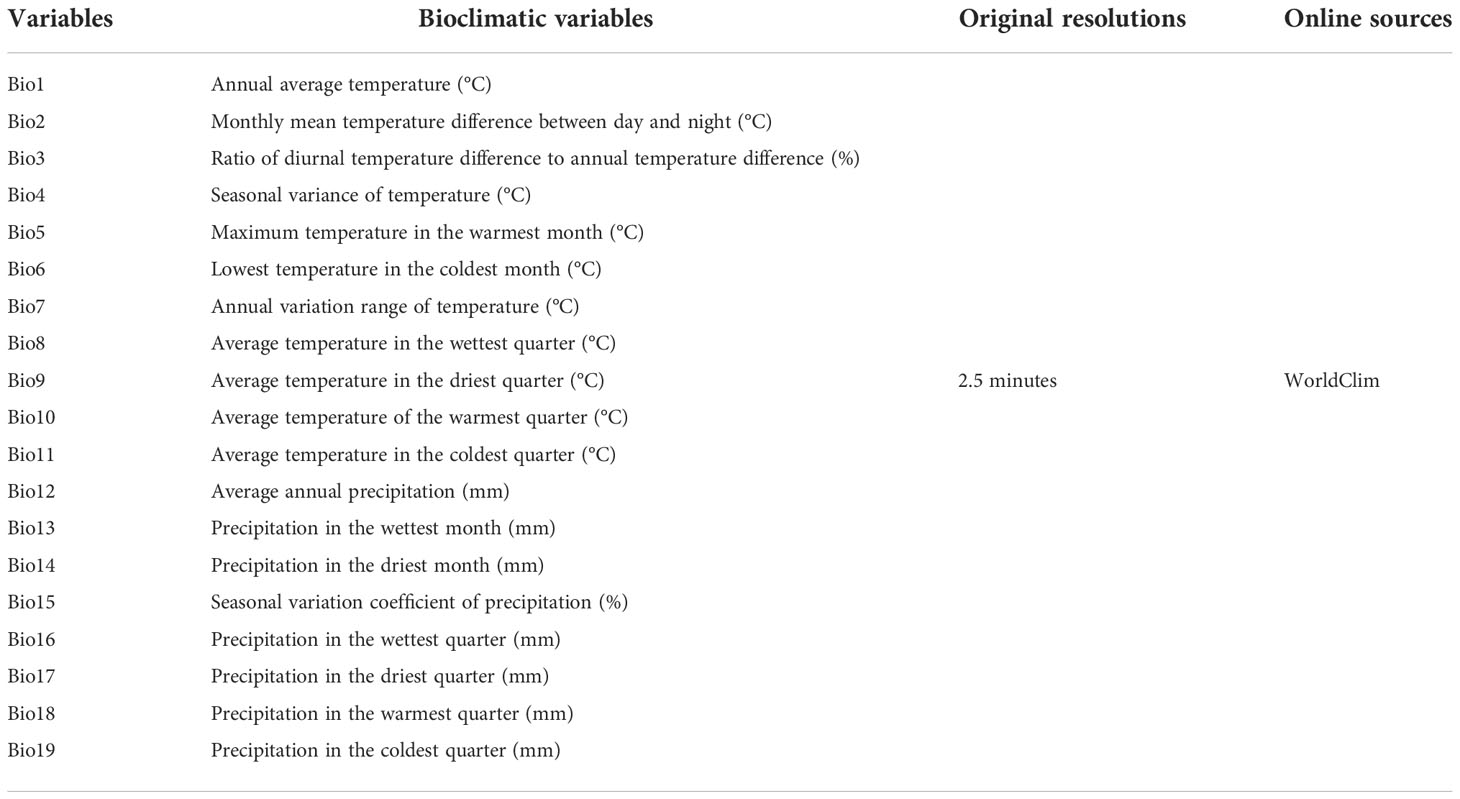
Table 1 Climate and environment variables.
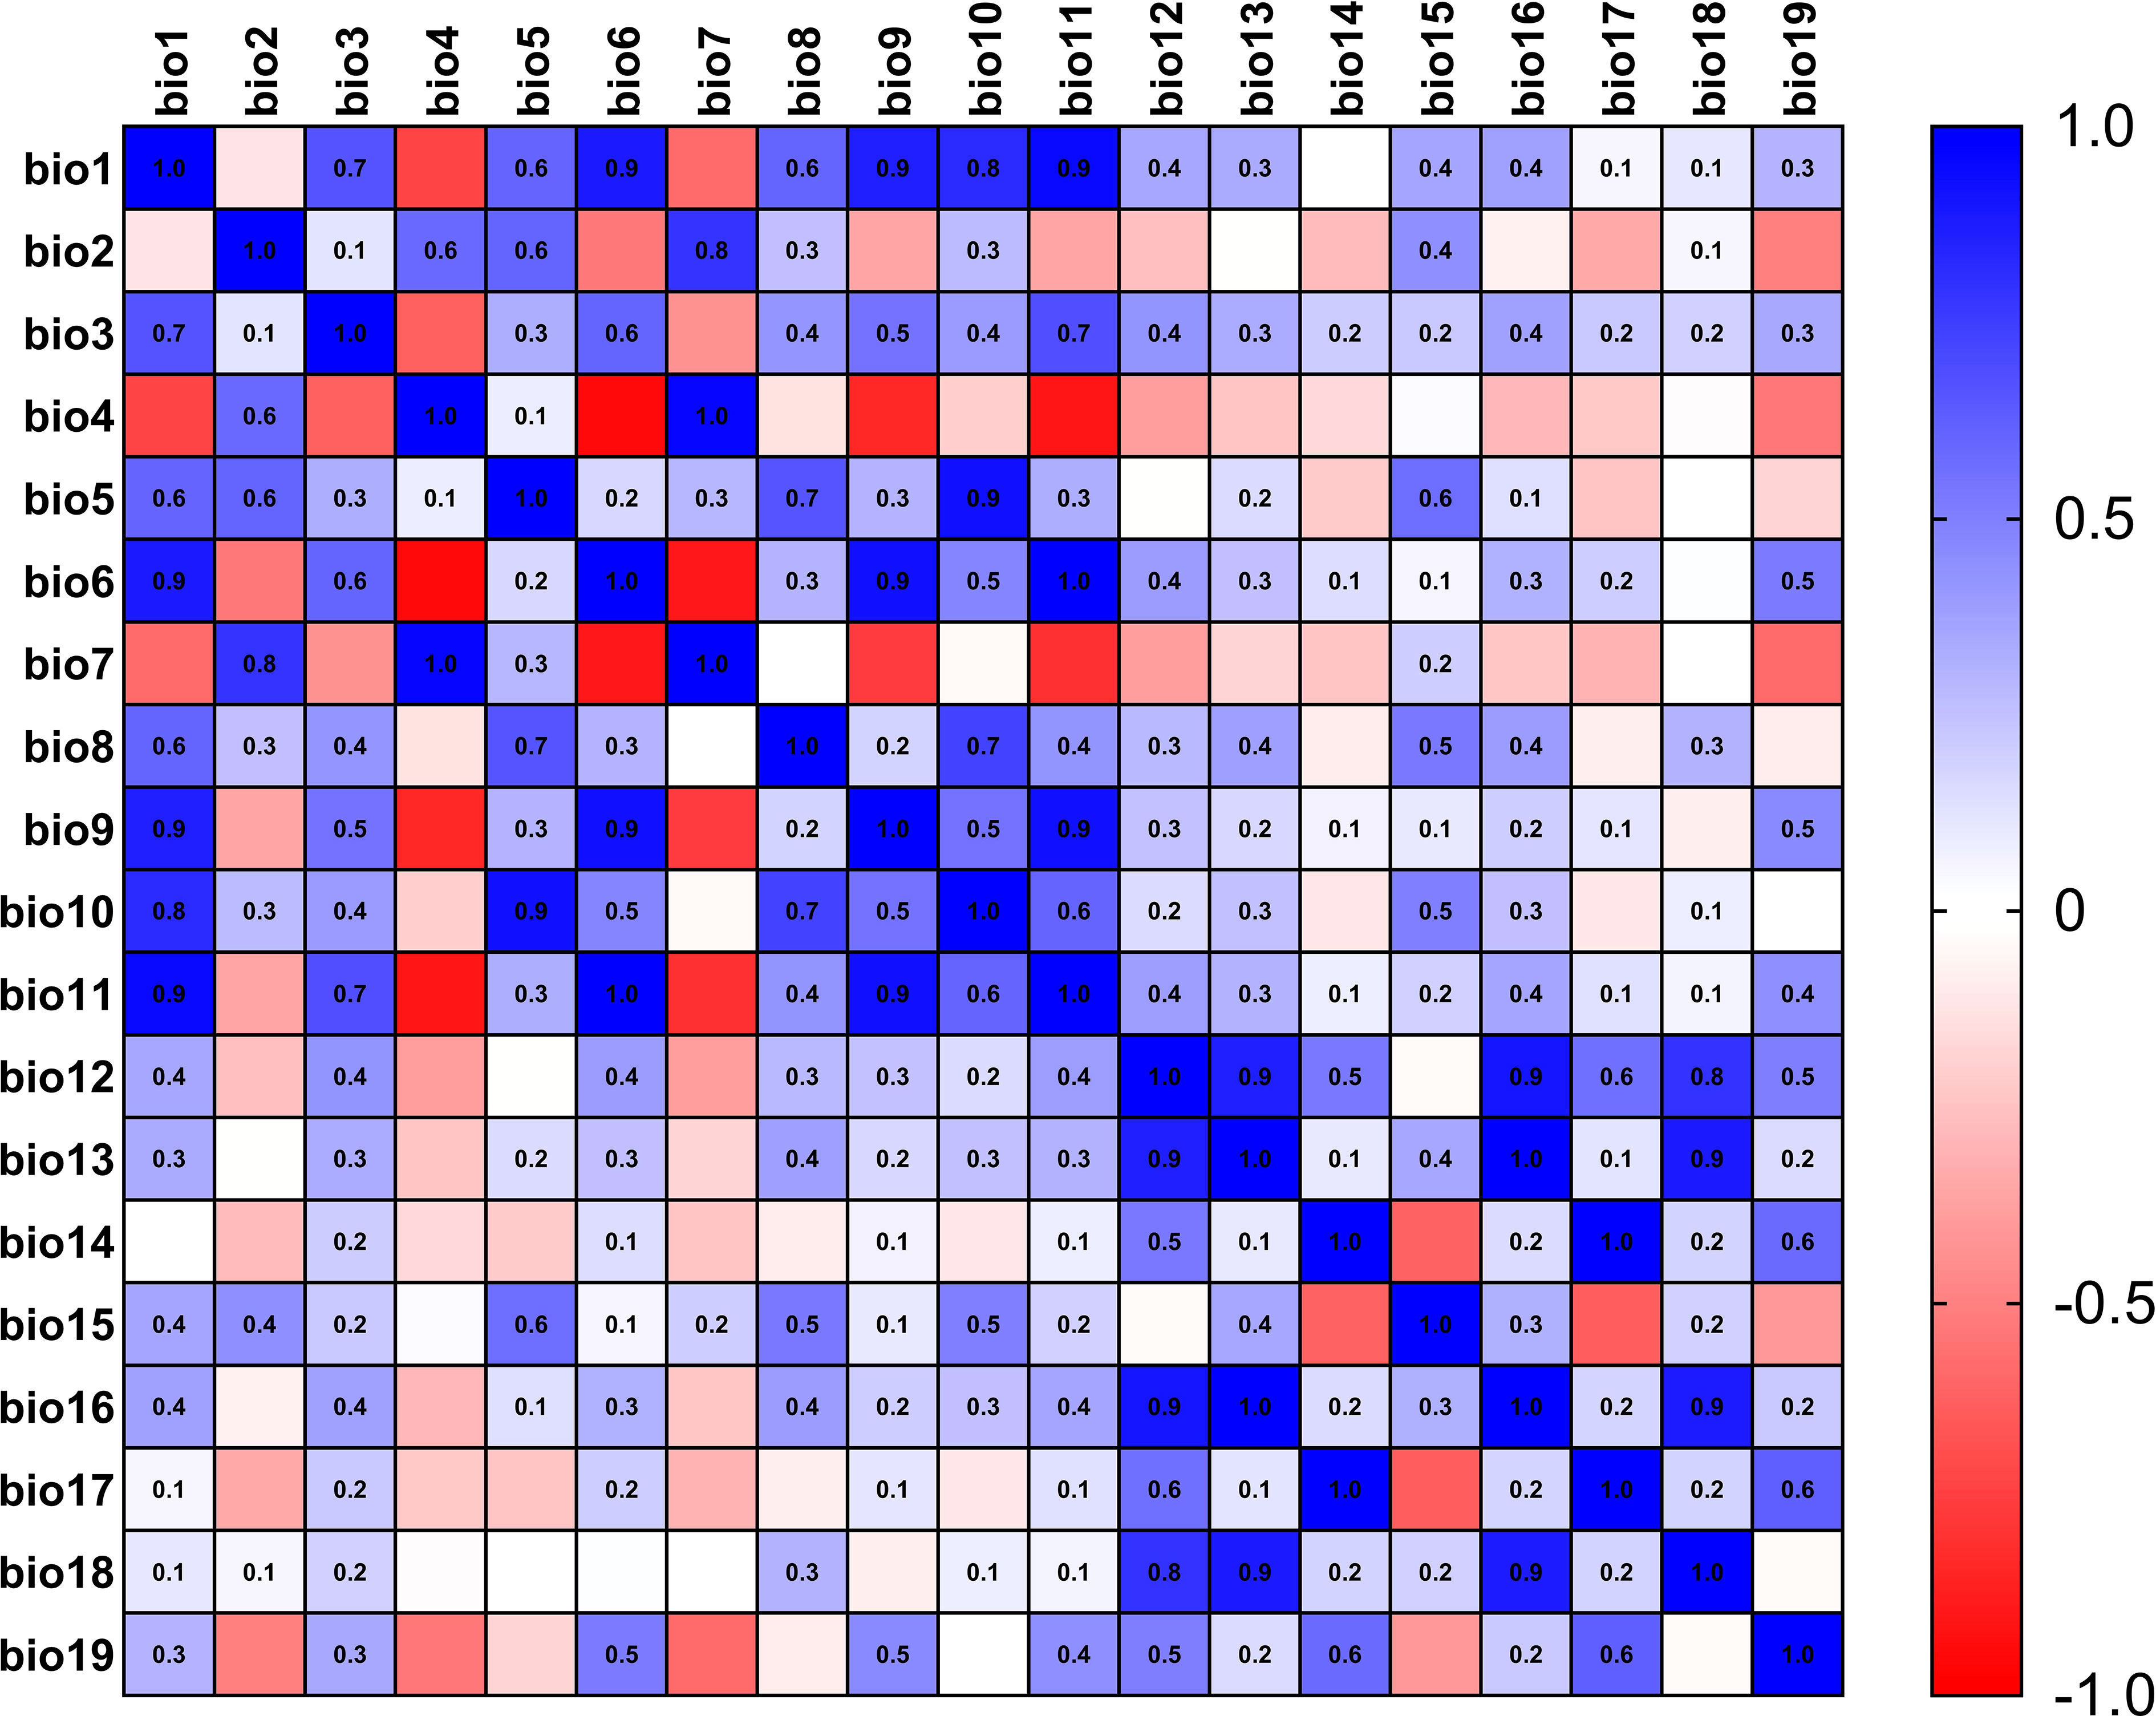
Figure 1 Heat map for correlation analysis of environmental factors in L. erysimi.
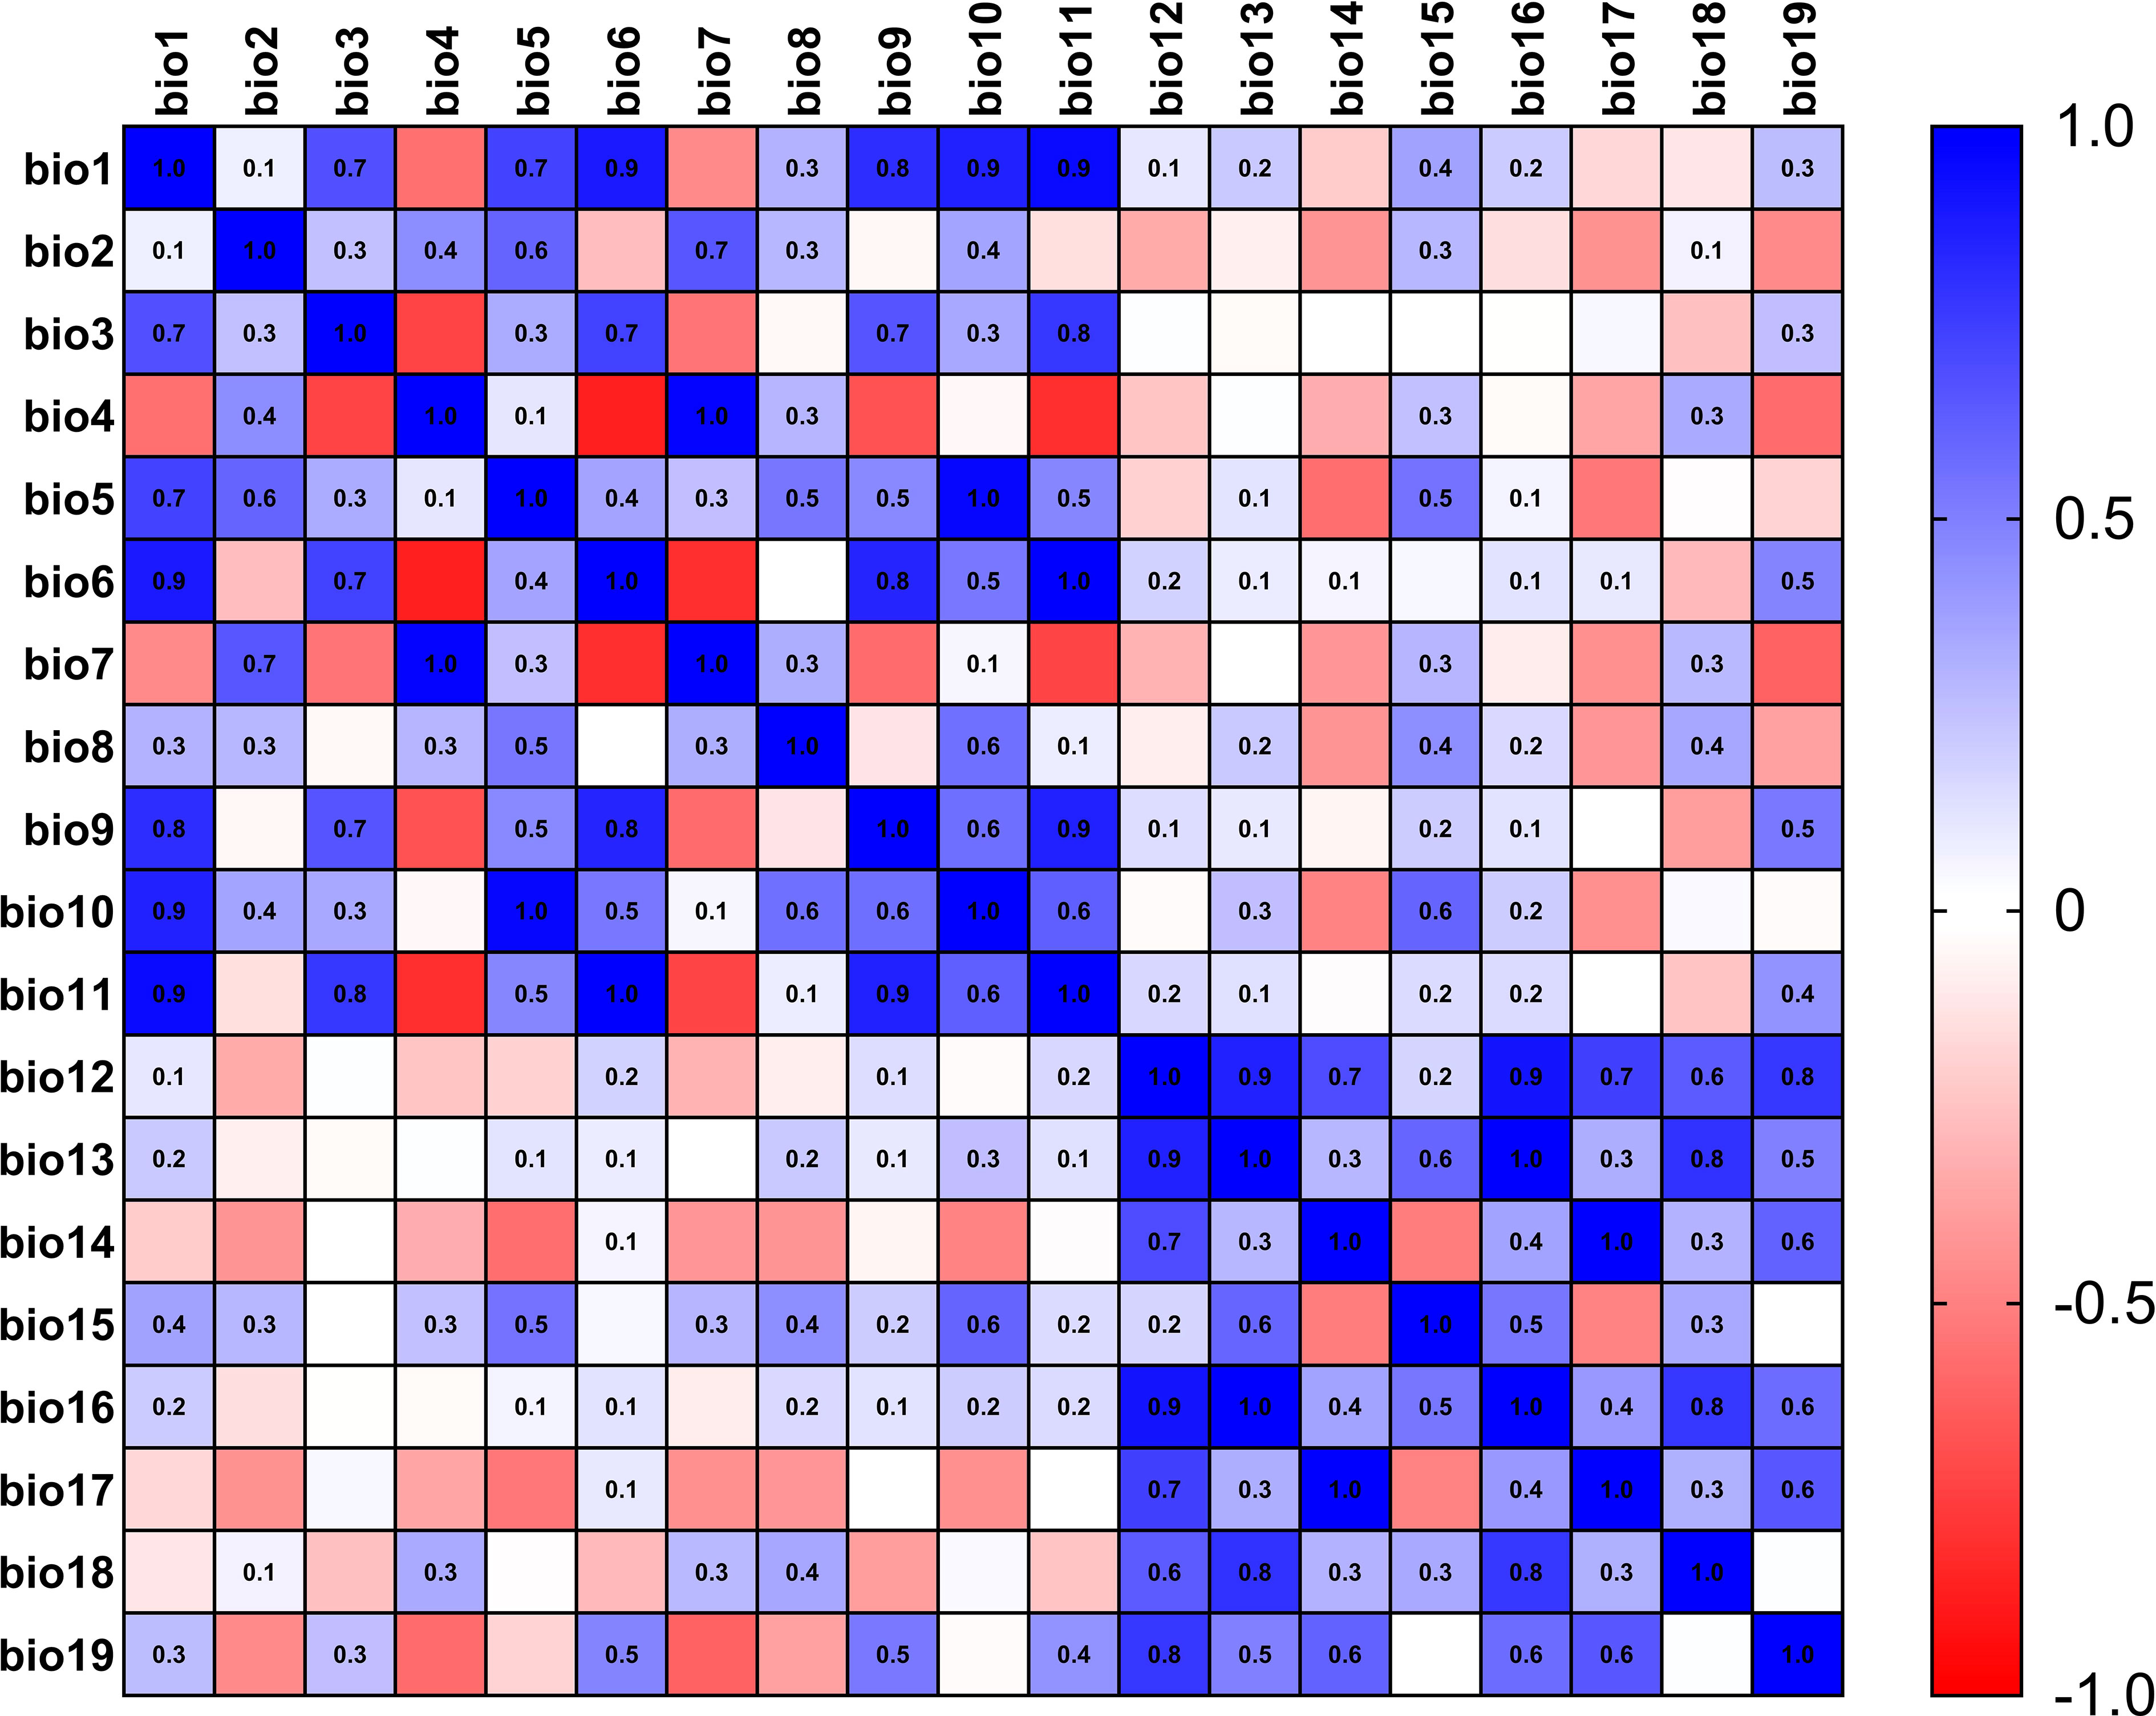
Figure 2 Heat map for correlation analysis of environmental factors in E. corollae.
In this study, environmental date from three GHG emission scenarios, Representative Concentration Pathway (RCP) 2.6, RCP4.5 and RCP8.5, were selected to project the future climate suitability areas for the L. erysimi and E. corollae under future climate conditions. Three future scenarios were obtained from the WorldClim. These bioclimatic variables ran in the model were selected from Coupled Model Intercomparison Project Phase 6 (CMIP6), and their accuracy was 2.5 arc-minutes. RCP 2.6 reveals carbon dioxide emissions could peak globally in 2020 and start to decline in 2080. It also shows that the atmospheric concentration would peak in the middle of the century, followed by a steady decline. In the RCP 4.5, emissions will peak in the middle of the century and then rapidly decline over the next 30 years. The emissions will stabilize to be half of what the levels were in the year 2000. Carbon dioxide concentration will continue to increase according to current trends, but will stabilize and the rate of increased emissions will not be as rapid as previously expected. Serving as the antithesis of RCP 2.6, RCP 8.5 serves as the worst case scenario for the future of emissions. In this RCP, emissions continue to drastically increase throughout the century – predominantly during early and middle parts of the current century. By 2100, the emissions will have stabilized, but will rest at 30 gigatonnes of carbon as opposed to the eight gigatonnes in 2000 (Van Vuuren et al., 2011).
Model construction and evaluation
First, we imported the filtered bioclimatic variable data (1970-2000) for the current GHG emission scenario into the MaxEnt model, and then imported the geographic distribution data of L. erysimi and E. corollae into the model separately, and randomly selected 75% of the data as the training set for the experiment, and the remaining 25% of the coordinate data as the test set, with a number of iterations of 10. MaxEnt software settings are as follows: check “Create response curves” and “Do jackknife to measure variable importance”; “out format” option select “Logistic”, check “Random seed”; set “Random test percentage” to 25, check “Write plot data”, the rest keep the default settings. The raster files were reclassified using the Spatial Analyst option of the Arc toolbox in ArcMap 10.8 software, and the distribution areas were set to four gradients (Welch and Harwood, 2014): Unsuitable area (0-0.2), Low suitable area (0.2-0.4), Moderately suitable area (0.4-0.6), and Highly suitable area (0.6-1).
In this study, the area under the receiver operating characteristic curve (AUC) (Fielding and Bell, 1997) was used as a measure of model prediction accuracy and the interval ranges from 0.5 to 1. 0.5 corresponds to a completely random prediction, in the range of 0.5-0.7 indicates poor accuracy of the prediction results, in the range of 0.7-0.9 indicates moderate accuracy of the prediction results, and when the prediction results are greater than 0.9, it indicates very high accuracy of the prediction results (Barry and Elith, 2006).
3 Results
Model performance evaluation
The MaxEnt model was constructed using the geographic distribution data of L. erysimi and E. corolla and the screened environmental variable data, and the performance of the MaxEnt model was evaluated using the mean values of AUCs obtained after 10 iterations of the model. The mean values of all AUCs were calculated to be greater than or equal to 0.8 (Table 2), which indicated that the model had a good performance and could predict the potential distribution areas of L. erysimi and E. corolla more accurately.
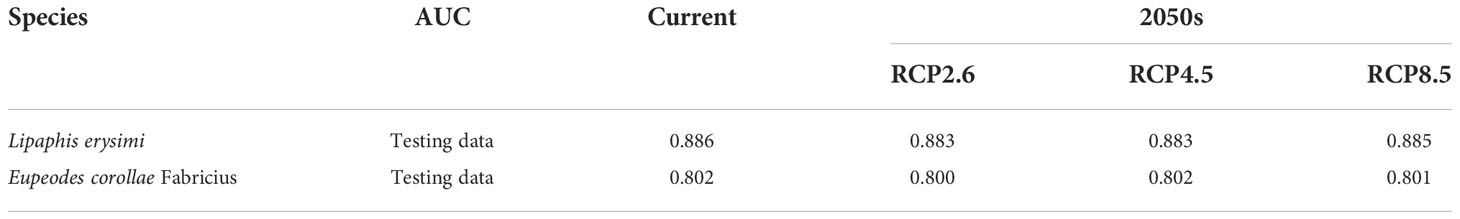
Table 2 Area under the receiver operating characteristic curve.
Potential distribution area changes of L. erysimi under current and future climate conditions
The potential distribution areas of L. erysimi under current and future climatic conditions are shown in Figure 3 and Table 3. Under current climatic conditions, the highly suitable area of L. erysimi is mainly distributed in western Europe, China Taiwan, southern coastal areas of China, eastern United States, northern Myanmar, and northern India, covering 1.67 × 10⁵ km2 or 1.15% of the total area; The moderately suitable area is mainly distributed in southwestern Europe, eastern and southern China, eastern United States, southeastern South America, and northern India, with an area of 7.48 × 10⁵ km2, accounting for 5.15% of the total area; The low suitable area is widely distributed in Europe, America, Africa, Asia, and Australia, accounting for 14.25% of the total area. Under the RCP2.6, the area of highly suitable area of L. erysimi increased, the area of moderate and low suitable area decreased, and the total suitable area decreased by 7.58 × 10⁴ km2. Under both the RCP4.5 and RCP8.5, the area of high and low suitable area of L. erysimi decreased, while the area of moderately suitable area increased, and the total suitable area increased by 9.10 × 10³ km2 under the RCP4.5 and decreased by 2.22 × 10⁴ km2 under the RCP8.5. This indicates that the expansion of L. erysimi will be inhibited under the RCP8.5, while the expansion of L. erysimi will be promoted under the RCP2.6 and RCP4.5.
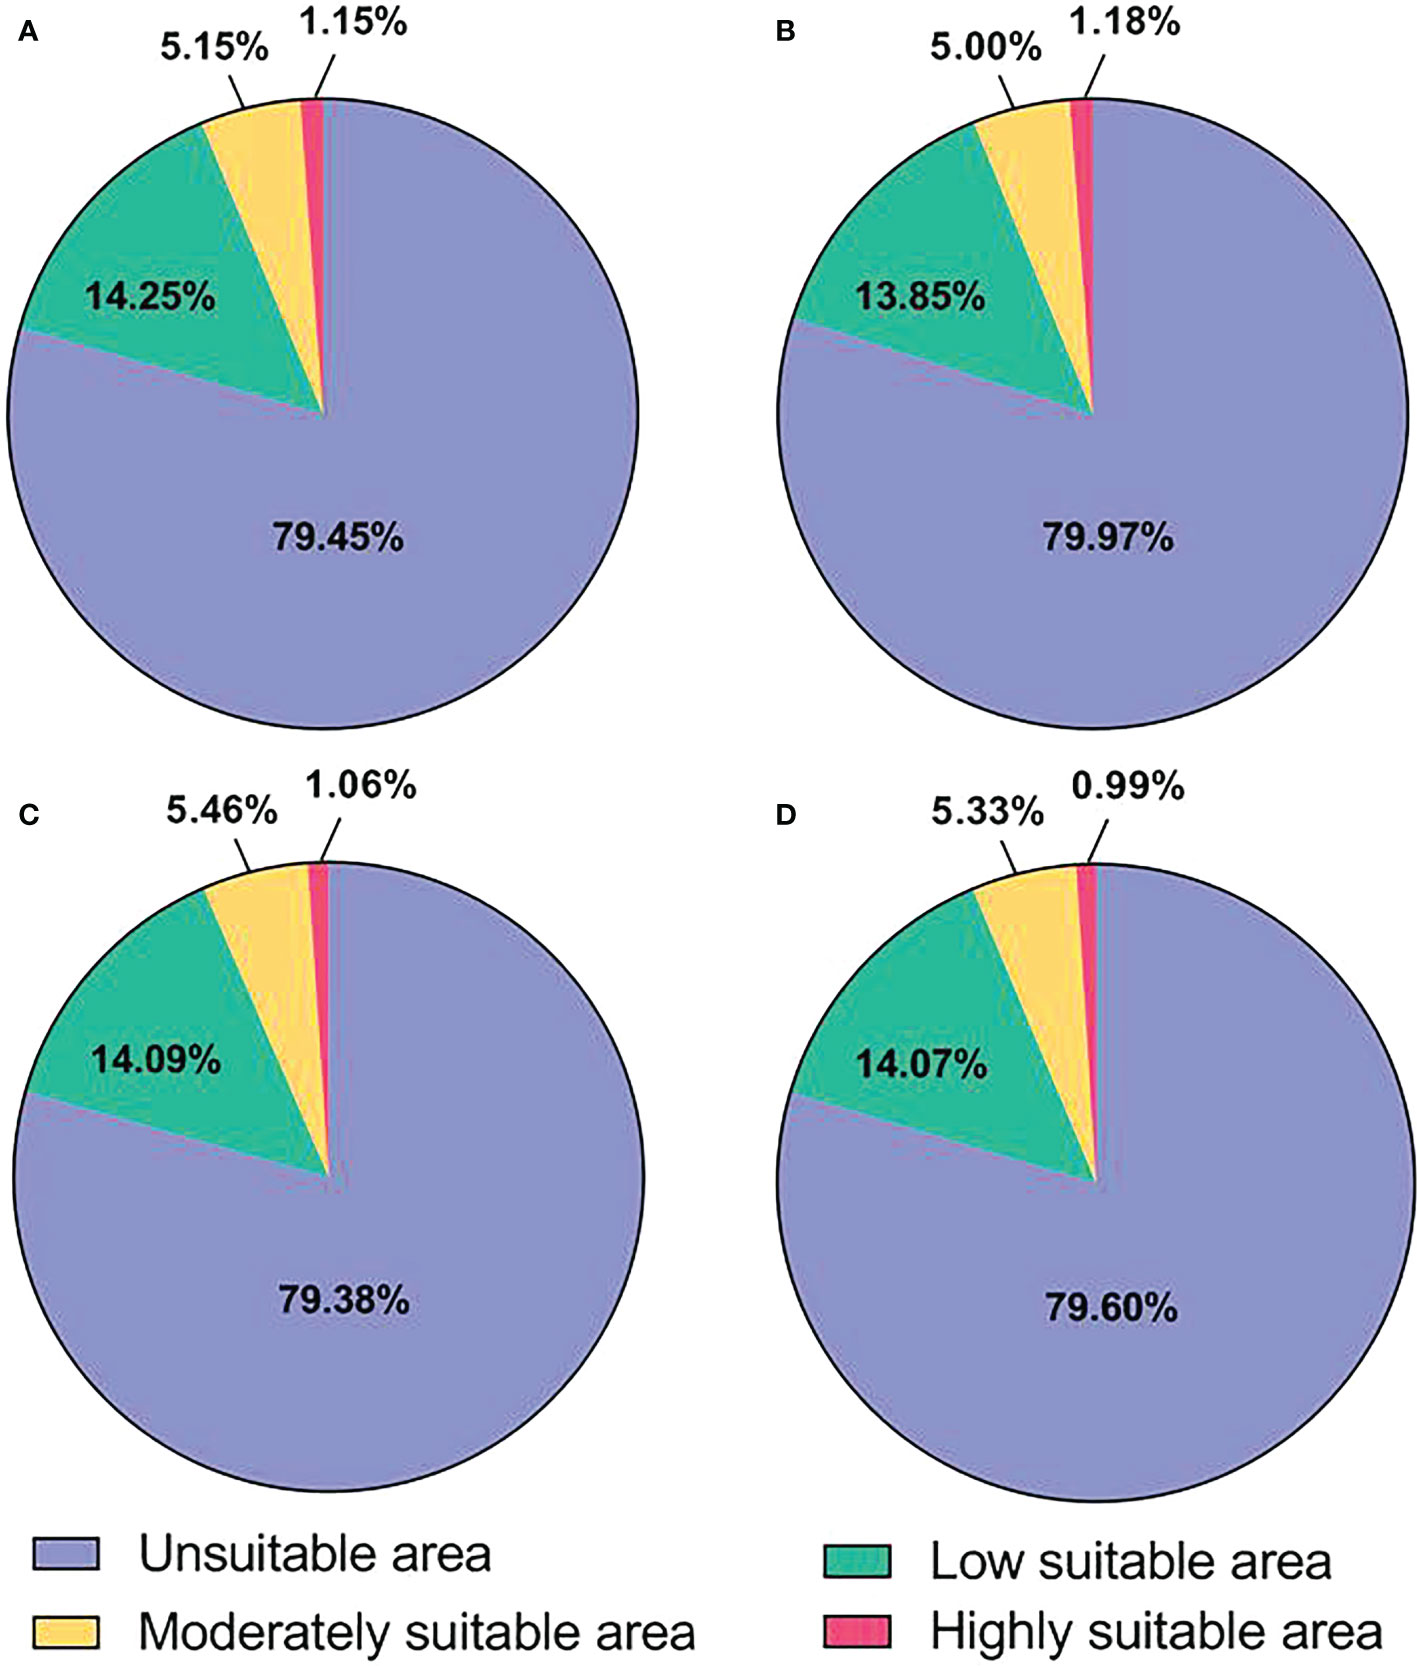
Figure 3 Proportion of suitable area for L. erysimi. (A), Current climatic conditions. (B), RCP2.6 climatic conditions. (C), RCP4.5 climatic conditions. (D), RCP8.5 climatic conditions.
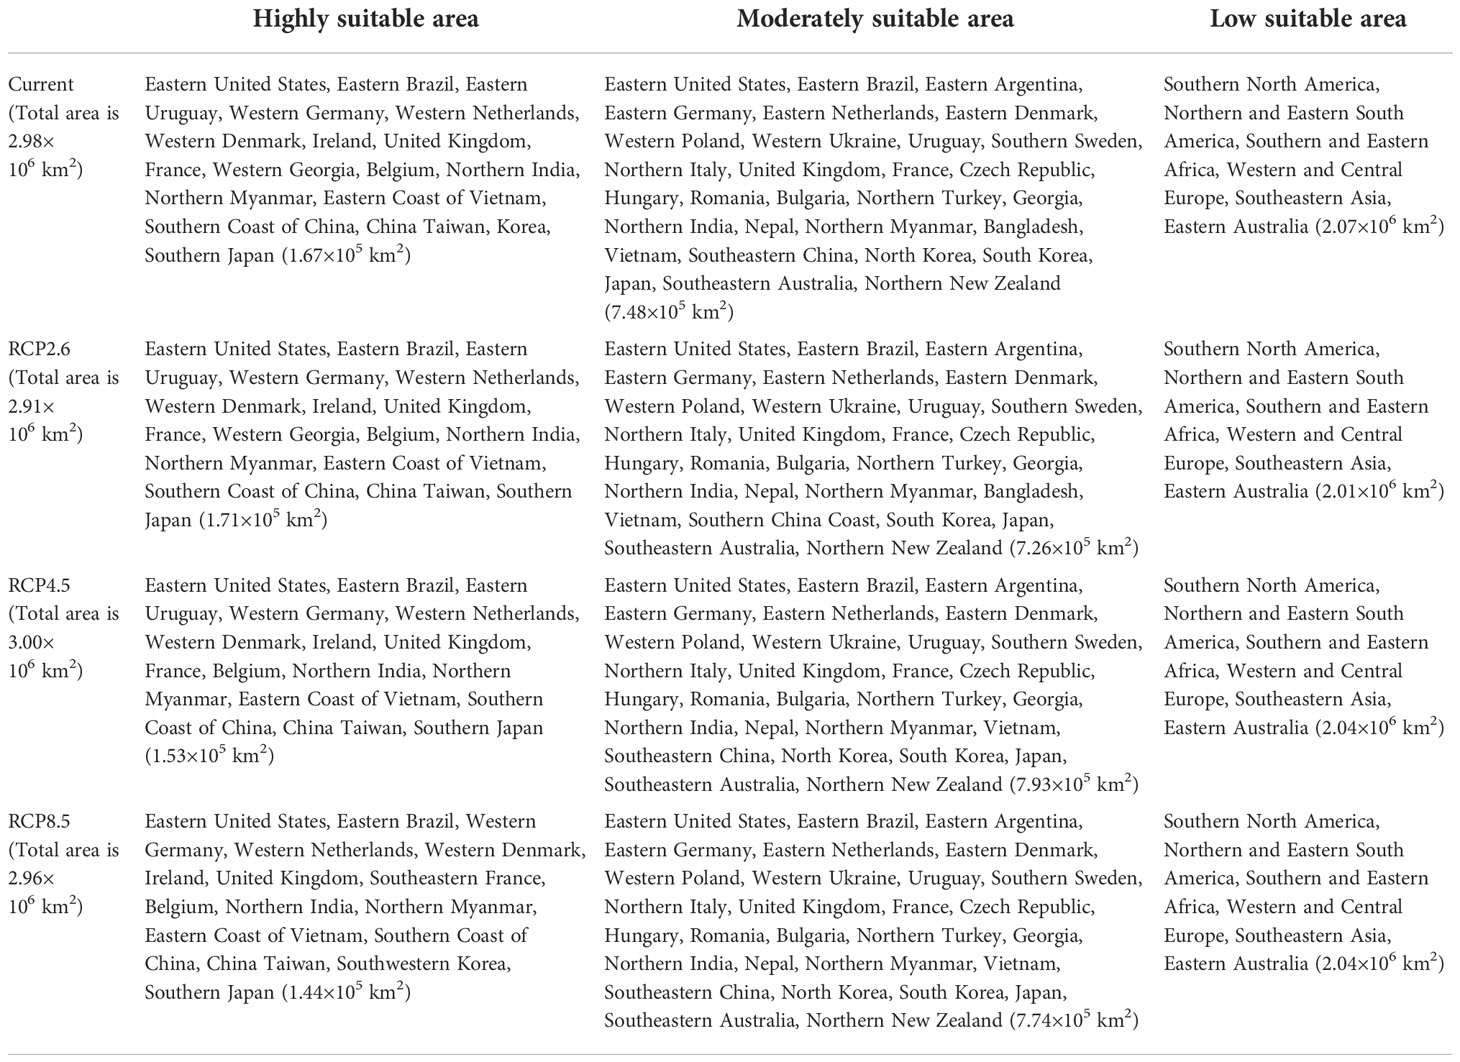
Table 3 The regions and area of suitable area for L. erysimi.
Changes in the potential distribution area of E. corollae under current and future climatic conditions
The potential distribution areas of E. corollae under current and future climatic conditions are shown in Figure 4 and Table 4. Under current climatic conditions, the highly suitable area of E. corollae is mainly distributed in China Taiwan, northern India, and northern Myanmar, with an area of 3.69×10³ km2, accounting for 0.03% of the total area; The moderately suitable area is mainly distributed in central Europe and eastern Asia, with scattered distribution in coastal areas of America, with an area of 7.85×10⁵ km2, accounting for 5.41% of the total area; The low suitable area is distributed in northeastern Europe, western North America, southern South America, southeastern China, eastern United States, and southern Australia, with an area of 9.80×10⁵ km2, accounting for 6.75% of the total area. Under all three future climatic conditions, the area of the highly suitable area of E. corollae was significantly reduced (by more than 65%) compared with the current climatic conditions, and the total suitable area was reduced by 1.29×10⁴ km2, 1.78×10⁴ km2 and 1.25×10⁴ km2, indicating that all three future climatic conditions were unfavorable for the expansion of E. corollae.
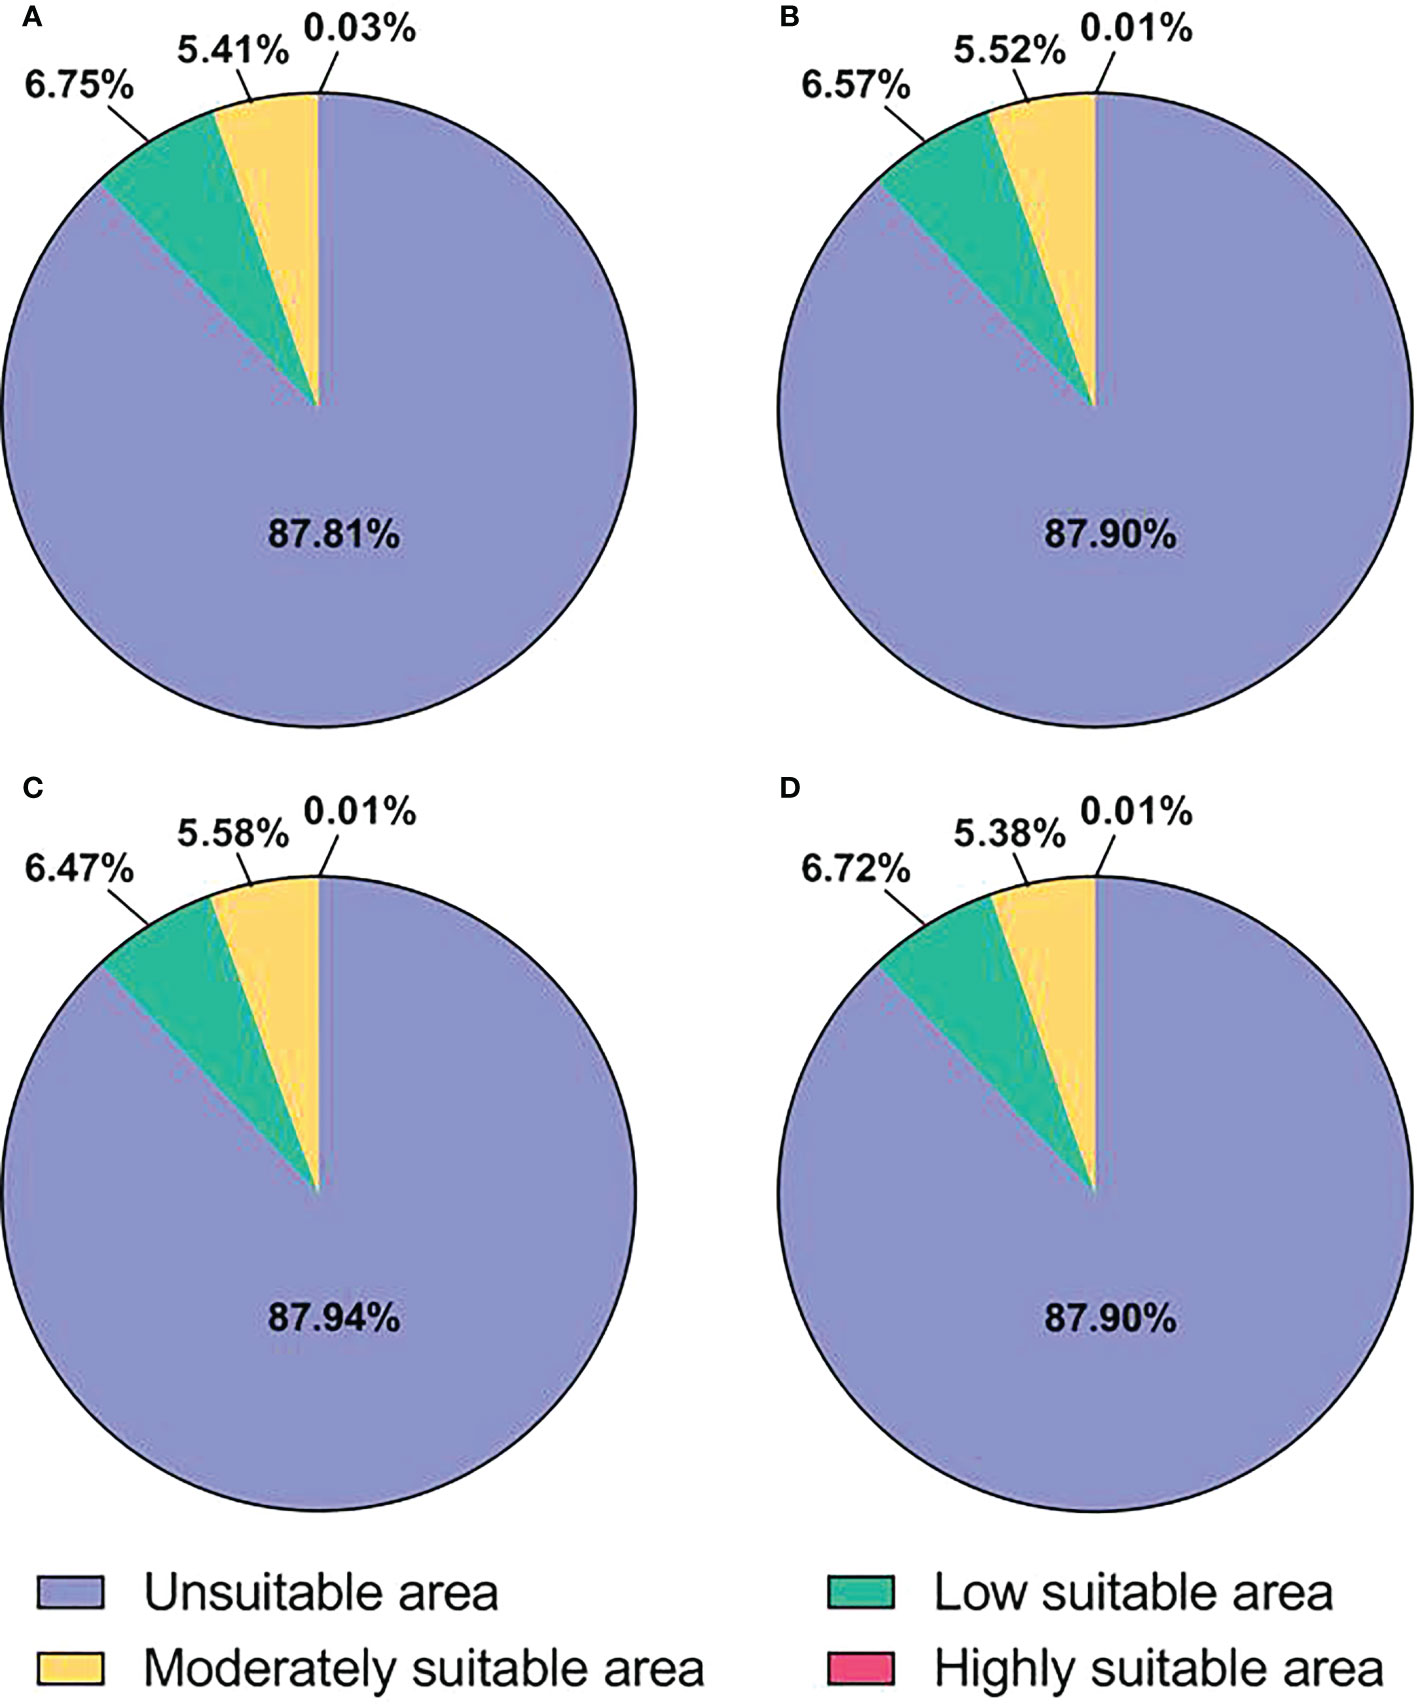
Figure 4 Proportion of suitable area for E. corollae. (A), Current climatic conditions. (B), RCP2.6 climatic conditions. (C), RCP4.5 climatic conditions. (D), RCP8.5 climatic conditions.
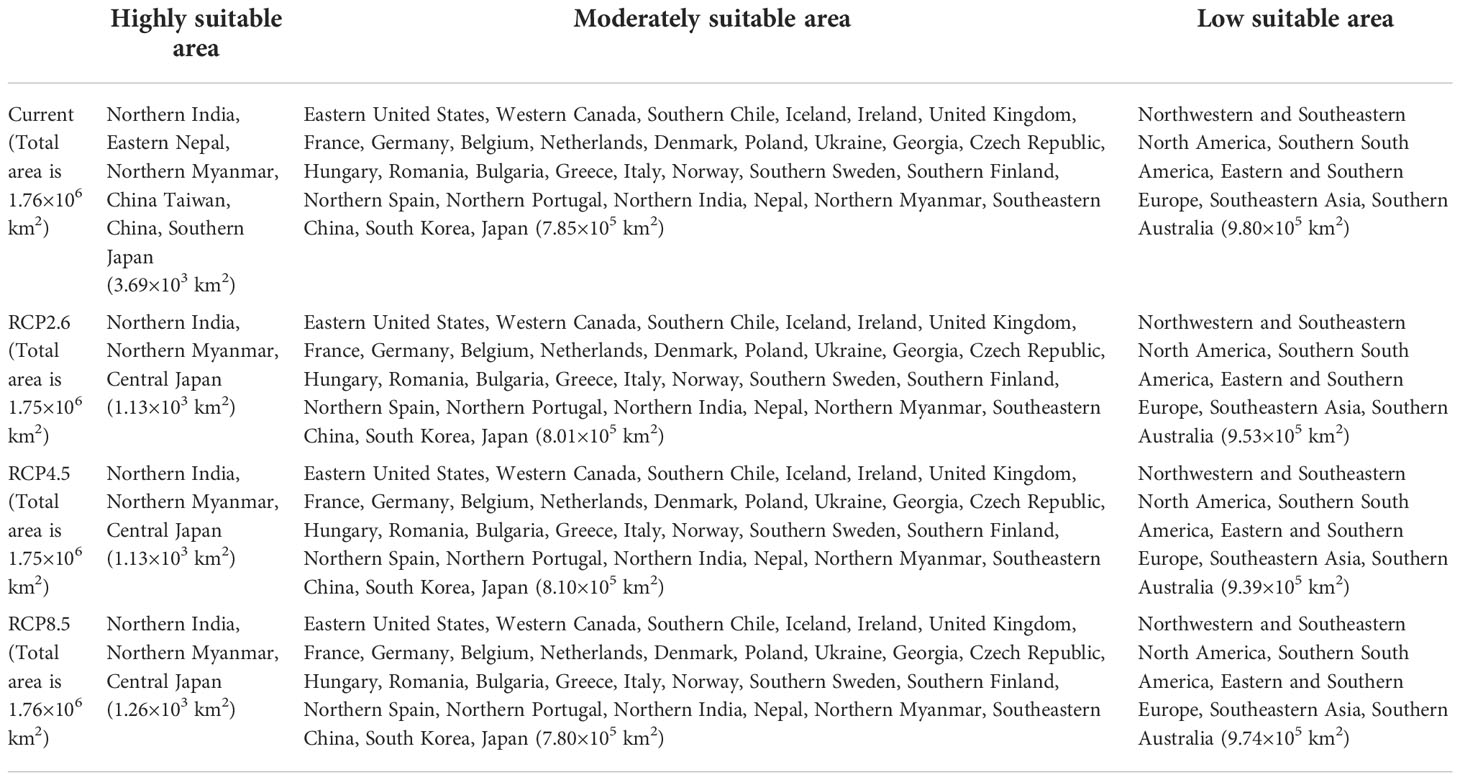
Table 4 The regions and area of suitable area for E. corollae.
Influence of environmental variables on the distribution of L. erysimi and E. corollae
The knife-cut test can show the magnitude of the contribution of environmental variables to the gain in the distribution of L. erysimi and E. corollae, and the correlation analysis of environmental variables using the knife-cut method yielded the results of the effect of environmental variables on the distribution of L. erysimi (Figure 5) and E. corollae (Figure 6). In L. erysimi, the model gains of Bio1 (Annual average temperature) and Bio12 (Annual average precipitation) were 0.8 and 0.68, respectively, with high regularization gains, which contributed more to the distribution gain of L. erysimi. In E. corollae, Bio1 (Annual average temperature) and Bio6 (Lowest temperature in the coldest month) had the highest model gains of 0.59 and 0.56, respectively, indicating that these two variables had the greatest influence on the distribution of E. corolla.
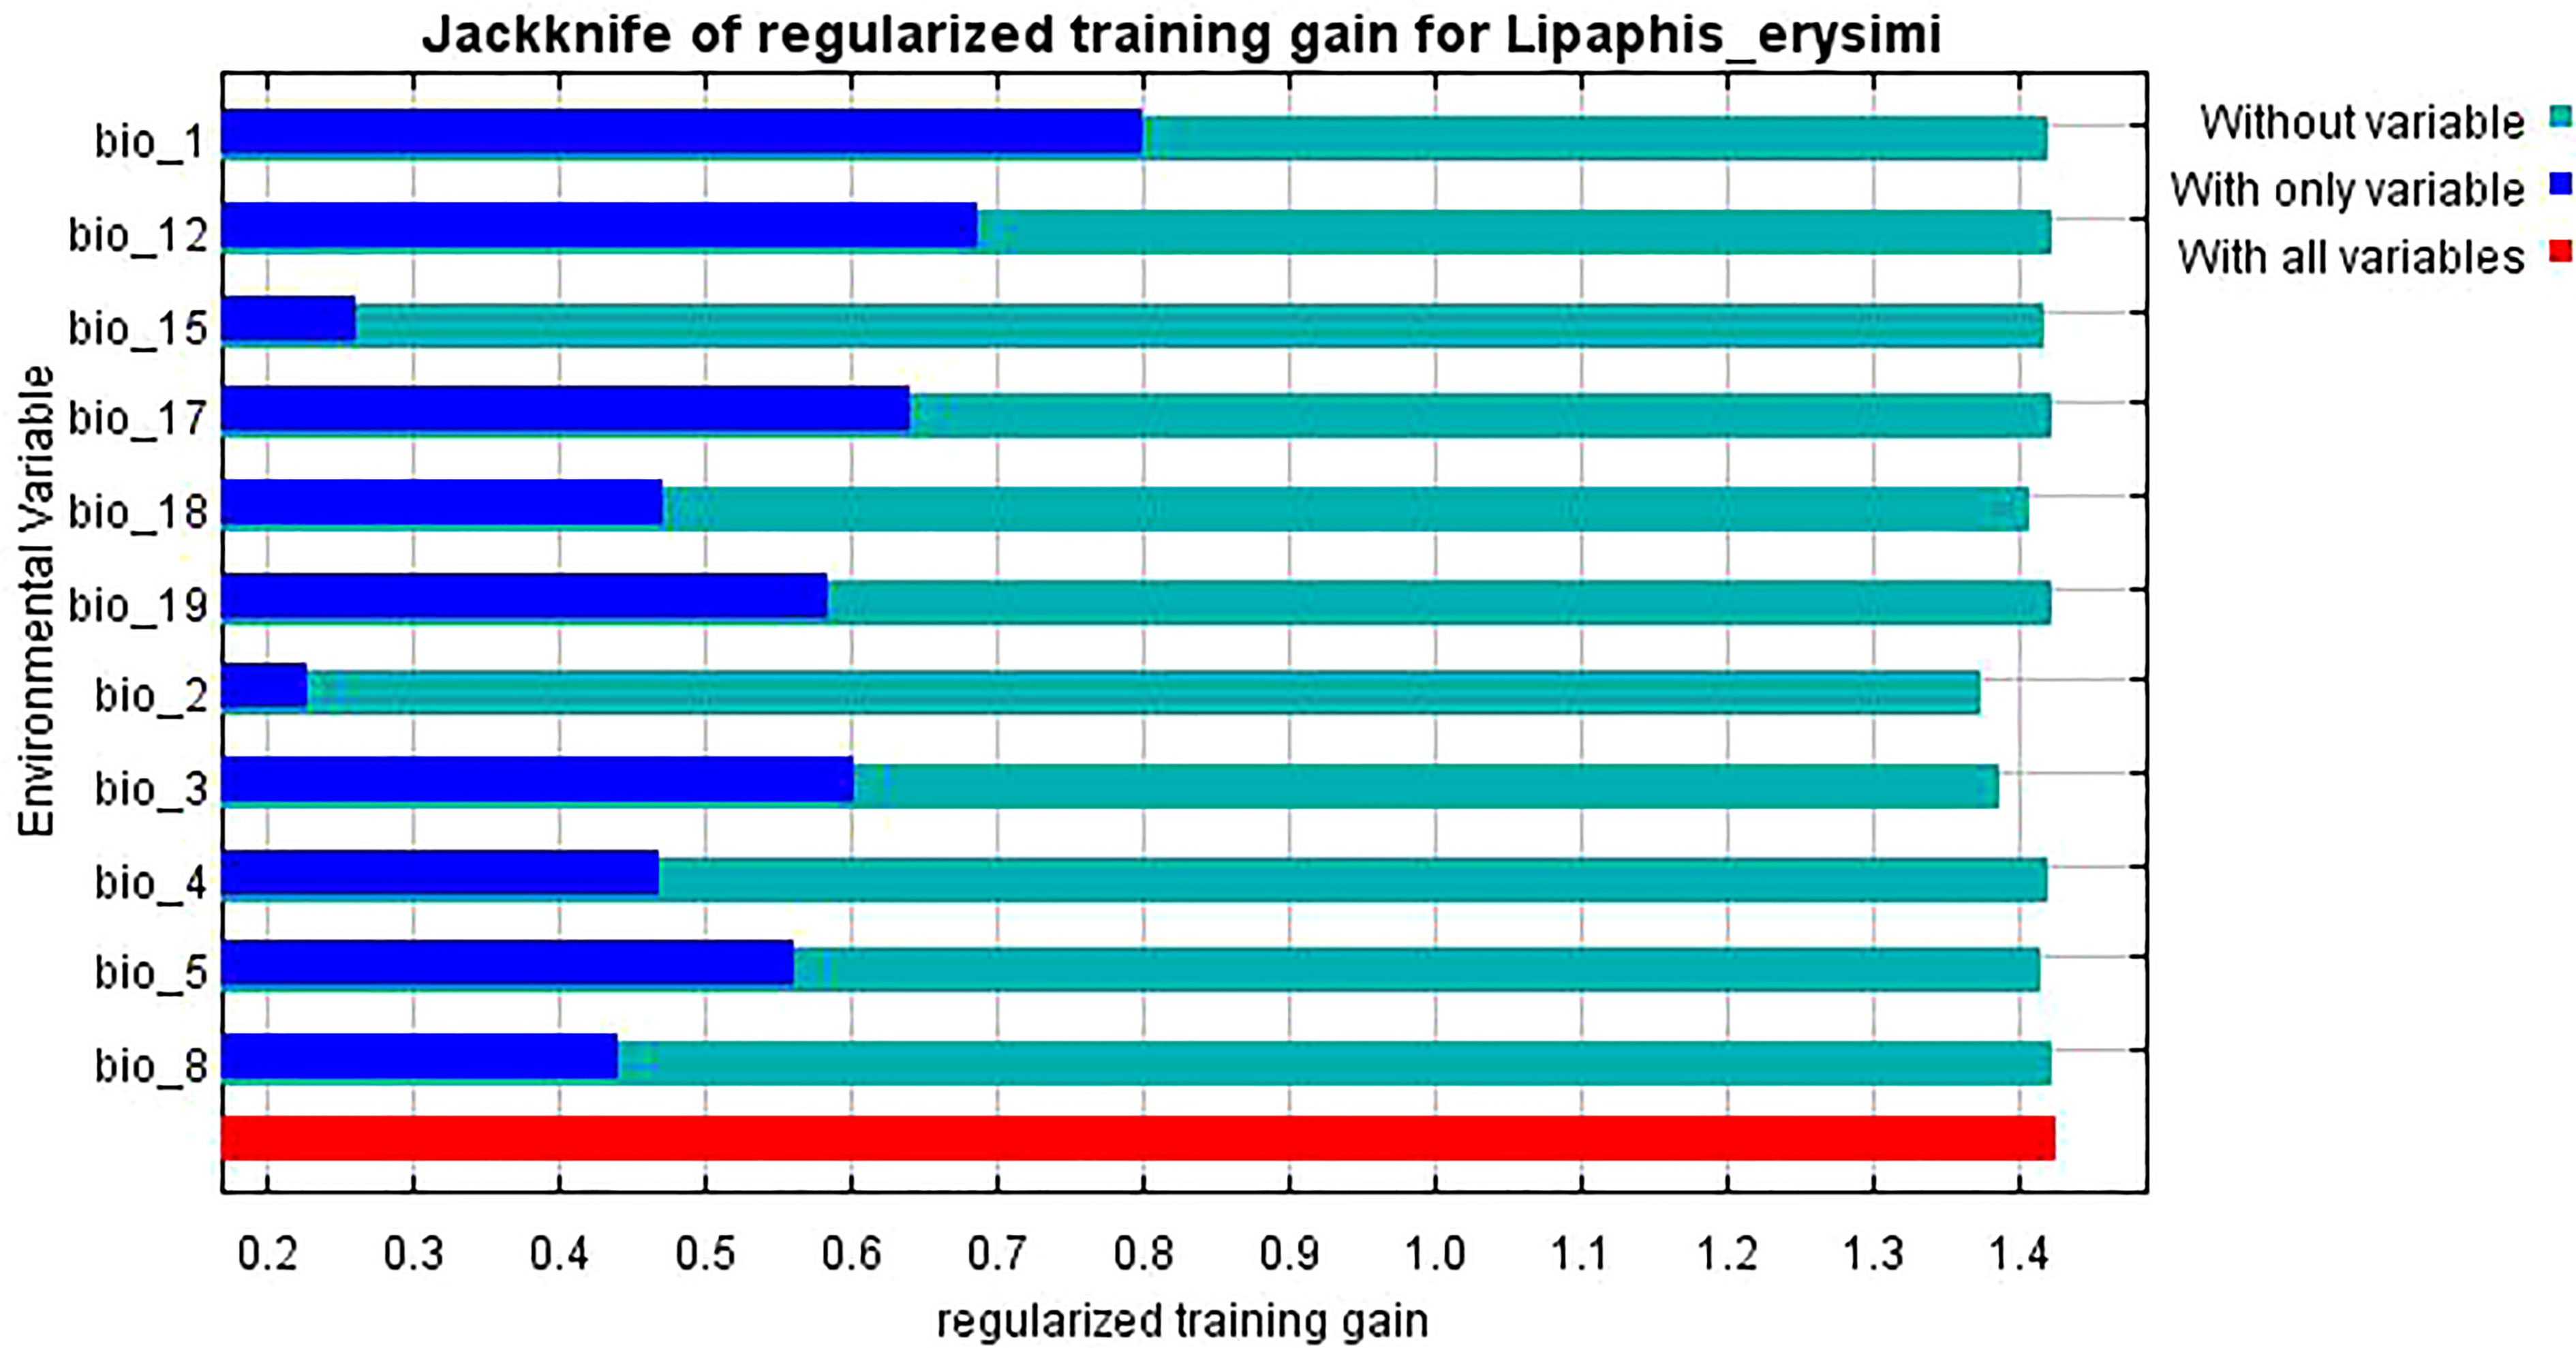
Figure 5 Evaluation of environmental variables affecting the distribution of L. erysimi by Jackknife test.
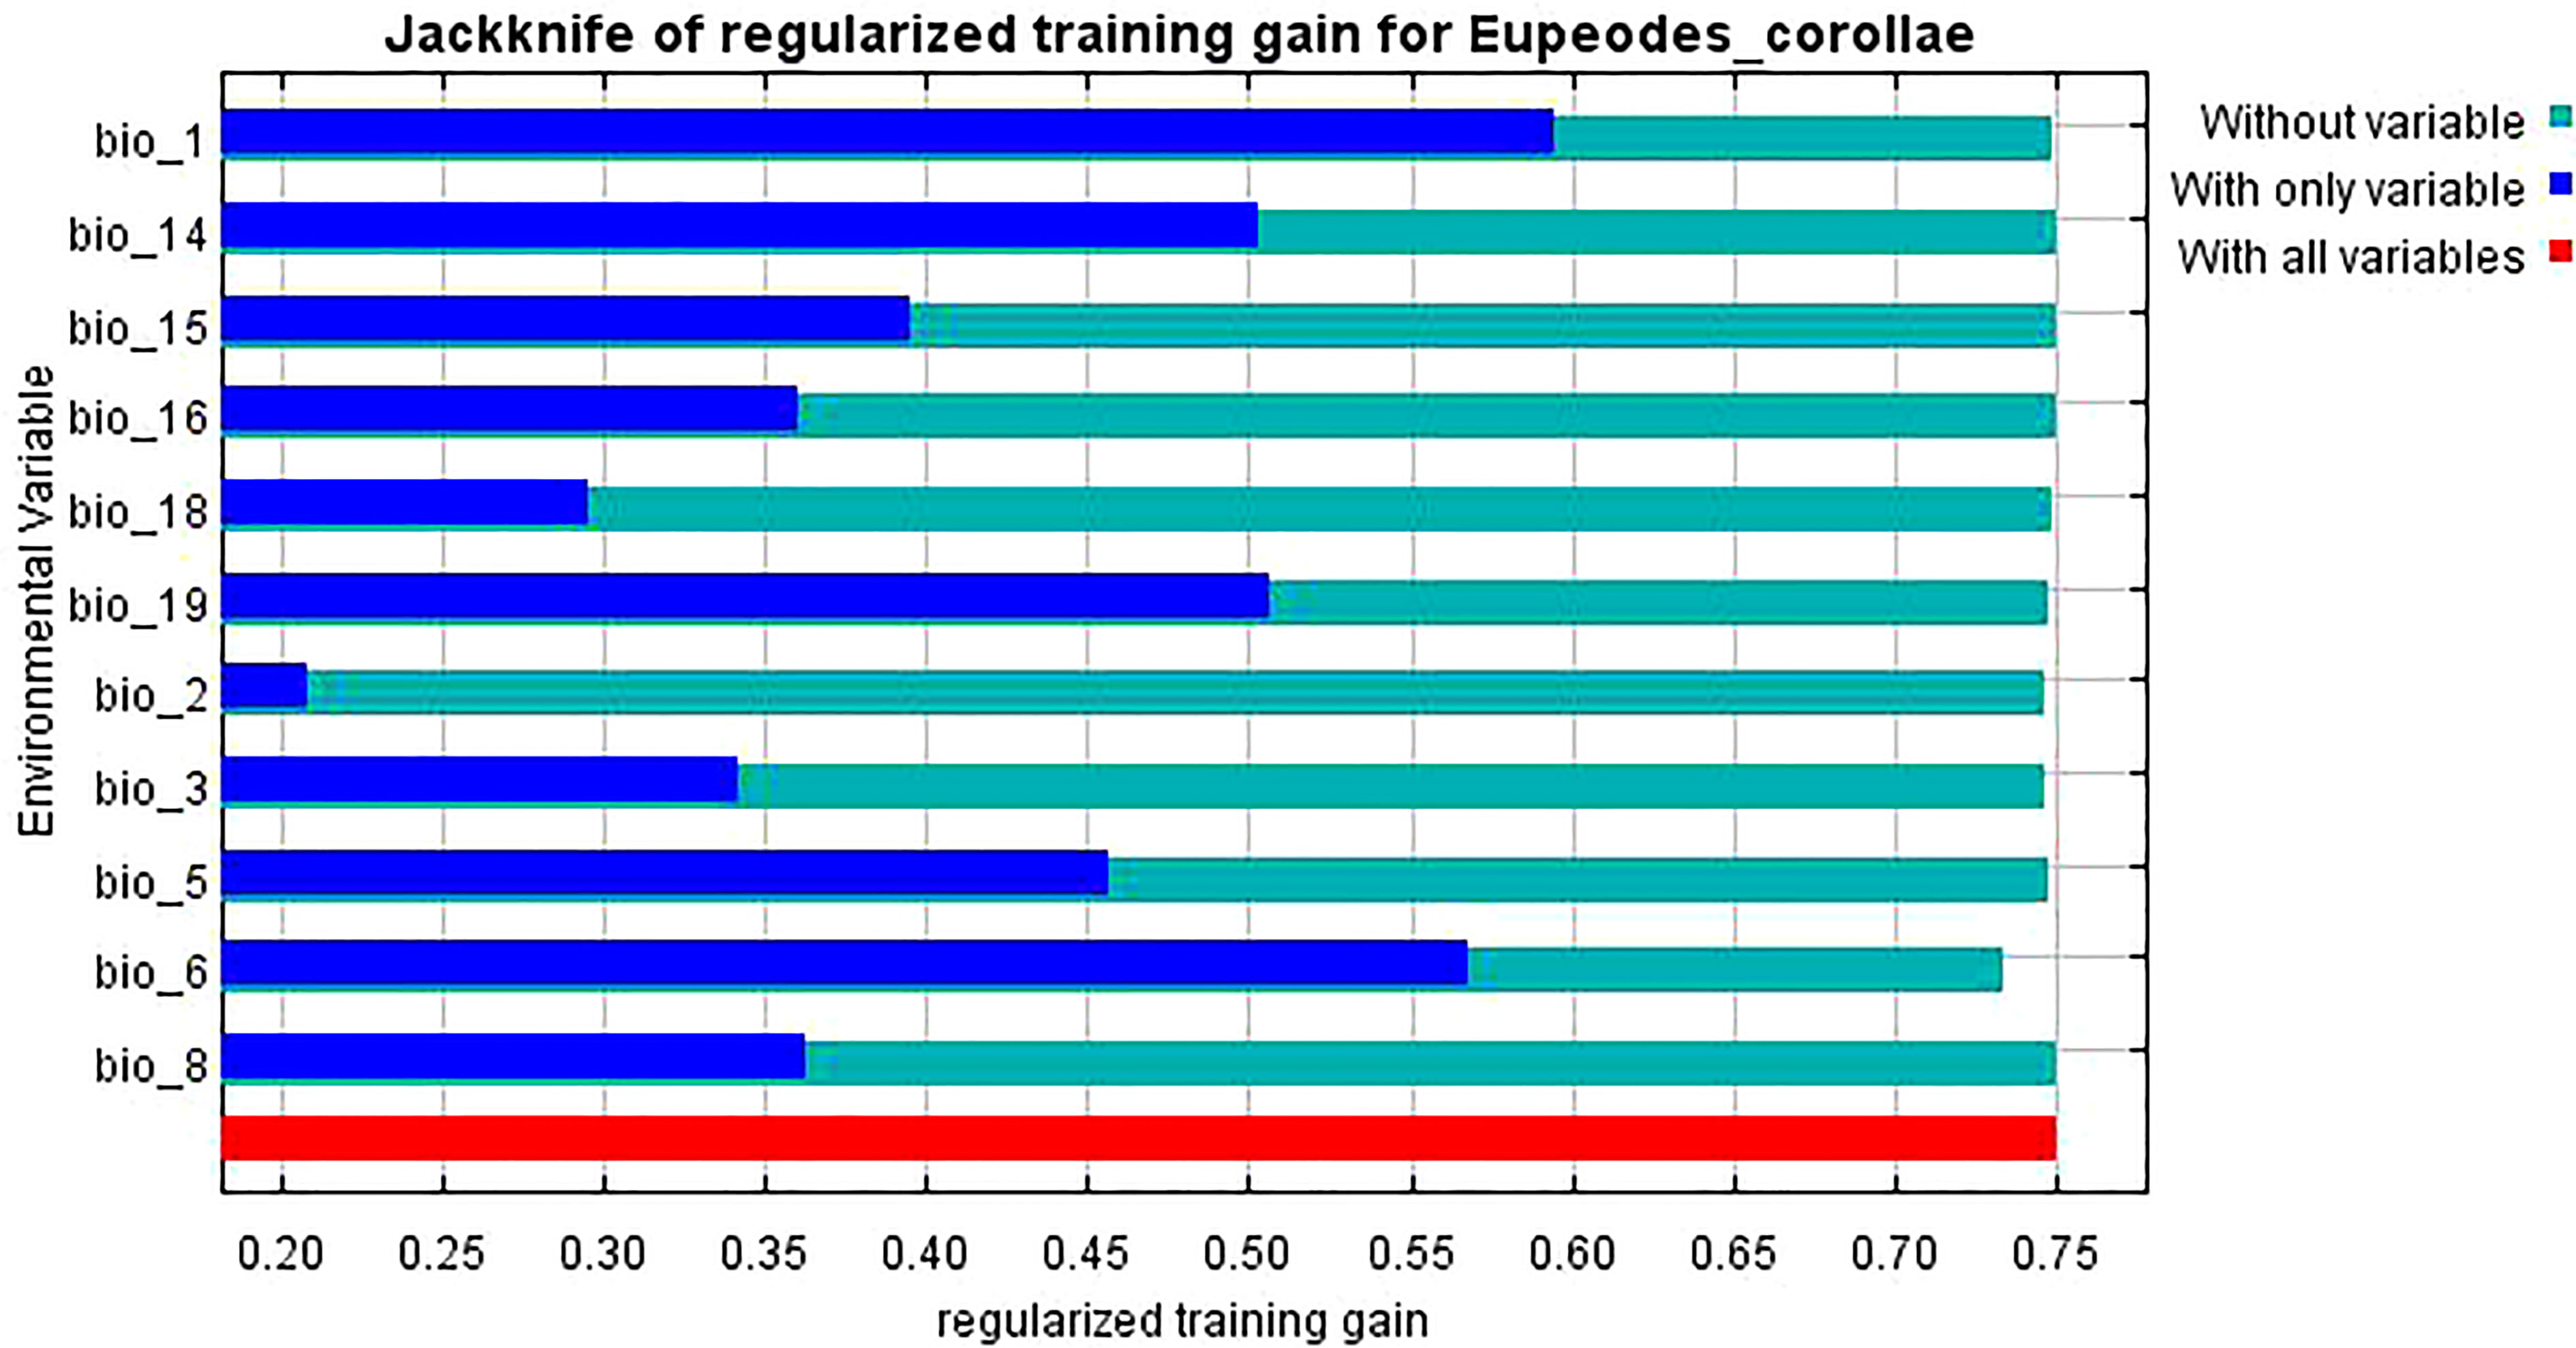
Figure 6 Evaluation of environmental variables affecting the distribution of E. corollae by Jackknife test.
The response curves of the dominant environmental variables showed that L. erysimi had no suitableness when the annual average temperature was below 0°C and above 29°C, and its suitableness was highest when the annual average temperature was around 18°C (Figure 7A). The highest suitableness was found when the annual average precipitation reached 1000 mm, and then declined with increasing annual average precipitation. Since the standard error of the response curve is large when the annual average precipitation more than 4000 mm, it does not be consider (Figure 7B). The response curves of the annual average temperature and the lowest temperature in the coldest month were consistent in the E. corolla, both increasing and then decreasing, with the highest suitableness at the annual average temperature around 10°C (Figure 7C) and the highest suitableness at the lowest temperature in the coldest month around 0°C (Figure 7D).
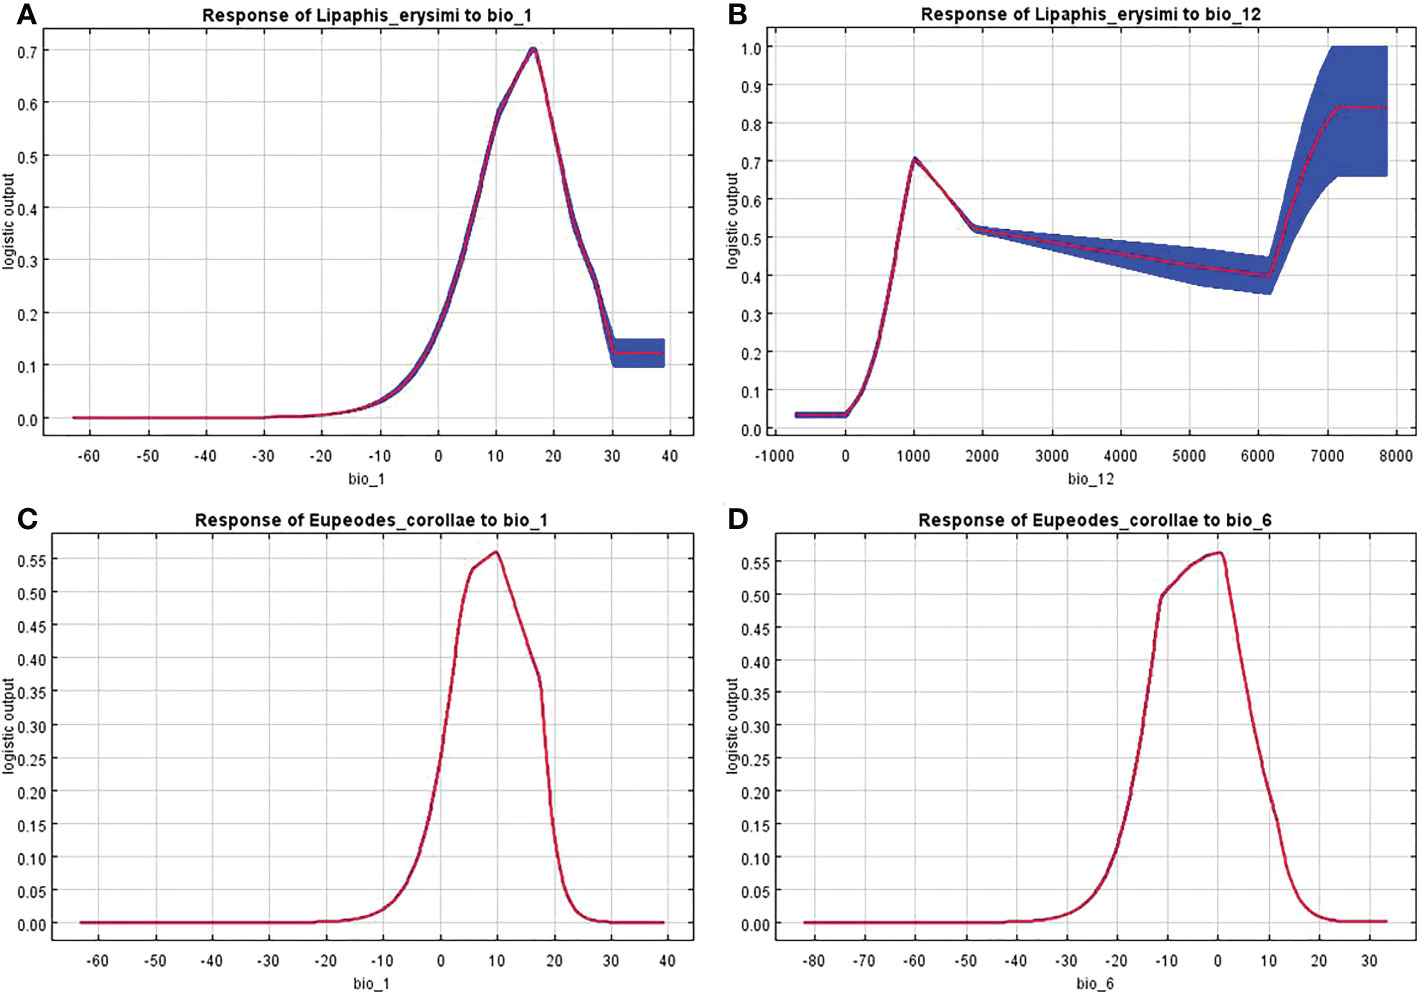
Figure 7 Response curve of distribution probability of L. erysimi and E. corollae to bioclimatic factors. (A), Response curve of L. erysimi to Bio1. (B), Response curve of L. erysimi to Bio12. (C), Response curve of E. corollae to Bio1. (D), Response curve of E. corollae to Bio6.
The curves show the mean response of the 10 replicate MaxEnt runs. Red indicates the average value and blue indicates ± SD.
Discussion
The highly and moderately suitable areas of L. erysimi under current climatic conditions in our study were mainly distributed at 15°-65°N and 15°-55°S, and are distributed in the Americas, Europe, Asia, and Australia, with concentrations in China, the United States, France, India, and so on, which is generally consistent with the reported distribution of L. erysimi (Patel et al., 2004; Desneux et al., 2006; Adhab and Schoelz, 2015; Bai et al., 2022). It proves the reliability of the prediction software used in our study. The area of highly suitable area of L. erysimi increased in the United States and India and decreases in Korea under the RCP2.6. The area of highly suitable area of L. erysimi increased in India and decreased in the United States and Korea under the RCP4.5. The area of highly suitable area of L. erysimi in France was reduced under the RCP8.5. The range and area of highly suitable area of E. corollae under the current climate conditions are smaller than that of L. erysimi, mainly distributed in 23.5-65°N and 30-55°S. The area of highly suitable area of E. corollae decreases remarkably under the three future climate conditions. China Taiwan, changes from a highly suitable area to a moderately suitable area, and the area of highly suitable area in northern India and northern Myanmar decreases. India is the third largest producer of rapeseed mustard, accounting for 19.8% of global acreage and 9.8% of total production, and damage by L. erysimi can result in up to 90% yield loss (Palial et al., 2022). Most of India is suitable for L. erysimi under current climatic conditions, and the suitable area for L. erysimi in India will increase under the RCP2.6 and RCP4.5. Whereas, E. corollae only be suitable in a small area in northern India, and its suitable area will decrease in future climatic conditions, which may increase the difficulty of using E. corollae for biological control of L. erysimi in India. Zhang et al. (2022a) Predicting the distribution of the Asian Longhorned Beetle, Anoplophora glabripennis (Coleoptera: Cerambycidae) and its natural enemies in China. The results showed that the Northern China (e.g., Xinjiang, Gansu, and Inner Mongolia), where A. glabripennis causes more serious damage, is also a potential suitable area for Dastarcus helophoroides and Dastarcus major, which provides a potential strategy for the management of A. glabripennis. In our study, the suitable area of E. corollae in Western Europe, southern China, eastern United States, Japan, and Korea partially overlap with those of the L. erysimi, it is speculated that the use of E. corollae for L. erysimi control in these areas may present a good effect.
Environmental variables act on species distributions at spatial scales that vary in size, and at relatively large scales, species interactions are often weakened and climatic variables play a major role (Hortal et al., 2010). Insects are poikilotherm, and temperature is crucial to their development. The distribution of insects and the number of generations in different regions can be inferred by measuring the developmental temperature and effective accumulation temperature of insects. In addition, humidity is closely related to insect life activities such as pupation, fledging, and evaporation of water from insects (Eberle et al., 2022). The two most critical environmental variables affecting the potential geographic distribution of L. erysimi in our study were Bio1 (Annual average temperature) and Bio12 (Annual average precipitation), and the two most critical environmental variables affecting the potential geographic distribution of E. corollae were Bio1 (Annual average temperature) and Bio6 (Lowest temperature in the coldest month). The suitableness of L. erysimi was the highest when the annual average temperature was 10°C-20°C. The suitableness of L. erysimi was the highest when the annual average precipitation was 1000 mm, and then decrease with the increase of annual average precipitation. Studies have shown that the optimum temperature of L. erysimi is at or below 20°C. Cloudy and cold weather is helpful to the development of L. erysimi (Singh et al., 2007). The occurrence of L. erysimi is severe in dry weather and the number of L. erysimi is inversely proportional to relative humidity when humidity is high (Mishra and Kanwat, 2018), the predicted results of our study are consistent with this result. The two most critical environmental variables influencing the distribution of E. corollae are both temperatures, with the highest suitableness at the annual average temperature of 10°C and the lowest temperature in the coldest month of 0°C, and E. corollae has been found to maintain egg production and predation at temperatures as low as 12°C (Moerkens et al., 2021), but no studies on the predatory performance of E. corollae at low temperatures have been reported, and it is speculated that conditions of 10°C-15°C may be conducive to the predation, development, and reproduction of E. corollae.
The MaxEnt ecological niche model has some limitations in that it only analyzes the influence of abiotic factors on species distribution, while in reality species distribution is also influenced by biotic factors (Wang et al., 2019). L. erysimi often follows seedlings dispersed by anthropogenic transfer, thus the actual distribution range is larger than predicted (Zhao et al., 2022a). In addition, if there is excessive humidity in the field or continuous rainfall, the aphids will be washed away and die in large numbers by the rain, leading to a reduction in the population density of E. corollae due to lack of food (Putra and Yasuda, 2006).
In conclusion, this study used the geographic distribution data of the historical occurrence of L. erysimi and E. corollae to project their potential distribution areas under current and future climates based on the MaxEnt model, and analyzed the key environmental factors affecting the survival and spread of both, concluding that RCP2.6 and RCP4.5 will be favorable for the survival and spread of L. erysimi, but will inhibit the spread of the natural enemy E. corolla; Low temperatures favor the predation of E. corollae but also promote the occurrence of L. erysimi; High humidity reduces population densities of L. erysimi and E. corolla; Therefore, we should fully consider the temperature and humidity in the field when using E. corolla to control L. erysimi and develop a scientific and reasonable control strategy. This study can provide theoretical and data support for the monitoring and early warning and biological control of L. erysimi.
Data availability statement
The original contributions presented in the study are included in the article/supplementary material. Further inquiries can be directed to the corresponding author.
Author contributions
YL, AW, SP, JJ, XY and SZ participated in the study design and analysis of the manuscript. JL, SY and RZ participated in the study design and helped to draft the manuscript. Supervision and financial support by SZ, revised and processed. All authors contributed to the article and approved the submitted version.
Funding
This study was supported by Hainan Major Science and Technology Project (ZDKJ201901). Hainan Province Science and Technology Special Fund (ZDYF2022XDNY163).
Conflict of interest
The authors declare that the research was conducted in the absence of any commercial or financial relationships that could be construed as a potential conflict of interest.
Publisher’s note
All claims expressed in this article are solely those of the authors and do not necessarily represent those of their affiliated organizations, or those of the publisher, the editors and the reviewers. Any product that may be evaluated in this article, or claim that may be made by its manufacturer, is not guaranteed or endorsed by the publisher.
References
Adhab, M. A., Schoelz, J. E. (2015). Report of the turnip aphid, Lipaphis erysimi (Kaltenbach 1843) from Missouri, USA. J. Plant Prot. Sci. 55, 327–328. doi: 10.1515/jppr-2015-0035
Bai, P. H., Hu, R. R., Bian, D. B., Liu, B. S., Li, N., Hu, C. F. (2022). Laboratory toxicity evaluation of Vitex negundo extracts on Lipaphis erysimi. Tianjin Agric. Sci. 28, 57–60. doi: 10.3969/j.issn.1006-6500.2022.S.014
Barreca, A. I. (2012). Climate change, humidity, and mortality in the united states. J. Environ. Econ Manage. 63, 19–34. doi: 10.1016/j.jeem.2011.07.004
Barry, S., Elith, J. (2006). Error and uncertainty in habitat models. J. Appl. Ecol. 43, 413–423. doi: 10.1111/j.1365-2664.2006.01136.x
Beck, J., Böller, M., Erhardt, A., Schwanghart, W. (2014). Spatial bias in the GBIF database and its effect on modeling species' geographic distributions. Ecol. Inform. 19, 10–15. doi: 10.1016/j.ecoinf.2013.11.002
Chattopadhyay, C., Agrawal, R., Kumar, A., Singh, Y. P., Roy, S. K., Khan, S. A., et al. (2005). Forecasting of Lipaphis erysimi on oilseed brassicas in India–a case study. Crop Prot. 24, 1042–1053. doi: 10.1016/j.cropro.2005.02.010
Davis, J. J. (1914). New or little known species of aphididae. Can. Entomol. 46, 226–236. doi: 10.4039/Ent46226-7
Desneux, N., Rabasse, J. M., Ballanger, Y., Kaiser, L. (2006). Parasitism of canola aphids in France in autumn. J. Pest Sci. 79, 95–102. doi: 10.1007/s10340-006-0121-1
Dong, K., Dong, Y., Luo, Y. Z. (2004). Studies on the developmental zero temperature and effective accumulated temperature of Syrphus corollae fabricius. J. Yunnan Agric. Univ. 19, 177–178+198. doi: 10.16211/j.issn.1004-390x(n).2004.02.013
Dong, Z., He, Y., Ren, Y., Wang, G., Chu, D. (2022). Seasonal and year-round distributions of Bactrocera dorsalis (Hendel) and its risk to temperate fruits under climate change. Insects 13, 550. doi: 10.3390/insects13060550
Eberle, S., Schaden, L. M., Tintner, J., Stauffer, C., Schebeck, M. (2022). Effect of temperature and photoperiod on development, survival, and growth rate of mealworms, Tenebrio molitor. Insects 13, 321. doi: 10.3390/insects13040321
Elith, J., Phillips, S. J., Hastie, T., Dudík, M., Chee, Y. E., Yates, C. J. (2011). A statistical explanation of MaxEnt for ecologists. Divers. Distrib. 17, 43–57. doi: 10.1111/j.1472-4642.2010.00725.x
Fick, S. E., Hijmans, R. J. (2017). WorldClim 2: new 1-km spatial resolution climate surfaces for global land areas. Int. J. climatol. 37, 4302–4315. doi: 10.1002/joc.5086
Fielding, A. H., Bell, J. F. (1997). A review of methods for the assessment of prediction errors in conservation presence/absence models. Environ. Conserv. 24, 38–49. doi: 10.1017/S0376892997000088
He, J. L., Sun, X. Q., Gui, L. M., Ye, W. J. (1990). A preliminary study on the biology of Eupeodes corollae fabricius in shanghai. J. Shanghai Agric. Univ. 8, 221–228+234.
Hortal, J., Roura- Pascual, N., Sanders, N. J., Rahbek, C. (2010). Understanding (insect) species distributions across spatial scales. Ecography. 33, 51–53. doi: 10.1111/j.1600-0587.2009.06428.x
Khaliq, A. M., Javed, M., Sohail, M., Sagheer, M. (2014). Environmental effects on insects and their population dynamics. J. Entomol. Zool Stud. 2, 1–7.
Koramutla, M. K., Aminedi, R., Bhattacharya, R. (2016). Comprehensive evaluation of candidate reference genes for qRT-PCR studies of gene expression in mustard aphid, Lipaphis erysimi (Kalt). Sci. Rep. 6, 1–10. doi: 10.1038/srep25883
Li, Z., Liu, Y., Zeng, H. (2022). Application of the MaxEnt model in improving the accuracy of ecological red line identification: A case study of zhanjiang, China. Ecol. Indic. 137, 108767. doi: 10.1016/j.ecolind.2022.108767
Li, G. T., Zhang, F. S., Gao, J. F. (1996). Observation on the biological characteristics of Eupeodes corollae fabricius. J. Jilin Agric. Univ. 18, 154–157. doi: 10.13327/j.jjlau.1996.s1.051
Liu, Y., Zhou, K., Xia, Q. (2018). A MaxEnt model for mineral prospectivity mapping. Nat. Resour. Res. 27, 299–313. doi: 10.1007/s11053-017-9355-2
Mishra, S. K., Kanwat, P. M. (2018). Seasonal incidence of mustard aphid, Lipaphis erysimi (Kalt) and its major predator on mustard and their correlation with abiotic factors. J. Entomol. Zool Stud. 6, 831–836.
Moerkens, R., Boonen, S., Wäckers, F. L., Pekas, A. (2021). Aphidophagous hoverflies reduce foxglove aphid infestations and improve seed set and fruit yield in sweet pepper. Pest Manage. Sci. 77, 2690–2696. doi: 10.1002/ps.6342
Palial, S., Kumar, S., Atri, C., Sharma, S., Banga, S. S. (2022). Antixenosis and antibiosis mechanisms of resistance to turnip aphid, Lipaphis erysimi (Kaltenbach) in Brassica juncea-fruticulosa introgression lines. J. Pestic. Sci. 95, 749–760. doi: 10.1007/s10340-021-01418-8
Pasiecznik, N. M., Smith, I. M., Watson, G. W., Brunt, A. A., Ritchie, B., Charles, L. M. F. (2005). CABI/EPPO distribution maps of plant pests and plant diseases and their important role in plant quarantine. Bull. Oepp. 35, 1–7. doi: 10.1111/j.1365-2338.2005.00815.x
Patel, S. R., Awasthi, A. K., Tomar, R. K. S. (2004). Assessment of yield losses in mustard (Brassica juncea l.) due to mustard aphid (Lipaphis erysimi kalt.) under different thermal environments in Eastern central India. Appl. Ecol. Environ. Res. 2, 1–15. doi: 10.15666/aeer/02001015
Pearson, R. G., Raxworthy, C. J., Nakamura, M., Townsend Peterson, A. (2007). Predicting species distributions from small numbers of occurrence records: a test case using cryptic geckos in Madagascar. J. Biogeogr. 34, 102–117. doi: 10.1111/j.1365-2699.2006.01594.x
Pekas, A., Craecker, D. I., Boonen, S., Wäckers, F. L., Moerkens, R. (2020). One stone; two birds: concurrent pest control and pollination services provided by aphidophagous hoverflies. Biol. Control. 149, 104328. doi: 10.1016/j.biocontrol.2020.104328
Phillips, S. J., Anderson, R. P., Schapire, R. E. (2006). Maximum entropy modeling of species geographic distributions. Ecol. Modell. 190, 231–259. doi: 10.1016/j.ecolmodel.2005.03.026
Phillips, S. J., Dudík, M. (2008). Modeling of species distributions with maxent: new extensions and a comprehensive evaluation. Ecography. 31, 161–175. doi: 10.1111/j.0906-7590.2008.5203.x
Putra, N. S., Yasuda, H. (2006). Effects of prey species and its density on larval performance of two species of hoverfly larvae, Episyrphus balteatus de geer and Eupeodes corollae fabricius (Diptera: Syrphidae). Appl. Entomol. Zool. 41, 389–397. doi: 10.1303/aez.2006.389
Rana, J. S. (2005). Performance of Lipaphis erysimi (Homoptera: Aphididae) on different brassica species in a tropical environment. J. Pestic. Sci. 78, 155–160. doi: 10.1007/s10340-005-0088-3
Reza, M. D. W., Biswas, A. K., Roy, K. (2004). Seasonal abundance of Lipaphis erysimi (Kalt.) population on mustard. Uttar. Pradesh J. Zoology. 24, 129–132.
Sillero, N. (2011). What does ecological modelling model? a proposed classification of ecological niche models based on their underlying methods. Ecol. Modell. 222, 1343–1346. doi: 10.1016/j.ecolmodel.2011.01.018
Singh, R., Singh, D., Rao, V. U. M. (2007). Effect of abiotic factors on mustard aphid (Lipaphis erysimi kalt.) on Indian brassica. Indian J. Agric. Sci. 41, 67–70.
Van Vuuren, D. P., Edmonds, J., Kainuma, M., Riahi, K., Thomson, A., Hibbard, K., et al. (2011). The representative concentration pathways: an overview. Clim. Change. 109, 5–31. doi: 10.1007/s10584-011-0148-z
Wang, R., Yang, H., Luo, W., Wang, M., Lu, X., Huang, T., et al. (2019). Predicting the potential distribution of the Asian citrus psyllid, Diaphorina citri (Kuwayama), in China using the MaxEnt model. PeerJ. 7, e7323. doi: 10.7717/peerj.7323
Warren, D. L., Seifert, S. N. (2011). Ecological niche modeling in maxent: the importance of model complexity and the performance of model selection criteria. Ecol. Appl. 21, 335–342. doi: 10.1890/10-1171.1
Welch, K. D., Harwood, J. D. (2014). Temporal dynamics of natural enemy–pest interactions in a changing environment. Biol. Control. 75, 18–27. doi: 10.1016/j.biocontrol.2014.01.004
Yackulic, C. B., Chandler, R., Zipkin, E. F., Royle, J. A., Nichols, J. D. (2013). Presence-only modelling using MAXENT: when can we trust the inferences? Methods Ecol. Evol. 4, 236–243. doi: 10.1111/2041-210x.12004
Yamamura, K., Yokozawa, M., Nishimori, M., Ueda, Y., Yokosuka, T. (2006). How to analyze long-term insect population dynamics under climate change: 50-year data of three insect pests in paddy fields. Popul. Ecol. 48, 31–48. doi: 10.1007/s10144-005-0239-7
Zhang, Y., Hughes, A. C., Zhao, Z., Li, Z., Qin, Y. (2022b). Including climate change to predict the global suitable area of an invasive pest: Bactrocera correcta (Diptera: Tephritidae). Glob. Ecol. Conserv. 34, e02021. doi: 10.1016/j.gecco.2022.e02021
Zhang, Q. C., Wang, J. G., Lei, Y. H. (2022a). Predicting distribution of the Asian longhorned beetle, anoplophora glabripennis (Coleoptera: Cerambycidae) and its natural enemies in China. Insects 13, 687. doi: 10.3390/insects13080687
Zhao, Q., Gao, X. Y., Cai, B., Chen, C., Wei, J. F. (2022a). Potential distribution of Diatraea saccharalis in China based on max ent model. Plant Quarantine 36, 77–82. doi: 10.19662/j.cnki.issn1005-2755.2021.00.032
Keywords: Lipaphis erysimi, Eupeodes corollae Fabricius, Suitable area, Climate factor, MaxEnt
Citation: Lian Y, Wang A, Peng S, Jia J, Yang X, Li J, Yang S, Zheng R and Zhou S (2022) Potential global distribution area projections of the aphid Lipaphis erysimi and its predator Eupeodes corollae in the context of climate change. Front. Plant Sci. 13:1019693. doi: 10.3389/fpls.2022.1019693
Received: 15 August 2022; Accepted: 14 November 2022;
Published: 25 November 2022.
Edited by:
Julian Chen, Institute of Plant Protection, Chinese Academy of Agricultural Sciences, ChinaReviewed by:
Mónica Asunción Hurtado Ruiz, University of Jaume I, SpainWen Xie, Insititute of Vegetables and Flowers, Chinese Academy of Agricultural Sciences, China
Copyright © 2022 Lian, Wang, Peng, Jia, Yang, Li, Yang, Zheng and Zhou. This is an open-access article distributed under the terms of the Creative Commons Attribution License (CC BY). The use, distribution or reproduction in other forums is permitted, provided the original author(s) and the copyright owner(s) are credited and that the original publication in this journal is cited, in accordance with accepted academic practice. No use, distribution or reproduction is permitted which does not comply with these terms.
*Correspondence: Shihao Zhou, enNoODgyMDA5MzlAMTI2LmNvbQ==
†These authors have contributed equally to this work