 Yukai Chen
 Hai-Li Zhang
 Li Zhang
 Mir Muhammad Nizamani
 Taoxiu Zhou
 Haiyang Zhang
 Tingting Liu
- 1Ministry of Education Key Laboratory for Ecology of Tropical Islands, College of Life Sciences, Hainan Normal University, Haikou, China
- 2Hainan Key Laboratory for Sustainable Utilization of Tropical Bioresources, School of Life Sciences, Hainan University, Haikou, China
- 3Guizhou Normal University Museum, Guizhou Normal University, Guizhou, China
- 4Department of Plant Pathology, Agricultural College, Guizhou University, Guiyang, China
- 5College of Biological Science and Technology, Yangzhou University, Yangzhou, China
- 6College of International Studies, Sichuan University, Chengdu, China
Hopea hainanensis (Dipterocarpaceae) is an endangered tree species restricted to Hainan Island, China, and a small part of Northern Vietnam. On Hainan Island, it is an important indicator species for tropical forests. The wood of Hopea hainanensis has a very high utilization value in nature since it is compact in structure, hard in texture, not easily deformed after drying, durable, and resistant to sunlight and water. As a result of its high quality, it has been felled and mined by humans without restraint, resulting in a reduction of its population size, severe habitat fragmentation, and a sharp decline in its population. Therefore, its conservation biology needs to be researched urgently. Researchers are currently focusing on the ecological factors and seed germination in the habitat of Hopea hainanensis to determine its endangered status. In the literature, there are no systematic analyses of the endangered mechanism of Hopea hainanensis in terms of genetic diversity. It focuses especially on the systematic genetic diversity of Hopea hainanensis in fragmented habitats. Using single nucleotide polymorphism (SNP) and genotyping-by-sequencing (GBS) technology, 42 samples from seven different cohabitation groups were genotyped. The results showed that the average heterozygosity of the seven populations of Hopea hainanensis was 19.77%, which indicated that the genetic diversity of Hopea hainanensis was low. Genetic diversity research is essential for rare and endangered plant protection research. We can find a scientific basis for protecting endangered plants on slope bases by analyzing genetic differences and relationships among populations.
1 Introduction
The Earth’s biodiversity quickly decreases due to agricultural growth, over-exploitation, deforestation, pollution, and climate change (Wang et al., 2007). Around 40% of plant species are on the verge of extinction (Ly et al., 2018). Conservation genetics, a new science that uses population genetics principles and methods to biological conservation, aims to save endangered species from extinction (Hogarth et al., 1997; Sarath Padmanabhan and Hemaprabha, 2018). Endangered animals are frequently distinguished by tiny, scattered populations and limited gene flow among populations (Mehmood et al., 2018). Mating happens more commonly among relatives in tiny, isolated populations, and selfing may be observed in hermaphroditic plants. Inbreeding causes homozygosity in harmful recessive genes and, as a result, the generation of poorer offspring, a condition known as inbreeding depression (Kardos et al., 2016).
Furthermore, genetic drift is higher in small populations, contributing to the fixation of harmful mutations and loss of genetic variation, weakening a population’s adaptive ability and raising its extinction risk (Kardos et al., 2021). The area of conservation genetics, which aims to research the genetic diversity, population differentiation, mating system, and historical demography of endangered species, gives amazing insights into preserving biodiversity in the real world (Brown et al., 1991). Furthermore, Hopea hainanensis research is primarily concerned with the impacts of various environmental conditions in the habitat on seed germination and seedling development, ex situ conservation, and better seed selection and cultivation techniques in artificial propagation and cultivation (Zhang et al., 2022).
Dipterocarpaceae comprise 20-50% of the basal forest area and more than 50% of the canopy trees in tropical Asian forests (Ghazoul, 2016). Because many Dipterocarpaceae species are valuable wood resources, they have been widely exploited in tropical Asian nations. As a result of the widespread harvesting of timber and destruction for agriculture, many dipterocarps are now designated as endangered or severely endangered (Wang et al., 2021). On the other hand, Dipterocarp woods are considerably more than just a supply of lumber. They are vital components of Asian tropical rainforest ecosystems, acting as the foundation for these varied ecosystems. Indeed, Southeast Asia is home to four of the world’s 25 “biodiversity hotspots” (Wang et al., 2020). Furthermore, dipterocarp forests provide various ecosystem services and play a significant role in balancing ecological processes at the regional and global levels (Agoramoorthy, 2002). It is the representative and endemic species of the tropical ravine rainforest in Hainan.
The natural survival population of H. hainanensis in Hainan is mainly distributed in the forest patches dominated by broken secondary rainforests in and around Limushan, Bawangling, Jianfengling, Diaoluoshan, Yinggeling, Wuzhishan, and other forest areas in Hainan Island (Song et al., 2020). H. hainanensis is listed as a class I protected plant in the List of China’s National Key Protected Wild Plants (Jiang, 2019). It was identified as an endangered species in the Red Book of Chinese Plants and is ranked as “Endangered” by the IUCN (Ly et al., 2018). Currently, studies on H. hainanensis mainly focus on the effects of various environmental factors in the habitat on seed germination and seedling development, ex situ protection, and improved seed selection and cultivation techniques in artificial propagation and cultivation (Chen et al., 2015). There is a lack of systematic analysis of the endangerment mechanism in terms of genetic diversity, and there is even less research on the systematic genetic diversity of ports in different fragmented and chemical habitats (Li et al., 2015; Zhang et al., 2022).
However, genetic diversity as an extinction mechanism for H. hainanensis has not been systematically studied. A few studies have been conducted on the genetic diversity of Hopea hainanensis systems in fragmented and metaplastic environments. Wang et al. isolated and identified 12 polymorphic microsatellite markers on endangered H. hainanensis (Wang et al., 2020). The genetic diversity and population structure of 10 H. hainanensis populations were analyzed using 12 SSR markers in Hainan Island. The emergence of population bottlenecks may cause genetic diversity loss and population differentiation. Long-term protection strategies for endangered species in Hainan were proposed.
In many fields, genotyping by sequencing (GBS) in simplified genome sequencing technology has become increasingly popular as next-generation high-throughput sequencing technology has developed (Mehmood et al., 2022). These include the construction and analysis of genetic maps, the study of genome-wide association systems and gene diversity and identifying the germplasm of plants and animals. Therefore, in this study, GBS technology was used to systematically identify 42 genome-wide SNPs of H. hainanensis resources. Based on the identified SNPs, a phylogenetic tree of these 42 H. hainanensis resources was constructed, and genetic diversity was analyzed. It has practical guiding significance for the protection of H. hainanensis resources and the improvement of its ecological environment. It is of great significance to the protection of H. hainanensis biodiversity.
2 Materials and methods
2.1 Study area
Hainan Island (E108°37′-111°03′, N18°10′-20°10) is located in southern China (Zhang et al., 2021), and it is the largest island city in China (Figure 1). Hainan Island has a mild climate, with an annual average temperature of 22-27°C, and is rich in forest resources (Zhang et al., 2022). Hainan Island is low and flat all around and towering in the middle, with Wuzhishanand Yinggeling as the uplift cores and descending step by step to the periphery. (https://www.hainan.gov.cn). Hainan Island is hailed as the largest “natural museum” by biologists, and 102 rare animals in Hainan Island have been included in the list of national first- and second-class key protected animals (Zhang et al., 2022). There are many rare and endangered wild plants. At the same time, northern and coastal regions have relatively low biodiversity and fewer rare and endangered species due to greater human disturbance intensity (Nizamani et al., 2021).
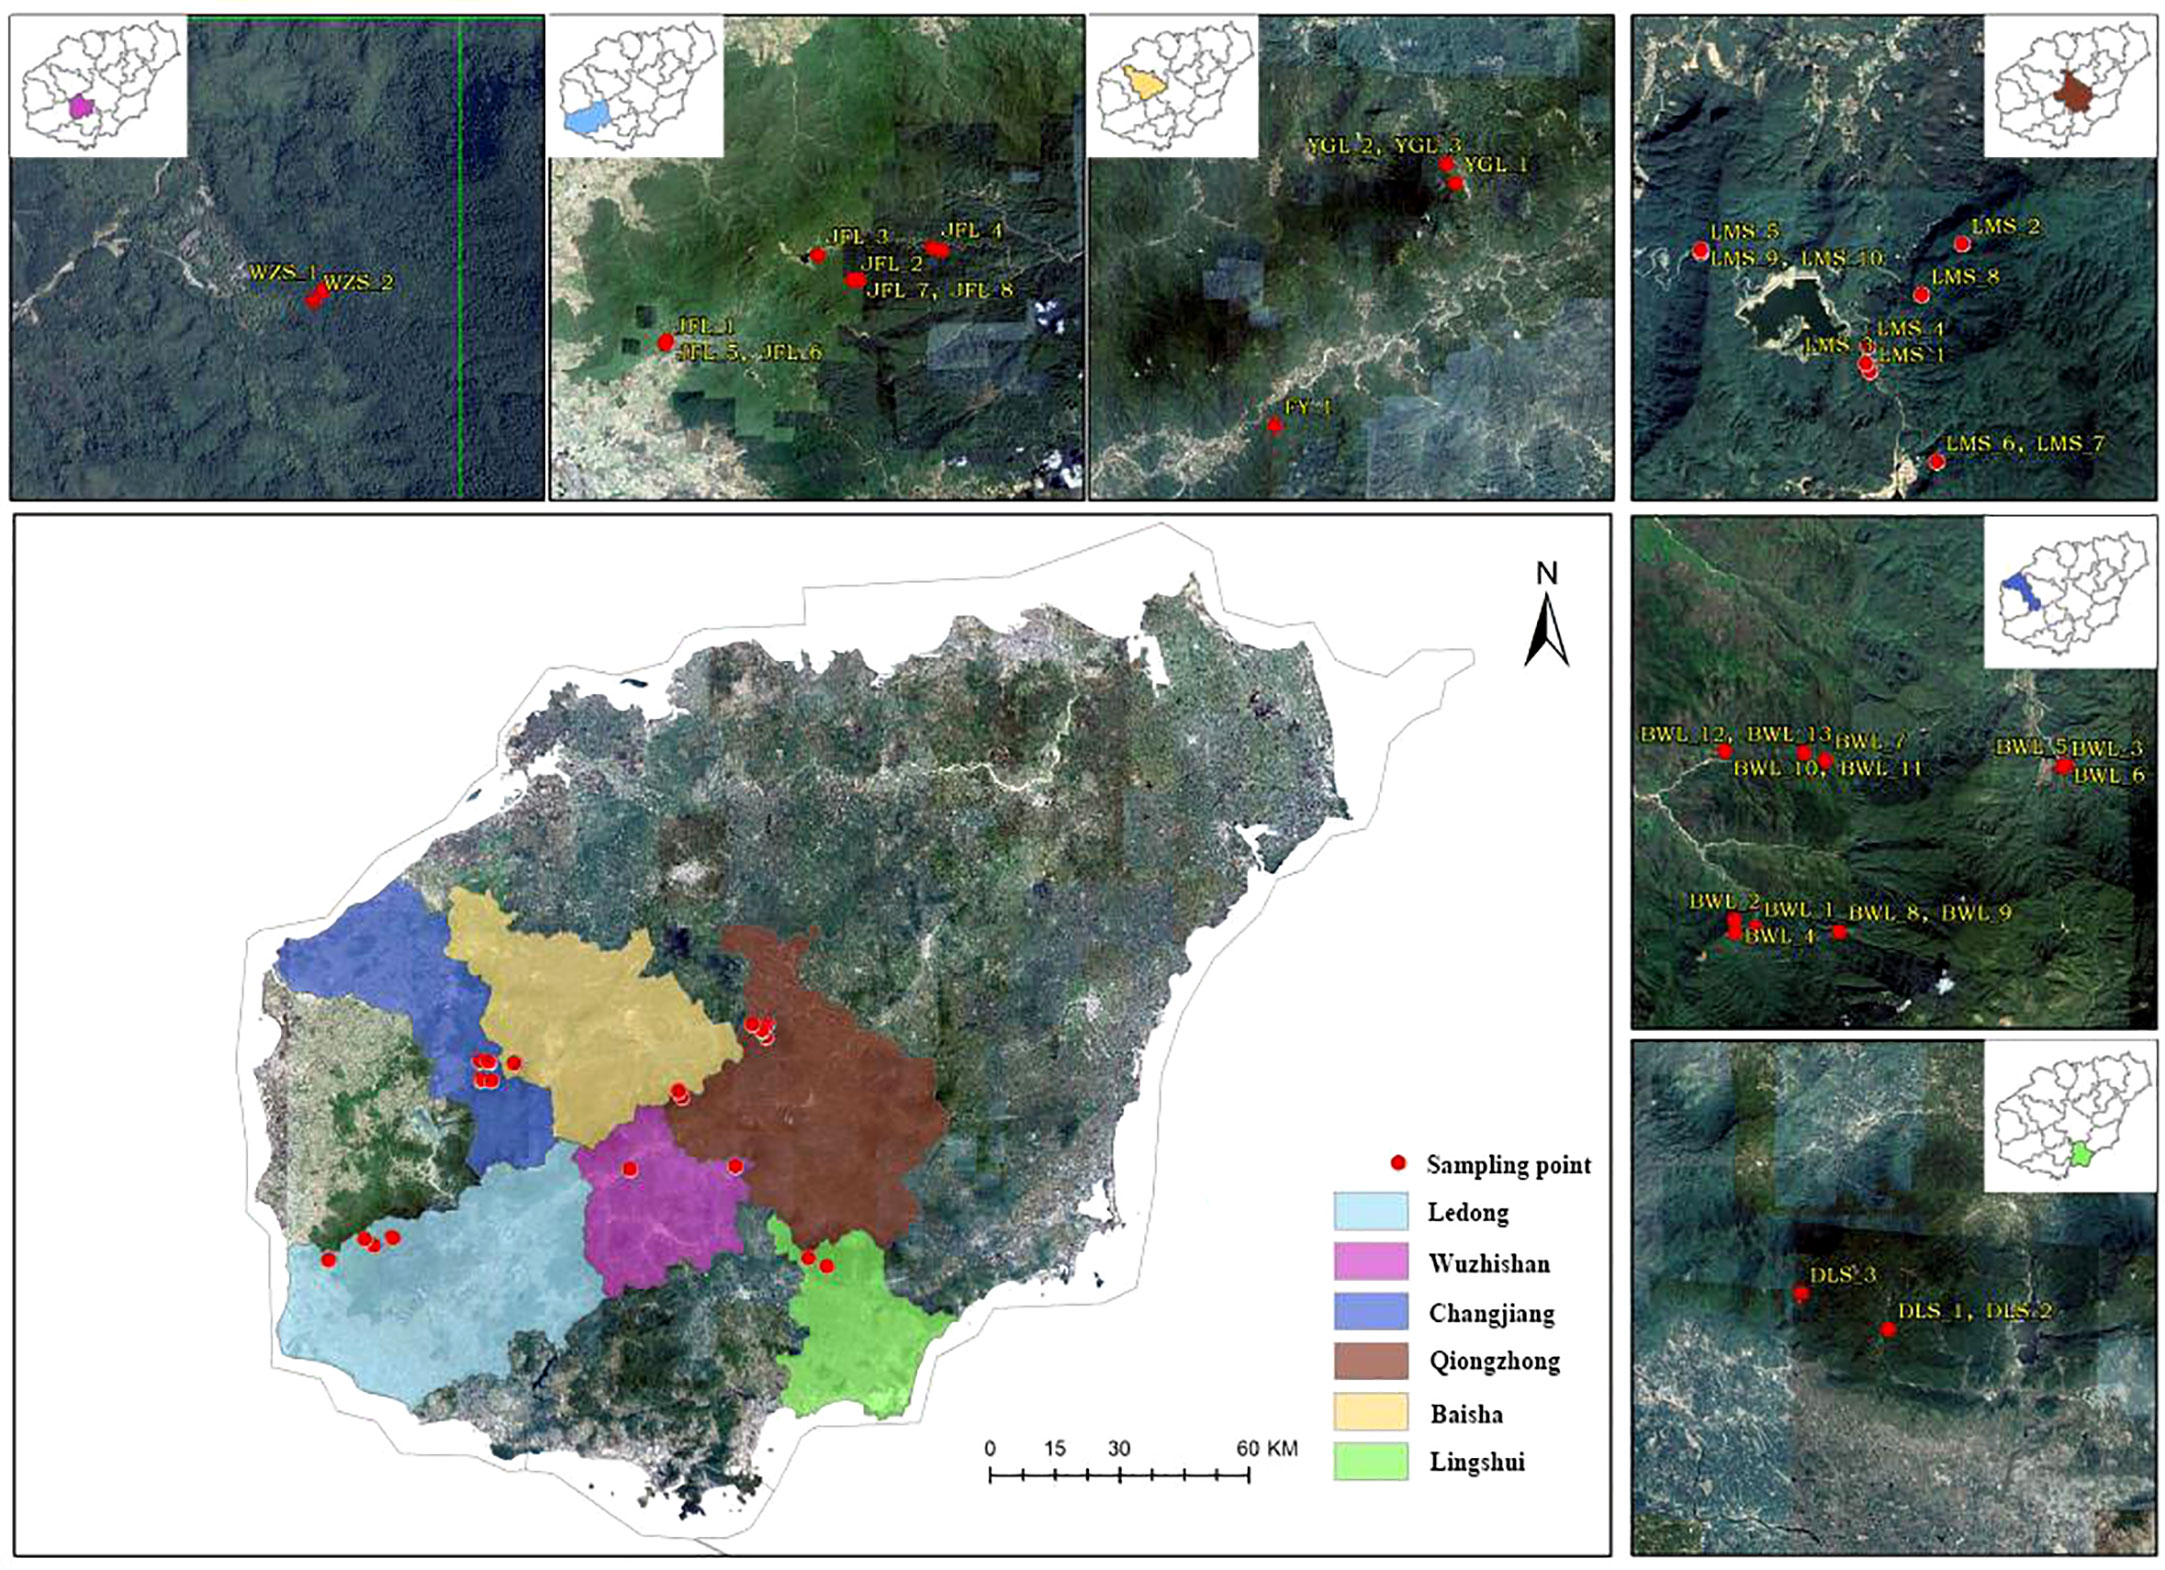
Figure 1 A distribution and sample collection information map of Hopea hainanensis in Hainan Island.
2.2 Materials
In the early field investigation, field investigation and actual sampling possibilities are based on the natural distribution of the levee population. The H. hainanensis sample materials were divided into seven regional populations according to their geographical sources for population sampling. The bawangling population includes nine subpopulations, namely BWL P1-P9, including samples BWL1-BWL_13. Limushan population consists of 7 subpopulations, LMS P1 and LMS P3-P8, including samples LMS1-LMS_10, respectively. The Jianfengling population included seven subpopulations JFL X1-X2, JFL P1, JFL P3-P6, which included samples JFL1-JFL_10. Wuzhishan population included two subpopulations (WZS P1-P2), including samples WZS_1-WZS_2, respectively. Yinggeling population included two subpopulations YGL P1-P2, including YGL1-YGL_3, respectively. The Diaoluoshan population included one subpopulation, DLS P1, including samples DLS_1-DLS_3. Fanyang population included one subpopulation FY1, including sample FY_1. The Fanyang population belongs to the Wuzhishan region. Regional population division, longitude, latitude, and sample number are shown in Table 1.
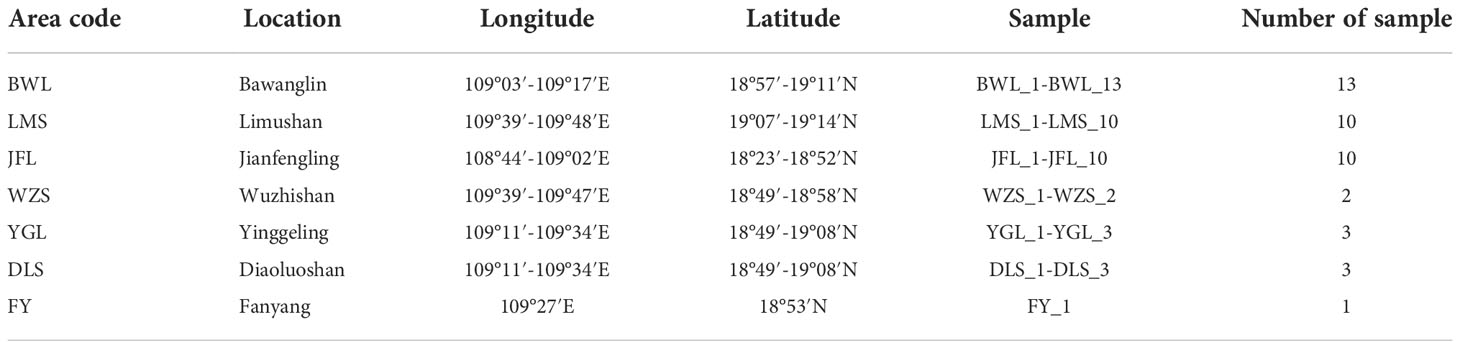
Table 1 The list of information for Hopea hainanensis sample collection in Hannan Island.
2.3 Methods
2.3.1 Sample DNA extraction and quality testing
42 H. hainanensis leaf samples were extracted with a Biotech (Beijing, China) DNA extraction kit (Plant no. DP305) under the standard operating procedure. After DNA extraction, the quality and concentration of DNA samples should be tested. Qubit was used to determine the concentration of DNA samples, and AGE was used to detect the quality of DNA samples (Wang et al., 2015).
2.3.2 Construction and sequencing of genomic GBS library
The quality and concentration of the extracted DNA were tested to be qualified and then sent to Hangzhou Lianchuan Biotechnology Co., Ltd. for GBS library construction and sequencing. RsaI-HaeIII digestion was used for digestion. The high-throughput sequencing library was prepared through terminal repair, A-tail addition, sequencing adaptor addition, purification, PCR amplification, and so on. The library was purified by electrophoresis and gluing according to the preset scheme. The gluing range of the library was 450-500bp to select the library with the length of the inserted fragment in the target interval for subsequent sequencing. Only libraries that had been screened for fragment length were qualified for sequencing. The sequencing platform was Illumina Nova6000, and the sequencing mode was PE150.
2.3.3 SNP mining in H. hainanensis genome
After the sequencing data is taken off the machine, the raw read data obtained by sequencing is quality-controlled, and low-quality sequences and splice sequences are removed to obtain a clean read. After that, all samples’ reads are clustered, similar reads are clustered together as a tag, and the consensus sequence is generated. Then, the data were aligned with the consensus sequence by the individual, and the Clean Read data were aligned with the consensus sequence. GATK software and SAMTOOLS software were used for SNP detection, and the quality filtering of the detected mutation sites was carried out. The evolutionary analysis was based on SNP data. Before evolutionary population analysis, SNPs were filtered according to the minor allele frequency (MAF) > 0.05 and data integrity > 80% (i.e., no more than 20% of individual genotypes were missing).
2.3.4 Phylogenetic tree analysis of H. hainanensis
The phylogenetic tree is a diagram used to describe the genetic differentiation relationship between species. According to the evolutionary relationship between different sources and different types of organisms, all kinds of organisms are placed on the branching tree diagram. The evolution process and the relationship between these organisms are succinctly described. Based on SNP, 1000 replicates of the PDIST model were obtained as phylogenetic trees of all samples based on the neighbor-joining algorithm of MEGA software (Dieckmann et al., 2016).
2.3.5 Principal component analysis
Principal Components analysis (PCA) was performed based on SNP to obtain the clustering of Principal components of all samples. Through PCA analysis, it can be known which samples have short genetic distances and close relatives. The samples with long genetic distances and distant relatives are helpful for population genetic evolution analysis.
2.3.6 Analysis of population genetic structure
Population genetic structure analysis can provide information on the origin and composition of individual lineage. Based on SNP, the population structure of all samples was analyzed by ADmixture software, and the number of clusters (K value) was assumed to be 1-10, respectively. Different K values represent the distribution of ancestral genetic material of different populations under the assumption that there are K ancestral groups.
2.3.7 Analysis of the genetic relationship
Based on SNP, the genetic distance between pairs of all samples was calculated. We can get the relative distance between samples by analyzing genetic distance data, which can assist the evolution analysis. In the phylogenetic heat map, the redder the color, the closer the relationship between the two individuals on the horizontal and vertical axes, the large area of red in the phylogenetic heat map between multiple individuals indicates that these individuals may constitute a closely related family group. Conversely, the bluer the heat map, the more distant the relatives.
3 Results
3.1 The quality of sequencing
After GBS sequencing, 28.09 Gb of Raw READ data were obtained from 42 H. hainanensis samples. After removing low-quality sequences, sequences containing more than 5% N (N represents undetermined base information), and adapter sequences, 27.85 Gb of high-quality sequencing data (Clean data) was obtained. The average size of each sample is 0.66 Gb. The average proportion of base error rate below 1% (Q20) was 96.66%, and the average proportion of base error rate below 0.1% (Q30) was 91.34%, indicating the high quality of sequencing. The average ratio (GC content) of guanine (G) and cytosine (C) among the four bases of DNA was 47.84%, indicating that the distribution was reasonable. The data overview of each sample is shown in Table 2.
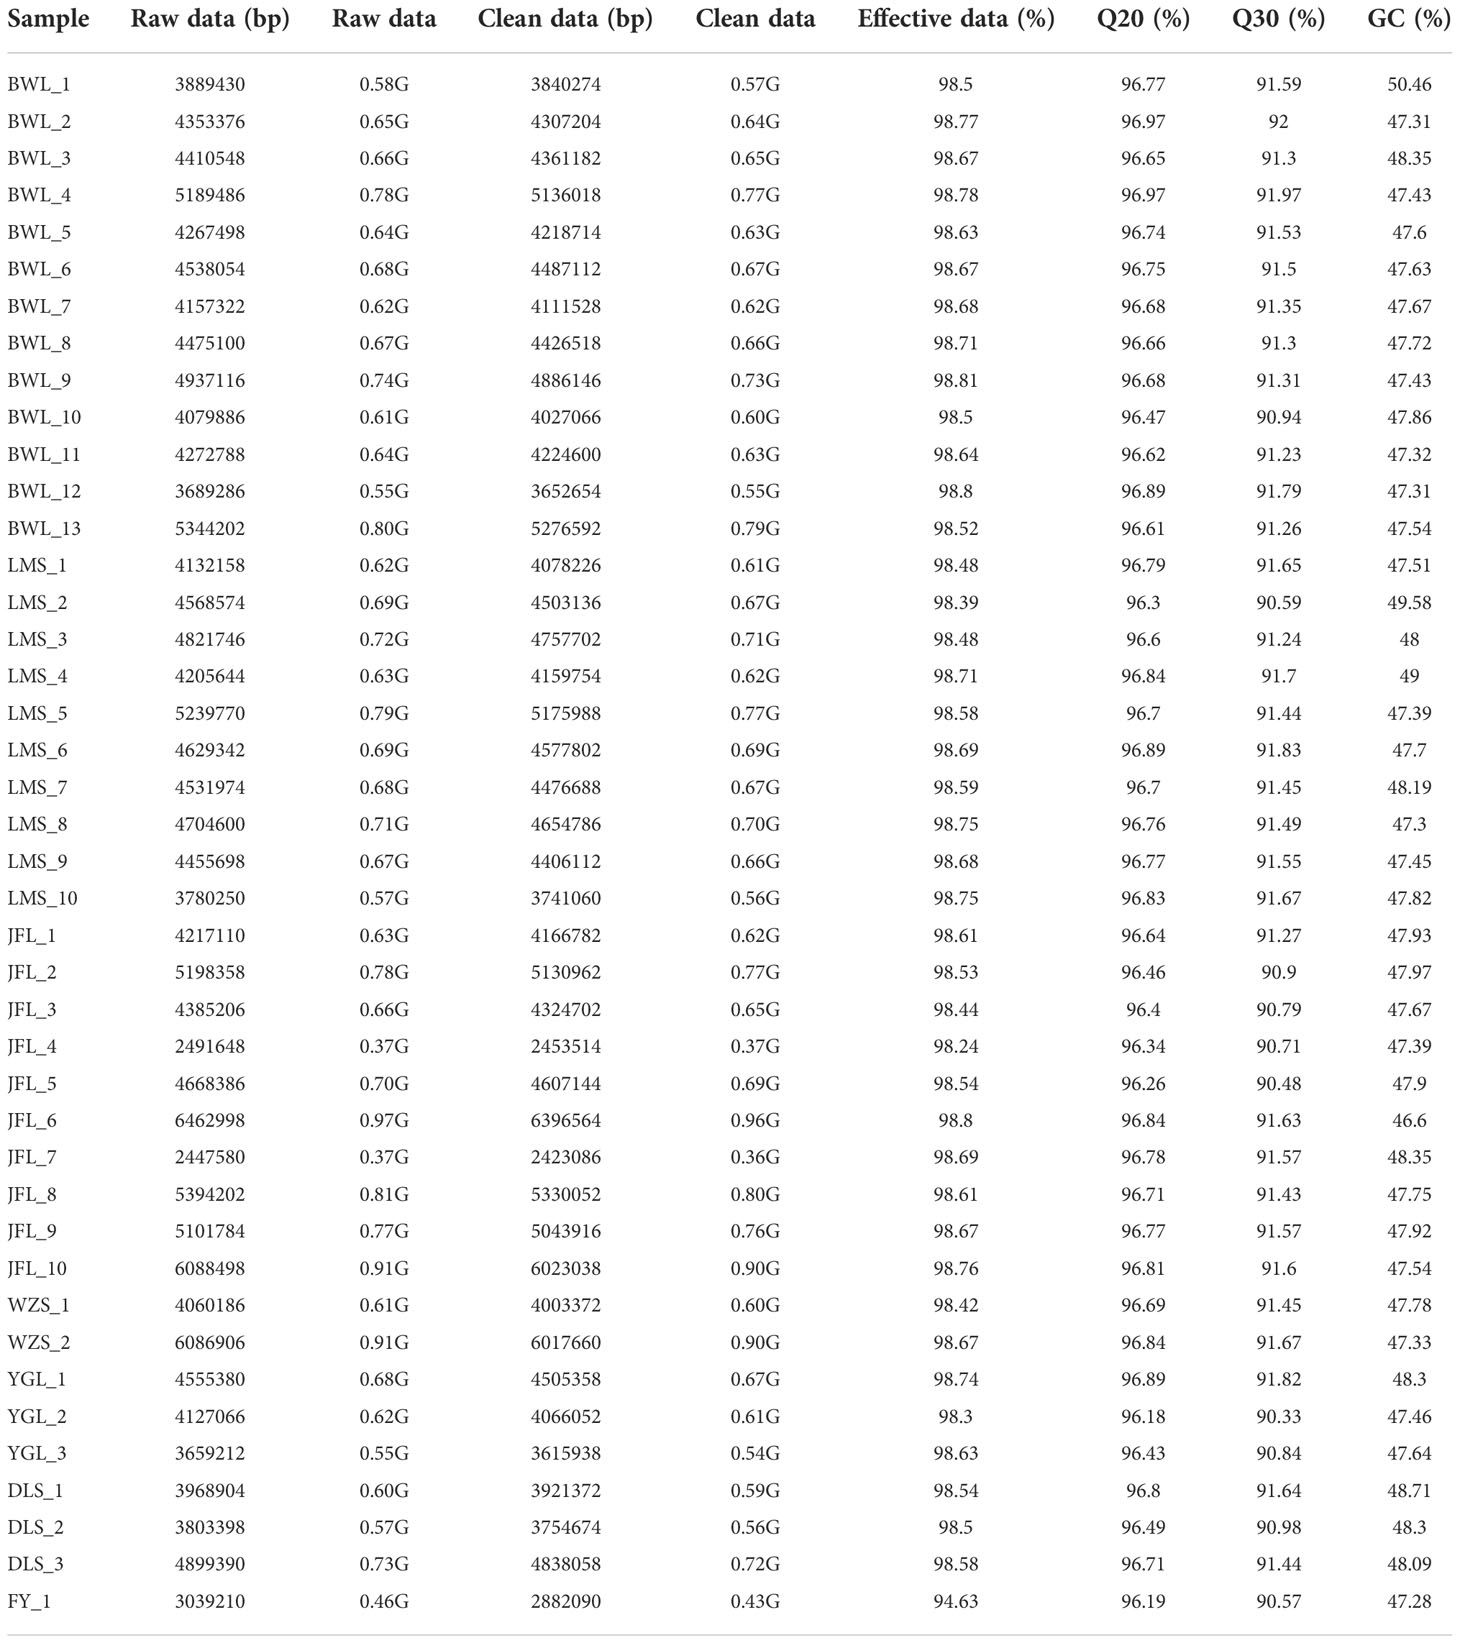
Table 2 The materials used in this study and overview of the GBS dataset.
3.2 SNP site mining
After comparing the data to the consensus sequence, GATK and SAMTOOLS software were used for mutation detection (Wright et al., 2019). SNPs consistently output by the two software were retained as reliable loci. According to the criteria of MAF >0.05 and data integrity >0.8, SNP data were further processed and filtered to retain SNPS with polymorphisms. After filtering the SNPs obtained, 430376 high-quality SNPs were finally obtained for subsequent analysis. It can be seen from the following Table 3 that the heterozygosity of the Fanyang population (FY) is relatively high, which may be related to the fact that the Fanyang population has only one sample, the sample size is small, the width of the genetic variation is insufficient and other factors, so there is not enough sample data for comparative analysis of the genetic diversity in this population. The heterozygosity of the other six populations ranged from 19.26% to 20.34%, with average heterozygosity of 19.77%, indicating a low level of genetic diversity.
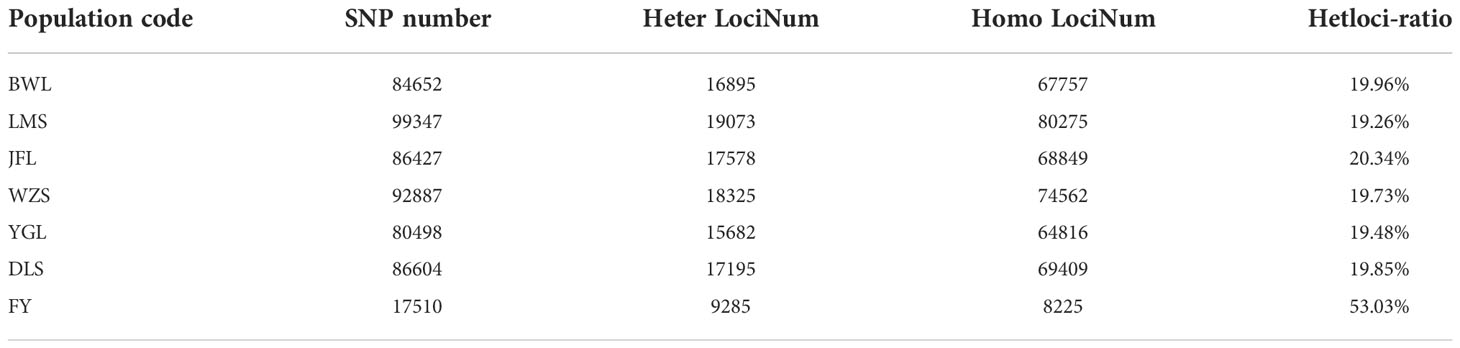
Table 3 SNP Statistical results.
3.3 Genetic evolution and population analysis
3.3.1 Phylogenetic evolutionary tree
The identified high-quality SNPs were used for phylogenetic analysis of the 42 H. hainanensis resources. After 1000 repetitions based on the PDIST model, the neighbor-joining algorithm of MEGA software was used to perform evolutionary analysis on all samples, and the phylogenetic tree of 42 H. hainanensis sample resources was obtained (Figure 2). Samples from the same sampling site were relatively closer to each other. However, the relative distance between the samples from different sites means that the internal samples from different sampling sites in these seven population areas may have a common ancestor. The results showed that the 42 samples could be divided into two large groups, and each could be further divided into small subgroups. In general, the samples of the same geographical origin were relatively aggregated in the two large taxa. Still, the distribution was mixed in the small subgroups, and the samples of the same geographical origin were not completely merged into the same subgroup. Group I mainly include the resources from Diaoluoshan, Fanyang Mountain, and Yinggeling, and the resources from Wuzhishanare clustered into Group II. The resources from Limushan, Bawangling, and Jianfengling are distributed in both groups, and the distribution is relatively chaotic. The small subgroups clustered in group I were divided into three small independent subgroups, indicating a large difference in kinship distance between the large group and each other. The aggregation of samples in group II was relatively uniform. Therefore, although there is certain geographical isolation between the H. hainanensis resources of different population areas, there is no direct correlation between the clustering based on genetic distance and its geographical source.
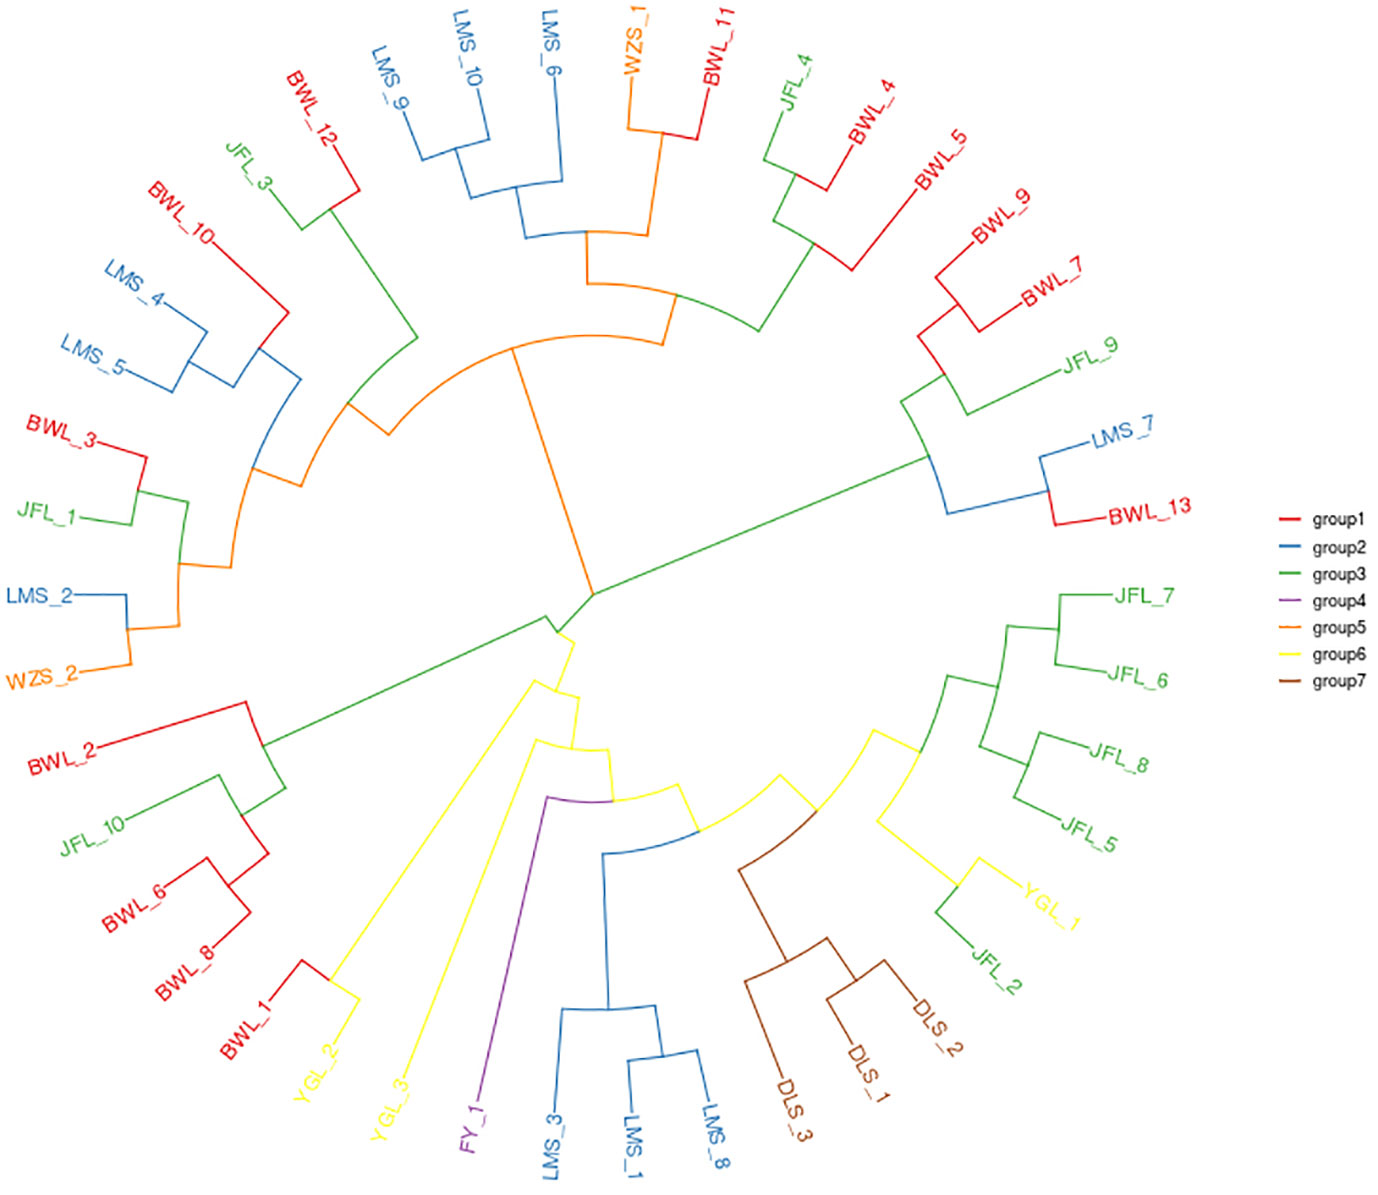
Figure 2 The neighbor-joining clustering of Hopea hainanensis in different Population.
3.3.2 Analysis of population genetic structure
To further verify the evolutionary genetic relationship between the samples and infer that the H. hainanensis population likely came from several ancestors. The genetic structure of the mutations in each sequencing sample was further studied. Based on SNP data, ADmixture software was used to analyze the population structure of all samples. Then, cluster analysis was performed, assuming that the number of clusters (K value) was 1-10. Different K values represent the distribution of ancestral genetic material of different populations under the assumption that there are K ancestral groups. Since K=1 cannot represent the distribution of ancestral genetic material of different populations, it is not shown in the figure. As shown in Figure 3, when K=2 and the sample are divided into two subgroups, the sample of group 1 is almost dark blue, and the sample of group 2 is almost light purple. The samples from Fanyang (FY), Diaoluoshan (DLS), Jianfengling (JFL), and Limushan (LMS) were clustered into group 2, and the remaining samples were clustered into group 1. In the Cross-Validation (CV) errors graph (Figure 4), when K=2, CV error achieves the minimum value, indicating that the genetic differences between samples are relatively large and the genetic relationship is distant. Therefore, it can be preliminarily concluded that the seven H. hainanensis populations in Hainan Island came from two different ancestors, and there was less gene exchange among them. In the table of genetic differentiation coefficients among populations (Table 4). The Fst values among the seven H. hainanensis populations ranged from -0.05258 to 0.29542. There was significant genetic differentiation (Fst > 0.25) between FY, WZS, and DLS populations. The genetic differentiation between DLS and BWL, WZS populations, and FY and BWL populations was significant (0.15 < Fst < 0.25). There was a moderate genetic differentiation between BWL and JFL, YGL, FY and LMS, JFL and DLS, and the other three populations (0.05 < Fst < 0.15). In addition, the genetic differentiation among other populations was low, so differentiation could not be considered (Fst < 0.05).
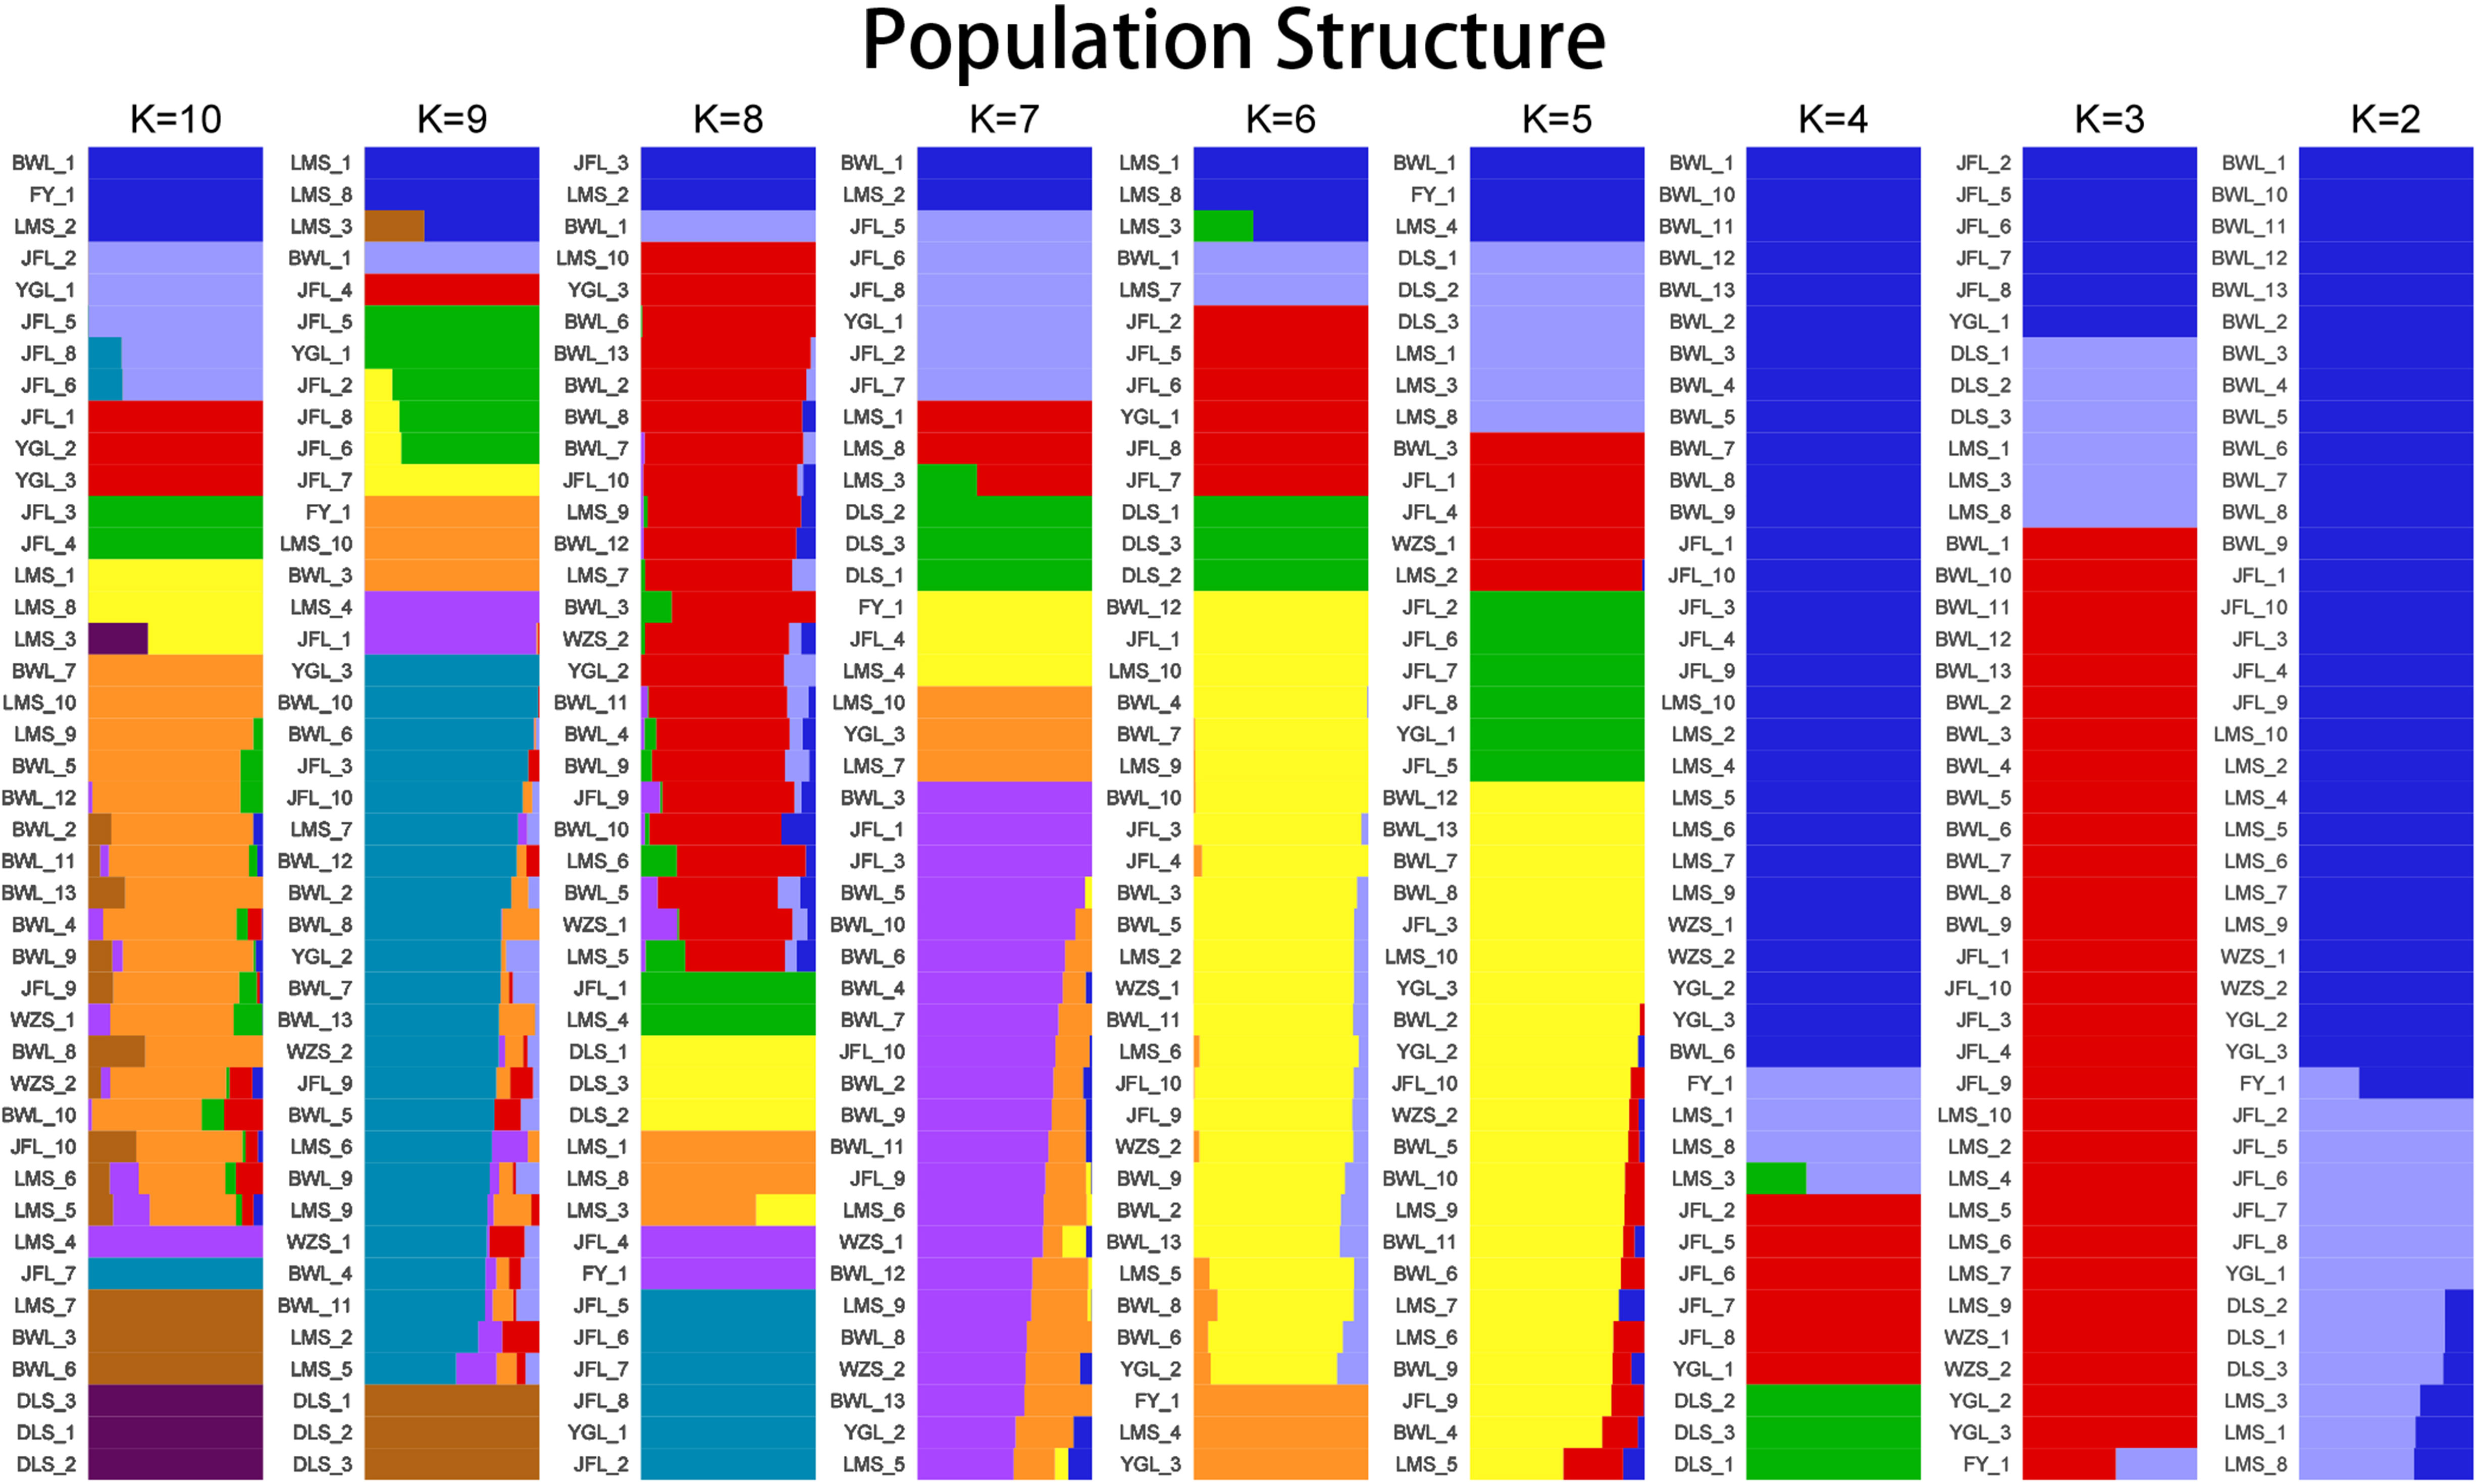
Figure 3 The population structure analysis on Hopea hainanensis.
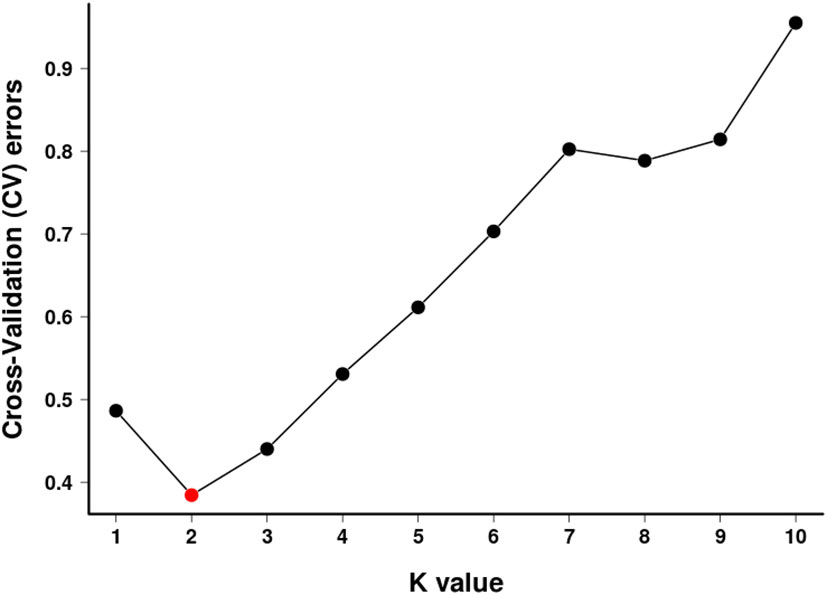
Figure 4 K selection of population structure.
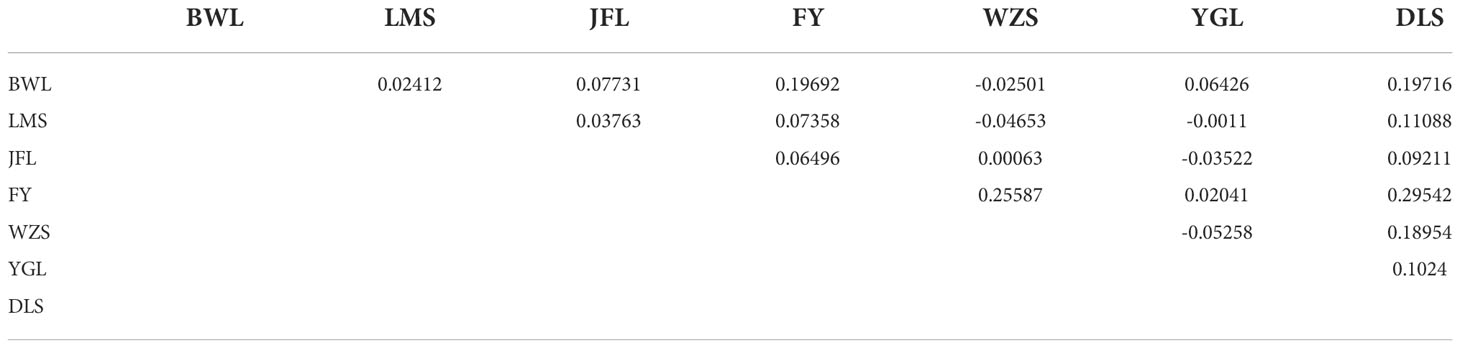
Table 4 Genetic differentiation coefficient(Fst: above diagonal).
3.3.3 Principal component analysis
Principal component analysis (PCA) was carried out on H. hainanensis population samples from Hainan Island to determine the evolutionary relationship among the populations further. When the geographical distance between groups is relatively close, PCA can better reflect the relationship between groups. Samples with similar genetic backgrounds will gather in the figure to form a cluster. The farther the distance between the two samples in the figure, the greater the genetic background difference between the two samples. As shown in the following figure (Figure 5), the 42 H. hainanensis were clustered to form three independent clusters, among which eight samples from Jianfengling (JFL_2, JFL_5-JFL_8), Limushan (LMS_3, LMS_8) and Yinggeling (YGL_1) populations with similar genetic backgrounds were clustered together to form cluster 1. Fanyang (FY_1), Wuzhishan(WZS_1-WZS_2), Bawangling (BWL1-BWL_13), Yingge Mountain (YGL_2, YGL_3), Jianfeng Mountain (JFL_1, JFL_3-JFL_4, JFL_9-JFL_10) and Limushan (LMS_1, LMS_2, LMS_4-L). The 31 samples from the six populations of MS_7, LMS_9, and LMS_10 were clustered together with similar genetic backgrounds to form cluster 2. The population of DLS_1-DLS_3 was far away from the other 2 clusters, showing a long genetic distance, so the population of DLS_1-DLS_3 formed a cluster alone.
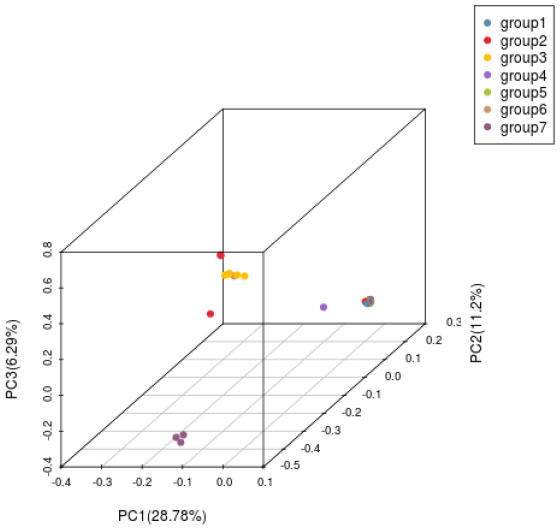
Figure 5 Principal component analysis diagram of H. hainanensis.
3.3.4 Analysis of the genetic relationship
In the relatedness heatmap (Figure 6), the relatedness coefficient was more significant than 0.4 (between the three samples of DLS_1, DLS_2, and DLS_3). The relatedness among the three samples of Diaoluoshan was very close. The genetic distance between LMS_8 and LMS_1 was very close in the relatedness heatmap. It can be concluded that the samples in the same population are more closely related, and the more distant the geographical location, the more complex the gene exchange, and the more distant the genetic relationship. The six samples, YGL_1, JFL_2, and JFL_5-JFL_8, are closely related. The three samples from Diaoluoshan (DLS_1-DLS_3) and Limushan (LMS_1) are just between 0.2 and 0.3. This indicates that there is still some genetic exchange between clusters under geographical isolation.
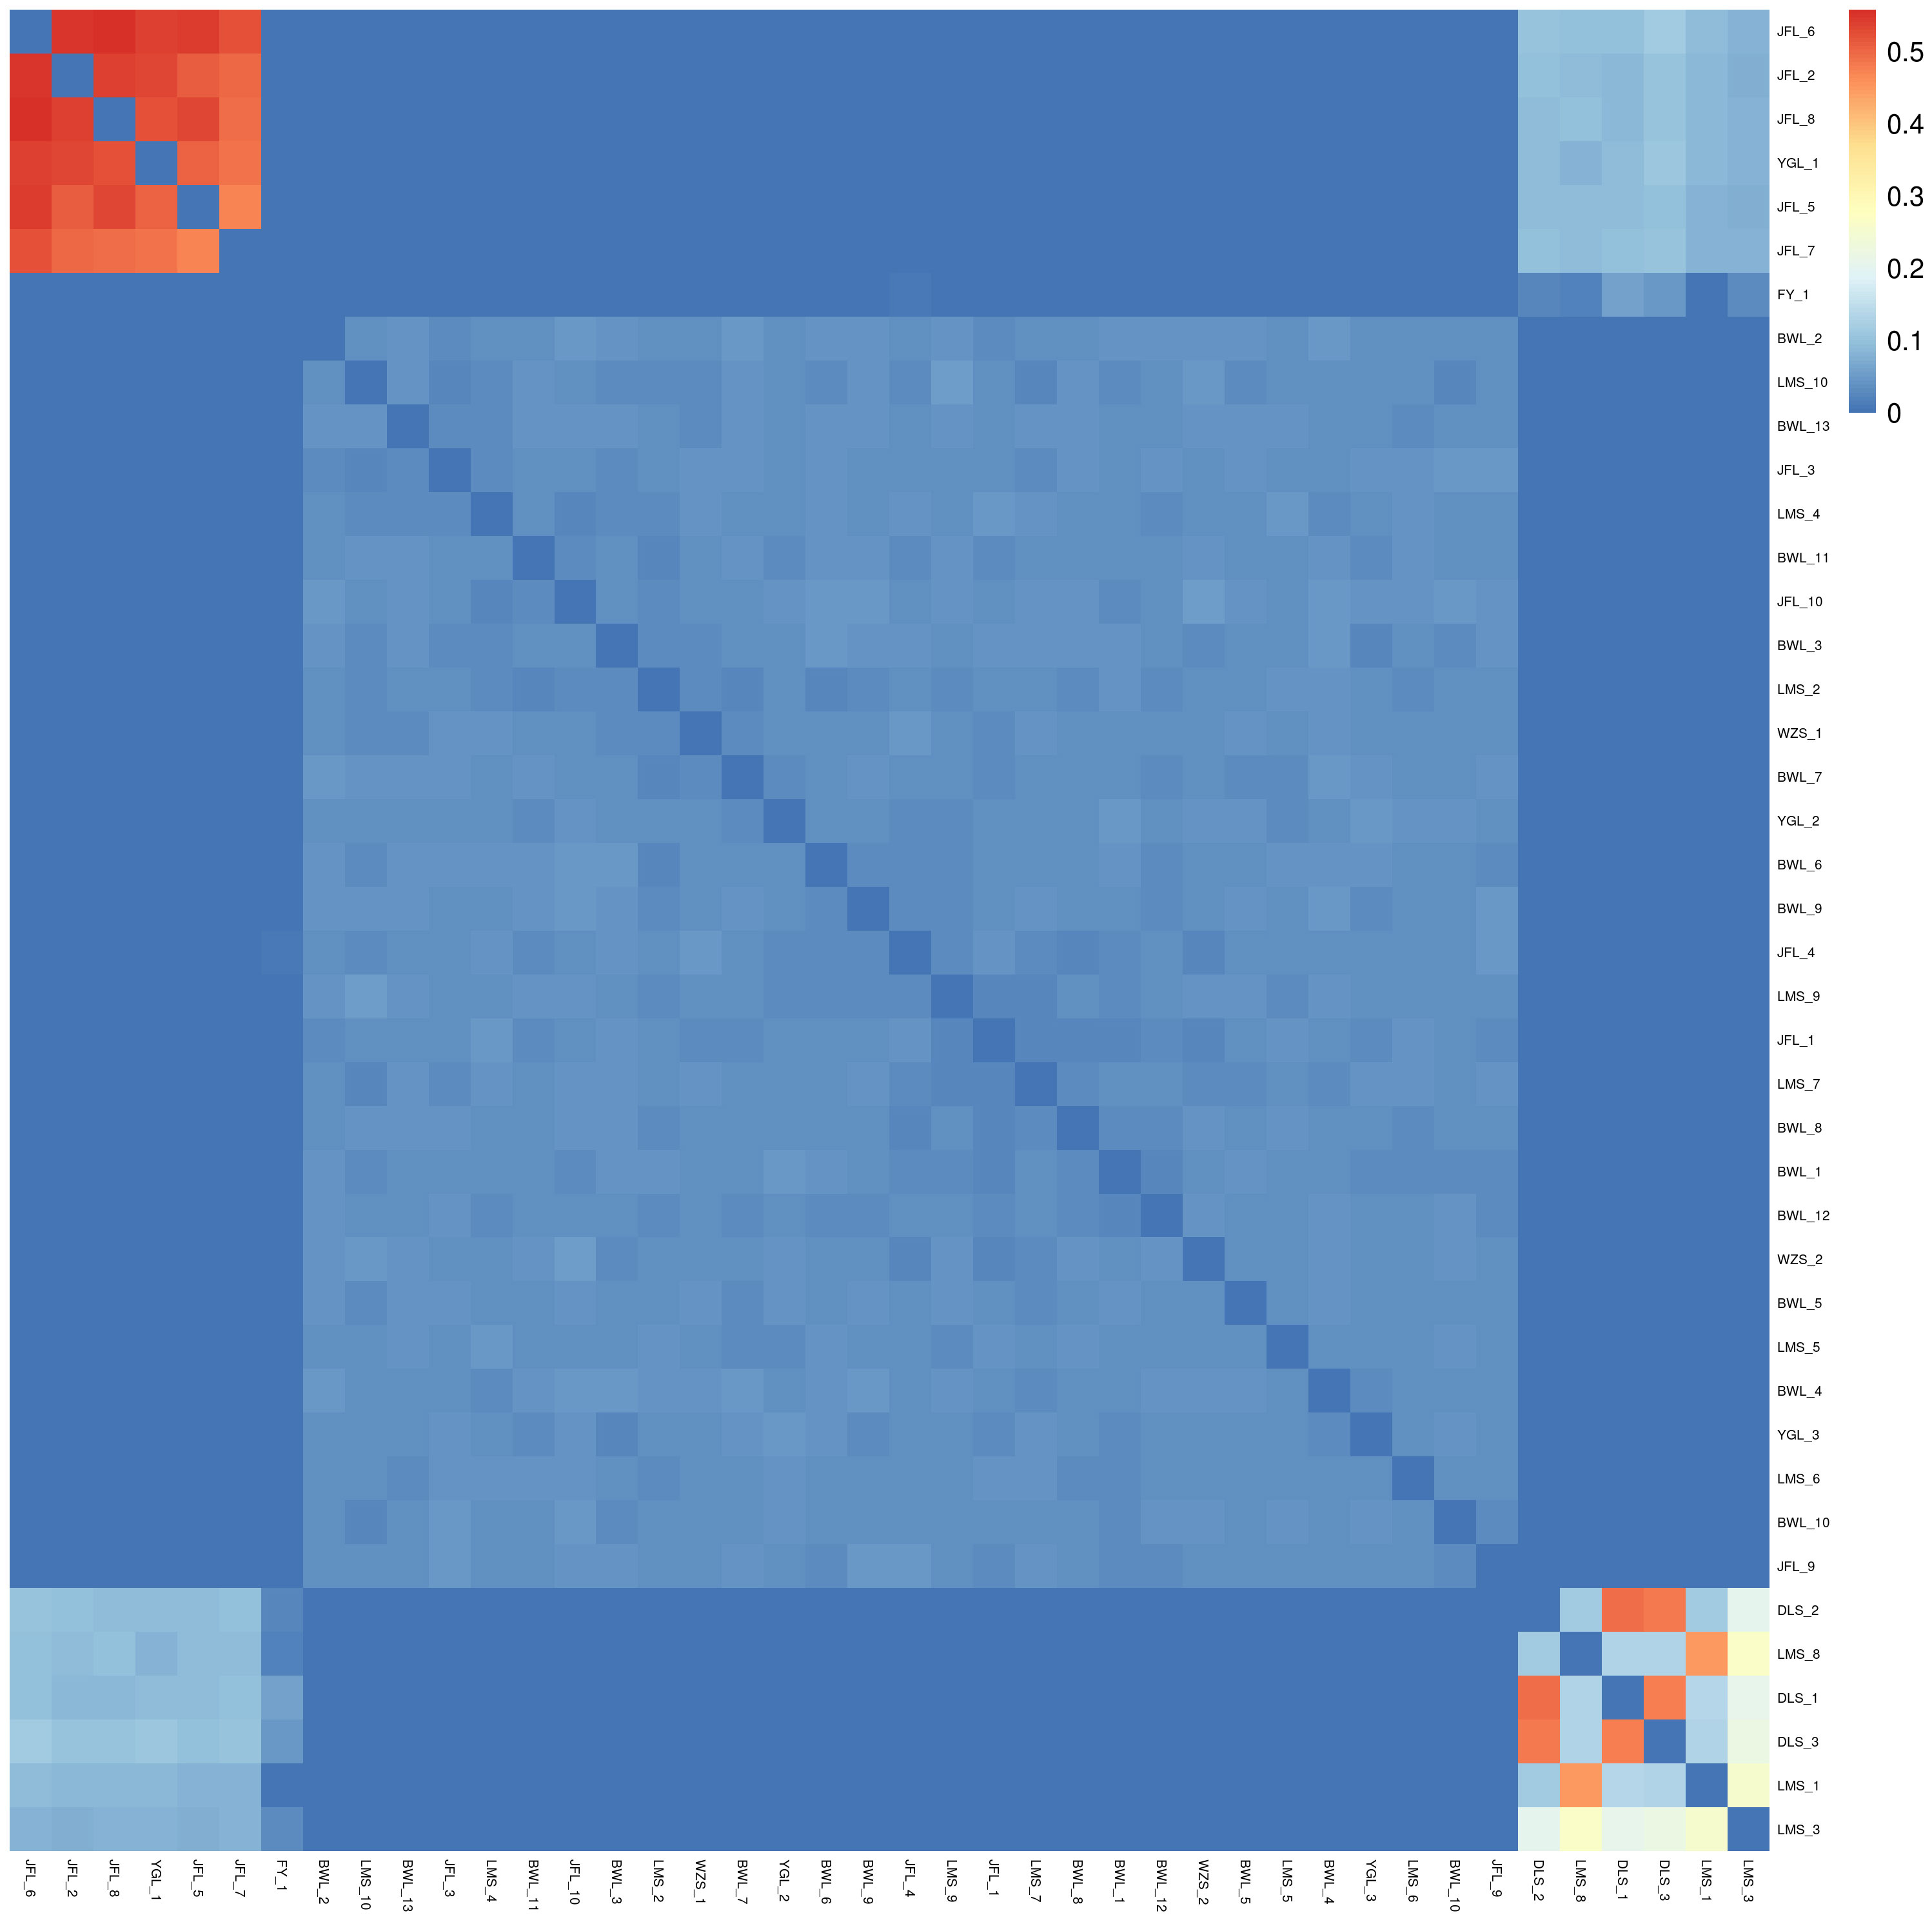
Figure 6 Ties of consanguinity.
4 Discussion
4.1 Genetic diversity in Hopea hainanensis
SNP variation is the most important and widespread type of sequence variation in the plant genome, which can be easily identified by sequence alignment (Fang et al., 2014). In this study, 48795 high-quality SNPs were obtained by screening and filtering. In the natural state of H. hainanensis field, the ecological range of the population is wide. The seeds are winged nuts, and the germination rate is high. Still, the seeds have higher requirements for germination conditions in the natural environment, which restricts the development of the population (Trang and Triest, 2019). Even if the H. hainanensis seeds can germinate and grow into seedlings in the natural population, the H. hainanensis seedlings are easy to be eliminated due to their weak competitiveness, resulting in few remaining adult H. hainanensis plants and weak natural regeneration ability of the population in the field (Kenta et al., 2004; Mehmood et al., 2021). The population density was very low, leading to the population’s weak reproductive ability and stress resistance and slow natural recovery and development. Genetic diversity is lost when the effective population shrinks and mating is switched from outcrossing to selfing (Ellegren and Galtier, 2016; Cai et al., 2021). It is most likely that a severe demographic bottleneck is responsible for the low genetic diversity of H. hainanensis populations. Over the past 300 years, this species has lost about 70% of its population (Ly et al., 2018). In the 20th century, Hainan Island’s deforestation increased rapidly. About 80% to 95% of the primary forests have been destroyed because of logging for wood on a large scale. Furthermore, transitions to rubber trees and Eucalyptus plantations, and the growth of cities (Lin et al., 2017; Chen et al., 2018; Sun et al., 2020). Due to the high quality of its wood, the number of H. hainanensis trees would go down proportionally, or maybe even more. There is a lack of genetic diversity analysis on the endangered mechanism of levees, especially on the genetic diversity of levees in different fragmented habitats.
Based on SNP, simplified genome sequencing analysis was performed on 42 H. hainanensis samples using GBS technology. After obtaining the data, genetic evolution and population analysis were performed, such as phylogenetic tree clustering analysis, population genetic structure analysis, principal component analysis, and phylogenetic relationship analysis. In principal component analysis, the contribution rates of the first principal component (PC1), the second principal component (PC2), and the third principal component (PC3) were 28.78%, 11.2%, and 6.29%, respectively. The contribution rates of the three principal components selected in this analysis were all low, and the total contribution rate was less than 50%. Therefore, there may be a deviation (difference) between the cluster results of PCA and the analysis results of other groups. In the principal component analysis, the genetic distance of the Diaoluoshan population was far from the other populations, and a single cluster was formed. Except for principal component analysis, the population structure of all samples, K value selection of population structure, and phylogenetic evolutionary tree analysis results showed that the cluster division was the same and supported the division of seven populations into two populations. Therefore, it is more reasonable to divide the 42 H. hainanensis samples from seven populations into two groups: Group 1 (Diaoluoshan, Limu shan, Yinggeling, Jianfengling) and Group 2 (Wuzhishan, Fanyang, Bawangling). In this study, high-throughput GBS sequencing was performed based on SNPs, and the analysis results may be limited due to the lack of reference genomes covering the whole genome of SNP.
4.2 Population genetic structure and differentiation in Hopea hainanensis
Genetic structure is influenced by many factors, such as breeding system, genetic drift, population size, seed dispersal, gene flow, evolutionary history, and natural selection (Konuma et al., 2000; Mehmood et al., 2020). The terrain of Hainan Island is low, flat ground, and high in the middle. The terrain takes Wuzhishan and Yinggeling as the uplifted core and drops progressively to the periphery. The mountain, hill, platform, and plain form a ring-stratified landform with an obvious cascade structure. The samples collected in this study were taken from Wuzhishan, Yinggeling Mountain, and adjacent forest reserves. In geographical location, the Jianfenglin population and Diaoluoshan population, Limushan between groups are far apart (> 100 km). Still, the smaller the genetic distance between the two groups (Fst = 0.09211), the existing gene flow between populations may have originated from the common ancestor of genetic exchange, carried by man-made factors, animals or other factors such as geological factors into the other group.
5 Conclusion
In order to improve genetic diversity among H. hainanensis populations, the H. hainanensis population resources of endangered plants should be effectively protected and developed. In order to protect H. hainanensis species, H. hainanensis seedlings may be protected ex situ due to their weak competitive ability and easy inhibition by mother trees. By conserving H. hainanensis seedlings ex-situ, we can reduce competition within the population and increase competition between poke stack populations. Genetic drift can also be reduced by increasing gene flow among small populations. Additionally, cross-introduction and breeding among the seven populations can improve genetic diversity.
6 Implications for conservation
Because the loss of genetic variation is a major threat to endangered species, preserving and restoring genetic variation is an important conservation action (Jiang et al., 2018; Cai et al., 2021). We discovered that genetic variation in the populations BWL, WZS and FY were low. These populations are more vulnerable to biotic and abiotic stresses, their conservation is critical. Furthermore, the populations DLS, YGL, JFL and LMS had higher levels of genetic diversity and contained more than one genetic subgroup. That populations could be used as seed sources for propagating seedlings and saplings in restoring Hainan Island’s previously logged lowland rainforests. It is difficult to regenerate native H. hainanensis populations because seedlings and saplings grow slowly and are frequently unable to establish themselves in heavily shaded conditions. To help restore endangered H. hainanensis populations on Hainan Island, select populations with high genetic diversity (e.g., for seedlings).
Data availability statement
The datasets presented in this study can be found in online repositories. The names of the repository/repositories and accession number(s) can be found in the article/supplementary material.
Author contributions
Conceptualization, LZ, MMN; methodology, YKC, HLZ, XTZ; software, HLZ, YKC, and MMN; validation, MMN; formal analysis, HLZ, LZ and MMN; investigation, YKC, and XTZ; resources, YKC; data curation, YKC; writing—original draft preparation, LZ, HLZ, HYZ, TTL, XTZ, YKC, and MMN; writing—review and editing, LZ, HLZ, HYZ, TTL, XTZ, YKC, and MMN; visualization, YKC; supervision, YKC; project administration, YKC; funding acquisition, YKC All authors have read and agreed to the published version of the manuscript. The data presented in the study are deposited in the Dryad repository.
Funding
This study was supported by the National Science Foundation of China (31760119), the National Science Foundation of Hainan Province (320MS038).
Conflict of interest
The authors declare that the research was conducted in the absence of any commercial or financial relationships that could be construed as a potential conflict of interest.
Publisher’s note
All claims expressed in this article are solely those of the authors and do not necessarily represent those of their affiliated organizations, or those of the publisher, the editors and the reviewers. Any product that may be evaluated in this article, or claim that may be made by its manufacturer, is not guaranteed or endorsed by the publisher.
References
Agoramoorthy, G. (2002). Hotspots: Earth's biologically richest and most endangered terrestrial ecoregions. J Mammal. 83 (2), 630–33.
Brown, A. H. D., Clegg, M. T., Kahler, A. L., Weir, B. S. (1991). “Plant population genetics,” in Breeding, and genetic resources (Sinauer, Sunderland), 43–63.
Cai, C., Xiao, J., Ci, X., Conran, J. G., Li, J. (2021). Genetic diversity of horsfieldia tetratepala (Myristicaceae), an endangered plant species with extremely small populations to China: Implications for its conservation. Plant Syst Evol. 307 (4), 1–12. doi: 10.1007/s00606-021-01774-z
Chen, H. X., Huang, C. T., He, F., Zheng, W., Feng, J. P. (2015). Review on research progress of Hopea hainanensis. Trop. Forestry 43 (4), 4–6. doi: 10.1007/s11274-008-9720-8
Chen, B., Xiao, X., Wu, Z., Yun, T., Kou, W., Ye, H., et al. (2018). Identifying establishment year and pre-conversion land cover of rubber plantations on hainan island, China using landsat data during 1987–2015. Remote Sens. 10 (8), 1240. doi: 10.3390/rs10081240
Dieckmann, R., Hammerl, J. A., Hahmann, H., Wicke, A., Kleta, S., Dabrowski, P. W., et al. (2016). Rapid characterisation of klebsiella oxytoca isolates from contaminated liquid hand soap using mass spectrometry, FTIR and raman spectroscopy. Faraday discussions 187, 353–375. doi: 10.1039/C5FD00165J
Ellegren, H., Galtier, N. (2016). Determinants of genetic diversity. Nat. Rev. Genet. 17 (7), 422–433. doi: 10.1038/nrg.2016.58
Fang, W. P., Meinhardt, L. W., Tan, H. W., Zhou, L., Mischke, S., Zhang, D. (2014). Varietal identification of tea (Camellia sinensis) using nanofluidic array of single nucleotide polymorphism (SNP) markers. Horticulture Res. 1. doi: 10.1038/hortres.2014.35
Ghazoul, J. (2016). Dipterocarp biology, ecology, and conservation (Oxford University Press). https://books.google.com/books
Hogarth, D. M., Cox, M. C., Bull, J. K. (1997). “Sugarcane improvement: past achievements and future prospects,” in Crop improvement for the 21st century, 1st edn. Ed. Kang, M. S. (Trivandrum: Research Signpost), 29–56.
Jiang, Z. G. (2019). China’s key protected species lists, their criteria and management. Biodiv Sci. 27 (6), 698–703. doi: 10.17520/biods.2019089
Jiang, Y., Liu, X., Xiang, W., Jiang, Y., He, Y. (2018). Genetic diversity and structure analysis of the endangered plant species horsfieldia hainanensis merr. in China. Biotechnol. Biotechnol. Equip. 32 (1), 95–101. doi: 10.1080/13102818.2017.1391122
Kardos, M., Armstrong, E. E., Fitzpatrick, S. W., Hauser, S., Hedrick, P. W., Miller, J. M., et al. (2021). The crucial role of genome-wide genetic variation in conservation. Proc. Natl. Acad. Sci. 118 (48), e2104642118. doi: 10.1073/pnas.2104642118
Kardos, M., Taylor, H. R., Ellegren, H., Luikart, G., Allendorf, F. W. (2016). Genomics advances the study of inbreeding depression in the wild. Evolutionary Appl. 9 (10), 1205–1218. doi: 10.1111/eva.12414
Kenta, T., Isagi, Y., Nakagawa, M., Yamashita, M., Nakashizuka, T. (2004). Variation in pollen dispersal between years with different pollination conditions in a tropical emergent tree. Mol. Ecol. 13 (11), 3575. doi: 10.1111/j.1365-294X.2004.02345.x
Konuma, A., Tsumura, Y., Lee, C. T., Lee, S. L., Okuda, T. (2000). Estimation of gene flow in the tropical-rainforest tree Neobalanocarpus heimii (Dipterocarpaceae), inferred from paternity analysis. Mol. Ecol. 9 (11), 1843–1852. doi: 10.1046/j.1365-294x.2000.01081.x
Li, G. Y., Chen, F. F., Yang, Z. L. (2015). Studies on seedling cultural techniques of Hopea hainanensis. Trop. Fores. 43, 7–9. doi: 10.3969/j.issn.1672-0938.2015.04.002
Lin, S., Jiang, Y., He, J., Ma, G., Xu, Y., Jiang, H. (2017). Changes in the spatial and temporal pattern of natural forest cover on hainan island from the 1950s to the 2010s: Implications for natural forest conservation and management. PeerJ 5, e3320. doi: 10.7717/peerj.3320
Ly, V., Nanthavong, K., Pooma, R., Hoang, V. S., Khou, E., Newman, M. F. (2018). Hopea hainanensis. IUCN Red List Threatened Species, 2018–2011. doi: 10.2305/IUCN.UK.2018-1.RLTS.T32357A2816074.en
Mehmood, S., Ahmed, W., Alatalo, J. M., Mahmood, M., Imtiaz, M., Ditta, A., et al. (2022). Herbal plants-and rice straw-derived biochars reduced metal mobilization in fishpond sediments and improved their potential as fertilizers. Sci. Total Environ. 826, 154043. doi: 10.1016/j.scitotenv.2022.154043
Mehmood, S., Ahmed, W., Ikram, M., Imtiaz, M., Mahmood, S., Tu, S., et al. (2020). Chitosan modified biochar increases soybean (Glycine max l.) resistance to salt-stress by augmenting root morphology, antioxidant defense mechanisms and the expression of stress-responsive genes. Plants 9 (9), 1173. doi: 10.3390/plants9091173
Mehmood, S., Ahmed, W., Rizwan, M., Imtiaz, M., Mohamed Ali Elnahal, A. S., Ditta, A., et al. (2021). Comparative efficacy of raw and HNO3-modified biochar derived from rice straw on vanadium transformation and its uptake by rice (Oryza sativa l.): Insights from photosynthesis, antioxidative response, and gene-expression profile. Environ. pollut. 289, 117916. doi: 10.1016/j.envpol.2021.117916
Mehmood, S., Saeed, D. A., Rizwan, M., Khan, M. N., Aziz, O., Bashir, S., et al. (2018). Impact of different amendments on biochemical responses of sesame (Sesamum indicum l.) plants grown in lead-cadmium contaminated soil. Plant Physiol. Biochem. 132, 345–355. doi: 10.1016/j.plaphy.2018.09.019
Nizamani, M. M., Harris, A. J., Cheng, X. L., Zhu, Z. X., Jim, C. Y., Wang, H. F. (2021). Positive relationships among aboveground biomass, tree species diversity and urban greening management in tropical coastal city of haikou. Ecol. Evol. 11, 12204–12219. doi: 10.1002/ece3.7985
Piry, S., Luikart, G., Cornuet, J. M. (1999). BOTTLENECK: A computer program for detecting recent reductions in the effective population size using allele frequency data. J. Hered 90 (4), 502–503. doi: 10.1093/jhered/90.4.502
Sarath Padmanabhan, T. S., Hemaprabha, G. (2018). Genetic diversity and population structure among 133 elite genotypes of sugarcane (Saccharum spp.) for use as parents in sugarcane varietal improvement. 3 Biotech. 8 (8), 1–12. doi: 10.1007/s13205-018-1364-2
Song, Y. B., Shen-Tu, X. L., Dong, M. (2020). Intraspecific variation of samara dispersal traits in the endangered tropical tree Hopea hainanensis (Dipterocarpaceae). Front. Plant Sci. 11, 599764. doi: 10.3389/fpls.2020.599764
Sun, R., Wu, Z., Chen, B., Yang, C., Qi, D., Lan, G., et al. (2020). Effects of land-use change on eco-environmental quality in hainan island, China. Ecol. Indic. 109, 105777. doi: 10.1016/j.ecolind.2019.105777
Trang, N. T. P., Triest, L. (2019). The genetics structure of three threatened Hopea species (Dipterocarpaceae) in the protected areas of Vietnam. Int. J. Appl. Nat. Sci. 8 (3), 191–204. doi: 10.4238/gmr.15028103
Wang, X., Li, J., Li, Y. (2015). Isolation and characterization of microsatellite markers for an endemic tree in East Asia,Quercus variabilis(Fagaceae). Appl. Plant Sci. 3 (6), 1500032. doi: 10.3732/apps.1500032
Wang, C., Ma, X., Ren, M., Tang, L. (2020). Genetic diversity and population structure in the endangered tree Hopea hainanensis (Dipterocarpaceae) on hainan island, China. PloS One 15 (11), e0241452. doi: 10.1371/journal.pone.0241452
Wang, C., Ma, X., Tang, L. (2021). Isolation and characterization of twelve polymorphic microsatellite markers in the endangered Hopea hainanensis (Dipterocarpaceae). Ecol. Evol. 11 (1), 4–10. doi: 10.1002/ece3.7077
Wang, F. G., Zhang, R. J., Xing, F. W., Ng, S. C., Ye, Y. S., Chen, H. Q. (2007). Rare and endangered plants and conservation in yinggeling nature reserve, hainan. J. Wuhan Botanical Res. 25 (3), 303–309. doi: 10.3969/j.issn.2095-0837.2007.03.017
Wright, B., Farquharson, K. A., McLennan, E. A., Belov, K., Hogg, C. J., Grueber, C. E. (2019). From reference genomes to population genomics: Comparing three reference-aligned reduced-representation sequencing pipelines in two wildlife species. BMC Genomics 20 (1), 1–10. doi: 10.1186/s12864-019-5806-y
Zhang, H. L., Cubino, J. P., Nizamani, M. M., Harris, A. J., Cheng, X. L., Da, L., et al. (2022). Wealth and land use drive the distribution of urban green space in the tropical coastal city of Haikou, China (Urban Forestry & Urban Greening), 127554. doi: 10.1016/j.ufug.2022.127554
Zhang, C., Sun, Z., Xing, Q., Sun, J., Xia, T., Yu, H. (2021). Localizing indicators of SDG11 for an integrated assessment of urban sustainability–a case study of hainan province. Sustainability 13 (19), 11092. doi: 10.3390/su131911092
Keywords: conservation biology, endangered tree, hopea hainanensis, SNP, GBS
Citation: Chen Y, Zhang H-L, Zhang L, Nizamani MM, Zhou T, Zhang H and Liu T (2022) Genetic diversity assessment of Hopea hainanensis in Hainan Island. Front. Plant Sci. 13:1075102. doi: 10.3389/fpls.2022.1075102
Received: 20 October 2022; Accepted: 18 November 2022;
Published: 07 December 2022.
Edited by:
Mehedi Masud, Taif University, Saudi ArabiaReviewed by:
Shahbaz Khan, Huazhong Agricultural University, ChinaSajid Mehmood, Guangzhou University, China
Copyright © 2022 Chen, Zhang, Zhang, Nizamani, Zhou, Zhang and Liu. This is an open-access article distributed under the terms of the Creative Commons Attribution License (CC BY). The use, distribution or reproduction in other forums is permitted, provided the original author(s) and the copyright owner(s) are credited and that the original publication in this journal is cited, in accordance with accepted academic practice. No use, distribution or reproduction is permitted which does not comply with these terms.
*Correspondence: Li Zhang, ODEwMjE3NzYxQHFxLmNvbQ==; Mir Muhammad Nizamani, bWlybW9oYW1tYWRuaXphbWFuaUBvdXRsb29rLmNvbQ==
†These authors share first authorship