 Tyrone Possamai
 Sabine Wiedemann-Merdinoglu
- 1CREA—Research Centre for Viticulture and Enology, Conegliano, Italy
- 2INRAE Centre Grand Est-Colmar, UMR 1131, Colmar, France
Vitis vinifera is the most widely cultivated grapevine species. It is highly susceptible to Plasmopara viticola and Erysiphe necator, the causal agents of downy mildew (DM) and powdery mildew (PM), respectively. Current strategies to control DM and PM mainly rely on agrochemical applications that are potentially harmful to humans and the environment. Breeding for resistance to DM and PM in wine grape cultivars by introgressing resistance loci from wild Vitis spp. is a complementary and more sustainable solution to manage these two diseases. During the last two decades, 33 loci of resistance to P. viticola (Rpv) and 15 loci of resistance to E. necator (Ren and Run) have been identified. Phenotyping is salient for QTL characterization and understanding the genetic basis of resistant traits. However, phenotyping remains a major bottleneck for research on Rpv and Ren/Run loci and disease resistance evaluation. A thorough analysis of the literature on phenotyping methods used for DM and PM resistance evaluation highlighted phenotyping performed in the vineyard, greenhouse or laboratory with major sources of variation, such as environmental conditions, plant material (organ physiology and age), pathogen inoculum (genetic and origin), pathogen inoculation (natural or controlled), and disease assessment method (date, frequency, and method of scoring). All these factors affect resistance assessment and the quality of phenotyping data. We argue that the use of new technologies for disease symptom assessment, and the production and adoption of standardized experimental guidelines should enhance the accuracy and reliability of phenotyping data. This should contribute to a better replicability of resistance evaluation outputs, facilitate QTL identification, and contribute to streamline disease resistance breeding programs.
Introduction
Grapevine species of the genus Vitis display susceptibility, partial, or total resistance to Plasmopara viticola Berl. & De Toni, the causal agent of downy mildew (DM), and to Erysiphe necator Sch., the causal agent of powdery mildew (PM). Vitis vinifera L. is the most cultivated grapevine species worldwide, but most of its accessions are highly susceptible to both P. viticola and E. necator. DM and PM have devastating impacts on grapevine cultivation (Gessler et al., 2011; Gadoury et al., 2012). Long-lasting research has focused on strategies to control the pathogens of these two diseases (Pertot et al., 2017), including the introgression of resistance from wild grapevine accessions into elite wine grape cultivars (Töpfer et al., 2011; Merdinoglu et al., 2018; Yobrégat, 2018; Töpfer and Trapp, 2022).
The oomycete P. viticola and the ascomycete E. necator (synonym Uncinula necator Burr.) are obligate, biotrophic and polycyclic pathogens, affecting all green organs of their host (Gessler et al., 2011; Gadoury et al., 2012). Plasmopara viticola grows optimally under high relative humidity (RH) and mild temperatures (Caffi et al., 2013; Mouafo-Tchinda et al., 2021), while E. necator has an optimal growth at 85% RH and 26°C (Carroll and Wilcox, 2003). Under ideal conditions, pathogens develop several cycles of clonal reproduction, causing severe damage to fruit quality and yield. The application of fungicides is commonly used to mitigate the impact of DM and PM in the vineyard, although these agrochemicals can be potentially harmful to humans and the environment (Komárek et al., 2010; Nicolopoulou-Stamati et al., 2016).
American and Asian Vitis spp. are frequently studied for disease resistance traits (Staudt and Kassemeyer, 1995; Staudt, 1997; Cadle-Davidson, 2008; Cadle-Davidson et al., 2011) (Tables 1, 2). Most wild grape accessions exhibit partial resistance to P. viticola and E. necator, affecting several stages of the pathogen life cycle, including the infection frequency, rate of tissue colonization, duration of the latent period, and production of spores without halting the infection (Parlevliet, 1979). A very few Vitis species display total resistance to P. viticola and E. necator with limited pathogen development and an incomplete pathogen life cycle. Research on new germplasms has recently identified resistant V. vinifera cultivars with partial resistance to DM and PM in comparison with other Vitis spp. (Hoffmann et al., 2008; Coleman et al., 2009; Riaz et al., 2020; Sargolzaei et al., 2020; Possamai et al., 2021).
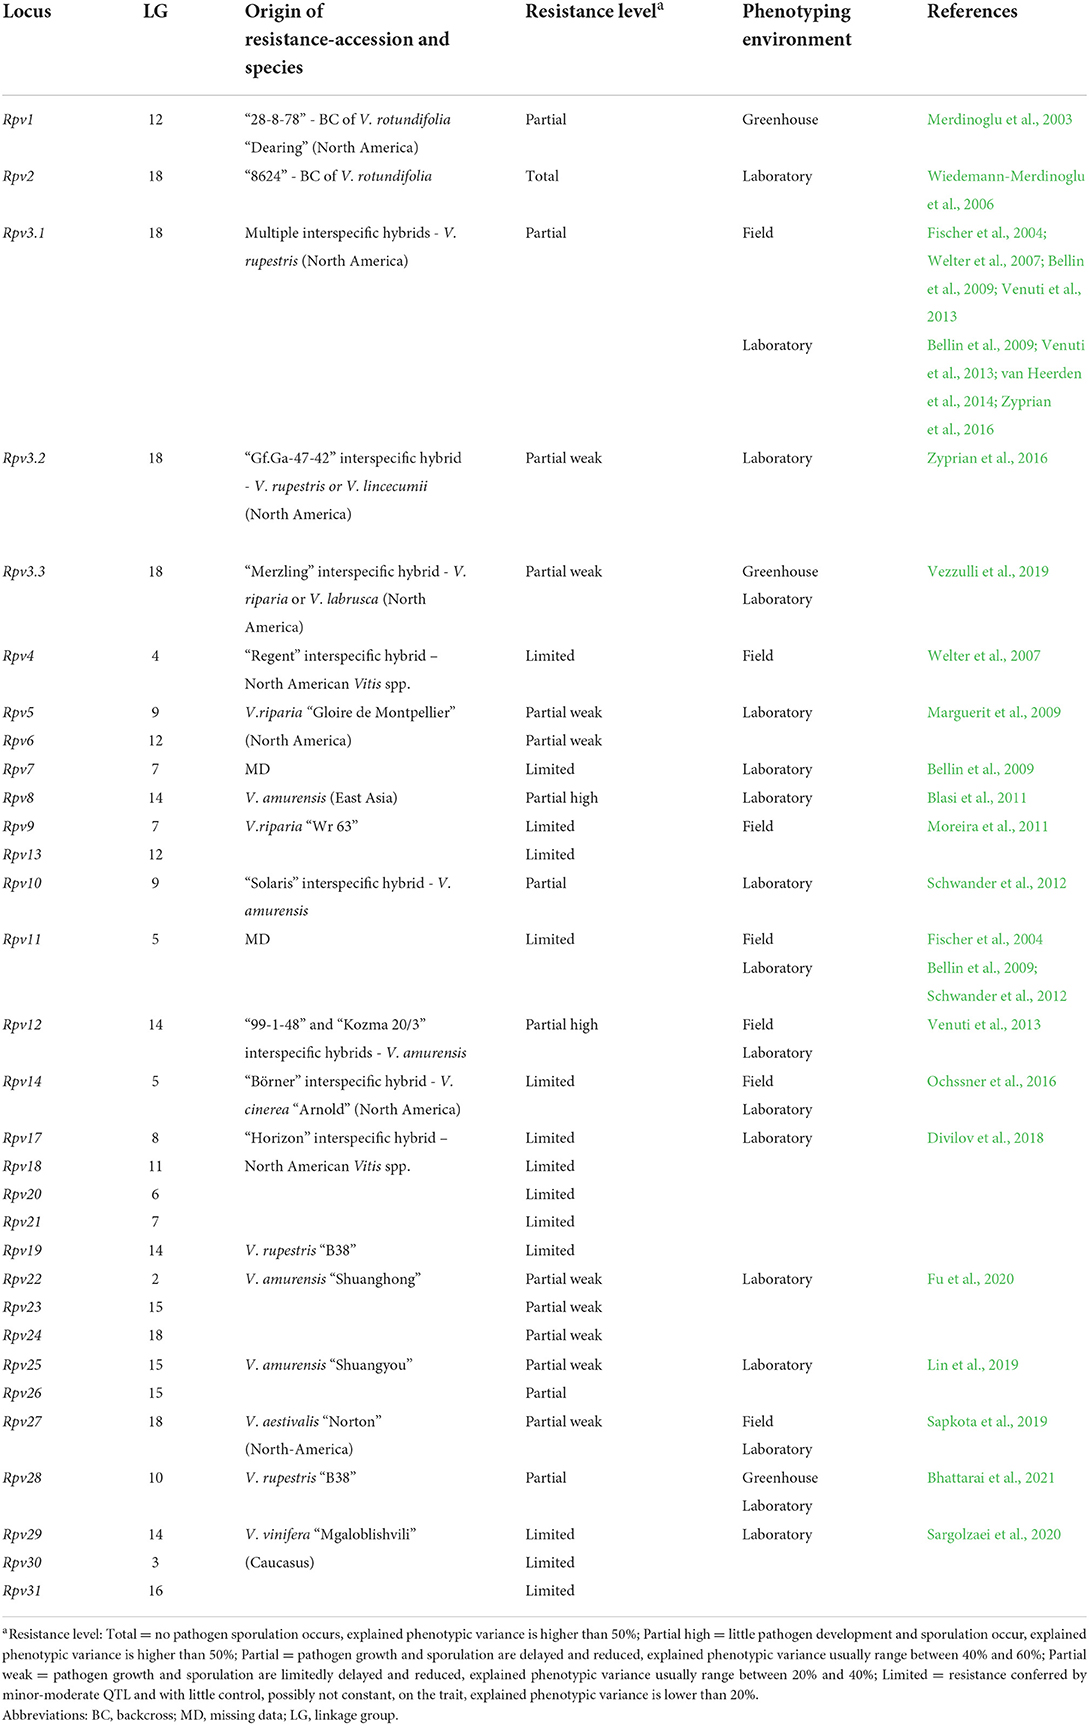
Table 1. Loci of resistance to P. viticola (Rpv) identified in grapevine. Resistance loci are listed with information about the grapevine accession/species of origin, the putative level of resistance associated with the locus and the environment of phenotyping utilized in the mapping study.
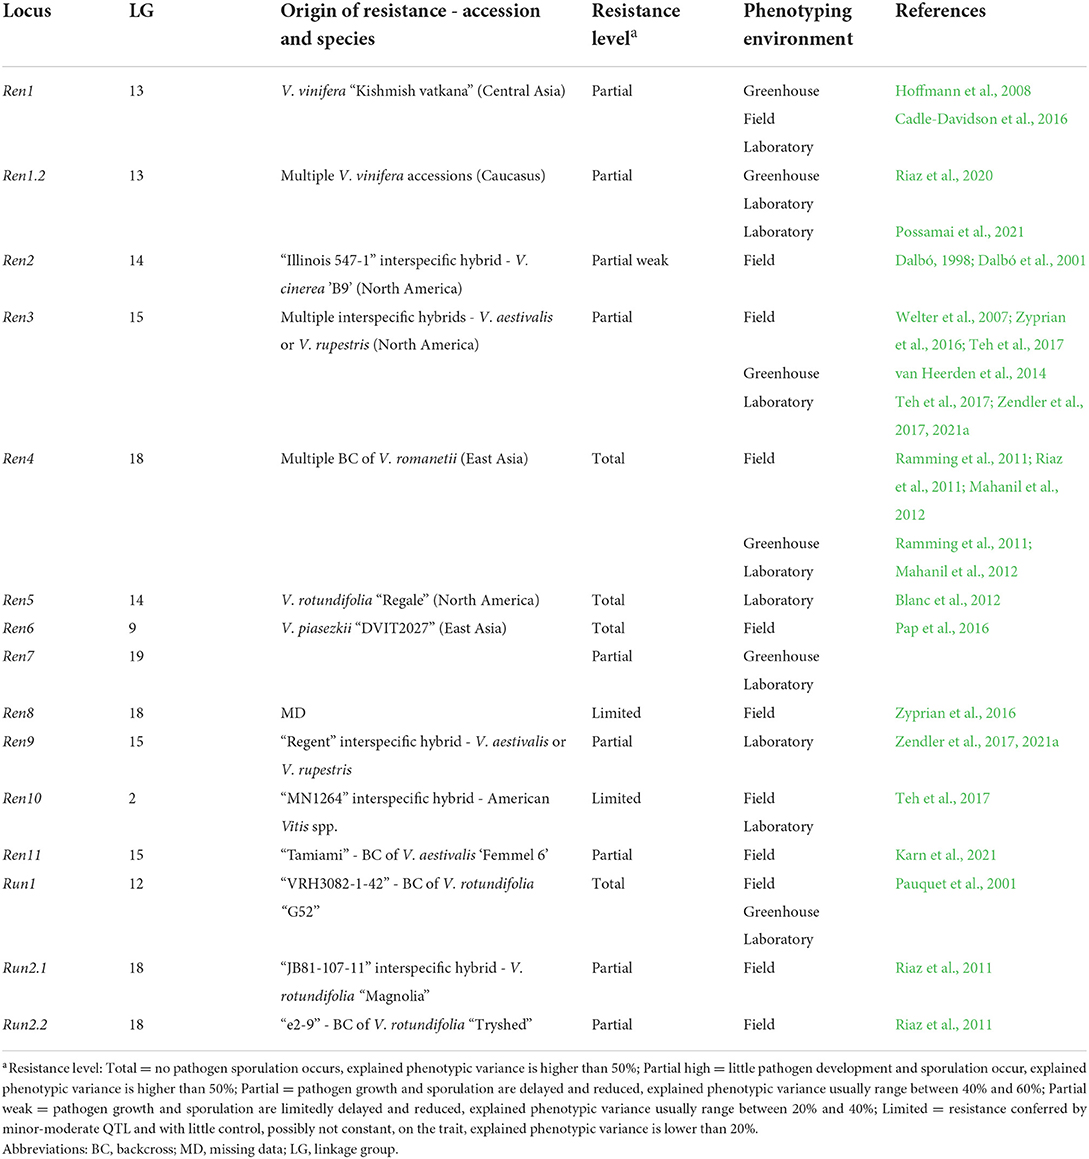
Table 2. Loci of resistance to E. necator (Ren and Run) identified in grapevine. Resistance loci are listed with information about the grapevine accession/species of origin, the putative level of resistance associated with the locus and the environment of phenotyping utilized in the mapping study.
The genetic basis of resistance traits in grapevine is usually identified through the biparental mapping approach with the construction of genetic maps performed by crossing two heterozygous parents and by separately analyzing their segregating markers in the progenies (pseudo-testcross mapping strategy; Grattapaglia and Sederoff, 1994). Selfing populations are an alternative to this approach (Blasi et al., 2011; Blanc et al., 2012). For quantitative trait loci (QTL) analyses, progenies are divided into groups according to the inherited genotypes and their phenotypes are compared to identify significant associations between traits and allelic variants.
Genetic maps and QTL analyses were influenced early on by the availability and reproducibility of markers. The lack of a genome reference maps created erroneous marker associations with different linkage groups, which made the comparison of studies and the interoperability of the results difficult (Marino et al., 2003; Marguerit et al., 2009). Currently, the use of high throughput sequencing technologies, more robust softwares and hardwares, and the availability of the grape reference genome (Jaillon et al., 2007; Canaguier et al., 2017) facilitate the discovery of thousands of molecular markers, the unification of linkage groups, the verification of the marker collinearity with the reference sequence, and the production of precise genetic maps (Hyma et al., 2015; Cadle-Davidson et al., 2016; Possamai et al., 2021).
To date, more than 50 populations have been genotyped and phenotyped to map QTL of resistance to P. viticola and E. necator. Mapping populations were generated by crossing V. vinifera with either wild Vitis spp. (Marguerit et al., 2009; Pap et al., 2016; Lin et al., 2019; Sapkota et al., 2019), backcross individuals (Pauquet et al., 2001; Riaz et al., 2011; Mahanil et al., 2012; Karn et al., 2021), or hybrid accessions (e.g., Welter et al., 2007; Bellin et al., 2009; Venuti et al., 2013; Vezzulli et al., 2019) (Tables 1, 2). Only one genome-wide association study (GWAS) based on both cross-generated individuals and natural grape cultivars was performed (Sargolzaei et al., 2020), and only two studies used pedigree information to characterize resistance QTL (Di Gaspero et al., 2012; Peressotti et al., 2015).
Genetic studies identified 33 loci of resistance to P. viticola (Rpv), and 15 loci of resistance to E. necator (Ren and Run) in American, Asian Vitis spp. and in some V. vinifera cultivars (Tables 1, 2) (Merdinoglu et al., 2018; Dry et al., 2019; https://www.vivc.de). Some Rpv and Ren/Run loci are labeled as major if they explain large phenotypic variance (usually more than 20%; Dalbó, 1998; Pauquet et al., 2001; Merdinoglu et al., 2003; Fischer et al., 2004; Blasi et al., 2011; Riaz et al., 2011, 2020; Blanc et al., 2012; Schwander et al., 2012; van Heerden et al., 2014; Zyprian et al., 2016; Teh et al., 2017; Zendler et al., 2017; Sapkota et al., 2019; Vezzulli et al., 2019; Bhattarai et al., 2021) and are stable across experiments. These loci confer total (Ramming et al., 2011; Blanc et al., 2012; Pap et al., 2016) or partial resistance (Dalbó et al., 2001; Pap et al., 2016; Lin et al., 2019; Possamai et al., 2021) (Tables 1, 2). Other loci are classified as minor or moderate when QTL have a limited control on the trait and pathogen development, usually up to 20% of explained phenotypic variance (Welter et al., 2007; Moreira et al., 2011; Schwander et al., 2012; Teh et al., 2017) and/or are mapped erratically in different replicates of the resistance evaluation (Fischer et al., 2004; Welter et al., 2007; Bellin et al., 2009; van Heerden et al., 2014; Zyprian et al., 2016; Lin et al., 2019) (Tables 1, 2).
In resistance mapping studies and loci characterization, phenotyping remains the main bottleneck. Indeed, sources of variation, such as environmental conditions, plant material, inoculum and inoculation of the pathogen and disease assessment method, affect resistance assessment and the quality of phenotyping data. In this review, we analyze different approaches used for phenotyping DM and PM resistance in grapevine, and discuss factors that contribute to the accuracy and reliability of phenotyping data, while exploring avenues for improvement.
Phenotyping of Vitis spp. resistance to P. viticola and E. necator in different environments
In the past 20 years, phenotyping strategies to map Rpv and Ren/Run loci showed a variability of protocols employed in different environments (vineyard, greenhouse or laboratory). This variability in loci characterization seems to be impacted by the receptivity of the plant material to infection, control of the pathogen inoculum, management of experimental conditions, and resistance variable assessed.
Vineyard assessments have been preferred for studying grapevine resistance to E. necator with 12 Ren/Run loci identified, while laboratory (in vitro) assays were more frequently used for P. viticola evaluations with at least 27 Rpv loci identified. Evaluations in the greenhouse have been used to a lower extent with only 3 Rpv and 7 Ren/Run loci characterized (Tables 1, 2).
Phenotyping in the vineyard
Resistance phenotyping in the vineyard has been performed since the 19th century (Töpfer et al., 2011; Yobrégat, 2018; Töpfer and Trapp, 2022). Candidate vines in a vineyard are assessed starting in the 3rd-year post-planting. Vines are maintained with or without a minimal fungicide protection, and scored for 2 (most of the studies) to 9 years (Karn et al., 2021). This approach enables the evaluation of resistance at the whole plant level under natural environmental conditions in the context of natural pathogen populations (that may vary over years) and polycyclic infections.
Plant material receptivity
Disease resistance in plants is genetically defined but, in some cases, is organ-specific (Hermanns et al., 2003; Strugala et al., 2015). For grapevine, cases with large differences in the level of resistance between organs (leaves and bunches) are quite rare and seem to apply to only a few accessions (Kennelly et al., 2005; Buonassisi et al., 2018). Leaves are the most rated organ for disease resistance, probably because they are numerous, available throughout the vegetative season, bidimensional, and can be scored for different variables. Resistance to DM and PM may also be assessed on berries, rachises, and canes in the vineyard (Riaz et al., 2011; Pap et al., 2016; Karn et al., 2021).
Environmental conditions may cause host stress-induced resistance and reduced DM and PM infections. For instance, temperatures below 8°C (Moyer et al., 2010), nutrient deficiency (Keller et al., 2003), and drought (Heyman et al., 2021) reduce the development and susceptibility of grapevine organs to diseases, delaying epidemics (Moyer et al., 2016). In addition, cultural strategies (soil tillage and fertilization) and stimulated grapevine growth increase both leaf and berry susceptibility to pathogens (Fernandes de Oliveira et al., 2021).
For grapevines growing under optimal conditions, resistance phenotypes are affected by the development stage of the organ, its physiology, and source-sink relationships. Young tissue shows higher susceptibility to DM and PM with the exception of very early leaves to P. viticola because of low stomata receptivity (Kennelly et al., 2007). Old grapevine tissue shows ontogenic resistance (Delp, 1954; Kennelly et al., 2005; Develey-Rivière and Galiana, 2007). For instance, leaves are less susceptible to E. necator after their physiological transition from sink to source status (Doster and Schnathorst, 1985; Calonnec et al., 2018). They are also characterized by an overexpression of pathogenesis-related (PR) protein genes, and ethylene and phenylpropanoid pathways (Calonnec et al., 2021). The ontogenic resistance process is promoted by stress and appears to be cultivar-dependent (Doster and Schnathorst, 1985; Barba et al., 2015; Calonnec et al., 2018, 2021). In particular, the gain in resistance is considered higher in partially resistant cultivars (Peros et al., 2006). Grape berries and rachises are receptive to DM until stomata convert to lenticels, 4–6 weeks post-bloom (Kennelly et al., 2005) and are receptive to PM until they reach 8% sugar content (Delp, 1954; Gadoury et al., 2003).
Evolution of pathogen populations and isolates in natural environment
Pathogen populations in the vineyard are characterized by some genetic diversity and undergo evolutionary processes with varied selection pressures. Plasmopara viticola and Erysiphe necator originated in North America where the genetic variability is high (Brewer and Milgroom, 2010; Rouxel et al., 2013). For instance, cryptic species of P. viticola are described on different Vitis spp. (Rouxel et al., 2013; Taylor et al., 2019) and specialized isolates of E. necator are detected on V. rotundifolia (Frenkel et al., 2010). In Europe, Australia, and other countries, pathogen diversity is lower due to the bottleneck at the time of their introduction (Brewer and Milgroom, 2010; Fontaine et al., 2013, 2021; Taylor et al., 2019). In Europe, two dominant E. necator isolates termed EU-A and B have been characterized (Délye et al., 1997; Brewer and Milgroom, 2010; Csikós et al., 2020). Group A populations are clonal while group B populations are sexual, but these two groups differ little in aggressiveness (Peros et al., 2006).
Distinct populations of P. viticola and E. necator may be involved in divergent resistance phenotyping outputs and mapping studies (Cadle-Davidson, 2008; Cadle-Davidson et al., 2016). Selective pressures, such as fungicide treatments (Frenkel et al., 2015; Delmas et al., 2017; Santos et al., 2020; Massi et al., 2021) and host resistance, are responsible for changes in population biology over time. In Europe, extensive asexual reproduction and mutation rates of P. viticola, despite little genetic differentiation, yield virulent isolates on Rpv3.1 (Peressotti et al., 2010; Venuti et al., 2013; Delmotte et al., 2014), Rpv10 (Heyman et al., 2021), and Rpv12 (Wingerter et al., 2021) grapevine genotypes. Similarly, phenotyping data in North America suggest the selection of natural virulent E. necator isolates on Ren2 (Cadle-Davidson et al., 2016) and Run1 (Feechan et al., 2015) grapevine genotypes.
Additionally, DM and PM inoculum pressure and distribution vary with geographic location, vineyard, and season in any given year (Montarry et al., 2008; Boso et al., 2019). Extremely low humidity and low or high temperatures are the main factors that negatively affect P. viticola and E. necator growth and sporulation (Caffi et al., 2013; Choudhury et al., 2014). Assessments for resistance are conducted one to three times annually. However, the end of the vegetative season, when the damage of DM and PM is usually more intense, is the preferred period for scoring resistance with dates changing depending on the year (Ramming et al., 2011; Riaz et al., 2011; Pap et al., 2016; Zyprian et al., 2016; Teh et al., 2017; Zendler et al., 2017; Karn et al., 2021).
Resistance traits can be measured by several variables and scales
Resistance phenotypic variables are scored by visually monitoring disease symptoms that are determined by the plant response to inoculation (necrosis) and/or pathogen growth. In the vineyard, P. viticola early infections cause yellow lesions on leaves that appear as translucent oil spots. On older leaves in late season, infections are limited and form yellow to reddish-brown spots in a mosaic-like patchwork. The sporulation of P. viticola is white, downy, and cottony, and develops on the abaxial leaf surface. The infection of E. necator displays on green tissues as whitish and powdery colonies that get thicker and larger with pathogen mycelium growth and sporulation. Numerous brown to black necrosis can be present during both DM and PM infections. Young berries infected by DM produce sporulation or shrivel completely in later infections, while in the case of PM infections, can break off during growth.
DM and PM symptoms in the vineyard are evaluated on one to three plants per genotype by determining the number of infected leaves (disease incidence) or by different visual scales (disease severity) (Table 3). The use of standardized descriptors determined by the Organization Internationale de la Vigne et du Vin (OIV; OIV, 2009) or the International Plant Genetic Resources Institute (IPGRI) represents a solid foundation for cross-comparison of results (Cadle-Davidson et al., 2019). The OIV codes 452 and 455 for leaf resistance, and 453 and 456 for berry resistance to P. viticola and E. necator, respectively, refer to a semi-quantitative scoring method. The scales comprise five classes, ranging from 1 for very susceptible phenotypes (with extended and dense pathogen sporulation) to 9 for totally resistant phenotypes (with only small necrosis or no symptoms) (OIV, 2009) (Table 3). Inverted scales from IPGRI positively correlated with the rate of infection are frequently considered to reduce the risk of possible confusion between the rate of disease severity and the degree of plant resistance (Pap et al., 2016; Teh et al., 2017; Zendler et al., 2017). This scale is also applied to various organs (Riaz et al., 2011; Pap et al., 2016; Karn et al., 2021) (Table 3).
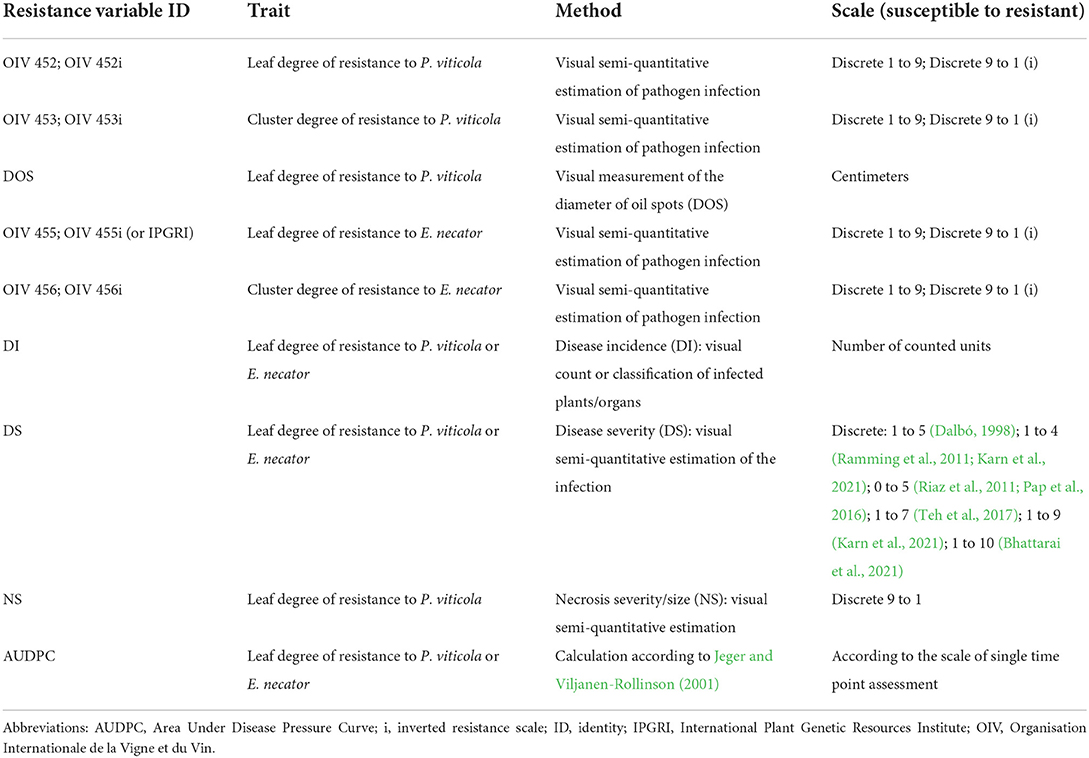
Table 3. Resistance variables assessed in the vineyard and greenhouse. An abbreviation and a description of the method and scale utilized for the scoring is proposed for each resistance variable assessed in mapping studies.
QTL identification in vineyard conditions: Stability over time, sites, and organs
Phenotyping in the vineyard uncovered the following major resistance QTL: Rpv3.1 (Welter et al., 2007; Bellin et al., 2009; Zyprian et al., 2016), Rpv12 (Venuti et al., 2013), Rpv14 (Ochssner et al., 2016), Rpv27 (Sapkota et al., 2019), Ren1 (Cadle-Davidson et al., 2016), Ren2 (Dalbó, 1998; Dalbó et al., 2001; Cadle-Davidson et al., 2016), Ren3/Ren9 (Fischer et al., 2004; Welter et al., 2007; Zyprian et al., 2016; Teh et al., 2017; Zendler et al., 2017), Ren4 (Ramming et al., 2011), Ren6, Ren7 (Pap et al., 2016), Ren11 (Karn et al., 2021), and Run2 (Riaz et al., 2011) (Table 4). Some of these resistance QTLs such as Rpv3.1 (Welter et al., 2007; Zyprian et al., 2016) and Ren3/Ren9 (Fischer et al., 2004; Welter et al., 2007; Teh et al., 2017) are stable over time and across studies. Ren3 and Ren9 are two close QTLs often detected as one locus, whose position is shifted during annual evaluations, probably due to the prevalence of different PM isolates from the beginning to the end of the epidemic (Zendler et al., 2017, 2021a). Moderate or minor QTL were difficult to detect because of the effects of major QTL, such as for Ren10 (Teh et al., 2017), or because of unique climatic conditions, such as for Ren8 (Zyprian et al., 2016), or because of their low and unstable significance, such as for Rpv4 and Rpv11 (Fischer et al., 2004; Welter et al., 2007). Disease resistance QTL do not appear to be organ-specific in grapevine, but show different significance and explained phenotypic variance depending on the organ considered: Rpv3.1 and Ren3/Ren9 were identified on leaves and berries (Welter et al., 2007; Zyprian et al., 2016); and Ren11 (Karn et al., 2021) and Run2.1 (Riaz et al., 2011) on leaves, berries, rachises, and canes; Ren6 and Ren7 were detected on leaves and canes (Pap et al., 2016); and the minor QTL Ren8 was associated with resistance in both leaves and berries (Zyprian et al., 2016), while Rpv4 was identified only with leaf resistance variables (Welter et al., 2007). Larger and more constant QTL significance is detected for leaf phenotypes while berry susceptibility seems more affected by year or environmental conditions (Vezzulli et al., 2018) and may depend on ideal infection conditions, during the limited time of berry receptivity.
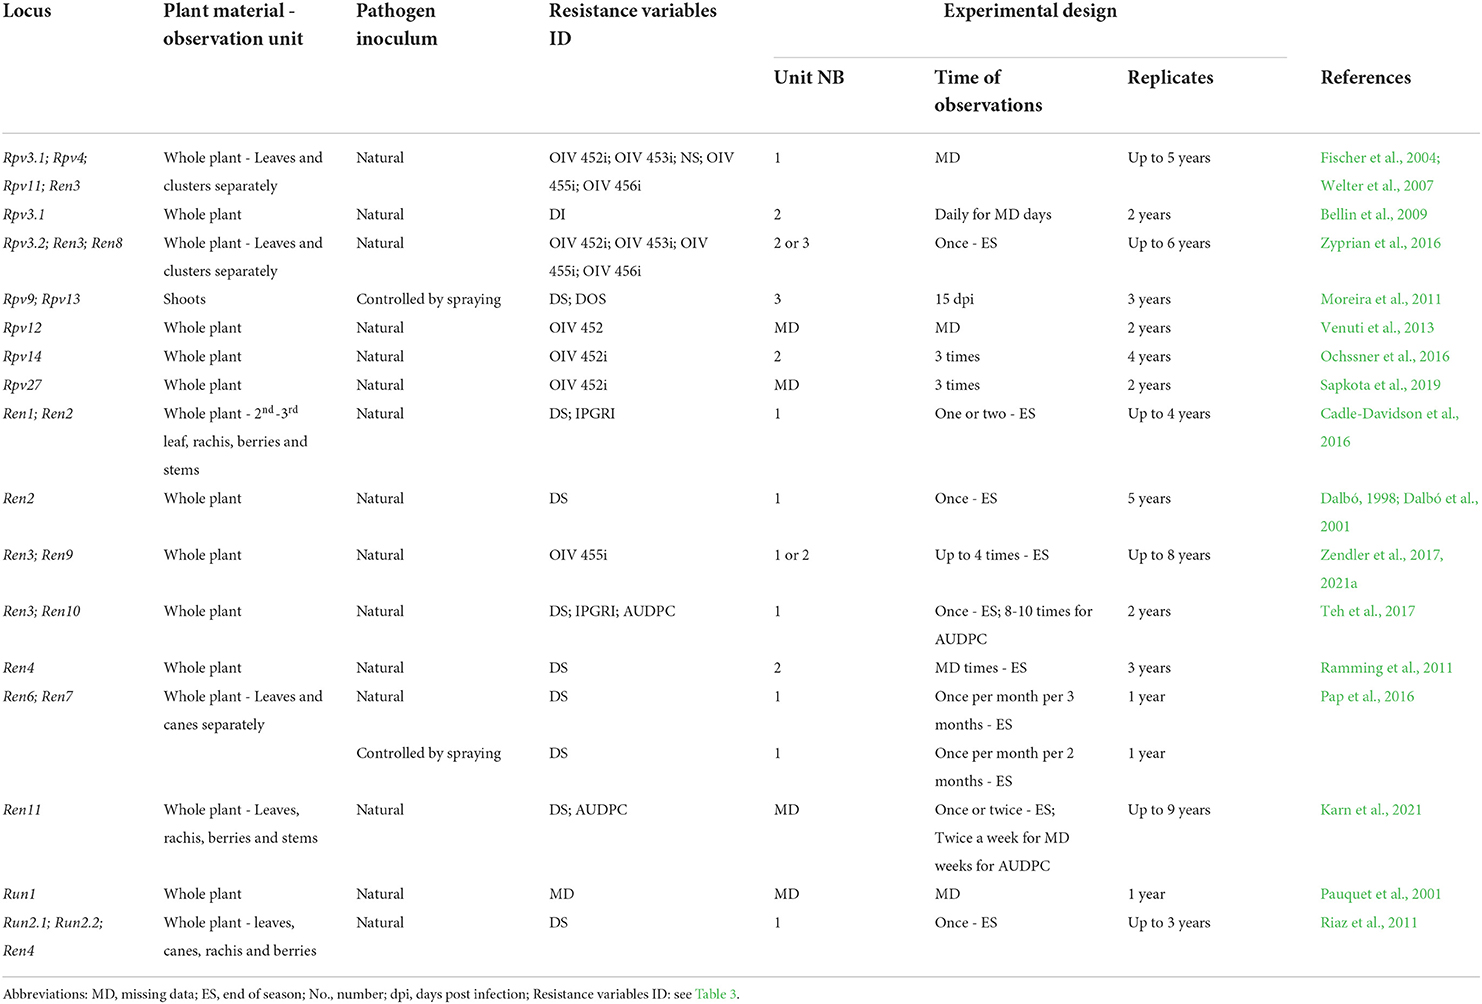
Table 4. Resistance phenotyping strategies utilized in the vineyard. The main elements and possible sources of variation of phenotyping protocols adopted in the main mapping studies are reported for each Rpv and Ren/Run locus.
Phenotyping in the greenhouse
As an alternative to vineyard assessment and its variable experimental conditions, the greenhouse is a more controlled environment which enables optimized plant and pathogen development. DM and PM infections appear spontaneously during the season or are induced by artificial inoculation on the whole plant or defined leaves.
Control of phenotyping sources of variation in the greenhouse
Phenotyping in the greenhouse usually relies on two to four replicates of each genotype obtained from hard-wood or soft-wood cuttings. Plants are maintained for 1–3 years in pots and are fertilized and pruned to maintain young growing shoots during the evaluation period. Plants in the greenhouse may be affected by only minor non-homogeneous conditions such as light exposure (Cadle-Davidson, 2008). As applied in the vineyard, grapevines are maintained in the greenhouse with or without a minimal fungicide protection.
Conditions for P. viticola infections in the greenhouse can be natural (Bhattarai et al., 2021) or induced (Merdinoglu et al., 2003). Artificial P. viticola inoculations are usually preferred and performed using a natural pathogen population from the vineyard (Moreira et al., 2011), or using a defined isolate maintained on controlled potted plants (Merdinoglu et al., 2003; Bellin et al., 2009; Vezzulli et al., 2019). Sporangia are sprayed by a water solution on receptive leaves of potted plants (Merdinoglu et al., 2003; Bellin et al., 2009) or on whole plants (Vezzulli et al., 2019; Bhattarai et al., 2021). DM is evaluated once annually between 7 (Merdinoglu et al., 2003) and 15 days post-inoculation (dpi) (Moreira et al., 2011) (Table 5).
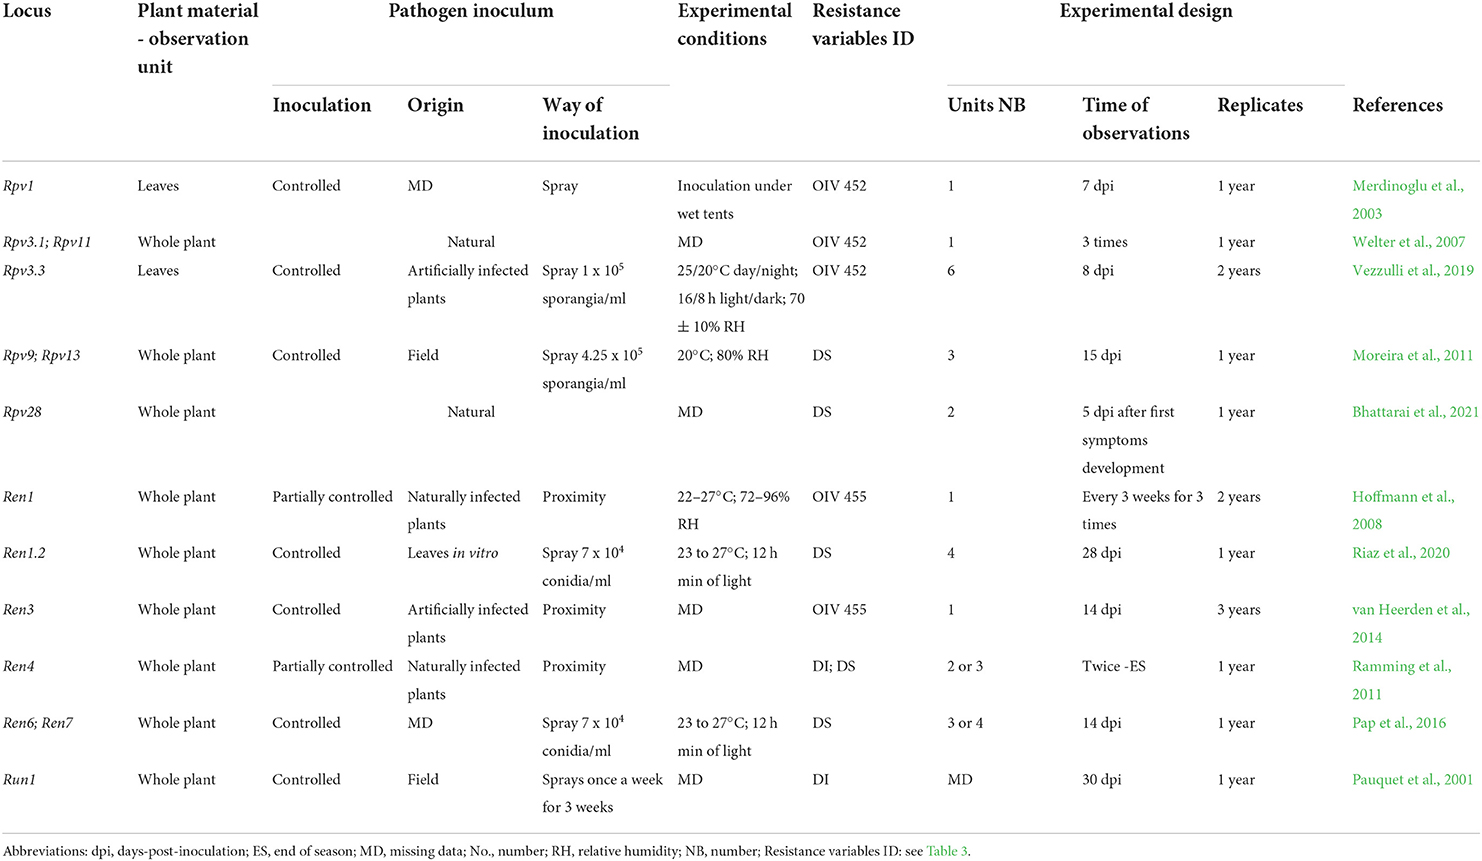
Table 5. Resistance phenotyping strategies utilized in the greenhouse. The main elements and possible sources of variation of phenotyping protocols adopted in the main mapping studies are reported for each Rpv and Ren/Run locus.
In the greenhouse, E. necator encounters optimal growth conditions and may develop natural infections (De Nardi et al., 2019). However, to encourage PM and its homogeneous distribution, naturally or artificially infected V. vinifera plants are often placed among the population of grapevines to be phenotyped (Hoffmann et al., 2008; Ramming et al., 2011; Mahanil et al., 2012; van Heerden et al., 2014; Karn et al., 2021). Then, the epidemic develops over several months and plants are evaluated two or three times (Hoffmann et al., 2008; Ramming et al., 2011; van Heerden et al., 2014; Karn et al., 2021). Alternatively, the pathogen may be inoculated by spraying and resistance is evaluated after a few weeks (Pauquet et al., 2001; Pap et al., 2016).
In the greenhouse, resistance is scored according to the OIV descriptors as done in the vineyard (Merdinoglu et al., 2003; Hoffmann et al., 2008; van Heerden et al., 2014; Vezzulli et al., 2019) or by using other similar semi-quantitative scales (Moreira et al., 2011; Ramming et al., 2011; Bhattarai et al., 2021) (Table 5).
QTL identification in greenhouse conditions
Greenhouse bioassays are mostly carried out with no or a few experimental replicates. These conditions enabled the identification of Rpv1 (Merdinoglu et al., 2003), Rpv3.3 (Vezzulli et al., 2019), Rpv28 (Bhattarai et al., 2021), Ren1 (Hoffmann et al., 2008), Ren1.2 (Riaz et al., 2020), and Run1 (Pauquet et al., 2001) (Table 5). Phenotyping in the greenhouse also confirmed QTL identified under vineyard conditions. This occurred for Rpv3.1 (Welter et al., 2007), Ren3/Ren9 (van Heerden et al., 2014), Ren4 (Ramming et al., 2011), and Ren6 and Ren7 (Pap et al., 2016). Only Ren11 was not confirmed with greenhouse-collected data (Karn et al., 2021). At the same time, greenhouse assays showed a lower number of minor QTLs, confirming those from the vineyard data, such as Rpv11 (Welter et al., 2007) or suggested possible new ones (Karn et al., 2021) (Table 5). Multi-year greenhouse assessments showed a very stable QTL identification for Ren3/Ren9 with data consistently collected at the same time after inoculation (van Heerden et al., 2014). Furthermore, a multi-phenotype study identified the highest QTL significance by visual greenhouse evaluation in comparison with vineyard and in vitro assays (Pap et al., 2016). These results suggest the potential of standardized greenhouse phenotyping in the evaluation of grapevine resistance to pathogens.
Phenotyping under in vitro conditions
The evaluation of grapevine resistance in the laboratory or in vitro conditions requires limited resources and space for plants and pathogens, and allows for an increase of genotypes to be evaluated and of bioassay replicates. One or multiple experiments per year can be performed (Schwander et al., 2012; Divilov et al., 2017; Possamai et al., 2021) and can integrate phenotypic dataset from the greenhouse or vineyard (Vezzulli et al., 2019; Riaz et al., 2020; Bhattarai et al., 2021). For these reasons, the in vitro phenotyping strategy is considered as an effective and practical tool for screening large populations and for identifying resistant accessions among grapevine collections (Brown et al., 1999; Deglène-Benbrahim et al., 2010; Miclot et al., 2012; Calonnec et al., 2013; Buonassisi et al., 2018; Vezzulli et al., 2018; Possamai et al., 2020). This approach is frequently used for resistance QTL identification.
Some tendencies were observed among the in vitro protocols described in the literature. Some mapping studies used different protocols (Pauquet et al., 2001; Bellin et al., 2009; Blanc et al., 2012; Schwander et al., 2012; Pap et al., 2016; Divilov et al., 2017; Sapkota et al., 2019; Vezzulli et al., 2019; Karn et al., 2021) but others used very similar protocols (either Bellin et al., 2009; Marguerit et al., 2009; Blasi et al., 2011; Venuti et al., 2013, or Schwander et al., 2012; Ochssner et al., 2016; Zyprian et al., 2016). The latter reports suggested possible standardizations for in vitro phenotyping bioassays.
In the laboratory, resistance is evaluated during a single pathogen life cycle, which happens during a very short time in comparison with epidemics under natural conditions. Under in vitro conditions, the origin and preparation of the plant material, the origin of the pathogen isolates, the methods of inoculation, the time point used for rating and the resistance variables assessed represent sources of variation in resistance evaluation that may affect the phenotyping results, although these factors can be managed (Tables 6, 7).
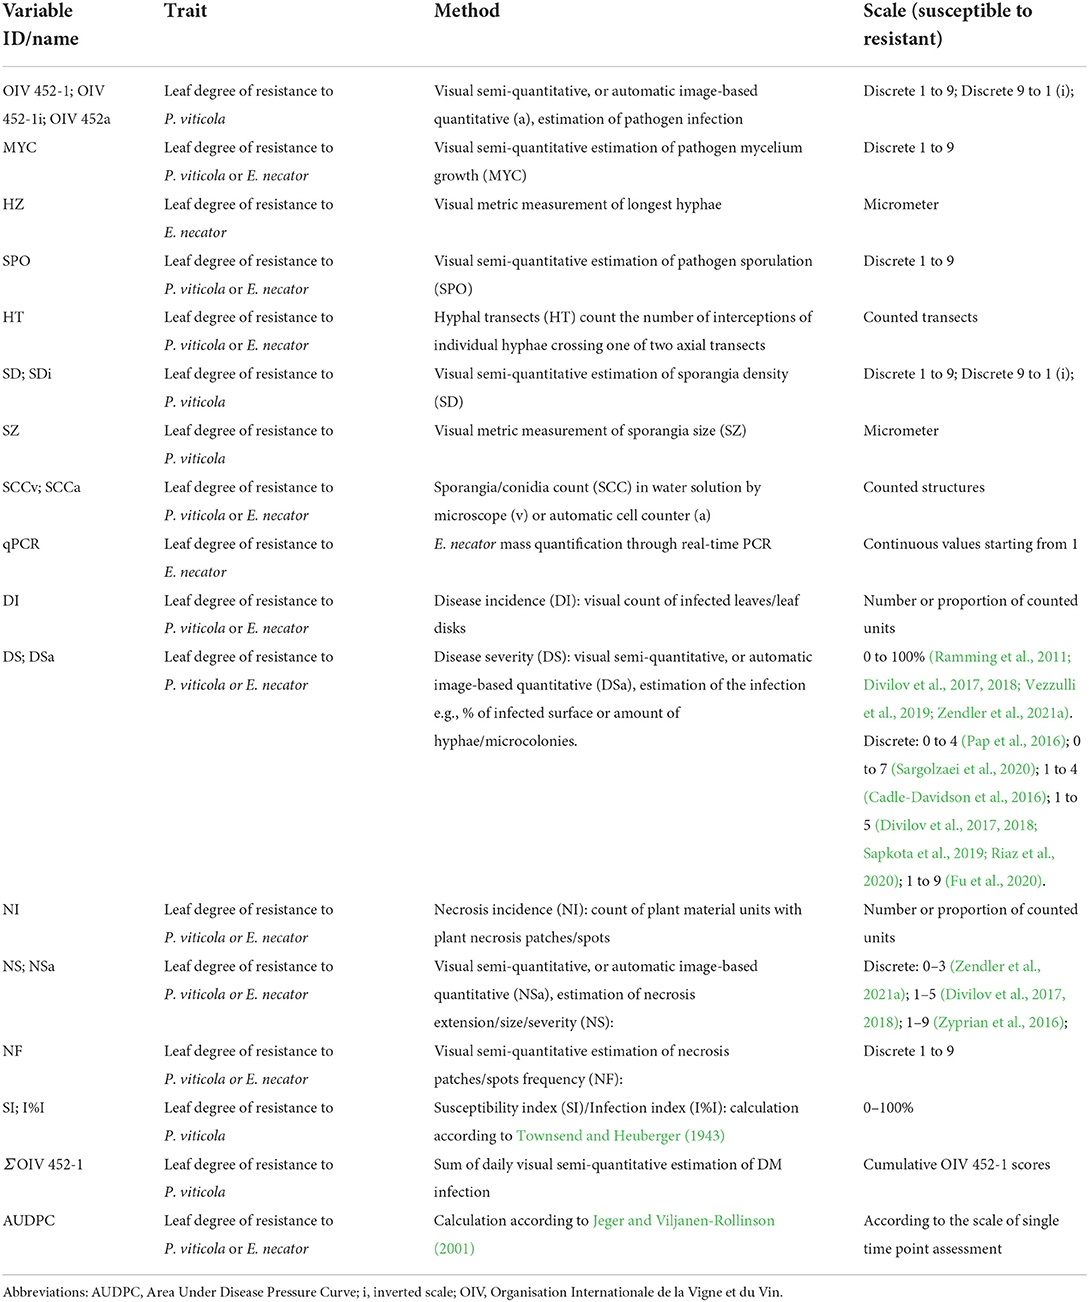
Table 6. Resistance variables assessed in the laboratory. An abbreviation and a description of the method and the scale utilized for the scoring are proposed for each resistance variable assessed in mapping studies.
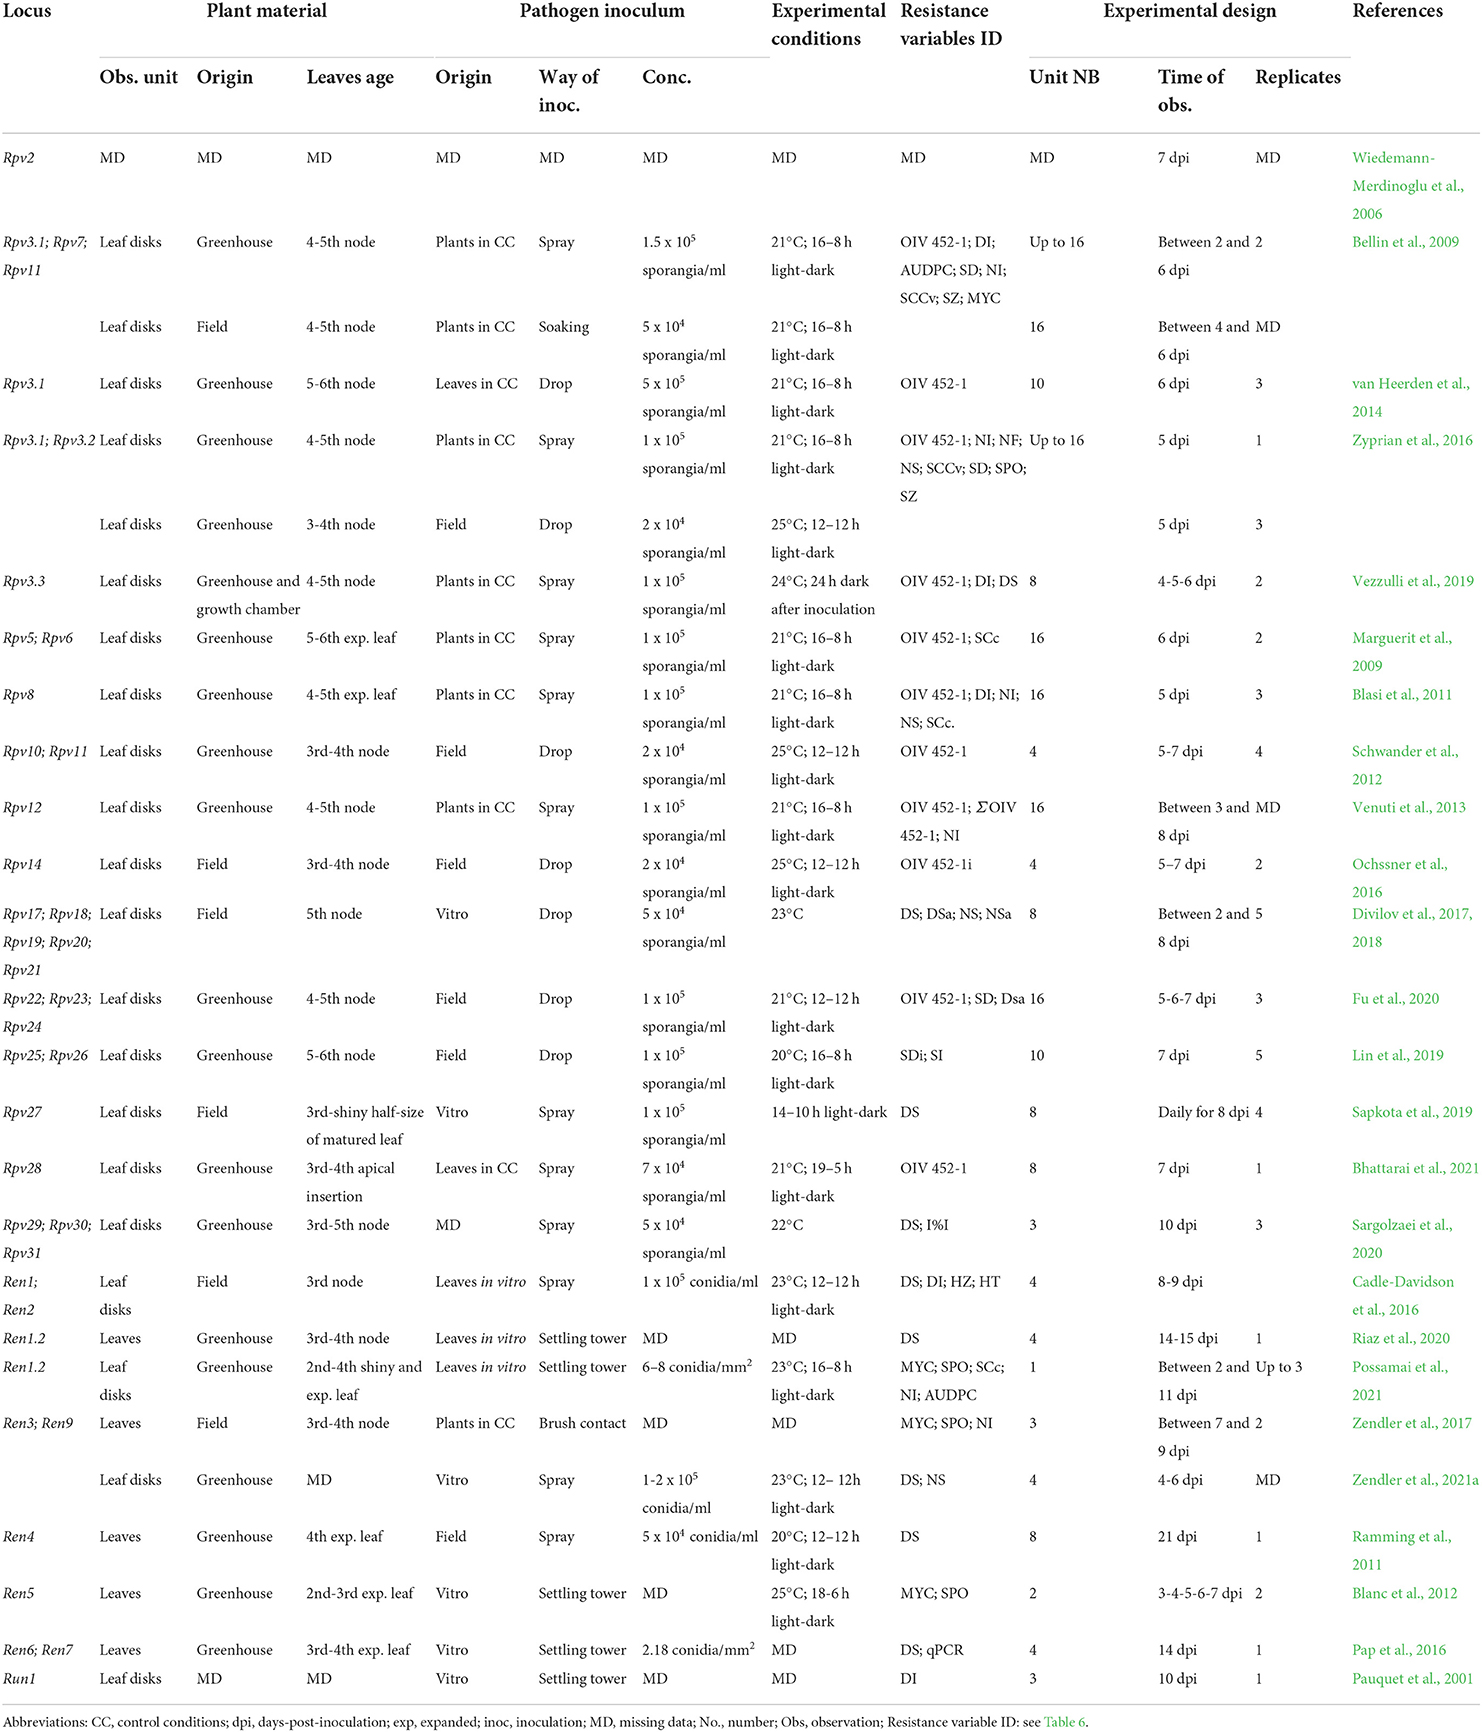
Table 7. Resistance phenotyping strategies utilized in the laboratory. The main elements and possible sources of variation of phenotyping protocols adopted in the main mapping studies are reported for each Rpv and Ren/Run locus.
Plant material management
For the bioassays performed in the laboratory, young leaves are collected from plants growing in optimal conditions either in the greenhouse (Blanc et al., 2012; Vezzulli et al., 2019; Possamai et al., 2021) or vineyard (Bellin et al., 2009; Ochssner et al., 2016; Divilov et al., 2017; Sapkota et al., 2019). Leaves are usually collected according to their position along the shoot to avoid ontogenic resistance (Merry et al., 2013; Calonnec et al., 2018, 2021) (Table 7). The maximal susceptibility to PM infection is conserved up to the fourth to fifth unfolded leaf on cuttings (Merry et al., 2013) and up to the second to third leaf on shoots in the vineyard (Barba et al., 2015; Calonnec et al., 2018). Some authors suggested that shine is also an important factor to identify susceptible leaves (Sapkota et al., 2019), particularly for PM resistance evaluations (Feechan et al., 2011; Cadle-Davidson et al., 2016; Possamai et al., 2021).
At the beginning of phenotyping experiments, particularly for E. necator resistance evaluations, a well-established practice is leaf disinfection and rinsing (Ramming et al., 2011; van Heerden et al., 2014; Pap et al., 2016; Divilov et al., 2017; Vezzulli et al., 2018; Sapkota et al., 2019; Bhattarai et al., 2021; Karn et al., 2021; Possamai et al., 2021; Zendler et al., 2021a). This avoids contamination when plant material originates in the vineyard and for long-lasting experiments.
Between 8 and 16 leaf disks are usually excised for DM resistance evaluations (Bellin et al., 2009; Divilov et al., 2017; Vezzulli et al., 2019), while for PM resistance evaluations, up to eight whole leaves (Ramming et al., 2011; Blanc et al., 2012; Pap et al., 2016) or leaf disks are assessed (Pauquet et al., 2001; Karn et al., 2021; Possamai et al., 2021; Zendler et al., 2021a).
Inoculum and infection management
P. viticola and E. necator inocula can either be collected as a natural population in the vineyard (Ramming et al., 2011; Schwander et al., 2012; Lin et al., 2019; Fu et al., 2020), or produced under controlled conditions on potted plants, for P. viticola (Bellin et al., 2009; Vezzulli et al., 2019), or on in vitro leaves for both pathogens (Blanc et al., 2012; Pap et al., 2016; Divilov et al., 2017; Sapkota et al., 2019; Possamai et al., 2021). Controlled inocula may originate as a mixture of isolates (Hoffmann et al., 2008; Bellin et al., 2009; Zyprian et al., 2016), or monosporangia/monoconidial cultures (Bellin et al., 2009; Teh et al., 2017; Possamai et al., 2021) (Table 7). In mapping studies, isolates are usually characterized by the pathogen origin (Bellin et al., 2009; Barba et al., 2015; Sargolzaei et al., 2020) and a few defined isolates (Bellin et al., 2009; Venuti et al., 2013). Leaves with P. viticola sporulation, or sporulated lesions, can be conserved by freezing (Delmotte et al., 2014), but the aggressiveness of the pathogen inoculum requires an infection cycle on leaves before resistance phenotyping. In contrast, E. necator isolates need to be maintained on green tissue (Miazzi et al., 1997; Gao et al., 2016).
For DM leaf disc bioassays, the pathogen inoculum is prepared by soaking leaves showing fresh P. viticola sporulation in water (Bellin et al., 2009; Divilov et al., 2017). Then, inoculations are performed by spraying the solution on the tissues (Bellin et al., 2009; Sapkota et al., 2019; Vezzulli et al., 2019; Sargolzaei et al., 2020; Bhattarai et al., 2021) or by the application of solution drops (10–50 μl) on the abaxial surface of the leaves (Schwander et al., 2012; Divilov et al., 2017; Lin et al., 2019; Fu et al., 2020). Experiments used a concentration of the spore solution ranging from 2 × 10⁴ to 5 × 10⁵ sporangia per ml (Table 7). Plasmopara viticola droplets remain on leaves for up to 24 h and need to be removed to avoid tissue rotting (van Heerden et al., 2014; Zyprian et al., 2016).
Erysiphe necator is inoculated on in vitro leaves by spraying conidia suspensions (Ramming et al., 2011; Cadle-Davidson et al., 2016; Karn et al., 2021; Zendler et al., 2021a) or using settling towers (Pauquet et al., 2001; Blanc et al., 2012; Pap et al., 2016; Possamai et al., 2021). Experiments used PM pressure ranging from 5 × 10⁴ to 2 × 10⁵ conidia per ml for spraying, and from 2 to 8 conidia per mm2 for settling towers (Table 7).
Petri dishes containing leaves or leaf disks are usually inoculated at the sampling date and incubated according to P. viticola and E. necator optimal growth and sporulation conditions between 20 and 25°C and with high relative humidity. Photoperiods vary between 12 and 19-h light (Schwander et al., 2012; Bhattarai et al., 2021) (Table 7). P. viticola infection is usually evaluated between 5 and 7 dpi (Bellin et al., 2009; Schwander et al., 2012; Lin et al., 2019; Fu et al., 2020; Bhattarai et al., 2021), while E. necator infection is assessed between 3 and 14 dpi (Blanc et al., 2012; Pap et al., 2016; Possamai et al., 2021).
Assessment of resistance variables from in vitro bioassays
In the laboratory, resistance rating methods are very diverse (Tables 6, 7). As commonly practiced for the other environments, DM and PM sporulation is scored for incidence (Pauquet et al., 2001; Bellin et al., 2009; Blasi et al., 2011; Vezzulli et al., 2019) and severity using different visual semi-quantitative scales (Divilov et al., 2017; Sapkota et al., 2019; Vezzulli et al., 2019), such as the OIV 452-1 and 455-1 descriptors (OIV, 2009). In vitro bioassays facilitate the use of machine vision analyses (Divilov et al., 2017; Fu et al., 2020). Phenotyping in the laboratory is often enriched by the collection of additional variables obtained by stereomicroscopes and microscopes. Some examples are: DM density of sporangiophores (Bellin et al., 2009; Zyprian et al., 2016; Fu et al., 2020), DM mesophyll colonization (Bellin et al., 2009), PM mycelium growth (Blanc et al., 2012; Possamai et al., 2021), dimension of DM sporangia (Zyprian et al., 2016), count of PM hyphal transects (number of hyphae crossed by a line traversing the leaf disc; Cadle-Davidson et al., 2016; Karn et al., 2021), and spore production (Zyprian et al., 2016; Possamai et al., 2021) (Tables 6, 7). In vitro phenotyping is also often enriched by the calculation of infection indexes (Townsend and Heuberger, 1943; Lin et al., 2019; Sargolzaei et al., 2020).
Plant necrosis is assessed either qualitatively (Bellin et al., 2009; Zyprian et al., 2016; Possamai et al., 2021) or quantitatively for its frequency and extension (Blasi et al., 2011; Zyprian et al., 2016; Divilov et al., 2017; Zendler et al., 2021a), in particular for P. viticola infections (Tables 6, 7).
Time series ratings are frequently recorded in the laboratory (Bellin et al., 2009; Venuti et al., 2013; Divilov et al., 2017; Sapkota et al., 2019; Vezzulli et al., 2019; Possamai et al., 2021) (Table 6), allowing several comparisons among phenotyping data and providing the opportunity to obtain new variables that consider the complete infection process, such as the Area-Under-Disease-Pressure-Curve (AUDPC; Jeger and Viljanen-Rollinson, 2001).
QTL identification through in vitro bioassays
In vitro bioassays detected all the resistance QTL loci identified in the vineyard, such as Rpv3.1 (Bellin et al., 2009; Zyprian et al., 2016), Rpv12 (Venuti et al., 2013), Rpv14 (Ochssner et al., 2016), Rpv27 (Sapkota et al., 2019), and Ren3/Ren9 (Zendler et al., 2017), or in the greenhouse, such as Rpv3.3 (Vezzulli et al., 2019), Rpv28 (Bhattarai et al., 2021), and Ren1.2 (Riaz et al., 2020; Possamai et al., 2021). The QTL loci Ren1 (Hoffmann et al., 2008; Cadle-Davidson et al., 2016), Ren4 (Ramming et al., 2011), Ren6, Ren7 (Pap et al., 2016), and Run1 (Pauquet et al., 2001) were detected in all the phenotyping environments (Table 6). In vitro assays provided both QTL significances close (Bellin et al., 2009; Pap et al., 2016; Vezzulli et al., 2019; Riaz et al., 2020) or far (e.g., Bhattarai et al., 2021) from those identified in other phenotyping environments.
Through phenotyping in vitro, several other resistance loci were mapped, in particular for P. viticola (Table 6), confirming the suitability of such a strategy to assess large numbers of accessions. QTL with large significant effects and/or stable results between experiments were Rpv5, Rpv6 (Marguerit et al., 2009), Rpv8 (Blasi et al., 2011), Rpv10 (Schwander et al., 2012), Rpv22, Rpv23, Rpv24 (Fu et al., 2020), and Ren5 (Blanc et al., 2012). In the study of Rpv17, Rpv18, Rpv19, Rpv20, and Rpv21, the proposed loci were not identified in all the mapping populations and experiments. Additionally, they were mapped together with several minor loci (Divilov et al., 2018). The Rpv25 and Rpv26 loci were not consistently identified and were detected together with other unstable QTLs (Lin et al., 2019). Finally, the Rpv29, Rpv30, and Rpv31 loci (Sargolzaei et al., 2020) segregated only in a few seedlings of the mapping population and accessions studied, which showed a large variability in infection rate.
In vitro bioassays suggest a certain variation of phenotyping in relation to the physiological state of the plant and aggressiveness of the pathogen (Sargolzaei et al., 2020; Possamai et al., 2021). Therefore, unoptimized and unstandardized practices are probably the cause of unstable QTL detection and significant differences in comparison with the other phenotyping environments. However, some authors suggested that minor QTL are easily detected under optimal laboratory conditions (Riaz et al., 2011; Teh et al., 2017).
The visual evaluation of disease incidence and severity, and the quantification of pathogen structures (sporangia or conidia count) produced the most significant QTL identification (Bellin et al., 2009; Marguerit et al., 2009; Blasi et al., 2011; Zyprian et al., 2016; Vezzulli et al., 2019; Possamai et al., 2021). For instance, mycelium growth and sporulation scores were the best variables in characterizing QTLs of total (Blanc et al., 2012; Pap et al., 2016) and partial (Possamai et al., 2021) resistance to E. necator. Objective DM severity carried out by machine vision analysis (Divilov et al., 2017; Fu et al., 2020), sporulation quantified by cell counters (Bellin et al., 2009; Blasi et al., 2011) and severity of E. necator measured by hyphal-transect (Cadle-Davidson et al., 2016; Karn et al., 2021) and qPCR (Pap et al., 2016) also identified major QTLs with high significance. Other variables, such as P. viticola mesophyll colonization (Bellin et al., 2009) and sporangia size (Zyprian et al., 2016), provided interesting biological information but were less effective in identifying resistance QTLs.
Plant necrosis provided resistance QTL collocating with those identified by sporulation data for Rpv3.1 (Welter et al., 2007), Rpv8 (Blasi et al., 2011), and Ren1.2 (Possamai et al., 2021), but also revealed new loci such as Rpv3.2 (Zyprian et al., 2016) and Rpv17 (Divilov et al., 2018).
The assessment of DM and PM over time showed that the QTL significance changed with disease progression (Bellin et al., 2009; Cadle-Davidson et al., 2016; Pap et al., 2016; Zendler et al., 2017; Possamai et al., 2021) and that cumulative infection indexes captured more phenotypic variance than single time point ratings, enhancing the QTL detection (Bellin et al., 2009; Teh et al., 2017; Karn et al., 2021; Possamai et al., 2021).
Efforts toward a standardization of main factors influencing phenotyping data
Mapping for resistance aims to characterizing genetic sources useful for grape breeding. However, the explained phenotypic variance of QTL varies according to the collected phenotypes (Bellin et al., 2009; Pap et al., 2016; Zyprian et al., 2016; Karn et al., 2021; Possamai et al., 2021), stressing the impact of phenotyping for studying the genetic basis of resistance traits.
Our review encountered a wide variety of phenotyping protocols, highlighting the main factors with a direct effect on the significance and reproducibility of results. Resistance phenotypes depend on the biological (plants and pathogens) and environmental components involved in the experiments and their interactions, the technical difficulties in managing and standardizing the resistance evaluations, and the consequential costs and time associated with the phenotyping practices. Objective and quantitative measures of grapevine mildew resistance using new tools, but also the harmonization of the procedure according to Minimum Information About a Plant Phenotyping Experiment (MIAPPE) would improve future phenotyping protocols.
Environments, plant material, and pathogen inocula
Phenotyping in the vineyard yield resistance data at the whole plant level during natural polycyclic infections and under unstable epidemic pressure. Some studies suggested that the leaves may be a proxy of whole plant resistance (Welter et al., 2007; Ramming et al., 2011; Pap et al., 2016; Zyprian et al., 2016; Karn et al., 2021). However, other studies suggested limited correlation between resistance of grapevine leaves and bunches (Calonnec et al., 2013; Buonassisi et al., 2018; Vezzulli et al., 2018). This may be due to either the presence of factors that influence the susceptibility of the organs or a possible low reliability of some resistance data. For these reasons, resistance should be observed on different organs, at least leaves and bunches. Furthermore, to standardize phenotyping results, the time of plant organ scoring should be defined according to the grapevine phenological phases (Lorenz et al., 1995; OIV, 2009). For disease dynamic, epidemic pressures could be estimated by assessing control plants (Riaz et al., 2011; Ochssner et al., 2016; Zyprian et al., 2016), or by capturing and quantifying pathogen airborne spores (Mahaffee and Stoll, 2016; Thiessen et al., 2018; Brischetto et al., 2020). Finally, pedoclimatic data should be recorded to better understand the resistance phenotyping results and QTL analyses (Zyprian et al., 2016; Zendler et al., 2017, 2021a).
Phenotyping under natural conditions of infection in the greenhouse has similar characteristics to phenotyping in the vineyard but with more consistent environmental conditions. Plants produced in the greenhouse for subsequent greenhouse or in vitro experiments allow a better follow-up of plant growth and juvenility of the leaves (Welter et al., 2007; Zyprian et al., 2016). The growing degree-day and/or the leaf position on the shoots of the leaf collected can be helpful to record the stage of the plant material used in phenotyping. Pathogen inoculations could be also standardized using artificial inoculation of isolates maintained under control conditions. However, the management of plant growth and infection in the greenhouse may result in expensive and complex practices in terms of space and time, limiting bioassay replicates. Probably for these reasons, only a limited number of experiments are carried out in the greenhouse.
In vitro bioassays do not affect the original plants and can be performed at different periods and in multiple replicates with several experimental units during the vegetative season. To date, pathogen isolates used in mapping studies have been poorly described. Therefore, it would be advantageous to standardize pathogen inocula in vitro using a set of isolates characterized for their virulence and aggressiveness. In vitro evaluations are effective in describing the biological and genetic resistance components during one pathogen cycle, but the bioassays do not consider possible derivative effects of the polycyclic behavior of the disease (Bove et al., 2019). Furthermore, plants are tested in extremely favorable conditions for the diseases, leading to a possible underestimation of the resistance in comparison with the vineyard (Calonnec et al., 2013). Therefore, the extreme diverse experimental conditions may explain the limited correlation between resistance sometimes observed on detached leaves or leaf disks and bunches in the vineyard (Calonnec et al., 2013; Zyprian et al., 2016; Buonassisi et al., 2018; Vezzulli et al., 2018; Bove et al., 2019). For all these reasons, resistant plants with new identified QTL should be assessed also under vineyard conditions.
Regardless of the phenotyping environment, the use of a range of control genotypes (with known resistance loci correlated to various resistance levels) growing and rated in the same environment and experimental design as the candidate plants to be assessed, would validate the phenotyping practices (plant material growth and sampling, pathogen inoculum preparation, and distribution and infection environmental conditions). Finally, due to the possible pathogen genetic variability, the identified resistance QTL should be checked in multi-year and multi-time evaluations, and in different vineyard areas before their introduction into breeding programs (Bellin et al., 2009; Teh et al., 2017; Karn et al., 2021; Possamai et al., 2021).
Resistance variables
The different variables used to score P. viticola and E. necator symptoms show significant correlations between them and usually locate the main QTL at the same genomic positions (Bellin et al., 2009; Cadle-Davidson et al., 2016; Pap et al., 2016; Zyprian et al., 2016; Karn et al., 2021; Possamai et al., 2021). Sporulating P. viticola and E. necator is primarily utilized to characterize grapevine resistance because it is macroscopic and appraisable in all phenotyping environments (Bellin et al., 2009; Venuti et al., 2013; Pap et al., 2016; Zyprian et al., 2016; Teh et al., 2017; Vezzulli et al., 2018; Fu et al., 2020; Sargolzaei et al., 2020; Özer et al., 2021). However, different studies suggest that necrosis or cell death (Pitsili et al., 2020) should be also assessed because the plant response may be differentially expressed according to plant–pathogen interactions (Zyprian et al., 2016; Gómez-Zeledón et al., 2017; Divilov et al., 2018; Possamai et al., 2020).
The official visual semi-quantitative scales, such as those of OIV or IPGRI, are considered subjective and error-prone (Poland and Nelson, 2011). However, annual training of observers in visual estimation of disease symptoms could reduce possible biases. To further reduce the possibility and effects of human errors and to improve the biological description of resistance and QTL identification, it is advisable that resistance assessments should be performed by several people, on multiple biological replicates and in multiple bioassays. The disease severity rating method may be an alternative to the previous scales, but the assessment of the percentage of infected surface may also be subjective. The disease incidence is probably the easiest method to assess resistance but fails to record complete information about quantitative phenotypes.
Tools and strategies for improving grapevine resistance phenotyping objectivity and automation
In resistance mapping studies, despite the numerous experiments and large-scale samples, phenotyping is generally conducted by traditional visual rating of disease symptoms with some exceptions (Pap et al., 2016; Divilov et al., 2017, 2018; Fu et al., 2020). Other studies showed that metabolomes such as stilbenoids in grapevines (Malacarne et al., 2011; Chitarrini et al., 2017) and lipids in pathogens (Negrel et al., 2018) can be studied to characterize DM and PM infections. Alternatively, grapevine pathogens can also be detected and quantified by molecular techniques such as qPCR and transcriptional analyses (Valsesia et al., 2005; Dufour et al., 2011; Malacarne et al., 2011; Hariharan and Prasannath, 2021). Different metabolic responses to P. viticola have already been associated with resistance loci (Eisenmann et al., 2019; Chitarrini et al., 2020; Ciubotaru et al., 2021) and could provide guidelines to define new resistance variables. However, these methods do not allow monitoring of disease progression.
Assessment of grapevine tissue, using spectrometers and spectral imaging sensors, relies on non-destructive measurements capable of early detection of pathogen infection, tracking of infection progression, and differentiation of responses mediated by resistance loci (Cséfalvay et al., 2009; Peressotti et al., 2011; Oerke et al., 2016; Štambuk et al., 2021). Nowadays, machine vision approaches can be highly automated in image capture, and their analysis can use advanced recognition algorithms (Hamuda et al., 2017) and convolutional neural networks (CNNs) (Rawat and Wang, 2017). These elements increase the machine vision throughput and performance that rival human observers in grapevine disease detection and classification (Bierman et al., 2019; Liu et al., 2020; Zendler et al., 2021b). Disease severity assessed by machine vision appears to be time and cost-effective (Divilov et al., 2017), but presents specific challenges, such as droplet dispersion (Fu et al., 2020), leaf morphology (Divilov et al., 2017; Fu et al., 2020), and low pathogen structure (E. necator hyphae) resolution (Bierman et al., 2019). Machine vision probably represents one of the most interesting opportunities to produce objective and quantitative measures of grapevine resistance.
Toward minimum information about a plant phenotyping experiment
The lack of common standards for grapevine resistance phenotyping experiments (plant material and pathogen inoculum, collection and storage) may hamper the correct interpretation of mapping studies and their application to new phenotyping and genetic investigations. This lack of standards is the result of a large variability of protocols but also of the dependence of the genetic trait on the environment and phenotyping conditions (Krajewski et al., 2015).
The Minimum Information About a Plant Phenotyping Experiment (MIAPPE) was proposed to harmonize phenotypic observations and develop precise and repeatable protocols (Krajewski et al., 2015; Cwiek-Kupczyńska et al., 2016; Papoutsoglou et al., 2020). These authors inventoried the attributes that are necessary for a useful description of a plant phenotyping experiment and an optimal use and re-use of the protocol and data produced. The MIAPPE (www.miappe.org) checklist consists of attributes that can be classified within the following eight categories: (1) general metadata (dataset identifier, objectives of the experiment and authors); (2) location and timing of the experiment; (3) biosource (plant material identification, pathogen); (4) environmental descriptors (for vineyard, greenhouse and environment chamber) such as aerial conditions, light, fertilizing and watering; (5) treatments (environmental properties, artificial treatments); (6) experimental design (experimental units could be a single plant, plot and groups of plants); (7) samples collection, processing and management protocols; and (8) observed variables described by three basic attributes: trait name, measurement method, and notation scale. Furthermore, authors relied on annotations that agree with publicly available ontologies using proper dataset formats (ISA-Tab; Rocca-Serra et al., 2010) to ensure the understanding and interoperability of the experiments (Krajewski et al., 2015; Cwiek-Kupczyńska et al., 2016). In particular, observed variable attributes were formalized through the Crop Ontology (CO; Shrestha et al., 2012; www.cropontology.org). For grapevine resistance phenotyping, this approach is still new and guidelines are not available yet. Such guidelines need be developed to implement best practices, improve the quality, availability, and usefulness of the data and to associate metadata describing the experiments. The implementation of such standards would facilitate the harmonization of data and metadata resources in a shared format (Savoi et al., 2021).
Conclusions
During the past 20 years, effective protocols have been implemented in all the environments of phenotyping (vineyard, greenhouse and laboratory conditions) for the identification of several DM and PM resistance Rpv and Ren/Run loci, respectively. Experimental conditions in the vineyard are variable and mostly uncontrolled (plant growth, pathogen inoculum, and climate). Additionally, they affect the degree of DM and PM infections, and significance of the QTL analyses. Phenotyping in more controlled environments such as the greenhouse or laboratory is often more effective than in the vineyard because it allows the production of reproducible results that increase the reliability of QTL identification. However, controlled environments generally provide only partial information on the resistance of the genotypes studied, such as leaf resistance under conditions of monocyclic pathogen development. Thus, with an aim of resistance durability, grapevine genotypes identified as resistant to DM and PM under these conditions should be evaluated in the vineyard where natural and diverse pathogen populations occur. Finally, in the search for new resistance loci in grapevine, future phenotyping experiments should follow MIAPPE guidelines to standardize protocols and increase the reliability and reproducibility of QTL mapping results, regardless of the phenotyping environment. Meanwhile, phenomics could provide new tools to increase grapevine-resistance assessment throughput and accuracy.
Author contributions
TP and SW-M conceived the work, performed the literature search, analyzed the data, drafted, and edited the manuscript. Both authors contributed to the article and approved the submitted version.
Acknowledgments
The authors thank Daniele Migliaro (CREA-VE), Komlan Avia (INRAE Grand Est-Colmar), and Marc Fuchs (Cornell University) for their helpful suggestions and discussions in the final review of the manuscript.
Conflict of interest
The authors declare that the research was conducted in the absence of any commercial or financial relationships that could be construed as a potential conflict of interest.
Publisher's note
All claims expressed in this article are solely those of the authors and do not necessarily represent those of their affiliated organizations, or those of the publisher, the editors and the reviewers. Any product that may be evaluated in this article, or claim that may be made by its manufacturer, is not guaranteed or endorsed by the publisher.
Abbreviations
BC, Backcross; DM, Downy Mildew; dpi, Days Post Infection/Inoculation; GWAS, Genome-Wide Association Study; IPGRI, International Plant Genetic Resources Institute; LG, Linkage Group; MIAPPE, Minimum Information About a Plant Phenotyping Experiment; MD, Missing Data; OIV, Organization Internationale de la Vigne et du Vin; PM, Powdery Mildew; QTL, Quantitative Trait Locus; RH, Relative Humidity; Rpv, Resistance to Plasmopara Viticola; Ren, Resistance to Erysiphe Necator; Run, Resistance to Uncinula Necator; UPOV, Union for the Protection of New Varieties of Plants.
References
Barba, P., Cadle-Davidson, L., Galarneau, E., and Reisch, B. (2015). Vitis rupestris B38 confers isolate-specific quantitative resistance to penetration by Erysiphe necator. Phytopathology 105, 1097–1103. doi: 10.1094/PHYTO-09-14-0260-R
Bellin, D., Peressotti, E., Merdinoglu, D., Wiedemann-Merdinoglu, S., Adam-Blondon, A.-F., Cipriani, G., et al. (2009). Resistance to Plasmopara viticola in grapevine ‘Bianca' is controlled by a major dominant gene causing localised necrosis at the infection site. Theoret. Appl. Genet. 120, 163–176. doi: 10.1007/s00122-009-1167-2
Bhattarai, G., Fennell, A., Londo, J. P., Coleman, C., and Kovacs, L. G. (2021). A novel grape downy mildew resistance locus from Vitis rupestris. Am. J. Enol. Vitic. 72, 12–20. doi: 10.5344/ajev.2020.20030
Bierman, A., LaPlumm, T., Cadle-Davidson, L., Gadoury, D., Martinez, D., Sapkota, S., et al. (2019). A high-throughput phenotyping system using machine vision to quantify severity of grapevine powdery mildew. Plant Phenomics 2019:9209727. doi: 10.34133/2019/9209727
Blanc, S., Wiedemann-Merdinoglu, S., Dumas, V., Mestre, P., and Merdinoglu, D. (2012). A reference genetic map of Muscadinia rotundifolia and identification of Ren5, a new major locus for resistance to grapevine powdery mildew. Theoret. Appl. Genet. 125, 1663–1675. doi: 10.1007/s00122-012-1942-3
Blasi, P., Blanc, S., Wiedemann-Merdinoglu, S., Prado, E., Rühl, E. H., Mestre, P., et al. (2011). Construction of a reference linkage map of Vitis amurensis and genetic mapping of Rpv8, a locus conferring resistance to grapevine downy mildew. Theoret. Appl. Genet. 123, 43–53. doi: 10.1007/s00122-011-1565-0
Boso, S., Gago, P., Santiago, J.-L., de la Fuente, M., and Martínez, M.-C. (2019). Factors affecting the vineyard populational diversity of Plasmopara viticola. Plant Pathol. J. 35, 125–136. doi: 10.5423/PPJ.OA.09.2018.0194
Bove, F., Bavaresco, L., Caffi, T., and Rossi, V. (2019). Assessment of resistance components for improved phenotyping of grapevine varieties resistant to downy mildew. Front. Plant Sci. 10, 1559. doi: 10.3389/fpls.2019.01559
Brewer, M. T., and Milgroom, M. G. (2010). Phylogeography and population structure of the grape powdery mildew fungus, Erysiphe necator, from diverse Vitis species. BMC Evol. Biol. 10:268. doi: 10.1186/1471-2148-10-268
Brischetto, C., Bove, F., Languasco, L., and Rossi, V. (2020). Can spore sampler data be used to predict Plasmopara viticola infection in vineyards? Front. Plant Sci. 11, 1187. doi: 10.3389/fpls.2020.01187
Brown, M. V., Moore, J. N., Fenn, P., and McNew, R. W. (1999). Comparison of leaf disk, greenhouse, and field screening procedures for evaluation of grape seedlings for downy mildew resistance. HortScience 34, 331–333. doi: 10.21273/HORTSCI.34.2.331
Buonassisi, D., Cappellin, L., Dolzani, C., Velasco, R., Peressotti, E., and Vezzulli, S. (2018). Development of a novel phenotyping method to assess downy mildew symptoms on grapevine inflorescences. Sci. Hortic. 236, 79–89. doi: 10.1016/j.scienta.2018.03.023
Cadle-Davidson, L. (2008). Variation within and between Vitis spp. for foliar resistance to the downy mildew pathogen Plasmopara viticola. Plant Dis. 92, 1577–1584. doi: 10.1094/PDIS-92-11-1577
Cadle-Davidson, L., Chicoine, D. R., and Consolie, N. H. (2011). Variation Within and Among Vitis spp. for foliar resistance to the powdery mildew pathogen Erysiphe necator. Plant Dis. 95, 202–211. doi: 10.1094/PDIS-02-10-0092
Cadle-Davidson, L., Gadoury, D., Fresnedo-Ramírez, J., Yang, S., Barba, P., Sun, Q., et al. (2016). Lessons from a phenotyping center revealed by the genome-guided mapping of powdery mildew resistance loci. Phytopathology® 106, 1159–1169. doi: 10.1094/PHYTO-02-16-0080-FI
Cadle-Davidson, L., Londo, J., Martinez, D., Sapkota, S., and Gutierrez, B. (2019). “From phenotyping to phenomics: present and future approaches in grape trait analysis to inform grape gene function,” in: The Grape Genome Compendium of Plant Genomes, eds D. Cantu and M. A. Walker (Cham: Springer International Publishing), 199–222. doi: 10.1007/978-3-030-18601-2_10
Caffi, T., Gilardi, G., Monchiero, M., and Rossi, V. (2013). Production and release of asexual sporangia in Plasmopara viticola. Phytopathology® 103, 64–73. doi: 10.1094/PHYTO-04-12-0082-R
Calonnec, A., Jolivet, J., Ramaroson, M., Dufour, M., and Corio-Costet, M. (2021). Defence responses of grapevine cultivars to powdery mildew: Ontogenic resistance versus genetic resistance. Plant Pathol. 70, 1583–1600. doi: 10.1111/ppa.13404
Calonnec, A., Jolivet, J., Vivin, P., and Schnee, S. (2018). Pathogenicity traits correlate with the susceptible Vitis vinifera leaf physiology transition in the biotroph fungus Erysiphe necator: An adaptation to plant ontogenic resistance. Front. Plant Sci. 9, 1808. doi: 10.3389/fpls.2018.01808
Calonnec, A., Wiedemann-Merdinoglu, S., Delière, L., Cartolaro, P., Schneider, C., and Delmotte, F. (2013). The reliability of leaf bioassays for predicting disease resistance on fruit: a case study on grapevine resistance to downy and powdery mildew: Grapevine disease resistance from bioassay to vineyard. Plant Pathol. 62, 533–544. doi: 10.1111/j.1365-3059.2012.02667.x
Canaguier, A., Grimplet, J., Di Gaspero, G., Scalabrin, S., Duchêne, E., Choisne, N., et al. (2017). A new version of the grapevine reference genome assembly (12X.v2) and of its annotation (VCost.v3). Genomics Data 14, 56–62. doi: 10.1016/j.gdata.2017.09.002
Carroll, J. E., and Wilcox, W. F. (2003). Effects of humidity on the development of grapevine powdery mildew. Phytopathology® 93, 1137–1144. doi: 10.1094/PHYTO.2003.93.9.1137
Chitarrini, G., Riccadonna, S., Zulini, L., Vecchione, A., Stefanini, M., Larger, S., et al. (2020). Two-omics data revealed commonalities and differences between Rpv12- and Rpv3-mediated resistance in grapevine. Sci. Rep. 10:12193. doi: 10.1038/s41598-020-69051-6
Chitarrini, G., Soini, E., Riccadonna, S., Franceschi, P., Zulini, L., Masuero, D., et al. (2017). Identification of biomarkers for defense response to Plasmopara viticola in a resistant grape variety. Front. Plant Sci. 8, 1524. doi: 10.3389/fpls.2017.01524
Choudhury, R. A., McRoberts, N., and Gubler, W. D. (2014). Effects of punctuated heat stress on the grapevine powdery mildew pathogen, Erysiphe necator. Phytopathol. Mediterr. 54, 148–158. doi: 10.14601/Phytopathol_Mediterr-12721
Ciubotaru, R. M., Franceschi, P., Zulini, L., Stefanini, M., Škrab, D., Rossarolla, M. D., et al. (2021). Mono-locus and pyramided resistant grapevine cultivars reveal early putative biomarkers upon artificial inoculation with Plasmopara viticola. Front. Plant Sci. 12, 693887. doi: 10.3389/fpls.2021.693887
Coleman, C., Copetti, D., Cipriani, G., Hoffmann, S., Kozma, P., Kovacs, L., et al. (2009). The powdery mildew resistance gene Ren1 co-segregates with an NBS-LRR gene cluster in two Central Asian grapevines. BMC Genet. 10:89. doi: 10.1186/1471-2156-10-89
Cséfalvay, L., Di Gaspero, G., Matouš, K., Bellin, D., Ruperti, B., and Olejníčková, J. (2009). Pre-symptomatic detection of Plasmopara viticola infection in grapevine leaves using chlorophyll fluorescence imaging. Eur. J. Plant Pathol. 125, 291–302. doi: 10.1007/s10658-009-9482-7
Csikós, A., Németh, M. Z., Frenkel, O., Kiss, L., and Váczy, K. Z. (2020). A fresh look at grape powdery mildew (Erysiphe necator) A and B genotypes revealed frequent mixed infections and only B genotypes in flag shoot samples. Plants 9:1156. doi: 10.3390/plants9091156
Cwiek-Kupczyńska, H., Altmann, T., Arend, D., Arnaud, E., Chen, D., Cornut, G., et al. (2016). Measures for interoperability of phenotypic data: minimum information requirements and formatting. Plant Methods 12:44. doi: 10.1186/s13007-016-0144-4
Dalbó, M. A. (1998). Genetic Mapping, QTL Analysis and Marker-Assisted Selection for Disease Resistance Loci in Grapes. PhD dissertation, Cornell University, Ithaca, NY.
Dalbó, M. A., Ye, G. N., Weeden, N. F., Wilcox, W. F., and Reisch, B. I. (2001). Marker-assisted selection for powdery mildew resistance in grapes. J. Am. Soc. Horticult. Sci. 126, 83–89. doi: 10.21273/JASHS.126.1.83
De Nardi, B., Santellani, F., Possamai, T., and Velasco, R. (2019). Breeding for mildew resistance in grapevine to improve environmental and socio-economic sustainability in hotspot areas of Veneto. Acta Hortic. 1248, 313–318. doi: 10.17660/ActaHortic.2019.1248.45
Deglène-Benbrahim, L., Wiedemann-Merdinoglu, S., Merdinoglu, D., and Walter, B. (2010). Evaluation of downy mildew resistance in grapevine by leaf disc bioassay with in vitro-and greenhouse-grown plants. Am. J. Enol. Vitic. 61, 521–528. doi: 10.5344/ajev.2010.10009
Delmas, C. E. L., Dussert, Y., Delière, L., Couture, C., Mazet, I. D., Richart Cervera, S., et al. (2017). Soft selective sweeps in fungicide resistance evolution: recurrent mutations without fitness costs in grapevine downy mildew. Mol. Ecol. 26, 1936–1951. doi: 10.1111/mec.14006
Delmotte, F., Mestre, P., Schneider, C., Kassemeyer, H. H., Kozma, P., Richart-Cervera, S., et al. (2014). Rapid and multiregional adaptation to host partial resistance in a plant pathogenic oomycete: Evidence from European populations of Plasmopara viticola, the causal agent of grapevine downy mildew. Infect. Genet. Evolut. 27, 500–508. doi: 10.1016/j.meegid.2013.10.017
Delp, C. J. (1954). Effect of temperature and humidity on the Grape powdery mildew fungus. Phytopathology® 44, 615–626.
Délye, C., Laigret, F., and Corio-Costet, M.-F. (1997). RAPD analysis provides insight into the biology and epidemiology of Uncinula necator. Phytopathology® 87, 670–677. doi: 10.1094/PHYTO.1997.87.7.670
Develey-Rivière, M., and Galiana, E. (2007). Resistance to pathogens and host developmental stage: a multifaceted relationship within the plant kingdom. New Phytol. 175, 405–416. doi: 10.1111/j.1469-8137.2007.02130.x
Di Gaspero, G., Copetti, D., Coleman, C., Castellarin, S. D., Eibach, R., Kozma, P., et al. (2012). Selective sweep at the Rpv3 locus during grapevine breeding for downy mildew resistance. Theoret. Appl. Genet. 124, 277–286. doi: 10.1007/s00122-011-1703-8
Divilov, K., Barba, P., Cadle-Davidson, L., and Reisch, B. I. (2018). Single and multiple phenotype QTL analyses of downy mildew resistance in interspecific grapevines. Theoret. Appl. Genet. 131, 1133–1143. doi: 10.1007/s00122-018-3065-y
Divilov, K., Wiesner-Hanks, T., Barba, P., Cadle-Davidson, L., and Reisch, B. I. (2017). Computer vision for high-throughput quantitative phenotyping: a case study of grapevine downy mildew sporulation and leaf trichomes. Phytopathology® 107, 1549–1555. doi: 10.1094/PHYTO-04-17-0137-R
Doster, M. A., and Schnathorst, W. C. (1985). Effects of leaf maturity and cultivar resistance on development of the powdery mildew fungus on grapevines. Phytopathology 75:318. doi: 10.1094/Phyto-75-318
Dry, I., Riaz, S., Fuchs, M., Sosnowski, M., and Thomas, M. (2019). “Scion breeding for resistance to biotic stresses,” in The Grape Genome Compendium of Plant Genomes, eds D. Cantu and M. A. Walker (Cham: Springer International Publishing), 319–347. doi: 10.1007/978-3-030-18601-2_15
Dufour, M. C., Fontaine, S., Montarry, J., and Corio-Costet, M. F. (2011). Assessment of fungicide resistance and pathogen diversity in Erysiphe necator using quantitative real-time PCR assays. Pest Manag. Sci. 67, 60–69. doi: 10.1002/ps.2032
Eisenmann, B., Czemmel, S., Ziegler, T., Buchholz, G., Kortekamp, A., Trapp, O., et al. (2019). Rpv3-1 mediated resistance to grapevine downy mildew is associated with specific host transcriptional responses and the accumulation of stilbenes. BMC Plant Biol. 19:343. doi: 10.1186/s12870-019-1935-3
Feechan, A., Kabbara, S., and Dry, I. B. (2011). Mechanisms of powdery mildew resistance in the Vitaceae family. Mol. Plant Pathol. 12, 263–274. doi: 10.1111/j.1364-3703.2010.00668.x
Feechan, A., Kocsis, M., Riaz, S., Zhang, W., Gadoury, D. M., Walker, M. A., et al. (2015). Strategies for Run1 deployment using Run2 and Ren2 to manage grapevine powdery mildew informed by studies of race specificity. Phytopathology 105, 1104–1113. doi: 10.1094/PHYTO-09-14-0244-R
Fernandes de Oliveira, A., Serra, S., Ligios, V., Satta, D., and Nieddu, G. (2021). Assessing the effects of vineyard soil management on downy and powdery mildew development. Horticulturae 7:209. doi: 10.3390/horticulturae7080209
Fischer, B. M., Salakhutdinov, I., Akkurt, M., Eibach, R., Edwards, K. J., Töpfer, R., et al. (2004). Quantitative trait locus analysis of fungal disease resistance factors on a molecular map of grapevine. Theoret. Appl. Genet. 108, 501–515. doi: 10.1007/s00122-003-1445-3
Fontaine, M. C., Austerlitz, F., Giraud, T., Labb,é, F., Papura, D., Richard-Cervera, S., et al. (2013). Genetic signature of a range expansion and leap-frog event after the recent invasion of Europe by the grapevine downy mildew pathogen Plasmopara viticola. Mol. Ecol. 22, 2771–2786. doi: 10.1111/mec.12293
Fontaine, M. C., Labbé, F., Dussert, Y., Delière, L., Richart-Cervera, S., Giraud, T., et al. (2021). Europe as a bridgehead in the worldwide invasion history of grapevine downy mildew, Plasmopara viticola. Curr. Biol. 31, 2155–2166.e4. doi: 10.1016/j.cub.2021.03.009
Frenkel, O., Brewer, M. T., and Milgroom, M. G. (2010). Variation in pathogenicity and aggressiveness of Erysiphe necator from Different Vitis spp. and geographic origins in the Eastern United States. Phytopathology® 100, 1185–1193. doi: 10.1094/PHYTO-01-10-0023
Frenkel, O., Cadle-Davidson, L., Wilcox, W. F., and Milgroom, M. G. (2015). Mechanisms of resistance to an azole fungicide in the grapevine powdery mildew fungus, Erysiphe necator. Phytopathology® 105, 370–377. doi: 10.1094/PHYTO-07-14-0202-R
Fu, P., Wu, W., Lai, G., Li, R., Peng, Y., Yang, B., et al. (2020). Identifying Plasmopara viticola resistance Loci in grapevine (Vitis amurensis) via genotyping-by-sequencing-based QTL mapping. Plant Physiol. Biochem. 154, 75–84. doi: 10.1016/j.plaphy.2020.05.016
Gadoury, D. M., Cadle-Davidson, L., Wilcox, W. F., Dry, I. B., Seem, R. C., and Milgroom, M. G. (2012). Grapevine powdery mildew (Erysiphe necator): a fascinating system for the study of the biology, ecology and epidemiology of an obligate biotroph. Mol. Plant Pathol. 13, 1–16. doi: 10.1111/j.1364-3703.2011.00728.x
Gadoury, D. M., Seem, R. C., Ficke, A., and Wilcox, W. F. (2003). Ontogenic resistance to powdery mildew in grape berries. Phytopathology® 93, 547–555. doi: 10.1094/PHYTO.2003.93.5.547
Gao, Y.-R., Han, Y.-T., Zhao, F.-L., Li, Y.-J., Cheng, Y., Ding, Q., et al. (2016). Identification and utilization of a new Erysiphe necator isolate NAFU1 to quickly evaluate powdery mildew resistance in wild Chinese grapevine species using detached leaves. Plant Physiol. Biochem. 98, 12–24. doi: 10.1016/j.plaphy.2015.11.003
Gessler, C., Pertot, I., and Perazzolli, M. (2011). Plasmopara viticola: a review of knowledge on downy mildew of grapevine and effective disease management. Phytopathol. Mediterr. 50, 3–44. doi: 10.14601/Phytopathol_Mediterr-9360
Gómez-Zeledón, J., Kaiser, M., and Spring, O. (2017). Exploring host-pathogen combinations for compatible and incompatible reactions in grapevine downy mildew. Eur. J. Plant Pathol. 149, 1–10. doi: 10.1007/s10658-017-1156-2
Grattapaglia, D., and Sederoff, R. (1994). Genetic linkage maps of Eucalyptus grandis and Eucalyptus urophylla using a pseudo-testcross: mapping strategy and RAPD markers. Genetics 137, 1121–1137. doi: 10.1093/genetics/137.4.1121
Hamuda, E., Mc Ginley, B., Glavin, M., and Jones, E. (2017). Automatic crop detection under field conditions using the HSV colour space and morphological operations. Comp. Elect. Agri. 133, 97–107. doi: 10.1016/j.compag.2016.11.021
Hariharan, G., and Prasannath, K. (2021). Recent advances in molecular diagnostics of fungal plant pathogens: a mini review. Front. Cell. Infect. Microbiol. 10, 600234. doi: 10.3389/fcimb.2020.600234
Hermanns, M., Slusarenko, A. J., and Schlaich, N. L. (2003). Organ-specificity in a plant disease is determined independently of R gene signaling. Mol. Plant-Microbe Interactions® 16, 752–759. doi: 10.1094/MPMI.2003.16.9.752
Heyman, L., Höfle, R., Kicherer, A., Trapp, O., Ait Barka, E., Töpfer, R., et al. (2021). The durability of quantitative host resistance and variability in pathogen virulence in the interaction between European grapevine cultivars and Plasmopara viticola. Front. Agronomy 3, 684023. doi: 10.3389/fagro.2021.684023
Hoffmann, S., Di Gaspero, G., Kovács, L., Howard, S., Kiss, E., Galbács, Z., et al. (2008). Resistance to Erysiphe necator in the grapevine “Kishmish vatkana” is controlled by a single locus through restriction of hyphal growth. Theoret. Appl. Genet. 116, 427–438. doi: 10.1007/s00122-007-0680-4
Hyma, K. E., Barba, P., Wang, M., Londo, J. P., Acharya, C. B., Mitchell, S. E., et al. (2015). Heterozygous mapping strategy (HetMappS) for high resolution genotyping-by-sequencing markers: a case study in grapevine. PLoS ONE 10, e0134880. doi: 10.1371/journal.pone.0134880
Jaillon, O., Aury, J.-M., Noel, B., Policriti, A., Clepet, C., Casagrande, A., et al. (2007). The grapevine genome sequence suggests ancestral hexaploidization in major angiosperm phyla. Nature 449, 463–467. doi: 10.1038/nature06148
Jeger, M. J., and Viljanen-Rollinson, S. L. H. (2001). The use of the area under the disease-progress curve (AUDPC) to assess quantitative disease resistance in crop cultivars. Theoret. Appl. Genet. 102, 32–40. doi: 10.1007/s001220051615
Karn, A., Zou, C., Brooks, S., Fresnedo-Ramírez, J., Gabler, F., Sun, Q., et al. (2021). Discovery of the Ren11 Locus from Vitis aestivalis for stable resistance to grapevine powdery mildew in a family segregating for several unstable and tissue-specific quantitative resistance loci. Front. Plant Sci. 12, 733899. doi: 10.3389/fpls.2021.733899
Keller, M., Rogiers, S. Y., and Schultz, H. R. (2003). Nitrogen and ultraviolet radiation modify grapevines' susceptibility to powdery mildew. VITIS – J. Grapevine Res. 42, 87–94. doi: 10.5073/vitis.2003.42.87-94
Kennelly, M. M., Gadoury, D. M., Wilcox, W. F., Magarey, P. A., and Seem, R. C. (2005). Seasonal development of ontogenic resistance to downy mildew in grape berries and rachises. Phytopathology® 95, 1445–1452. doi: 10.1094/PHYTO-95-1445
Kennelly, M. M., Gadoury, D. M., Wilcox, W. F., Magarey, P. A., and Seem, R. C. (2007). Primary infection, lesion productivity, and survival of sporangia in the grapevine downy mildew pathogen Plasmopara viticola. Phytopathology® 97, 512–522. doi: 10.1094/PHYTO-97-4-0512
Komárek, M., Cadková, E., Chrastný, V., Bordas, F., and Bollinger, J.-C. (2010). Contamination of vineyard soils with fungicides: a review of environmental and toxicological aspects. Environ. Int. 36, 138–151. doi: 10.1016/j.envint.2009.10.005
Krajewski, P., Chen, D., Cwiek, H., van Dijk, A. D. J., Fiorani, F., Kersey, P., et al. (2015). Towards recommendations for metadata and data handling in plant phenotyping. J. Exp. Bot. 66, 5417–5427. doi: 10.1093/jxb/erv271
Lin, H., Leng, H., Guo, Y., Kondo, S., Zhao, Y., Shi, G., et al. (2019). QTLs and candidate genes for downy mildew resistance conferred by interspecific grape (V. vinifera L. × V. amurensis Rupr.) crossing. Sci. Horticulturae 244:e045. doi: 10.1016/j.scienta.2018.09.045
Liu, B., Ding, Z., Tian, L., He, D., Li, S., and Wang, H. (2020). Grape leaf disease identification using improved deep convolutional neural networks. Front. Plant Sci. 11, 1082. doi: 10.3389/fpls.2020.01082
Lorenz, D. H., Eichhorn, K. W., Bleiholder, H., Klose, R., Meier, U., and Weber, E. (1995). Growth stages of the grapevine: phenological growth stages of the grapevine (Vitis vinifera L. ssp. vinifera)-Codes and descriptions according to the extended BBCH scale. Austr. J. Grape Wine Res. 1, 100–103. doi: 10.1111/j.1755-0238.1995.tb00085.x
Mahaffee, W. F., and Stoll, R. (2016). The Ebb and flow of airborne pathogens: monitoring and use in disease management decisions. Phytopathology® 106, 420–431. doi: 10.1094/PHYTO-02-16-0060-RVW
Mahanil, S., Ramming, D., Cadle-Davidson, M., Owens, C., Garris, A., Myles, S., et al. (2012). Development of marker sets useful in the early selection of Ren4 powdery mildew resistance and seedlessness for table and raisin grape breeding. Theoret. Appl. Genet. 124, 23–33. doi: 10.1007/s00122-011-1684-7
Malacarne, G., Vrhovsek, U., Zulini, L., Cestaro, A., Stefanini, M., Mattivi, F., et al. (2011). Resistance to Plasmopara viticola in a grapevine segregating population is associated with stilbenoid accumulation and with specific host transcriptional responses. BMC Plant Biol. 11:114. doi: 10.1186/1471-2229-11-114
Marguerit, E., Boury, C., Manicki, A., Donnart, M., Butterlin, G., Némorin, A., et al. (2009). Genetic dissection of sex determinism, inflorescence morphology and downy mildew resistance in grapevine. Theoret. Appl. Genet. 118, 1261–1278. doi: 10.1007/s00122-009-0979-4
Marino, R., Sevini, F., Madini, A., Vecchione, A., Pertot, I., Dalla Serra, A., et al. (2003). QTL mapping for disease resistance and fruit quality in grape. Acta Hortic. 2003, 527–533. doi: 10.17660/ActaHortic.2003.603.69
Massi, F., Torriani, S. F. F., Borghi, L., and Toffolatti, S. L. (2021). Fungicide resistance evolution and detection in plant pathogens: Plasmopara viticola as a case study. Microorganisms 9:119. doi: 10.3390/microorganisms9010119
Merdinoglu, D., Schneider, C., Prado, E., Wiedemann-Merdinoglu, S., and Mestre, P. (2018). Breeding for durable resistance to downy and powdery mildew in grapevine. Oeno One 52:e2116. doi: 10.20870/oeno-one.2018.52.3.2116
Merdinoglu, D., Wiedemann-Merdinoglu, S., Coste, P., Dumas, V., Haetty, S., Butterlin, G., et al. (2003). Genetic analysis of downy mildew resistance derived from Muscadinia Rotundifolia. Acta Hortic. 2003, 451–456. doi: 10.17660/ActaHortic.2003.603.57
Merry, A. M., Evans, K. J., Corkrey, R., and Wilson, S. J. (2013). Coincidence of maximum severity of powdery mildew on grape leaves and the carbohydrate sink-to-source transition. Plant Pathol. 62, 842–850. doi: 10.1111/j.1365-3059.2012.02691.x
Miazzi, M., Natale, P., Pollastro, S., and Faretra, F. (1997). Handling of the biotrophic pathogen Uncinula necator (schw.) Burr. under laboratory conditions and observations on its mating system. J. Plant Pathol. 78, 71–77.
Miclot, A.-S., Wiedemann-Merdinoglu, S., Duchêne, E., Merdinoglu, D., and Mestre, P. (2012). A standardized method for the quantitative analysis of resistance to grapevine powdery mildew. Eur. J. Plant Pathol. 133, 483–495. doi: 10.1007/s10658-011-9922-z
Montarry, J., Cartolaro, P., Delmotte, F., Jolivet, J., and Willocquet, L. (2008). Genetic structure and aggressiveness of Erysiphe necator populations during grapevine powdery mildew epidemics. Appl. Environ. Microbiol. 74, 6327–6332. doi: 10.1128/AEM.01200-08
Moreira, F. M., Madini, A., Marino, R., Zulini, L., Stefanini, M., Velasco, R., et al. (2011). Genetic linkage maps of two interspecific grape crosses (Vitis spp.) used to localize quantitative trait loci for downy mildew resistance. Tree Genet. Genomes 7, 153–167. doi: 10.1007/s11295-010-0322-x
Mouafo-Tchinda, R. A., Beaulieu, C., Fall, M. L., and Carisse, O. (2021). Effect of temperature on aggressiveness of Plasmopara viticola f. sp. aestivalis and P. viticola f. sp. riparia from eastern Canada. Canad. J. Plant Pathol. 43, 73–87. doi: 10.1080/07060661.2020.1758958
Moyer, M. M., Gadoury, D. M., Cadle-Davidson, L., Dry, I. B., Magarey, P. A., Wilcox, W. F., et al. (2010). Effects of acute low-temperature events on development of Erysiphe necator and susceptibility of Vitis vinifera. Phytopathology® 100, 1240–1249. doi: 10.1094/PHYTO-01-10-0012
Moyer, M. M., Londo, J., Gadoury, D. M., and Cadle-Davidson, L. (2016). Cold Stress-Induced Disease Resistance (SIDR): indirect effects of low temperatures on host-pathogen interactions and disease progress in the grapevine powdery mildew pathosystem. Eur. J. Plant Pathol. 144, 695–705. doi: 10.1007/s10658-015-0745-1
Negrel, L., Halter, D., Wiedemann-Merdinoglu, S., Rustenholz, C., Merdinoglu, D., Hugueney, P., et al. (2018). Identification of lipid markers of Plasmopara viticola infection in grapevine using a non-targeted metabolomic approach. Front. Plant Sci. 9, 360. doi: 10.3389/fpls.2018.00360
Nicolopoulou-Stamati, P., Maipas, S., Kotampasi, C., Stamatis, P., and Hens, L. (2016). Chemical pesticides and human health: the urgent need for a new concept in agriculture. Front. Public Health 4, 148. doi: 10.3389/fpubh.2016.00148
Ochssner, I., Hausmann, L., and Töpfer, R. (2016). Rpvl4, a new genetic source for Plasmopara viticola resistance conferred by Vitis cinerea. VITIS – J. Grapevine Res. 55, 2. doi: 10.5073/vitis.2016.55.79-81
Oerke, E. C., Herzog, K., and Toepfer, R. (2016). Hyperspectral phenotyping of the reaction of grapevine genotypes to Plasmopara viticola. J. Exp. Bot. 67, 5529–5543. doi: 10.1093/jxb/erw318
OIV (2009). Descriptor List for Grape Varieties and Vitis Species, 2nd edn. Paris: Office International de la Vigne et du Vin. Available online at: http://www.ov.org
Özer, N., Uzun, H. I., Aktürk, B., Özer, C., Akkurt, M., and Aydin, S. (2021). Resistance assessment of grapevine leaves to downy mildew with sporulation area scoring. Eur. J. Plant Pathol. 160, 337–348. doi: 10.1007/s10658-021-02247-2
Pap, D., Riaz, S., Dry, I. B., Jermakow, A., Tenscher, A. C., Cantu, D., et al. (2016). Identification of two novel powdery mildew resistance loci, Ren6 and Ren7, from the wild Chinese grape species Vitis piasezkii. BMC Plant Biol. 16:170. doi: 10.1186/s12870-016-0855-8
Papoutsoglou, E. A., Faria, D., Arend, D., Arnaud, E., Athanasiadis, I. N., Chaves, I., et al. (2020). Enabling reusability of plant phenomic datasets with MIAPPE 1.1. New Phytol. 227, 260–273. doi: 10.1111/nph.16544
Parlevliet, J. E. (1979). Components of resistance that reduce the rate of epidemic development. Annu. Rev. Phytopathol. 17, 203–222. doi: 10.1146/annurev.py.17.090179.001223
Pauquet, J., Bouquet, A., This, P., and Adam-Blondon, A. F. (2001). Establishment of a local map of AFLP markers around the powdery mildew resistance gene Run1 in grapevine and assessment of their usefulness for marker assisted selection. Theoret. Appl. Gene. 103, 1201–1210. doi: 10.1007/s001220100664
Peressotti, E., Dolzani, C., Poles, L., Banchi, E., Stefanini, M., Salamini, F., et al. (2015). A first pedegree-based analysis (PBA) approach for the detection of disease resistance traits in grapevine hybrids. Acta Hortic. 2015, 113–121. doi: 10.17660/ActaHortic.2015.1082.15
Peressotti, E., Duchêne, E., Merdinoglu, D., and Mestre, P. (2011). A semi-automatic non-destructive method to quantify grapevine downy mildew sporulation. J. Microbiol. Methods 84, 265–271. doi: 10.1016/j.mimet.2010.12.009
Peressotti, E., Wiedemann-Merdinoglu, S., Delmotte, F., Bellin, D., Di Gaspero, G., Testolin, R., et al. (2010). Breakdown of resistance to grapevine downy mildew upon limited deployment of a resistant variety. BMC Plant Biol. 10, 147. doi: 10.1186/1471-2229-10-147
Peros, J. P., Nguyen, T. H., Troulet, C., Michel-Romiti, C., and Notteghem, J. L. (2006). Assessment of powdery mildew resistance of grape and Erysiphe necator pathogenicity using a laboratory assay. VITIS-J. Grapevine Res. 45, 29. doi: 10.5073/vitis.2006.45.29-36
Pertot, I., Caffi, T., Rossi, V., Mugnai, L., Hoffmann, C., Grando, M. S., et al. (2017). A critical review of plant protection tools for reducing pesticide use on grapevine and new perspectives for the implementation of IPM in viticulture. Crop Prot. 97, 70–84. doi: 10.1016/j.cropro.2016.11.025
Pitsili, E., Phukan, U. J., and Coll, N. S. (2020). Cell death in plant immunity. Cold Spring Harb. Perspect. Biol. 12:a036483. doi: 10.1101/cshperspect.a036483
Poland, J. A., and Nelson, R. J. (2011). In the eye of the beholder: the effect of rater variability and different rating scales on QTL mapping. Phytopathology® 101, 290–298. doi: 10.1094/PHYTO-03-10-0087
Possamai, T., Migliaro, D., Gardiman, M., Velasco, R., and De Nardi, B. (2020). Rpv Mediated defense responses in grapevine offspring resistant to Plasmopara viticola. Plants 9:781. doi: 10.3390/plants9060781
Possamai, T., Wiedemann-Merdinoglu, S., Merdinoglu, D., Migliaro, D., De Mori, G., Cipriani, G., et al. (2021). Construction of a high-density genetic map and detection of a major QTL of resistance to powdery mildew (Erysiphe necator Sch.) in Caucasian grapes (Vitis vinifera L.). BMC Plant Biol. 21:528. doi: 10.1186/s12870-021-03174-4
Ramming, D. W., Gabler, F., Smilanick, J., Cadle-Davidson, M., Barba, P., Mahanil, S., et al. (2011). A single dominant locus, Ren4, confers rapid non-race-specific resistance to grapevine powdery mildew. Phytopathology® 101, 502–508. doi: 10.1094/PHYTO-09-10-0237
Rawat, W., and Wang, Z. (2017). Deep convolutional neural networks for image classification: a comprehensive review. Neural Comput. 29, 2352–2449. doi: 10.1162/neco_a_00990
Riaz, S., Menéndez, C. M., Tenscher, A., Pap, D., and Walker, M. A. (2020). Genetic mapping and survey of powdery mildew resistance in the wild Central Asian ancestor of cultivated grapevines in Central Asia. Hortic Res 7:104. doi: 10.1038/s41438-020-0335-z
Riaz, S., Tenscher, A. C., Ramming, D. W., and Walker, M. A. (2011). Using a limited mapping strategy to identify major QTLs for resistance to grapevine powdery mildew (Erysiphe necator) and their use in marker-assisted breeding. Theor. Appl. Gene. 122, 1059–1073. doi: 10.1007/s00122-010-1511-6
Rocca-Serra, P., Brandizi, M., Maguire, E., Sklyar, N., Taylor, C., Begley, K., et al. (2010). ISA software suite: supporting standards-compliant experimental annotation and enabling curation at the community level. Bioinformatics 26, 2354–2356. doi: 10.1093/bioinformatics/btq415
Rouxel, M., Mestre, P., Comont, G., Lehman, B. L., Schilder, A., and Delmotte, F. (2013). Phylogenetic and experimental evidence for host-specialized cryptic species in a biotrophic oomycete. New Phytol. 197, 251–263. doi: 10.1111/nph.12016
Santos, R. F., Ciampi-Guillardi, M., Fraaije, B. A., de Oliveira, A. A., and Amorim, L. (2020). The climate-driven genetic diversity has a higher impact on the population structure of Plasmopara viticola than the production system or QoI fungicide sensitivity in subtropical Brazil. Front. Microbiol. 11, 575045. doi: 10.3389/fmicb.2020.575045
Sapkota, S., Chen, L.-L., Yang, S., Hyma, K. E., Cadle-Davidson, L., and Hwang, C.-F. (2019). Construction of a high-density linkage map and QTL detection of downy mildew resistance in Vitis aestivalis-derived ‘Norton.' Theor. Appl. Gene. 132, 137–147. doi: 10.1007/s00122-018-3203-6
Sargolzaei, M., Maddalena, G., Bitsadze, N., Maghradze, D., Bianco, P. A., Failla, O., et al. (2020). Rpv29, Rpv30 and Rpv31: Three novel genomic loci associated with resistance to Plasmopara viticola in Vitis vinifera. Front. Plant Sci. 11, 562432. doi: 10.3389/fpls.2020.562432
Savoi, S., Arapitsas, P., Duchêne, É., Nikolantonaki, M., Ontañón, I., Carlin, S., et al. (2021). Grapevine and wine metabolomics-based guidelines for FAIR data and metadata management. Metabolites 11:757. doi: 10.3390/metabo11110757
Schwander, F., Eibach, R., Fechter, I., Hausmann, L., Zyprian, E., and Töpfer, R. (2012). Rpv10: a new locus from the Asian Vitis gene pool for pyramiding downy mildew resistance loci in grapevine. Theor. Appl. Genet. 124, 163–176. doi: 10.1007/s00122-011-1695-4
Shrestha, R., Matteis, L., Skofic, M., Portugal, A., McLaren, G., Hyman, G., et al. (2012). Bridging the phenotypic and genetic data useful for integrated breeding through a data annotation using the Crop Ontology developed by the crop communities of practice. Front. Physiol. 3, e00326. doi: 10.3389/fphys.2012.00326
Štambuk, P., Šikuten, I., Preiner, D., Nimac, A., and Lazarević, B. (2021). Screening of croatian native grapevine varieties for susceptibility to Plasmopara viticola using leaf disc bioassay, chlorophyll fluorescence, and multispectral imaging. Plants 10:661. doi: 10.3390/plants10040661
Staudt, G. (1997). Evaluation of resistance to grapevine powdery mildew (Uncinula necator [Scuw.] Burr., anamorph Oidium tuckeri Berk.) in accessions of Vitis species. VITIS – J. Grapevine Res. 50, 123–126.
Staudt, G., and Kassemeyer, H. (1995). Evaluation of downy mildew resistance in various accessions of wild Vitis species. VITIS – J. Grapevine Res. 1995, 225–228.
Strugala, R., Delventhal, R., and Schaffrath, U. (2015). An organ-specific view on non-host resistance. Front. Plant Sci. 6, e0526. doi: 10.3389/fpls.2015.00526
Taylor, A. S., Knaus, B. J., Grünwald, N. J., and Burgess, T. (2019). Population genetic structure and cryptic species of Plasmopara viticola in Australia. Phytopathology® 109, 1975–1983. doi: 10.1094/PHYTO-04-19-0146-R
Teh, S. L., Fresnedo-Ramírez, J., Clark, M. D., Gadoury, D. M., Sun, Q., Cadle-Davidson, L., et al. (2017). Genetic dissection of powdery mildew resistance in interspecific half-sib grapevine families using SNP-based maps. Mol. Breed. 37, 586. doi: 10.1007/s11032-016-0586-4
Thiessen, L. D., Neill, T. M., and Mahaffee, W. F. (2018). Development of a quantitative loop-mediated isothermal amplification assay for the field detection of Erysiphe necator. PeerJ 6:e4639. doi: 10.7717/peerj.4639
Töpfer, R., Hausmann, L., Harst, M., Maul, E., and Zyprian, E. (2011). “New horizons for grapevine breeding,” in Fruit, Vegetable and Cereal Science and Biotechnology, Methods in Temperate Fruit Breeding, eds H. Flachowsky and M. V. Hanke (Isleworth: Global Science Books).
Töpfer, R., and Trapp, O. (2022). A cool climate perspective on grapevine breeding: climate change and sustainability are driving forces for changing varieties in a traditional market. Theor. Appl. Genet. 1026:4077. doi: 10.1007/s00122-022-04077-0
Townsend, G. R., and Heuberger, J. W. (1943). Methods for estimating losses caused by disease in fungicide experiments. Plant Dis. Report. 27, 340–343.
Valsesia, G., Gobbin, D., Patocchi, A., Vecchione, A., Pertot, I., and Gessler, C. (2005). Development of a high-throughput method for quantification of Plasmopara viticola DNA in grapevine leaves by means of quantitative real-time polymerase chain reaction. Phytopathology® 95, 672–678. doi: 10.1094/PHYTO-95-0672
van Heerden, C. J., Burger, P., Vermeulen, A., and Prins, R. (2014). Detection of downy and powdery mildew resistance QTL in a ‘Regent' × ‘RedGlobe' population. Euphytica 200, 281–295. doi: 10.1007/s10681-014-1167-4
Venuti, S., Copetti, D., Foria, S., Falginella, L., Hoffmann, S., Bellin, D., et al. (2013). Historical introgression of the downy mildew resistance gene Rpv12 from the Asian species Vitis amurensis into grapevine varieties. PLoS ONE 8, e61228. doi: 10.1371/journal.pone.0061228
Vezzulli, S., Malacarne, G., Masuero, D., Vecchione, A., Dolzani, C., Goremykin, V., et al. (2019). The Rpv3-3 haplotype and stilbenoid induction mediate downy mildew resistance in a grapevine interspecific population. Front. Plant Sci. 10, 204. doi: 10.3389/fpls.2019.00234
Vezzulli, S., Vecchione, A., Stefanini, M., and Zulini, L. (2018). Downy mildew resistance evaluation in 28 grapevine hybrids promising for breeding programs in Trentino region (Italy). Eur. J. Plant Pathol. 150, 485–495. doi: 10.1007/s10658-017-1298-2
Welter, L. J., Göktürk-Baydar, N., Akkurt, M., Maul, E., Eibach, R., Töpfer, R., et al. (2007). Genetic mapping and localization of quantitative trait loci affecting fungal disease resistance and leaf morphology in grapevine (Vitis vinifera L). Mol. Breed. 20, 359–374. doi: 10.1007/s11032-007-9097-7
Wiedemann-Merdinoglu, S., Prado, E., Coste, P., Dumas, V., Butterlin, G., Bouquet, A., et al. (2006). “Genetic analysis of resistance to downy mildew from Muscadinia rotundifolia,” in: 9th International Conference on Grape Genetics and Breeding.02-06.07.2006. (Udine: Abstract of poster).
Wingerter, C., Eisenmann, B., Weber, P., Dry, I., and Bogs, J. (2021). Grapevine Rpv3-, Rpv10- and Rpv12-mediated defense responses against Plasmopara viticola and the impact of their deployment on fungicide use in viticulture. BMC Plant Biol. 21:470. doi: 10.1186/s12870-021-03228-7
Yobrégat, O. (2018). Introduction to resistant vine types: a brief history and overview of the situation. OENO One 52, 241–246. doi: 10.20870/oeno-one.2018.52.3.2220
Zendler, D., Malagol, N., Schwandner, A., Töpfer, R., Hausmann, L., and Zyprian, E. (2021b). High-throughput phenotyping of leaf disks infected with grapevine downy mildew using shallow convolutional neural networks. Agronomy 11:1768. doi: 10.3390/agronomy11091768
Zendler, D., Schneider, P., Töpfer, R., and Zyprian, E. (2017). Fine mapping of Ren3 reveals two loci mediating hypersensitive response against Erysiphe necator in grapevine. Euphytica 213:68. doi: 10.1007/s10681-017-1857-9
Zendler, D., Töpfer, R., and Zyprian, E. (2021a). Confirmation and fine mapping of the resistance locus Ren9 from the grapevine cultivar ‘Regent.' Plants 10:24. doi: 10.3390/plants10010024
Keywords: Erysiphe necator, grapevine, phenotyping, Plasmopara viticola, QTL, resistance breeding, Rpv, Ren/Run
Citation: Possamai T and Wiedemann-Merdinoglu S (2022) Phenotyping for QTL identification: A case study of resistance to Plasmopara viticola and Erysiphe necator in grapevine. Front. Plant Sci. 13:930954. doi: 10.3389/fpls.2022.930954
Received: 28 April 2022; Accepted: 27 June 2022;
Published: 11 August 2022.
Edited by:
Gabriella De Lorenzis, University of Milan, ItalyReviewed by:
Summaira Riaz, University of California, Davis, United StatesLudger Hausmann, Institut für Rebenzüchtung, Julius Kühn-Institut, Germany
Copyright © 2022 Possamai and Wiedemann-Merdinoglu. This is an open-access article distributed under the terms of the Creative Commons Attribution License (CC BY). The use, distribution or reproduction in other forums is permitted, provided the original author(s) and the copyright owner(s) are credited and that the original publication in this journal is cited, in accordance with accepted academic practice. No use, distribution or reproduction is permitted which does not comply with these terms.
*Correspondence: Sabine Wiedemann-Merdinoglu, c2FiaW5lLndpZWRlbWFubkBpbnJhZS5mcg==