 Yuan Liu1,2,3†
 Chenwei Nie2,3†
 Zhen Zhang1
 ZiXu Wang2,4Bo Ming2Jun Xue2
 Hongye Yang2Honggen Xu2Lin Meng2,3Ningbo Cui5Wenbin Wu6*
 Xiuliang Jin1,2,3*
- 1School of Geomatics, Anhui University of Science and Technology, Huainan, China
- 2Institute of Crop Sciences, Chinese Academy of Agricultural Sciences/Key Laboratory of Crop Physiology and Ecology, Ministry of Agriculture, Beijing, China
- 3National Nanfan Research Institute (Sanya), Chinese Academy of Agricultural Sciences, Sanya, China
- 4Engineering Mapping and Geographical Information Division, Henan Provincial Communications Planning & Design Institute Co., LTD, Zhengzhou, China
- 5State Key Laboratory of Hydraulics and Mountain River Engineering & College of Water Resource and Hydropower, Sichuan University, Chengdu, China
- 6Institute of Agricultural Resources and Regional Planning, Chinese Academy of Agricultural Sciences, Beijing, China
Timely and accurate pre-harvest estimates of maize yield are vital for agricultural management. Although many remote sensing approaches have been developed to estimate maize yields, few have been tested under lodging conditions. Thus, the feasibility of existing approaches under lodging conditions and the influence of lodging on maize yield estimates both remain unclear. To address this situation, this study develops a lodging index to quantify the degree of lodging. The index is based on RGB and multispectral images obtained from a low-altitude unmanned aerial vehicle and proves to be an important predictor variable in a random forest regression (RFR) model for accurately estimating maize yield after lodging. The results show that (1) the lodging index accurately describes the degree of lodging of each maize plot, (2) the yield-estimation model that incorporates the lodging index provides slightly more accurate yield estimates than without the lodging index at three important growth stages of maize (tasseling, milking, denting), and (3) the RFR model with lodging index applied at the denting (R5) stage yields the best performance of the three growth stages, with R2 = 0.859, a root mean square error (RMSE) of 1086.412 kg/ha, and a relative RMSE of 13.1%. This study thus provides valuable insight into the precise estimation of crop yield and demonstra\tes that incorporating a lodging stress-related variable into the model leads to accurate and robust estimates of crop grain yield.
1. Introduction
Given the population growth, the demand for food supplies is increasing all over the world (Mishra et al., 2021). Furthermore, limited arable land and frequent extreme weather events have resulted in significant stress on food security. Maize, one of the most important grain crops in the world, is a staple grain crop in China (Jin et al., 2020), where 273 million tons were harvested in 2021, accounting for 40% of global grain production. Timely, accurate, and nondestructive pre-harvest estimation of maize yield is vital for the authorities to formulate corresponding regulation policies and ensure the stability of grain prices and food security (Yu et al., 2020; Feng et al., 2021; Wu et al., 2021). Such estimates also facilitate the development of precision agriculture.
Remote sensing technology can quickly and accurately obtain wall-to-wall information on the land surface and has been widely used to estimate the yield of various food crops (Ju et al., 2021; Maimaitijiang et al., 2021; Nagy et al., 2021). However, satellite remote sensing is often limited by low spatial resolution, long revisit period, and cloudy weather, which prevents image acquisition at certain time points (Xu et al., 2021a). The development of unmanned aerial vehicles (UAVs) provides a way to solve these problems (Peng et al., 2021). As a new tool of information acquisition, UAV remote sensing has irreplaceable advantages in agricultural production (Duan et al., 2021), achieving accurate results with low cost, convenient operation, high spatial-temporal resolution and more (Tao et al., 2020; Wang et al., 2021).
Two main methods exist for crop yield estimation based on UAV remote sensing: data-assimilation methods and statistical models. Data assimilation methods involve crop growth models, which simulate crop growth, development, and yield by combining crop and environment parameters, such as crop species, soil-plant dynamics, water status, and meteorological data (Palosuo et al., 2011; Wu et al., 2021). Assimilating remote sensing data with crop growth models, including WOFOST (van Diepen et al., 1989), AquaCrop (Steduto et al., 2009), DSSAT (Jones et al., 2003), and SWAP (Van Dam et al., 1997), have achieved good results in crop yield estimation. However, these models require a set of biotic and abiotic parameters for model calibration (Kang and Özdoğan, 2019), which undoubtedly increases the complexity of the model because some of the parameters are difficult to obtain. In addition, a certain amount of error exists in most of the environment data acquired from remote sensing data. Consequently, the applicability of the data-assimilation methods is limited in large-scale-yield modeling (Zhang et al., 2019). Statistical models are the earliest and simplest methods to estimate crop yield and are favored by numerous researchers. The basis of statistical models is to establish a linear or nonlinear regression between remote sensing data and measured crop yield (Duan et al., 2017; Zhou et al., 2017). Crop yield estimated by this approach does not address the physiological mechanisms that determine plant growth (Crane-Droesch, 2018), so fewer auxiliary measurements are required. Statistical models to estimate crop yield can be further divided into two categories: linear and nonlinear models. The linear models directly construct the relationship between vegetation indices and crop yield based on linear regressions. However, empirical relationships between crop yield and estimators (e.g., vegetation indices, canopy height, and canopy coverage) usually present nonlinearities (Johnson et al., 2016). Given the generally high degree of autocorrelation of these estimators, yield-estimation models using these variables over time are prone to overfitting. In view of these limitations, machine-learning algorithms were developed to better deal with nonlinearities and reduce overfitting, which is the second type of statistical model. The most successful machine-learning methods for yield estimation include random forest regression (RFR) (Wan et al., 2020; Li et al., 2021), support vector regression (Shafiee et al., 2021), and partial least squares regression (Rischbeck et al., 2016).
Estimating crop yield based on statistical models usually uses spectral, structural, and textural information. Spectral vegetation indices derived from multispectral or hyperspectral data are closely related to some vegetation parameters, such as leaf area index (Tan et al., 2020), green biomass (Li et al., 2020), and crop yield (Panek and Gozdowski, 2021). They describe the average tonal variations in various bands. Structural information such as canopy height and canopy coverage have been used to depict the physiological and geometric characteristics of vegetation and are good indicators of plant growth and crop yield (Malambo et al., 2018). Texture information, characterized by the spatial distribution of tonal variations within a band (Haralick et al., 1973), highlights the structural and geometric features of the plant canopy. Numerous previous studies have estimated crop biomass and yield based on texture (Zheng et al., 2018; Yue et al., 2019; Maimaitijiang et al., 2020). Most studies have focused on using these three common predictors for maize-yield estimates (Rischbeck et al., 2016; Wan et al., 2020). However, few studies have considered how lodging affects crop yield estimation, despite lodging being a common occurrence during the growing season. When lodging occurs, the photosynthetic capacity and dry matter production capacity decrease (Luo et al., 2022), and the transport of water, nutrients, and carbohydrates through the xylem and phloem is cut off (Kashiwagi et al., 2015). During the 12-leaf stage, stalk and root lodging can reduce maize yield by 14% and 28%, respectively (Xue et al., 2017). Every 1% increase in lodging reduces maize yield by an average of 108 kg/ha (Liu et al., 2021). As a result, lodging leads to the loss of crop yield and the reduction of grain quality (Tan et al., 2021). Therefore, lodging may affect yield estimates. To improve crop yield, studies on maize lodging have investigated the factors that cause or affect lodging and have screened lodging-resistant varieties (Chen et al., 2021; Li et al., 2022). In studies of crop yield estimation using agricultural remote sensing, the crop-yield response to lodging has been widely discussed (Acreche and Slafer, 2011; Mi et al., 2011). However, few investigations have focused on how lodging affects model performance and robustness (Chauhan et al., 2019).
To accurately estimate maize yield after lodging, we develop herein a lodging index to represent the degree of lodging of each plot. In addition, we propose a method to estimate maize yield based on spectral features, structural features, texture features, and the lodging index extracted from UAV-based RGB and multispectral images. The analyses were conducted at three different maize growth stages (tasseling stage, milking stage, and denting stage). The specific objectives of this study are (1) to develop an index that represents the degree of maize lodging, (2) to explore how the lodging index correlates with the current model used to estimate maize yield, and (3) to develop a method to accurately estimate maize yield under lodging conditions.
2. Materials and methods
2.1. Study area and experimental setup
The study area was located at the Xinxiang Experimental Station of the Chinese Academy of Agricultural Sciences (35°7′51.6″N, 113°45′58″E; elevation 75 m), Henan Province in China (Figure 1). Xinxiang County is in the North China Plain and has a warm continental monsoon climate characterized by four distinct seasons. The main crop grown in the summer is maize. The average annual precipitation and temperature are 560.6 mm and 14.3 °C, respectively. The average annual precipitation is unevenly distributed, being mostly concentrated between June and September, when about 75% of the annual rainfall occurs.
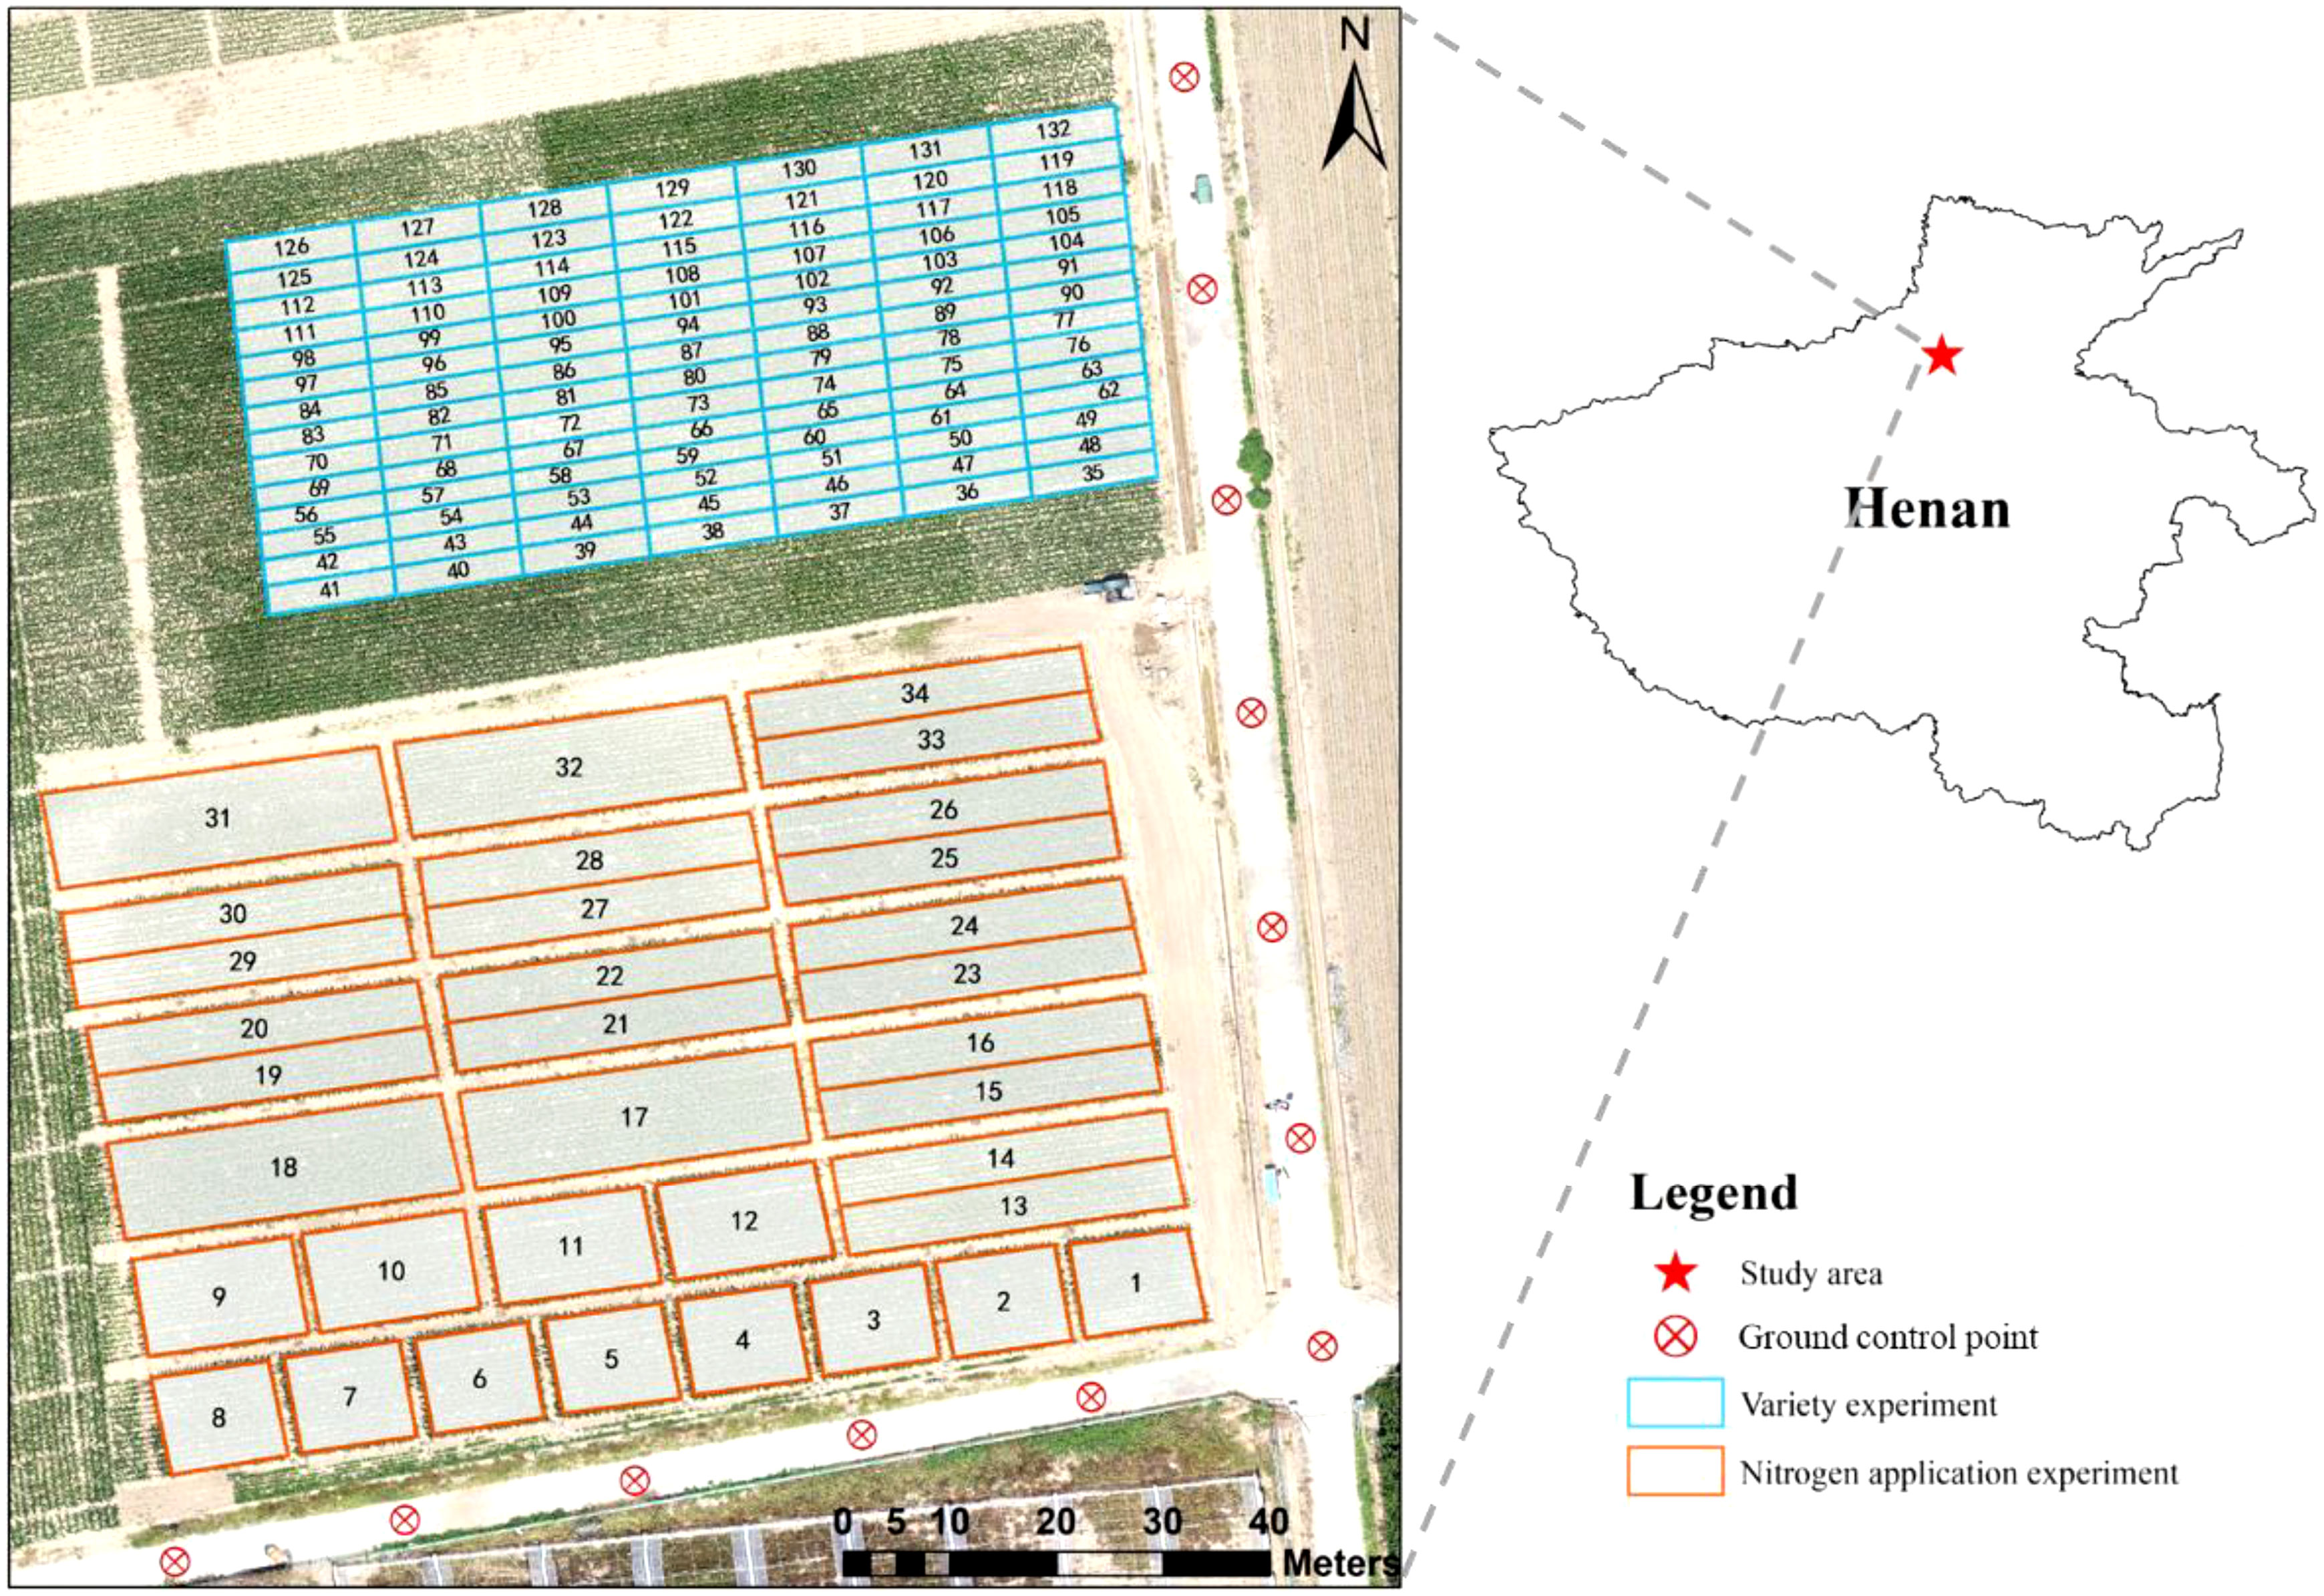
Figure 1 Study area location and layout of the experimental site.
Maize was planted in 132 plots with different varieties and fertilizer treatments (Figure 1) to ensure the generalizability of the proposed method and avoid overfitting. In the variety experiment, 98 maize varieties with different genotypes and lodging resistance were planted, each in a 3 m × 10 m plot. The same fertilizer treatment was applied in each plot. In the nitrogen-treatment experiment, two maize varieties widely planted in north China (JNK728 and ZD958) were planted in 34 plots, with varied fertilizer treatment (0–400 kg/ha) and application time (from before sowing to the silking stage). In all the plots, urea (CH4N2O) was used as nitrogen source. The planting density was 75 000 plants/ha, with a row spacing of 60 cm, and a plant spacing of 23 cm.
2.2. Data acquisition
2.2.1. UAV images acquisition
This study used a DJI M600 pro UAV (Figure 2A, DJI Innovation Co., Ltd., Shenzhen, China) equipped with a Sony α7RII and a RedEdge-MX camera to collect RGB images and multispectral images, respectively (Figure 2B). The Sony α7RII digital camera uses a complementary 35.9 × 24.0 mm2 metal-oxide semiconductor sensor with a resolution of 42.4 million pixels. The RedEdge-MX multispectral camera includes five bands (blue or B, green or G, red or R, red edge or RE, and near-infrared or NIR) within the spectral region of 400–1000 nm. The details of each sensor are given in Table 1.
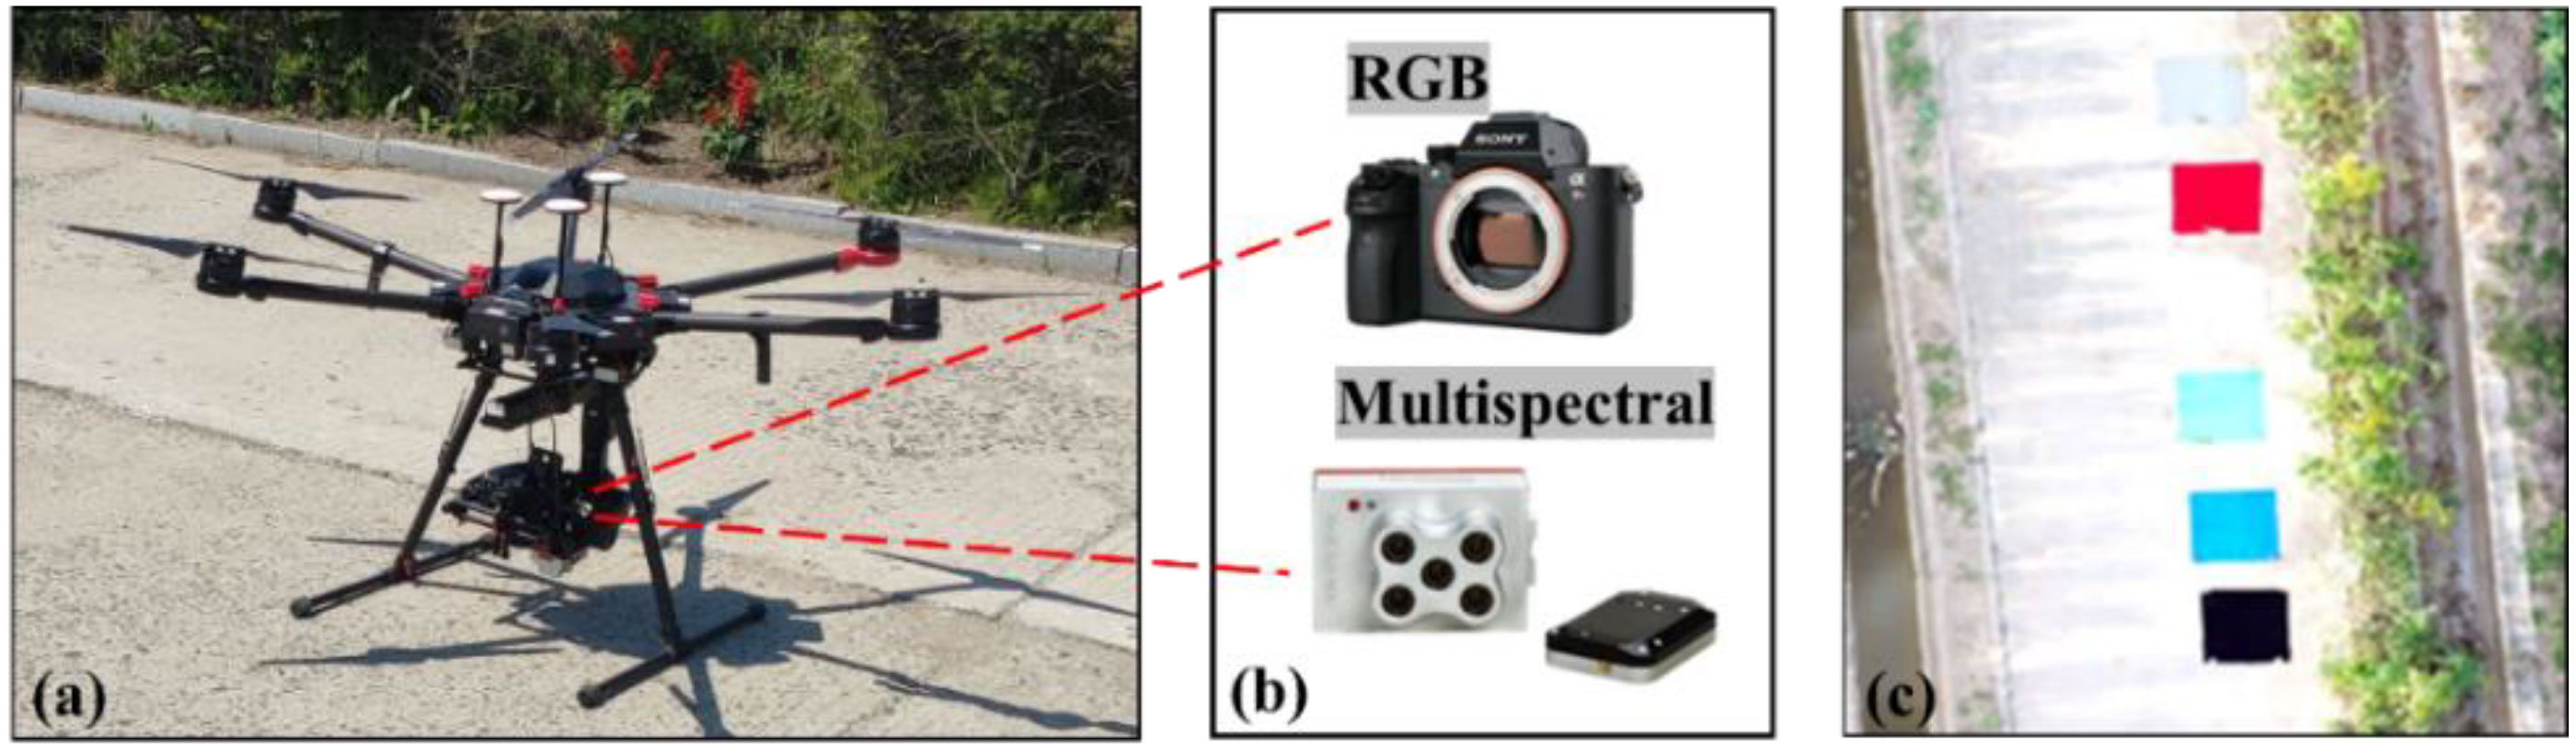
Figure 2 The UAV platform and sensors: (A) DJI M600 pro, (B) Sony α7RII and MicaSense RedEdge-MX, and (C) six tarpaulins of different colors.
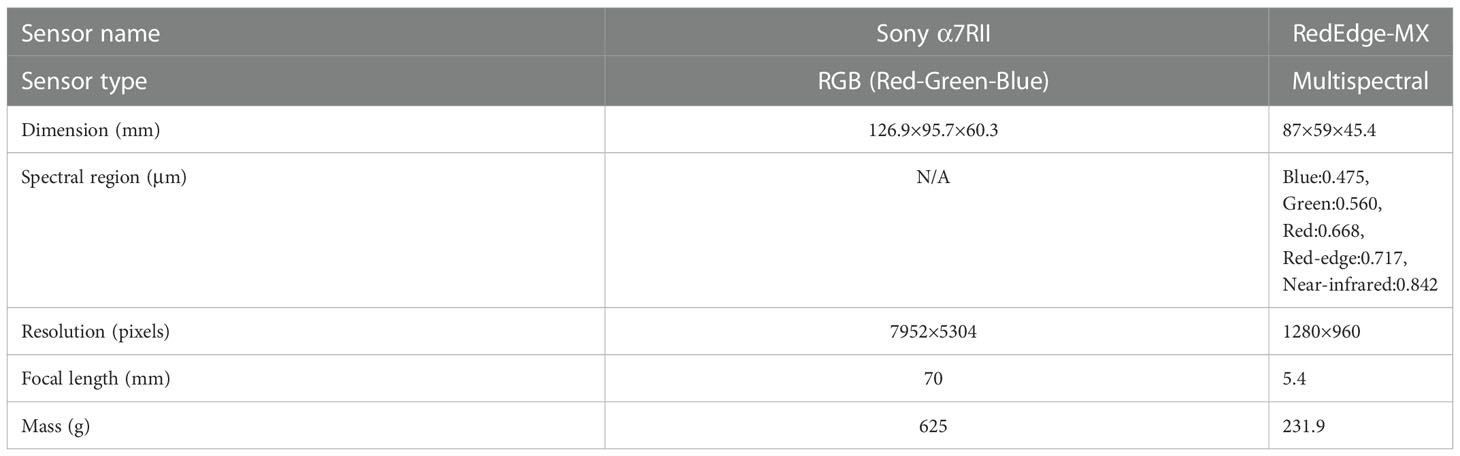
Table 1 Basic parameters of the sensors mounted on the UAV.
UAV images of summer maize were collected in 2020 at the stages of tasseling (VT), milking (R3), and denting (R5). Three flight missions were undertaken at 30 m height and a speed of 2.1 m/s. Each flight mission took about 30 minutes. The lateral and forward overlaps were 80% and 90%, respectively. Each flight campaign was conducted during clear and sunny weather between 12 p.m. and 2 p.m. to reduce the impact on image quality of cloud cover and changes in solar zenith angle. To calibrate the multispectral camera, the FieldSpec 4s spectroradiometer (Analytical Spectral Devices, Boulder, Colorado, USA) was used to measure the reflectivity of tarpaulins with six different colors (gray, red, white, green, blue, and black) at various wavelengths in the study area (Figure 2C). The spectral range of the spectrometer was from 350 to 2500 nm, each color tarp was measured ten times during the UAV flight and the average was taken as the reflectance result of the corresponding calibration tarp. The six color tarpaulins were placed in the field perpendicular to the flight path, allowing their reflectance data to be acquired during the UAV flight. Meanwhile, to facilitate the georegistration of images, 12 ground control points (GCPs) were evenly marked around the plots (Figure 1).
2.2.2. Collection of yield data
The yield of the 132 plots was measured by using the following procedure: For each plot, all maize plants in six 5-m-long rows were harvested. Ten maize ears of representative size and weight were selected for indoor measurement of water content and grain weight. The relative water content of the grain was measured with a PM-8188-A Grain Moisture Meter (Kett Electric Laboratory Co., Ltd., Tokyo, Japan). Finally, the grain yield at 14% water content of each plot was calculated and is shown in Figure 3. The lowest yield (1291.08 kg/ha) was from plot 69. The highest yield (13781.02 kg/ha) was from plot 117.

Figure 3 Bar plot showing the measured maize yield in the sampling plots.
2.3. Image preprocessing
The orthoimages of RGB and multispectral data were generated using the Agisoft PhotoScan software (version 1.4.5, Agisoft LLC, St. Petersburg, Russia), facilitated by the GPS and IMU (Inertial Measurement Unit) data recorded by the UAV flight control system. Georegistration of the orthoimages obtained at different times was conducted so that the positional displacements were removed, and the images were geographically well aligned. This step was done by the ArcGIS software (version 10.4, Environmental Systems Research Institute, Inc., Redlands, CA, USA) according to the 12 GCPs (Figure 1).
For the multispectral images, radiometric correction was conducted to convert image digital number (DN) values into reflectance to extract spectral information. Linear, quadratic, exponential, logarithmic, and power functions were used to fit the relationship between the DN values of six color tarpaulins (Figure 2C) extracted from the images and their reflectance based on the FieldSpec 4s spectroradiometer measurements. The optimal functions were used to separately calibrate each band in each growth stage (Figure 4). The exponential function was selected for the blue band in the VT and R5 stages, and for the green band in the R5 stage, with R2 reaching 0.93, 0.95, and 0.98, respectively. The quadratic function, with R2 varying from 0.93 to 0.99. The overall workflow of this study is shown in Figure 5, including the acquisition of indicators, the establishment of models, and the research objectives.
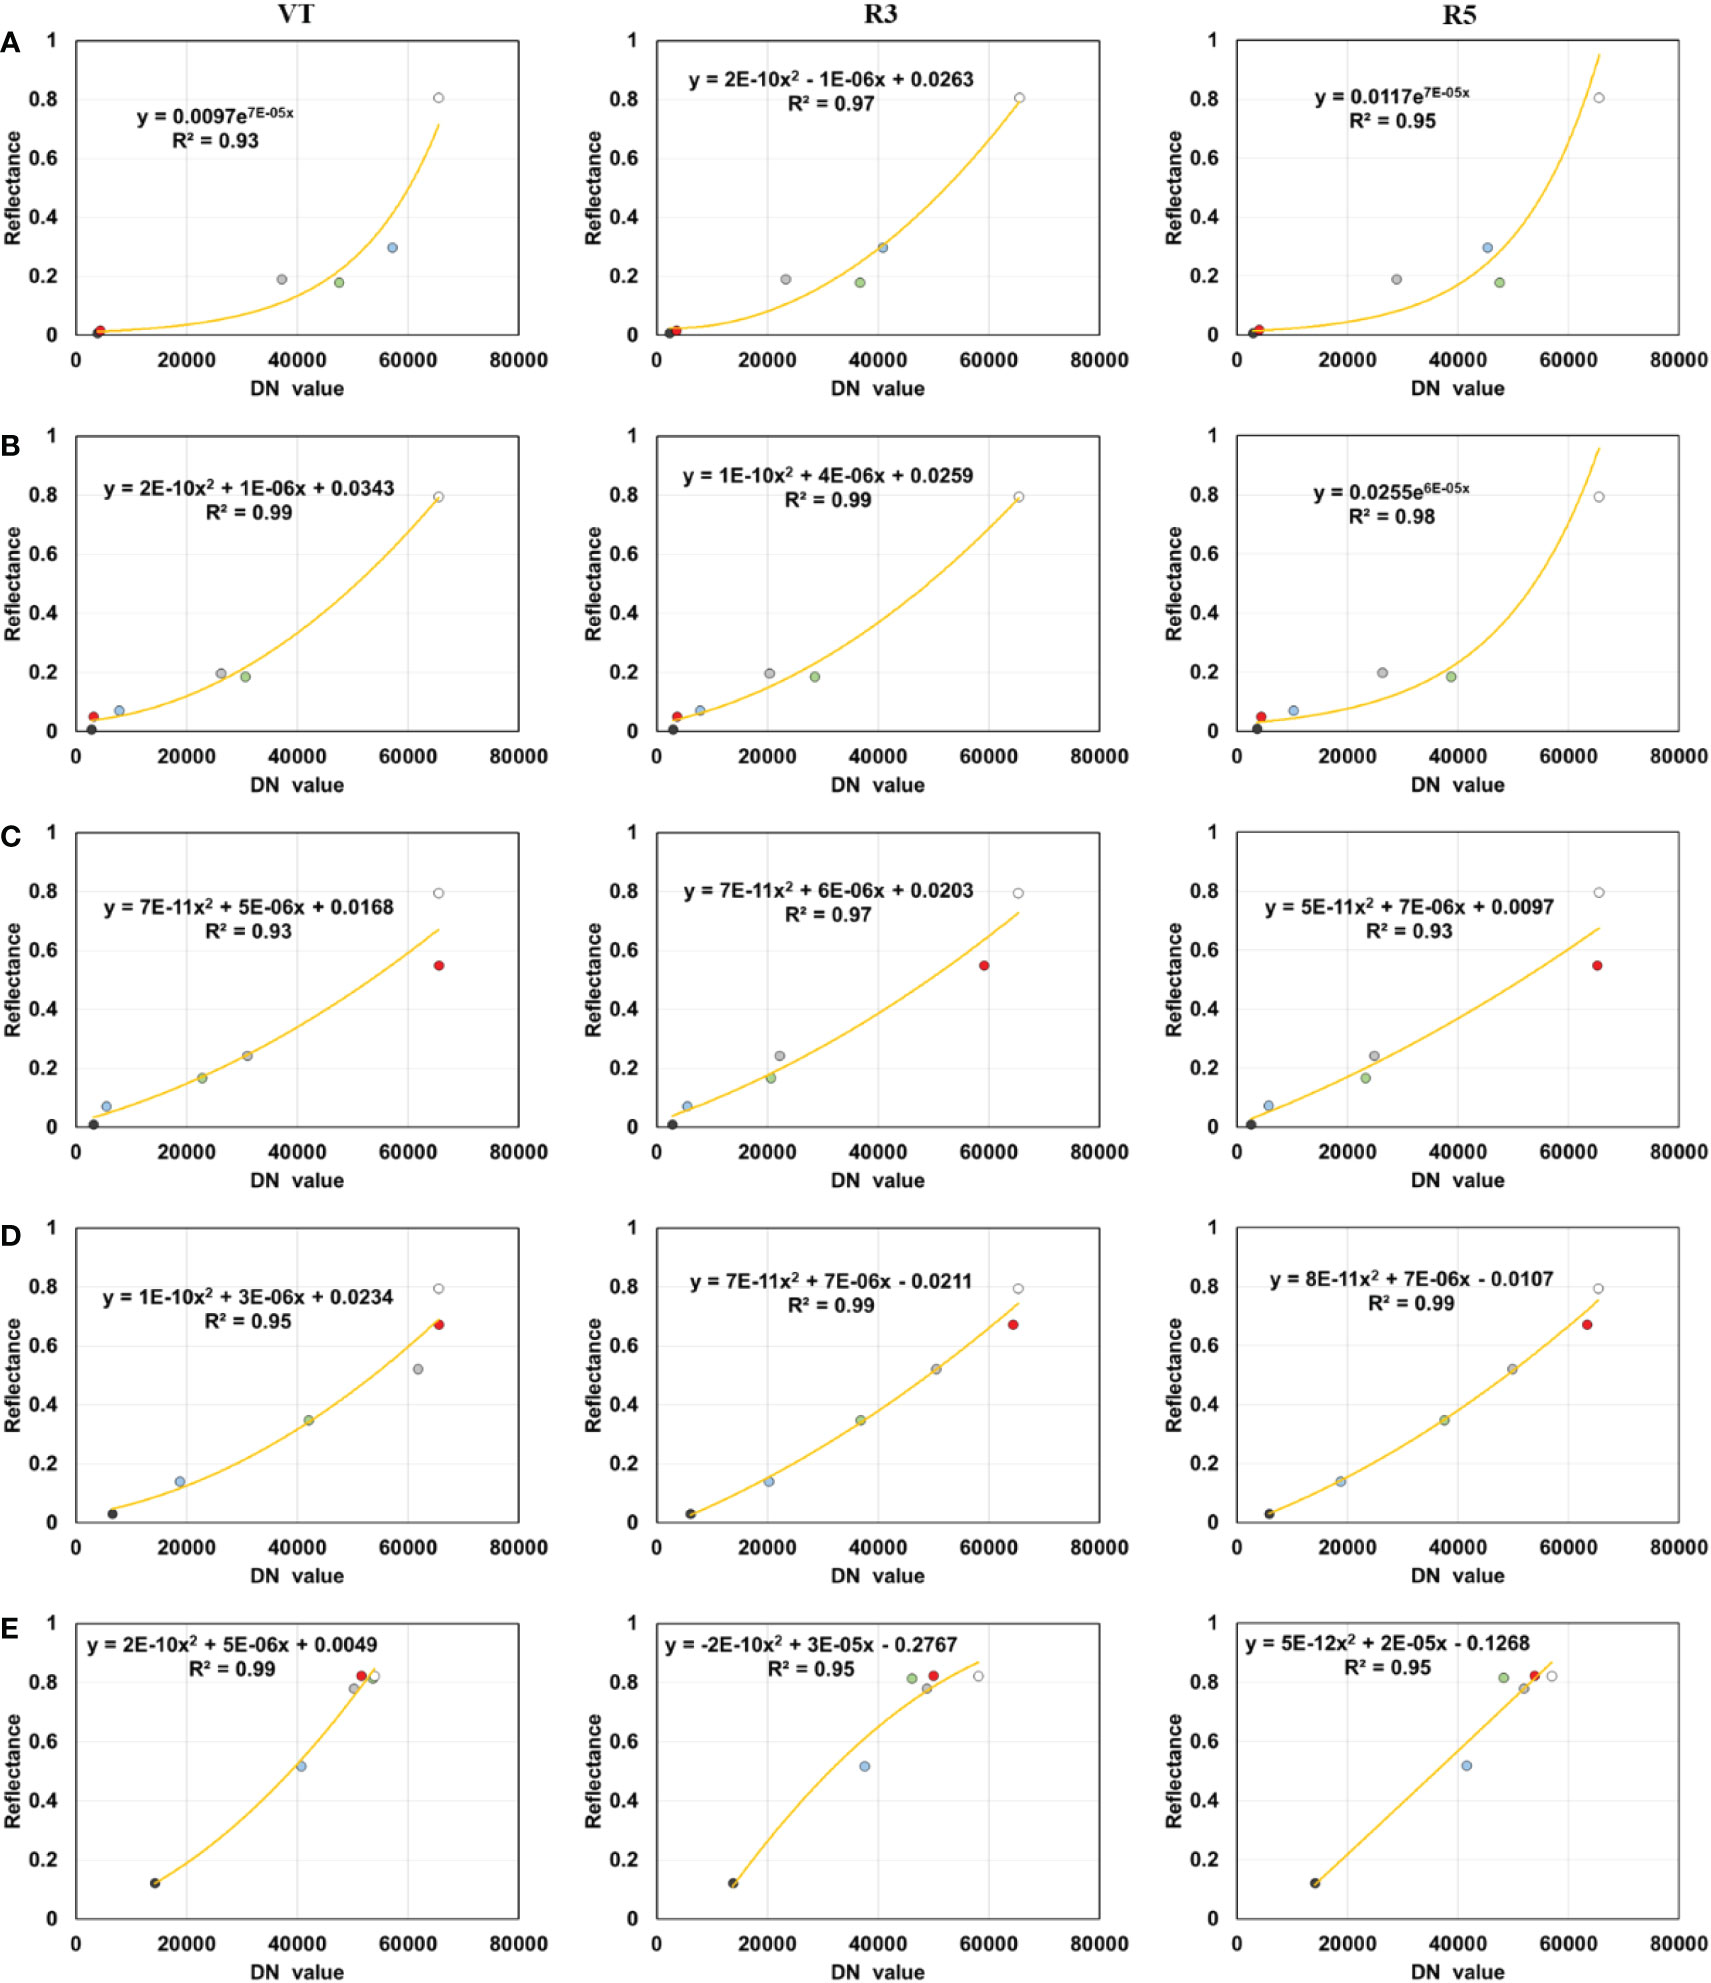
Figure 4 Multispectral radiometric calibration fitting models. (A) blue band, (B) green band, (C) red band, (D) red-edge band, and (E) near-infrared band.
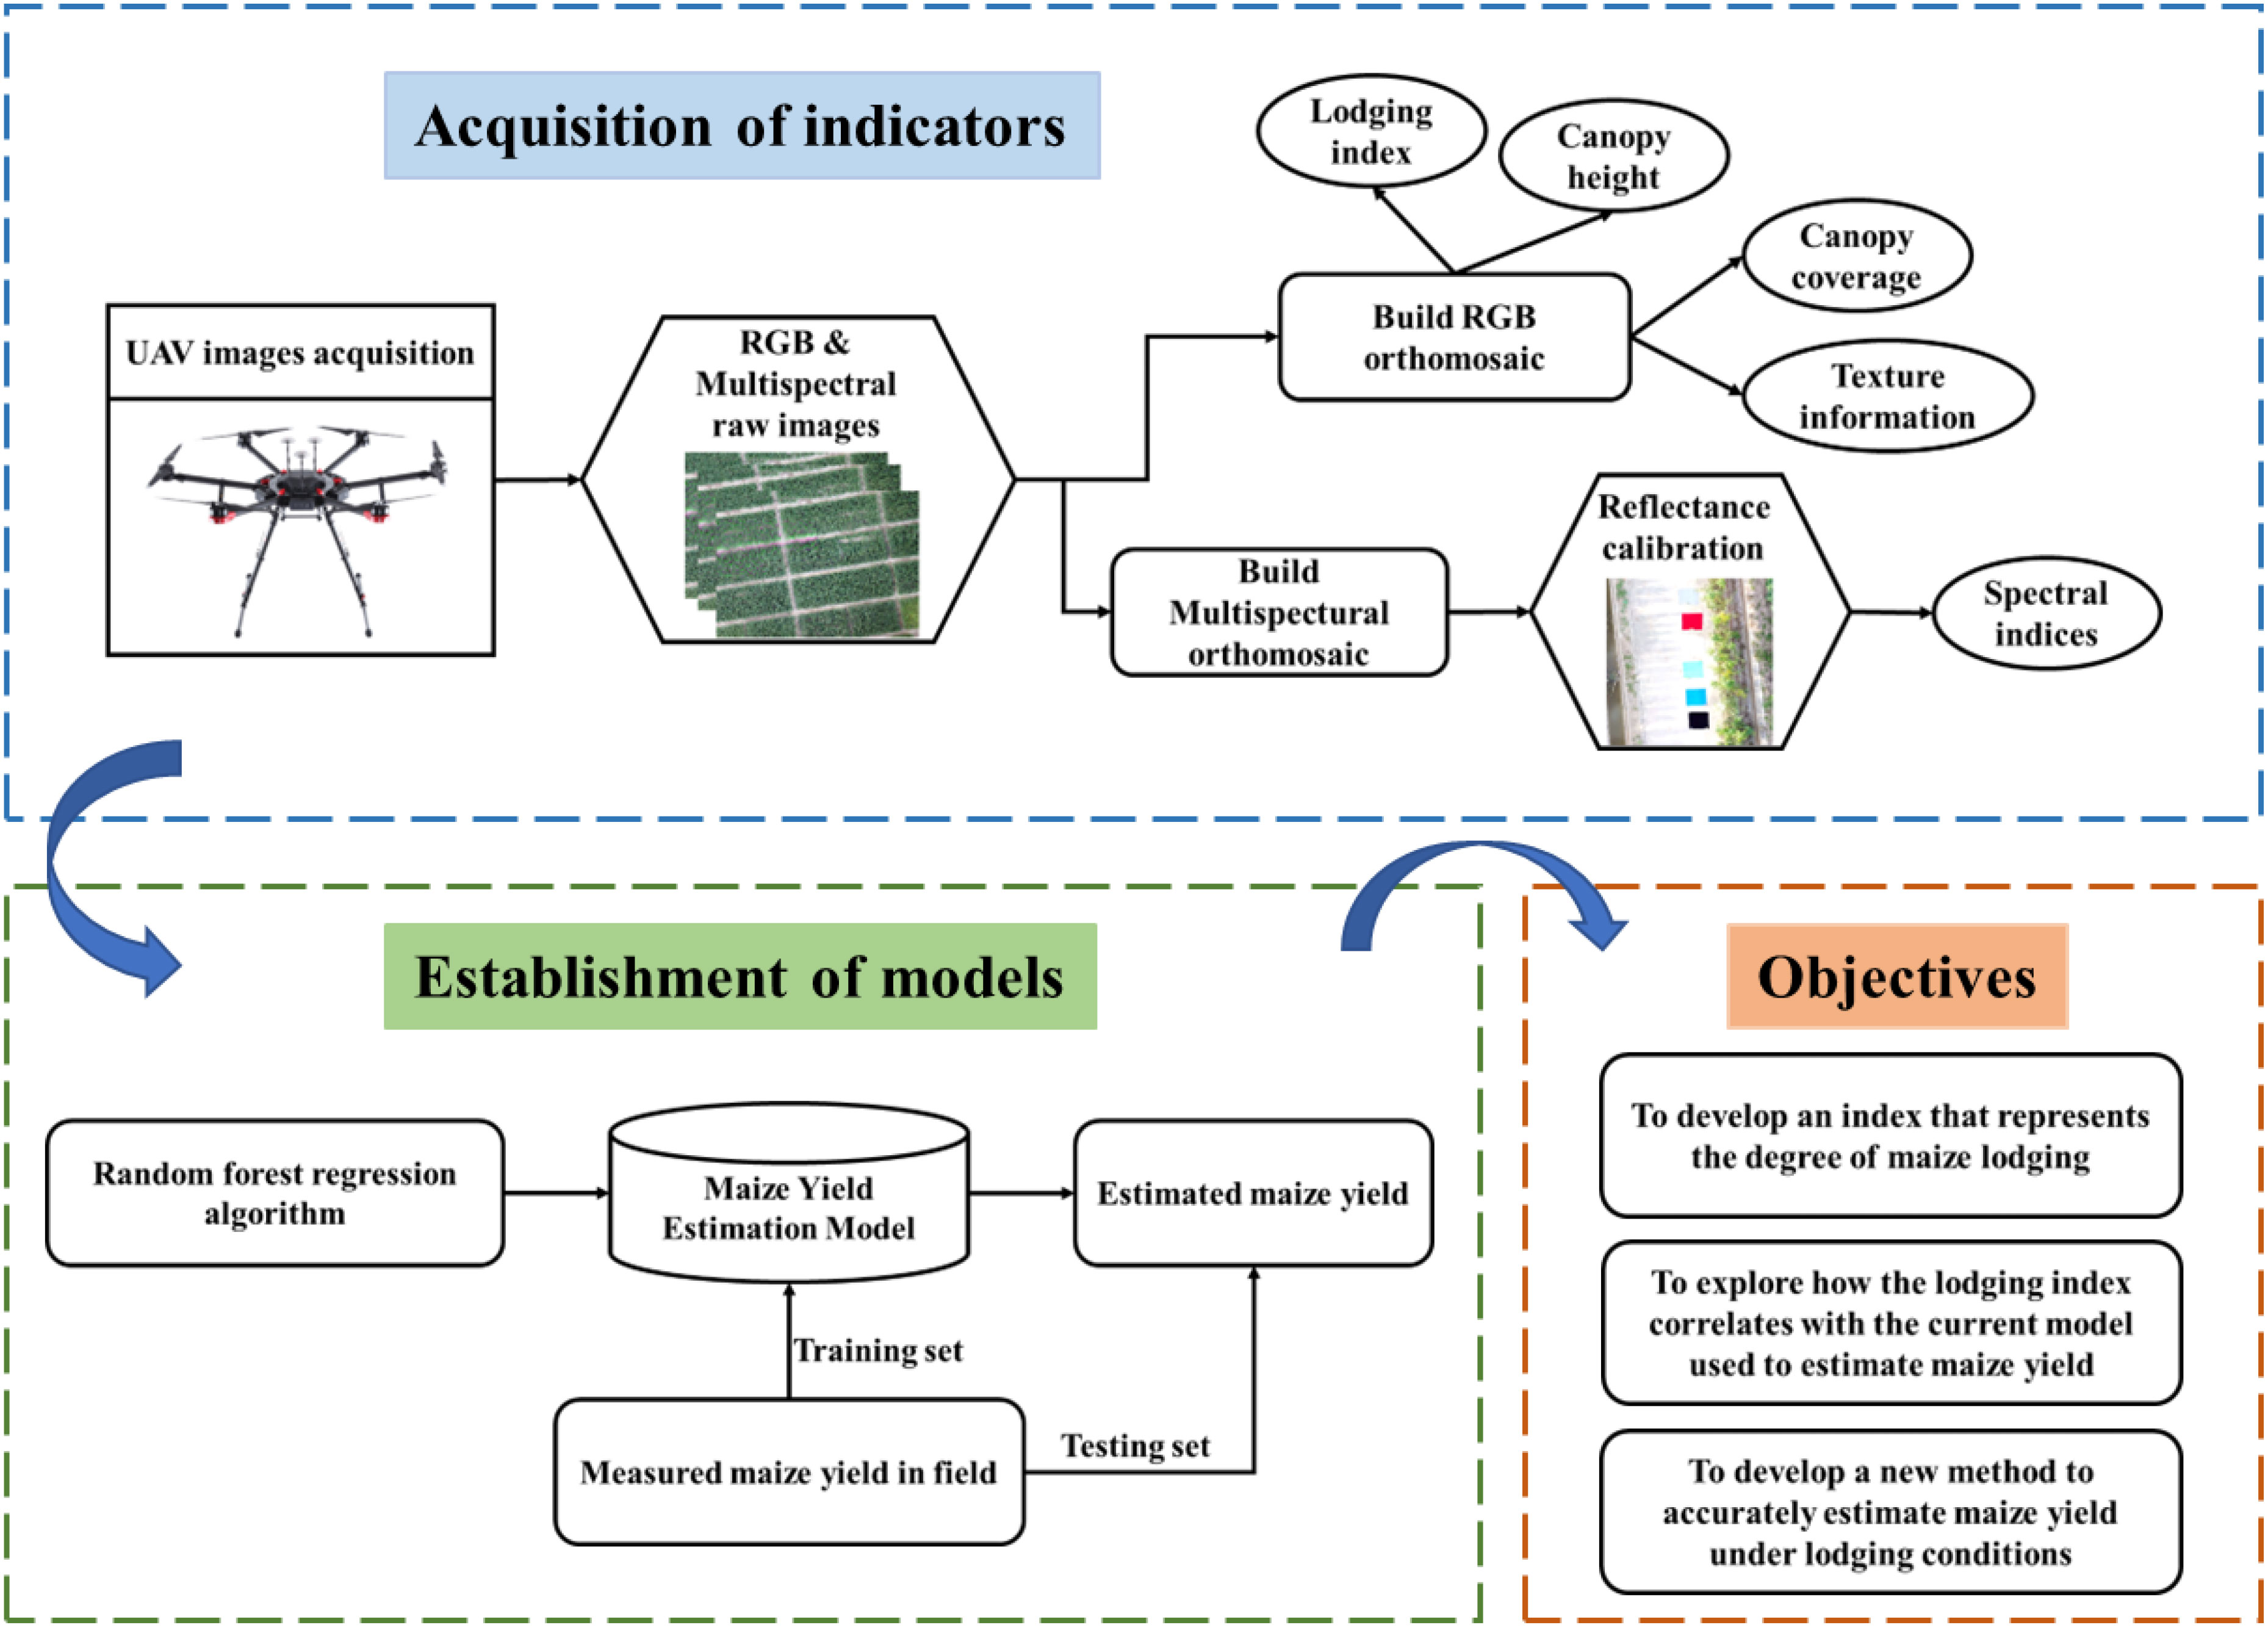
Figure 5 Workflow for preprocessing, feature extraction, model building, and target research using multimodal data.
2.4. Features extraction from multimodal images
Integrating multimodal features for crop yield estimation has been validated in previous studies (Rischbeck et al., 2016; Feng et al., 2020; Ramadanningrum et al., 2020). Estimating maize yields by integrating spectral, structural, and textural information can provide more information related to yield and overcome the inherent asymptotic saturation of single canopy features (Maimaitijiang et al., 2017). In this study, the lodging information was also considered.
2.4.1. Canopy spectral information
The spectral characteristics of crops are affected mainly by the absorption, reflection, and transmission of electromagnetic radiation caused by the physiological structure of plants, which makes spectral indices good predictors of crop yield (Berger et al., 2020; Yang et al., 2021). In this study, radiometrically calibrated multispectral images were used to extract the canopy spectral features. Fourteen spectral indices that have been widely used in yield estimation were selected (Sui et al., 2018; Maimaitijiang et al., 2020), as shown in Table 2. The extraction was implemented in the ArcGIS software.
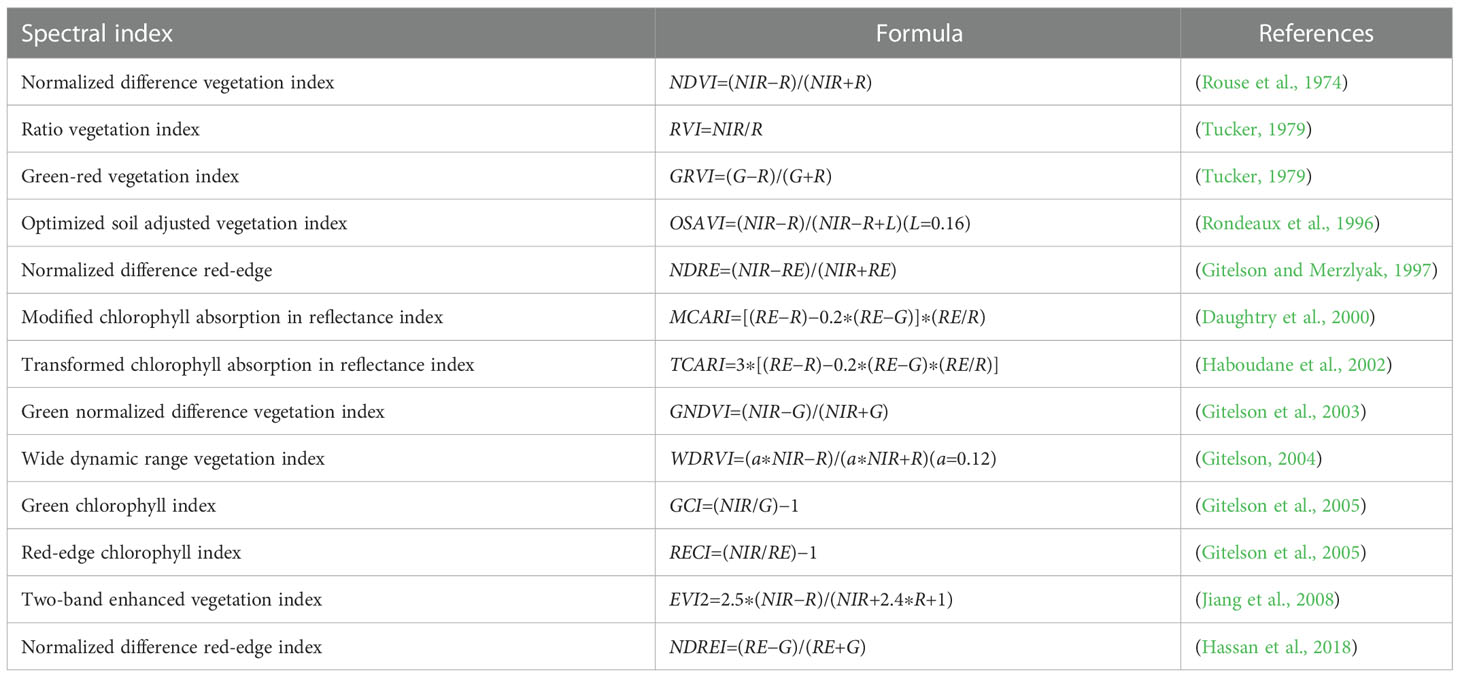
Table 2 Definitions of the features extracted from multispectral imagery.
2.4.2. Canopy structure information
The canopy-structure information is directly related to light use efficiency (Xu et al., 2021b), which contains independent information from spectral and texture feature (Stanton et al., 2017). Two indicators, canopy coverage (CC) and canopy height (CH), were extracted to characterize the structure of the maize. Both were extracted from the UAV-RGB images.
Canopy height was extracted by generating a crop height model (CHM) from UAV high-resolution RGB images. At each of the three growth stages, the structure-from-motion (SfM) algorithm was implemented in Agisoft PhotoScan software to create a three-dimensional (3D) points cloud and a digital surface model (DSM) (Xie and Yang, 2020). In addition, a bare-earth digital elevation model (DEM) was created based on photogrammetric 3D point clouds generated before maize emergence (Maimaitijiang et al., 2019). Subsequently, the CHM was calculated by subtracting DEM from DSM using the raster calculator tool in the ArcGIS software.
The calculation of CC depends on the correct recognition of crop pixels from among the background (soil and weeds). Previous studies have shown that vegetation and soil can be separated based on indices calculated from RGB images, such as the color index of vegetation extraction (CIVE), excess green index (ExG), and excess green minus excess red (ExG − ExR) (Hamuda et al., 2016; Castillo-Martínez et al., 2020). In this study, the CIVE [Eq. (1)] is used with a threshold interval set at [−28, 5]. The CC is thus expressed as the fraction of maize canopy pixels to all pixels in the sampled plot [Eq. (2)]:
where Pmaize is the number of maize canopy pixels the plot, and Ptotal is the total number of pixels in the plot.
2.4.3. Canopy texture information
Canopy texture can provide additional information related to spatial canopy architecture and spectral characteristics (Xu et al., 2022). The inclusion of texture features can reduce the bias of yield estimates beyond what is possible using spectral indices alone; this is helpful for early monitoring of grain yield (Wang et al., 2021). In this study, texture features were extracted from UAV-RGB images based on the gray-level co-occurrence matrix (GLCM), which is a popular method to extract texture features (Mohanaiah et al., 2013). This step was implemented in the ENVI software (version 5.3; Esri Inc.) with a window size of 7 × 7. The meanings and formulas (Haralick et al., 1973) of the texture indices are presented in Table 3.
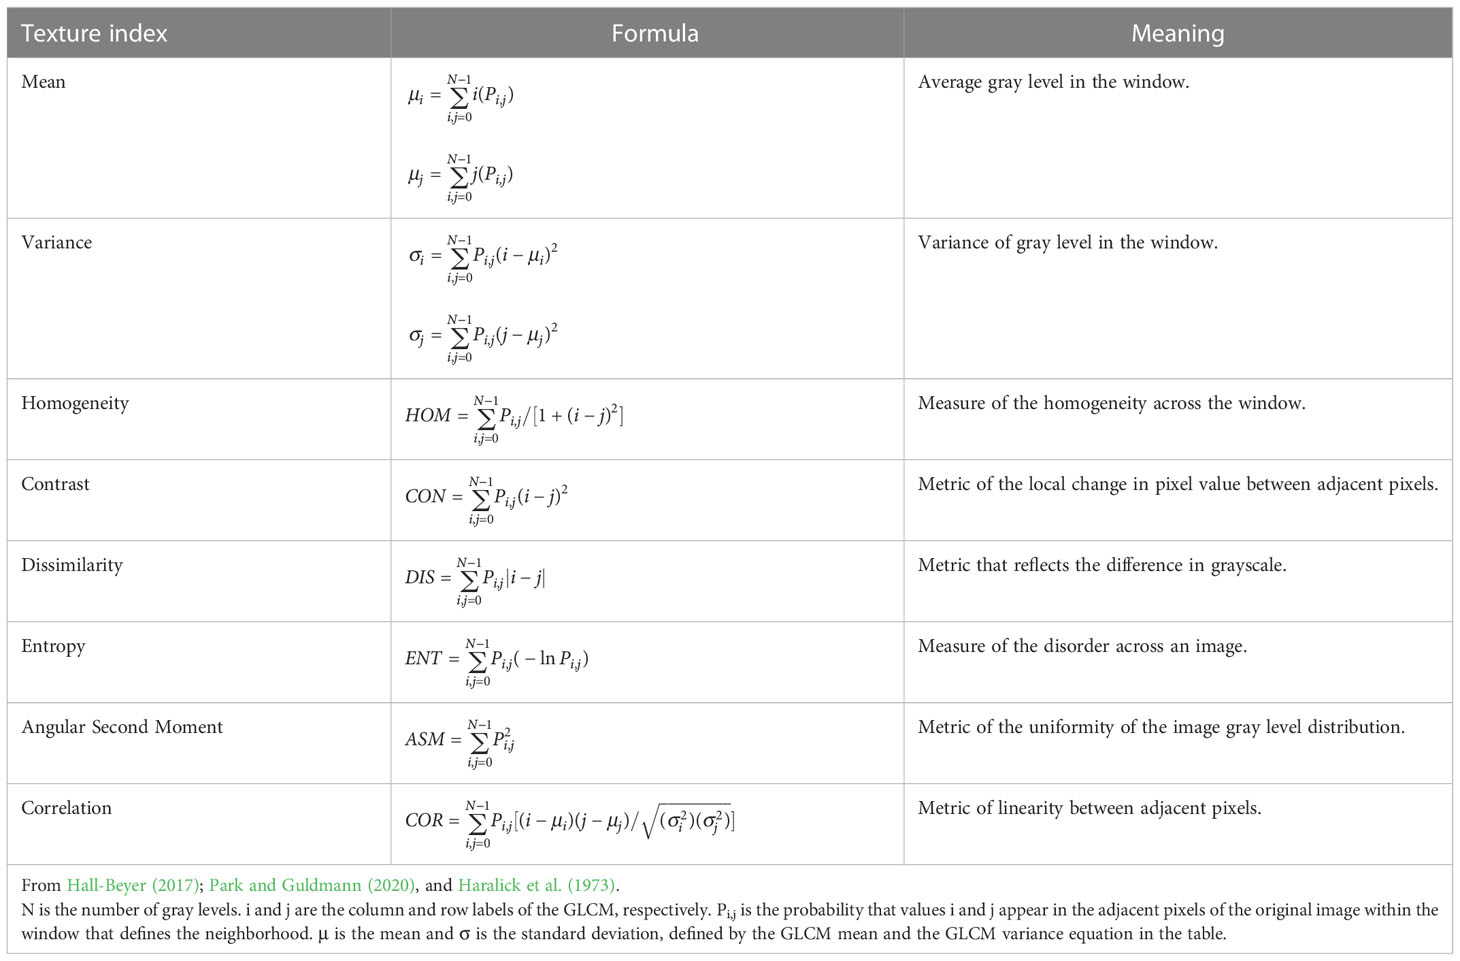
Table 3 Meanings and formulas of the selected texture indices based on GLCM.
2.4.4. Lodging stress information
Around August 3, 2020 (tasseling stage), a sudden rainstorm accompanied by strong winds (wind force level 5 to 6) hit the experiment site, resulting in varying degrees of lodging in the maize plots. The distribution and degree of lodging were investigated in the field the day after. Different degrees of lodging occurred in the same plot at the pixel level. In this study, the lodging degree at the pixel level was extracted as per Wang (2021) and then divided into three categories: no lodging (NL), light lodging (LL), and severe lodging (SL). NL means that the maize remained upright, and the angle between the plant and the ground was between 0° and 30°. LL means that the angle between the maize plant and the ground was 30° to 60°. SL means that the maize plant was close to or completely on the ground. An index representing the degree of lodging of each plot was developed based on the pixel-level degree of lodging and the lodging area in each plot. The calculation was implemented in the ArcGIS software. The formula for calculating the lodging index is
where LI is the lodging index of a plot, LDi is the pixel-level lodging degree, and Si is the area fraction of lodging degree i in the plot.
2.5 Random forest regression algorithm
We selected the RFR machine-learning algorithm because it has already produced accurate and robust estimates of crop yield (Aghighi et al., 2018; Cai et al., 2019). The RFR algorithm is an ensemble method that uses bootstrap sampling. Multiple samples are extracted from the original sample with replacement, each bootstrap sample is modeled by a decision tree, and then multiple decision trees are combined by voting to determine the final estimation (Breiman, 2001). Because multiple different decision trees are integrated, RFR is robust against overfitting (Yu et al., 2016).
The RFR models were implemented using Python version 3.7 (Google Inc., Mountain View, California, USA). The number of RFR decision trees was set to 100, the number of seeds used by the random number generator was set to 15, and the maximum depth of the decision tree was determined so that each leaf is “pure” or until all leaves contain less than the minimum number of samples needed to split the internal nodes. The other parameters used the default settings of the Python sklearn package.
To ensure a fair and comprehensive evaluation of the constructed model, we randomly selected 80% of the samples of the measured maize yields to train the model and used the remaining 20% to determine the accuracy of the yield estimates produced by this method.
2.6 Assessment of model accuracy
Three evaluation indicators were used to test the model accuracy: the coefficient of determination R2, the root mean square error (RMSE), and relative RMSE (rRMSE). These evaluation metrics are calculated as follows:
where Xmodel,i and Xobs, i are the estimated yield and observed yield for plot i, respectively, is the average of the observed yields, and n is the number of samples.
3. Results
3.1. Construction of lodging index
The pixel-level map of lodging degree (Figure 6) for each test plot is derived from the pixel-size degree of lodging extracted by Wang (2021). The classification accuracy of using the random forest classifier for lodging degree at pixel size is 86.96%; for more details, see Wang (2021). The result shows that the degree of lodging differs at different positions within the same plot. Therefore, it is hard to describe the degree of lodging of the plot only by lodging area or the lodging degree at pixel size. The lodging index of each plot is shown in Figure 7, where a larger lodging index indicates a greater degree of lodging in the plot, and a lower degree of lodging means that the lodging degree of the plot is lighter. The lodging degree of each plot represented by the lodging index (Figure 7) is consistent with the spatial distribution of the pixel-level lodging degree (Figure 6). Thus, the lodging index is used to analyze how lodging affects yield estimates.
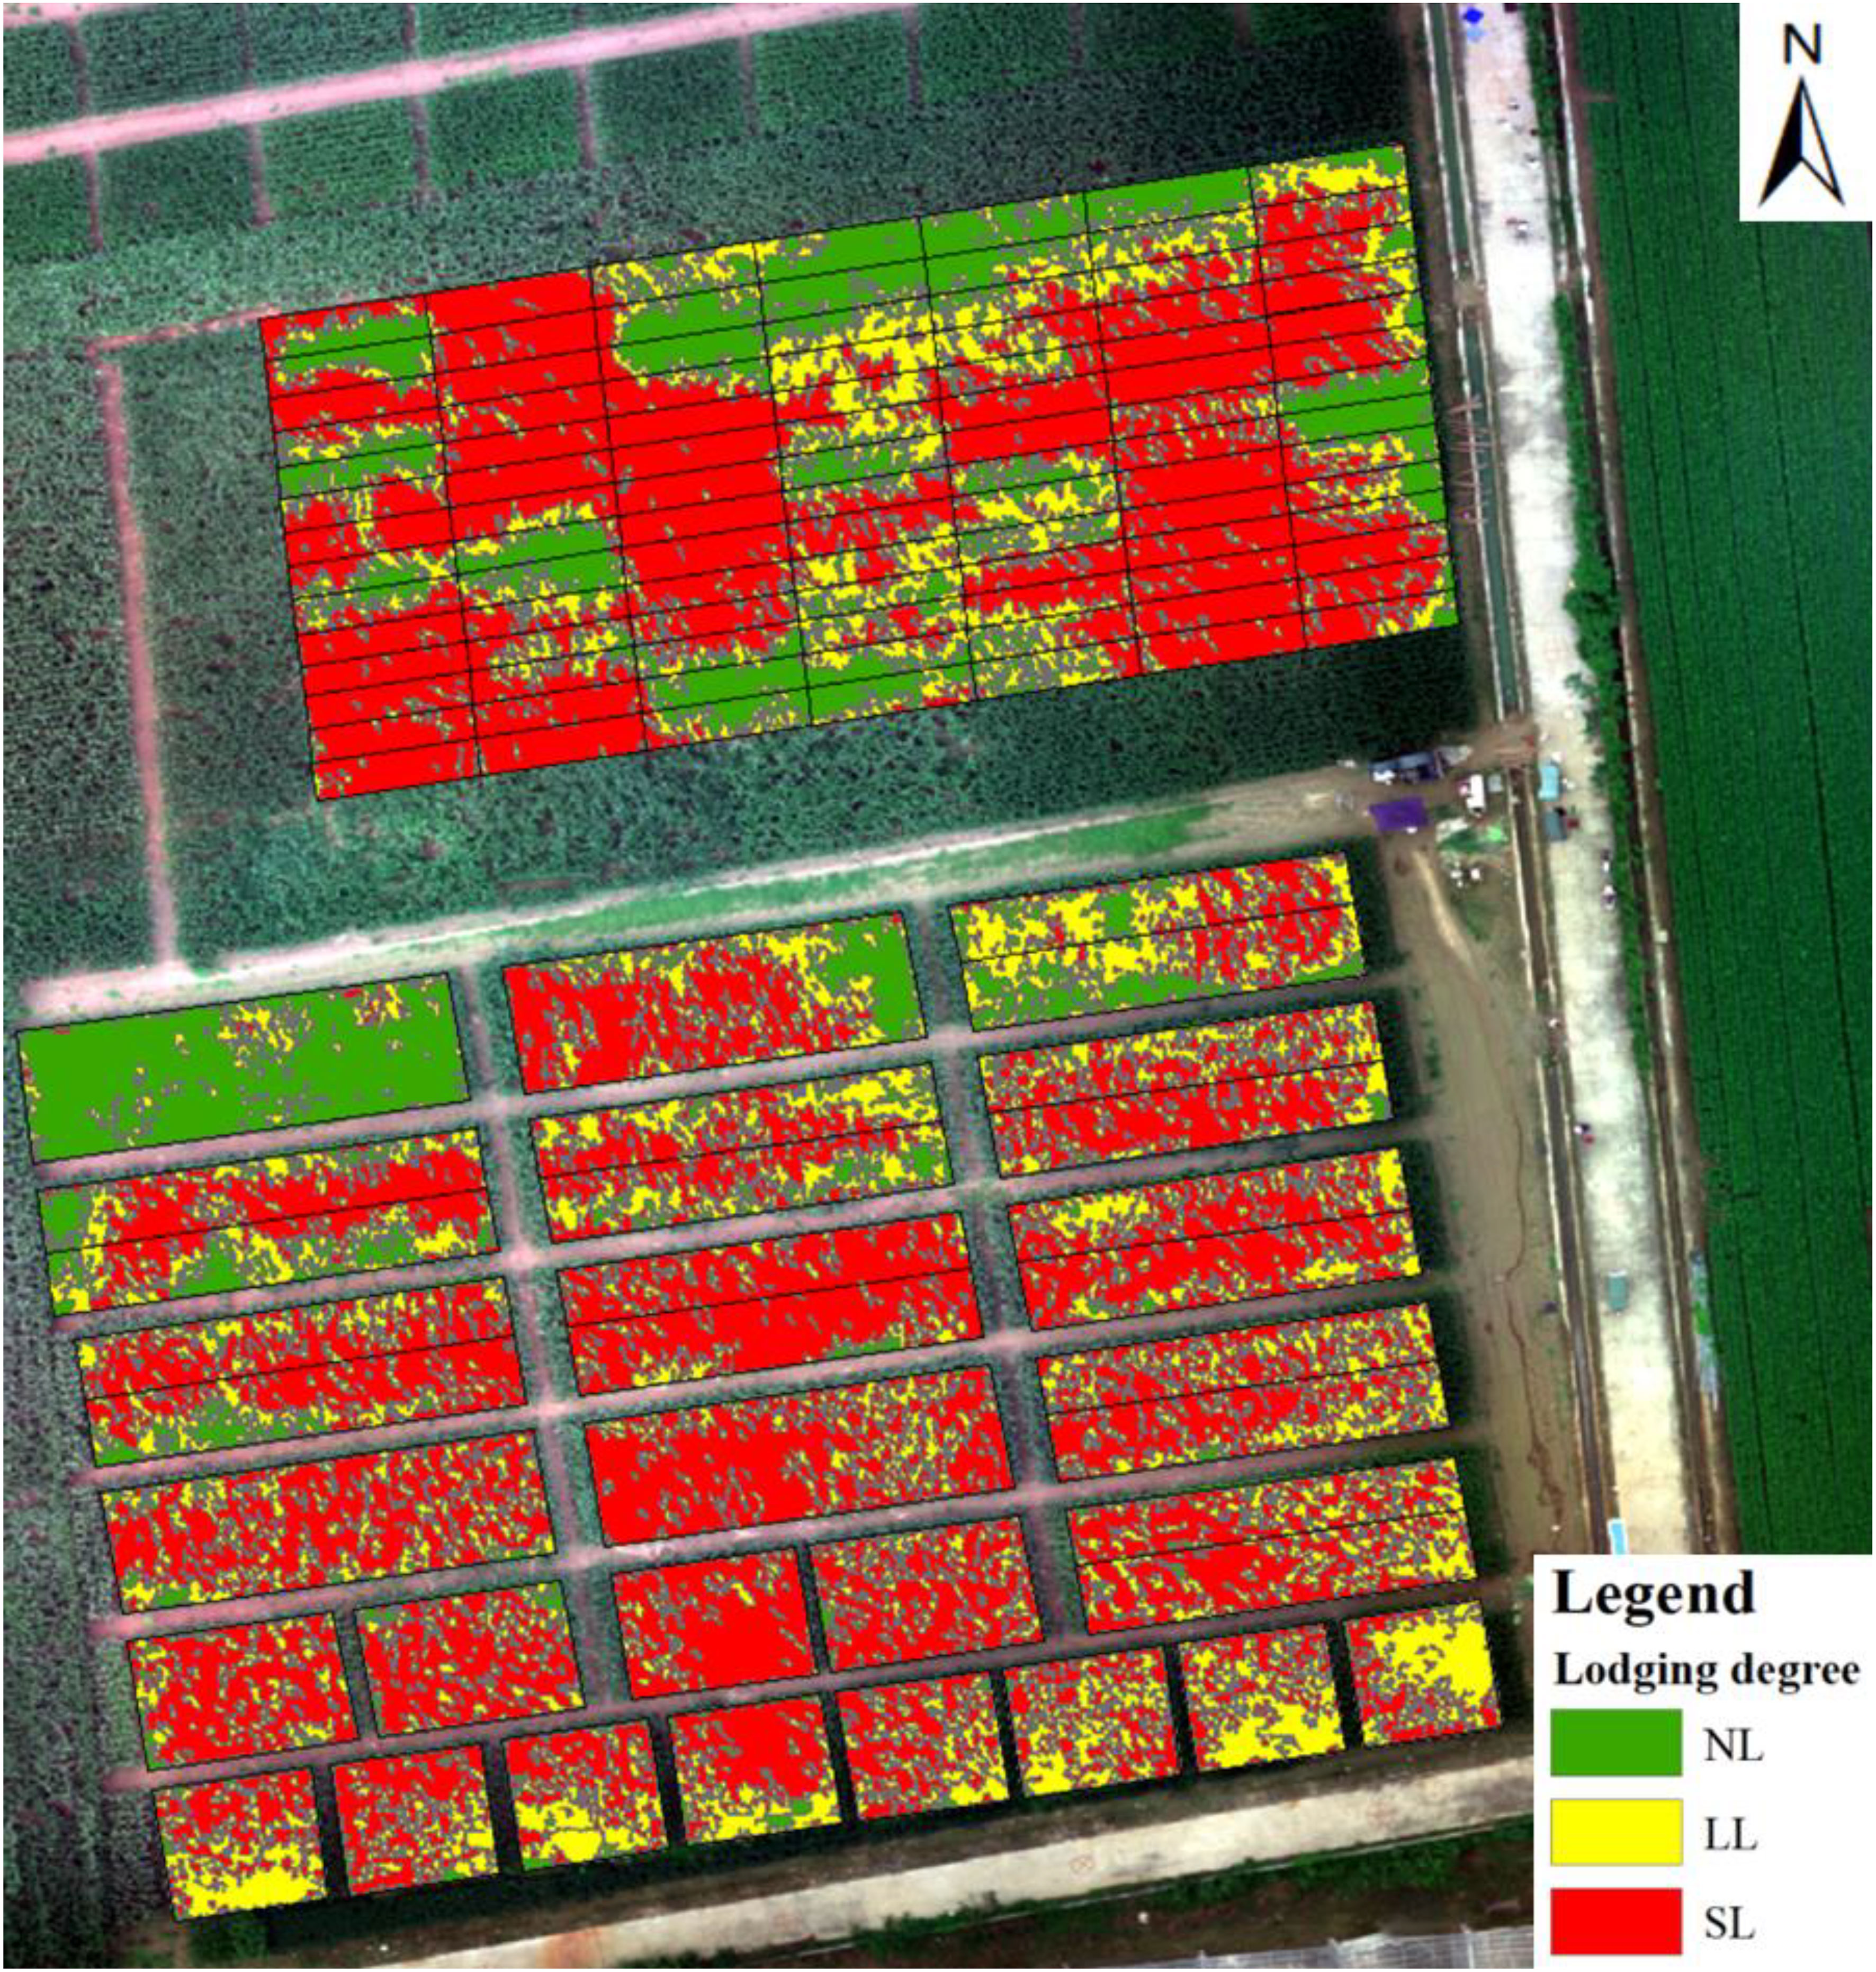
Figure 6 Distribution of pixel-level degree of maize lodging.
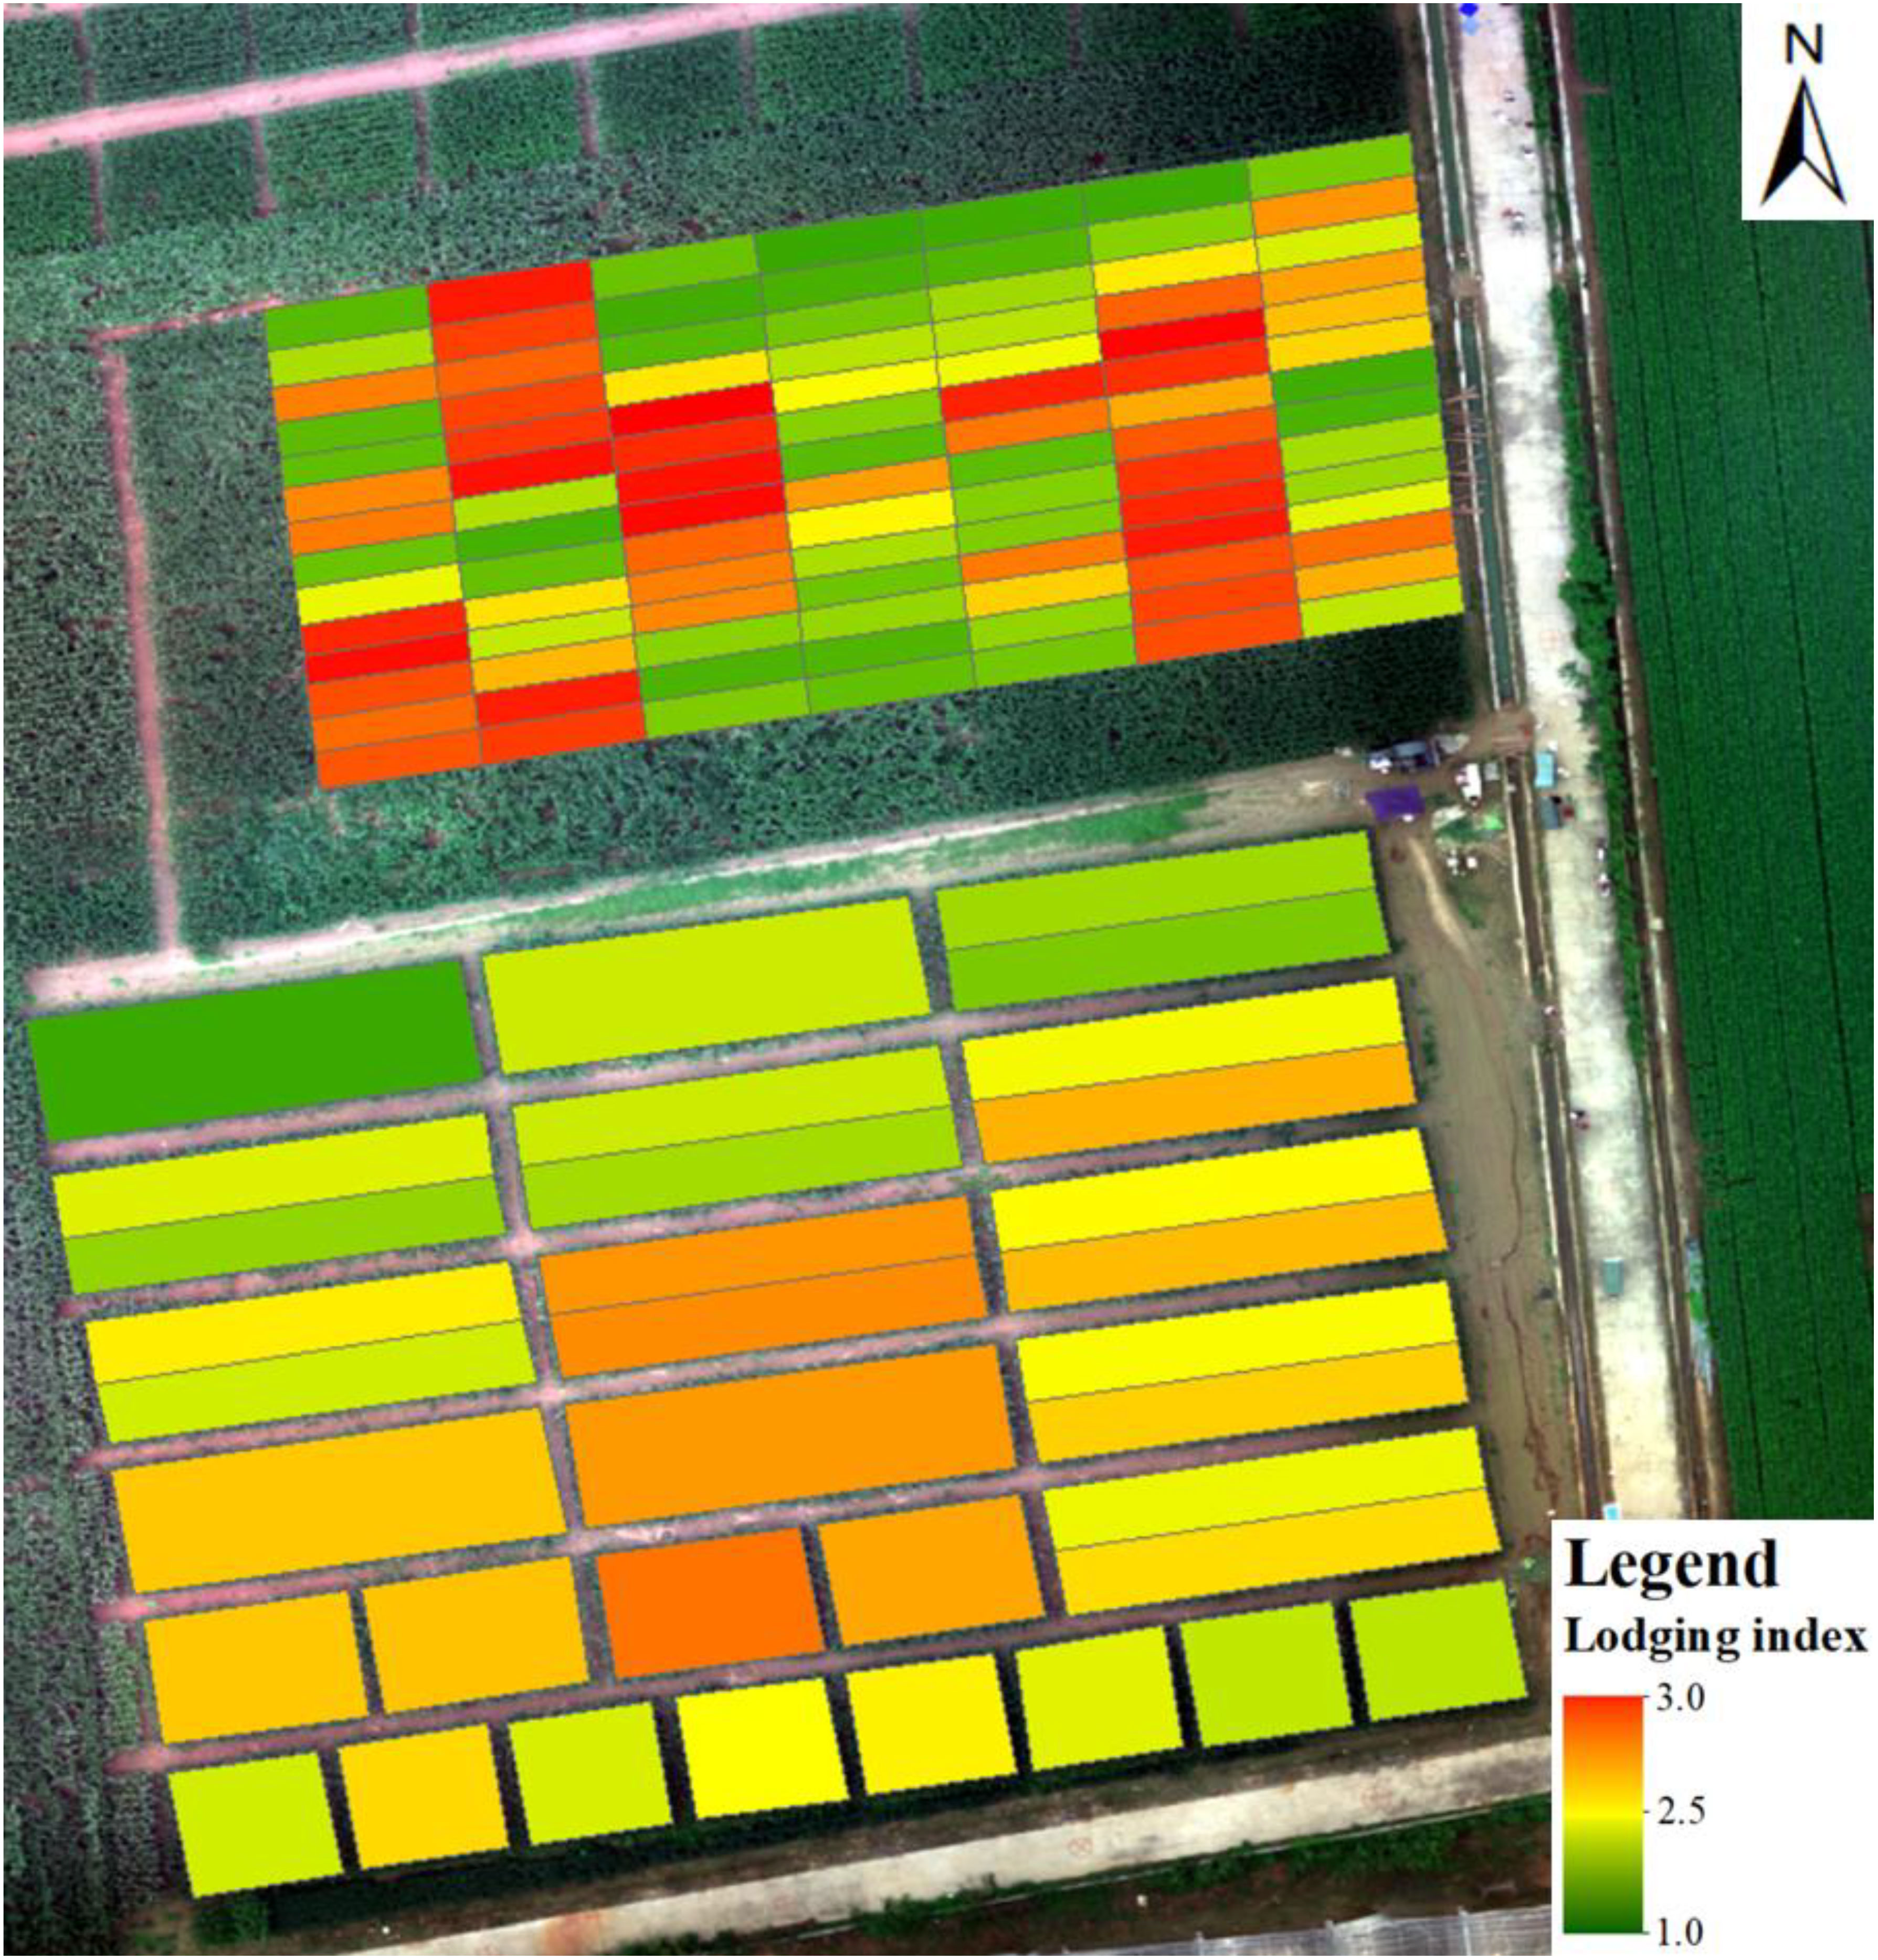
Figure 7 Distribution of lodging index for each plot.
To further describe the relationship between the lodging index and yield, we plot the measured yield versus the lodging index in Figure 8. There was no obvious increasing or decreasing trend in the measured maize yield with increasing lodging index.
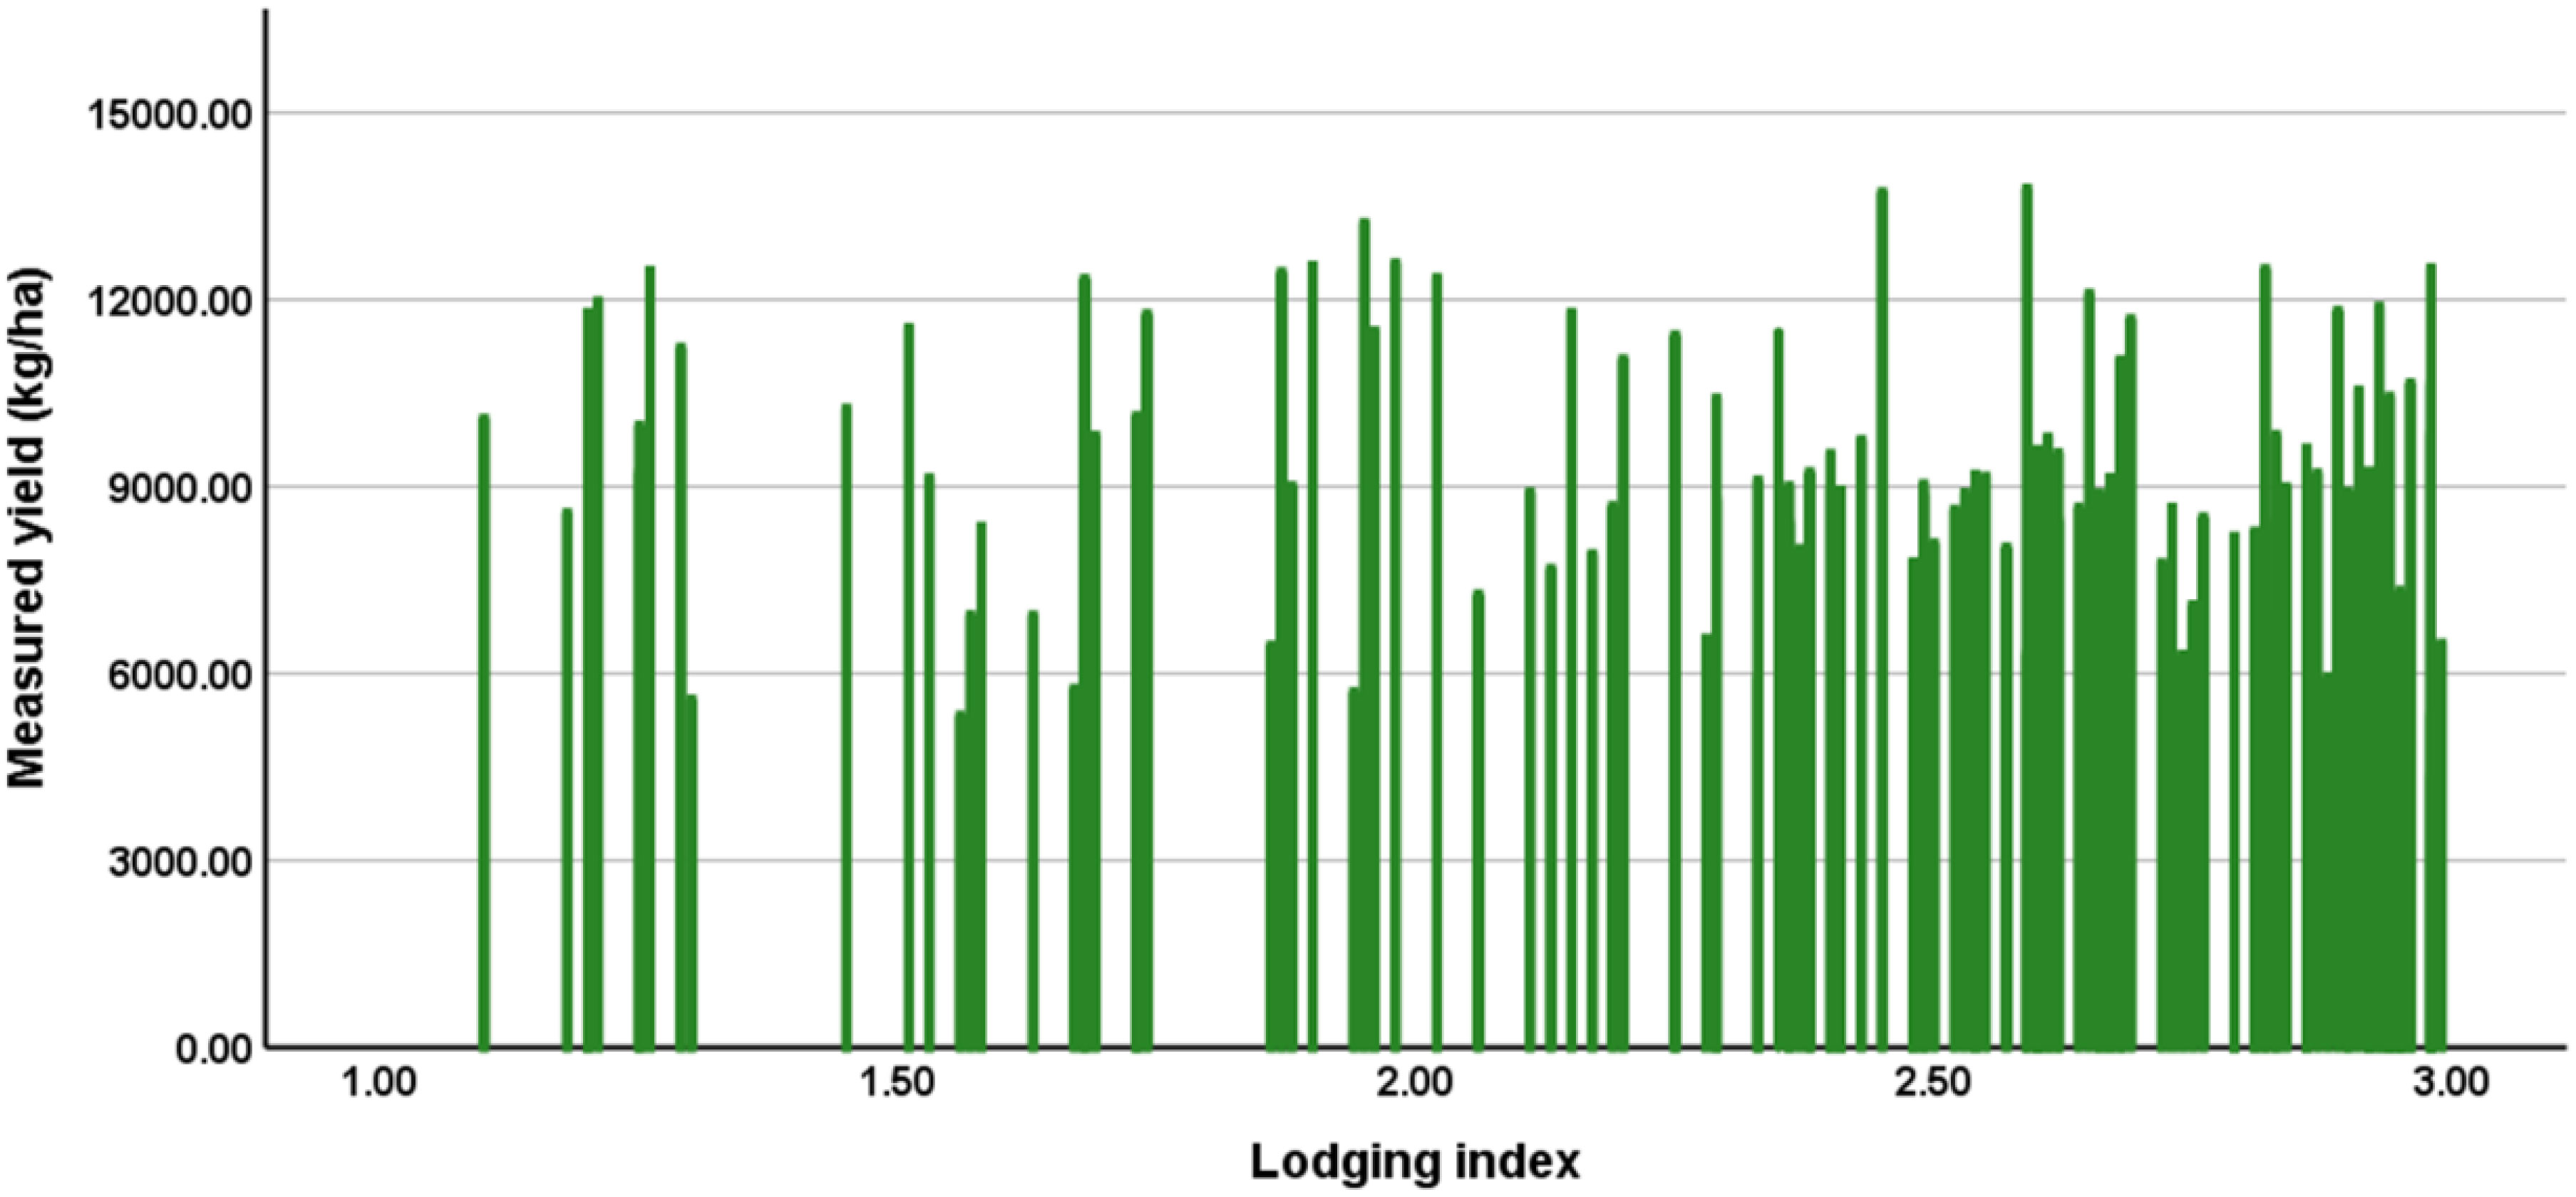
Figure 8 One-to-one correspondence between the lodging index and the measured yield of each plot.
3.2. Estimation of maize yield without lodging index
Differences appear in the estimated maize yield in different growth stages, and the yield-estimation model identifies the optimal harvest time. The results show that the models developed based on UAV images obtained at different growth stages perform at various levels (Figure 9). The model developed at the R5 stage performs best, with R2 = 0.806, RMSE = 1106.67 kg/ha, and rRMSE = 13.4%. The model developed at the VT stage performs the worst, with R2 = 0.170, RMSE = 1799.01 kg/ha, and rRMSE = 21.7%. The results indicate that models developed at later growth stages perform better than models developed at early growth stages, which is consistent with previous results (Johansen et al., 2020; Li et al., 2021).
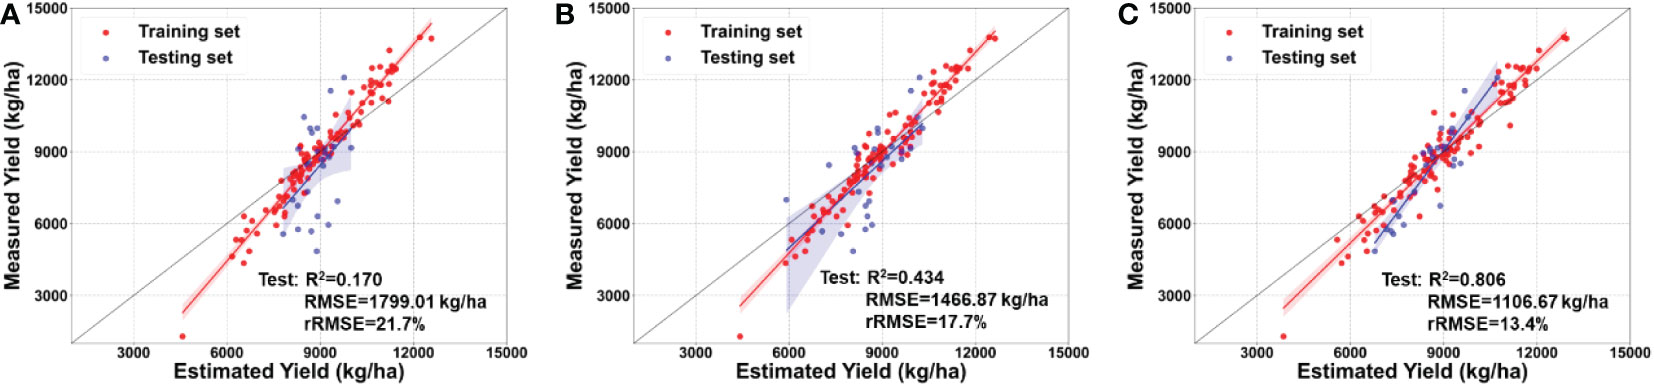
Figure 9 Estimation of maize yield by integrating multimodal data, but without considering the lodging index, at the (A) tasseling stage (VT), (B) milking stage (R3), and (C) denting stage (R5).
To further explore whether lodging affects yield estimation, the deviation between the estimated and measured yields is plotted as a function of lodging index. As shown in Figure 10, no clear relationship appears between the estimation error and the lodging index. Large estimation errors appear mainly in plots with small lodging index or larger lodging index. In addition, at all three growth stages of maize, the yield of plots with a small degree of lodging tends to be underestimated with respect to the actual yield, whereas the yield of the plots with severe lodging degree is clearly overestimated. The results indicate that the yield estimates are influenced by lodging. Thus, lodging must be considered to accurately estimate yields under lodging conditions.
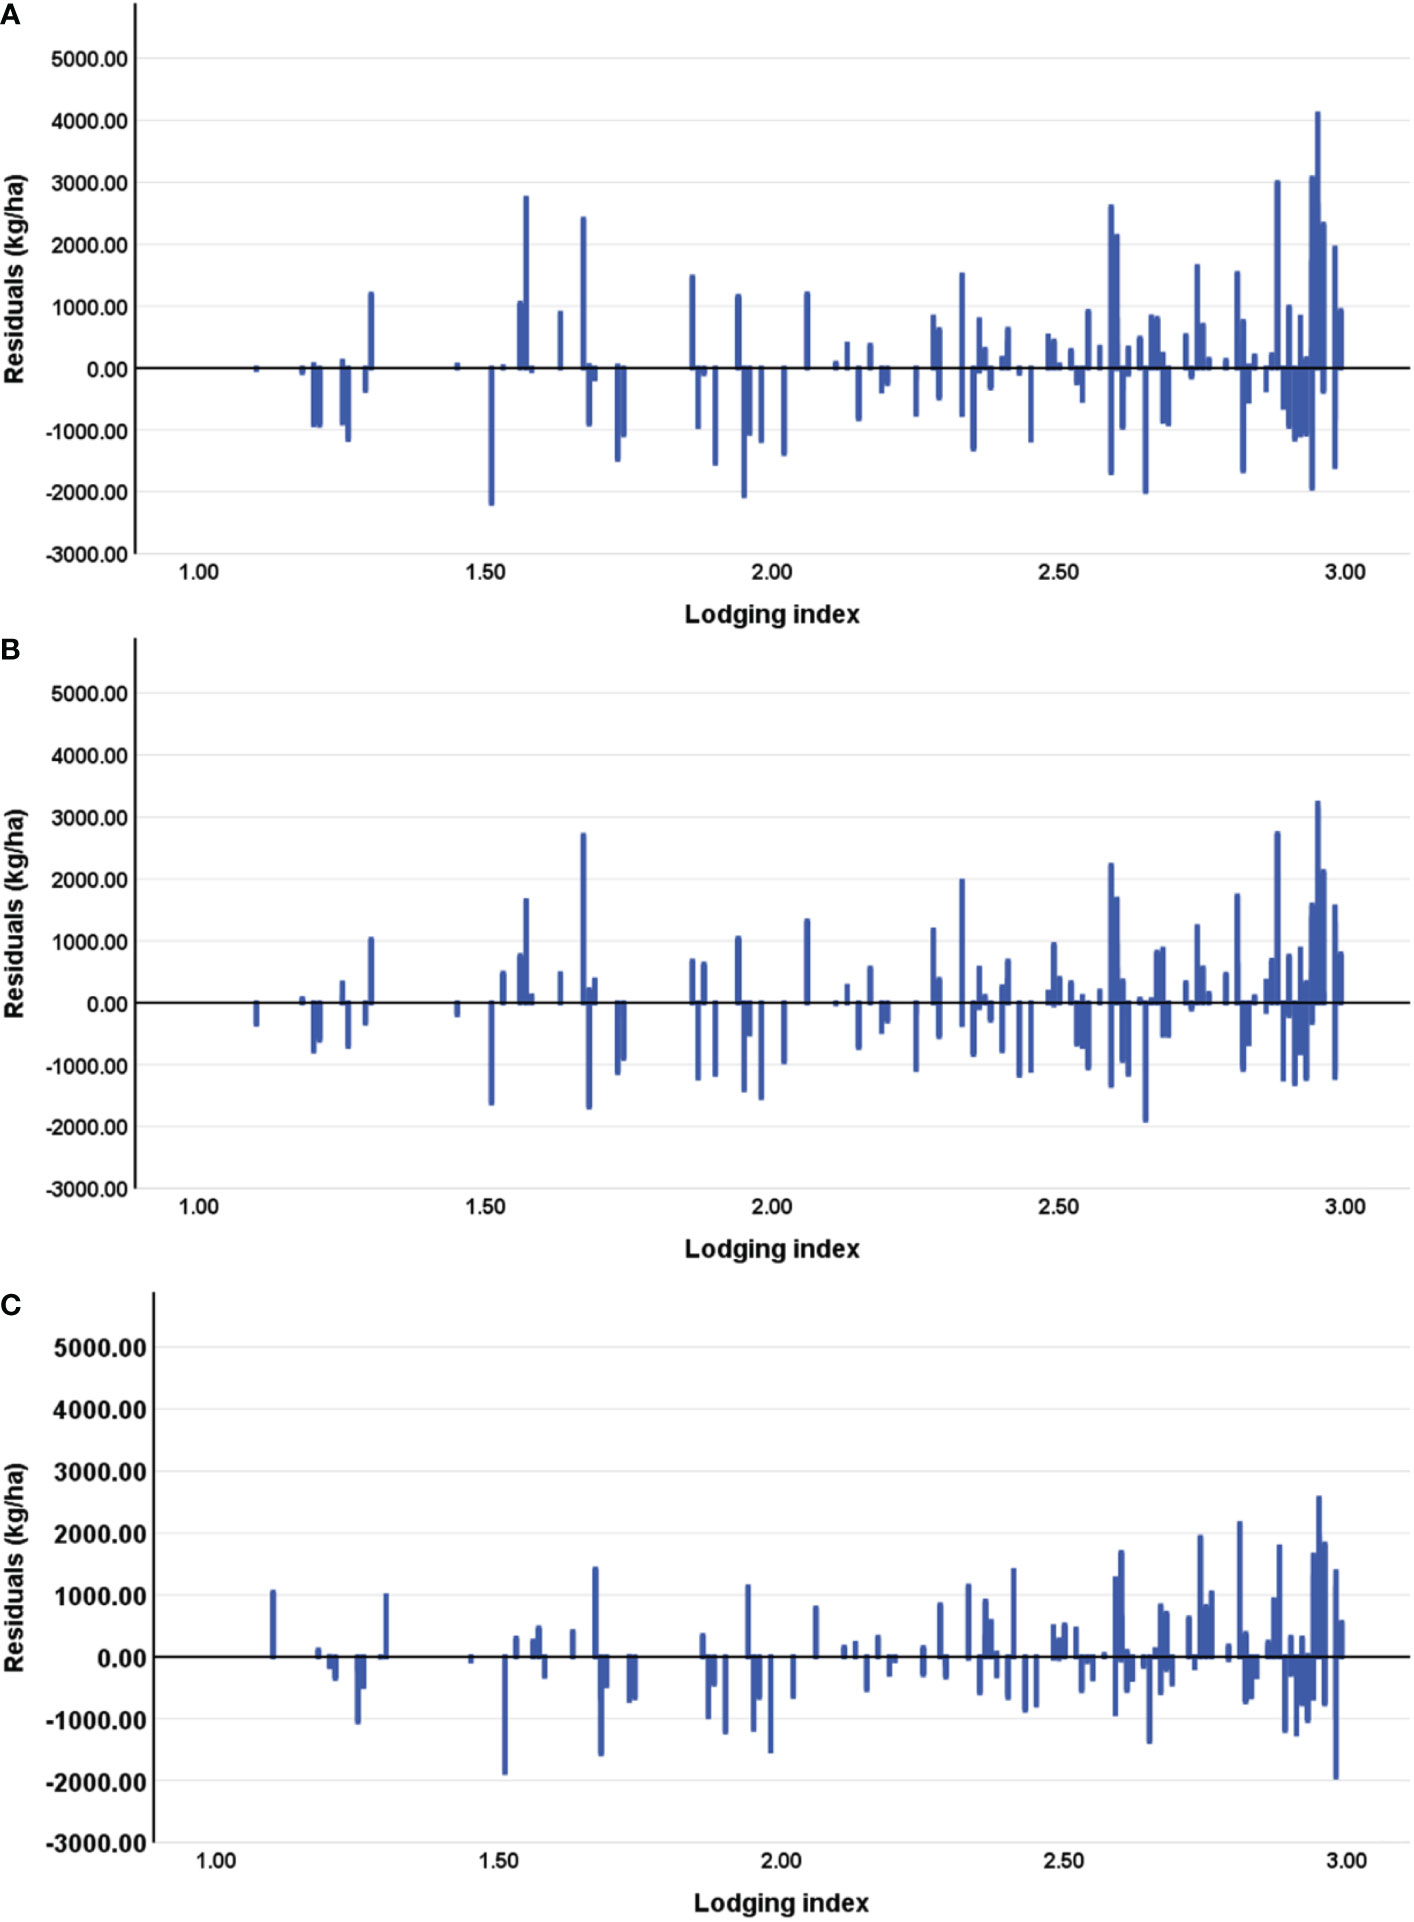
Figure 10 Residuals of yields estimated without considering the lodging index at the (A) tasseling stage (VT), (B) milking stage (R3), and (C) denting stage (R5).
3.3. Accurate estimation of maize yield with lodging index
Figure 11 shows the yield estimated by integrating into the model the canopy spectral, structural, and textural information and the lodging index. For the model developed at the same growth stage, the model including the lodging index performs better than without the lodging index. For models including the lodging index, a model developed at the later growth stages performs better than a model developed at early growth stages, which performs similarly to a model without the lodging index. For a model developed at the VT stage, R2 increases from 0.170 to 0.242 and the RMSE decreases from 1799.01 to 1700.60 kg/ha. For a model developed at the R3 stage, R2 increases from 0.434 to 0.533 and the RMSE decreases from 1466.87 to 1401.75 kg/ha. For a model developed at the VT stage, R2 increases from 0.806 to 0.859 and the RMSE decreases from 1106.67 to 1086.41 kg/ha. These results indicate that the lodging index is a useful variable for accurately estimating maize yield when lodging occurs.
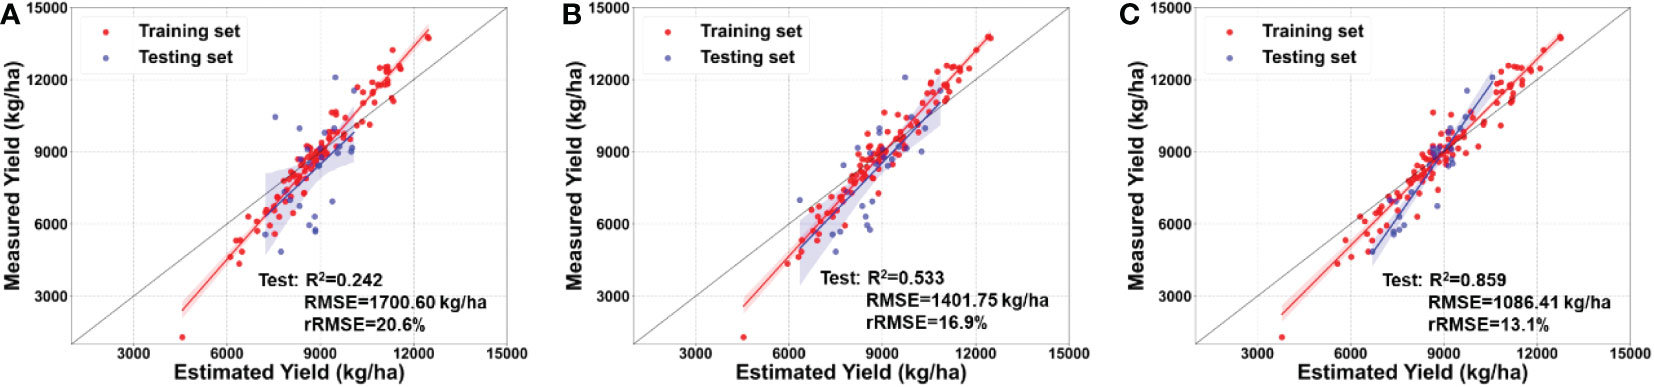
Figure 11 Maize yield estimated by integrating multimodal data with lodging index at the (A) tasseling stage (VT), (B) milking stage (R3), and (C) denting stage (R5).
To test the importance of the lodging index in yield estimation, Figure 12 shows the relationship between the residual of the estimation model (i.e., the estimated yield minus the measured yield) and the lodging index. Upon integrating the lodging index into the maize yield estimation model for all three maize growth stages, plots with a low (high) lodging index experience more (less) overestimation but less (more) underestimation. In addition, the estimation residuals are smaller at the R5 stage than at the VT and R3 stages, although adding the lodging index. In general, adding lodging information to the model reduces the underestimation of yield in areas of slight lodging and reduces overestimation in areas of severe lodging, so the model performs better in the early stage after lodging than in the later stage.
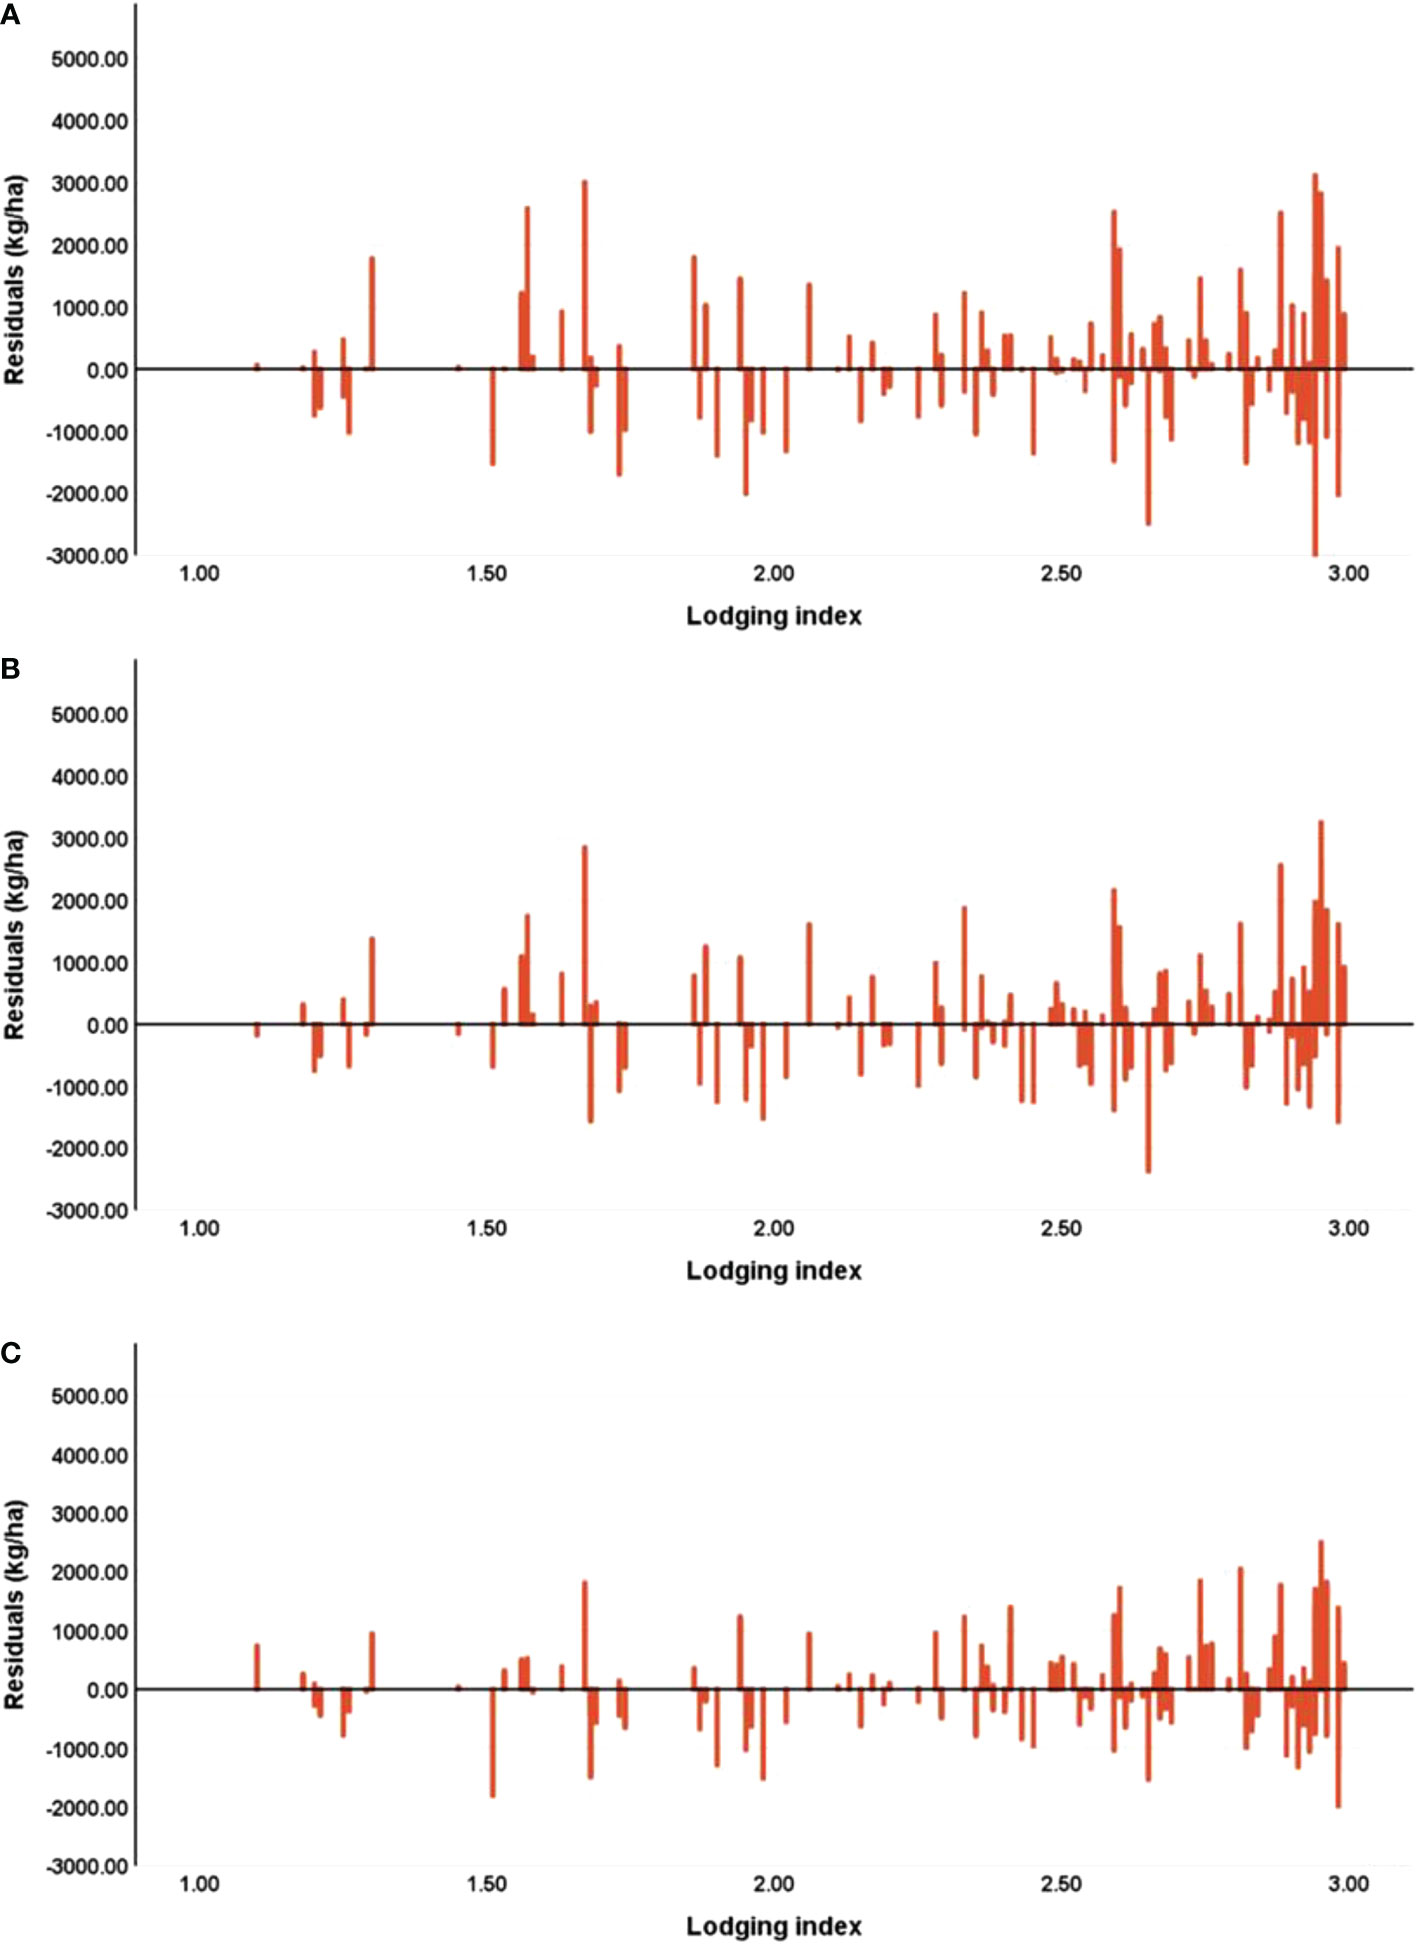
Figure 12 Estimation bias between measured yield and estimated yield, at the (A) tasseling stage (VT), (B) milking stage (R3), and (C) denting stage (R5).
4. Discussion
The construction of the lodging index should consider not only the degree of lodging but also the lodging area (Kendall et al., 2017). The lodging index proposed herein integrates the pixel-level degree of lodging and the fraction of the lodging area in the plot. The calculated lodging index well characterizes the degree of lodging of each plot (cf. Figures 6, 7), but subtle differences still exist where the lodging degree is underestimated. In addition, the lodging index represents the entire plot, but omits details within plots. Future work should construct a lodging index that represents more comprehensively the lodging situation of each community.
This study uses the spectral, structural, and textural information of the maize canopy to estimate maize yields. The model developed at the R5 stage has R2 = 0.806, RMSE = 1106.67 kg/ha, and rRMSE = 13.4%, which is consistent with previous studies (Rischbeck et al., 2016; Feng et al., 2020; Ramadanningrum et al., 2020). Integrating the lodging index with canopy spectral, structural, and textural information improves maize-yield estimates (Figures 8, 10) because lodging occurred in the field. The main reason for these results may be that the lodging index constructed herein provides useful information about the degree of lodging of each plot under natural conditions.
The variable importance at different growth stages presented in Figure 13 also shows that the CC and lodging index are important for estimating maize yields at all three growth stages. This shows that the lodging index may offer additional information associated with the growth status of maize. In addition, different variables are not screened to improve the performance of the model. Previous studies have shown that a strong linear correlation exists between vegetation indices, whereas each variable produces different effects on retrieving vegetation parameters (Zeng et al., 2022). Therefore, multiple variables must be integrated to estimate yield with better accuracy.
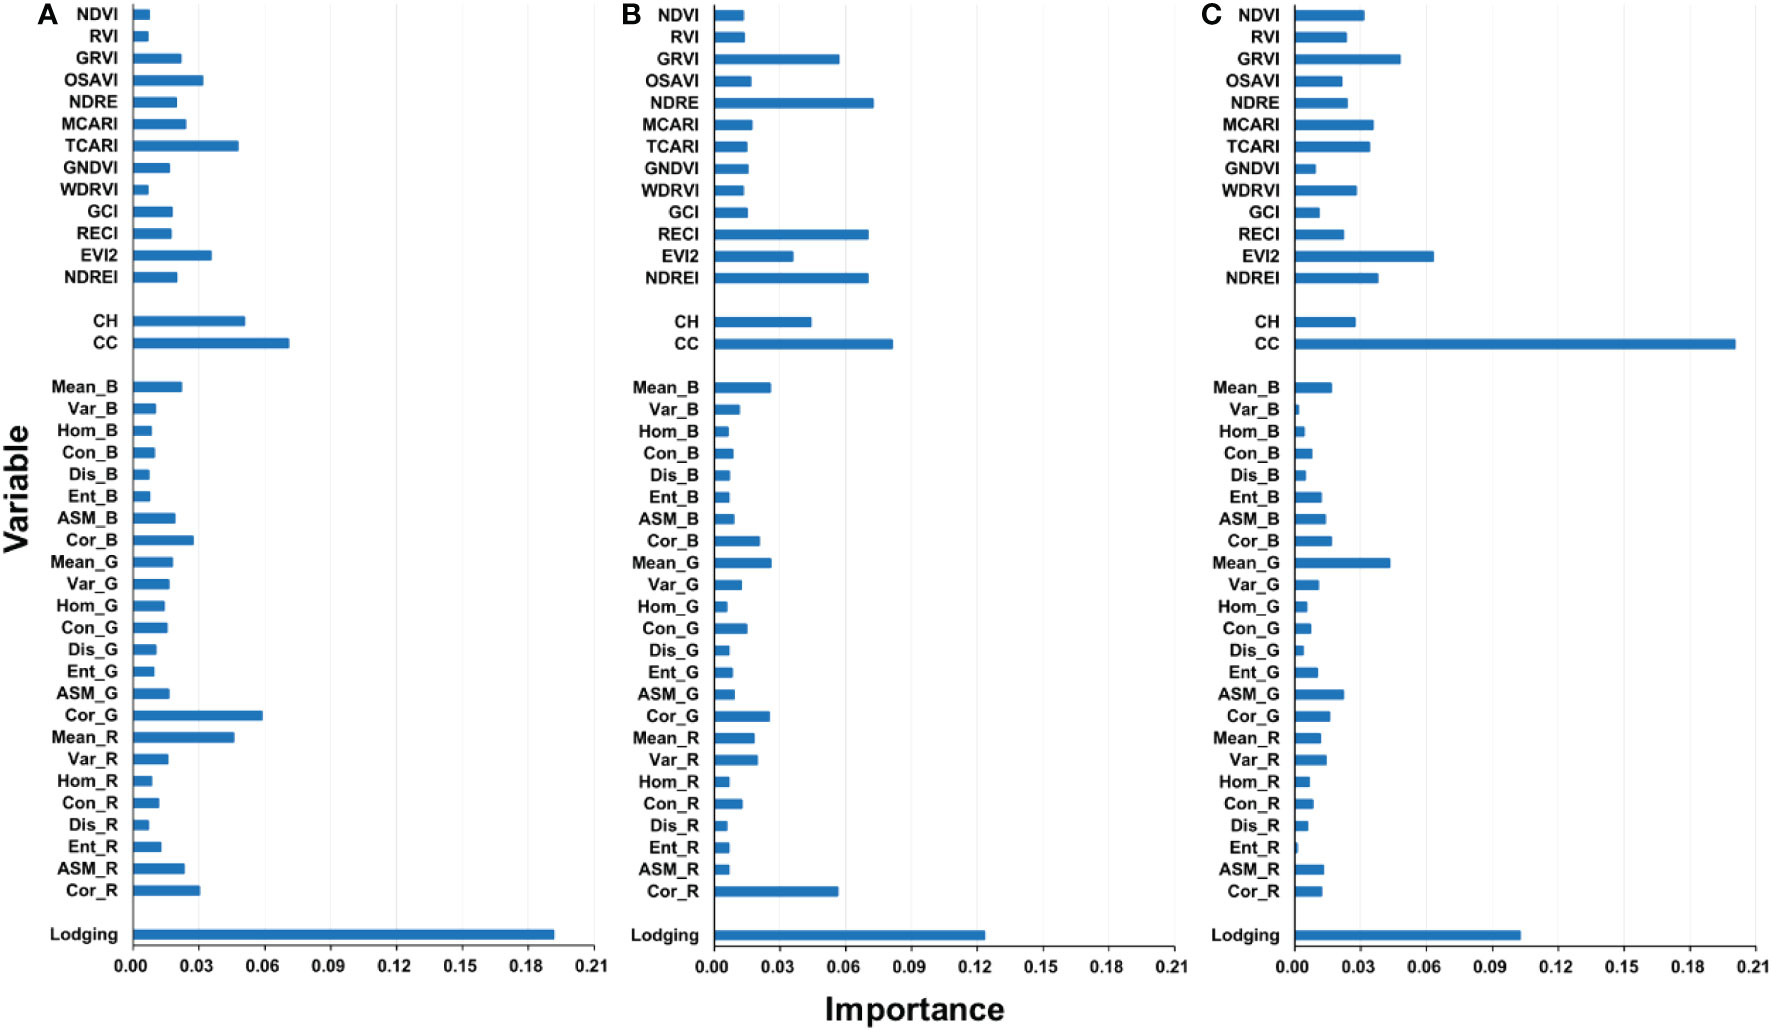
Figure 13 Variable importance of yield estimating model in different growth stages: (A) VT stage, (B) R3 stage, and (C) R5 stage.
The improved accuracy of yield estimation in the VT and R3 stages is slightly greater than that in the R5 stage, indicating a decreased response of maize plants to lodging as they grow. This is consistent with the varying importance at different growth stages presented in Figure 13. The importance of the lodging index in RFR modeling decreases as the growth stage approaches maturity. Such decreases may be attributed to the natural self-recovery of maize plants and the manual measures taken. The self-recovery of maize plants could change the canopy characteristics (Hu et al., 2021), which leads to less difference between lodged and non-lodged plants. Moreover, manual measures were applied within 3 days after lodging occurred to help the maize plants return to the upright state. These measures may also reduce the influence of lodging on yields and thereby weaken the effect of the lodging index on yield estimation. In addition, the response of maize plants to lodging decreases with the growth of maize plants. In this study, all experimental plots were analyzed together to verify the stability of the model, and the role of lodging in yield estimation in a variety of experiments and nitrogen treatments was not considered. Thus, future studies should take this into consideration.
Regardless of whether the lodging index is included in the yield estimation model, the model developed in the R5 stage is the most accurate of the three growth stages, and the model developed in VT stage is the least accurate. The main reason for this result may be that pollination does not start at the VT stage, and many factors can later affect the development of seeds. For example, the canopy characteristics might change with the rapid growth of the crop after lodging occurs due to the self-recovery of maize (Han et al., 2018). As the maize plants grow closer to harvesting, the development of seeds the canopy characteristics tend to stabilize (Song et al., 2016), which would improve the correlation between the final grain yields and the canopy characteristics. Therefore, estimating crop yield at the early growth stage produces greater error than estimating crop yield at later growth stages.
5. Conclusion
In this study, the RGB and multispectral images obtained from a low-altitude UAV are used to estimate the grain yield of various varieties of maize with different nitrogen fertilization treatments. The canopy spectral, structural, and textural information were integrated into the RFR algorithm for estimating maize yield. In addition, to study how lodging affects yield estimation, a lodging index was developed to quantify the degree of lodging of each plot. The results lead to the following main conclusions: (1) The lodging index developed herein accurately quantifies the degree of lodging of each plot. (2) Including the lodging index into the yield-estimation model leads to more accurate crop yield estimates, and the model performs better in the early stage of maize growth than that in the later stage of maize growth. (3) The maize yield can be accurately estimated by integrating spectral, structural, textural, and structure information of the maize canopy with the lodging index, especially in the R5 stage, which gives R2 = 0.859, RMSE = 1086.41 kg/ha, and rRMSE = 13.1%, followed by the R3 stage, with the VT stage producing the least accurate yield estimates.
Future efforts to improve UAV-based maize-yield estimation under various lodging conditions should focus on developing a more comprehensive lodging index, exploring how lodging affects yield estimation, and seeking new ways to integrate lodging information into yield estimation.
Data availability statement
The raw data supporting the conclusions of this article will be made available by the authors, without undue reservation.
Author contributions
BM, JX, HY, NC, WW and HX contributed to conception and design of the study. YL and LM organized the database. YL and ZW performed the statistical analysis. YL and CN wrote the first draft of the manuscript. YL, XJ and CN wrote sections of the manuscript. All authors contributed to the article and approved the submitted version.
Funding
This research was supported by Central Public‐interest Scientific Institution Basal Research Fund for Chinese Academy of Agricultural Sciences (Y2020YJ07, Y2022XK22), National Natural Science Foundation of China (42071426, 51922072, 51779161, 51009101), the National Key Research and Development Program of China (2021YFD1201602), the Agricultural Science and Technology Innovation Program of the Chinese Academy of Agricultural Sciences, Hainan Yazhou Bay Seed Lab (JBGS+B21HJ0221), Nanfan Special Project, CAAS (YJTC01, YBXM01), and the Special Fund for Independent Innovation of Agricultural Science and Technology in Jiangsu, China (CX(21)3065).
Conflict of interest
Author ZW is employed byHenan Provincial Communications Planning & Design Institute Co., LTD.
The remaining authors declare that the research was conducted in the absence of any commercial or financial relationships that could be construed as a potential conflict of interest.
Publisher’s note
All claims expressed in this article are solely those of the authors and do not necessarily represent those of their affiliated organizations, or those of the publisher, the editors and the reviewers. Any product that may be evaluated in this article, or claim that may be made by its manufacturer, is not guaranteed or endorsed by the publisher.
References
Acreche, M. M., Slafer, G. A. (2011). Lodging yield penalties as affected by breeding in Mediterranean wheats. Field Crops Res. 122 (1), 40–48. doi: 10.1016/j.fcr.2011.02.004
Aghighi, H., Azadbakht, M., Ashourloo, D., Shahrabi, H. S., Radiom, S. (2018). Machine learning regression techniques for the silage maize yield prediction using time-series images of landsat 8 OLI. IEEE J. Selected Topics Appl. Earth Observations Remote Sens. 11 (12), 4563–4577. doi: 10.1109/JSTARS.2018.2823361
Berger, K., Verrelst, J., Féret, J-B., Wang, Z., Wocher, M., Strathmann, M., et al. (2020). Crop nitrogen monitoring: Recent progress and principal developments in the context of imaging spectroscopy missions. Remote Sens. Environ. 242, 111758. doi: 10.1016/j.rse.2020.111758
Cai, Y., Guan, K., Lobell, D., Potgieter, A. B., Wang, S., Peng, J., et al. (2019). Integrating satellite and climate data to predict wheat yield in Australia using machine learning approaches. Agric. For. Meteorol. 274, 144–159. doi: 10.1016/j.agrformet.2019.03.010
Castillo-Martínez, M.Á., Gallegos-Funes, F. J., Carvajal-Gámez, B. E., Urriolagoitia-Sosa, G., Rosales-Silva, A. J. (2020). Color index based thresholding method for background and foreground segmentation of plant images. Comput. Electron. Agric. 178 (2020), 105783. doi: 10.1016/j.compag.2020.105783
Chauhan, S., Darvishzadeh, R., Boschetti, M., Pepe, M., Nelson, A. (2019). Remote sensing-based crop lodging assessment: Current status and perspectives. ISPRS J. Photogrammetry Remote Sens. 151, 124–140. doi: 10.1016/j.isprsjprs.2019.03.005
Chen, L., Yi, Y., Wang, W., Zeng, Y., Tan, X., Wu, Z., et al. (2021). Innovative furrow ridging fertilization under a mechanical direct seeding system improves the grain yield and lodging resistance of early indica rice in south China. Field Crops Res. 270, 108184. doi: 10.1016/j.fcr.2021.108184
Crane-Droesch, A. (2018). Machine learning methods for crop yield prediction and climate change impact assessment in agriculture. Environ. Res. Lett. 13 (11), 114003. doi: 10.1088/1748-9326/aae159
Daughtry, C. S. T., Walthall, C. L., Kim, M. S., de Colstoun, E. B., McMurtrey, J. E. (2000). Estimating corn leaf chlorophyll concentration from leaf and canopy reflectance. Remote Sens. Environ. 74 (2), 229–239. doi: 10.1016/S0034-4257(00)00113-9
Duan, T., Chapman, S. C., Guo, Y., Zheng, B. (2017). Dynamic monitoring of NDVI in wheat agronomy and breeding trials using an unmanned aerial vehicle. Field Crops Res. 210, 71–80. doi: 10.1016/j.fcr.2017.05.025
Duan, B., Fang, S., Gong, Y., Peng, Y., Wu, X., Zhu, R., et al. (2021). Remote estimation of grain yield based on UAV data in different rice cultivars under contrasting climatic zone. Field Crops Res. 267, 108148, 71–80. doi: 10.1016/j.fcr.2021.108148
Feng, L., Wang, Y., Zhang, Z., Du, Q. (2021). Geographically and temporally weighted neural network for winter wheat yield prediction. Remote Sens. Environ. 262, 112514. doi: 10.1016/j.rse.2021.112514
Feng, A., Zhou, J., Vories, E. D., Sudduth, K. A., Zhang, M. (2020). Yield estimation in cotton using UAV-based multi-sensor imagery. Biosyst. Eng. 193, 101–114. doi: 10.1016/j.biosystemseng.2020.02.014
Gitelson, A. A. (2004). Wide dynamic range vegetation index for remote quantification of biophysical characteristics of vegetation. J. Plant Physiol. 161 (2), 165–173. doi: 10.1078/0176-1617-01176
Gitelson, A. A., Gritz, Y., Merzlyak, M. N. (2003). Relationships between leaf chlorophyll content and spectral reflectance and algorithms for non-destructive chlorophyll assessment in higher plant leaves. J. Plant Physiol. 160 (3), 271–282. doi: 10.1078/0176-1617-00887
Gitelson, A. A., Merzlyak, M. N. (1997). Remote estimation of chlorophyll content in higher plant leaves. Int. J. Remote Sens. 18 (12), 2691–2697. doi: 10.1080/014311697217558
Gitelson, A. A., Vina, A., Ciganda, V., Rundquist, D. C., Arkebauer, T. J. (2005). Remote estimation of canopy chlorophyll content in crops. Geophysical Res. Lett. 32 (8), L08403. doi: 10.1029/2005GL022688
Haboudane, D., Miller, J. R., Tremblay, N., Zarco-Tejada, P. J., Dextraze, L. (2002). Integrated narrow-band vegetation indices for prediction of crop chlorophyll content for application to precision agriculture. Remote Sens. Environ. 81 (2), 416–426. doi: 10.1016/S0034-4257(02)00018-4
Hall-Beyer, M. (2017). Practical guidelines for choosing GLCM textures to use in landscape classification tasks over a range of moderate spatial scales. Int. J. Remote Sens. 38 (5), 1312–1338. doi: 10.1080/01431161.2016.1278314
Hamuda, E., Glavin, M., Jones, E. (2016). A survey of image processing techniques for plant extraction and segmentation in the field. Comput. Electron. Agric. 125, 184–199. doi: 10.1016/j.compag.2016.04.024
Han, L., Yang, G., Feng, H., Zhou, C., Yang, H., Xu, B., et al. (2018). Quantitative identification of maize lodging-causing feature factors using unmanned aerial vehicle images and a nomogram computation. Remote Sens. 10 (10), 1528. doi: 10.3390/rs10101528
Haralick, R. M., Shanmugam, K., Dinstein, I. (1973). Textural features for image classification. IEEE Trans. Syst. Man Cybernetics SMC-3 (6), 610–621. doi: 10.1109/TSMC.1973.4309314
Hassan, M. A., Yang, M., Rasheed, A., Jin, X., Xia, X., Xiao, Y., et al. (2018). Time-series multispectral indices from unmanned aerial vehicle imagery reveal senescence rate in bread wheat. Remote Sens. 10 (6), 809. doi: 10.3390/rs10060809
Hu, X., Sun, L., Gu, X., Sun, Q., Wei, Z., Pan, Y., et al. (2021). Assessing the self-recovery ability of maize after lodging using UAV-LiDAR data. Remote Sens. 13 (12), 2270. doi: 10.3390/rs13122270
Jiang, Z., Huete, A. R., Didan, K., Miura, T. (2008). Development of a two-band enhanced vegetation index without a blue band. Remote Sens. Environ. 112 (10), 3833–3845. doi: 10.1016/j.rse.2008.06.006
Jin, X., Li, Z., Feng, H., Ren, Z., Li, S. (2020). Estimation of maize yield by assimilating biomass and canopy cover derived from hyperspectral data into the AquaCrop model. Agric. Water Manage. 227, 105846. doi: 10.1016/j.agwat.2019.105846
Johansen, K., Morton, M. J.L., Malbeteau, Y., Aragon, B., Al-Mashharawi, S., Ziliani, M. G., et al. (2020). Predicting biomass and yield in a tomato phenotyping experiment using UAV imagery and random forest. Front. Artif. Intell. 3, 28. doi: 10.3389/frai.2020.00028
Johnson, M. D., Hsieh, W. W., Cannon, A. J., Davidson, A., Bédard, F. (2016). Crop yield forecasting on the Canadian prairies by remotely sensed vegetation indices and machine learning methods. Agric. For. Meteorol. 218-219, 74–84. doi: 10.1016/j.agrformet.2015.11.003
Jones, J. W., Hoogenboom, G., Porter, C. H., Boote, K. J., Batchelor, W. D., Hunt, L. A., et al. (2003). The DSSAT cropping system model. Eur. J. Agron. 18 (3), 235–265. doi: 10.1016/S1161-0301(02)00107-7
Ju, S., Lim, H., Ma, J. W., Kim, S., Lee, K., Zhao, S., et al. (2021). Optimal county-level crop yield prediction using MODIS-based variables and weather data: A comparative study on machine learning models. Agric. For. Meteorol. 307, 108530. doi: 10.1016/j.agrformet.2021.108530
Kang, Y., Özdoğan, M. (2019). Field-level crop yield mapping with landsat using a hierarchical data assimilation approach. Remote Sens. Environ. 228, 144–163. doi: 10.1016/j.rse.2019.04.005
Kashiwagi, T., Sasaki, H., Ishimaru, K. (2015). Factors responsible for decreasing sturdiness of the lower part in lodging of rice (Oryza sativaL.). Plant Production Sci. 8 (2), 166–172. doi: 10.1626/pps.8.166
Kendall, S. L., Holmes, H., White, C. A., Clarke, S. M., Berry, P. M. (2017). Quantifying lodging-induced yield losses in oilseed rape. Field Crops Res. 211, 106–113. doi: 10.1016/j.fcr.2017.06.013
Li, B., Xu, X., Zhang, L., Han, J., Bian, C., Li, G., et al. (2020). Above-ground biomass estimation and yield prediction in potato by using UAV-based RGB and hyperspectral imaging. ISPRS J. Photogrammetry Remote Sens. 162, 161–172. doi: 10.1016/j.isprsjprs.2020.02.013
Li, L., Wang, B., Feng, P., Wang, H., He, Q., Wang, Y., et al. (2021). Crop yield forecasting and associated optimum lead time analysis based on multi-source environmental data across China. Agric. For. Meteorol. 308–309, 108558. doi: 10.1016/j.agrformet.2021.108558
Li, W.-q., Han, M.-M., Pang, D.-W., Chen, J., Wang, Y.-Y., Dong, H.-H., et al. (2022). Characteristics of lodging resistance of high-yield winter wheat as affected by nitrogen rate and irrigation managements. J. Integr. Agric. 21 (5), 1290–1309. doi: 10.1016/S2095-3119(20)63566-3
Liu, X.-m., Gu, W.-r., Li, C.-f., Li, J., Wei, S. (2021). Effects of nitrogen fertilizer and chemical regulation on spring maize lodging characteristics, grain filling and yield formation under high planting density in heilongjiang province, China. J. Integr. Agric. 20 (2), 511–526. doi: 10.1016/S2095-3119(20)63403-7
Luo, X., Wu, Z., Fu, L., Dan, Z., Yuan, Z., Liang, T., et al. (2022). Evaluation of lodging resistance in rice based on an optimized parameter from lodging index. Crop Sci. 62 (3), 1318–1332. doi: 10.1002/csc2.20712
Maimaitijiang, M., Ghulam, A., Sidike, P., Hartling, S., Maimaitiyiming, M., Peterson, K., et al. (2017). Unmanned aerial system (UAS)-based phenotyping of soybean using multi-sensor data fusion and extreme learning machine. ISPRS J. Photogrammetry Remote Sens. 134, 43–58. doi: 10.1016/j.isprsjprs.2017.10.011
Maimaitijiang, M., Sagan, V., Sidike, P., Maimaitiyiming, M., Hartling, S., Peterson, K. T., et al. (2019). Vegetation index weighted canopy volume model (CVMVI) for soybean biomass estimation from unmanned aerial system-based RGB imagery. ISPRS J. Photogrammetry Remote Sens. 151, 27–41. doi: 10.1016/j.isprsjprs.2019.03.003
Maimaitijiang, M., Sagan, V., Sidike, P., Hartling, S., Esposito, F., Fritschi, F. B. (2020). Soybean yield prediction from UAV using multimodal data fusion and deep learning. Remote Sens. Environ. 237, 111599. doi: 10.1016/j.rse.2019.111599
Maimaitijiang, M., Sagan, V., Fritschi, F. B. (2021). “Crop Yield Prediction using Satellite/Uav Synergy and Machine Learning,” 2021 IEEE International Geoscience and Remote Sensing Symposium IGARSS, pp. 6276–6279, doi: 10.1109/IGARSS47720.2021.9554735.
Malambo, L., Popescu, S. C., Murray, S. C., Putman, E., Pugh, N. A., Horne, D. W.. (2018). Multitemporal field-based plant height estimation using 3D point clouds generated from small unmanned aerial systems high-resolution imagery. Int. J. Appl. Earth Observation Geoinformation 64, 31–42. doi: 10.1016/j.jag.2017.08.014
Mi, C., Zhang, X., Li, S., Yang, J., Zhu, D., Yang, Y. (2011). Assessment of environment lodging stress for maize using fuzzy synthetic evaluation. Math. Comput. Model. 54 (3), 1053–1060. doi: 10.1016/j.mcm.2010.11.035
Mishra, V., Cruise, J. F., Mecikalski, J. R. (2021). Assimilation of coupled microwave/thermal infrared soil moisture profiles into a crop model for robust maize yield estimates over southeast united states. Eur. J. Agron. 123, 126208. doi: 10.1016/j.eja.2020.126208
Mohanaiah, P., Sathyanarayana, P., Gurukumar, L. (2013). Image texture feature extraction using GLCM approach. Int. J. Sci. Res. Publications 3 (5), 1–5.
Nagy, A., Szabó, A., Adeniyi, O. D., Tamás, J. (2021). Wheat yield forecasting for the tisza river catchment using landsat 8 NDVI and SAVI time series and reported crop statistics. Agronomy 11 (4), 652. doi: 10.3390/agronomy11040652
Palosuo, T., Kersebaum, K. C., Angulo, C., Hlavinka, P., Moriondo, M., Olesen, J. E., et al. (2011). Simulation of winter wheat yield and its variability in different climates of Europe: A comparison of eight crop growth models. Eur. J. Agron. 35 (3), 103–114. doi: 10.1016/j.eja.2011.05.001
Panek, E., Gozdowski, D. (2021). Relationship between MODIS derived NDVI and yield of cereals for selected European countries. Agronomy 11 (2), 340. doi: 10.3390/agronomy11020340
Park, Y., Guldmann, J.-M. (2020). Measuring continuous landscape patterns with Gray-level Co-occurrence matrix (GLCM) indices: An alternative to patch metrics? Ecol. Indic. 109, 105802. doi: 10.1016/j.ecolind.2019.105802
Peng, X., Han, W., Ao, J., Wang, Y. (2021). Assimilation of LAI derived from UAV multispectral data into the SAFY model to estimate maize yield. Remote Sens. 13 (6), 1094. doi: 10.3390/rs13061094
Ramadanningrum, D. P., Kamal, M., Murti, S. H. (2020). Image-based tea yield estimation using landsat-8 OLI and sentinel-2B images. Remote Sens. Applications: Soc. Environ. 20, 100424. doi: 10.1016/j.rsase.2020.100424
Rischbeck, P., Elsayed, S., Mistele, B., Barmeier, G., Heil, K., Schmidhalter, U. (2016). Data fusion of spectral, thermal and canopy height parameters for improved yield prediction of drought stressed spring barley. Eur. J. Agron. 78, 44–59. doi: 10.1016/j.eja.2016.04.013
Rondeaux, G., Steven, M., Baret, F. (1996). Optimization of soil-adjusted vegetation indices. Remote Sens. Environ. 55 (2), 95–107. doi: 10.1016/0034-4257(95)00186-7
Rouse, J., Haas, R. H., Schell, J. A., Deering, D. W. (1974). Monitoring vegetation systems in the great plains with ERTS. In: NASA SP-351, Third ERTS-1 Symposium NASA, Washington DC. 1, pp. 309–317.
Shafiee, S., Lied, L. M., Burud, I., Dieseth, J. A., Alsheikh, M., Lillemo, M. (2021). Sequential forward selection and support vector regression in comparison to LASSO regression for spring wheat yield prediction based on UAV imagery. Comput. Electron. Agric. 183, 106036. doi: 10.1016/j.compag.2021.106036
Song, R., Cheng, T., Yao, X., Tian, Y., Zhu, Y., Cao, W.. (2016). “Evaluation of landsat 8 time series image stacks for predicitng yield and yield components of winter wheat,” in 2016 IEEE International Geoscience and Remote Sensing Symposium (IGARSS). 2016, 6300–6303. doi: 10.1109/IGARSS.2016.7730647
Stanton, C., Starek, M. J., Elliott, N., Brewer, M., Maeda, M. M., Chu, T., et al. (2017). Unmanned aircraft system-derived crop height and normalized difference vegetation index metrics for sorghum yield and aphid stress assessment. J. Appl. Remote Sens. 11 (2), 026035. doi: 10.1117/1.JRS.11.026035
Steduto, P., Hsiao, T. C., Raes, D., Fereres, E. (2009). AquaCrop–the FAO crop model to simulate yield response to water: I. concepts and underlying principles. Agron. J. 101 (3), 426–437. doi: 10.2134/agronj2008.0139s
Sui, J., Qin, Q., Ren, H., Sun, Y., Zhang, T., Wang, J., et al. (2018). Winter wheat production estimation based on environmental stress factors from satellite observations. Remote Sens. 10 (6), 962. doi: 10.3390/rs10060962
Tan, C. W., Zhang, P. P., Zhou, X. X., Wang, Z. X., Xu, Z. Q., Mao, W., et al. (2020). Quantitative monitoring of leaf area index in wheat of different plant types by integrating NDVI and beer-Lambert law. Sci. Rep. 10 (1), 929. doi: 10.1038/s41598-020-57750-z
Tan, S., Mortensen, A. K., Ma, X., Boelt, B., Gislum, R. (2021). Assessment of grass lodging using texture and canopy height distribution features derived from UAV visual-band images. Agric. For. Meteorol. 308–309, 108541. doi: 10.1016/j.agrformet.2021.108541
Tao, H., Feng, H., Xu, L., Miao, M., Yang, G., Yang, X., et al. (2020). Estimation of the yield and plant height of winter wheat using UAV-based hyperspectral images. Sensors (Basel) 20 (4), 1231. doi: 10.3390/s20041231
Tucker, C. J. (1979). Red and photographic infrared linear combinations for monitoring vegetation. Remote Sens. Environ. 8 (2), 127–150. doi: 10.1016/0034-4257(79)90013-0
Van Dam, J. C., Huygen, J., Wesseling, J., Feddes, R., Kabat, P., Van Walsum, P., et al. (1997). Theory of SWAP version 2.0. Tech. Document 45, 167.
van Diepen, C. A., Wolf, J., van Keulen, H., Rappoldt, C. (1989). WOFOST: a simulation model of crop production. Soil Use Manage. 5 (1), 16–24. doi: 10.1111/j.1475-2743.1989.tb00755.x
Wan, L., Cen, H., Zhu, J., Zhang, J., Zhu, Y., Sun, D., et al. (2020). Grain yield prediction of rice using multi-temporal UAV-based RGB and multispectral images and model transfer – a case study of small farmlands in the south of China. Agric. For. Meteorol. 291, 108096. doi: 10.1016/j.agrformet.2020.108096
Wang, Z. (2021). Detection and analysis of degree of maize lodging using UAV-RGB image multi-feature factors and V arious classification methods. ISPRS Int. J. Geo-Information. 10, 309. doi: 10.3390/ijgi10050309
Wang, F., Yi, Q., Hu, J., Xie, L., Yao, X., Xu, T., et al. (2021). Combining spectral and textural information in UAV hyperspectral images to estimate rice grain yield. Int. J. Appl. Earth Observation Geoinformation 102, 102397. doi: 10.1016/j.jag.2021.102397
Wu, S., Yang, P., Ren, J., Chen, Z., Li, H. (2021). Regional winter wheat yield estimation based on the WOFOST model and a novel VW-4DEnSRF assimilation algorithm. Remote Sens. Environ. 255, 112276. doi: 10.1016/j.rse.2020.112276
Xie, C., Yang, C. (2020). A review on plant high-throughput phenotyping traits using UAV-based sensors. Comput. Electron. Agric. 178, 105731. doi: 10.1016/j.compag.2020.105731
Xue, J., Xie, R.-Z., Zhang, W.-F., Wang, K.-R., Hou, P., Ming, B., et al. (2017). Research progress on reduced lodging of high-yield and -density maize. J. Integr. Agric. 16 (12), 2717–2725. doi: 10.1016/S2095-3119(17)61785-4
Xu, W., Chen, P., Zhan, Y., Chen, S., Zhang, L., Lan, Y., et al. (2021a). Cotton yield estimation model based on machine learning using time series UAV remote sensing data. Int. J. Appl. Earth Observation Geoinformation 104, 102511. doi: 10.1016/j.jag.2021.102511
Xu, X., Nie, C., Jin, X., Li, Z., Zhu, H., Xu, H., et al. (2021b). A comprehensive yield evaluation indicator based on an improved fuzzy comprehensive evaluation method and hyperspectral data. Field Crops Res. 270, 108204. doi: 10.1016/j.fcr.2021.108204
Xu, L., Zhou, L., Meng, R., Zhao, F., Lv, Z., Xu, B., et al. (2022). An improved approach to estimate ratoon rice aboveground biomass by integrating UAV-based spectral, textural and structural features. Precis. Agric. 23, 1276–1301. doi: 10.1007/s11119-022-09884-5
Yang, W., Nigon, T., Hao, Z., Dias Paiao, G., Fernández, F. G., Mulla, D., et al. (2021). Estimation of corn yield based on hyperspectral imagery and convolutional neural network. Comput. Electron. Agric. 184, 106092. doi: 10.1016/j.compag.2021.106092
Yue, J., Yang, G., Tian, Q., Feng, H., Xu, K., Zhou, C. (2019). Estimate of winter-wheat above-ground biomass based on UAV ultrahigh-ground-resolution image textures and vegetation indices. ISPRS J. Photogrammetry Remote Sens. 150, 226–244. doi: 10.1016/j.isprsjprs.2019.02.022
Yu, N., Li, L., Schmitz, N., Tian, L. F., Greenberg, J. A., Diers, B. W., et al. (2016). Development of methods to improve soybean yield estimation and predict plant maturity with an unmanned aerial vehicle based platform. Remote Sens. Environ. 187, 91–101. doi: 10.1016/j.rse.2016.10.005
Yu, D., Zha, Y., Shi, L., Jin, X., Hu, S., Yang, Q., et al. (2020). Improvement of sugarcane yield estimation by assimilating UAV-derived plant height observations. Eur. J. Agron. 121, 126159. doi: 10.1016/j.eja.2020.126159
Zeng, Y., Hao, D., Huete, A., Dechant, B., Berry, J., Chen, J. M., et al. (2022). Optical vegetation indices for monitoring terrestrial ecosystems globally. Nat. Rev. Earth Environ. 3 (7), 477–493. doi: 10.1038/s43017-022-00298-5
Zhang, Z., Jin, Y., Chen, B., Brown, P. (2019). California Almond yield prediction at the orchard level with a machine learning approach. Front. Plant Sci. 10, 809. doi: 10.3389/fpls.2019.00809
Zheng, H., Cheng, T., Zhou, M., Li, D., Yao, X., Tian, Y., et al. (2018). Improved estimation of rice aboveground biomass combining textural and spectral analysis of UAV imagery. Precis. Agric. 20 (3), 611–629. doi: 10.1007/s11119-018-9600-7
Keywords: remote sensing, maize yield, lodging levels, random forest regression, UAV images
Citation: Liu Y, Nie C, Zhang Z, Wang Z, Ming B, Xue J, Yang H, Xu H, Meng L, Cui N, Wu W and Jin X (2023) Evaluating how lodging affects maize yield estimation based on UAV observations. Front. Plant Sci. 13:979103. doi: 10.3389/fpls.2022.979103
Received: 27 June 2022; Accepted: 28 December 2022;
Published: 17 January 2023.
Edited by:
Yuzhen Lu, Mississippi State University, United StatesReviewed by:
Muhammad Ali Raza, Islamia University of Bahawalpur, PakistanHaikuan Feng, Beijing Research Center for Information Technology in Agriculture, China
Yanbo Huang, United States Department of Agriculture (USDA), United States
Joby Czarnecki, Mississippi State University, United States
Copyright © 2023 Liu, Nie, Zhang, Wang, Ming, Xue, Yang, Xu, Meng, Cui, Wu and Jin. This is an open-access article distributed under the terms of the Creative Commons Attribution License (CC BY). The use, distribution or reproduction in other forums is permitted, provided the original author(s) and the copyright owner(s) are credited and that the original publication in this journal is cited, in accordance with accepted academic practice. No use, distribution or reproduction is permitted which does not comply with these terms.
*Correspondence: Wenbin Wu, d3V3ZW5iaW5AY2Fhcy5jbg==; Xiuliang Jin, amlueGl1bGlhbmdAY2Fhcy5jbg==
†These authors share first authorship