 Xinyue Zhou
 Xiaojie Li
 Yan Zhao
- Key Laboratory of Grassland Resources (IMAU), Key Laboratory of Forage Cultivation, Processing and High Efficient Utilization, College of Grassland, Resource and Environmental Science, Ministry of Education, Ministry of Agriculture, Inner Mongolia Agricultural University, Hohhot, China
Background: Using genomic DNA from 79 F1 plants resulted from a crossing between parents with strong and weak grazing tolerance in Medicago falcata L., we generated an EcoRI restriction site-associated DNA (RAD) sequencing library. After sequencing and assembly, a high-density genetic map with high-quality SNP markers was constructed, with a total length of 1312.238 cM and an average density of 0.844 SNP/cM.
Methods: The phenotypic traits of 79 F1 families were observed and the QTLS of 6 traits were analyzed by interval mapping.
Results: Sixty three QTLs were identified for seven traits with LOD values from 3 to 6 and the contribution rates from 15% to 30%. Among the 63 QTLs, 17 were for natural shoot height, 12 for rhizome Length, 10 for Shoot canopy diameter, 9 for Basal plant diameter, 6 for stem number, 5 for absolute shoot height, and 4 for rhizome width. These QTLs were concentrated on LG2, LG4, LG5, LG7, and LG8. LG6 had only 6 QTLs. According to the results of QTL mapping, comparison of reference genomes, and functional annotation, 10 candidate genes that may be related to grazing tolerance were screened. qRT-PCR analysis showed that two candidate genes (LOC11412291 and LOC11440209) may be the key genes related to grazing tolerance of M. falcata.
Conclusion: The identified trait-associated QTLs and candidate genes in this study will provide a solid foundation for future molecular breeding for enhanced grazing-tolerance in M. falcata.
Introduction
Medicago falcata L. is a perennial legume in the Medicago genus (Wang et al., 2006, 2016). Distributed mainly in alpine regions such as Russia, Mongolia, and China’s East Central Inner Mongolia and Xinjiang. Medicago falcata has a strong tolerance to cold, drought, and grazing, and can grow in marginal soil with wide adaptability (Shi et al., 2019; Zhou et al., 2021). Because of these application values, M. falcata is widely used for grassland improvement, artificial range setup, and sand prevention (Popp et al., 2000). Improving grazing tolerance in cultivated alfalfa is a common goal worldwide in alfalfa breeding. In this regard, the values of M. falcata are well accepted for alfalfa breeding (Pecetti et al., 2008). In M. falcata, many traits, such as rhizome length, stem number, and shoot canopy diameter, are quantitative traits. It is practical to locate these traits in the M. falcata genome by using QTL analysis (McCord et al., 2014). The development and application of single nucleotide polymorphism (SNP) and the emergence of restriction site-associated DNA sequencing (RAD-Seq) technology pave the way for rapid development of SNPs and subsequent QTL analysis in non-model species, such as M. falcata (Li and Brummer, 2012; Kang et al., 2014). RAD-Seq is a new, yet powerful technology, which allows quick identification of millions of SNPs in a mapping population at low cost (Kumar et al., 2009; José et al., 2017; Yermekbayev et al., 2020). With RAD-Seq, we are able to generate a large number of SNPs, construct a genetic linkage map, and perform QTL analysis in M. falcata. Yin (2021) studied genetic diversity of Elymus dahuricus was analyzed by RAD-Seq sequencing. The results showed that the phenotypic clustering results were consistent with RAD sequencing results for about 50% of the materials within two years, indicating that phenotypic classification results and molecular sequencing results were mutually confirmed and well matched. For example, (Zhang et al., 2020) used single nucleotide polymorphism (SNP) markers to construct a high-density linkage map of alfalfa. QTL mapping for yield-related traits was carried out. Cui (2020) used 460 SNP markers to construct the genetic linkage map of alfalfa and M. falcata, and conducted QTL mapping for alfalfa agronomic traits. Liu (2012) constructed a genetic linkage map of tetraploid alfalfa using 51 RAPD markers and mapped QTL for 16 important agronomic traits. Liu (2017) constructed alfalfa genetic linkage map by using 176 SSR polymorphism markers and 960 SNP markers, and conducted QTL mapping for 19 related traits, such as alfalfa yield. Up to date, numerous studies have demonstrated the phenotypic features related to grazing tolerance, established the evaluation methodologies and metrics for grazing tolerance in M. falcata, and proven the unique advantages of M. falcata in the improvement of grazing tolerance in cultivated alfalfa. Wang et al. (2013) proved the reliability of optimal sequence analysis in M. falcata grazing tolerance, and through morphological index analysis showed that in the Hulunbuir native M. falcata, plant individuals with large projection area, great plant height, significant plants diameters stem number, long root depth and significant root diameters had strong grazing tolerance. Wang (2015) studied the grazing tolerance in Hulunbuir native M. falcata, cloned and analyzed some grazing tolerance-related genes (Jiang et al., 2022). Based on RAD-seq, the genetic linkage map and QTL mapping of Medicago sativa L. flowering stage traits were constructed, and 7 candidate genes related to flowering stage were screened out. However, there are no reports on the construction of genetic linkage map of M. falcata, QTL studies on grazing tolerance traits of M. falcata, and candidate gene screening (Luciano et al., 2021).
In this study, we chose two M. falcata parents with contrasting grazing tolerance, crossed the two parents, and generated a mapping population. Using RAD-seq technique, SNPS were identified, the first genetic linkage map was constructed, and QTL sites related to grazing tolerance were analyzed. Ten candidate genes related to grazing tolerance were screened out, and two of them were presumed to be key genes. The linkage map constructed and the QTL candidate genes identified for grazing tolerance will provide valuable information for future molecular mechanism studies and lay a solid foundation for improving grazing tolerance of alfalfa.
Materials and methods
Materials and population generation
Two native M. falcata genotypes (MF200401 and MF200402) from Hulunbuir, Inner Mongolia, China, were chosen as the parents for genetic crossing, and they were tetraploid plants. MF200401, which has high grazing tolerance, was used as the maternal parent, whereas MF200402, which has low grazing tolerance, was used as the paternal parent. Individual plants with contrasting grazing tolerance phenotypes were manually pollinated to generate an F1 population of 79 plants. From 2016 to 2018, we observed the agronomic traits related to grazing tolerance of M. falcata F1 population at grassland station of Hulunbuir Ewenki Autonomous Banner (119°07′ E latitude 49°01′ N latitude) and experimental base of Inner Mongolia Agricultural University, and focused on the identification and evaluation of grazing tolerance.
Trait definition and analysis
In this study, we focused on the following important traits: shoot height, basal plant diameter, stem number, shoot canopy diameter, rhizome length, and rhizome width. Each trait was measured with the following description:
Shoot height (cm): We measured the natural height and the absolute height. Natural height was measured as the height of shoot from the ground to the highest point of the shoot under natural growing status. Absolute height was measured as the height of shoot from the ground to the highest point of the shoot when the shoot was pulled and stretched straight.
Shoot basal diameter (cm): The diameter of the cluster below the first node was measured.
Stem number: Total number of shoots in a plant cluster.
Shoot canopy diameter (cm): The shoot canopy diameter was approximated by measuring the diameter of the shadow cast by the shoot canopy on the ground when the sun was on the top of the plant at noon.
Rhizome length (cm) and rhizome width(cm): The length and the diameter of the crown of each cluster of plants were measured.
DNA extraction
From the crossing population, 79 individuals were selected randomly to construct the genetic map. Genomic DNA of the 79 F1 individuals and two parents, MF200401 and MF200402, was extracted from young leaves using the Plant Genomic DNA Extraction Kit (DP305, TianGen, Beijing, China) following the manufacturer’s instructions.
RAD library construction and sequencing
About 1 μg of genomic DNA was digested with EcoRI, followed by ligation of Solexa P1 Adapter (common adapter with EcoRI end), fragmentation, gel recovery of 300–700 bp fragments, end-filling of A, ligation of Solexa P2 Adapter (adapter with barcode). The individual samples were pooled together, purified, and PCR amplified with P1 and P2 primers for 18 cycles. The 300–700-bp amplicons were further gel purified and the quality was checked using Agilent 2100 Bioanalyzer and then sequenced using the Illumina HiSeq 2500 platform at BGI (Shenzhen, China).
Sequencing data analysis
In order to ensure the accuracy of subsequent information analysis, the original sequence was quality-filtered and compared to the reference genome for analysis by BWA software. Sequence data were analyzed using customized Perl scripts from BGI-Shenzhen (Shenzhen, China). Raw reads were cleaned up by removing the adapters, index sequences, and low-quality reads. RAD markers were developed using the clean data. SNPs markers were examined using the GATK1 program. Reads from each individual were clustered into tag reads by sequence similarity (allowing five mismatches, at most, between any two reads within each tag reads cluster) and clusters with <3 or >100 reads were discarded. All the SNPs had total support reads ≥ 5, and for heterozygous SNPs, the inferior base depth was ≥3.
SNP detection and map construction
All SNPs markers used for genetic linkage map construction were filtered using the following criteria: (1) ratio of confidence levels to quality depth ≥ 2; (2) p-values from the Fisher’s exact test ≤ 60; (3) RMS mapping quality values ≥ 40; (4) all markers were tested by Chi-square test (p < 0.01).
Genetic linkage maps were generated using JoinMap version 4.1. A logarithm of the odds (LOD) score between 2 and 20 was set to cluster linkage groups. The regression mapping was used as the mapping algorithm, and the genetic distances were calculated based on Kosambi’s mapping function. All SNPs were clustered on 8 linkage groups (LGs). The location and distance between each SNP were calculated based on multipoint analysis.
QTLs analysis
QTL analysis was performed using MapQTL version 6.0 software based on the parental maps and phenotype data from 79 individual plants. QTLs were detected using interval mapping initially, and the mapping algorithm was a mixed model. Then multiple QTL mapping (MQM) was performed to detect additional QTLs that might be masked by the major QTLs. After a 1,000 permutation test, a LOD threshold of 3 was set to find significant QTLs at the 95% confidence level. The ranges above the LOD threshold of 3 were identified as QTL intervals. Markers located at or flanked with the peak LOD value of a QTL were recognized as QTL-associated markers.
Screening and analysis of candidate genes
Medicago falcata L. CV. Hulunbuir was selected as plant material to detect the expression of candidate genes. Choose the particle satiated M. falcata, with sandpaper, break hard real-time, in Petri dish culture to sprout, the germination of seeds in sterile culture in the soil and put to cultivate in artificial climate chamber, during the cultivation for long sunshine condition (16 h light/8 h) of the dark, day/night temperature 18°C to 26°C, well ventilated, and regular watering. When growth to the flowering period, choose three plants that grow better and the peak of flowering period simulated cutting processing, M. falcata cutting stubble height is 15 cm, respectively dealing with 3, 5, and 7 days, each point in time selecting a suitable amount of leaf and stem tissue in 2 ml centrifuge tube, and one not to cut processing plant as a control, sampling at the same time, the liquid nitrogen frozen. Total RNA was extracted according to the FastPure Plant Total RNA Isolation Kit (Vazyme, China), and biological replicates were performed three times. The quality of RNA was determined by electrophoresis of a 1% (w/v), agarose gel. First-strand cDNA was synthesized from 2 μg total RNA using the TransScript First-Strand cDNA Synthesis SuperMix Kit (TransGen, China). qRT-PCR was performed by SYBR green Super Mix and CFX96 Real-Time PCR Detection System (Bio-Rad, Hercules, CA, United States). Gene-specifc primers used for qRT-PCR were designed using Oligo 7.0. The expression level of MfActin was used as the internal control, the relative expression levels of candidate genes were calculated according to the 2−ΔΔCT method, and three independent biological replicates were used for each sample.
Results
Establish mapping groups
In this study, two alfalfa populations with extreme differences in grazing tolerance traits were selected as materials, and the parents with the greatest differences in important grazing tolerance-related traits such as regeneration rate, number of branches, and root neck depth into the soil were selected for intra-species one-to-one single sexual crosses to obtain two F1 populations, which could be asexually propagated and could be used as permanent mapping populations, and a population with 79 single plants was selected as the mapping population after hybrid testing and identification (Figure 1).
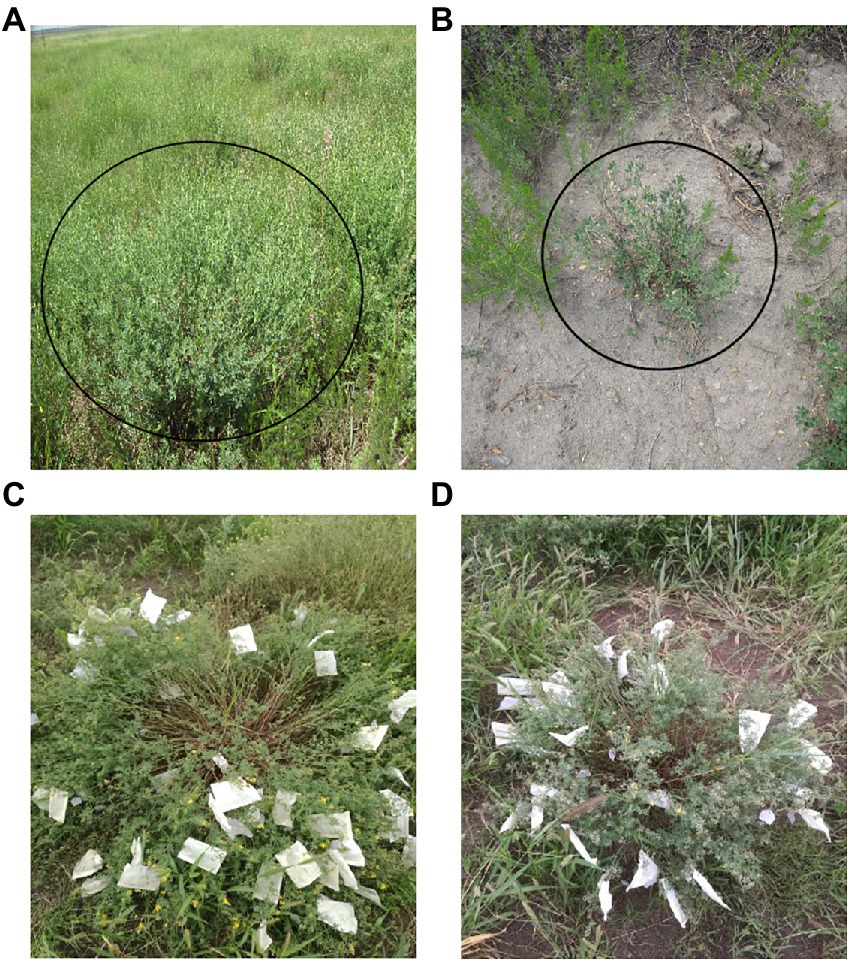
Figure 1. (A) Plants with high grazing tolerance were selected under continuous high-intensity grazing in Ewenki Autonomous Banner (119° 07′ E Latitude 49° 01′ N Latitude), Hulunbuir, China, and named (MF200401); (B) Plants with low grazing tolerance were selected under continuous high-intensity grazing in Ewenki Autonomous Banner (119° 07′E Latitude 49° 01/N Latitude), Hulunbuir, China, and named (MF200402); (C) Orthologous population; hybrid parent 1; 79 F1 populations obtained by crossing grazing-tolerant material (MF200401) with poorly grazing-tolerant material (MF200402); (D) Reverse cross population; hybrid parent 2; 54 F1 populations obtained by crossing grazing-tolerant material (MF200401) with poorly grazing-tolerant material (MF200402).
Analysis of variance of morphological index data observed after grazing
The morphological and physiological characteristics related to grazing tolerance of M. falcata were studied systematically. Five phenotypic traits directly affecting the formation of grazing tolerance of M. falcata and two phenotypic traits indirectly involved in the formation of grazing tolerance were identified, which revealed the morphological mechanism and physiological basis of grazing tolerance of M. falcata. Two genotypic population materials with significant differences in grazing tolerance were identified and screened (one was MF200401 material with high grazing tolerance, and one is MF200402 material with low grazing resistance; Table 1).
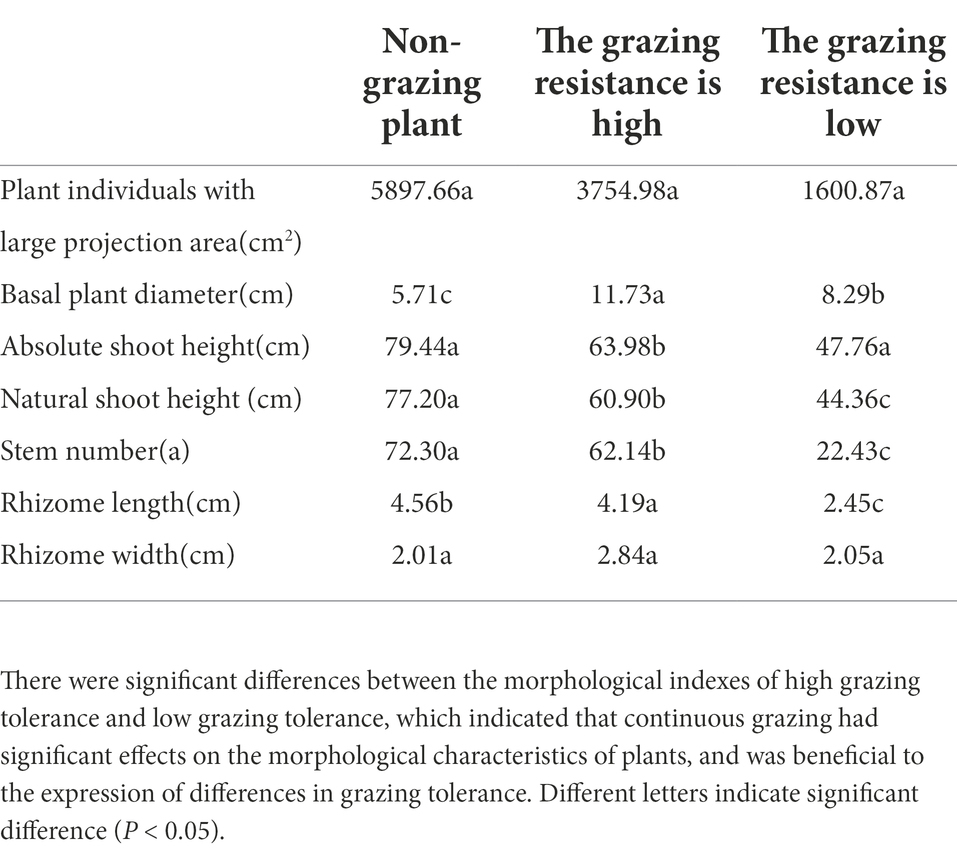
Table 1. Analysis of variance of phenotypic traits observed in F1 population of two sites in 3 years was conducted.
Polymorphism selection
In this study, a total of 1,412,614 high-quality polymorphic SNP loci were screened based on the RAD data of the parents. Based on the SNP detection results, the polymorphic SNPs between parents were screened (Table 2). For the F1 population, heterozygous loci with polymorphisms between parents (lm × ll, nn × np, ab × cd, ef × eg, hk × hk types) were screened (Table 3). Filter out loci with missing parental information. The marker loci with >10% deletion rate in the offspring population were filtered out, i.e., for single polymorphic loci, at least 90% of the samples have a definite genotype. After filtering to obtain parental polymorphic loci meeting the filtering 5,191 parental polymorphic loci were filtered, and the results were imported into JoinMap 4.1 software for further.
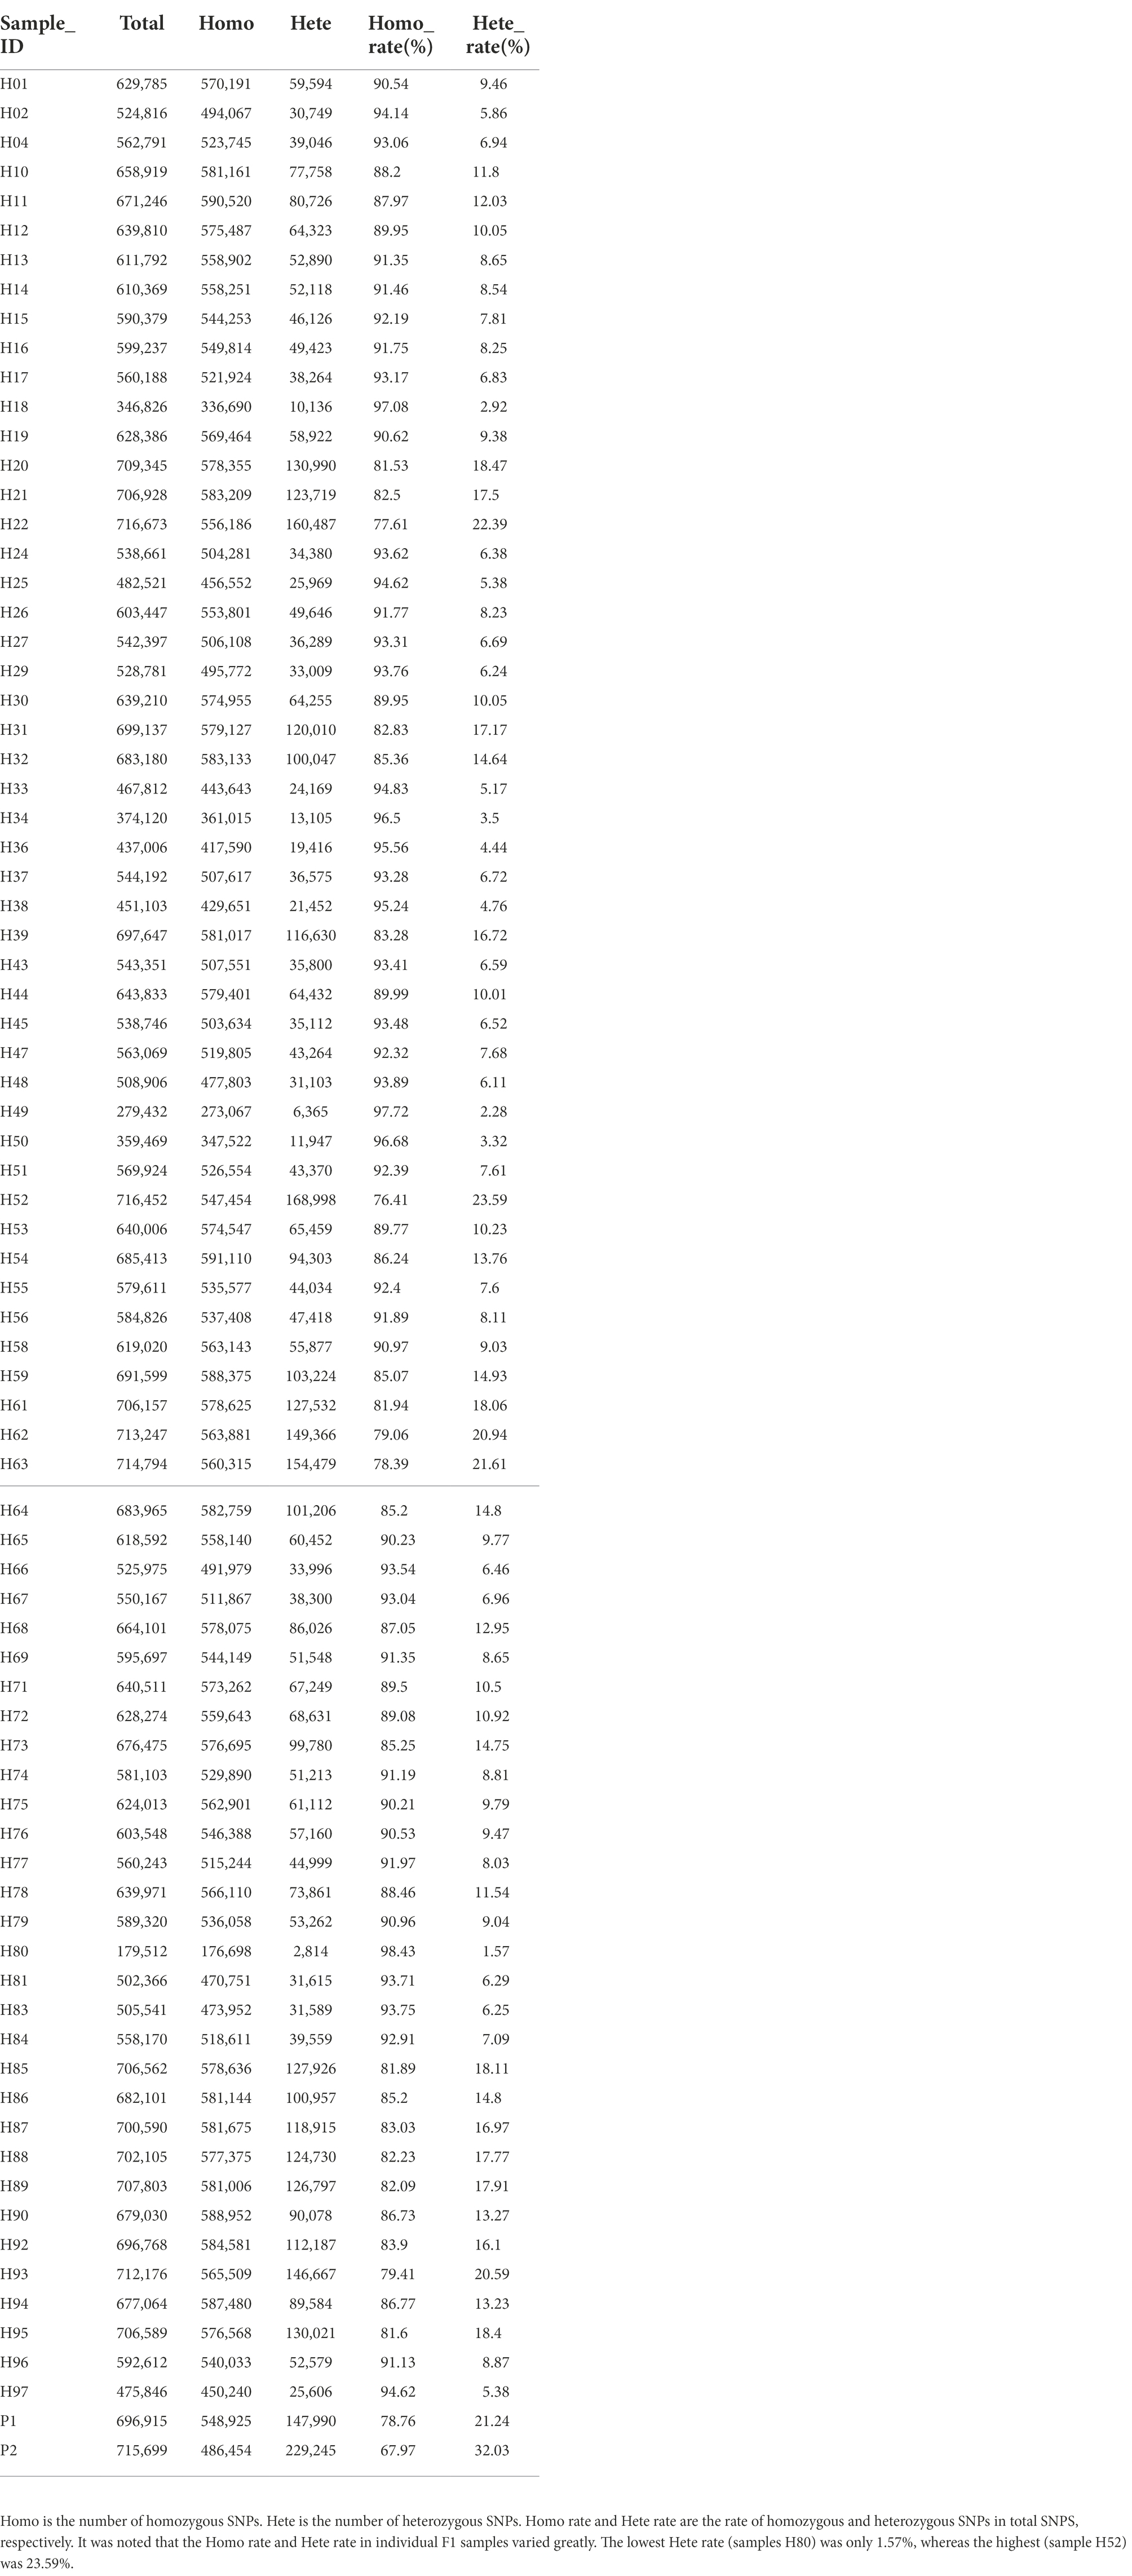
Table 2. The results of mutation detection and analysis by high-throughput sequencing showed that summary of SNPs in individual samples.

Table 3. Type of markers.
Biased segregation filtering In progenies
The offspring were genotyped according to the parental marker types obtained from the screening, and the obtained markers were tested by Chi-square test (significance level α = 0.01) to remove the segregating markers (e.g., F2 population aa, ab, bb). The expected probability ratio of F2 population aa, ab, and bb genotypes is 1:2:1, and a significant deviation from this ratio is considered as a marker bias, the bias markers will affect the map construction results and QTL localization, and the majority of the literature on the treatment of biased segregation, using the Chi-square test. The threshold value for segregation was set at 0.1, and the abnormal genotypes were filtered out according to the segregating genotypes of the offspring of different populations. The results were compiled into the Joinmap4.1 input file format for genetic mapping (Table 4).
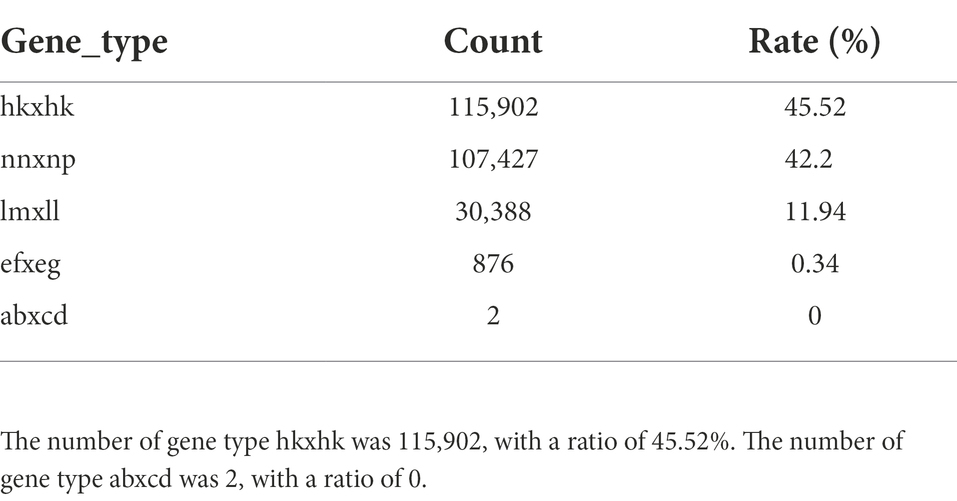
Table 4. Summary of polymorphic types in F1 progenies.
Construction of genetic linkage map
Based on logarithm of the odds (LOD) values (2 < LOD < 20), 1,756 SNPs were used to generate the genetic linkage map using JoinMap version 4.1. The regression mapping was used as the mapping algorithm, and the genetic distances were calculated based on Kosambi’s mapping function. These mapped SNPs were clustered in 8 linkage groups (LGs). The total length of the consensus map was 1312.238 cM with the average distance about 0.844 cM between markers. The distribution of SNPs in each LG and the genetic distances were summarized in Table 4 From the results in Table 4, LG4 and LG8 had the most SNPs, while LG6 had the least SNPs. LG8 had the smallest average genetic distance between SNPs, while LG6 had the largest average genetic distance of 1.69 cM. The largest gap between two SNPs (22.482 cM) was found in LG3. All SNPs were loaded to Joinmap4.1 and a genetic map was generated as shown in Figure 2.
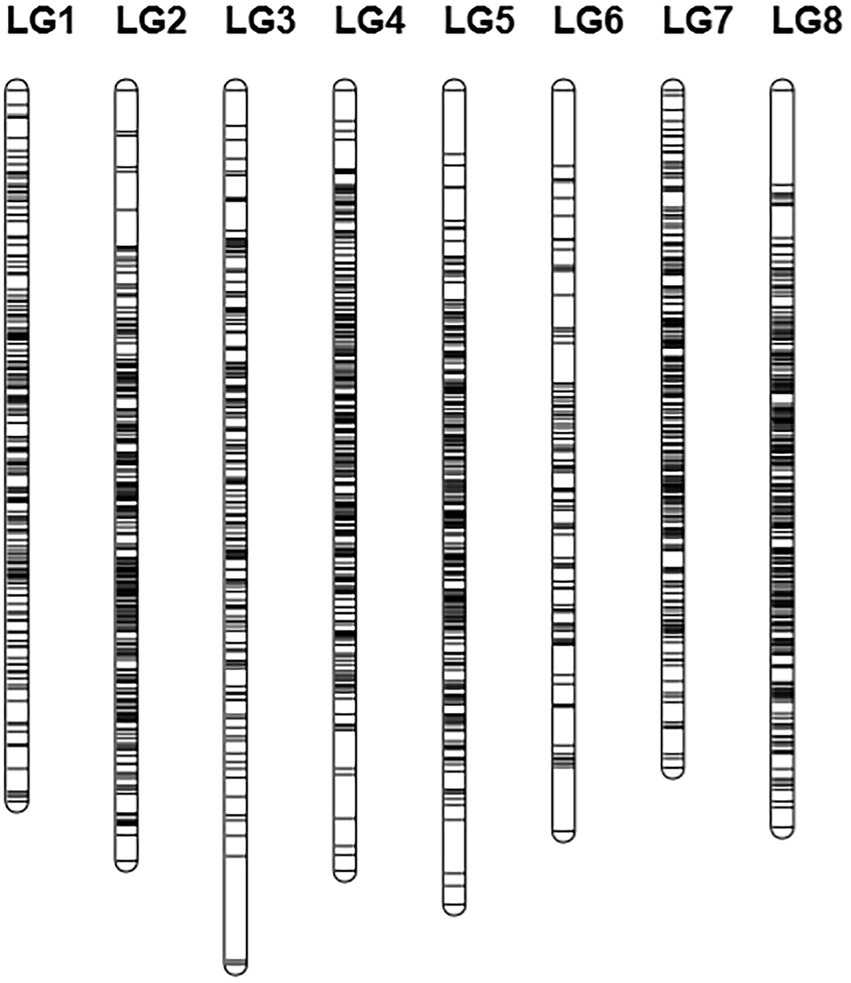
Figure 2. Genetic linkage map.
Co-linear analysis of genetic map and physical map
From the collinearity analysis results, the collinearity results of genetic map and physical map were not very good, but the trend of most markers was consistent. Marker was evenly distributed on the genome.
Analysis of grazing tolerance QTLs
QTLs were detected using the interval mapping method in the MapQTL6 software. A total of 63 QTLs were identified for six grazing tolerance-associated traits (Table 5). Among them, 12 QTLs were related to rhizome length, which contributed for 16.9%–28.3% variance; 4 QTLs for rhizome width, contributing for 17.7%–20.3%; 10 QTLs for shoot canopy diameter, contributing for 16.7%–26%; 9 QTLs for basal plant diameter, contributing for 16.6%–27.4%; 6 QTLs for stem number, contributing for 16.5%–22.3%; 5 QTLs for absolute shoot height, contributing for 16.8–20.7%; and 17 QTLs for natural shoot height, contributing for 16.5%–24.4%. These QTLs were mainly distributed on LG2, LG4, LG5, LG7, and LG8. LG6 had the least QTLs. The LOD values were between 3 and 6 and the contribution was between 15% and 30%. There were no markers that had significantly high contribution (greater than 60%).
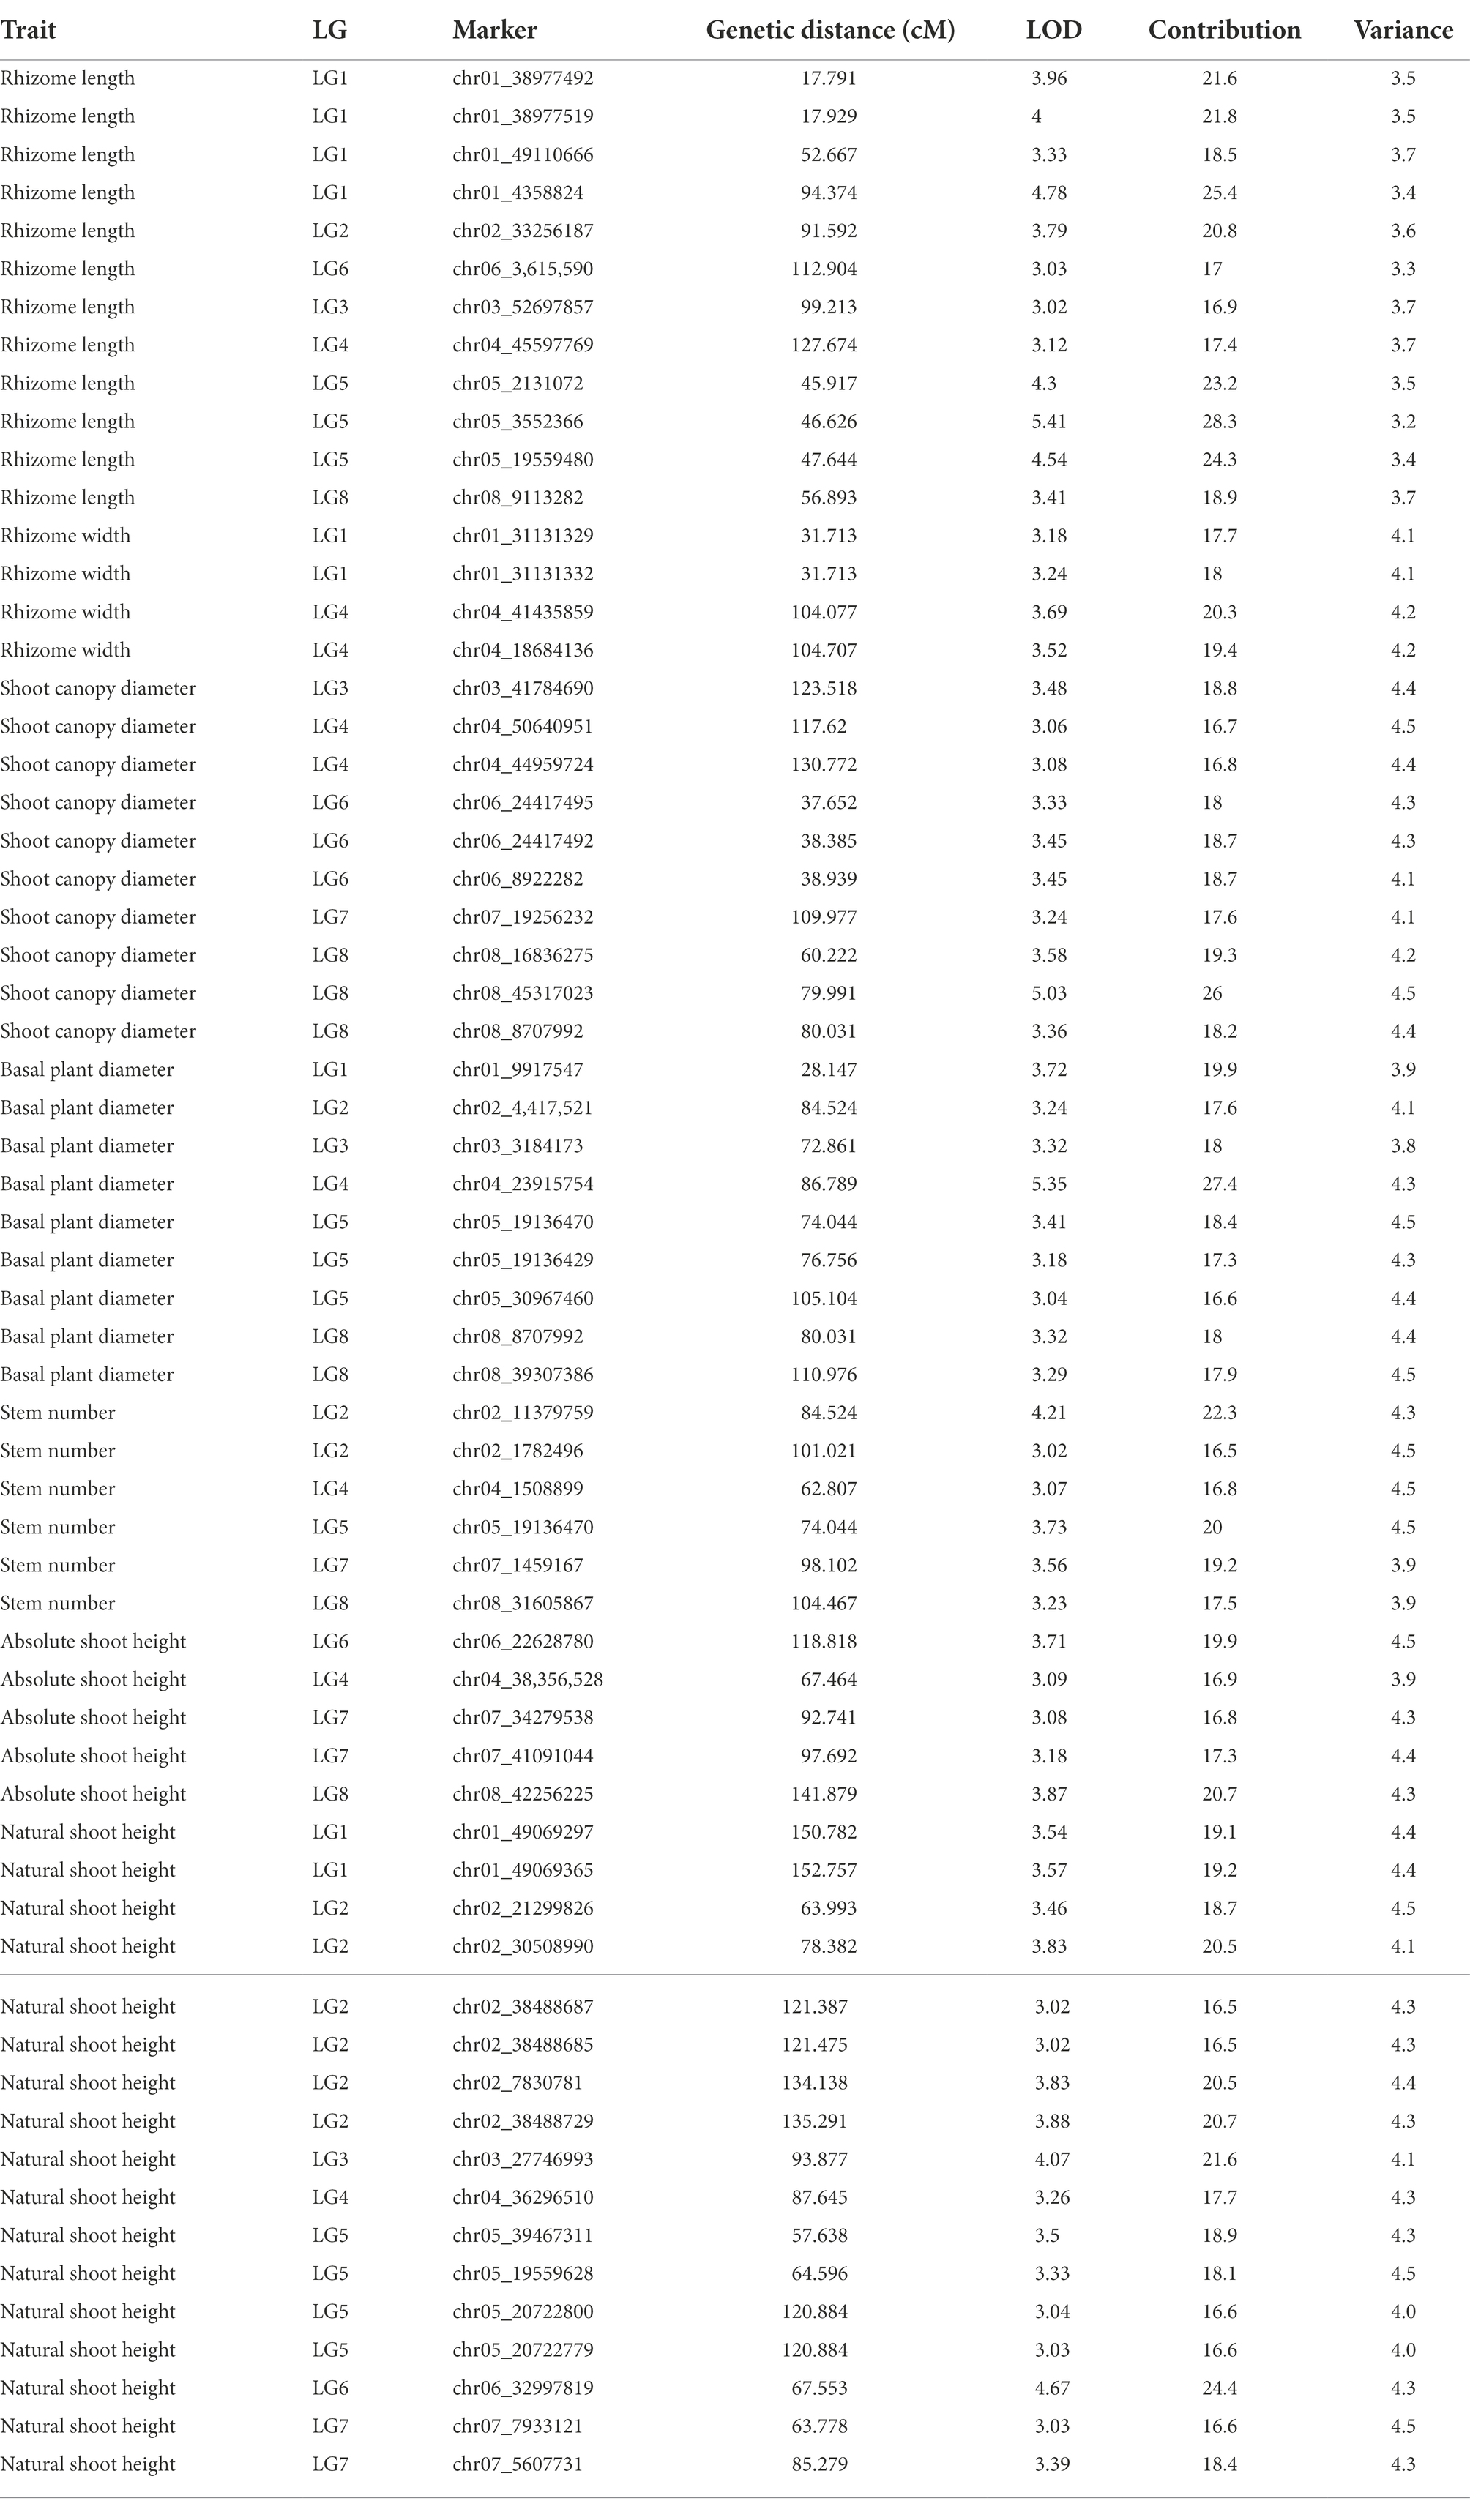
Table 5. Results of QTL analysis from MapQTL6.
From the results in Table 5 and Figure 3, we identified 12 significant QTLs for the rhizome length in LG1, LG2, LG3, LG4, LG5, LG6, and LG8. The LOD values for the 12 QTLs were between 3.02 and 5.41 and the contribution ranged from 16.9% to 28.3%. The QTL with maximal LOD value was located in LG5, while the QTL with the minimal LOD was in LG3. Similarly, from the results in Table 6 and Figure 4, we identified four significant QTLs for the rhizome width in LG1 and LG4. The LOD values for the four QTLs were from 3.18 to 3.69 and the contribution ranged from 17.7 to 20.3%. From the results in Table 6 and Figure 5, we identified 10 significant QTLs for the shoot canopy diameter in LG3, LG4, LG6, LG7, and LG8. The LOD values for the QTLs were from 3.06 to 5.03 and the contribution ranged from 16.7% to 26%. From the results in Table 6 and Figure 6, we identified nine significant QTLs for the basal plant diameter in LG1, LG2, LG3, LG4, LG5, and LG8. The LOD values for the QTLs were from 3.04 to 5.35 and the contribution ranged from 16.6 to 27.4%. From the results in Table 6 and Figure 7, we identified 6 significant QTLs for the stem number in LG2, LG4, LG5, LG7, and LG8. The LOD values for the QTLs were from 3.02 to 4.21 and the contribution ranged from 16.5% to 22.3%. From the results in Table 6 and Figure 8, we identified five significant QTLs for the absolute shoot height inLG4, LG6, LG7, and LG8. The LOD values for the QTLs were from 3.08 to 3.87 and the contribution ranged from 16.8% to 20.7%. From the results in Table 6 and Figure 9, we identified 17 significant QTLs for the natural shoot height in LG1, LG2, LG3, LG4, LG5, LG6, and LG7. The LOD values for the QTLs were from 3.02 to 4.67 and the contribution ranged from 16.5% to 24.4%. The QTL with maximal LOD value was located in LG6 while the QTL with the minimal LOD was in LG2.
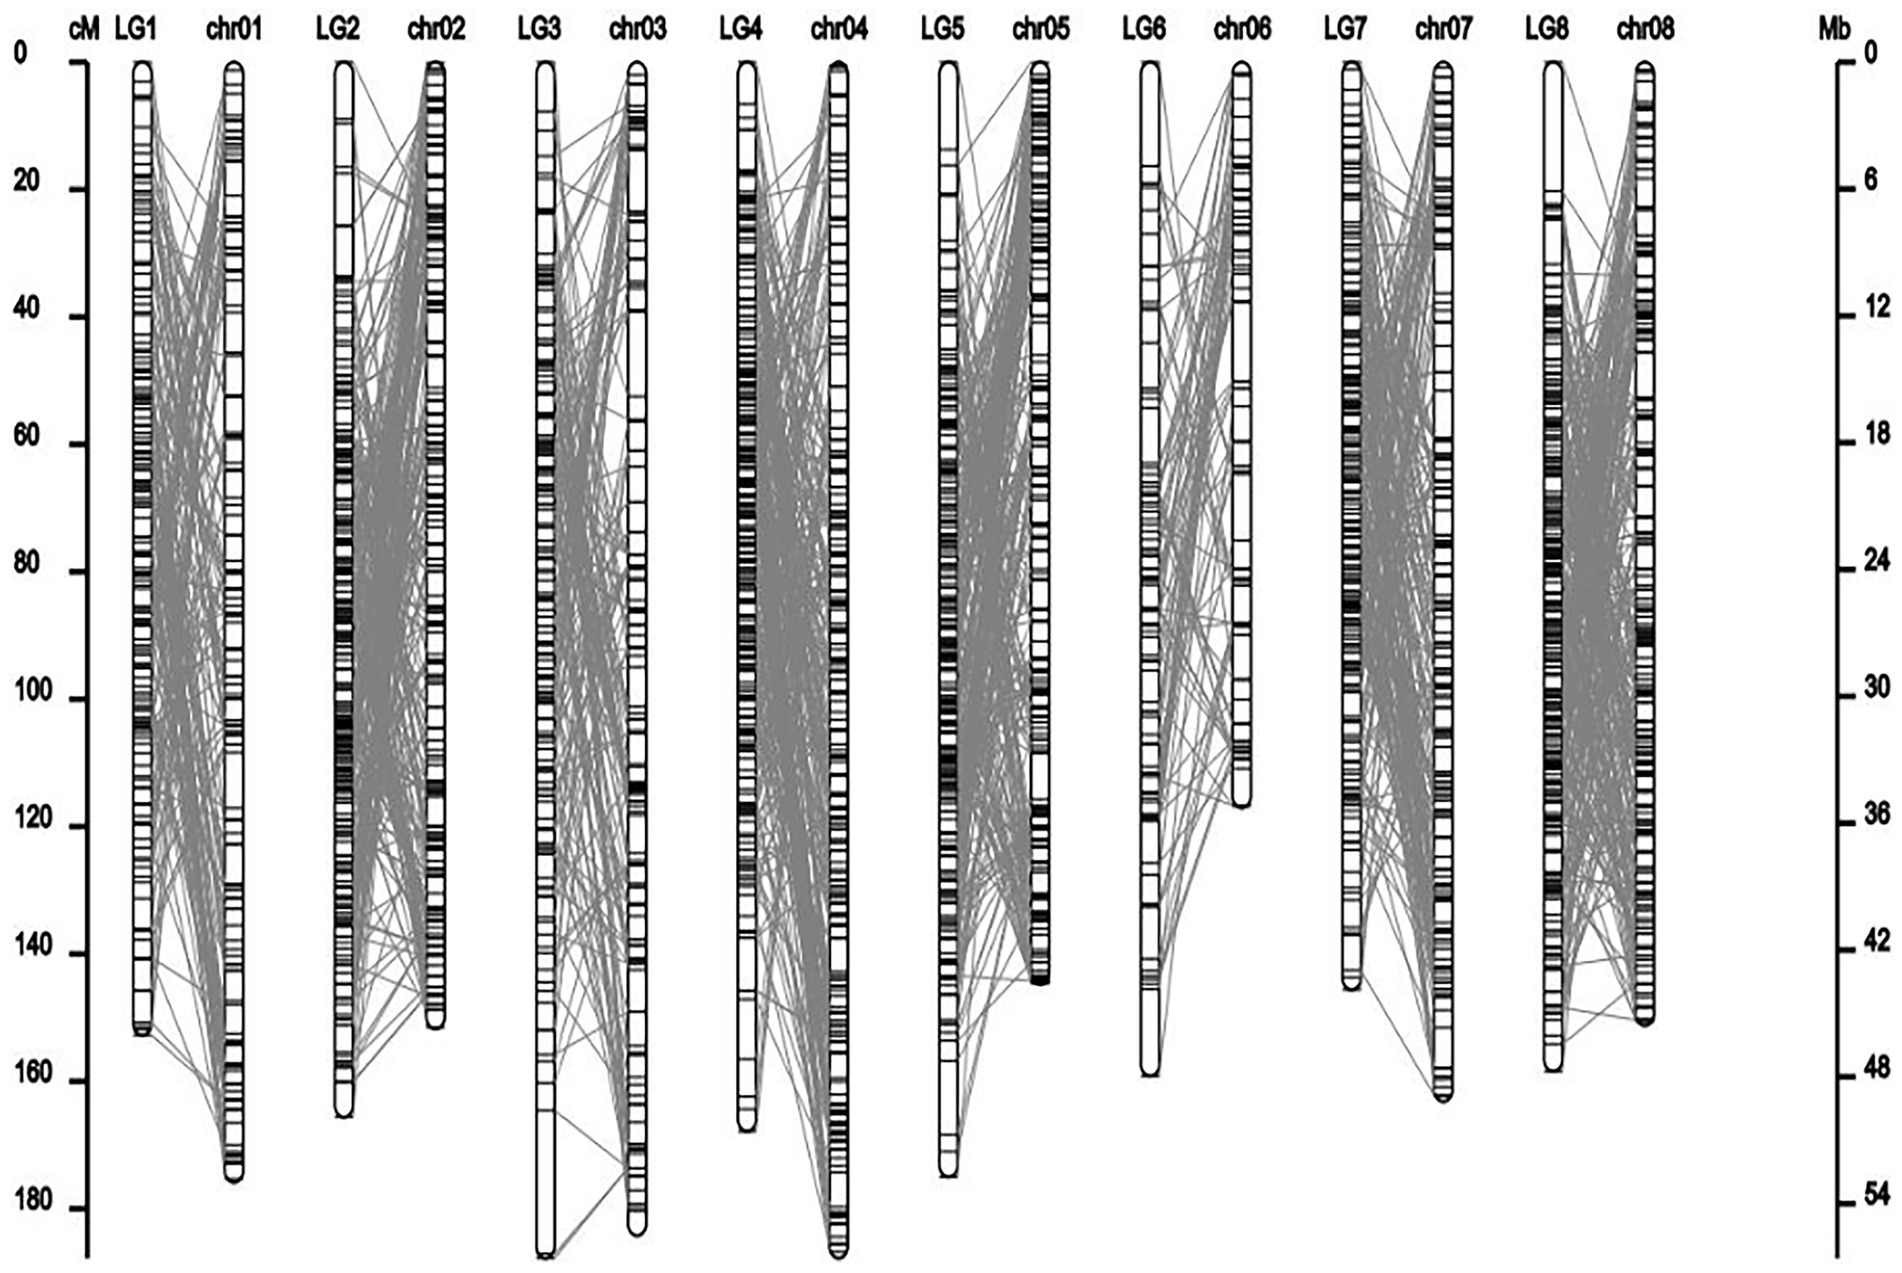
Figure 3. Collinearity analysis of genetic linkage map and physical map.
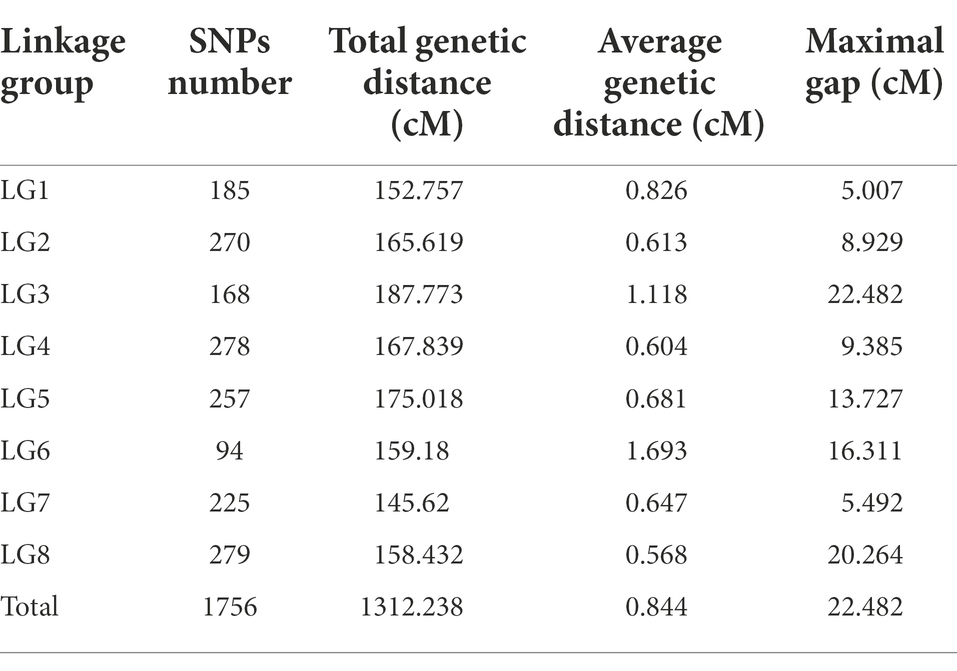
Table 6. Summary of genetic linkage map and distances.
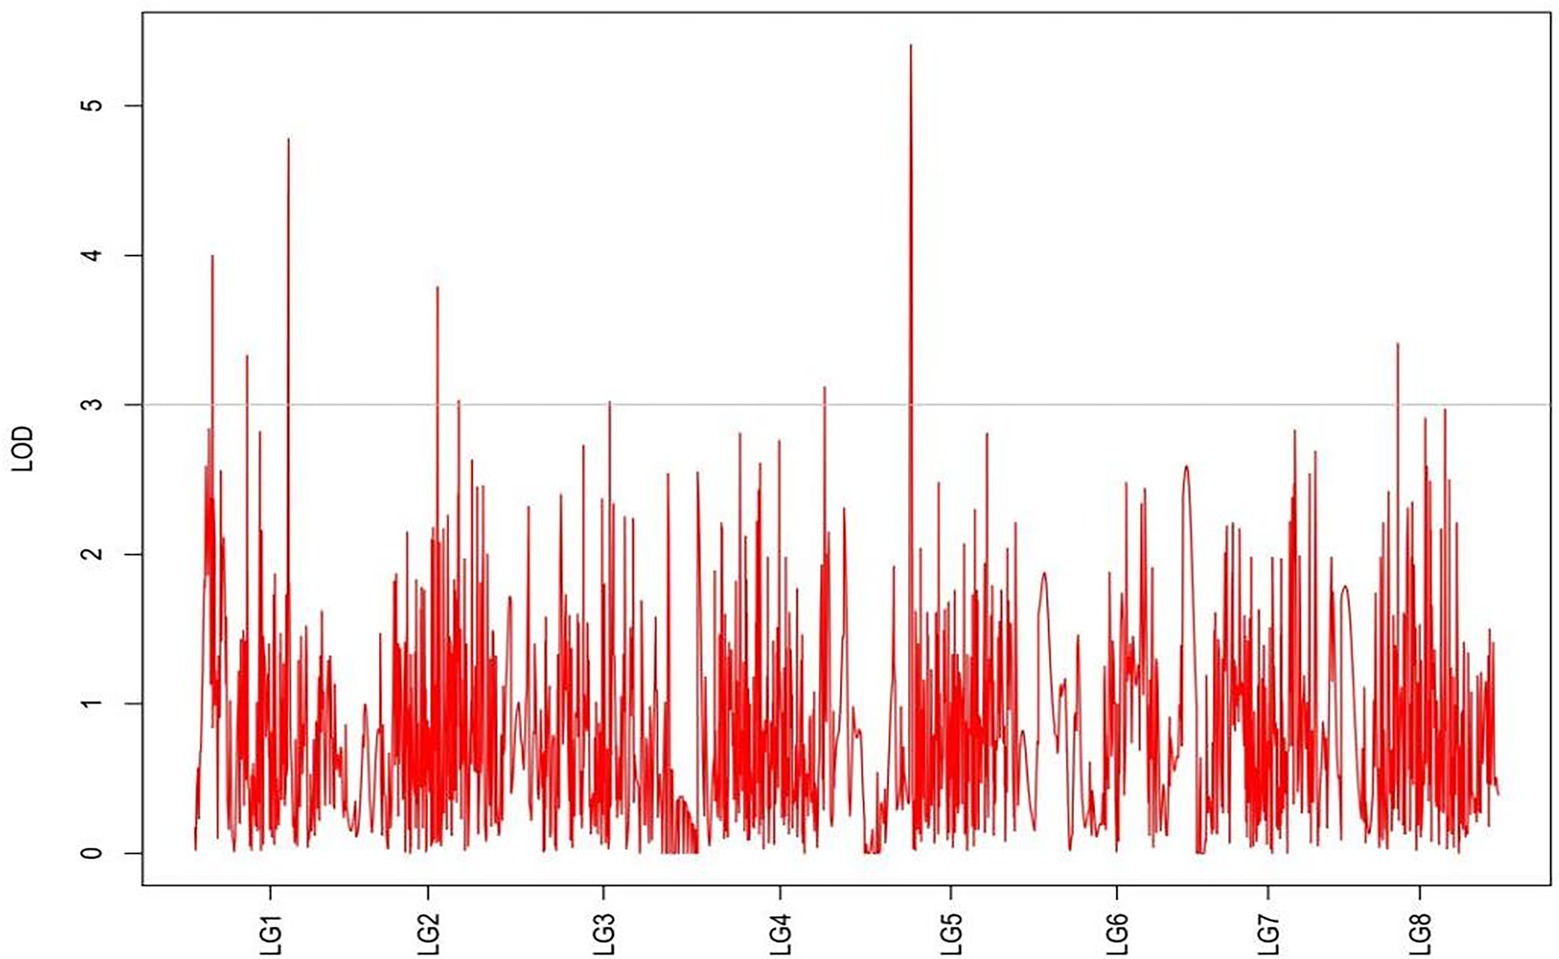
Figure 4. MapQTL localization of the rhizome length trait.
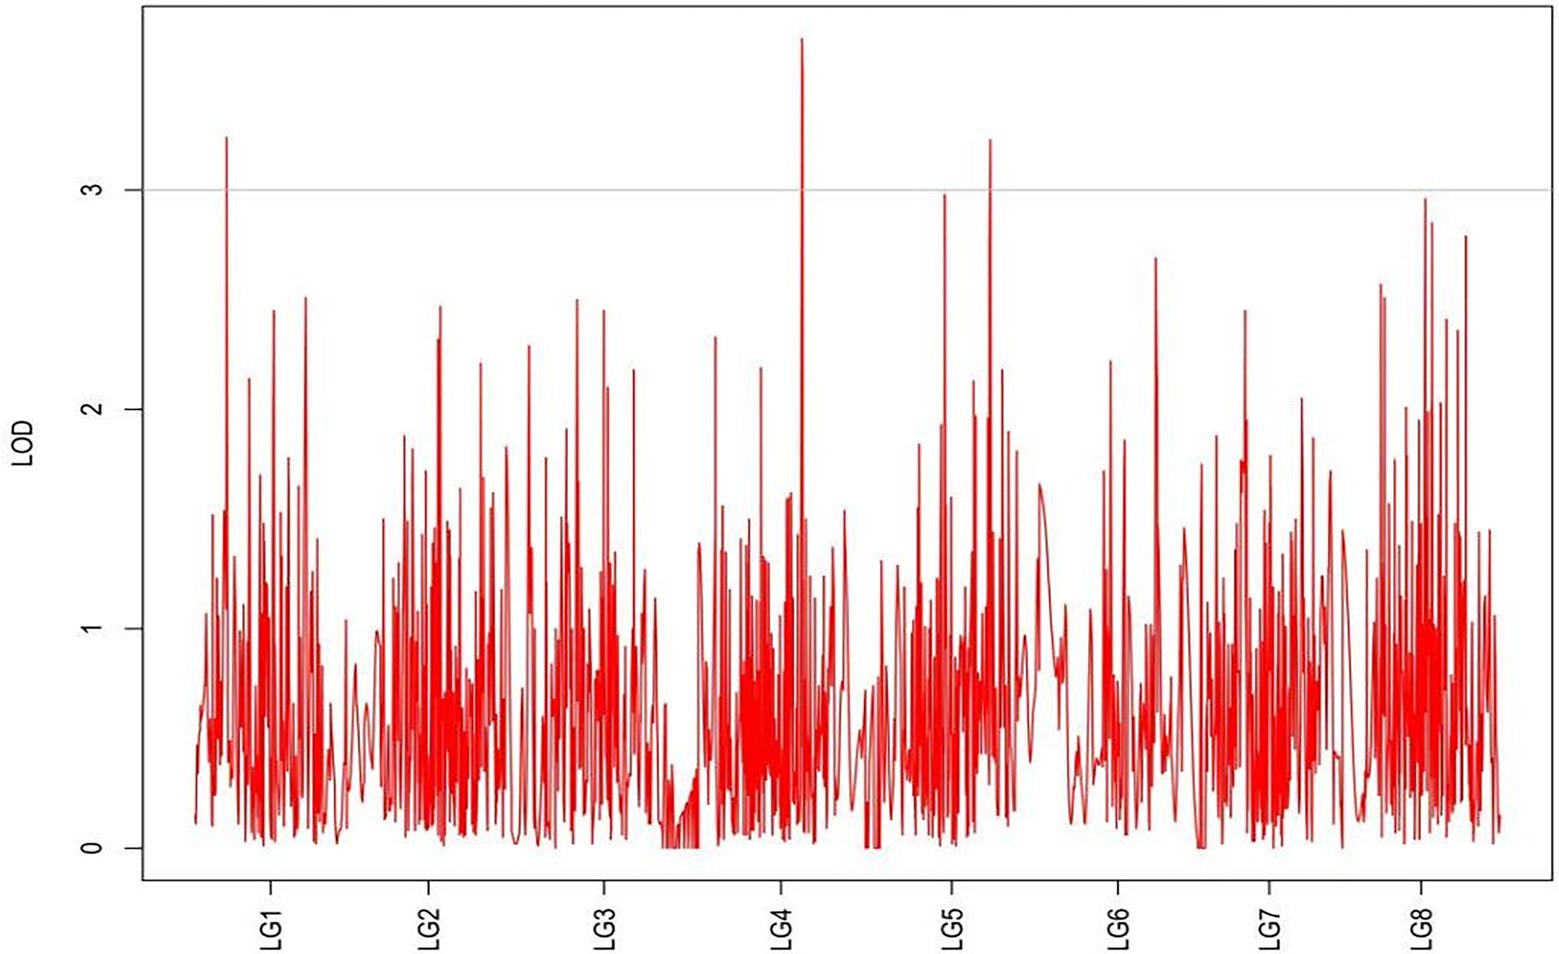
Figure 5. MapQTL localization of the rhizome width trait.
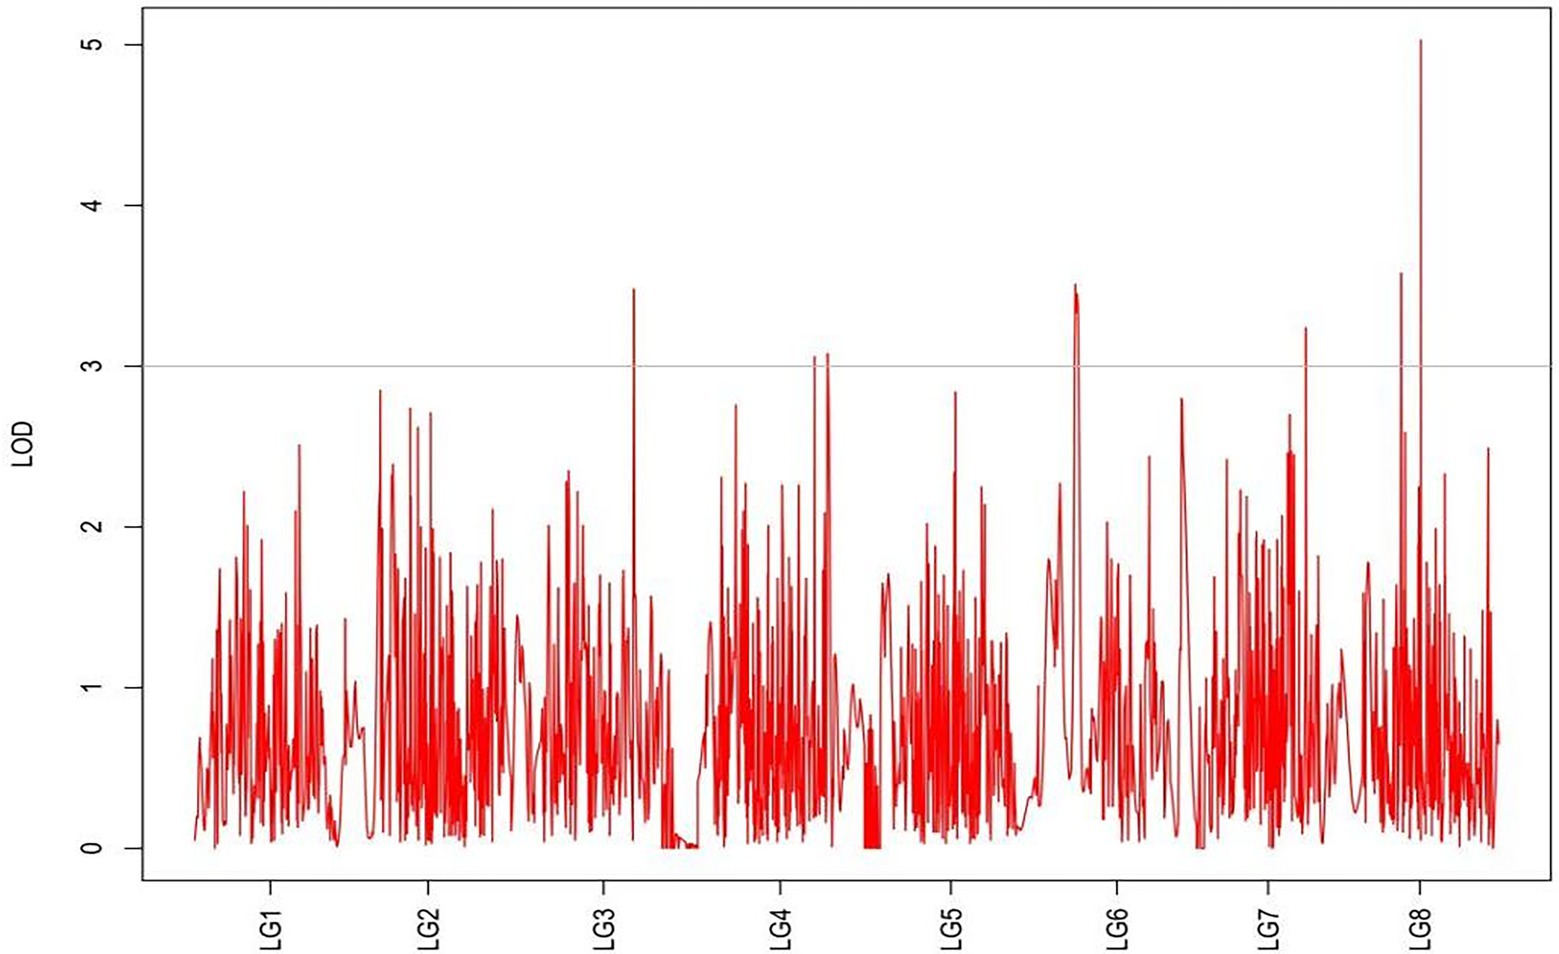
Figure 6. MapQTL localization of the shoot canopy diameter trait.
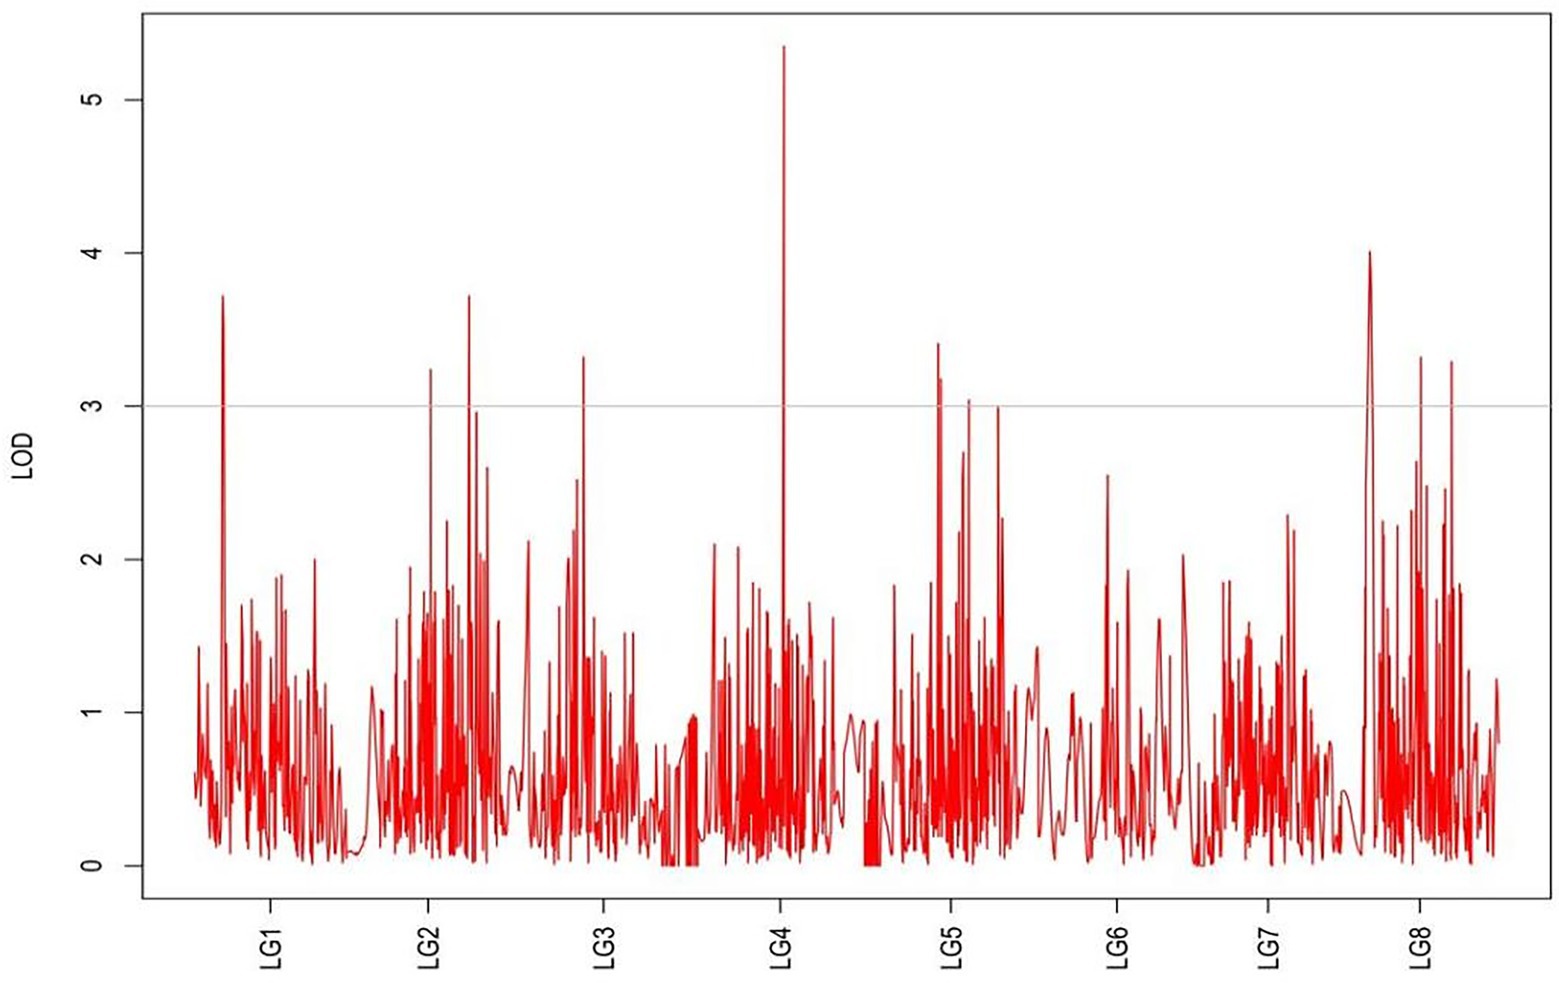
Figure 7. MapQTL localization of the basal plant diameter trait.
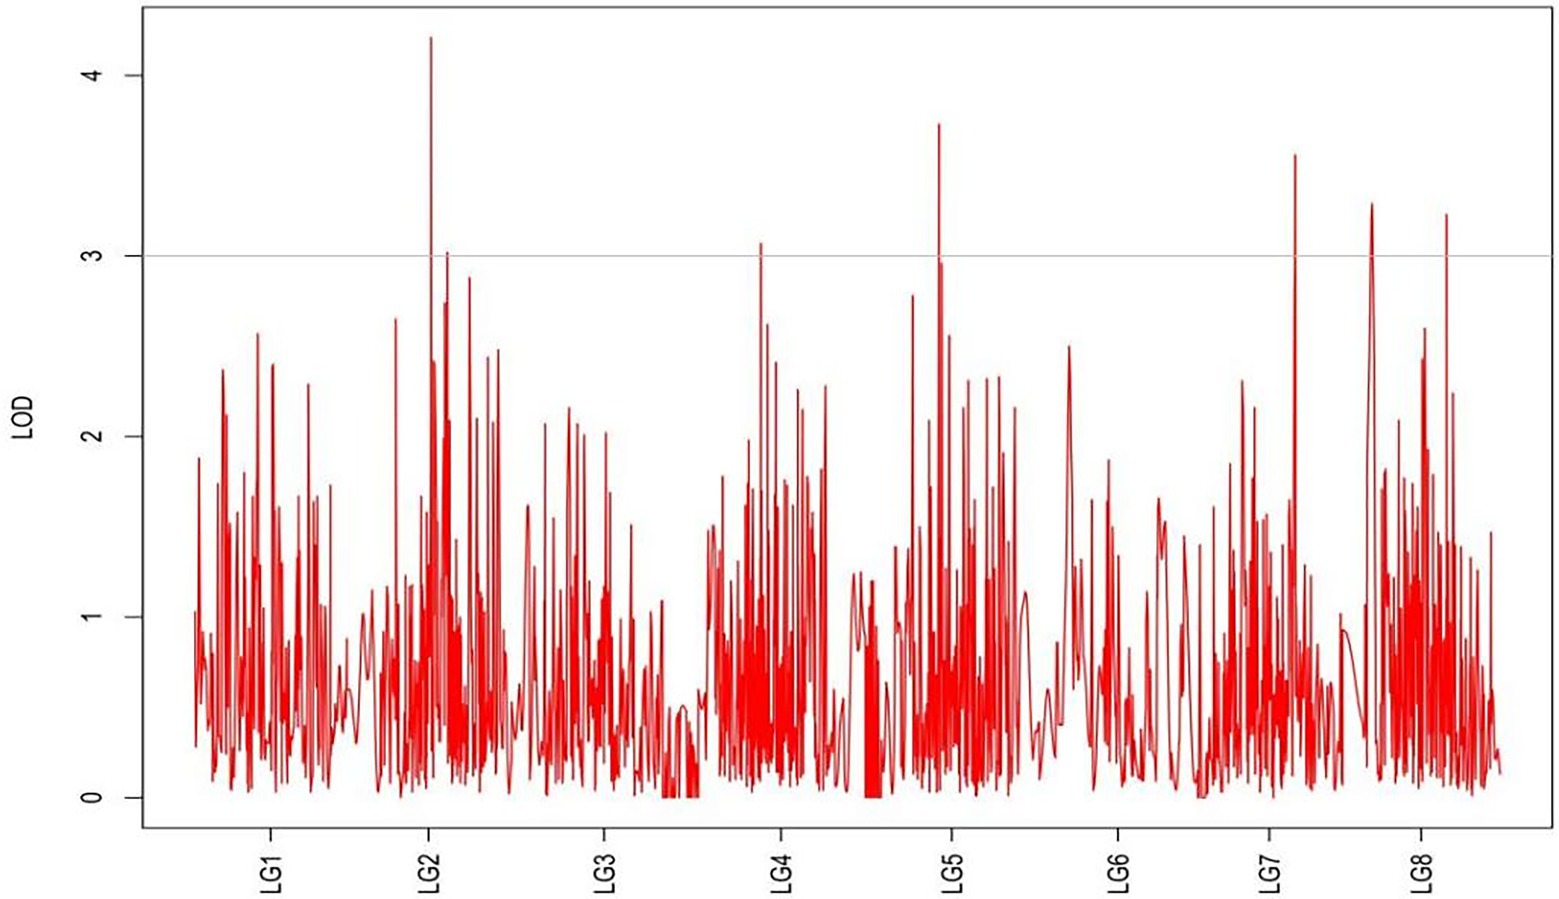
Figure 8. MapQTL localization of the stem number trait.
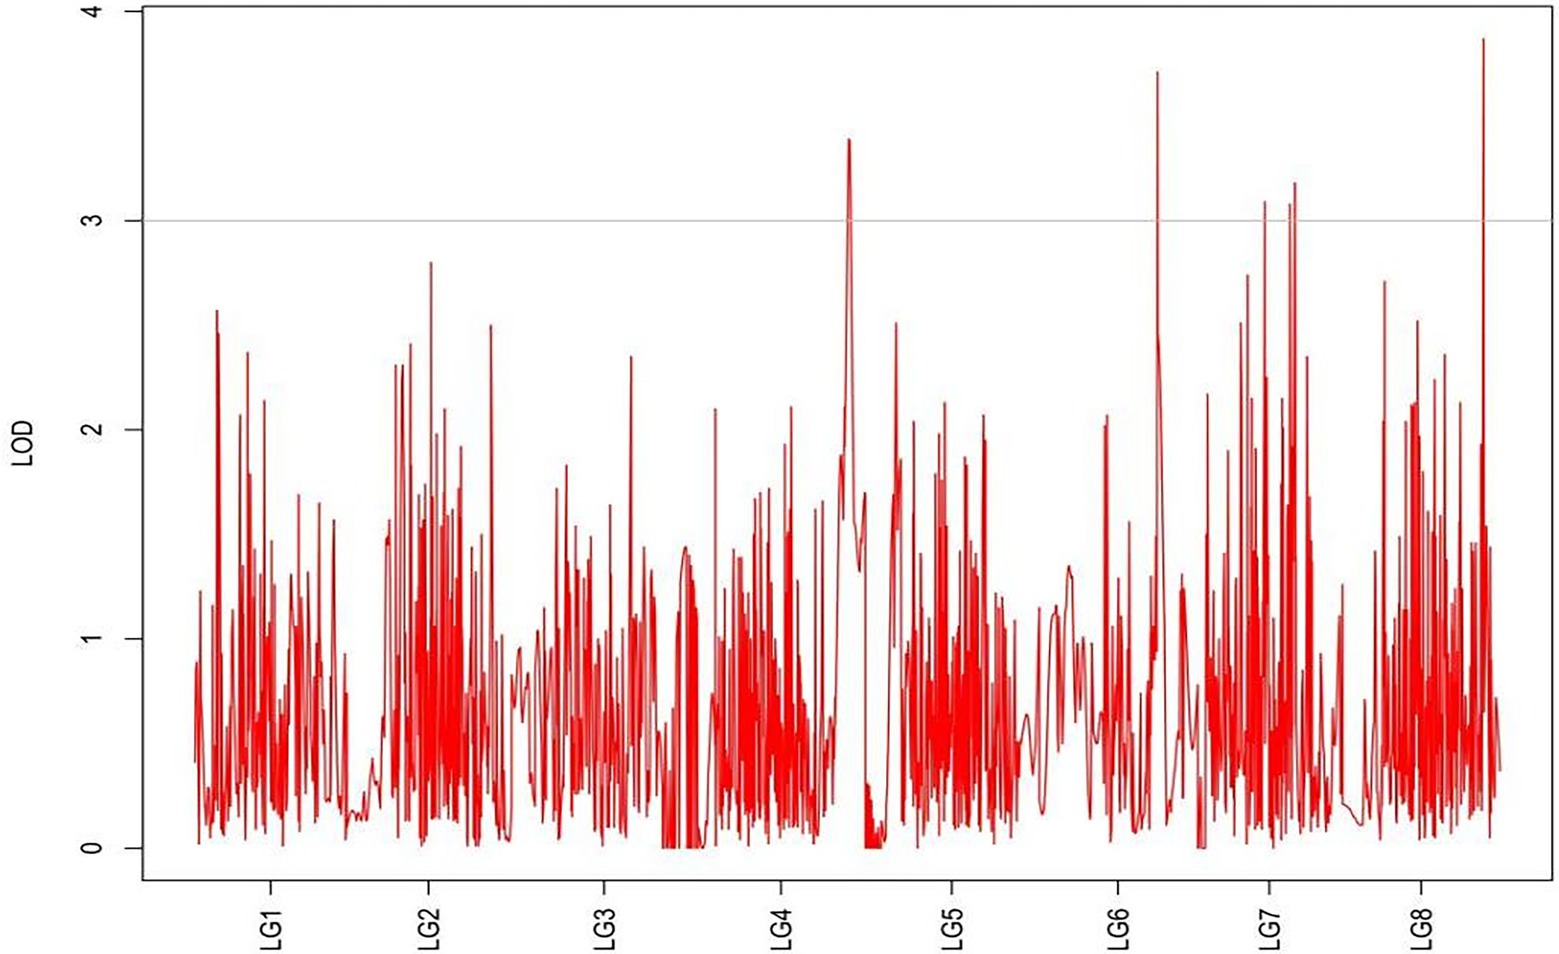
Figure 9. MapQTL localization of the absolute shoot height trait.
For each trait, the corresponding QTL map was shown in Figures 4–10.
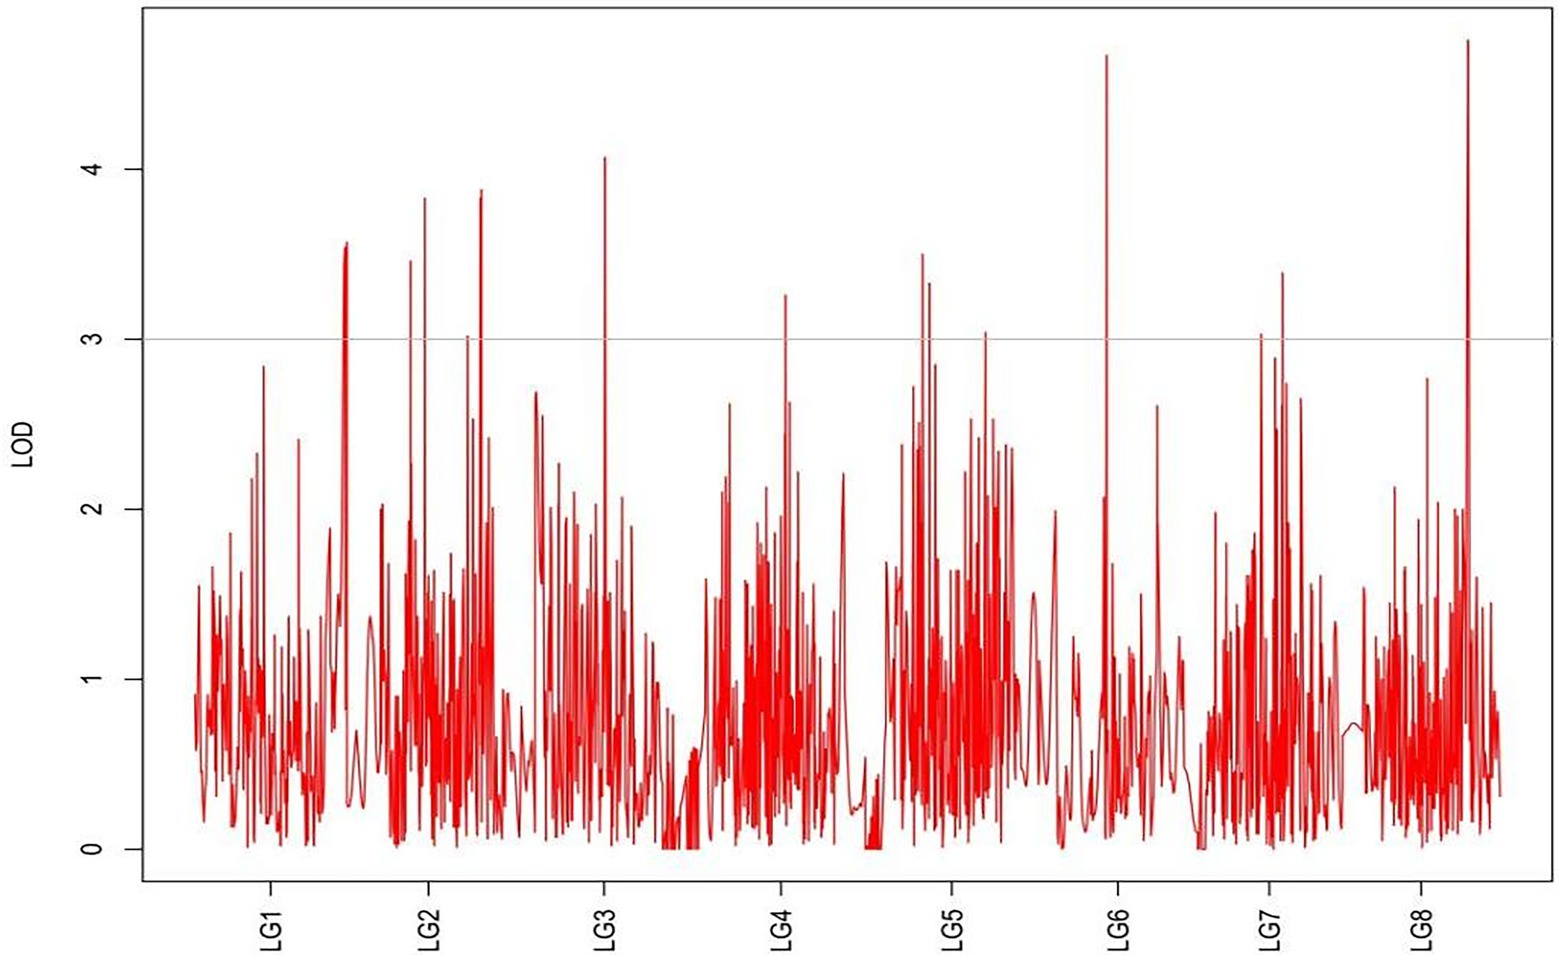
Figure 10. MapQTL localization of the natural shoot height trait.
Screening and identification of candidate genes for grazing tolerance
According to all the QTL ranges of grazing tolerance, we searched for genes in NCBI alfalfa genome database (CM001217.2), LG1 contained a total of 34 genes, LG2 obtained 35 genes, LG3 obtained 16 genes, LG4 found 30 genes, LG5 obtained 35 genes. Ten genes were obtained by LG6, 26 genes were obtained by LG7, and 29 genes were obtained by LG8. All the intervals contained 215 genes. Further analysis of gene annotation information was conducted to screen out 8 candidate genes that might be related to grazing tolerance, including genes related to MYB gene family, GRAS gene family, CAM gene family, etc. (Table 7).
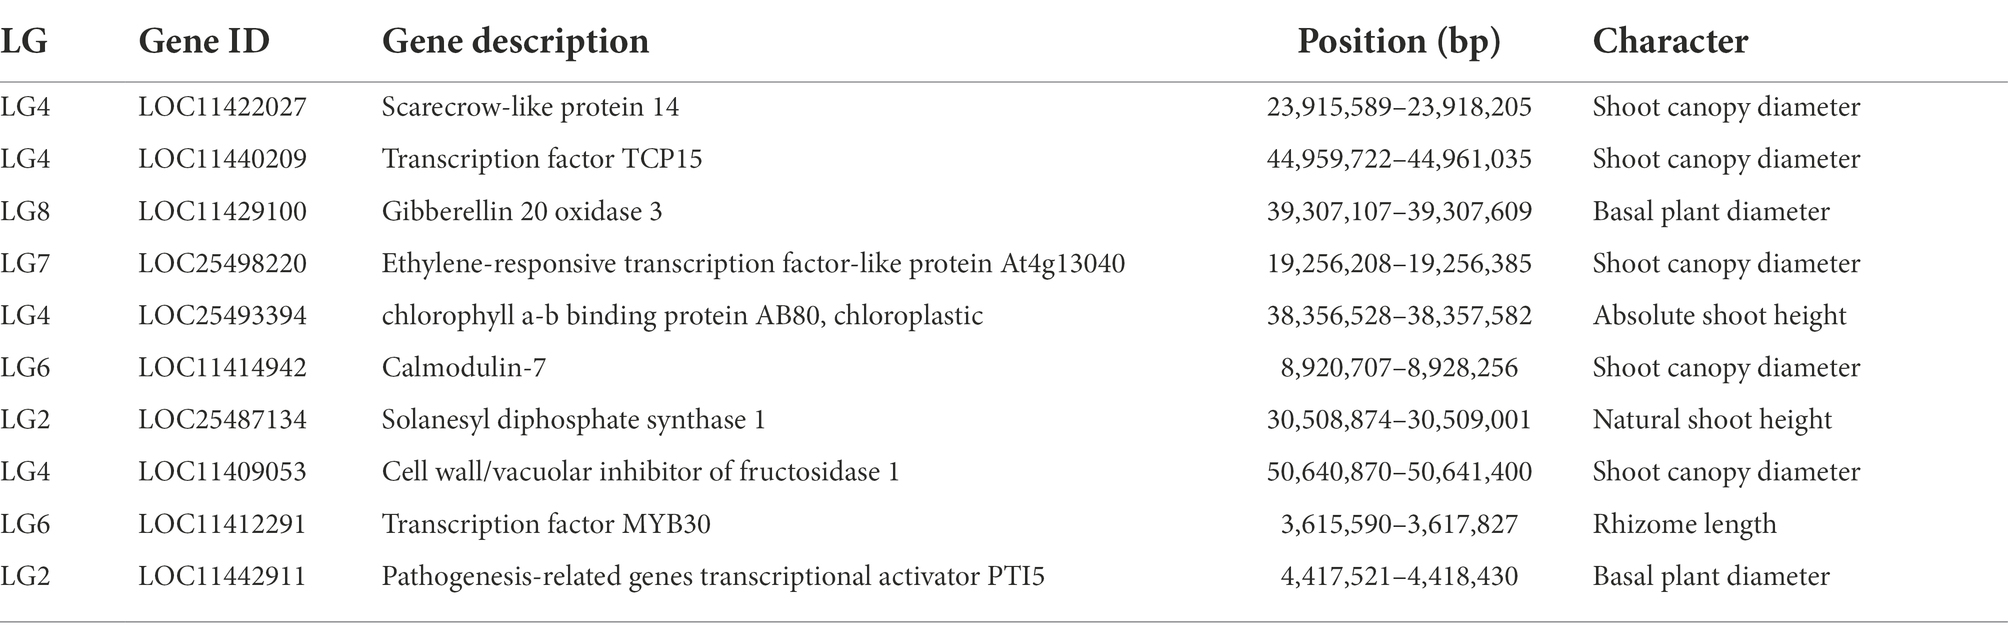
Table 7. Screening results of candidate genes related to grazing tolerance.
The 10 candidate genes of M. falcata were verified by qRT-PCR. The results showed that the relative expression of LOC11422027 and LOC11429100 genes decreased continuously under different days of simulated cutting stress. The relative expression of LOC11442911 genes showed a trend of first increasing and then decreasing, and the relative expression of LOC25498220, LOC25493394, LOC11414942, LOC25487134, and LOC11409053 genes showed a trend of first decreasing and then increasing. The relative changes of LOC11412291 and LOC11440209 showed a trend of continuous up-regulation (Figure 10).
Discussion
RAD-seq analysis
Genetic map or genetic linkage map refers to the relative location and genetic distance of a gene or molecular marker on a chromosome, which is different from the real distance in a physical map (Meng et al., 2015; Yagi et al., 2017; Lv et al., 2021). Genetic distance in a genetic map is calculated from the recombination rate of genes or markers. For instance, 1% of recombination rate corresponds to approximately 1 cM (centimorgan). The farther two loci are located, the higher probability a recombination will occur or the higher the recombination rate. A recombination of 50% means the two loci are located in two different linkage groups. That is to say, the maximal value of a recombination rate is 50%. Normally, one chromosome is one linkage group. However, if a chromosome is very long, it is possible to consider different arms of a chromosome as different linkage groups. The genetic distance does not always correspond to a fixed physical distance. For example, in species with a high LD value, 1 cM corresponds to a slightly larger chromosomal fragment. Even in the same species, different chromosomal regions may be different. For instance, in the centromere region, 1 cM corresponds to a slightly larger chromosomal fragment (Chen, 2018). A high standard linkage map requires an average genetic distance of 20 cM for genetic markers on a chromosome. The distance between genetic markers for a QTL locus should be 10–20 cM or less (Zhang, 2020). The currently constructed genetic linkage maps for diploid and tetraploid alfalfa and the QTL marker analyses of important traits symbolize the successful application of genetic improvement and molecular breeding technologies in alfalfa (Musial et al., 2006, 2007a,b; Robins and Brummer, 2010; Han et al., 2011; Qiang et al., 2015).
In recent years, with the rapid development of molecular biology, different new molecular marker technologies have been developed. SNP markers are the third-generation molecular markers. Due to its high density, high representativeness, high genetic stability, and easy detection, SNPs markers are widely used in genetic map construction in various species (Han et al., 2012; Pandey et al., 2017a,b). The restriction-site-associated DNA sequencing (RAD-seq) technology is a high throughput sequencing approach, which greatly reduces the complexity of complex genomes and rapidly identifies genome-wide high-density SNPs (Feng et al., 2020). For species lacking reference genomes, RAD-seq overcomes the limitation of a known genome sequence yet obtains large scale of SNPs markers. Reducing the genome complexity means reducing cost, thus RAD-seq is especially useful in population-level studies. In classical SNP analysis, when SNPs are identified, researchers need to design specific primers to genotype individual samples. However, for RAD-seq, this genotypic information is acquired simultaneously with the identification of SNPs. For species with reference genome sequences, the analysis of RAD-seq is simple and novel SNPs can be identified. Therefore, RAD-seq is a new approach to develop thousands of SNPs markers with low cost. It has been applied in multiple model and non-model plant species. Recently, researchers in the United States performed RNA-seq in 27 tetraploid and diploid alfalfa genotypes. They identified 14,000 specific genes and 9 million SNPs and the construction of genetic linkage map and related QTL analysis are still in progress (Li et al., 2012, 2014; Fukuda et al., 2019; Wang L. et al., 2020). Using RAD-seq technology to detect SNP markers can obtain more polymorphic sites than Super GBS sequencing technology, and construct a higher density linkage map. Cui (2020) by using Super GBS sequencing technology, only obtained 460 SNP labeled in the Figure 11. Liu et al. (2017) obtained 4,346 SNP markers by RAD-sequence analysis. Wu et al. (2014) used RAD-seq technology to develop 3,804 pairs of new DNA markers, including SNPS and Indels, and combined with 1,230 SSR markers to construct a high-density genetic linkage map. Zhang et al. (2019) used the SNPs obtained by RAD-seq technology to construct a high-density genetic linkage map, including 4,346 SNP markers and 119 simple sequence repeat (SSR) markers. In this study, 79 individuals from the F1 population were used as the mapping population, and the RAD-seq technology was used for database construction and sequencing. To construct a high-density genetic map of alfalfa RAD-seq. Finally, a high-density genetic linkage map containing 8 linkage groups and 1,756 markers was obtained, with a total map distance of 1312.238 cM and an average density of 0.844 cM. The marker density of RAD-Seq map constructed by RAD-seq technology has been greatly improved, the resolution of QTL mapping has been improved, the length of QTL interval has been shortened, and the value of determining causal loci to improve the traits of interest has been improved. Therefore, RAD-seq technology was applied in this study to develop molecular markers for alfalfa mapping population.
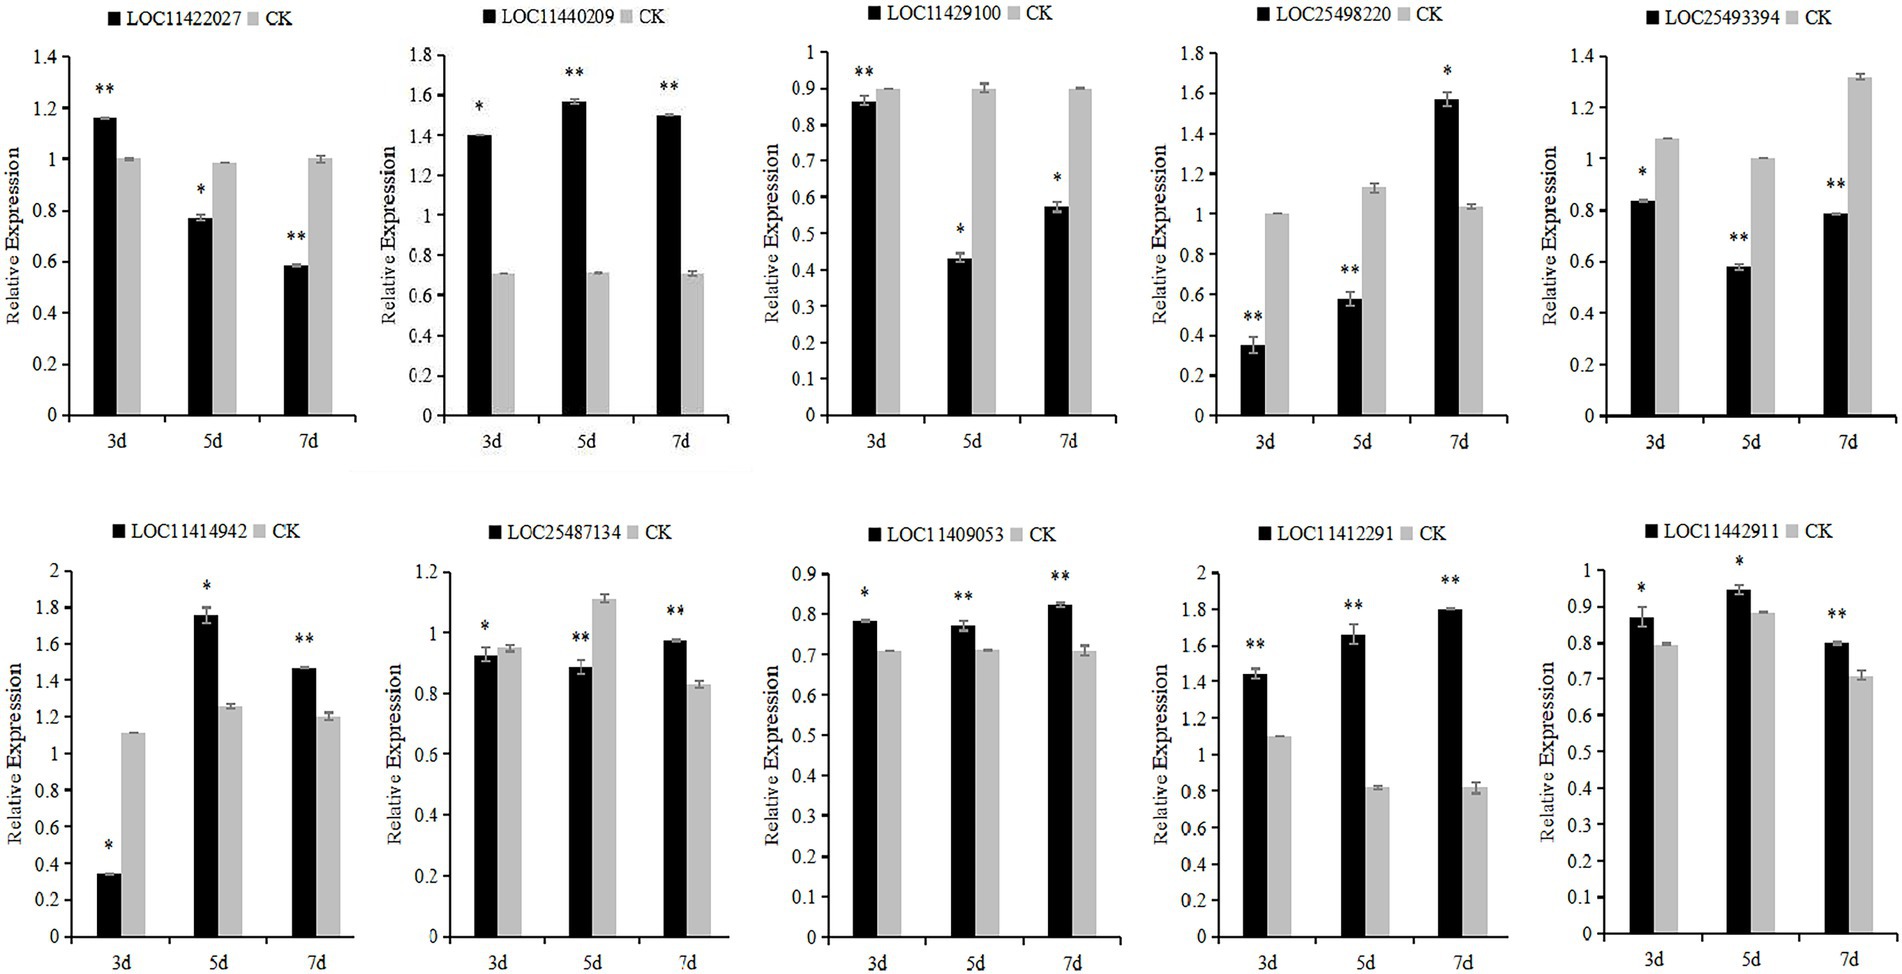
Figure 11. Relative expression levels of Medicago falcata after simulated cutting for 3, 5, and 7 days. Asterisks indicate significant differences as determined by ANOVA (*p < 0.05, **p < 0.01).
In this study, the genetic linkage map and the physical map were drawn simultaneously using the progeny separation information and sequencing information. The average coverage distance of the genetic map was 164.03 cM, while the average coverage distance of the physical map was 46.43 Mb. It can be seen from the results that there are some differences between different mapping methods, and the positions of some markers on the genetic map and the physical map are inconsistent. Many plants, such as wheat and alfalfa, also have the phenomenon that the genetic and physical distances between markers on linkage groups are not consistent, mainly because the physical and genetic distances between markers in the repressed and active regions of chromosome recombination are not consistent (Zhao et al., 2017; Jiang et al., 2022). After the map construction, using bioinformatics analysis software for the above markers genome distribution of statistical genetic map and genome position corresponding to the relationship between genetic and physical location linear system such as high quality, and the accuracy of assessment to ensure map all indicators show that the research of M. falcata genetic linkage map construction with high quality and accuracy. These maps will be helpful for QTL mapping and marker-assisted selection (MAS) of alfalfa in the future.
Grazing tolerance-associated QTL traits
QTLs are widely used in model plants and field crops, especially the important agronomic traits. QTL localization is to link specific traits with molecular makers on a genetic linkage map (Robins et al., 2007; Liu et al., 2014; Liu, 2016; Zhang, 2016). Using QTL mapping, some critical traits, such as yield (Wang L. et al., 2020) and cold tolerance (Chutimanitsakun et al., 2011; Shimoyama et al., 2020), have been linked to corresponding QTLs. Due to the practical values of QTL mapping in alfalfa, (Liu et al., 2017) located 19 QTL loci that are associated with agronomic traits in alfalfa. Zhang et al. (2020) detected 28 QTLs related to the important trait, flowering time. He (2016) constructed a genetic map and detected two QTLs associated with flowering time and leaf type in alfalfa. Tu (2011) identified 11 QTLs in M. truncatula. However, QTL analysis of agronomic traits in M. falcata is still in its preliminary stage. The success of QTL mapping in alfalfa and M. truncatula set a solid foundation for M. falcata studies.
In this study, we constructed a high-density genetic map in M. falcata and performed a QTL analysis for important grazing tolerance traits using interval mapping. Overall, we detected 63 QTLs for 6 grazing tolerance traits. These QTLs are distributed on eight LGs. Identification and location of the QTLs will aid in gene discovery, molecular marker-assisted selection, cloning, and regulation studies of quantitative trait-associated genes in M. falcata. These studies will eventually help improving and breeding the grazing tolerance varieties in M. falcata.
Analysis of candidate genes for grazing tolerance traits
Previous QTL mapping studies on alfalfa mainly focused on flowering traits (Zhang et al., 2019, 2020). Although QTL mapping and RNA-seq integration have been applied to identify candidate genes in rice (Oryza sativa L.), maize (Zea mays L.), soybean (Glycine max), and other crops (Kuang et al., 2020; Lei et al., 2020; Han et al., 2022), but these methods have not been used to discover grazing tolerance trait genes in M. falcata.
In this study, 10 candidate genes that may be related to grazing tolerance were screened based on QTL mapping results, comparison of reference genomes, and functional annotation information. Among these candidate genes, LOC11422027 was located in Chr04.23915589–23918205. It is annotated as Scarecrow-like protein 14, which has been reported to be a multifunctional regulator involved in plant growth, photosynthesis, tolerance to photooxidative stress, and aging (Chen et al., 2014). The candidate gene LOC11429100 was located in LOC11429100 and was annotated as Gibberellin 20 oxidase 3, which is a key enzyme in GA biosynthesis (Yan et al., 2014). The candidate gene LOC25498220 was located in Chr07.19256208–19256385 and annotated as At4g13040 in Ethylene responsive transcription factor-like protein. At4g13040(referred herein as Apetala 2 family protein involved in SA-mediated disease defense 1—APD1) is an important regulator for SA-mediated plant defense (Mrunmay et al., 2014). In Chr04.38356528–38357582, LOC25493394 has an opposite pattern: A-B binding protein AB80, chloroplastic, (Gerardo et al., 1992) showed that chlorophyll A/B binding protein AB80 can promote chloroplast synthesis of coenzymes and improve the utilization of light energy in pea. The candidate gene LOC11414942 located in Chr06.8920707–8928256 was annotated as calmodulin-7, Recent studies further indicate that CAM7 is also an integral part of multiple signaling pathways including hormone, immunity, and stress (Zeb et al., 2019). Solanesyl diphosphate synthase 1 (SPS1) is the key enzyme in solanesol, a LOC25487134 gene located in Chr02.30508874–30509001 biosynthesis. Their studies in tobacco show that SPS1 significantly increased leaf growth, in tobacco, and in leaves content (Yan et al., 2020). LOC11409053 gene located in Chr04.50640870–50641400, Studies have shown that the Cell wall/vacuolar inhibitor of fructosidase 1 regulates ABA response and salt how in Arabidopsis (Yang et al., 2020). The candidate gene LOC11440209 located in Chr04.44959722–44961035 was annotated as the transcription factor TCP15, TCP15 are required for an efficient elongation response to auxin, most likely by regulating a subset of auxin-inducible genes related to cell expansion (Luciav et al., 2020). The candidate gene LOC11412291 was located in Chr06.3615590–3617827, which was annotated as the transcription factor MYB30. Some studies have reported that MYB30 is necessary for root growth regulation during defense responses and can regulate the synthesis of Arabidopsis wax powder. Epidermal wax powder plays an important role in plant resistance to diseases and insect pests and reduction of ultraviolet radiation (Raffaele et al., 2006; Kaho et al., 2018). Some studies have shown that the deeper the root is buried in the soil, the higher the grazing tolerance of alfalfa (Wang et al., 2013). The candidate gene LOC11442911 was located in Chr02.4417521-4418430 and was annotated as pathogen-related genes transcriptional activator PTI5. The ERF family transcription factor Pti5 belongs to a member of the ERF subfamily in the AP2/ERF family. Wang Y. et al. (2020) showed that Pti5 transcription factor plays a regulatory role in disease resistance and fruit ripening in tomato. qRT-PCR was used to analyze the relative expression levels of these 10 candidate genes through simulated grazing tolerance cutting test. We found that the relative expression levels of LOC11412291 and LOC11440209 were significantly up-regulated with the increase of cutting days. Therefore, we predicted that M. falcata faced with abiotic stress (cutting or grazing). LOC11412291 and LOC11440209 genes may have certain regulatory functions, which can be used as key candidate genes related to grazing tolerance.
Conclusion
In this study, using RAD-seq technology, we sequenced 79 F1 individuals from a cross between a high (MF200401) and a low (MF200402) grazing tolerance M. falcata parent. After cleaning up reads and mapping to reference genome, we obtained 1756 high-quality SNPs and constructed a high-density genetic linkage map. These SNPs were located in 8 LGs with a consensus total length of 1312.238 cM and average distance of 0.844 cM between markers. Based on 6 phenotypic traits and linkage analysis, 63 QTLs associated with grazing tolerance traits were detected. Among them, 17 QTLs were associated with natural shoot height; 12 QTLs were related to rhizome length; 10 QTLs corresponded to shoot canopy diameter; 9 QTLs for basal plant diameter; 6 QTLs for stem number; 5 QTLs for absolute shoot height and 4 QTLs for rhizome width. Ten candidate genes that might be related to grazing tolerance were screened by QTL mapping and annotation information, and two key candidate genes (LOC11412291 and LOC11440209) were screened by qRT-PCR through simulated cutting test, and their functions could be further verified in M. falcata. The results presented in this study provide valuable information for breeding grazing tolerant alfalfa and M. falcata.
Data availability statement
The data presented in the study are deposited in the NCBI repository, accession numbers: PRJNA795270 and PRJNA795570.
Author contributions
XZho, XL, and DY assembled sequences and analyzed the data. XZho and XL wrote the manuscript. XZho collected the plant material. YZ and JW conceived the research and revised the manuscript. All authors contributed to the article and approved the submitted version.
Funding
This work was supported by grants from the National Natural Science Foundation of China (no. 31560662 and 32160326) and Inner Mongolia Autonomous Region Science and Technology Project (no. 2020GG0176).
Conflict of interest
The authors declare that the research was conducted in the absence of any commercial or financial relationships that could be construed as a potential conflict of interest.
Publisher’s note
All claims expressed in this article are solely those of the authors and do not necessarily represent those of their affiliated organizations, or those of the publisher, the editors and the reviewers. Any product that may be evaluated in this article, or claim that may be made by its manufacturer, is not guaranteed or endorsed by the publisher.
Footnotes
References
Chen, Y. M. (2018). Construction of SNP linkage map and QTL mapping for flower color traits of Photophthora blight resistance in anther palm. Hainan University, China.
Chen, K., Li, H., Chen, Y., Zheng, Q., Li, B., and Li, Z. (2014). TaSCL14, a novel wheat (Triticum aestivum L.) GRAS gene, regulates plant growth,photosynthesis, tolerance to photooxidative stress, and senescence. J. Genet. Genomics 42, 21–32. doi: 10.1016/j.jgg.2014.11.002
Chutimanitsakun, Y., Nipper, R. W., CuestaMarcos, A., Cistué, L., Corey, A., and Filichkina, T. (2011). Construction and application for QTL analysis of a restriction site associated DNA (RAD) linkage map in barley. BMC Genomics 12:4. doi: 10.1186/1471-2164-12-4
Cui, L. L. (2020). Hybrid analysis of alfalfa and Medicago falcata L. and construction of SNP marker genetic map. Chinese Academy of Agricultural Sciences, China.
Feng, J., Zhao, S., Li, M., Zhang, C., Qu, H., Li, Q., et al. (2020). Genome-wide genetic diversity detection and population structure analysis in sweetpotato(Ipomoeabatatas)using RAD-seq. Genomics 112, 1978–1987. doi: 10.1016/j.ygeno.2019.11.010
Fukuda, S., Nagano, Y., Matsuguma, K., Lshimoto, K., Hiehata, N., and Yamamoto, T. (2019). Construction of a high-density linkage map for bronze loquat using RAD-Seq. Sci. Hortic. 251, 59–64. doi: 10.1016/j.scienta.2019.02.065
Gerardo, A., Enrique, G., Mireya, S., Patricio, G., Luis, H., and June, S. (1992). Characterization of DNA sequences that mediate nuclear protein binding to the regulatory region of the Pisum safiwum (pea) chlorophyl a/b binding protein gene AB80: identification of a repeated heptamer motif. Plant J. 2, 301–309.
Han, Y. H., Dong-Man, K., and Monteros, M. J. (2012). High-resolution melting analysis for SNP genotyping and mapping in tetraploid alfalfa. Mol. Breed. 29, 489–501. doi: 10.1007/s11032-011-9566-x
Han, Y., Yun, K., Ivone, T.-J., Foo, C., Christopher, D., and Patrickx, Z. (2011). Genome-wide SNP discovery in tetraploid alfalfa using 454 sequencing and high resolution melting analysis. BMC Genomics 12, 350–360. doi: 10.1186/1471-2164-12-350
Han, Q., Zhu, Q., Shen, Y., Lee, M., Lübberstedt, T., and Zhao, G. (2022). QTL mapping low-temperature germination ability in the maize IBM Syn10 DH population. Plants 11:214. doi: 10.3390/plants11020214
He, F. (2016). Construction of genetic map and QTL mapping for flowering and leaf type traits in Medicago sativa L. Shihezi University, China.
Jiang, X. Q., Yang, T. H., Zhang, F., Yang, X. J., Yang, C. F., and He, F. (2022). RAD-Seq-based high-density linkage maps construction and quantitative trait loci mapping of flowering time trait in alfalfa (Medicago sativa L.). Front. Plant Sci. 13:899681. doi: 10.3389/fpls.2022.899681
José, D. R., Da Silva, N., Liu, S., Fábio, P., Caio Augusto, P., Priscilla Marqui, S. V., et al. (2017). Large-scale SNP discovery and construction of a high density genetic map of Colossoma macropomum through genotyping-by-sequencing. Sci. Rep. 7:46112. doi: 10.1038/srep46112
Kaho, M., Hiromasa, M., Tomotaka, I., Takamasa, S., Mika, N., and Satomi, S. (2018). MYB30 links ROS signaling, root cell elongation, and plant immune responses. PNAS 115, E4710–E4719. doi: 10.1073/pnas.1804233115
Kang, J. M., Zhang, T. J., Wang, M. Y., Zhang, Y., and Yang, Q. C. (2014). Research progress and application of QTL and whole genome selection in alfalfa. Acta Pratacul. Sin. 23, 304–312. doi: 10.11686/cyxb20140636
Kuang, C. H., Zhao, X. F., Yang, K., Zhang, Z. P., Ding, L., Pu, Z. E., et al. (2020). Mapping and characterization of major QTL for spike traits in common wheat. Physiol. Mol. Biol. Plants 26, 1295–1307. doi: 10.1007/s12298-020-00823-0
Kumar, P., Gupta, V. K., Misra, A. K., Modi, D. R., and Pandey, B. K. (2009). Potential of molecular markers in plant biotechnology. Plant Omics. 2, 141–162. doi: 10.1201/9780429505676-23
Lei, L., Zheng, H., Bi, Y., Yang, L., Liu, H., Wang, J., et al. (2020). Identification of a major qtl and candidate gene analysis of salt tolerance at the bud burst stage in rice (Oryza sativa L.) using QTL-Seq and RNA-Seq. Rice 13, 1–14. doi: 10.1186/s12284-020-00416-1
Li, X., Acharya, A., Farmer, A. D., Crow, J. A., Bharti, A. K., Kramer, R. S., et al. (2012). Prevalence of single nucleotide polymorphism among 27 diverse alfalfa genotypes as assessed by transcriptome sequencing. BMC Genomics 13:568. doi: 10.1186/1471-2164-13-568
Li, X., and Brummer, E. C. (2012). Applied genetic sand genomics in alfalfa breeding. Agronomy 2, 40–61. doi: 10.3390/agronomy2010040
Li, X., Han, Y., Wei, Y., Acharya, A., Farmer, A. D., Ho, J., et al. (2014). Development of an alfalfa SNP array and its use to evaluate patterns of population structure and linkage disequilibrium. PLoS One 9:e84329. doi: 10.1371/journal.pone.0084329
Liu, S. N. (2012). Construction of genetic map and gene mapping of important agronomic traits in alfalfa. Inner Mongolia University, China,.
Liu, S. R. (2016). Construction of a high-density genetic linkage map and QTL mapping for leaf litter traits in citrus. Huazhong Agricultural University, China.
Liu, F. Q. (2017). Construction of genetic map and QTL mapping of important agronomic traits in alfalfa. Harbin Normal University, China.
Liu, C. Q., Gao, P., and Luan, F. S. (2014). Construction of genetic map and QTL analysis of fruit related traits in watermelon. Sci. Agric. Sin. 47, 2814–2829. doi: 10.3864/j.issn.0578-1752.2014.14.012
Liu, N. X., Li, M., Hu, X. B., Ma, Q. B., Mu, Y. H., Tan, Z. Y., et al. (2017). Construction of high-density genetic map and QTL mapping of yield-related and two quality traits in soybean RILs population by RAD-sequencing. BMC Genomics 18:466. doi: 10.1186/s12864-017-3854-8
Luciano, P., Philippe, B., Sabrina, D., Paola, L., Paolo, A., and Bernadette, J. (2021). QTL analysis for grazing tolerance, autumn dormancy and growth habit offers prospects for marker-assistedselection in lucerne. Euphytica 217:1, –11. doi: 10.1007/s10681-021-02897-7
Luciav, F., Victoria, G., Federicod, A., Ivanal, V., and Danielh, G. (2020). Class I TCP proteins TCP14 and TCP15 are required for elongation and gene expression responses to auxin. Plant Mol. Biol. 105, 147–159. doi: 10.1007/s11103-020-01075-y
Lv, D. Y., Zhang, C. L., Yv, R., Yao, J. X., Wu, J. H., Song, X. P., et al. (2021). Utilization of a wheat 50K SNP microarray-derived high-density genetic map for QTL mapping of plant height and grain traits in wheat. Plan. Theory 10:1167. doi: 10.3390/PLANTS10061167
McCord, P., Gordon, V., Saha, G., Hellinga, J., Vandemark, G., and Larsen, R. (2014). Detection of QTL for forage yield, lodging resistance and springvigor traits in alfalfa (Medicago sativa L.). Euphytica 200, 269–279. doi: 10.1007/s10681-014-1160-y
Meng, L., Li, H. H., Zhang, L. Y., and Wang, J. K. (2015). QTL IciMapping: integrated software for genetic linkage map construction and quantitativetrait locus mapping in biparental populations. Crop J. 3, 269–283. doi: 10.1016/j.cj.2015.01.001
Mrunmay, K., Swadhin, S., Janesh, K., Subaran, S., Nidhi, S., Lipika, B., et al. (2014). The Arabidopsis thaliana At4g13040 gene, a unique member of the AP2/EREBP family, is a positive regulator for salicylic acid accumulation and basal defense against bacterial pathogens. J. Plant Physiol. 171, 860–867. doi: 10.1016/j.jplph.2013.12.015
Musial, J. M., Lowe, K. F., Mackie, J. M., Aitken, K. S., and Lrwin, J. A. G. (2006). DNA markers linked to yield,yield components,and morphological traits in autotetraploid lucerne (Medicago sativa L.). Aust. J. Agr. Res. 57, 801–810. doi: 10.1071/AR05390
Musial, J. M., Mackie, J. M., Armour, D. J., Phan, H. T. T., Ellwood, S. E., Aitken, K. S., et al. (2007a). Identification of QTL for reaction to three races of colletotric humtrifolii and further analysis of inheritance of resistance in auto tetraploid lucerne. Theor. Appl. Genet. 114, 1417–1426. doi: 10.1007/s00122-007-0527-z
Musial, J. M., Mackie, J. M., Armour, D. J., Phan, H. T. T., Ellwood, S. E., Aitken, K. S., et al. (2007b). Identification of QTL for resistance and susceptibility to Stagonospora meliloti in auto tetraploid lucerne. Theor. Appl. Genet. 114, 1427–1435. doi: 10.1007/s00122-007-0528-y
Pandey, M. K., Agarwal, G., Kale, S. M., Clevenger, J., Nayak, S. N., and Sriswathi, M. (2017a). Development and evaluation of a high density genotyping “Axiom_Arachis” array with 58K SNPs for accelerating genetics and breeding in groundnut. Sci. Rep. 7:40577. doi: 10.1038/srep40577
Pandey, M. K., Khan, A. W., Singh, V. K., Vishwakarma, M. K., Shasidhar, Y., Kumar, V., et al. (2017b). QTL-seq approach identified genomic regions and diagnostic markers for rust and late leaf spot resistance in groundnut (Arachis hypogaea L.). Plant Biotechnol. J. 15, 927–941. doi: 10.1111/pbi.12686
Pecetti, L., Roman, M., De Rosa, L., and Piano, E. (2008). Selection of grazing-tolerant lucerne cultivars. Grass Forage Sci. 63, 360–368. doi: 10.1111/j.1365-2494.2008.00640.x
Popp, J., McCaughey, W., Cohen, R., McAllister, T., and Majak, W. (2000). Enhancing pasture productivity with alfalfa: A review. Can. J. Plant Sci. 80, 513–519. doi: 10.4141/P99-049
Qiang, H., Chen, Z. H., Zhang, Z. L., Wang, X. M., Gao, H. W., and Wang, Z. (2015). Molecular diversity and population structure of a world wide collection of cultivated tetraploid alfalfa(Medicago sativa subsp.sativa L.).Germplasm as revealed by microsatellite markers. PLoS One 10:e0124592. doi: 10.1371/journal.pone.0124592
Raffaele, S., Rivas, S., and Roby, D. (2006). An essential role for salicylic acid in AtMYB30-mediatedcontrol of the hypersensitive cell death program in Arabidopsis. FEBS Lett. 580, 3498–3504. doi: 10.1016/j.febslet.2006.05.027
Robins, J. G., Bquchan, G. R., and Brummer, E. C. (2007). Genetic mapping forage yield,plant height,and regrow that multiple harvests in tetraploid alfalfa(Medicago sativa L.). Crop. Sci. 47, 11–18. doi: 10.2135/cropsci2006.07.0447
Robins, J. G., and Brummer, E. C. (2010). QTL underlying self-fertility in tetraploid alfalfa. Crop. Sci. 50, 143–149. doi: 10.2135/cropsci2009.02.0104
Shi, H. F., He, S. J., He, X. Y., Lu, S. Y., and Guo, Z. F. (2019). An eukaryotic elongation factor 2 from Medicago falcata (MfEF2) confers cold tolerance. BMC Plant Biol. 19, 218–230. doi: 10.1186/s12870-019-1826-7
Shimoyama, N., Johnson, M., Beaumont, A., and Schläppi, M. (2020). Multiple cold tolerance trait phenotyping reveals shared quantitative trait loci in Oryza sativa. Rice 13, 57–17. doi: 10.1186/s12284-020-00414-3
Tu, D. P. (2011). Construction of genetic map and QTL mapping of some agronomic traits in Medicago truncatula by SSR markers. Yangzhou University, China.
Wang, D. (2015). Cloning and genetic transformation of alfalfa tolerance related genes in tobacco. Inner Mongolia: Inner Mongolia Agricultural University.
Wang, L., Conteh, B., Fang, L., Xia, Q., and Nian, H. (2020). QTL mapping for soybean (Glycine max L.) leaf chlorophyll-content traits in a genotyped RIL population by using RAD-seq based high-density linkage map. BMC Genomics 21:739. doi: 10.1186/s12864-020-07150-4
Wang, Y., Feng, G. D., Zhang, Z., Liu, Y., Ma, Y. L., Wang, Y. Y., et al. (2020). Overexpression of Pti4, Pti5, and Pti6 in tomato promote plant defense and fruit ripening. Plant. Sci. 302:110702. doi: 10.1016/j.plantsci.2020.110702
Wang, M. T., Jiang, L. H., Bada, L. H., Lv, S. J., and Wang, J. J. (2013). Application of optimal sequence analysis method in evaluation of grazing tolerance of Medicago falcata L. Grassland Prata 25, 51–56. doi: 10.3969/j.issn.2095-5952.2013.02.013
Wang, J. J., Lv, S. J., Wang, M. T., Wang, D., Bada, L. H., Jiang, L. H., et al. (2006). Morphological mechanism of grazing tolerance of alfalfa at individual level. Grassland J. 24, 35–41. doi: 10.11733/j.issn.1007-0435.2016.01.005
Wang, J. J., Zhao, Y., Ray, L., and Song, M. Z. (2016). Transcriptome responses in alfalfa associated with tolerance to intensive animal grazing. Sci. Rep. 6:19438. doi: 10.1038/srep19438
Wu, K., Liu, H. Y., Yang, M. M., Ye, T., Ma, H. H., Wu, W. X., et al. (2014). High density genetic map construction and QTLs analysis of grain yield-related traits in sesame(Sesamum indicum L.)basedon RAD-Seq. BMC Plant Biol. 14:274. doi: 10.1186/s12870-014-0274-7
Yagi, M., Shirasawa, K., Waki, T., Kume, T., Isobe, S., Tanase, K., et al. (2017). Construction of an SSR and RAD marker-based genetic linkage map for carnation (Dianthus caryophyllus L.). Plant Mol. Biol. Rep. 35, 110–117. doi: 10.1007/s11105-016-1010-2
Yan, N., Gai, X., Xue, L., Du, Y., Shi, J., and Liu, Y. (2020). Effects of NtSPS1 overexpression on Solanesol content, plant growth, photosynthesis, and Metabolome of Nicotiana tabacum. Plan. Theory 9:518. doi: 10.3390/plants9040518
Yan, C., Yan, Z., Wang, Y., Yan, X., and Han, Y. (2014). Tudor-SN, a component of stress granules, regulates growth under salt stress by modulating GA20ox3 mRNA levels in Arabidopsis. J. Exp. Bot. 65, 5933–5944. doi: 10.1093/jxb/eru334
Yang, W., Chen, S., Cheng, Y., Zhang, N., Ma, Y., Wang, W., et al. (2020). Cell wall/vacuolar inhibitor of fructosidase 1 regulates ABA response and salt tolerance in Arabidopsis. Plant Signal. Behav. 15:e1744293. doi: 10.1080/15592324.2020.1744293
Yermekbayev, K., GriffithsS, M., Chhetry, M., Leverington-Waite, M., Orford, S., Amalova, A., et al. (2020). Construction of a genetic map of RILs derived from wheat(T. aestivum L.) varieties pamyati azieva×paragon using high-throughput SNP genotyping platform KASP—kompetitive allele specific PCR. Russ. J. Genet. 56, 1090–1098. doi: 10.1134/S102279542009015X
Yin, T. T. (2021). Analysis of phenotypic characters and Gentic diversity based on RAD-Seq sequencing of the Germplasm resources of Elymus. Xinjiang Agricultural University, China.
Zeb, Q., Wang, X., Hou, C., Zhang, X., Dong, M., Zhang, S., et al. (2019). The interaction of CaM7 and CNGC14 regulates root hair growth in Arabidopsis. J. Integr. Plant Biol. 62, 887–896. doi: 10.1111/jipb.12890
Zhang, Z. D. (2016). Optimization of high density genetic map and QTL mapping of important traits in jujube. Beijing Forestry University, China.
Zhang, M. F. (2020). Construction of high density molecular linkage map and QTL mapping for important traits such as starch content in tetraploid potato. Inner Mongolia Agricultural University, China.
Zhang, F., Kang, J. M., Long, R. C., Yu, L. X., Sun, Y., Wang, Z., et al. (2020). Construction of high density genetic link age map and mapping quantitative trait loci(QTL)for flowering time in autotetraploid alfalfa(Medicago sativaL.)using genotyping by sequencing. Plant Genome 13:e20045. doi: 10.1002/tpg2.20045
Zhang, F., Kang, J. M., Long, R. C., Yu, L. X., Wang, Z., Zhao, Z. X., et al. (2019). High-density linkage map construction and mapping QTL for yield and yield components in auto tetraploid alfalfa using RAD-seq. BMC Plant Biol. 19:165. doi: 10.1186/s12870-019-1770-6
Zhao, L. B., Li, Z., Qu, J. P., Yu, Y., Lu, L., and Peng, Z. S. (2017). Novel fluorescent sequence-related amplified polymorphism(FSRAP) markers for the construction of a genetic linkage map of wheat(Triticum aestivum L.). Genetika 49, 1081–1093. doi: 10.2298/GENSR1703081Z
Keywords: Medicago falcata L., grazing tolerance, genetic linkage mapping, QTLs, high-density
Citation: Zhou X, Li X, Zhang X, Yin D, Wang J and Zhao Y (2022) Construction of a high-density genetic map and localization of grazing-tolerant QTLs in Medicago falcata L.. Front. Plant Sci. 13:985603. doi: 10.3389/fpls.2022.985603
Edited by:
Maofeng Chai, Qingdao Agricultural University, Qingdao, ChinaReviewed by:
Xiao Ma, Sichuan Agricultural University, ChinaGuoan Shen, Chinese Academy of Medical Sciences and Peking Union Medical College, China
Copyright © 2022 Zhou, Li, Zhang, Yin, Wang and Zhao. This is an open-access article distributed under the terms of the Creative Commons Attribution License (CC BY). The use, distribution or reproduction in other forums is permitted, provided the original author(s) and the copyright owner(s) are credited and that the original publication in this journal is cited, in accordance with accepted academic practice. No use, distribution or reproduction is permitted which does not comply with these terms.
*Correspondence: Junjie Wang, amp3NjJAMTYzLmNvbQ==; Yan Zhao, emhhb3lhbm5tZ0BpbWF1LmVkdS5jbg==