 Jemanesh K. Haile1*†
 Demissew Sertse2†
 Amidou N’Diaye1
 Valentyna Klymiuk1
 Krystalee Wiebe1Yuefeng Ruan3
 Harmeet S. Chawla4
 Maria-Antonia Henriquez5
 Lipu Wang1Hadley R. Kutcher1Barbara Steiner6
 Hermann Buerstmayr6
 Curtis J. Pozniak1
- 1Department of Plant Sciences, Crop Development Centre, University of Saskatchewan, Saskatoon, SK, Canada
- 2Aquatic and Crop Resource Development, National Research Council Canada, Saskatoon, SK, Canada
- 3Swift Current Research and Development Centre, Agriculture and Agri-Food Canada, Swift Current, SK, Canada
- 4Department of Plant Sciences, University of Manitoba, Winnipeg, MB, Canada
- 5Morden Research and Development Centre, Agriculture and Agri-Food Canada, Morden, MB, Canada
- 6Department of Agrobiotechnology, Institute of Biotechnology in Plant Production, University of Natural Resources and Life Sciences Vienna, Tulln, Austria
Durum wheat is more susceptible to Fusarium head blight (FHB) than other types or classes of wheat. The disease is one of the most devastating in wheat; it reduces yield and end-use quality and contaminates the grain with fungal mycotoxins such as deoxynivalenol (DON). A panel of 265 Canadian and European durum wheat cultivars, as well as breeding and experimental lines, were tested in artificially inoculated field environments (2019–2022, inclusive) and two greenhouse trials (2019 and 2020). The trials were assessed for FHB severity and incidence, visual rating index, Fusarium-damaged kernels, DON accumulation, anthesis or heading date, maturity date, and plant height. In addition, yellow pigment and protein content were analyzed for the 2020 field season. To capture loci underlying FHB resistance and related traits, GWAS was performed using single-locus and several multi-locus models, employing 13,504 SNPs. Thirty-one QTL significantly associated with one or more FHB-related traits were identified, of which nine were consistent across environments and associated with multiple FHB-related traits. Although many of the QTL were identified in regions previously reported to affect FHB, the QTL QFhb-3B.2, associated with FHB severity, incidence, and DON accumulation, appears to be novel. We developed KASP markers for six FHB-associated QTL that were consistently detected across multiple environments and validated them on the Global Durum Panel (GDP). Analysis of allelic diversity and the frequencies of these revealed that the lines in the GDP harbor between zero and six resistance alleles. This study provides a comprehensive assessment of the genetic basis of FHB resistance and DON accumulation in durum wheat. Accessions with multiple favorable alleles were identified and will be useful genetic resources to improve FHB resistance in durum breeding programs through marker-assisted recurrent selection and gene stacking.
1 Introduction
According to FAO, food production needs to increase by 70% (baseline 2009) to feed a growing world population, which is projected to reach ~9.1 billion by 2050 (FAO, 2009). Reports that considered recent consumption behaviors and updated 2050 population projections (~10 billion) estimate that crop production of food crops will need to be increased by 119% to meet the demand (Berners-Lee et al., 2018). While achieving this production goal is feasible, major biotic and abiotic constraints further constrain crop production. For example, diseases and other pests account for up to 40% of annual yield loss in crop production (Savary et al., 2012). The prevalence of diseases and other pests has been exacerbated by increasing climate-change-related burdens and world trade and movements (Carvajal-Yepes et al., 2019; Prank et al., 2019).
Wheat is the most important cereal crop in the world; it is produced on 217 million hectares globally and is a major source of nutrition and caloric intake (OECD/FAO, 2019). However, diseases and other pests heavily constrain wheat production in general and durum wheat in particular. An average yield loss in wheat due to biotic stresses is estimated to be over 20% a year (Savary et al., 2019). Most wheat diseases are fungal-caused, and genetic resistance has been effective in controlling several diseases, like wheat rust. However, Fusarium head blight (FHB) (Miedaner et al., 2017) remains one of the most destructive diseases of wheat worldwide, especially for durum wheat, because it is generally the most susceptible of the small-grained cereals. Breeding for FHB resistance is a priority, but it is hindered by its complex genetic architecture, significant genotype-by-environment interaction, and high cost of phenotype testing. In addition to direct yield losses caused by FHB, indirect losses due to the contamination of infected kernels with Fusarium mycotoxins are becoming a primary concern.
Mycotoxins are toxic substances that cause a significant annual economic loss to the agriculture and food industries. Each year, approximately 25% of agricultural commodities are contaminated by mycotoxins. One of the major mycotoxins in the wheat supply chain with a critical health risk potential is deoxynivalenol (DON). DON is a trichothecene mycotoxin produced by Fusarium graminearum and Fusarium culmorum (Mirocha et al., 1994). It is also known as vomitoxin, which is harmful to humans and animals after consumption (Foroud et al., 2019) because it can cause vomiting, anorexia, growth retardation, immune suppression, inflammation and necrosis of various tissues, and diarrhea in animals (Pestka and Smolinski, 2005). The Codex Committee on Contaminants in Food develops and proposes international food safety standards and codes of practice and has set the maximum DON allowable at 2.0 mg/kg for cereal grains, including wheat (Canadian Grain Commission, 2019). Therefore, breeding for FHB-resistant cultivars, together with an integrated disease management strategy, is the most effective, economical, and environment-friendly way to combat the disease globally.
Most current durum wheat cultivars are highly susceptible to FHB, and breeding progress is hampered by the narrow genetic variation for FHB resistance in elite germplasm. Compared to hexaploid wheat, fewer resistance loci are reported for FHB resistance in tetraploid wheat. Furthermore, most of these quantitative trait loci (QTL) possess only minor or moderate effects compared to the major resistance loci in hexaploid wheat, e.g., Fhb1 located on chromosome 3BS, Fhb2 located on chromosome 6BS, and Qfhs.ifa-5A are all derived from the resistant Chinese cultivar “Sumai 3” (Prat et al., 2014). Introgression of resistance genes from hexaploid into durum wheat has been largely unsuccessful, except for a recent report where introgression of Fhb1 from Sumai 3 into durum wheat resulted in an improved resistance response (Giancaspro et al., 2016; Prat et al., 2017). In addition, FHB resistance in wheat is usually negatively associated with agronomic traits such as semi-dwarfness and other plant phenological traits, a fact that complicates the genetic mapping of resistance loci or deploying them in breeding. There is compelling evidence supporting a negative correlation between FHB resistance and plant height (PH) and heading date (HD), which is often reflected in the colocalization of PH and HD QTL with FHB resistance QTL (Buerstmayr et al., 2003; Buerstmayr et al., 2012; Sari et al., 2018; Sari et al., 2020). In addition, the widely deployed dwarfing allele Rht-B1 has been associated with FHB susceptibility (Buerstmayr and Buerstmayr, 2016; He et al., 2016a). Buerstmayr et al. (2020) summarized the influence of PH, anther extrusion/retention, and HD/flowering time on FHB response. This has motivated the phenotyping of agro-morphological traits along with FHB resistance for most recent FHB studies (Haile et al., 2020).
Despite the lack of genetic diversity for FHB resistance, several studies have identified FHB resistance QTL derived from tetraploid wheat, suggesting the presence of minor-effect resistance that could be the focus of gene pyramiding strategies. Several genome-wide association studies (GWAS) have been reported using tetraploid wheat germplasm, including a Canadian durum wheat breeding panel (Sari et al., 2020), Tunisian-derived durum wheat populations (Ghavami et al., 2011), diverse durum lines from Northern America, the Mediterranean, Central Europe, Australia, and CIMMYT (Steiner et al., 2019b), and a durum association mapping panel mainly comprising Canadian breeding lines (Ruan et al., 2020). Most of the QTL mapping studies assessed type II resistance (resistance to fungal spread); however, other types of FHB resistance, such as resistance to DON accumulation, although more challenging to study, are also important. Moreover, most of the previous GWAS were performed based on single-locus models, such as the General Linear Model (GLM) and the Mixed Linear Model (MLM) (Bradbury et al., 2007). However, single-locus genome-wide association studies (SL-GWAS) are limited in detecting marginal effect quantitative trait nucleotides (QTNs) (Zhang et al., 2019b). Thus, many important loci associated with the target traits remain undiscovered because they do not satisfy the stringent criterion of the significance test. Current advances in multi-locus GWAS (ML-GWAS) models have improved the power and reliability of identifying causal loci for complex traits. to identify causal loci for complex traits. ML-GWAS also has a lower false-positive rate. It has been successfully applied to identify significant QTNs with subtle contributions to several agronomic traits in maize (Xu et al., 2018), rice (Misra et al., 2018), flax (Sertse et al., 2019), cotton (Li et al., 2018), and leaf rust in wheat (Fatima et al., 2020). At the same time, no studies have yet used ML-GWAS for FHB-related traits in durum wheat.
Thus, in the current study, we have analyzed a panel of Canadian and European durum wheat cultivars and breeding lines genotyped with the wheat 90K array and phenotyped for resistance to FHB to (1) determine the genetic architecture of FHB resistance, including resistance to DON accumulation, (2) test several GWAS models, including the SL and ML for FHB resistance-related traits, (3) identify potential candidate genes linked to the associated QTL, and (4) develop Kompetitive Allele-Specific PCR (KASP) markers from the QTL regions for utilization in plant breeding programs. In addition, we have addressed Fusarium-damaged kernels (FDK) and the relationship between FHB and quality traits such as protein content (PRO) and yellow pigment (YP). The results provide an insight into the complex genetic architecture of FHB resistance and reveal the QTL and genotypes of potential breeding value for FHB resistance. Additionally, the results should help better understand the genetic basis and diversity of DON accumulation in durum wheat and facilitate the reduction of DON contamination by stacking DON resistance QTL using marker-assisted selection (MAS).
2 Materials and methods
2.1 Plant materials
The germplasm used in this study consisted of 265 lines (Supplementary Table S1). This panel was primarily composed of durum from Canada, including elite Canadian and USA cultivars, advanced breeding lines, and recently developed germplasm from Canadian breeding programs (Crop Development Centre, University of Saskatchewan and Swift Current Research and Development Centre, Agriculture and Agri-food Canada) and research projects. The breeding lines and the cultivars were genotyped with Rht-B1b as per the previously published protocol (N’Diaye et al., 2017). The remaining lines were European Triticum durum cultivars and experimental lines developed by single seed descent by crossing a resistant tetraploid experimental line DBC-480 to Karur and Durobonus (susceptible European T. durum cultivars) and the advanced breeding line SZD1029K (Supplementary Table S1). These lines were developed and provided by the University of Natural Resources and Life Sciences, Vienna, Department of Agrobiotechnology, Institute of Biotechnology in Plant Production (IFA-Tulln), Austria, for this study. Karur and Durobonus are registered varieties in France and Austria, respectively. The DBC-480 line was developed at IFA-Tulln, Austria, by four generations of marker-assisted backcrossing of the highly resistant Triticum aestivum cultivar Sumai 3 into the background of the Austrian T. durum variety Semperdur and subjected to rigorous phenotypic selection for improved FHB resistance in field trials (Prat et al., 2017). The presence of the resistant Fhb1 allele was verified using the SSR markers Xgwm389, Xgwm533, and Xgwm493. Cultivars Karur, Durobonus, and SZD1029K possess the semi-dwarfing allele Rht-B1b, while DBC-480 is a tall line harboring the Rht-B1a wild-type allele (Prat et al., 2017). Additionally, experimental lines descending from crosses of T. durum cultivars with moderately FHB-resistant Triticum dicoccoum and/or Triticum dicoccoides accessions from the IFA-Tulln, Austria, research program were also part of this study.
2.2 Phenotyping
Phenotypic data were obtained from multiple experiments conducted from 2019 to 2022 (inclusive) at FHB field nurseries (abbreviated afterward as FL) in Saskatoon (NSF), Saskatchewan, and Morden (MR), Manitoba, Canada, and in 2019 and 2020 in the University of Saskatchewan’s Crop Development Centre’s Greenhouse (GH), Saskatoon, SK (Supplementary Table S11). The infection recorded in 2021 was generally lower than normal because of extreme drought conditions (Supplementary Figure S1).
2.2.1 Screening in the field FHB nurseries
At Saskatoon, the 265 lines were planted at the FHB nursery in hill plots with FHB susceptible and resistant checks in a randomized complete block design with three replications. For artificial inoculation, the inoculum was prepared by mixing equal amounts of spores from two virulent DON-producing Fusarium graminearum isolates, Fg003 and Fg004, 3-O-acetyl-DON (3-AcDON) and 15-O-acetyl-DON (15-AcDON), respectively, originally collected from Saskatchewan. Aliquots of conidia stock solutions were stored at −20°C, then thawed at 37°C and diluted with distilled water to obtain the anticipated final spore concentration just before inoculation. Inoculations were performed when 50% of the plants in the earliest plot reached anthesis using a motor-driven backpack sprayer in the late afternoons. About 100 ml m−2 of conidial suspension at each inoculation cycle was sprayed onto the durum wheat heads. Inoculations were repeated at 2-day intervals and ended 2 days after the last plot flowered, resulting in up to six applications per plot. A sprinkler irrigation system provided adequate moisture after each inoculation to promote spore germination and fungal infection.
Agro-morphological traits, HD or anthesis (AD), days to maturity (MAT), and PH were assessed for all entries to determine their possible association with FHB traits. Heading date was recorded as the number of days from planting to the date when 50% of the heads in a plot had emerged, AD as days from planting until the first anther extruded out from the floret, and MAT when 50% of the plants reached physiological maturity. Plant height (cm) was measured as the distance from the base of the plant to the top of the spike, excluding awns. FHB incidence (INC) was the percentage of FHB-infected spikes/plots, and severity (SEV) was the percentage of symptomatic spikelets visually estimated 21 days after inoculation. At physiological maturity, 10 to 15 randomly infected spikes from each plot were collected and carefully threshed by hand to minimize the loss of FDKs. The grains were bulked, and a 10-g sample was milled in a Laboratory Mill 3610 grinder (2015 Perten Instruments®); 2 g subsample of flour was poured into a 15-ml polypropylene conical tube. DON quantification was performed using the high-throughput fast chromatography-tandem mass spectrometry (FC-MS/MS)-based method (Wang et al., 2022). LC-MS/MS conditions were developed on an Agilent Series 1260 Infinity HPLC system (Agilent Technologies, Mississauga, ON, Canada) coupled with an AB Sciex API 4000 hybrid triple quadrupole linear ion trap (QTRAP) mass spectrometer (AB Sciex, Concord, ON, Canada) equipped with a Turboionspray interface. Applied Biosystems/MDS Sciex Analyst software (Version 1.7) was used for system control and quantification. In addition, the FHB index (VRI) was calculated as (SEV × INC)/100 (Stack and McMullen, 1998), and INC-SEV-DON (ISD) index was calculated as (0.2 × INC) + (0.2 × SEV) + (0.6 × DON) following the protocol of the Prairie Recommending Committee for Wheat, Rye, and Triticale (PRCWRT, 2013).
The same lines were also evaluated at the Agriculture Agri-Food Canada (AAFC) FHB nursery near Morden, MB, in a randomized complete block design in a single 1-m-long row spaced 30 cm apart. Fusarium graminearum inoculum was prepared on corn kernels using four isolates: HSW-15-39 (3-ADON), HSW-15-87 (3-ADON), HSW-15-27 (15-ADON), and HSW-15-57 (15-ADON). Each isolate was inoculated in individual pans containing sterile corn and incubated for 1 month. After the corn was dried, it was stored in plastic tubs at 4°C until use. The inoculum was dispersed at a rate of 8 g per row, two times at weekly intervals, starting when the earliest lines were at the four- to five-leaf stage (Zadok’s stage 31) (Zadoks et al., 1974). The inoculum application was followed by irrigation three times a week (Monday, Wednesday, and Friday) using Cadman Irrigations Travellers with Briggs Booms. FHB incidence and severity were rated at 21 days post-anthesis. Full-row plots were harvested manually (avoiding the borders) and combined threshed. The harvested samples were sent to a service provider (Central Testing Laboratory Ltd., Winnipeg, MB) to perform FDK and DON analyses. In addition, the effect of DON accumulation on YP and PRO was investigated for the DON samples collected from the 2020 NSF using a near-infrared spectroscopy (NIR) analyzer.
2.2.2 Screening in the greenhouse
Type II resistance to FHB was assessed in GH trials. Lines with check cultivars were planted in 1-gallon pots filled with a standard potting mix (type-3 soil). Six seeds per pot were sown, and after germination, only three plants were retained per pot for further growth and inoculation. Pots were designated as experimental units and arranged in a completely randomized design with two replications. Replicates were sown approximately 1–2 weeks apart, resulting in a 1–3-day difference in anthesis between replications. The temperature in the greenhouse was maintained at 22°C/18°C (day/night) with a 16-h photoperiod. The lines were inoculated with 3-ADON F. graminearum isolate SK-14-97 (obtained from the Cereal Pathology group, University of Saskatchewan, SK, Canada). First, a conidial suspension was plated onto potato dextrose agar media and exposed to permanent light for 4 to 7 days at 18°C. Then, a conidial suspension was adjusted to a concentration of 50,000 spores per mL using a hemocytometer. The anthesis date was recorded for each plant in a pot. Inoculations were performed at anthesis by pipetting 10 µl of conidia suspension between the lemma and palea of the two outer florets of one central spikelet per spike. A total of six heads per line was inoculated. The heads were then sprayed with sterile distilled water and covered with polyethylene transparent plastic bags for 24 hours to maintain high humidity. FHB symptoms were visually scored as the percentage of infected spikelets per spike at 21 days post-inoculation. At maturity, the inoculated heads of each line were harvested, combined from all replicates, threshed by hand to retain all the seeds, and ground into a fine powder for DON analysis following the procedure described in section 2.2.1.
2.3 Phenotypic data analyses
To obtain the best linear unbiased predictions (BLUPs) of the measured traits across test environments, the R package lme4 (version 3.4.2, https://www.r-project.org) was used for phenotypic data analysis using the following R-script: fitted to each genotype: Phenotype ∼ (1|Genotype) + (1|Repeat%in%Environment) + (1|Genotype&Environment). Lines were treated as a random factor, and BLUPs were estimated for all traits within and across environments. Broad-sense heritability (H2) was then estimated using the variance components estimated from the previous equation. Pearson correlations between the BLUPs of the observed traits were calculated in R (Benesty et al., 2009).
2.4 Genotyping and SNP filtering
The mapping panel was genotyped with the 90K Illumina SNP chip to identify single nucleotide polymorphisms (SNPs). SNPs with minor allele frequencies <5% and missing data >10% were removed to avoid spurious marker–trait associations, leaving 13,504 SNPs for subsequent analyses (Supplementary Table S10). The physical positions of SNP markers were obtained from the latest Chinese Spring reference genome sequences (RefSeqv2.1: https://doi.org/10.1111/tpj.15289) to compare the QTL intervals with previous studies because most of them used this reference sequence.
2.4.1 Genotyping with Rht-B1b marker
The Rht-B1b confers semi-dwarfism in durum (Peng et al., 1999). Therefore, we genotyped the lines with the Rht-Blb marker to see how this locus relates to FHB resistance. To compute the proportion of phenotypic variance explained by the marker Rht-B1b, we fitted a multiple linear regression model using Rht-B1b SNP as a predictor and FHB traits (mean FHB SEV and mean FHB INC) as a response. We also computed the proportion of mean PH variance explained by this marker for comparison. To implement the multiple linear regression model, we used the Ordinary Least Squares (OLS) regression function from the statsmodels library in Python 3.7.
2.5 Linkage disequilibrium and population structure
Linkage disequilibrium (LD) analysis was performed for each chromosome by computing r2 values for all pairwise marker comparisons using the R genetics package (CRAN - Package genetics (r-project.org)). Marker positions were then used to investigate LD decay along each chromosome and across the entire genome. Background LD was estimated as the 90th percentile of the r2 value of marker pairs on different chromosomes. LD decay distance was determined by fitting a non-linear model using the Hill and Weir method (Weir, 1979), with the r2 threshold set at 0.2 and r2 = half decay distance.
To define the appropriate number of subpopulations (K) for subsequent population structure and principal component analyses (PCA), the Bayesian information criterion (BIC) of each genotype was computed for 10 arbitrary clusters using the discriminant analysis of principal components (DAPC) function in the R package Adegenet 2.1.7 (Jombart, 2008; Jombart et al., 2020). Results were visualized into scree plots, and the number of clusters where the line trended horizontally was considered an appropriate number of ancestral subpopulations (K). The admixture proportion (ancestral coefficients) of genotypes was inferred based on sparse non-negative matrix factorization (sNMF) (Frichot et al., 2014) at the above (K + 1) estimated K as the number of subpopulations using the snmf function in R package LEA (Frichot and François, 2015). The admixture proportions of each genotype were summarized in bar plots using the plot function of the same package LEA. Principal component analysis was also performed based on the K subpopulation and the variation explained by each PC was computed. The clustering of the genotypes was visualized in a scatter plot based on the first two PCs. To confirm the population structure and the genetic relationships of the genotypes, phylogenetic analysis was performed following the Neighbor-Joining method using TASSEL 5 (Bradbury et al., 2007), and the web-based interactive tree of life (iTOL) (Letunic and Bork, 2016) was applied to visualize the trees.
2.6 Marker–trait association analysis
We applied seven ML and one SL GWAS method to capture loci underlying FHB and its related traits. The multi-locus methods include multi-locus random-SNP-effect MLM (mrMLM) (Wang et al., 2016), fast multi-locus random-SNP-effect EMMA (FASTmrEMMA) (Wen et al., 2017), Iterative Sure Independence Screening EM-Bayesian LASSO (ISIS EM-BLASSO) (Tamba et al., 2017), polygenic-background-control-based Kruskal–Wallis test plus empirical Bayes (pKWmEB) (Ren et al., 2018), fast mrMLM (FASTmrMLM) (Tamba and Zhang, 2018), and polygenic-background-control-based least angle regression plus empirical Bayes (pLARmEB) (Zhang et al., 2017), all implemented in the R package MrMLM v 5 (Wen et al., 2018). In addition, a haplotype (LD block) based on a restricted two-stage multi-locus multi-allele GWAS (RTM-GWAS) (He et al., 2017) was applied. The significant threshold for the first six in MrMLM was defined based on a logarithm of odds (LOD) >3, whereas for RTM GWAS Bonferroni corrected p < α/n was applied, where α = 0.05 and n = the number of LD blocks. For single-locus GWAS, a mixed linear model (MLM, with Q + K model) was applied using TASSEL 5 (Bradbury et al., 2007). The significant threshold of marker–trait association was set at a p-value adjusted based on Bonferroni correction (α/n, where α = 0.05 or significant threshold before multiple comparisons and n was the number of markers used for GWAS) (Sun et al., 2017). Population structure and kinship were included as correcting factors for all eight methods. Finally, significant SNP markers within one LD (13 Mbp) on the same chromosome were considered to represent a single locus. Quantile–Quantile (Q–Q) plots were generated to visualize the goodness of fitting for the GWAS model accounted for by the population structure and familial relatedness. The negative logarithm of the p-value from the model was calculated against the expected value based on the null hypothesis.
After identifying consistent and significant QTL regions, representative SNPs were extracted from the QTL regions and further investigated for combined additive effects for the traits SEV, INC, and DON. These combinations were tested with across environment BLUP values of the traits to assess which combination contributed to better resistance. Lines that carry resistant alleles at multiple loci were then selected and recommended for future breeding for FHB resistance based on the number of resistance alleles they contained.
2.7 Analysis of potential candidate genes for DON accumulation
To identify potential candidate genes within the interval of the DON QTNs captured by the GWAS analyses, the Chinese Spring reference wheat genome (RefSeqv2.1: https://doi.org/10.1111/tpj.15289) was used. Three highly significant MTAs for DON, Ra_c4159_2716 (QFhb-1A.1), Ra_c41921_951 (QFhb-4B.4), and Ra_c29107_289 (QFhb-6A), were subjected to candidate gene analysis to identify genes/gene networks associated with resistance. LD analysis was performed using the R package gpart (Kim et al., 2019) by setting the coefficient of determination r2 > 0.5 based on the genotype data and cv Chinese Spring’s gene coordinates. All polymorphic genes within the LD block (r2 > 0.5) were assessed for their potential functional role based on information in different databases, including Knetminer wheat (https://knetminer.com/Triticum_aestivum/) and wheatgmap (http://www.wheatgmap.org/), orthologs of other species from Ensembl Plants (https://plants.ensembl.org/). To search orthologs in well-studied species such as rice and Arabidopsis, corresponding databases were used: the Rice Genome Annotation Project Database (RGAP) (http://rice.uga.edu/) and the Arabidopsis Information Resource (TAIR) (https://www.arabidopsis.org/), respectively. Genes with potential roles in FHB and related trait regulations were identified and summarized.
2.8 KASP marker development and analysis
The six FHB-related traits QTL that were consistently detected in multiple environments and by multiple GWAS models were chosen for KASP marker conversion. The most significant SNP from each of these six QTL was selected from the iSelect 90K Infinium array, and their probe sequences (Wang et al., 2014) were used for PCR primer development. Primers were developed from this probe sequence with two allele-specific forward primers and one common reverse primer (Supplementary Table S9). The KASP genotyping assays were performed on a CFX Touch Real-Time PCR Detection System (BioRad, Hercules, CA, USA) following the LGC Biosearch Technologies’ KASP genotyping manual (www.biosearchtech.com). Each KASP marker was verified on the GWAS panel to be congruent with the 90K iSelect genotyping scores. We then evaluated the genetic diversity of the SNPs significantly associated with the detected QTL in the Global Diversity Panel (GDP) of tetraploid wheat (Mazzucotelli et al., 2020). Six KASP markers, each representing a single locus detected by GWAS (see KASP marker development and analysis), were scored on the GDP, and data were recorded as “resistant” or “susceptible” alleles based on the marker effects estimated from the GWAS panel. Allelic frequencies of these loci were calculated separately in cultivars, landraces, domesticated, and wild emmer subsets of the GDP. Haplotypes were constructed based on the alleles at the six loci, and the number of accessions in GDP carrying each haplotype was summarized in a frequency bar plot. The top 10 most frequent haplotypes were georeferenced based on the coordinates of the country of origin of the accessions carrying the haplotypes and overlaid on the world map using the Quantum Geographic Information System (QGIS 3.8) (http://qgis.osgeo.org).
3 Results
3.1 Phenotypic variations
Descriptive statistics for all the traits tested under field and greenhouse conditions are presented in Supplementary Table S2. Analysis of variance of FHB traits showed significant (p < 0.001) variation among genotypes (data not shown). The phenotypic values ranged from 5% to 100% (GH) and 2% to 93% (FL) for SEV, 1% to 98% for INC, and 0.377 to 228.8 ppm (GH) and 0 to 97 ppm (FL) for DON. The mean values for all FHB traits were higher in 2020 at NSF, Saskatoon, than in the other environments, except where INC was higher in 2019 at the same location. In contrast, the lowest mean scores were recorded for 2021 at both field locations for all the traits. The frequency distribution of the mean values of the studied traits fit a normal distribution, except for DON (Figure 1). The broad-sense heritability (H2, %) of the traits tested ranged from 38% (INC) to 93% (PH) (Supplementary Table S2).
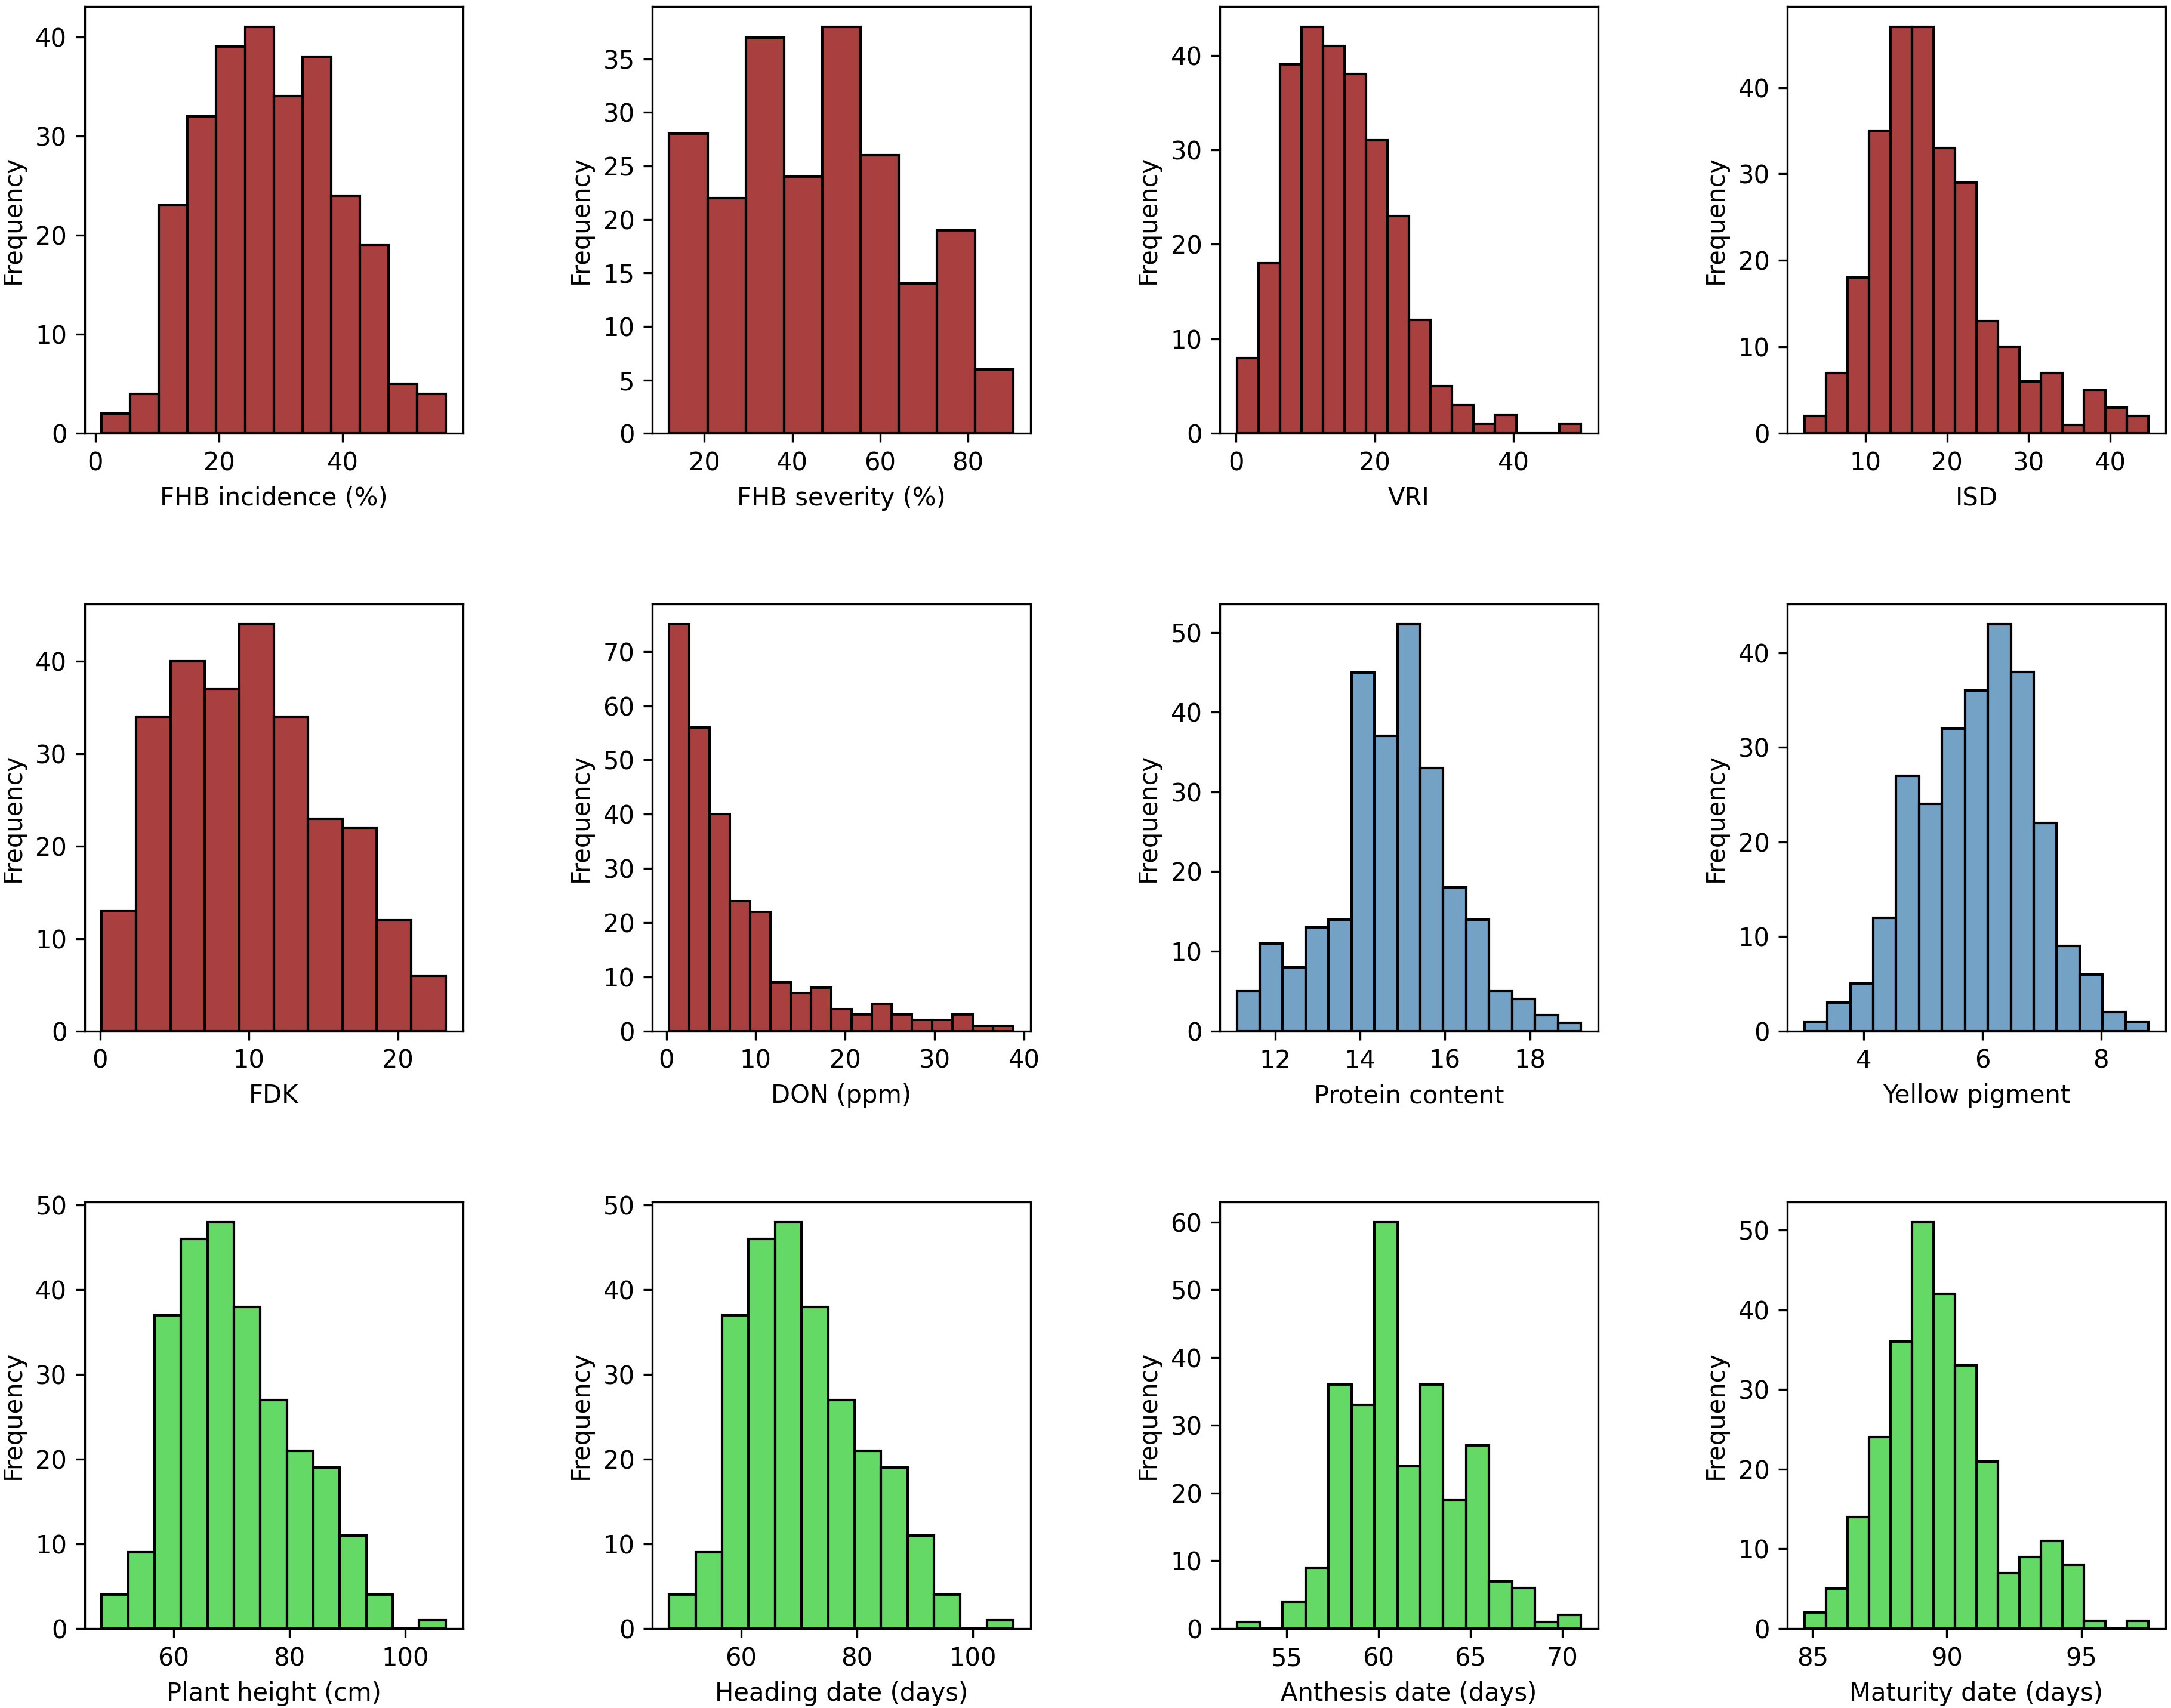
Figure 1 Phenotypic distribution of mean values for FHB incidence (INC; %), FHB severity (SEV; %), Fusarium-damaged kernels (FDK; %), deoxynivalenol concentration (DON; ppm), protein content (PRO; %), yellow pigment (YP, µg g−1), visual rating index (VRI; %), INC-SEV-DON index (ISD), plant height (PH, cm), heading date (HD, days), anthesis date (AD, days), and maturity date (MAT, days).
Weak to strong correlations were detected between FHB SEV and INC and related traits. The correlations among BLUPs for FHB and morpho-physiological traits are presented in Figure 2. The correlation between BLUPs for SEV and INC (r = 0.47) was higher than that between SEV and DON (r = 0.30). BLUPs for DON were nearly equally correlated to SEV and FDK (r = 0.27). BLUPs for FDK correlated highest with SEV (r = 0.46). In contrast, BLUPs for PH, AD, and HD showed weak to moderate negative correlations with all FHB-related traits (Figure 2). The correlation coefficients of FHB response traits (SEV, INC, and DON) in all test environments ranged from 0.31 to 0.66 (Supplementary Figure S2). DON was highly correlated with SEV and FDK in individual environments (Supplementary Figure S2).
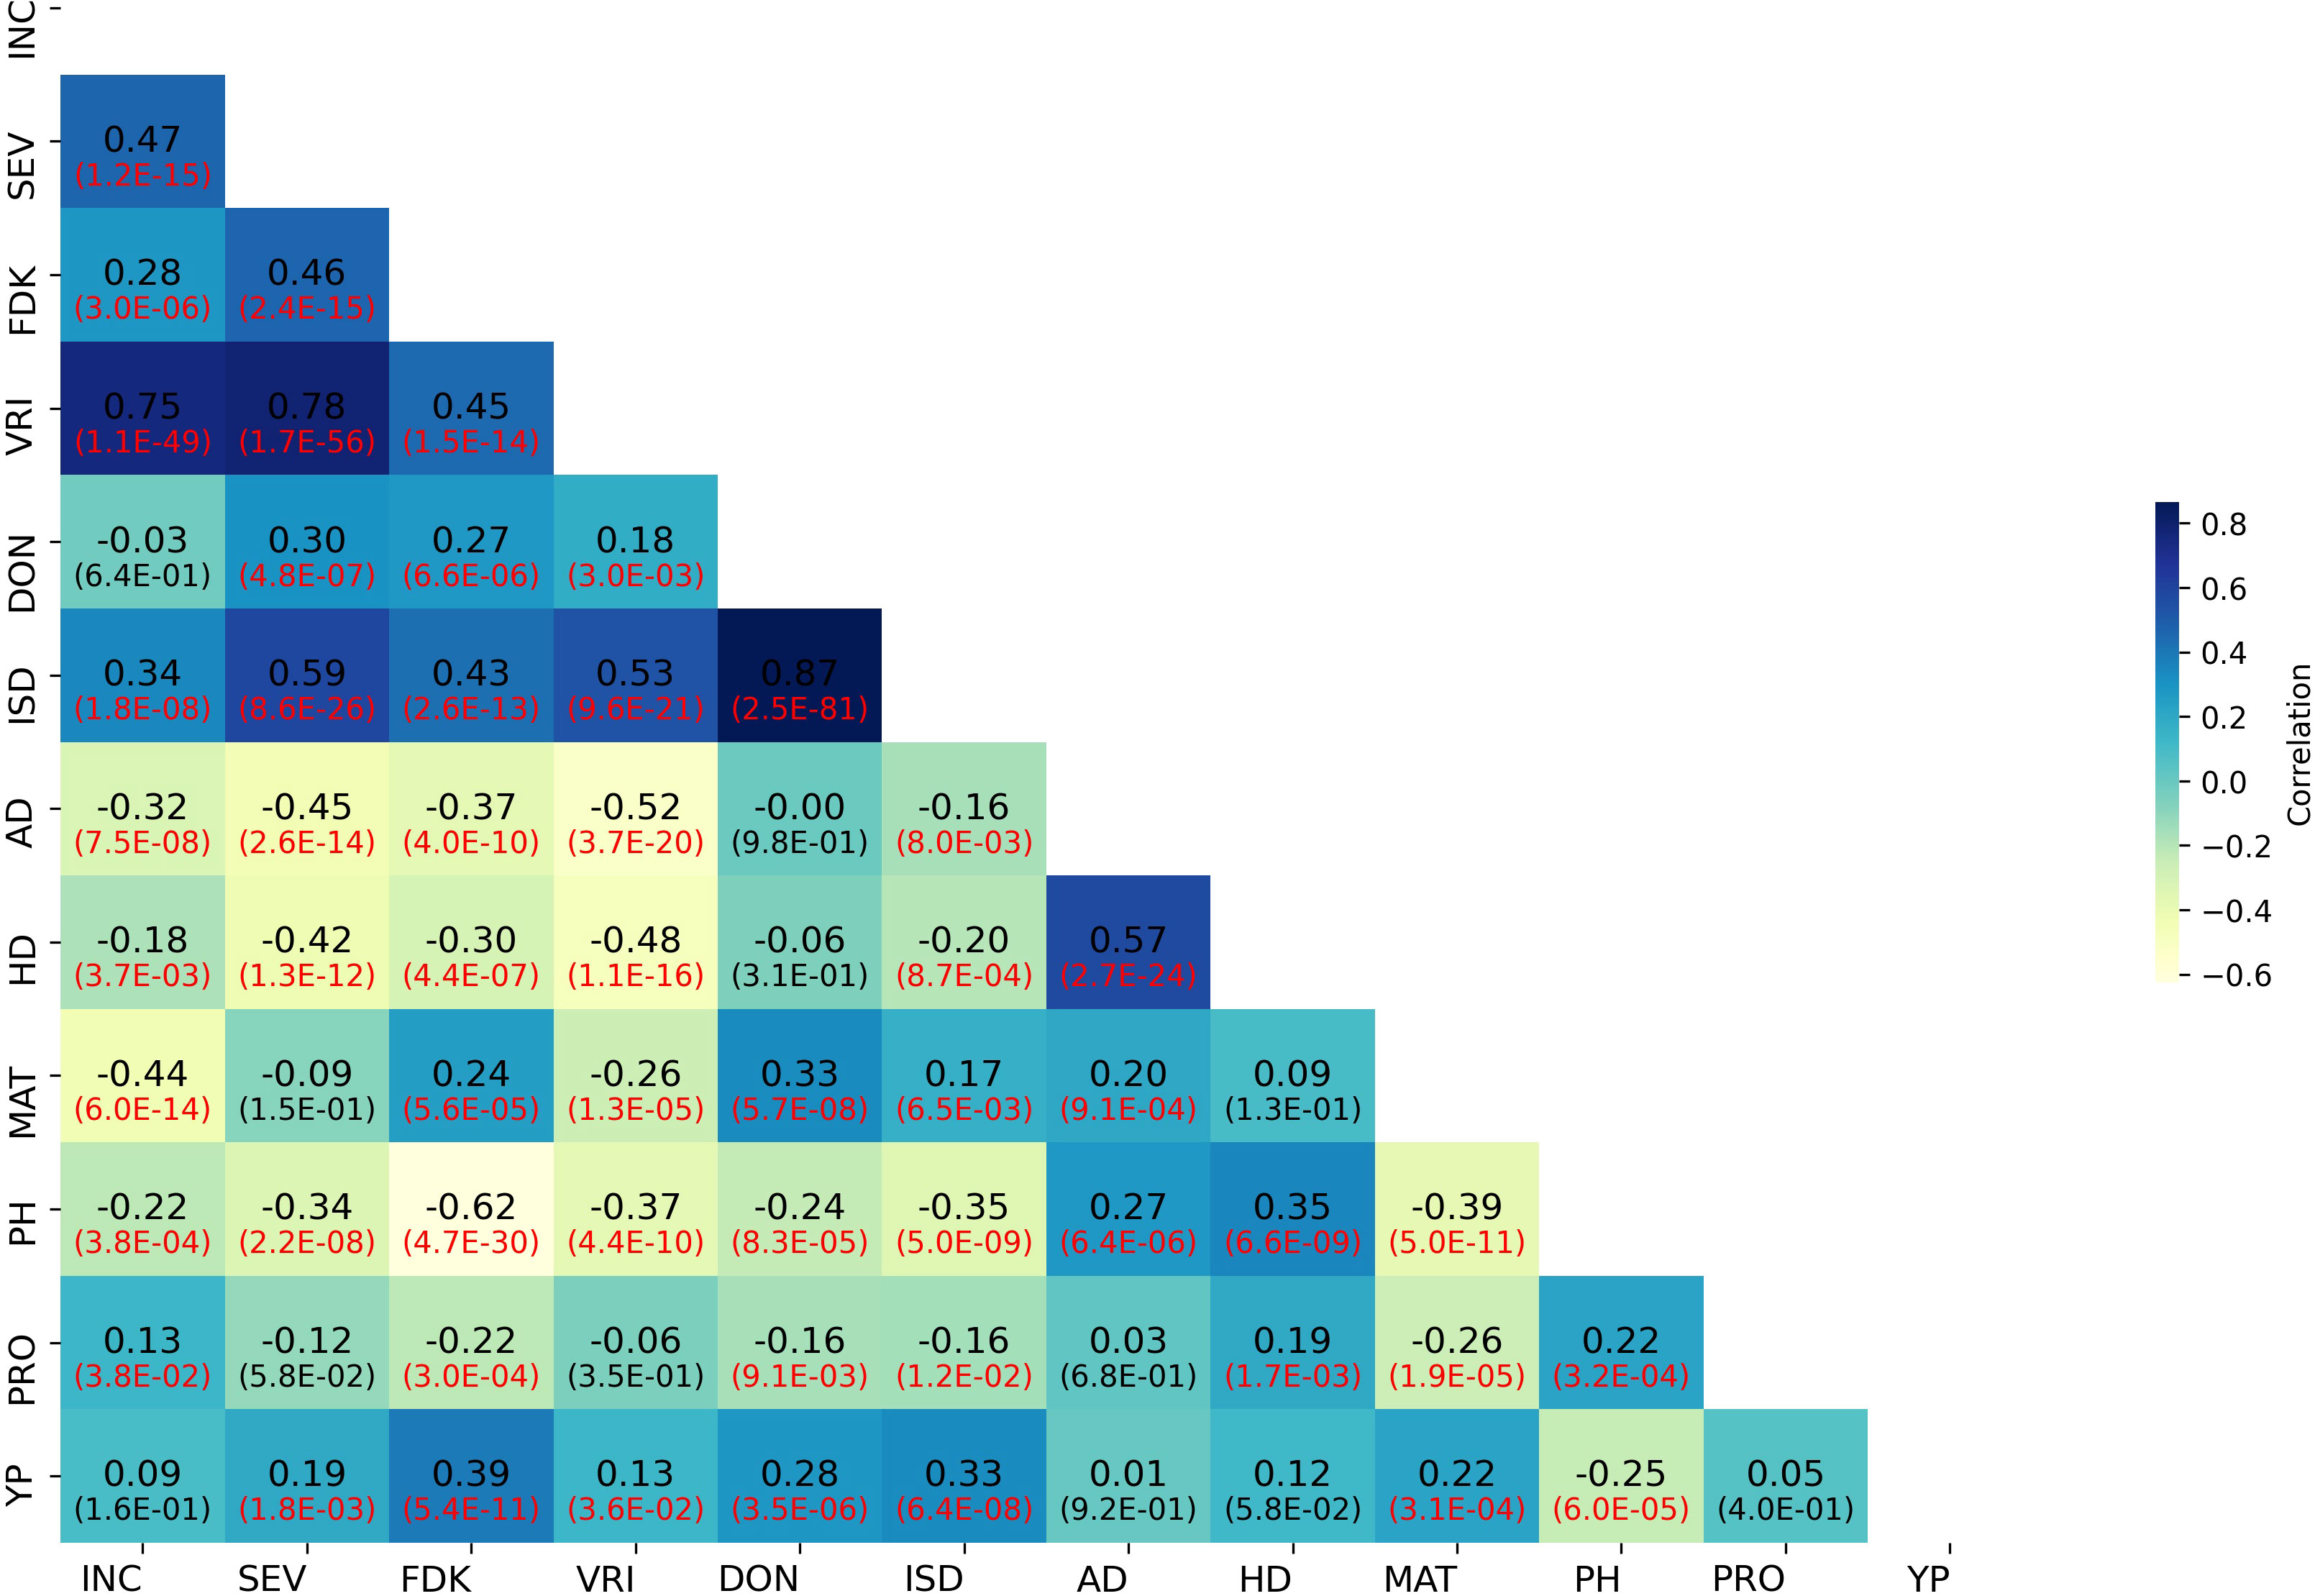
Figure 2 Correlation heatmap of FHB and agro-morphological trait BLUP values in the GWAS panel. INC, FHB incidence; SEV, FHB severity; FDK, Fusarium-damaged kernels; VRI, visual rating index; DON, deoxynivalenol; ISD, INC-SEV-DON index; AD, days to anthesis; HD, days to heading; MAT, days to maturity; PH, plant height; PRO, grain protein content; YP, yellow pigment.
3.2 Population stratification
The final number of SNP markers used for the analysis of population structure and GWAS analysis was 13,504. The appropriate number of subpopulations (K) was identified as five subgroups, essentially consistent with the breeding program of origin and pedigree (Table S1). The admixture, PCA, and phylogenetic analyses showed a similar pattern of clustering of individuals (Figure 3). Most of the experimental lines carrying the major resistance QTL Fhb1 derived from Sumai 3 are clustered in Pop1, whereas some progenies from crosses with Sumai 3 Fhb1 sources to European durum wheat cultivars (Prat et al., 2017) were clustered in Pop2 and Pop3. Pop4 comprised all the Canadian durum wheat cultivars and breeding lines, whereas Pop5 consisted of experimental lines derived from the intercrossing of cultivated lines with T. turgidum ssp. dicoccum and T. turgidum ssp. dicoccoides lines from the IFA-Tulln breeding program.
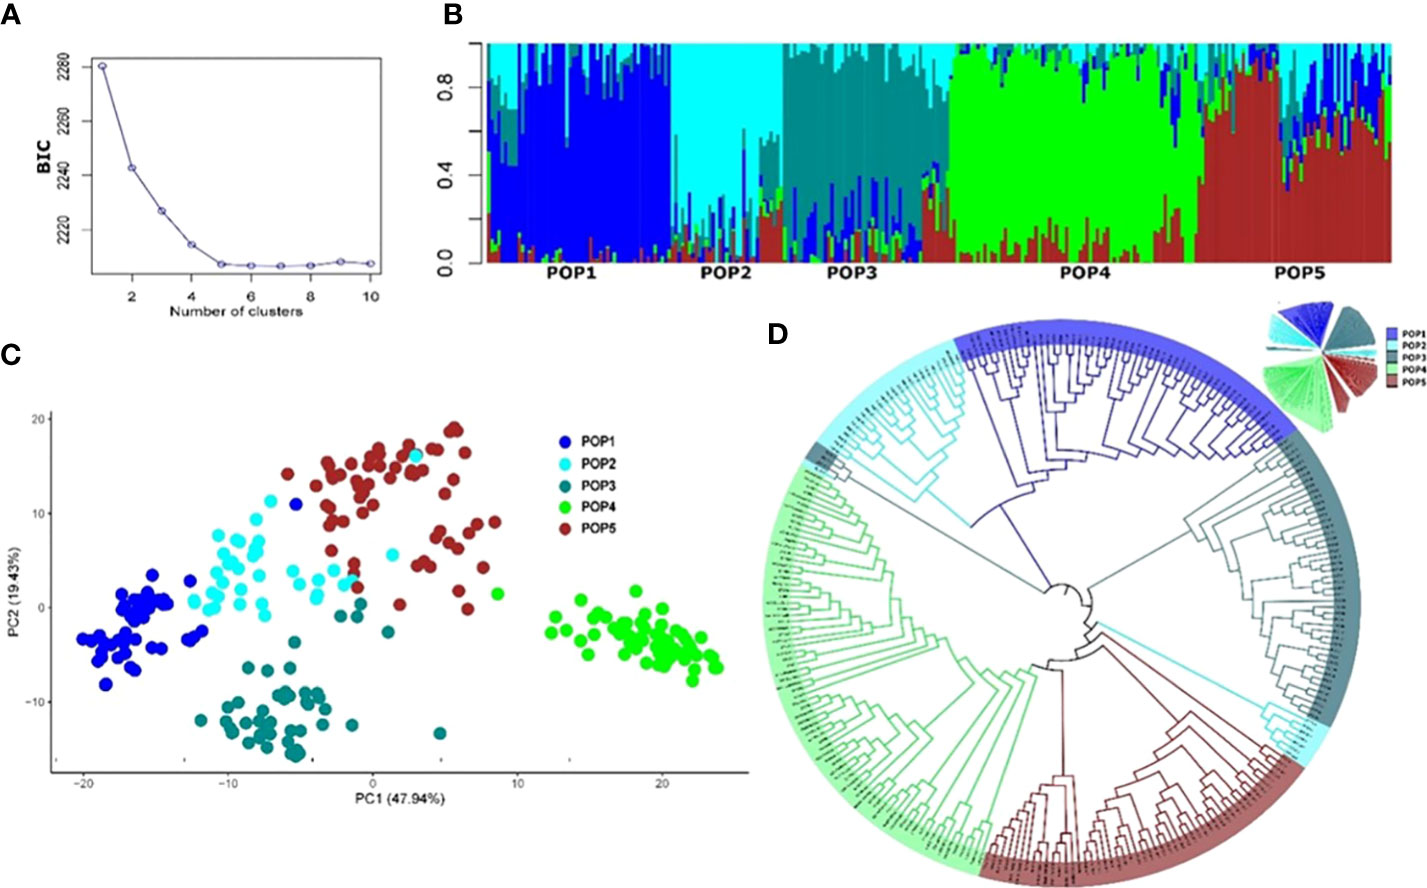
Figure 3 Population structure of the 265 durum wheat lines based on 13,504 SNP markers. (A) Cross-validation error showing the likely appropriate number of populations K to be 5. (B) Population structure based on genetic admixture for K = 5, where each bar represents a single line and the colored segments within each bar reflect the proportional contributions of each subgroup to that line. (C) Principal component analysis (PCA) plot of the first two principal components (PCs). Percentages in brackets indicate the variance explained by the PCs. (D) Topological view of the neighbor-joining phylogenetic tree.
3.3 Marker-trait associations
For GWAS analysis, we performed and compared several single and multi-locus models. The single-locus MLM detected a total of 204 QTNs for FHB-related traits (INC, SEV, FDK, and DON), 245 QTNs for agro-morphological traits (PH, HD/AD, and MAT), and 31 QTNs for quality traits (YP and PRO) (Supplementary Table S3), based on individual environment and across environment BLUPs. For FHB resistance-related traits, the QTNs identified were distributed on all 14 chromosomes. For the MLM, the Q–Q plots illustrating the associations observed between SNPs and FHB resistance and related agro-morphological traits compared to expected associations after accounting for population structure and kinship relationships are presented in Supplementary Figure S3. The multi-locus models captured 288, 144, and 26 QTNs for FHB resistance, agro-morphological, and quality traits, respectively (Supplementary Table S3).
In total, 42 QTNs for FHB, 24 for agro-morphological, and six for quality traits were detected by two or more methods and explained greater than 15% of the phenotypic variation (Supplementary Tables S4, S5). Among the six ML-GWAS models used in our analysis, the ISIS EM-BLASSO model identified 93 QTNs, while FASTmrEMMA detected the lowest number of QTNs (37) for all the traits (Supplementary Table S3). We further grouped the 42 FHB QTNs into 31 QTL (Supplementary Table S4) based on the genome-wide LD of the panel (Supplementary Figure S4). Of these, QFhb-1A.1, QFhb-2B.4, QFhb-3B.1, QFhb-3B.2 QFhb-4B.1, QFhb-5A, QFhb-6B.3, and QFhb-7B.2 were associated with QTNs identified by BLUP values and/or from GH screening (Table 1).
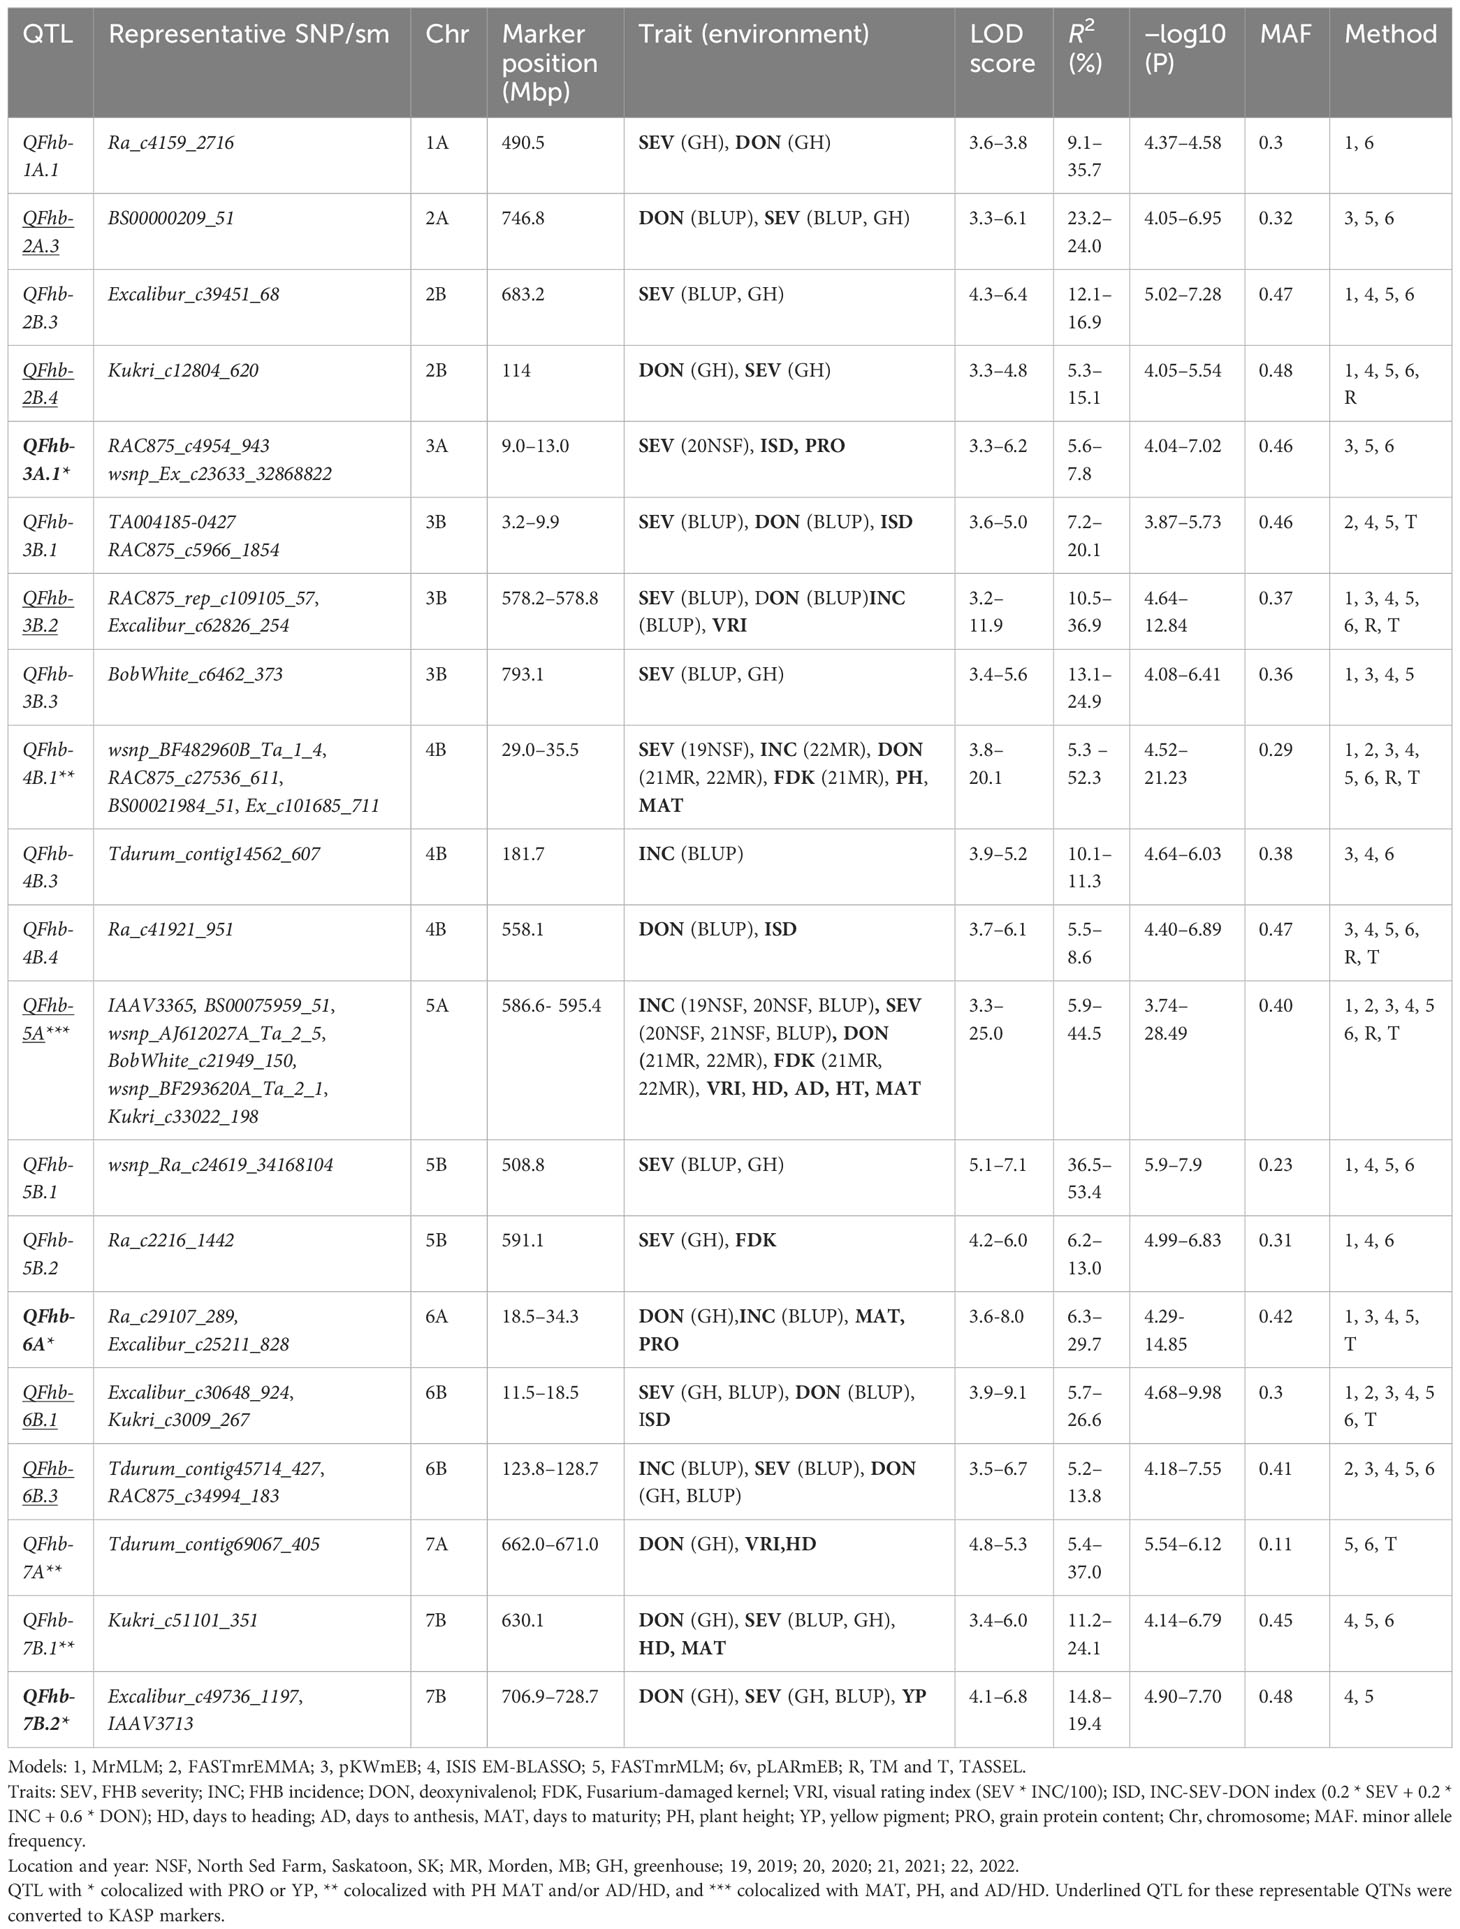
Table 1 Marker–trait associations detected by two or more GWAS models for FHB resistance and related traits using BLUP/field and GH data.
QTNs for FHB SEV, INC, and DON that were detected in multiple environments with multiple models are presented in Table 1 and Supplementary Table S4. Most agro-morphology-related trait-associated QTNs were consistent with the position of FHB QTL QFhb-4B.1 and QFhb-5A (Table 1; Supplementary Table S5). QFhb-3B.1 localized to a similar region of chromosome 3B as that previously reported for Fhb1 (Supplementary Figure S5), which we confirmed by marker analysis (Supplementary Table S1). Contrast analysis revealed that, on average, lines carrying Fhb1 showed reduced SEV, DON, VRI, and ISD (Supplementary Figure S6). QTL QFhb-2A.4 and QFhb-4B.4 were associated only with DON. Similarly, another QTL on chromosome 2B, QFhb-2B.4, was captured by the LD block approach (RTM GWAS) associated with DON with the highest −log10(P) value of 26.58 (Supplementary Figure S7). QFhb-4B.1 and QFhb-5A were detected by eight of the GWAS models and associated with all FHB response and agro-morphological traits, followed by QFhb-7B.2, which was associated with YP as well (Table 1). QFhb-4B.1 represents the most prominent genomic region for PH and MAT, with the highest LOD score (43.0) and phenotypic variance (60.3), followed by QFhb-5A with an LOD score of 25.0 and phenotypic variance of 44.5% for HD, AD, and MAT. QFhb-6A explained the maximum phenotypic variance (29.7%) for PRO (Table 1; Supplementary Tables S4, S5). As an example, the phenotypic variation for VRI based on the representative SNP at the most significant and consistent QTL, QFhb-5A, is presented in Figure 4, and the QTL region that spanned 586–595 Mbp on chromosome 5A is associated with multiple FHB resistance, and agro-morphological traits are shown in Supplementary Figure S8. Significance −log10(p-values) of the association of 13,504 SNPs based on RTM (LdBlock-based method) located on 14 chromosomes with BLUP values for DON, SEV, VRI, HD, MAT, and PH are depicted as Manhattan plot with multi-track Q–Q plots for each case (Supplementary Figure S9).
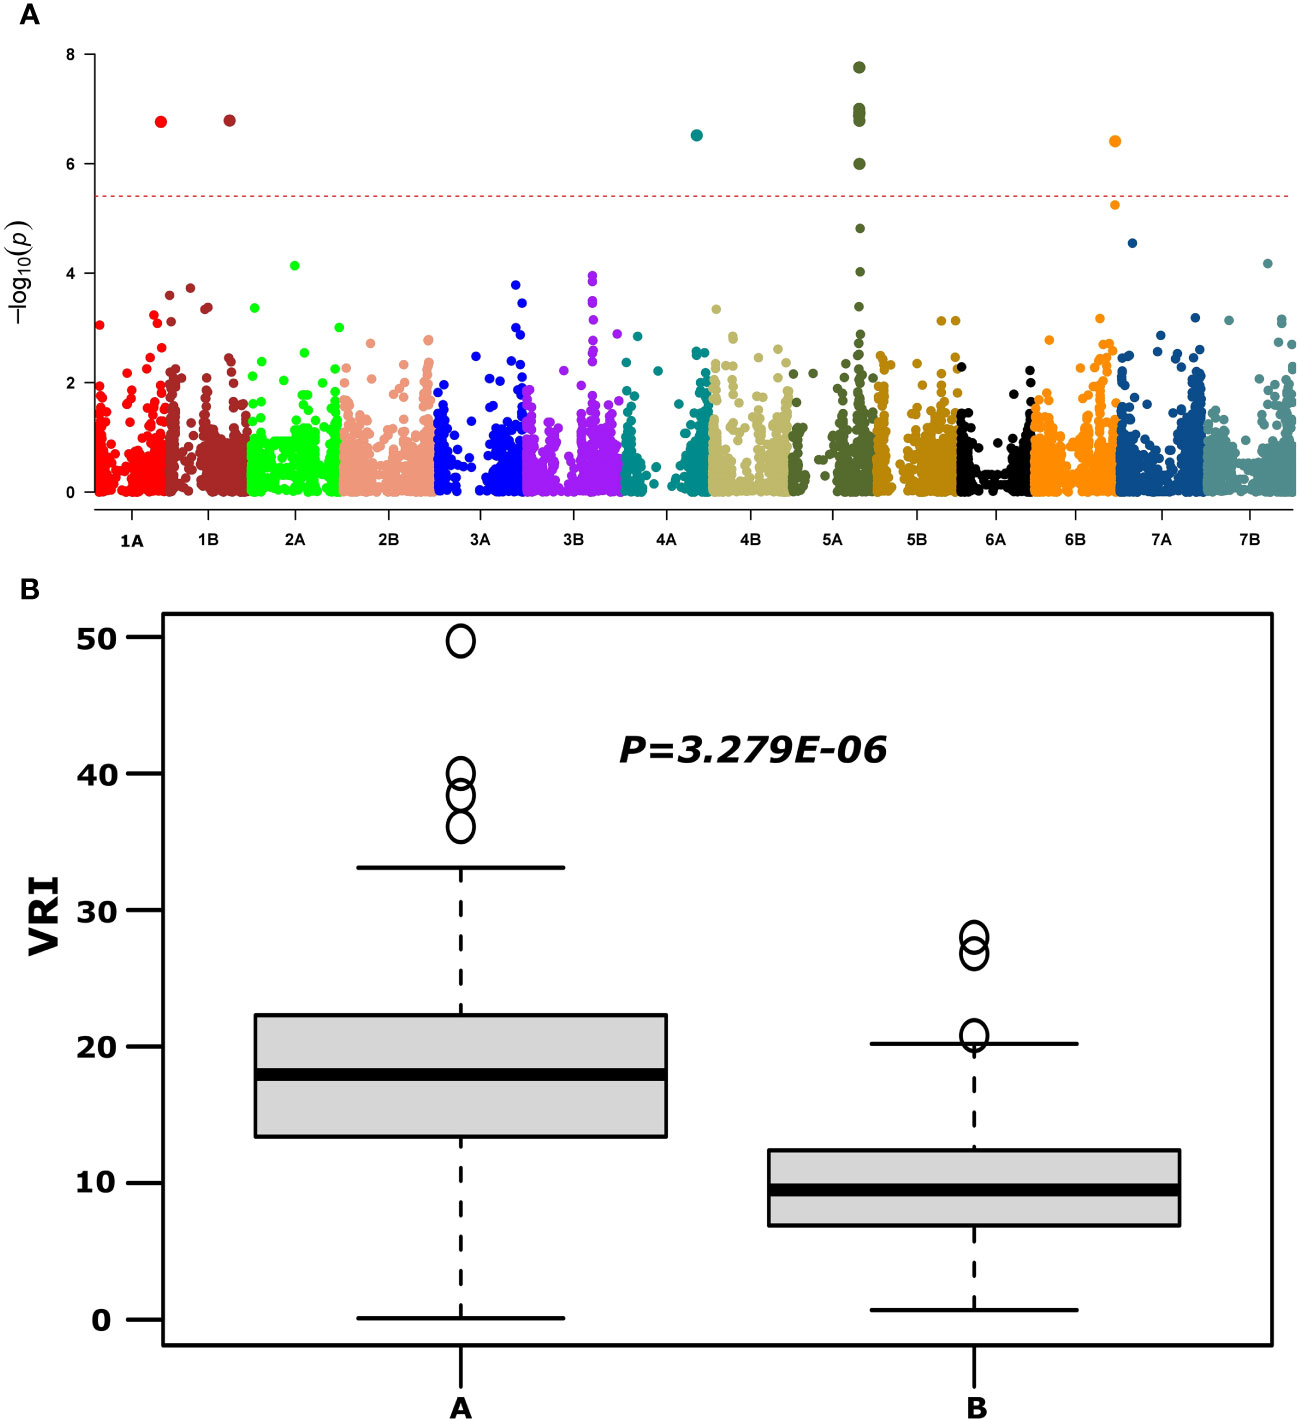
Figure 4 Manhattan plot reveals QTL for FHB visual rating index (VRI) using the MLM model (upper panel, A) and phenotypic variations at large effect QTL QFhb-5A (IAAV3365) for VRI (lower panel, B) based on overall mean.
3.4 Candidate genes in the QTL regions for resistance to DON accumulation
The three loci strongly associated with DON, Ra_c4159_2716 (QFhb-1A.1), Ra_c41921_951 (QFhb-4B.4), and Ra_c29107_289 (QFhb-6A), harbor candidate genes reported to be involved in disease resistance, defense, and stress responses, which were identified within their strong LD range of the associated genomic regions using Chinese Spring reference genome gene annotation (Table 2). The locus Ra_c41921_951 on chromosome 4B associated with DON (FL) and detected by five different GWAS models harbors 11 genes, of which 10 were predicted to play a role in disease resistance; the remaining one is a stomatal opening gene. Two of the genes at this locus were predicted to contribute specifically to wheat stripe rust resistance. Of these, one was TRAESCS4B02G280000, which is an orthologue with genes encoding the SU (VAR)3-9 HOMOLOG 1 protein (SUVH1) that was assumed to regulate phenological traits such as days to flowering, heading, and maturity. Of the 11 genes, most (n = 8) were also predicted to regulate biological processes associated with drought resistance. The other GH_DON-associated locus on chromosome 6A, which was marked by Ra_c29107_289, harbors more than 20 genes that have been predicted to have a role in FHB resistance. This locus contains a higher density of genes (n = 13) that are orthologous with nitrate transporter 2.1 (NRT2.1). The QTL on chromosome 3B harbors UDP-glucuronosyltransferases (UGTs) gene families, which detoxify DON (Table 2).
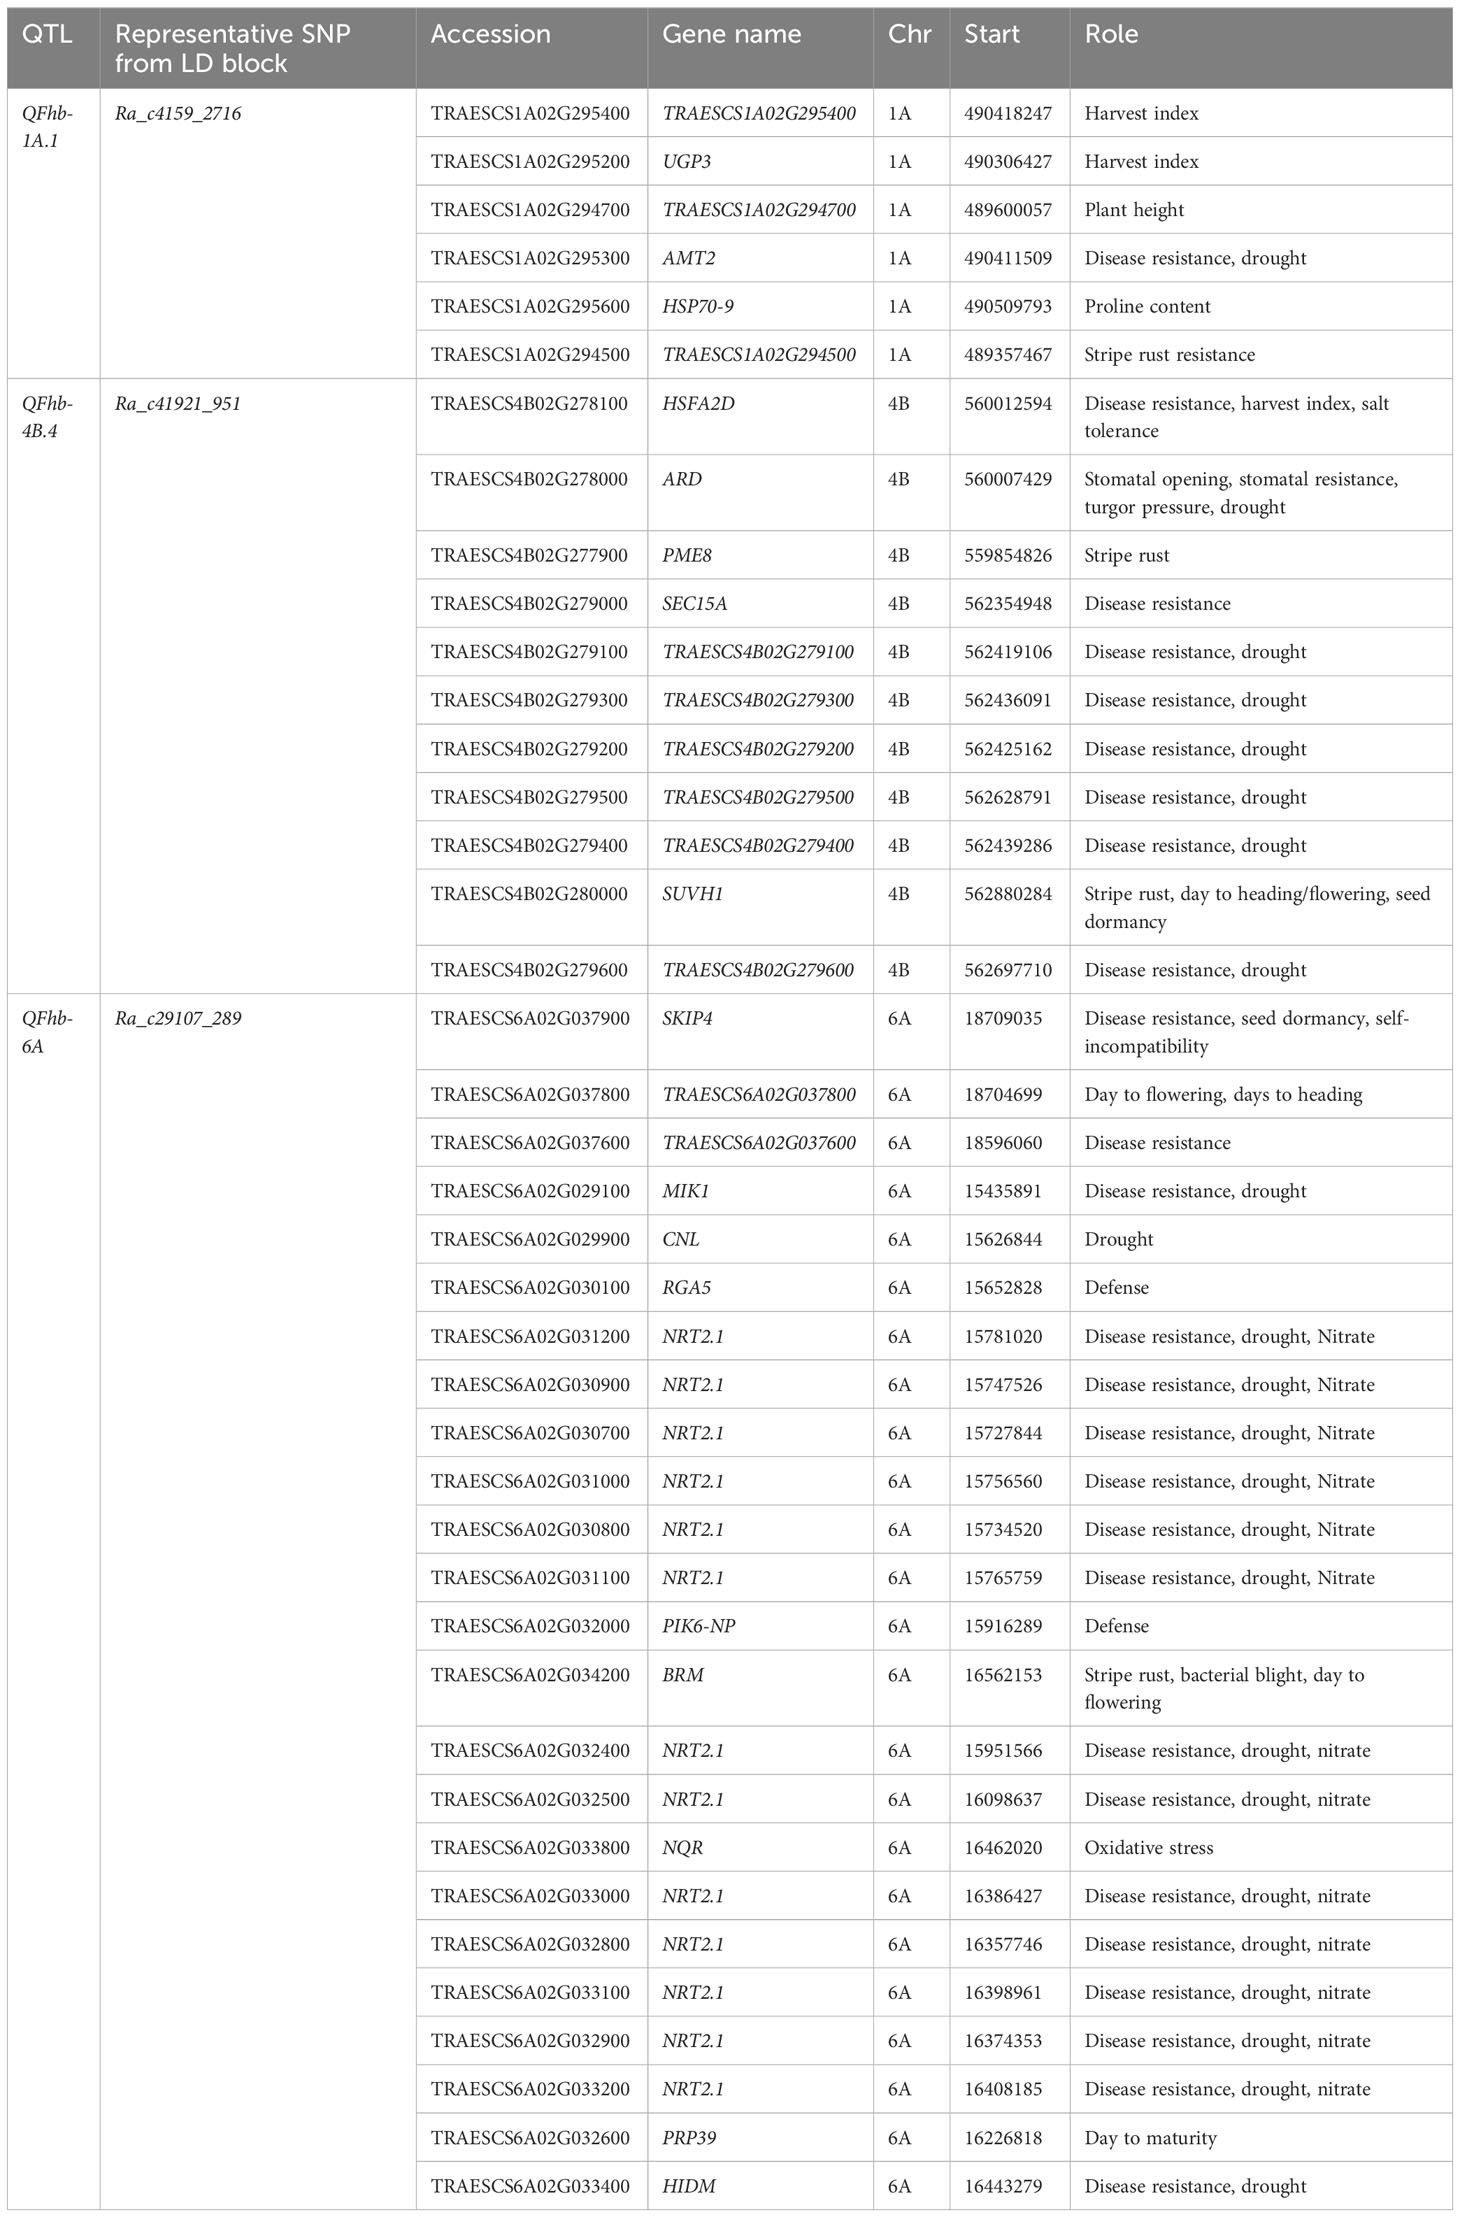
Table 2 Predicted candidate genes detected within the LD block of selected significant QTL with R2 > 15% for resistance to DON accumulation.
3.5 KASP markers for the FHB-associated QTL
For MAS, we converted to KASP marker QTN representing six QTL that were (a) detected in multiple environments and (b) by multiple GWAS models (underlined QTL in Table 1). The markers were robust and clearly clustered lines into two discrete allelic groups (Supplementary Figure S12). These were then scored in the GWAS panel and a subset of the GDP and compared with available 90K data (Supplementary Table S9). The KASP markers developed from Kukri_c12804_620 (QFhb-2B.4) scored two loci, one of which was much more congruent with the 90K data associated with the FHB resistance QTL, thus was used for further analysis (Supplementary Table S9). Analysis of the SNP markers in the GDP panel revealed that the frequency of FHB resistance alleles among the GDP wheat groups (cultivar, landrace, domesticated, and wild emmer) was highly variable, especially for QFhb-5A (Supplementary Figure 6A). Surprisingly, the frequencies of resistance alleles were low in cultivars (Figure 5; Supplementary Table S8). In contrast, wild and domesticated emmers present in the GDP all carried the resistance allele at QFhb-6B.1 (Figure 5A; Supplementary Table S8). Next, we grouped the alleles from each QTL into 58 haplotypes and identified their frequency within the GDP (Supplementary Figure 6B). The majority of the 10 most common resistant haplotypes were concentrated in accessions collected from the Mediterranean and Middle East countries (Figure 5C). The haplotype ID and frequencies for the selected six markers are presented in Supplementary Table S7.
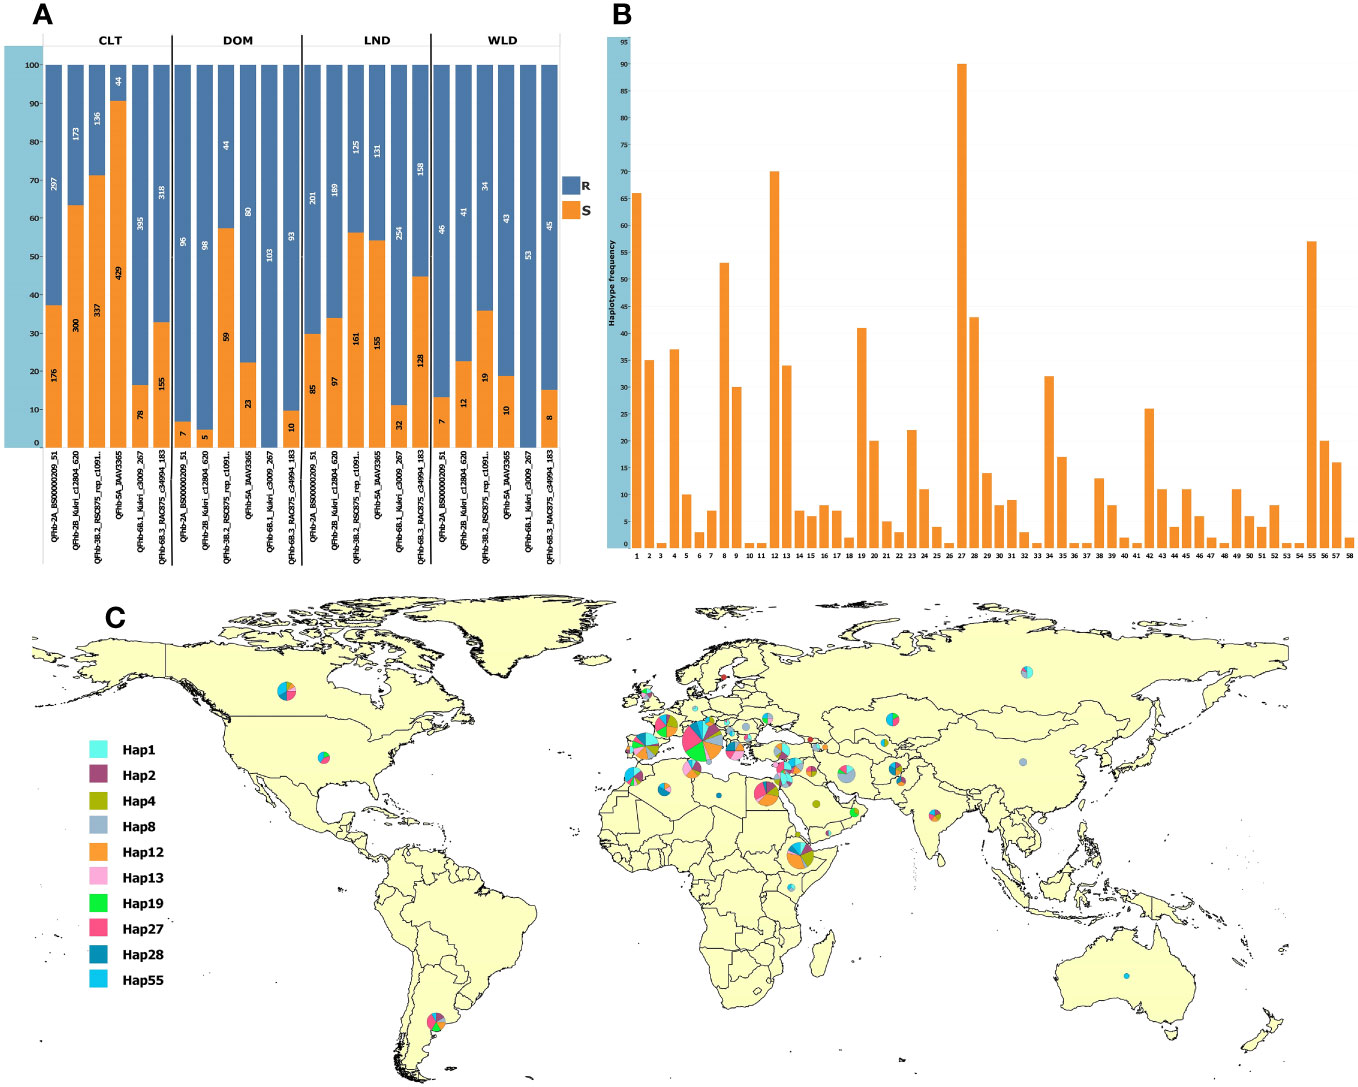
Figure 5 Allelic frequencies in the GDP panel and the geographic distribution of the 10 most frequent haplotypes. (A) Allelic frequencies of the six representative SNPs from the most consistent QTL in cultivars (CLT), domesticated emmer (DOM), landraces (LND), and wild emmer (WLD); the y-axis shows the percentage, and the labels show the absolute frequencies. (B) Haplotype frequencies based on the six loci. (C) Geographic distribution of the top 10 most frequent haplotypes. The haplotype pie chart circle size is proportional to the number of accessions from the corresponding country.
4 Discussion
4.1 Trait heritability and correlation
This study identified QTL as having a major effect on DON accumulation based on both field and GH data, followed by SEV and INC. The heritability for DON was 86%, higher than for SEV (61%) and INC (38%). This is likely because we used the high-throughput fast chromatography-tandem mass spectrometry (FC-MS/MS) method, which is not subject to the same error rate as the visual scoring of FHB incidence and severity in the field (Wang et al., 2022). Similarly, the heritability for SEV was higher in the GH (72%) than in the field (61%). Conversely, He et al. (2016b) found low heritability estimates (0.34) for FHB traits in a point-inoculated trial. This could be because of genotypic differentiation that occurred due to point (GH) and spray (FL) inoculation, where some genotypes reacted differently to the two methods, resulting in a large interaction variance. According to Miedaner et al. (2003) and Schroeder et al. (1963), genotypes that are resistant to spray but susceptible to point inoculation should have type I resistance (resistance to initial infection), whereas genotypes susceptible to spray but resistant to point inoculation should possess type II resistance. Therefore, the QTL that were significant in two or more environments for FHB response should be emphasized for resistance breeding.
The negative correlations between FHB resistance and PH and HD/AD also agreed with previous findings summarized by (Prat et al., 2017; Steiner et al., 2017; Haile et al., 2018). The relationship between HD and PH with FHB was moderate and negative (Figure 2; Supplementary Figure S10), unlike the strong correlation reported by Ruan et al. (2020). Correlations between HD/AD and FHB may have a confounding effect on the association mapping results because these two traits can cause infection escape, and weather conditions such as humidity and temperature during anthesis can significantly affect the success of FHB infection. Therefore, it is vital to score FHB following the HD/AD days for individual germplasm (as used in this study) or correct for these factors in individual nurseries (Nannuru et al., 2022).
DON production plays a significant role in the spread of FHB within a spike (Bai et al., 2002); however, according to Bai et al. (2002), DON production is not necessary for initial infection by the fungus. The correlation between FHB SEV and DON accumulation in the present study was positive, with a coefficient of 0.43 (Figure 2). Reviews by Buerstmayr and Lemmens (2015) and Lemmens et al. (2016) also indicated a positive correlation between FHB severity traits and mycotoxins. However, He et al. (2014) found a negative relationship between FHB index and DON concentration, whereas Bai et al. (2002) reported a complicated relationship between SEV and DON, i.e., cultivars moderately resistant and moderately susceptible to FHB SEV usually had higher DON accumulation than resistant cultivars, but there also were exceptions, especially for cultivars with moderate resistance.
4.2 Marker–trait associations
Depending on the type of trait, applying appropriate model/s and statistical method/s is crucial for reliable results in GWAS. FHB resistance is a polygenic and multifactorial complex trait controlled by multiple small-effect loci. Multi-locus methods are more effective and efficient in capturing such small effect loci than single-locus models (Segura et al., 2012; Xu et al., 2018; Zhang et al., 2019a). However, combining multi- and single-locus methods is recommended to increase detection power and robustness (Li et al., 2018). It is also advantageous to integrate multiple GWAS methods to cross-check results to improve QTL confidence (Zhang et al., 2020).
Previous mapping studies have identified QTL for FHB resistance with minor to moderate effects that were repeatedly detected on 11 of the chromosomes of tetraploid wheat (Otto et al., 2002; Gladysz et al., 2007; Kumar et al., 2007; Ghavami et al., 2011; Buerstmayr et al., 2012; Ruan et al., 2012; Buerstmayr et al., 2013; Miedaner et al., 2017; Ruan et al., 2020). In our study, we identified QTN on all 14 chromosomes. Only minimal variation for resistance to FHB has been reported in cultivated durum wheat (Triticum turgidum ssp. durum); therefore, introgressions of resistance from its relatives (e.g., T. turgidum ssp. dicoccum, T. turgidum ssp. dicoccoides) are a priority and have shown promise, particularly in conferring resistance to FHB SEV (Buerstmayr et al., 2013). In this study, we identified QTN regions, QFhb-1A.1, QFhb-2A.3, QFhb-6A, and QFhb-7B.2, with significant contributions to the phenotypic variation that were identified from exotic sources. Several other studies also identified the main effect of QTL from exotic genetic resources, such as T. carthlicum (Sari et al., 2018), T. turgidum ssp. dicoccoides (Otto et al., 2002; Kumar et al., 2007; Ruan et al., 2012; Buerstmayr et al., 2013), and T. turgidum ssp. dicoccum (Buerstmayr et al., 2012; Zhang et al., 2014), stressing the importance of these germplasm collections as sources of FHB resistance genes to support breeding. The majority of the QTL detected by Ruan et al. (2020), were confirmed in this study, but the QTL effects were higher in this study. One potential explanation is that we tested a larger panel (265 lines) in five field environments and twice in the greenhouse, which may contribute to increased genetic variance and heritability expression.
4.2.1 QTL associated with multiple FHB resistance traits
Responses to different FHB resistance types are generally correlated, and complex biological and physiological mechanisms are involved in the coordination of their expression. Seven of the significant and stable QTL regions were detected for FHB resistance, QFhb-1A.1, QFhb-2B.4, QFhb-3B.1, QFhb-3B.2, Fhb-4B.1, QFhb-5A, and QFhb-6B.3, which affect SEV, INC, and DON. Moreover, QFhb-3A.1 and QFhb-7B.2 were associated with PRO and YP, respectively, in addition to SEV and DON. These QTL were of major importance based on consistency across models, their detection across multiple testing environments, and their association with agro-morphological traits like plant height and heading time.
Due to the colocalization of QTL, QFhb-4B.1, and QFhb-5A with PH and other agro-morphological traits, respectively, we discuss them independently. Simultaneously, we compared the locations of the QTL regions in this study with those of previous studies. For some of the QTL, comparisons across different findings were difficult due to the differences in the marker platforms and the lack of reliability in chromosome assignment among existing consensus maps.
4.2.1.1 Chromosome 1A
The QTL QFhb-1A.1 contributed 35.1% to the phenotypic variance for DON in greenhouse (GH) trials. While we did not detect its effect in field trials, this QTL is coincident with minor QTL for FHB INC, and SEV in Canadian tetraploid germplasm (Ruan et al., 2020), Chinese elite germplasm (Wu et al., 2019), and US soft red winter wheat (Gaire et al., 2021). Our candidate gene analysis revealed that this QTL colocalizes with an ammonium transporter gene (AMT2), a family of proteins transporting ammonium salt and its analogs (Table 2). Several studies have reported that ammonium influences the interaction between plants and pathogens (Jiang et al., 2019); thus, this gene might influence the pathogen’s ability to produce DON.
4.2.1.2 Chromosome 2A
Among the QTL, QFhb-2A.3 was consistent for FHB SEV, as it was detected in five of the testing environments and using across-environment BLUP values. In the same physical region of QFhb-2A.3, Gladysz et al. (2007) identified a QTL for resistance to FHB severity derived from the resistant T. turgidum ssp. dicoccoides accession Mt. Hermon#22 and a minor QTL from a diverse tetraploid population reported by Ruan et al. (2020) in the 762–769 Mb interval. Ruan et al. (2020) reported a QTL 16 Mb distant from QFhb-2A.3, whereas Steiner et al. (2019b) reported a QTL for FHB resistance in the same region. The physical positions of all the loci identified on chromosome 2A were physically distant from the photoperiod gene Ppd-A1, a major gene responsible for flowering time in wheat (Distelfeld et al., 2009). This is fortunate because these QTL are not being influenced by AD or HD, both of which could potentially limit their use in breeding programs.
4.2.1.3 Chromosome 3B
The two 3B QTL, QFhb-3B.1 and QFhb-3B.2, were associated with all FHB response traits in this study. QFhb-3B.1 was identified in a similar region as the 3B QTL identified in most previous studies (Anderson et al., 2001; Liu et al., 2006; Buerstmayr et al., 2009; Arruda et al., 2016; Steiner et al., 2019b; Ruan et al., 2020; Nannuru et al., 2022). This region also corresponds to the physical interval of the major FHB QTL, Fhb1, located on 3BS around 7.6–13.9 Mb (Anderson et al., 2001; Liu et al., 2006). This was expected as durum wheat lines that carry Fhb1 introgressed from Sumai 3 (Prat et al., 2017) were included in our diversity panel, and most showed the favorable allele for this locus. Tetraploid landrace, TG3487, with mean FHB SEV 6.2% (Supplementary Table S11), also carried the favorable loci for QFhb-3B.1 (Supplementary Table S1). Fhb1 is well known for conferring resistance to FHB severity (Anderson et al., 2001; Buerstmayr et al., 2003; Cuthbert et al., 2006)). In this study, we also confirmed the importance of QFhb-3B.1 to reduced DON accumulation in tetraploid wheat. Indeed, resistance to SEV conferred by Fhb1 is associated with its ability to inactivate DON (Schweiger et al., 2016). Similarly, QFhb-3B.2 is a pleiotropic locus associated with SEV, INC, DON, and VRI and contributed up to 36% of the phenotypic variance. It was considered a novel region, as we are not aware of previous studies reporting this region. UDP-glucuronosyltransferases (UGTs) reside in this QTL region; they are DON-responsive genes potentially involved in DON detoxification, are induced by F. graminearum and enhance resistance to FHB in wheat (Zhu et al., 2020; Wu et al., 2022). Plants can use UGTs to chemically modify DON to produce DON-3-glucosides, which are less toxic than DON (Jia et al., 2009). Accordingly, wheat could induce UGTs to respond to infection and detoxify the trichothecene mycotoxins. Interestingly, UGT genes had higher expression levels in FHB-resistant wheat genotypes such as “Sumai 3” (Gottwald et al., 2012).
4.2.1.4 Chromosome 5B
QTL QFhb-5B.1 conferred up to 53% of the phenotypic variation for FHB SEV and DON and was detected around 508.8 Mb, 114.2 Mb away from the vernalization gene VRN-B1 (613.0 Mb). It was not associated with agro-morphological traits. Ruan et al. (2020) identified a QTL for FHB INC and FHB index in the VRN-B1 region (577–694 Mb) that affected HD, supporting that this QTL is indeed unique from that published previously.
4.2.1.5 Chromosome 7B
On 7BL, QFhb-7B.2 was associated with FHB SEV and DON. The allele associated with reduced SEV and DON was also associated with elevated YP, an important end-use quality trait in durum wheat (Pozniak et al., 2007). The association with YP was perhaps not surprising since QFhb-7B.2 is physically located near Psy1-B1, a critical gene in the carotenoid biosynthetic pathway that is partially responsible for the elevated yellow color in the grains of durum wheat (Pozniak et al., 2007). We did notice, however, that this QTL was also associated with a slight reduction in grain protein content. Indeed, DON showed a weak negative correlation with PRO (−0.17) (Figure 2). This is in contrast to previous reports that observed a positive correlation between FHB symptoms and PRO, likely because of the degradation of starchy content by Fusarium spp. and of proteins by the hyphae of the fungus causes the consequent increase in PRO (Boyacioglu et al., 1992). However, given the relatively small negative correlation, any potential loss in PRO is likely to be overcome in breeding programs by simultaneous selection for low DON and higher PRO, as has been done for other negatively correlated traits (Ruan et al., 2021).
4.2.2 QTL regions for FHB response colocalized with agro-morphological traits
Responses to FHB resistance involve complex biological mechanisms and environmental conditions. Wheat is most susceptible to FHB infection during anthesis, particularly if the flowering period coincides with warm, humid conditions that promote disease development (Hooker et al., 2002). For example, HD (or AD) might affect the disease scores when the germplasm differs in maturity, and correlations can be positive or negative, depending on weather conditions in different years. Consequently, FHB traits and flowering time QTL are often associated with mapping studies (Sari et al., 2019; Ruan et al., 2020). In our study, two of the major QTL for FHB responses, QFhb-4B.1 and QFhb-5A, colocalized with all agro-morphological traits (Table 1). In addition, QFhb-2B.1, QFhb-6A, QFhb-7A, and QFhb-7B.1 colocalized with minor PH and/or HD and MAT QTL. So, while these QTL may be useful for targeted selection breeding, their selection may result in undesirable influence on phenotypic expression of flowering time, time to maturity, and plant height. Indeed, taller plants have a greater chance to escape infection, and increased height likely reduces the relative humidity near the wheat spikes, but an excessive plant height is undesirable in commercial durum wheat production.
4.2.2.1 Chromosome 4B
Five QTL regions were identified on Chr 4B (Table 1; Supplementary Tables S4) in our study. Of these, QTL QFhb-4B.4 was solely associated with DON and ISD, an index based on 60% of the DON value (PRCWRT, 2013). In the same interval, a QTL for FHB SEV was previously identified (Nannuru et al., 2022). QFhb-4B.1 (spanning 29.0–35.5 Mb physical interval) was associated with all FHB response traits, including DON. However, this QTL consistently colocalized with major QTL (R2 = 60.3 and LOD = 43.0) for PH and MAT. In a similar QTL region, Nannuru et al. (2022) identified QTL for resistance to FHB severity and DON in the spring European wheat panel using scorings corrected for the confounding effect of PH and HD. Plant height has been reported to be associated with FHB (Mao et al., 2010; Miedaner et al., 2017; Sari et al., 2018; Steiner et al., 2019b; Buerstmayr and Buerstmayr, 2022). The correlation analysis in the present study further confirms these reports, as FHB SEV, INC, and DON were negatively correlated with PH.
Based on our analysis, QFhb-4B.1 localizes to a similar genomic interval as Rht1 (Rht-B1) on chromosome 4B. We confirmed this by assaying the allelic state of Rht-B1 using a robust DNA marker for that gene (Ellis et al., 2002) (Supplementary Table S1). In our diversity panel, the Rht-B1b marker explained 4.1% and 5.7% of the phenotypic variance of the mean FHB SEV and INC, respectively, whereas it explained 49.3% of the mean PH variance. According to previous reports, there is an association between Rht-B1a (GA-sensitive allele), low FHB infection, and tall plant height (He et al., 2016a; Dhariwal et al., 2020; Nannuru et al., 2022). Given the strong influence of Rht-B1b on FHB susceptibility in our population, other dwarfing genes that do not impact the phenotypic expression of resistance should be considered by breeders. One GA-insensitive dwarfing gene, Rht24, may be a suitable alternative because it reduces plant height without influencing FHB (Herter et al., 2018).
4.2.2.2 Chromosome 5A
One of the most stable QTL regions identified in this study was QFhb-5A (Supplementary Figure S8), which spans 586.6–595.4 Mb and was associated with all the FHB response traits considered in the current study. However, this QTL also colocated within the interval of major QTL (R2 = 44.5) for HD/AD and MAT. The physical position of this QTL supports that it is not Fhb5 (Buerstmayr et al., 2009; Xue et al., 2011), which spans a physical interval between 105.4 and 214.2 Mb of chromosome 5A (Ma et al., 2020). However, QFhb-5A overlaps with other QTL reported previously—5A2 (Sari et al., 2020) with similar representative SNPs wsnp_AJ612027A_Ta_2_5 and Kukri_c33022_198, spanning a physical interval of 550.5–556.8 Mb (Sari et al., 2018) and 551.0–556.6 Mb (Sari et al., 2020). Similarly, Ruan et al. (2020) reported a QTL for FHB response and flowering time in the same physical interval (585–591 Mb). QFhb-5A also appears to be congruent with a 5A QTL for FHB resistance derived from European winter wheat cultivars Arina, Pirat, and Apache (Gervais et al., 2003; Paillard et al., 2004; Draeger et al., 2007; Holzapfel et al., 2008; Gaire et al., 2021) and in Chinese spring wheat (Zhu et al., 2020) and European spring wheat (Nannuru et al., 2022).
Flowering time is an adaptive trait of wheat, and it is regulated by a complex pathway to ensure that grain filling occurs under favorable conditions (Royo et al., 2020). Allelic variation at the Vrn1 loci in wheat regulates flowering time, plant height, spike, and spikelet morphology (Li et al., 2019). We determined that Vrn-A1 correlates with the physical interval of QFhb-5A and has been associated with FHB response previously. A similar result is reported by Gervais et al. (2003); He et al. (2016b), and Klahr et al. (2007), where the QTL for the FHB response was likely to be conferred by the pleiotropic effects of Vrn-A1. According to He et al. (2016b), the effect of Vrn-A1 on FHB resistance decreased substantially when DH was used as a covariate. Thus, current evidence supports that QFhb-5A is most likely pleiotropically associated with the effect of Vrn-A1 on flowering time, despite this gene only having a moderate influence on flowering time in durum wheat (Ruan et al., 2020). However, as noted prior, Vrn-A1 does not influence flowering time alone but also regulates spike and spikelet development, and plant height. Our current hypothesis is that QFhb-5A is not associated with HD per se but is likely associated with the pleiotropic effects on spikelet formation. Indeed, spike development impacts type II (resistance to FHB spread in the wheat spike), and mutants of Vrn1 in wheat delay the formation of terminal spikelets and increase the overall number of spikelets per spike (Li et al., 2019). Therefore, caution should be taken when using this QTL in resistance breeding because the mechanism of colocalization between the vernalization genes and FHB resistance is still unclear.
4.3 Exploitation of FHB resistance QTL in durum wheat breeding
We identified QFhb-3B.1 in our diversity panel as an effective QTL to reduce INC and SEV (Supplementary Figure S6), and based on marker data, we confirmed this QTL is congruent with Fhb1 (Supplementary Table S1). Fhb1 is the well-studied QTL for FHB resistance breeding in wheat and provides type II resistance and the ability to detoxify DON (Lemmens et al., 2005). However, the low frequency of resistance alleles in elite wheat breeding parents and concerns about the detrimental effect of linkage drag have limited the utilization of Fhb1 in breeding programs (Brar et al., 2019). In addition, the introgression of Fhb1 into durum wheat has been challenging due to unstable expression in a durum genetic background (Zhao et al., 2018). However, Prat et al. (2017) successfully introgressed Fhb1 from Sumai 3 into two European durum cultivars (Karur and Durobonus) and an Austrian breeding line (SZD1029K), which we included in our diversity panel. We also included several breeding lines in our panel carrying Fhb1 that are derived from introgression efforts (Supplementary Table S1). Allelic variation at Fhb1 was associated with all FHB-related traits except for DON (Supplementary Figure S6), confirming the effectiveness of Fhb1 introgression in some durum backgrounds. Moreover, we identified additional lines in our diversity panel that appear to be carriers of Fhb1 based on KASP marker (Fhb1-TaHRC) data (Supplementary Table S1). However, the effect of Fhb1 varied depending on the durum genetic background and the individual environments, explaining between 7% and 20% of the phenotypic variance, and indeed, some accessions harboring Fhb1 showed moderate susceptibility to FHB in our studies. Previous studies have also demonstrated that Fhb1 is neutral or does not effectively increase resistance to FHB alone in certain genotypes (Pumphrey et al., 2007). The discrepancies observed among Fhb1 introgressions with different durum backgrounds may be due to differences in their respective genetic resistance architectures (Prat et al., 2017) or the presence of susceptibility factors and suppressor genes in its genome (Ghavami et al., 2011) that compromised the expression of FHB resistance in durum wheat. Furthermore, we noted that Fhb1 introgressions showed reduced YP and PRO compared to non-carriers (Supplementary Figure S11).
In Canada, durum wheat cultivars such as Brigade (Clarke et al., 2009), Transcend (Singh et al., 2012), CDC Credence (Pozniak et al., 2020a), CDC Defy (Pozniak et al., 2020b), and AAC Schrader show improved FHB resistance relative to other elite durum wheat cultivars in Canadian production. These were developed by accumulating native resistance genes (Ruan et al., 2020; Sari et al., 2020) through phenotypic selection. Several Canadian durum wheat cultivars and advanced breeding lines—for example, Brigade, DT1021, DT696, Transcend, and DT2004—carry four favorable alleles for reduced DON accumulation. Therefore, these cultivars and breeding lines are a useful platform for stacking additional FHB resistance QTL (including Fhb1), which should result in further improvements in FHB resistance.
Because the QTL QFhb-2A.3, QFhb-2B.4, QFhb-3B.2, QFhb-6B.1, and QFhb-6B.3 were not associated with the agro-morphological traits, these are likely a higher priority for immediate use in durum wheat breeding programs. Lines with resistance alleles at these QTL (ABAAA haplotype, Figure 6) showed relatively less mean FHB VRI and DON accumulation, whereas those lacking the resistance alleles showed high FHB SEV and more DON accumulation (Figure 6). Therefore, these lines carrying favorable haplotypes (such as ABAAA) could be good sources for FHB resistance breeding.
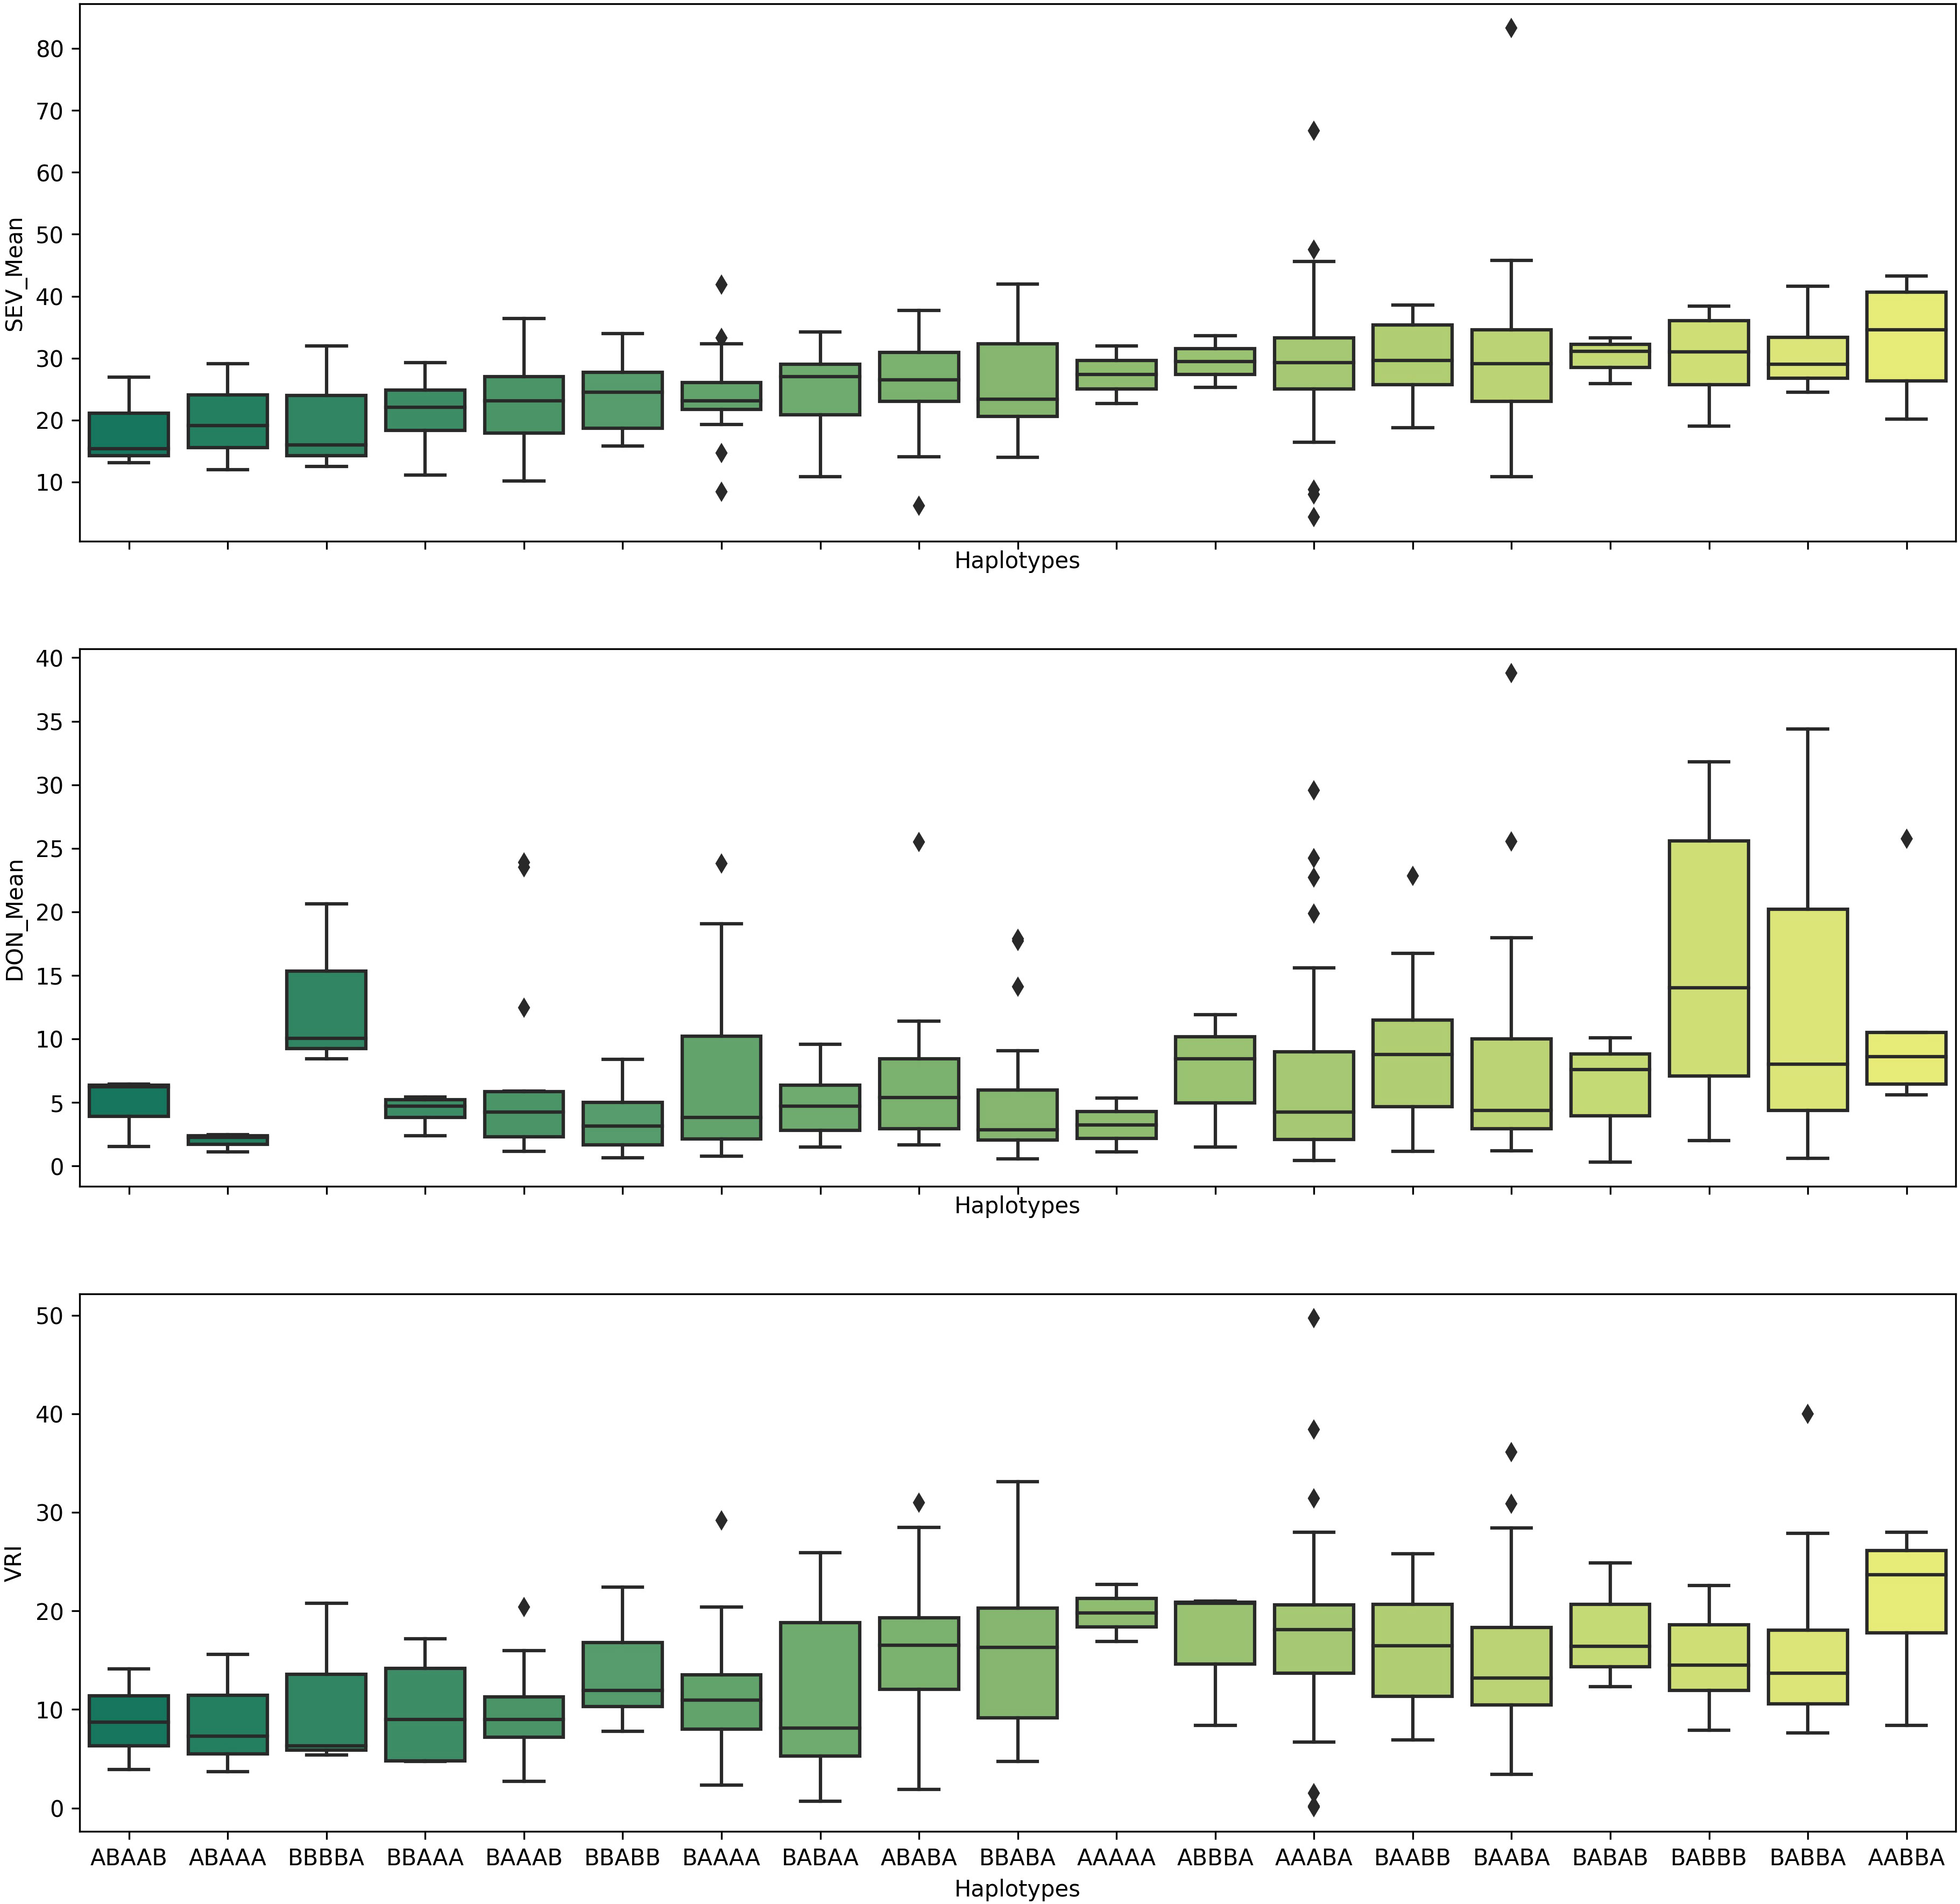
Figure 6 Pyramiding effects of QFhb-2A.3, QFhb-3B.2, QFhb-6A, QFhb-6B.1, and QFhb-7B.2 provide resistance to FHB SEV, INC, and DON accumulation. SEV, severity (%); INC, incidence (%); DON, deoxynivalenol (ppm).
The GDP is an internationally established diversity panel comprising a wide representation of Triticum turgidum ssp. durum cultivars, modern germplasm, and landraces, along with a selection of emmer (T. turgidum ssp. dicoccum, T. turgidum ssp. dicoccoides) and primitive tetraploid wheats (Mazzucotelli et al., 2020). The panel is publicly available and is recognized by the durum wheat community as a vehicle to drive the discovery of useful alleles and their immediate deployment in breeding activities. To that end, we have developed KASP markers for utility in breeding programs (Supplementary Figure S12; Supplementary Table S9) and used these to characterize the six consistently expressed FHB-trait-associated QTL (see results section 3.5) and to describe their haplotypes in the GDP (Supplementary Table S9). This analysis revealed a relatively low frequency of resistance-associated haplotypes for some of the QTL in cultivated durum wheat, while a higher frequency of resistance alleles was detected in domesticated and wild emmer accessions (Figure 5). This trend of declining frequency of resistant alleles in commercial cultivars may reflect that the selection for other agronomically important traits may have reduced the frequency of FHB resistance in breeding programs. This may not be surprising, since many of the QTL we identified were associated with agro-morphological traits important to regional adaption (heading time, maturity time, plant height). For example, QFhb-5A was strongly associated with FHB resistance but, as we noted above, was associated with HD, AD, HT, and MAT (Table 1). Both HD and MAT must be optimized for regional adaptation and to maximize grain yield potential (Alahmad et al., 2020), and selection for these two traits may have unintendedly reduced the frequency of FHB resistance alleles. At the same time, in a study by Gaire et al. (2021), the accumulation of FHB-resistance loci showed reduced DON but resulted in lower yield potential, highlighting a trade-off between FHB resistance and grain yield.
The wild relatives of wheat are a valuable resource for FHB resistance in wheat, and various studies have identified moderate levels of resistance in the wild (Ruan et al., 2012), cultivated emmer wheat (Ruan et al., 2012; Ruan et al., 2020), and Persian wheat (T. carthlicum; Somers et al., 2006). In our study, the frequency of resistant haplotypes at the six prominent QTL (Supplementary Table S6) was higher in the wild and domesticated emmer accessions from our panel (Supplementary Table S1), supporting their use in breeding. For example, we included several elite progenies of lines from T. carthlicum cv. “Blackbird” (Somers et al., 2006) and T. turgidum ssp. dicoccum TG3487 (Ruan et al., 2012; Ruan et al., 2020). Their progeny (D04X_84_030, D04X_84_033, and D04X_84_104), P48_19, A1200J_101, and A1200K_209, P49_7, and R11_27_1, carried the favorable alleles for the five FHB resistance QTL. Thus, exotic and wild germplasm is an important source of FHB resistance, and we are currently pyramiding the QTL identified from these native sources of resistance. Of course, we are mindful that linkage drag with other important durum traits is a reality when using these materials—as we observed for PRO and YP—but in our experience, these negative associations can be overcome by using a combination of marker-assisted selection, genomic selection, and coselection for FHB-related traits and agronomic performance (Haile et al., 2019).
5 Conclusions
Identifying and utilizing novel QTL and genes for resistance is a continuous and regular challenge in plant breeding to deal with the threats to crop production caused by diseases. Genome-wide association studies are one of the strategies to detect QTL associated with resistance. In this study, by applying ML-GWAS models to a panel of 265 durum wheat cultivars, breeding lines, and experimental populations, we provided comprehensive insight into the molecular genetic basis of FHB resistance and correlated agro-morphological and quality traits. SNPs associated with FHB resistance were identified across the 14 chromosomes. Among the major QTL identified in this study, six QTL regions on chromosomes 2A, 2B, 3B, 5A, and 6B were the most consistent across traits and environments and are recommended for marker-assisted gene stacking. Although most of them are identified in known regions, QFhb-3B.2 associated with FHB SEV, INC, and DON could enhance our understanding and provide new resources for FHB resistance breeding. Stacking the QTL identified in this study and using the lines carrying the resistance alleles will facilitate further genetic improvement of FHB resistance and reduce DON accumulation in durum wheat. However, it is vital to integrate trait associations into breeding decisions, particularly when using QTL such as QFhb.4B.1 and QFhb.5A, which colocalized with multiple agro-morphological traits.
Lastly, based on the results of our and previous studies (Prat et al., 2017; Ruan et al., 2020), Fhb1 is effective in diverse durum backgrounds and in combination with other resistance QTL. Therefore, we suggest that pyramiding Fhb1 with resistance QTL derived from exotic germplasm (T. turgidum ssp. dicoccoides and T. turgidum ssp. dicoccum) could improve FHB resistance in durum wheat. Finally, we have developed robust KASP markers for the six prominent QTL associated with FHB resistance and quantified their haplotypes in the Global Durum Panel. These markers, together with their assessment of the GDP, will be a useful resource to support marker-assisted breeding and/or as main effect markers in genomic selection programs.
Data availability statement
The datasets presented in this study can be found in online repositories. The names of the repository/repositories and accession number(s) can be found in the article/Supplementary Material.
Author contributions
JH and CJP designed the experiments. JH, M-AH, VK, KW, and LW conducted experiments and collected data under the supervision of CP. JH, DS, AN, KW, and HC performed data analysis. JH prepared the manuscript with input from DS and AN. CP, VK, BS, HB, HK, DS, M-AH, LW, and YR reviewed and edited the manuscript. All authors contributed to the article and approved the submitted version.
Funding
The authors acknowledge funding provided by the “4D Wheat: Diversity, Domestication, Discovery and Delivery” project, funded by Genome Canada, Agriculture and Agri-Food Canada, Western Grains Research Foundation, Saskatchewan Ministry of Agriculture, Saskatchewan Wheat Development Commission, Alberta Wheat Commission, Manitoba Crop Alliance, Ontario Research Fund, Viterra, Canadian Agricultural Partnership, and Illumina. We also acknowledge the administrative support of Genome Prairie.
Acknowledgments
The authors are grateful to Dr. Julia Lafferty (Saatzucht Donau GesmbH. & CoKG, Austria) and Agriculture and Agri-food-Canada for providing some of the breeding lines used in this study. The authors acknowledge Ens Jennifer, Lexie Gerl, Xue (Snow) Lin, Ayla Lichtenwald, Madison Kist, Maureen Troesch, Russel Lawrie, Ryan Babonich, Heidi Lazorko, and Eldon Simons for their assistance and technical support.
Conflict of interest
The authors declare that the research was conducted in the absence of any commercial or financial relationships that could be construed as a potential conflict of interest.
Publisher’s note
All claims expressed in this article are solely those of the authors and do not necessarily represent those of their affiliated organizations, or those of the publisher, the editors and the reviewers. Any product that may be evaluated in this article, or claim that may be made by its manufacturer, is not guaranteed or endorsed by the publisher.
Supplementary material
The Supplementary Material for this article can be found online at: https://www.frontiersin.org/articles/10.3389/fpls.2023.1182548/full#supplementary-material
References
Alahmad, S., Kang, Y., Dinglasan, E., Mazzucorelli, E., Voss-Fels, K. P., Avle, J. A., et al. (2020). Adaptive traits to improve durum wheat yield in drought and crown rot environments. Int. J. Mol. Sci. 21 (15), 5260. doi: 10.3390/ijms21155260
Anderson, J. A., Stack, R. W., Liu, S., Waldron, B. L., Fjeld, A. D., Coyne, C., et al. (2001). DNA markers for Fusarium head blight resistance QTLs in two wheat populations. Theor. Appl. Genet. 102, 1164–1168. doi: 10.1007/s001220000509
Arruda, M. P., Lipka, A. E., Brown, P. J., Krill, A. M., Thurber, C., Brown-Guedira, G., et al. (2016). Comparing genomic selection and marker-assisted selection for Fusarium head blight resistance in wheat (Triticum aestivum L.). Mol. Breed. 36, 84. doi: 10.1007/s11032-016-0508-5
Bai, G. H., Desjardins, A. E., Plattner, R. D. (2002). Deoxynivalenol-nonproducing Fusarium graminearum causes initial infection but does not cause disease spread in wheat spikes. Mycopathologia 153, 91–98. doi: 10.1023/A:1014419323550
Benesty, J., Chen, J., Huang, Y., Cohen, I. (2009). “Pearson Correlation Coefficient,” in Noise Reduction in Speech Processing. Eds. Cohen, I., Huang, Y., Chen, J., Benesty, J. (Berlin, Heidelberg: Springer Berlin Heidelberg).
Berners-Lee, M., Kennelly, C., Watson, R., Hewitt, C. N. (2018). Current global food production is sufficient to meet human nutritional needs in 2050 provided there is radical societal adaptation. Elementa: Sci. Anthropocene 6, 52. doi: 10.1525/elementa.310
Boyacioglu, D., Hettiarachchy, N. S., Stack, R. W. (1992). Effect of three systemic fungicides on deoxynivalenol (vomitoxin) production by Fusarium graminearum in wheat. Can. J. Plant Sci. 72, 93–101. doi: 10.4141/cjps92-010
Bradbury, P. J., Zhang, Z., Kroon, D. E., Casstevens, T. M., Ramdoss, Y., Buckler, E. S. (2007). TASSEL: software for association mapping of complex traits in diverse samples. Bioinformatics 23, 2633–2635. doi: 10.1093/bioinformatics/btm308
Brar, G. S., Pozniak, C. J., Kutcher, H. R., Hucl, P. J. (2019). Evaluation of Fusarium head blight resistance genes Fhb1, Fhb2, and Fhb5 introgressed into elite Canadian hard red spring wheats: effect on agronomic and end-use quality traits and implications for breeding. Mol. Breed. 39, 44. doi: 10.1007/s11032-019-0957-8
Buerstmayr, H., Ban, T., Anderson, J. A. (2009). QTL mapping and marker-assisted selection for Fusarium head blight resistance in wheat: a review. Plant Breed. 128, 1–26. doi: 10.1111/j.1439-0523.2008.01550.x
Buerstmayr, M., Alimari, A., Steiner, B., Buerstmayr, H. (2013). Genetic mapping of QTL for resistance to Fusarium head blight spread (type 2 resistance) in a Triticum dicoccoides 9 Triticum durum backcross-derived population. Theor. Appl. Genet. 126, 2825–2834. doi: 10.1007/s00122-013-2174-x
Buerstmayr, M., Buerstmayr, H. (2016). The semidwarfing alleles rht-D1b and rht-B1b show marked differences in their associations with anther-retention in wheat heads and with fusarium head blight susceptibility. Phytopathology® 106, 1544–1552. doi: 10.1094/PHYTO-05-16-0200-R
Buerstmayr, M., Buerstmayr, H. (2022). The effect of the Rht1 haplotype on Fusarium head blight resistance in relation to type and level of background resistance and in combination with Fhb1 and Qfhs.ifa-5A. Theor. Appl. Genet. 135, 1985–1996. doi: 10.1007/s00122-022-04088-x
Buerstmayr, M., Huber, K., Heckmann, J., Steiner, B., Nelson, J. C., Buerstmayr, H. (2012). Mapping of QTL for Fusarium head blight resistance and morphological and developmental traits in three backcross populations derived from Triticum dicoccum × Triticum durum. Theor. Appl. Genet. 125, 1751–1765. doi: 10.1007/s00122-012-1951-2
Buerstmayr, H., Lemmens, M. (2015). Breeding healthy cereals: genetic improvement of Fusarium resistance and consequences for mycotoxins. World Mycotoxin J. 8, 591–602. doi: 10.3920/WMJ2015.1889
Buerstmayr, M., Steiner, B., Buerstmayr, H. (2020). Breeding for Fusarium head blight resistance in wheat—Progress and challenges. Plant Breed. 139, 429–454. doi: 10.1111/pbr.12797
Buerstmayr, H., Stierschneider, M., Steiner, B., Lemmens, M., Griesser, M., Nevo, E., et al. (2003). Variation for resistance to head blight caused by Fusarium graminearum in wild emmer (Triticum dicoccoides) originating from Israel. Euphytica 130, 17–23. doi: 10.1023/A:1022324727780
Canadian Grain Commission (2019). Grain and food safety (600-303 Main Street, Winnipeg, MB R3C 3G8: Canadian Grain Commission).
Carvajal-Yepes, M., Cardwell, K., Nelson, A., Garrett, K. A., Giovani, B., Saunders, D. G. O., et al. (2019). A global surveillance system for crop diseases. Science 364, 1237–1239. doi: 10.1126/science.aaw1572
Clarke, J. M., Knox, R. E., Depauw, R. M., Clarke, F. R., Fernandez, M. R., Mccaig, T. N., et al. (2009). Brigade durum wheat. Can. J. Plant Sci. 89, 505–509. doi: 10.4141/CJPS08168
Cuthbert, P. A., Somers, D. J., Thomas, J., Cloutier, S., Brule-Babel, A. (2006). Fine mapping Fhb1, a major gene controlling fusarium head blight resistance in bread wheat (Triticum aestivum L.). Theor. Appl. Genet. 112, 1465–1472. doi: 10.1007/s00122-006-0249-7
Dhariwal, R., Henriquez, M. A., Hiebert, C., Mccartney, C. A., Randhawa, H. S. (2020). Mapping of major fusarium head blight resistance from Canadian wheat cv. AAC tenacious. Int. J. Mol. Sci. 21, 4497. doi: 10.3390/ijms21124497
Distelfeld, A., Li, C., Dubcovsky, J. (2009). Regulation of flowering in temperate cereals. Curr. Opin. Plant Biol. 12, 178–184. doi: 10.1016/j.pbi.2008.12.010
Draeger, R., Gosman, N., Steed, A., Chandler, E., Thomsett, M., Srinivasachary, et al. (2007). Identification of QTLs for resistance to Fusarium head blight, DON accumulation and associated traits in the winter wheat variety Arina. Theor. Appl. Genet. 115, 617–625. doi: 10.1007/s00122-007-0592-3
Ellis, M., Spielmeyer, W., Gale, K., Rebetzke, G., Richards, R. (2002). "Perfect" markers for the Rht-B1b and Rht-D1b dwarfing genes in wheat. Theor. Appl. Genet. 105 (6–7), 1038–1042. doi: 10.1007/s00122-002-1048-4
FAO. (2009). How to Feed the World in 2050. Available at: https://www.fao.org/fileadmin/templates/wsfs/docs/expert_paper/How_to_Feed_the_World_in_2050.pdf.
Fatima, F., Mccallum, B. D., Pozniak, C. J., Hiebert, C. W., Mccartney, C. A., Fedak, G., et al. (2020). Identification of new leaf rust resistance loci in wheat and wild relatives by array-based SNP genotyping and association genetics. Front. Plant Sci. 11, 583738. doi: 10.3389/fpls.2020.583738
Foroud, N. A., Baines, D., Gagkaeva, T. Y., Thakor, N., Badea, A., Steiner, B., et al. (2019). Trichothecenes in cereal grains – an update. Toxins 11, 634. doi: 10.3390/toxins11110634
Frichot, E., François, O. (2015). LEA: an R package for landscape and ecological association studies. Methods Ecol. Evol. 6, 925–929. doi: 10.1111/2041-210X.12382
Frichot, E., Mathieu, F., Trouillon, T., Bouchard, G., François, O. (2014). Fast and efficient estimation of individual ancestry coefficients. Genetics 196, 973–983. doi: 10.1534/genetics.113.160572
Gaire, R., Brown-Guedira, G., Dong, Y., Ohm, H., Mohammadi, M. (2021). Genome-wide association studies for fusarium head blight resistance and its trade-off with grain yield in soft red winter wheat. Plant Dis. 105, 2435–2444. doi: 10.1094/PDIS-06-20-1361-RE
Gervais, L., Dedryver, F., Morlais, J. Y., Bodusseau, V., Negre, S., Bilous, M., et al. (2003). Mapping of quantitative trait loci for field resistance to Fusarium head blight in an European winter wheat. Theor. And Appl. Genet. 106, 961–970. doi: 10.1007/s00122-002-1160-5
Ghavami, F., Elias, E. M., Mamidi, S., Ansari, O., Sargolzaei, M., Adhikari, T., et al. (2011). Mixed model association mapping for fusarium head blight resistance in Tunisian-derived durum wheat populations. G3: Genes|Genomes|Genetics 1, 209–218. doi: 10.1534/g3.111.000489
Giancaspro, A., Giove, S. L., Zito, D., Blanco, A., Gadaleta, A. (2016). Mapping QTLs for fusarium head blight resistance in an interspecific wheat population. Front. Plant Sci. 7. doi: 10.3389/fpls.2016.01381
Gladysz, C., Lemmens, M., Steiner, B., Buerstmayr, H. (2007). Evaluation and genetic mapping of resistance to Fusarium head blight in Triticum dicoccoides. Israel J. Plant Sci. 55, 263–266. doi: 10.1560/IJPS.55.3-4.263
Gottwald, S., Samans, B., Lück, S., Friedt, W. (2012). Jasmonate and ethylene dependent defence gene expression and suppression of fungal virulence factors: two essential mechanisms of Fusarium head blight resistance in wheat? BMC Genomics 13, 369. doi: 10.1186/1471-2164-13-369
Haile, J. K., N’diaye, A., Clarke, F., Clarke, J., Knox, R., Rutkoski, J., et al. (2018). Genomic selection for grain yield and quality traits in durum wheat. Mol. Breed. 38, 75. doi: 10.1007/s11032-018-0818-x
Haile, J. K., N’diaye, A., Walkowiak, S, Nilsen, K. T., Clarke, J. M., Kutcher, H. R., et al. (2019). Fusarium head blight in durum wheat: recent status, breeding directions, and future research prospects. Phytopathology 109, 1664–1675. doi: 10.1094/phyto-03-19-0095-rvw
Haile, J. K., N’diaye, A., Sari, E., Walkowiak, S., Rutkoski, J. E., Kutcher, H. R., et al. (2020). Potential of genomic selection and integrating “Omics” Data for disease evaluation in wheat. Crop Breed. Genet. Genomics 2, e200016. doi: 10.20900/cbgg20200016
He, X., Lillemo, M., Shi, J., Wu, J., Bjørnstad, Å., Belova, T., et al. (2016b). QTL characterization of fusarium head blight resistance in CIMMYT bread wheat line soru1. PloS One 11, e0158052. doi: 10.1371/journal.pone.0158052
He, J., Meng, S., Zhao, T., Xing, G., Yang, S., Li, Y., et al. (2017). An innovative procedure of genome-wide association analysis fits studies on germplasm population and plant breeding. Theor. Appl. Genet. 130, 2327–2343. doi: 10.1007/s00122-017-2962-9
He, X., Singh, P. K., Dreisigacker, S., Singh, S., Lillemo, M., Duveiller, E. (2016a). Dwarfing genes rht-B1b and rht-D1b are associated with both type I FHB susceptibility and low anther extrusion in two bread wheat populations. PloS One 11, e0162499. doi: 10.1371/journal.pone.0162499
He, X., Singh, P. K., Schlang, N., Duveiller, E., Dreisigacker, S., Payne, T., et al. (2014). Characterization of Chinese wheat germplasm for resistance to Fusarium head blight at CIMMYT, Mexico. Euphytica 195, 383–395. doi: 10.1007/s10681-013-1002-3
Herter, C. P., Ebmeyer, E., Kollers, S., Korzun, V., Leiser, W. L., Würschum, T., et al. (2018). Rht24 reduces height in the winter wheat population ‘Solitär × Bussard’ without adverse effects on Fusarium head blight infection. Theor. Appl. Genet. 131, 1263–1272. doi: 10.1007/s00122-018-3076-8
Holzapfel, J., Voss, H.-H., Miedaner, T., Korzun, V., Häberle, J., Schweizer, G., et al. (2008). Inheritance of resistance to Fusarium head blight in three European winter wheat populations. Theor. Appl. Genet. 117, 1119–1128. doi: 10.1007/s00122-008-0850-z
Hooker, D. C., Schaafsma, A. W., Tamburic-Ilincic, L. (2002). Using weather variables pre- and post-heading to predict deoxynivalenol content in winter wheat. Plant Dis. 86, 611–619. doi: 10.1094/PDIS.2002.86.6.611
Jia, H., Cho, S., Muehlbauer, G. J. (2009). Transcriptome analysis of a wheat near-isogenic line pair carrying fusarium head blight–resistant and –susceptible alleles. Mol. Plant-Microbe Interactions® 22, 1366–1378. doi: 10.1094/MPMI-22-11-1366
Jiang, J., Zhao, J., Duan, W., Tian, S., Wang, X., Zhuang, H., et al. (2019). TaAMT2;3a, a wheat AMT2-type ammonium transporter, facilitates the infection of stripe rust fungus on wheat. BMC Plant Biol. 19, 239. doi: 10.1186/s12870-019-1841-8
Jombart, T. (2008). adegenet: a R package for the multivariate analysis of genetic markers. Bioinformatics 24, 1403–1405. doi: 10.1093/bioinformatics/btn129
Jombart, T., Kamvar, Z. N., Collins, C., Luštrik, R., Beugin, M.-P., Knaus, B. J., et al. (2020). Adegenet: exploratory analysis of genetic and genomic data. Available at: http://adegenet.rforge.r-project.org/.
Kim, S. A., Brossard, M., Roshandel, D., Paterson, A. D., Bull, S. B., Yoo, Y. J. (2019). gpart: human genome partitioning and visualization of high-density SNP data by identifying haplotype blocks. Bioinformatics 35, 4419–4421. doi: 10.1093/bioinformatics/btz308
Klahr, A., Zimmermann, G., Wenzel, G., Mohler, V. (2007). Effects of environment, disease progress, plant height and heading date on the detection of QTLs for resistance to Fusarium head blight in an European winter wheat cross. Euphytica 154, 17–28. doi: 10.1007/s10681-006-9264-7
Kumar, S., Stack, R. W., Friesen, T. L., Faris, J. D. (2007). Identification of a novel fusarium head blight resistance quantitative trait locus on chromosome 7A in tetraploid wheat. Phytopathology 97, 592–597. doi: 10.1094/PHYTO-97-5-0592
Lemmens, M., Scholz, U., Berthiller, F., Dall'asta, C., Koutnik, A., Schuhmacher, R., et al. (2005). The ability to detoxify the mycotoxin deoxynivalenol colocalizes with a major quantitative trait locus for Fusarium head blight resistance in wheat. Mol. Plant Microbe Interact. 18, 1318–1324. doi: 10.1094/MPMI-18-1318
Lemmens, M., Steiner, B., Sulyok, M., Nicholson, P., Mesterhazy, A., Buerstmayr, H. (2016). Masked mycotoxins: does breeding for enhanced Fusarium head blight resistance result in more deoxynivalenol-3-glucoside in new wheat varieties? World Mycotoxin J. 9, 741–754. doi: 10.3920/WMJ2015.2029
Letunic, I., Bork, P. (2016). Interactive tree of life (iTOL) v3: an online tool for the display and annotation of phylogenetic and other trees. Nucleic Acids Res. 44, W242–W245. doi: 10.1093/nar/gkw290
Li, C., Fu, Y., Sun, R., Wang, Y., Wang, Q. (2018). Single-locus and multi-locus genome-wide association studies in the genetic dissection of fiber quality traits in upland cotton (Gossypium hirsutum L.). Front. Plant Sci. 9. doi: 10.3389/fpls.2018.01083
Li, C., Lin, H., Chen, A., Lau, M., Jernstedt, J., Dubcovsky, J. (2019). Wheat VRN1, FUL2 and FUL3 play critical and redundant roles in spikelet development and spike determinacy. Development 146 (14), dev 175398. doi: 10.1242/dev.175398
Liu, S., Zhang, X., Pumphrey, M. O., Stack, R. W., Gill, B. S., Anderson, J. A. (2006). Complex microcolinearity among wheat, rice, and barley revealed by fine mapping of the genomic region harboring a major QTL for resistance to Fusarium head blight in wheat. Funct. Integr. Genomics 6, 83–89. doi: 10.1007/s10142-005-0007-y
Ma, Z., Xie, Q., Li, G., Jia, H., Zhou, J., Kong, Z., et al. (2020). Germplasms, genetics and genomics for better control of disastrous wheat Fusarium head blight. Theor. Appl. Genet. 133, 1541–1568. doi: 10.1007/s00122-019-03525-8
Mao, S.-L., Wei, Y.-M., Cao, W., Lan, X.-J., Yu, M., Chen, Z.-M., et al. (2010). Confirmation of the relationship between plant height and Fusarium head blight resistance in wheat (Triticum aestivum L.) by QTL meta-analysis.
Mazzucotelli, E., Sciara, G., Mastrangelo, A. M., Desiderio, F., Xu, S. S., Faris, J., et al. (2020). The global durum wheat panel (GDP): an international platform to identify and exchange beneficial alleles. Front. Plant Sci. 11, 569905. doi: 10.3389/fpls.2020.569905
Miedaner, T., Moldovan, M., Ittu, M. (2003). Comparison of spray and point inoculation to assess resistance to fusarium head blight in a multienvironment wheat trial. Phytopathology® 93, 1068–1072. doi: 10.1094/PHYTO.2003.93.9.1068
Miedaner, T., Sieber, A.-N., Desaint, H., Buerstmayr, H., Longin, C. F. H., Würschum, T. (2017). The potential of genomic-assisted breeding to improve Fusarium head blight resistance in winter durum wheat. Plant Breed. 136, 610–619. doi: 10.1111/pbr.12515
Mirocha, C. J., Xie, W., Xu, Y., Wilcoxson, R. D., Woodward, R. P., Etebarian, R. H., et al. (1994). Production of trichothecene mycotoxins by Fusarium graminearum and Fusarium culmorum on barley and wheat. Mycopathologia 128, 19–23. doi: 10.1007/BF01104274
Misra, G., Badoni, S., Domingo, C. J., Cuevas, R. P. O., Llorente, C., Mbanjo, E. G. N., et al. (2018). Deciphering the genetic architecture of cooked rice texture. Front. Plant Sci. 9. doi: 10.3389/fpls.2018.01405
Nannuru, V. K. R., Windju, S. S., Belova, T., Dieseth, J. A., Alsheikh, M., Dong, Y., et al. (2022). Genetic architecture of fusarium head blight disease resistance and associated traits in Nordic spring wheat. Theor. Appl. Genet. 135, 2247–2263. doi: 10.1007/s00122-022-04109-9
N’Diaye, A., Haile, J. K., Cory, A. T., Clarke, F. R., Clarke, J. M., Knox, R. E., et al. (2017). Single marker and haplotype-based association analysis of semolina and pasta colour in elite durum wheat breeding lines using a high-density consensus map. PloS One 12, e0170941. doi: 10.1371/journal.pone.0170941
Otto, C. D., Kianian, S. F., Elias, E. M., Stack, R. W., Joppa, L. R. (2002). Genetic dissection of a major Fusarium head blight QTL in tetraploid wheat. Plant Mol. Biol. 48, 625–632. doi: 10.1023/A:1014821929830
Paillard, S., Schnurbusch, T., Tiwari, R., Messmer, M., Winzeler, M., Keller, B., et al. (2004). QTL analysis of resistance to Fusarium head blight in Swiss winter wheat (Triticum aestivum L.). Theor. Appl. Genet. 109, 323–332. doi: 10.1007/s00122-004-1628-6
Peng, Z. S., Su, Z. X., Cheng, K. C. (1999). Characterization of dwarf trait in the tetraptoid wheat landrace, Aiganfanma. Wheat Inf Serv. 89, 7–12.
Pestka, J. J., Smolinski, A. T. (2005). Deoxynivalenol: toxicology and potential effects on humans. J. Toxicol. Environ. Health B Crit. Rev. 8, 39–69. doi: 10.1080/10937400590889458
Pozniak, C. J., Clarke, J. M., Haile, T. A. (2020b). CDC Defy durum wheat. Can. J. Plant Sci. 100 (6), 725–730. doi: 10.1139/cjps-2020-0091
Pozniak, C. J., Clarke, J. M., Haile, J. K., Haile, T. A. (2020a). CDC Credence durum wheat. Can. J. Plant Sci. 100 (6), 720–724. doi: 10.1139/cjps-2020-0092
Pozniak, C. J., Knox, R. E., Clarke, F. R., Clarke, J. M. (2007). Identification of QTL and association of a phytoene synthase gene with endosperm colour in durum wheat. Theor. Appl. Genet. 114, 525–537. doi: 10.1007/s00122-006-0453-5
Prank, M., Kenaley, S. C., Bergstrom, G. C., Acevedo, M., Mahowald, N. M. (2019). Climate change impacts the spread potential of wheat stem rust, a significant crop disease. Environ. Res. Lett. 14, 124053. doi: 10.1088/1748-9326/ab57de
Prat, N., Buerstmayr, M., Steiner, B., Robert, O., Buerstmayr, H. (2014). Current knowledge on resistance to Fusarium head blight in tetraploid wheat. Mol. Breed. 34, 1689–1699. doi: 10.1007/s11032-014-0184-2
Prat, N., Guilbert, C., Prah, U., Wachter, E., Steiner, B., Langin, T., et al. (2017). QTL mapping of Fusarium head blight resistance in three related durum wheat populations. Theor. Appl. Genet. 130, 13–27. doi: 10.1007/s00122-016-2785-0
PRCWRT. (2013). Operating procedures. Prairie grain recommending committee for wheat, rye and triticale operating procedures. Available at: http://www.pgdc.ca/pdfs/wrt/Proposed%20PRCWRT%20OPS%20-%20FINAL%20DRAFT%20-%2027%20Nov%202013%20Updated%205%20December%202015.pdf.
Pumphrey, M. O., Bernardo, R., Anderson, J. A. (2007). Validating the fhb1 QTL for fusarium head blight resistance in near-isogenic wheat lines developed from breeding populations. Crop Sci. 47, 200–206. doi: 10.2135/cropsci2006.03.0206
Ren, W.-L., Wen, Y.-J., Dunwell, J. M., Zhang, Y.-M. (2018). pKWmEB: integration of Kruskal–Wallis test with empirical Bayes under polygenic background control for multi-locus genome-wide association study. Heredity 120, 208–218. doi: 10.1038/s41437-017-0007-4
Royo, C., Dreisigacker, S., Soriano, J. M., Lopes, M. S., Ammar, K., Villegas, D. (2020). Allelic variation at the vernalization response (Vrn-1) and photoperiod sensitivity (Ppd-1) genes and their association with the development of durum wheat landraces and modern cultivars. Front. Plant Sci. 11, 00838. doi: 10.3389/fpls.2020.00838
Ruan, Y., Comeau, A., Langevin, F., Hucl, P., Clarke, J. M., Brule-Babel, A., et al. (2012). Identification of novel QTL for resistance to Fusarium head blight in a tetraploid wheat population. Genome 55, 853–864. doi: 10.1139/gen-2012-0110
Ruan, Y., Zhang, W., Knox, R. E., Berraies, S., Campbell, H. L., Ragupathy, R., et al. (2020). Characterization of the genetic architecture for fusarium head blight resistance in durum wheat: the complex association of resistance, flowering time, and height genes. Front. Plant Sci. 11, 592064. doi: 10.3389/fpls.2020.592064
Ruan, Y., Babonich, R., Clarke, J. M., Hucl, P. J., Clarke, F. R., Knox, R. E., et al. (2021). Differential reaction of hexaploid and tetraploid wheat to Fusarium graminearum chemotypes in a controlled environment. Can. J. Plant Pathol. 43 (5), 760–768. doi: 10.1080/07060661.2021.1907447
Sari, E., Berraies, S., Knox, R. E., Singh, A. K., Ruan, Y., Cuthbert, R. D., et al. (2018). High density genetic mapping of Fusarium head blight resistance QTL in tetraploid wheat. PloS One 13, e0204362. doi: 10.1371/journal.pone.0204362
Sari, E., Cabral, A. L., Polley, B., Tan, Y., Hsueh, E., Konkin, D. J., et al. (2019). Weighted gene co-expression network analysis unveils gene networks associated with the Fusarium head blight resistance in tetraploid wheat. BMC Genomics 20, 925. doi: 10.1186/s12864-019-6161-8
Sari, E., Knox, R. E., Ruan, Y., Henriquez, M. A., Kumar, S., Burt, A. J., et al. (2020). Historic recombination in a durum wheat breeding panel enables high-resolution mapping of Fusarium head blight resistance quantitative trait loci. Sci. Rep. 10, 7567. doi: 10.1038/s41598-020-64399-1
Savary, S., Ficke, A., Aubertot, J.-N., Hollier, C. (2012). Crop losses due to diseases and their implications for global food production losses and food security. Food Secur. 4, 519–537. doi: 10.1007/s12571-012-0200-5
Savary, S., Willocquet, L., Pethybridge, S., Esker, P., Mcroberts, N., Nelson, A. (2019). The global burden of pathogens and pests on major food crops. Nat. Ecol. Evol. 3, 1. doi: 10.1038/s41559-018-0793-y
Schroeder, H. W., Christensen, J. J., Christensen, J. D., Platz-Christensen, J., Schroeder, H. W. (1963). Factors affecting resistance of Wheat to scab caused by Gibberella zeae. Phytopathology 53, 831–838. Available at: https://api.semanticscholar.org/CorpusID:80680493.
Schweiger, W., Steiner, B., Vautrin, S., Nussbaumer, T., Siegwart, G., Zamini, M., et al. (2016). Suppressed recombination and unique candidate genes in the divergent haplotype encoding Fhb1, a major Fusarium head blight resistance locus in wheat. Theor. Appl. Genet. 129, 1607–1623. doi: 10.1007/s00122-016-2727-x
Segura, V., Vilhjálmsson, B. J., Platt, A., Korte, A., Seren, Ü., Long, Q., et al. (2012). An efficient multi-locus mixed-model approach for genome-wide association studies in structured populations. Nat. Genet. 44, 825–830. doi: 10.1038/ng.2314
Sertse, D., You, F. M., Ravichandran, S., Cloutier, S. (2019). The complex genetic architecture of early root and shoot traits in flax revealed by genome-wide association analyses. Front. Plant Sci. 10. doi: 10.3389/fpls.2019.01483
Singh, A. K., Clarke, J. M., Knox, R. E., Depauw, R. M., Mccaig, T. N., Fernandez, M. R., et al. (2012). Transcend durum wheat. Can. J. Plant Sci. 92 (4), 809–813. doi: 10.4141/cjps2011-255
Somers, D. J., Fedak, G., Clarke, J., Cao, W. (2006). Mapping of FHB resistance QTLs in tetraploid wheat. Genome 49 (12), 1586–1593. doi: 10.1139/g06-127
Stack, R. W., McMullen, M. P. (1998). A visual scale to estimate severity of Fusarium head blight in wheat. (Fargo, ND, United States: North Dakota State University Agriculture and University Extension Dept.)
Steiner, B., Buerstmayr, M., Michel, S., Schweiger, W., Lemmens, M., Buerstmayr, H. (2017). Breeding strategies and advances in line selection for Fusarium head blight resistance in wheat. Trop. Plant Pathol. 42, 165–174. doi: 10.1007/s40858-017-0127-7
Steiner, B., Michel, S., Maccaferri, M., Lemmens, M., Tuberosa, R., Buerstmayr, H. (2019b). Exploring and exploiting the genetic variation of Fusarium head blight resistance for genomic-assisted breeding in the elite durum wheat gene pool. Theor. Appl. Genet. 132, 969–988. doi: 10.1007/s00122-018-3253-9
Sun, J., Rutkoski, J. E., Poland, J. A., Crossa, J., Jannink, J. L., Sorrells, M. E. (2017). Multitrait, random regression, or simple repeatability model in high-throughput phenotyping data improve genomic prediction for wheat grain yield. Plant Genome 10 (2). doi: 10.3835/plantgenome2016.11.0111
Tamba, C. L., Ni, Y.-L., Zhang, Y.-M. (2017). Iterative sure independence screening EM-Bayesian LASSO algorithm for multi-locus genome-wide association studies. PloS Comput. Biol. 13, e1005357. doi: 10.1371/journal.pcbi.1005357
Tamba, C. L., Zhang, Y.-M. (2018). A fast mrMLM algorithm for multi-locus genome-wide association studies. bioRxiv, 341784. doi: 10.1101/341784
Wang, S., Wong, D., Forrest, K., Allen, A., Chao, S., Huang, B. E., et al. (2014). Characterization of polyploid wheat genomic diversity using a high-density 90,000 single nucleotide polymorphism array. Plant Biotechnol. J. 12 (6), 787–796. doi: 10.1111/pbi.12183
Wang, S.-B., Feng, J.-Y., Ren, W.-L., Huang, B., Zhou, L., Wen, Y.-J., et al. (2016). Improving power and accuracy of genome-wide association studies via a multi-locus mixed linear model methodology. Sci. Rep. 6, 19444. doi: 10.1038/srep19444
Wang, L., Michel, D., Zhang, W., El-Aneed, A., Fobert, P. R., Ruan, Y., et al. (2022). A high-throughput fast chromatography tandem mass spectrometry (FC-MS/MS) based method for deoxynivalenol (DON) quantification in wheat grain. PhytoFrontiers™ 2 (4), 322–330. doi: 10.1094/PHYTOFR-03-22-0024-TA
Weir, B. S. (1979). Inferences about linkage disequilibrium. Biometrics 35, 235–254. doi: 10.2307/2529947
Wen, Y.-J., Zhang, H., Ni, Y.-L., Huang, B., Zhang, J., Feng, J.-Y., et al. (2017). Methodological implementation of mixed linear models in multi-locus genome-wide association studies. Briefings Bioinf. 19, 700–712. doi: 10.1093/bib/bbw145
Wen, Y.-J., Zhang, H., Ni, Y.-L., Huang, B., Zhang, J., Feng, J.-Y., et al. (2018). Methodological implementation of mixed linear models in multi-locus genome-wide association studies. Briefings Bioinf. 19, 700–712. doi: 10.1093/bib/bbw145
Wu, L., Zhang, Y., He, Y., Jiang, P., Zhang, X., Ma, H. (2019). Genome-wide association mapping of resistance to fusarium head blight spread and deoxynivalenol accumulation in chinese elite wheat germplasm. Phytopathology® 109, 1208–1216. doi: 10.1094/PHYTO-12-18-0484-R
Wu, F., Zhou, Y., Shen, Y., Sun, Z., Li, L., Li, T. (2022). Linking multi-omics to wheat resistance types to fusarium head blight to reveal the underlying mechanisms. Int. J. Mol. Sci. 23, 2280. doi: 10.3390/ijms23042280
Xu, Y., Yang, T., Zhou, Y., Yin, S., Li, P., Liu, J., et al. (2018). Genome-wide association mapping of starch pasting properties in maize using single-locus and multi-locus models. Front. Plant Sci. 9, 1311. doi: 10.3389/fpls.2018.01311
Xue, S., Xu, F., Tang, M., Zhou, Y., Li, G., An, X., et al. (2011). Precise mapping Fhb5, a major QTL conditioning resistance to Fusarium infection in bread wheat (Triticum aestivum L.). Theor. Appl. Genet. 123, 1055–1063.]. doi: 10.1007/s00122-011-1647-z
Zadoks, J. C., Chang, T. T., Konzak, C. F. (1974). A decimal code for the growth stages of cereals. Weed Res. 14, 415–421. doi: 10.1111/j.1365-3180.1974.tb01084.x
Zhang, Q., Axtman, J. E., Faris, J. D., Chao, S., Zhang, Z., Friesen, T. L., et al. (2014). Identification and molecular mapping of quantitative trait loci for Fusarium head blight resistance in emmer and durum wheat using a single nucleotide polymorphism-based linkage map. Mol. Breed. 34, 1677–1687. doi: 10.1007/s11032-014-0180-6
Zhang, J., Feng, J. Y., Ni, Y. L., Wen, Y. J., Niu, Y., Tamba, C. L., et al. (2017). pLARmEB: integration of least angle regression with empirical Bayes for multilocus genome-wide association studies. Heredity (Edinb) 118, 517–524. doi: 10.1038/hdy.2017.8
Zhang, Y.-M., Jia, Z., Dunwell, J. M. (2019a). The applications of new multi-locus GWAS methodologies in the genetic dissection of complex traits. Front. Plant Sci. 10, 100. doi: 10.3389/fpls.2019.00100
Zhang, Y.-M., Jia, Z., Dunwell, J. M. (2019b). Editorial: the applications of new multi-locus GWAS methodologies in the genetic dissection of complex traits. Front. Plant Sci. 10. doi: 10.3389/fpls.2019.00100
Zhang, Y.-W., Tamba, C. L., Wen, Y.-J., Li, P., Ren, W.-L., Ni, Y.-L., et al. (2020). mrMLM v4. 0.2: an R platform for multi-locus genome-wide association studies. Genom. Proteomics Bioinf. 18, 481–487. doi: 10.1016/j.gpb.2020.06.006
Zhao, M., Leng, Y., Chao, S., Xu, S. S., Zhong, S. (2018). Molecular mapping of QTL for Fusarium head blight resistance introgressed into durum wheat. Theor. Appl. Genet. 131, 1939–1951. doi: 10.1007/s00122-018-3124-4
Keywords: durum wheat, FHB resistance, DON, GWAS, multi-locus, GDP, KASP markers
Citation: Haile JK, Sertse D, N’Diaye A, Klymiuk V, Wiebe K, Ruan Y, Chawla HS, Henriquez M-A, Wang L, Kutcher HR, Steiner B, Buerstmayr H and Pozniak CJ (2023) Multi-locus genome-wide association studies reveal the genetic architecture of Fusarium head blight resistance in durum wheat. Front. Plant Sci. 14:1182548. doi: 10.3389/fpls.2023.1182548
Received: 08 March 2023; Accepted: 18 September 2023;
Published: 12 October 2023.
Edited by:
Runsheng Ren, Jiangsu Academy of Agricultural Sciences (JAAS), ChinaReviewed by:
Filippo Maria Bassi, International Center for Agricultural Research in the Dry Areas (ICARDA), MoroccoQin Yang, Northwest A&F University, China
Copyright © 2023 Haile, Sertse, N’Diaye, Klymiuk, Wiebe, Ruan, Chawla, Henriquez, Wang, Kutcher, Steiner, Buerstmayr and Pozniak. This is an open-access article distributed under the terms of the Creative Commons Attribution License (CC BY). The use, distribution or reproduction in other forums is permitted, provided the original author(s) and the copyright owner(s) are credited and that the original publication in this journal is cited, in accordance with accepted academic practice. No use, distribution or reproduction is permitted which does not comply with these terms.
*Correspondence: Jemanesh K. Haile, amVtYW5lc2guaGFpbGVAdXNhc2suY2E=; aGFpbGVqQGNhbm9sYWNvdW5jaWwub3Jn
†Present addresses: Jemanesh K. Haile, Canola Council of Canada, Crop Productionand Innovation, Saskatoon, SK, Canada
Demissew Sertse, Department of Plant Sciences, University of Manitoba, Winnipeg, MB, Canada