 Yue Li
 Qingtao Wang2
 Lihua Hao
- 1School of Earth Science and Engineering, Hebei University of Engineering, Handan, China
- 2School of Landscape and Ecological Engineering, Hebei University of Engineering, Handan, China
- 3Institute of Geographic Sciences and Natural Resources Research, Chinese Academy of Sciences, Beijing, China
- 4School of Water Conservancy and Hydropower, Hebei University of Engineering, Handan, China
The leaf maximum rate of carboxylation (Vcmax) is a key parameter of plant photosynthetic capacity. The accurate estimation of Vcmax is crucial for correctly predicting the carbon flux in the terrestrial carbon cycle. Vcmax is correlated with plant traits including leaf nitrogen (Narea) and leaf photosynthetic pigments. Proxies for leaf chlorophyll (Chlarea) and carotenoid contents (Cararea) need to be explored in different ecosystems. In this study, we evaluated the relationship between leaf maximum rate of carboxylation (scaled to 25°C; Vcmax25) and both leaf Narea and photosynthetic pigments (Chlarea and Cararea) in winter wheat in a farmland ecosystem. Our results showed that Vcmax25 followed the same trends as leaf Chlarea. However, leaf Narea showed smaller dynamic changes before the flowering stage, and there were smaller seasonal variations in leaf Cararea. The correlation between leaf Vcmax25 and leaf Chlarea was the strongest, followed by leaf Cararea and leaf Narea (R2 = 0.69, R2 = 0.47 and R2 = 0.36, respectively). The random forest regression analysis also showed that leaf Chlarea and leaf Cararea were more important than leaf Narea for Vcmax25. The correlation between leaf Vcmax25 and Narea can be weaker since nitrogen allocation is dynamic. The estimation accuracy of the Vcmax25 model based on Narea, Chlarea, and Cararea (R2 = 0.75) was only 0.05 higher than that of the Vcmax25 model based on Chlarea and Cararea (R2 = 0.70). However, the estimation accuracy of the Vcmax25 model based on Chlarea and Cararea (R2 = 0.70) was 0.34 higher than that of the Vcmax25 model based on Narea (R2 = 0.36). These results highlight that leaf photosynthetic pigments can be a predictor for estimating Vcmax25, expanding a new way to estimate spatially continuous Vcmax25 on a regional scale, and to improve model simulation accuracy.
1 Introduction
Farmland ecosystems play an important role in the carbon cycle of terrestrial ecosystems (Robertson et al., 2000). However, the carbon flux of farmland ecosystems is one of the main uncertainties in global terrestrial carbon cycle research and is significantly affected by human activities (Lal, 2001; Bondeau et al., 2007; Taylor et al., 2013). High-quality simulations of the carbon budget of farmland ecosystems are beneficial for future projections of climate change and crop yield (Houborg et al., 2015; Bonan and Doney, 2018). Process-based terrestrial biosphere models (TBMs) are effective tools for estimating changes in the ecosystem carbon budget. However, currently there is still significant uncertainty in simulating the impact of climate change on terrestrial carbon flux (Smith and Dukes, 2012; Anav et al., 2015; Li et al., 2018a). Approximately 90% of carbon and water fluxes in biosphere and atmospheric occur through photosynthesis, and the photosynthetic module is an important part of TBMs (Zhu et al., 2016). Photosynthetic rate is a primary source of uncertainty in terrestrial carbon dynamic modelling because of the lack of in-depth research on photosynthesis and field observation data (Dietze, 2014).
To simulate photosynthetic rate, most TBMs used a kinetic enzyme model based on Farquhar–von Caemmerer–Berry (FvCB) (Farquhar et al., 1980; Jin et al., 2023). The maximum rate of carboxylation (Vcmax) and the maximum rate of electron transport (Jmax) are two key photosynthetic parameters in FvCB model. Vcmax represents the maximum rate of Ribulose‐1,5‐Bisphosphate (RuBP) carboxylation catalyzed by Rubisco (ribulose 1,5-bisphosphate carboxylase/oxygenase) enzyme (Quebbeman and Ramirez, 2016). Jmax is the rate of RuBP regeneration through the electron transport chain (Voncaemmerer and Farquhar, 1981; Sharkey et al., 2007). In process-based models, Vcmax plays a critical role in constraining photosynthetic rates (Lebauer et al., 2013). Previously, Vcmax was assumed to be a fixed value (at the temperature of 25°C; Vcmax25), which varied with plant functional type (PFT) in process-based models (Houborg et al., 2013; Zhang et al., 2014). Nonetheless, there are seasonal variations for Vcmax25 (Grassi et al., 2005; Medvigy et al., 2013; Alton, 2017; Croft et al., 2017). Even for the same PFT, the difference between species is great (Dillen et al., 2012; Croft et al., 2017). Previous studies have typically used leaf nitrogen content (N) to model the photosynthetic capacity to incorporate spatiotemporal changes in Vcmax25 (Kattge et al., 2009; Walker et al., 2014). However, it is not possible to accurately retrieve leaf nitrogen content based on remote sensing data (Knyazikhin et al., 2013). Additionally, a relationship between leaf N and Vcmax25 cannot be applied at large scales or to different PFTs because Rubisco-N, rather than total leaf nitrogen (photosynthetic and nonphotosynthetic nitrogen pools), is more related to Vcmax25 (Croft et al., 2017; Onoda et al., 2017; Effah et al., 2023). Nonphotosynthetic N pools can complicate the relationships between leaf Vcmax25 and leaf N.
In recent years, leaf chlorophyll content has been retrieved relatively accurately via remote sensing (Croft et al., 2013), which plays a crucial role in capturing light energy to drive photosynthetic reactions (Yang et al., 2014; Croft et al., 2020; Huang et al., 2023). Leaf chlorophyll can effectively eliminate the influence of nonphotosynthetic N, which refers to changes in the photosynthetic active N pool (Croft et al., 2017). Leaf chlorophyll contents have been adopted to represent photosynthetic capacity in some studies (Houborg et al., 2015; Croft et al., 2017). In farmland ecosystems, Houborg et al. (2013) adopted an intermediate variable (leaf N) to demonstrate a semi- empirical relationship between the leaf Vcmax25 and chlorophyll content. In temperate deciduous forests, Croft et al. (2017) found a direct correlation between leafVcmax25 and leaf Chlarea. Luo et al. (2018) incorporated Chlleaf into terrestrial biosphere models to constrain Vcmax25 based on the relationship between Vcmax25 and Chlleaf from the work of Croft et al. (2017), and improved the temporal correlations between the measured and the estimated fluxes in a temperate deciduous forest. Strong correlations between the field-measured leaf chlorophyll content and Vcmax25 have been reported in various PFTs (Qian et al., 2019; Lu et al., 2020; Wang et al., 2020; Qian et al., 2021; Lu et al., 2022; Liu et al., 2023b). Recent studies have found that leaf carotenoid, another major photosynthetic pigment, can improve the estimation precision for Vcmax25 based on leaf Chlarea. Leaf carotenoid content increases the capability of phenological monitoring, particularly in areas where seasonal variations in leaf chlorophyll content are not obvious (Wong et al., 2019). The functional relationship between the photosynthetic pigments (chlorophyll and carotenoid) and Vcmax25 plays an important role in regional model simulations (Croft and Chen, 2018; Luo et al., 2018; Luo et al., 2019). Therefore, leaf chlorophyll and carotenoid contents should be incorporated into the Vcmax25 model to improve the accuracy of TBMs in simulating C dynamics (Luo et al., 2019). However, the relationships between leaf pigment content (especially leaf carotenoid content) and Vcmax25are still unclear. A large-scale spatial mapping of Vcmax25 requires understanding how these relationships change in different PFTs.
In this study, we estimated the relationships between Vcmax25 with leaf nitrogen and leaf pigments (chlorophyll and carotenoid) in a farmland ecosystem. Photosynthesis response curves, leaf nitrogen and leaf pigment content (chlorophyll and carotenoid contents) were observed at Yucheng (YC) Ecological Station during the 2021. We also investigated the correlations between Vcmax25 with leaf nitrogen, chlorophyll and carotenoid contents in a farmland ecosystem. We also analyzed the relationships among these driving variables associated with Vcmax25 and assessed their relative importance.
2 Materials and methods
2.1 Field site description
We carried out field experiments in Yucheng, Shandong Province, China (36°57′ N,116°38′ E). The station is a wheat producing area in China, which located in a warm temperate zone. The annual average temperature and precipitation are 13.1°C and 610 mm, respectively. The average temperature in January is -3°C, and the average temperature in July is 26.9°C. Precipitation occurs mainly from June to August, accounting for 69.1% of the total annual precipitation and shows a pattern of spring drought and summer floods (Zhu et al., 2020). The tidal soil is the main soil type in this area. The PH value is 8.0 and the soil organic matter content is 15.0 g kg-1. Mass fraction of soil total nitrogen is 0.64 g kg-1 (Hga et al., 2020).
2.2 Measurements of CO2 response curve
Leaf gas exchange in winter wheat was measured in a 10 × 10m subset area within a larger field. We conducted winter wheat observation experiment from day of the year (DOY) 92 (April 2) to 147 (May 27) in 2021. Leaf samples were randomly selected approximately once every seven days (Table 1). Three to four winter wheat leaf samples were collected weekly during the 2021 growing season. The CO2 response curves for leaves in winter wheat were measured by a portable gas‐exchange system (Li 6400; Li‐Cor, Inc., Lincoln, NE, USA).
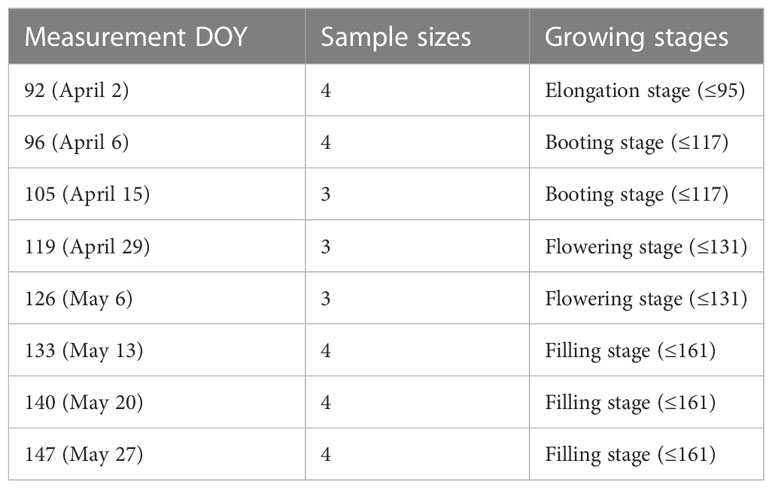
Table 1 Leaf measurements stages and sample sizes of winter wheat at YC site in 2021.
CO2 response curves were observed under saturated light conditions. It took about 40 minutes to observe CO2 response curves. Adjust the photosynthetic photon flux density (PPFD) to 1,500 μmol m−2 s−1 (saturated light). The flow rate was maintained at 500 mmol s-1, and the relative humidity was set in the range of 40–80% during the measurement period. The air CO2 concentrations (Ca) gradients are 380, 300, 200, 100, 50, 380, 600, 800, 1,000, and 1,200 μmol CO2 mol−1 air. Leaf samples were acclimated in a 2 × 3 cm2 leaf cuvette for 20 min at a temperature of 25°C and a CO2 concentration of 380 μmol CO2 mol−1 before measuring CO2 response curves. Vcmax and Jmax values were estimated by an Excel tool (www.landflux.org/Tools.php) (Ethier and Livingston, 2004). Arrhenius equation (Equation 1 and Table 2) was used in our study to normalize Vcmax and Jmax to Vcmax25 and Jmax25 (Sharkey et al., 2007; Sharkey, 2016). The net photosynthetic rate (Asat) was recorded at a PPFD of 1,500 μmol m−2 s−1 and a CO2 concentration of 380 µmol mol-1.
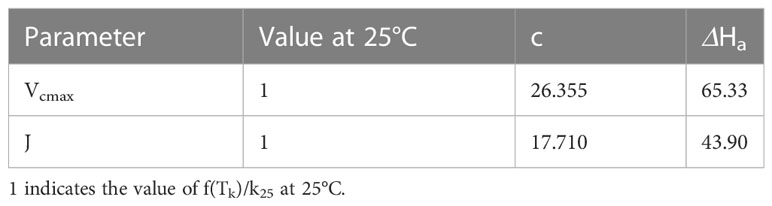
Table 2 Parameters values referring to the temperature responses of leaf photosynthetic capacity.
where k25 and f(Tk) were, respectively, the values at 25°C and leaf surface temperature. c was a scaling constant (Table 2). ΔHa referred to the activation energy. R was the molar gas constant (0.008314 kJ mol-1 K-1). Tk represented the absolute leaf temperature.
2.3 Leaf biochemistry measurements
We conducted leaf biochemical analyses (leaf nitrogen content, Narea; leaf chlorophyll content, Chlarea; and leaf carotenoid content, Cararea) on the same day as leaf A/Ci curves observations. The leaves of winter wheat were sampled from the same locations as for the A/Ci curves observations. For leaf photosynthetic pigment (chlorophyll and carotenoid) and nitrogen analyses, leaf samples were immediately packed in paper bags and were sent to chemistry laboratory. Fresh leaf weight was also recorded in chemistry laboratory. The leaf photosynthetic pigments were extracted using 95% ethanol. A Shimadzu UV-2600 spectrophotometer was used to calculate both leaf chlorophyll and carotenoid contents by measuring the absorbance at 665, 649, and 470 nm (Fargasova and Molnarova, 2010). We used the same leaves as those measured to determine the leaf photosynthetic pigments to calculate leaf nitrogen content. Dry the leaf samples at 80°C for 48 hours until a constant weight. Specific leaf area (SLA) was determined by leaf dry weights and leaf area. We ground the dried leaves into powder by a mixer mill (MM400, RETSCH, Germany). A Vario MAX CN elemental analyzer (Elementar Analyzer system, Hanau, Germany) was used to record leaf nitrogen content.
Fractions of leaf N allocated to photosynthetic components, i.e., active Rubisco (PR), bioenergetics pools (PB) and light-harvesting components (PL), were determined based on Vcmax, Jmax and leaf chlorophyll content, according to the equations reported by Niinemets and Tenhunen (1997).
where MA referred to dry leaf mass per unit area (g m-2). Cc was leaf chlorophyll content (mmol g-1). Nmass represented nitrogen content per dry leaf mass (g g-1). The CB value was 2.15 mmol g-1. The values of Vcr and Jmc were 20.5 µmol CO2 (g Rubisco)-1 s-1 and 156 µmol electrons (µmol cyt f)-1 s-1 at the temperature of 25°C, respectively (Niinemets et al., 1998).
2.4 Data analysis
In the correlation analyses, we used Pearson’s correlation coefficients to demonstrate the linear correlation strength between two variables. Pearson correlation coefficient, also known as the Pearson product-moment correlation coefficient, is represented by R in this paper. The following function was used to calculate R:
where n is the sample size, and R is between -1 and +1. The larger the absolute value of R, the stronger the correlation. There may be a positive (R>0) or negative (R<0) correlation between two variables.
The relationships between leaf nitrogen content and leaf photosynthetic pigments (chlorophyll and carotenoid contents) were evaluated by simple linear regressions. We used the statistical package in Origin Pro 9.0 to conduct simple linear regressions. Analysis of variance (ANOVA) was adopted to evaluate the significance of the regression equations. The statistical significance of tests was set at 0.05. The prediction variables, leading to changes in Vcmax25, included leaf nitrogen, chlorophyll, carotenoid, and SLA. We adopted random forest regression analysis (Breiman, 2001) to discern the amount of changes in Vcmax25. The relative importance of each predictor was evaluated by random forest regression analysis (Delgado-Baquerizo et al., 2017), which can resolve the multicollinearity problems between prediction variables. The percentage increase in the mean square error (%IncMSE) indicates the influence of replacing a predictor with a random variable on the predicted outcome, which represents the effect of predictors on the dependent variable. the original variable was more important when the random variable changed the original variance significantly.Therefore, the higher the %IncMSEof predictor, the more importance it is. Random forest package (randomForest) in R was used in our study to perform the random forest regression (http://www.r-project.org/). Multiple linear regression models were constructed to explore the effects of leaf nitrogen and photosynthetic pigments (chlorophyll and carotenoid) on variations in Vcmax25. The performances of the Vcmax25 models were estimated using the coefficient of determination (R2) between different leaf trait variables. We used SPSS® version 17.0 (SPSS Inc. Chicago, IL, USA) to perform multiple linear regression analysis in our study.
3 Results
3.1 Seasonal variations in leaf photosynthetic parameters and biochemical parameters
Winter wheat showed large temporal variations in leaf photosynthetic rate and Vcmax25 in 2021. At the elongation and booting stages, the leaf Asat and Vcmax25 increased gradually before the flowering stage (on average, 42% and 62% higher on DOY 126 than on DOY 92, respectively), reaching a peak of 28.63 μmol m-2 s-1 and 133.46 μmol m-2 s-1, respectively, at the flowering stage. Asat and Vcmax25 then declined rapidly during the filling stage (on average, 79% and 190% lower on DOY 147 than on DOY 126, respectively) (Figures 1A, C). Temporal variations in leaf Jmax25 and Vcmax25 were consistent (Figure 1C). Leaf chlorophyll content had a similar temporal variation to Vcmax25, which gradually reached its peak at the flowering stage (on average, 68% higher on DOY 126 than on DOY 92) and rapidly declined at the filling stage (on average, 99% lower on DOY 147 than on DOY 126) (Figure 1B). Leaf Asat and photosynthetic parameters appeared to follow the trends of leaf chlorophyll content. However, there were some differences in the seasonal patterns of leaf chlorophyll, nitrogen, and carotenoid contents. Leaf nitrogen content showed smaller dynamic changes before the flowering stage than leaf Chlarea (on average, 26% higher on DOY 126 than on DOY 92) and then declined rapidly at the late stage (on average, 83% lower on DOY 147 than on DOY 126) (Figure 1A). The peak value of leaf Cararea was, on average, 48% higher than that of Cararea on DOY 92. There were minor changes in leaf Cararea after the flowering stage (on average, 33% lower on DOY 147 than on DOY 126) (Figure 1B). Therefore, smaller seasonal changes were showed in leaf Cararea compared to leaf Chlarea in winter wheat, particularly after the flowering stage.
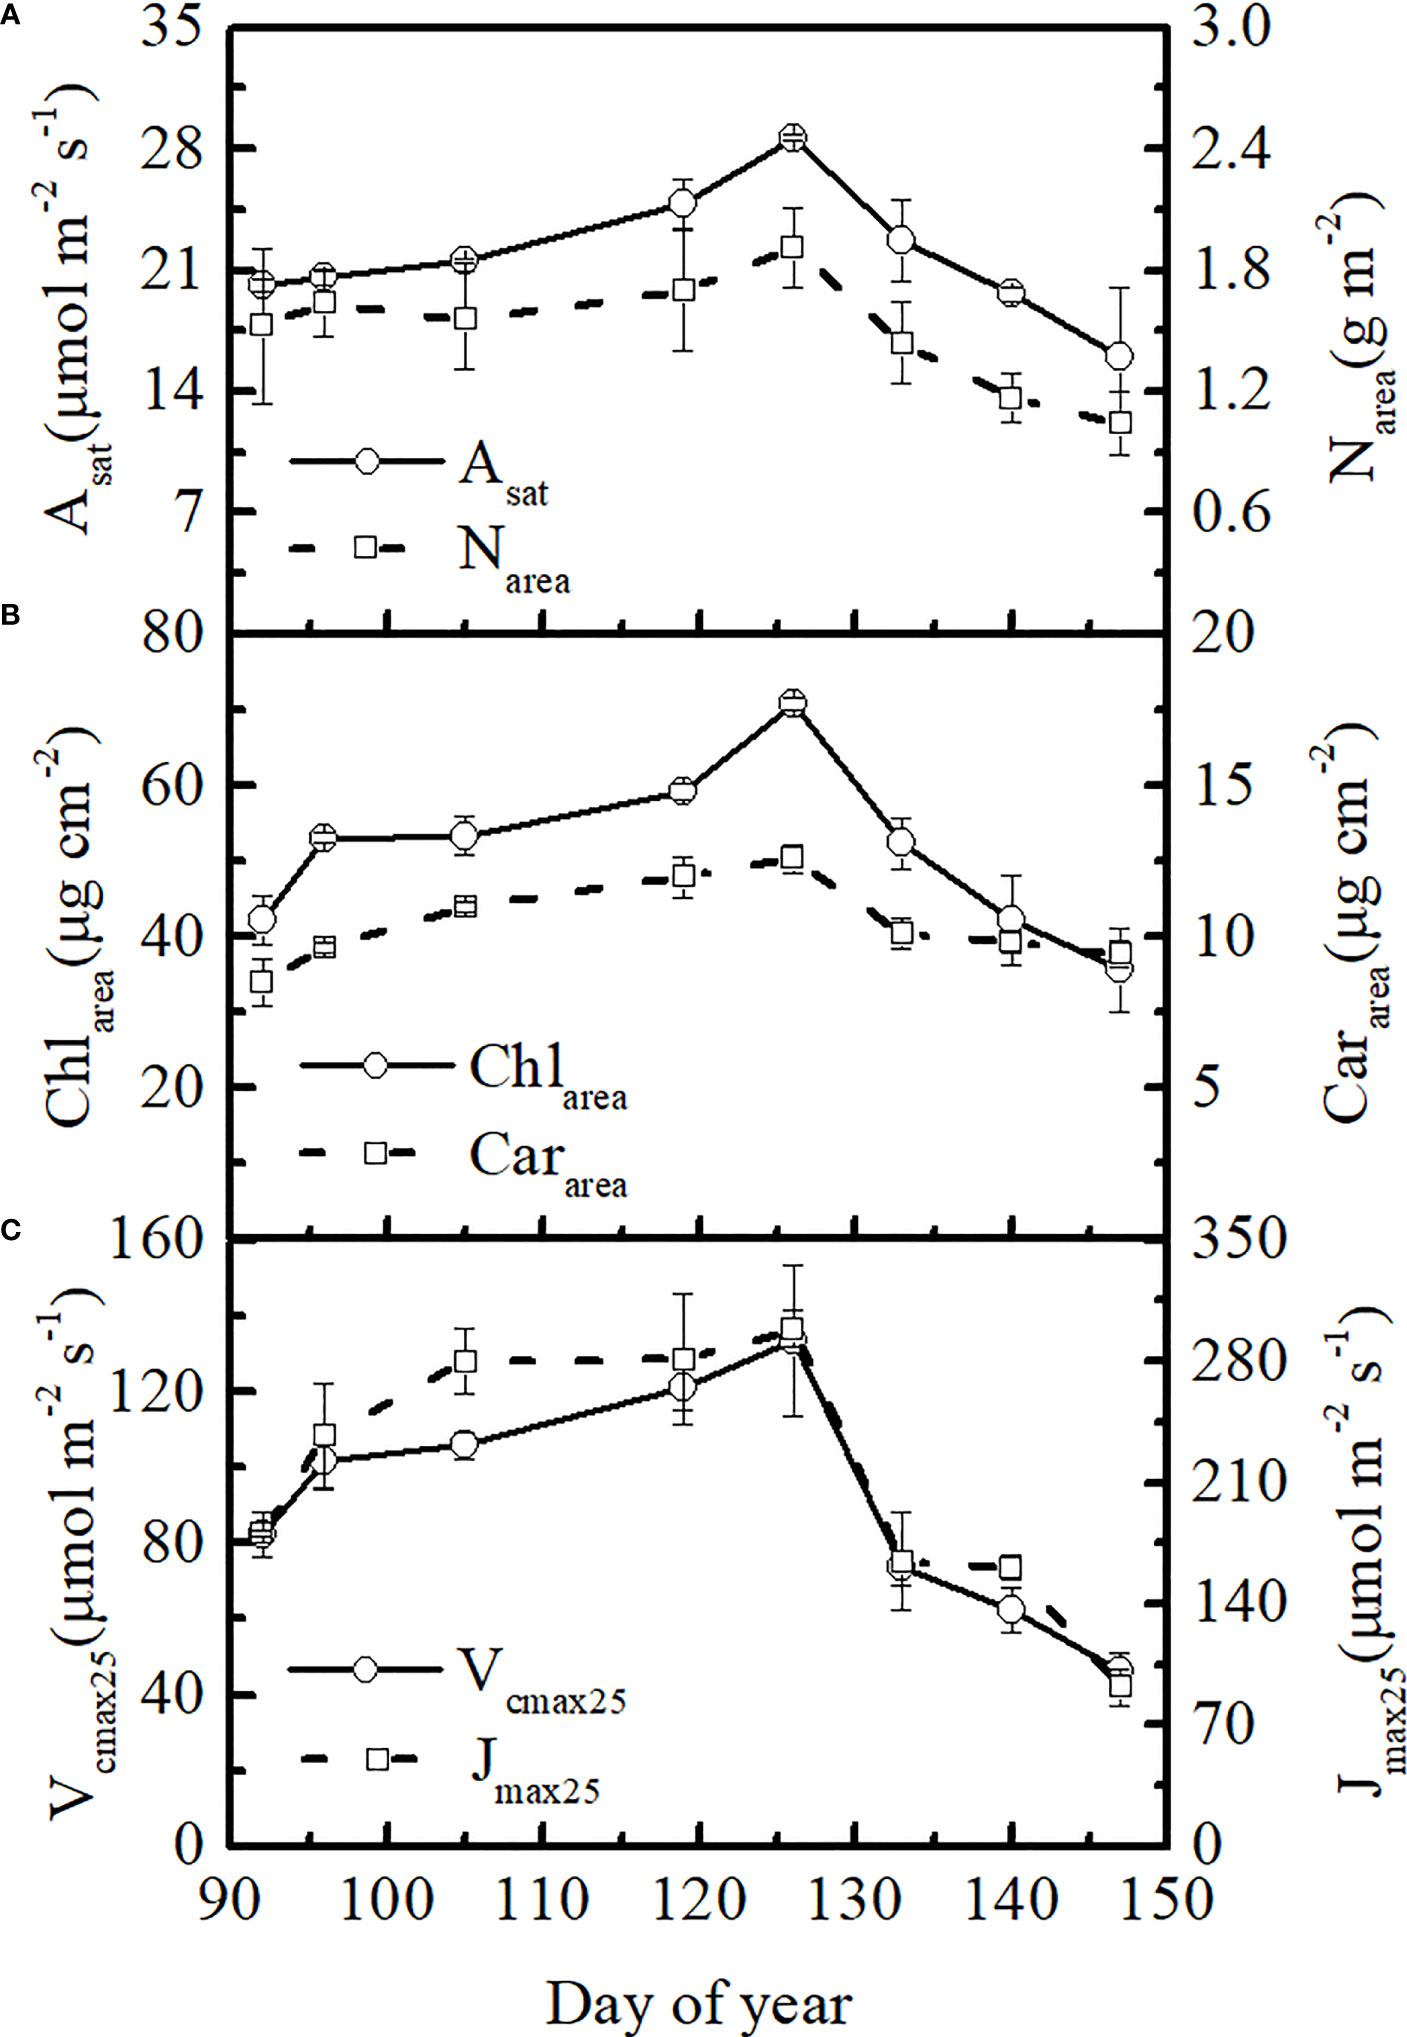
Figure 1 Seasonal changes in (A) photosynthetic rate and nitrogen content, (B) leaf chlorophyll and leaf carotenoid contents, and (C) Vcmax25 and Jmax25 for winter wheat in 2021.
3.2 Correlation of leaf photosynthetic parameters and leaf traits variables
There were positive correlations between the leaf photosynthetic parameters (Asat, Vcmax25, and Jmax25) and leaf trait variables (Narea, Chlarea, and Cararea) (Figure 2). The correlation coefficient between leaf Vcmax25 and leaf Chlarea was the highest (0.83), followed by leaf Cararea (0.68) and leaf Narea (0.60), all of which showed significant linear positive correlations (p<0.001) (Figure 2). The correlations between Leaf Jmax25 were also significantly correlated with leaf traits variables (Narea, Chlarea, Cararea), with correlation coefficients of 0.55 (p<0.01), 0.79 (p<0.001), and 0.70 (p<0.001), respectively. Correlations were also observed between the three leaf trait variables (Figure 2).
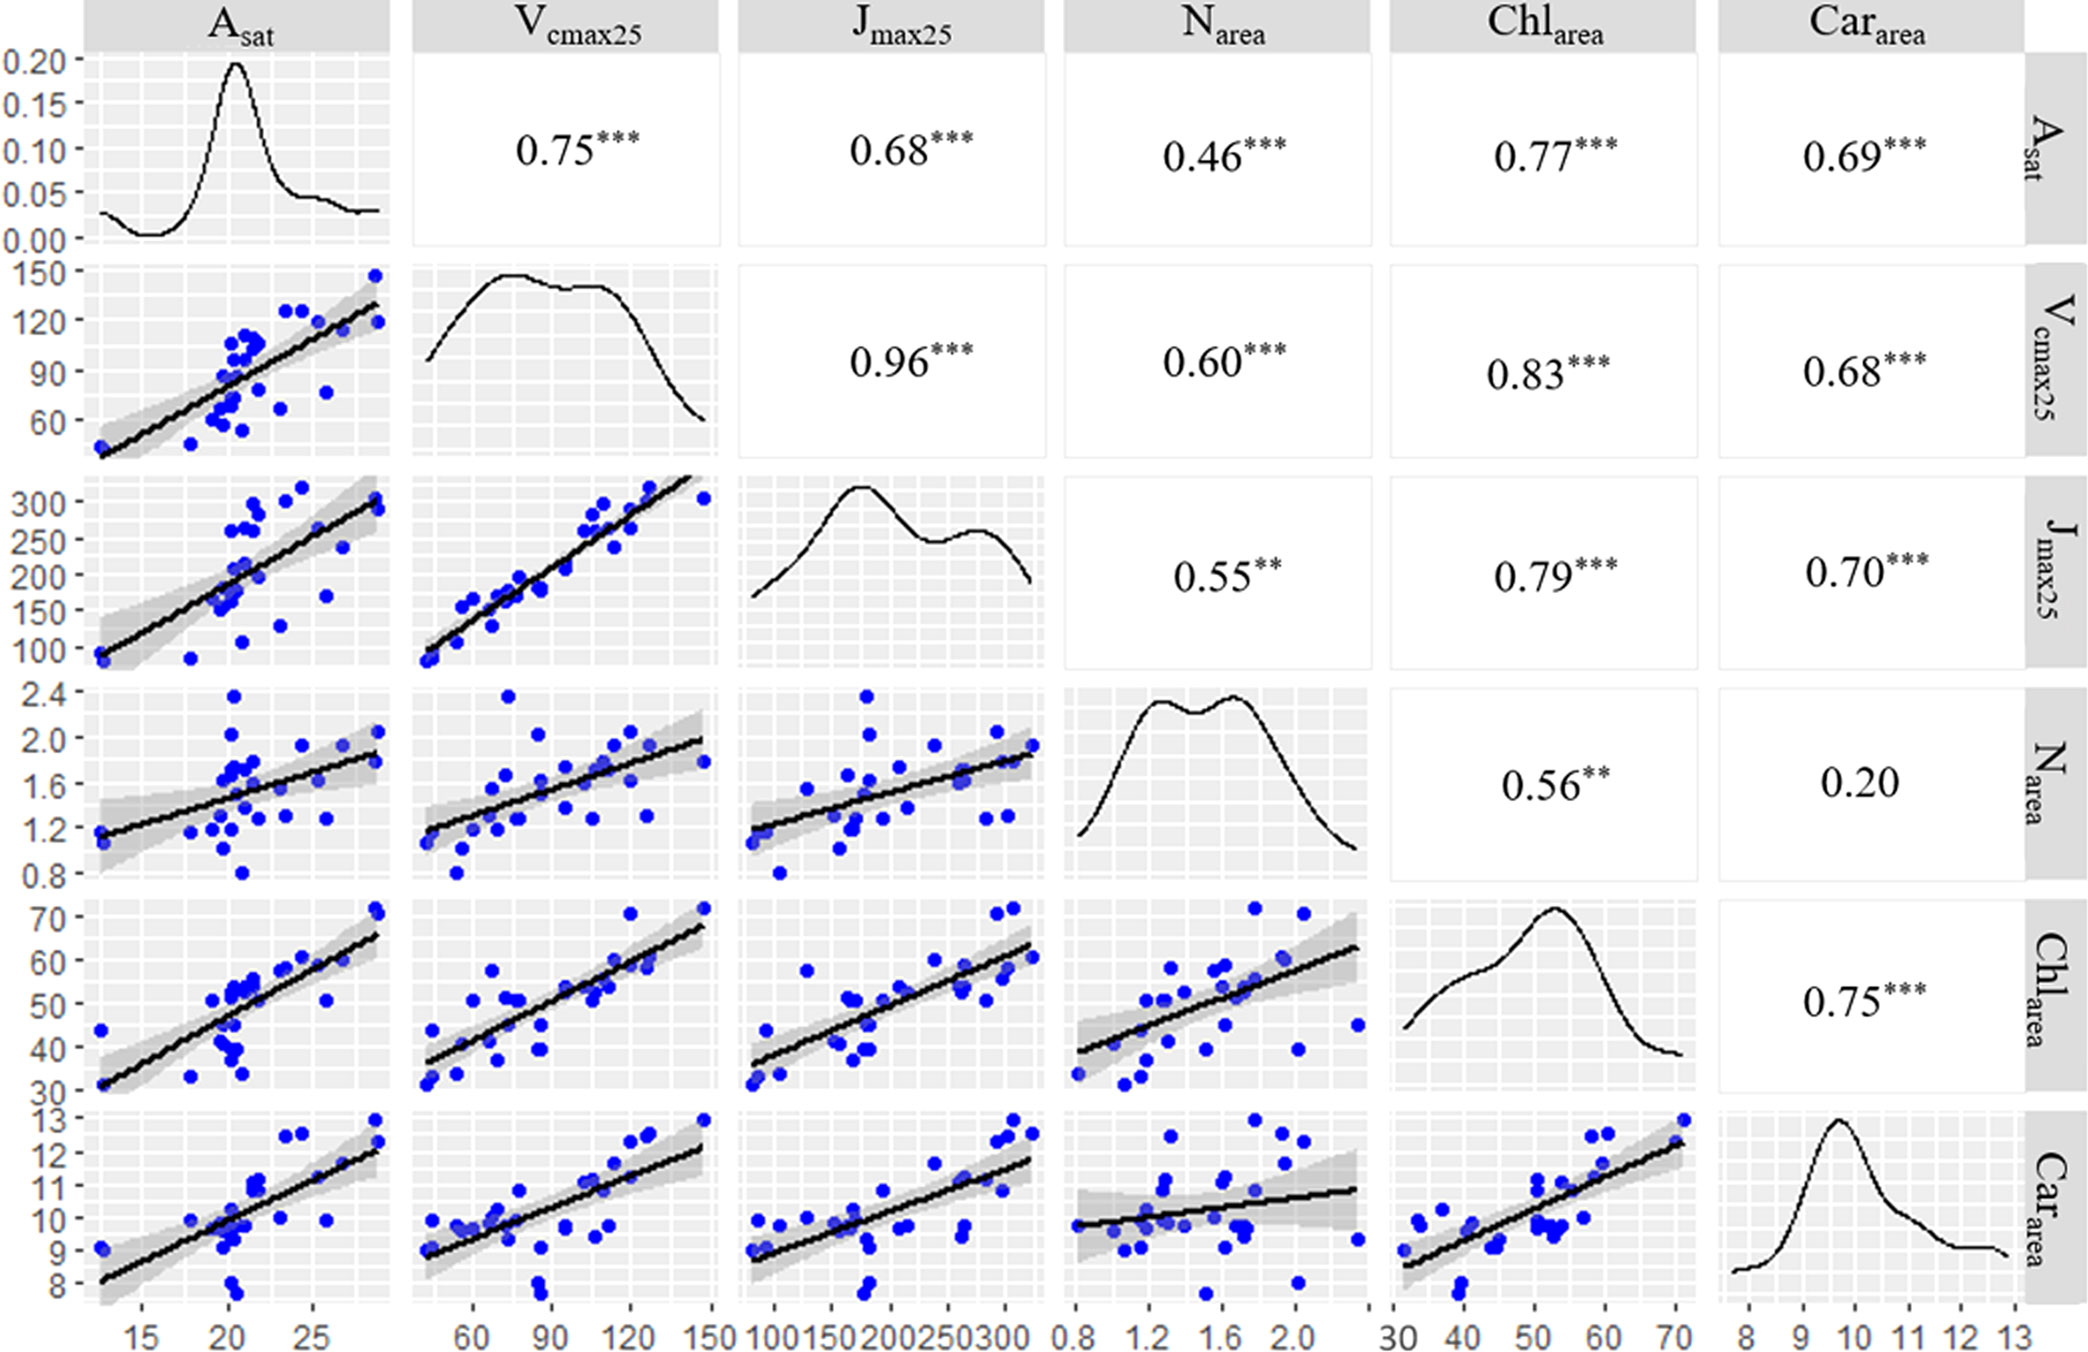
Figure 2 Correlation between both leaf photosynthetic rate and leaf photosynthetic capacity with different leaf traits variables. ***, ** and * represent p< 0.001, p< 0.01and p< 0.05, respectively. The caption describes all significant situations of correlation between parameters, including significant correlation (*) and extremely significant correlation (** and ***). The results in Figure 2 showed that the parameters were highly correlated (** and ***) or uncorrelated.
Simple linear regressions were conducted between leaf photosynthetic capacity with leaf nitrogen content, and leaf photosynthetic pigments (Table 3). The resultsindicated that leaf Chlarea accounted for 69% and 63% of the temporal variation in Vcmax25 and Jmax25, respectively (p<0.001). Leaf Cararea accounted for 47% and 48% of the temporal variation in Vcmax25 and Jmax25, respectively (p<0.001). However, there was a weak relationship between leaf Narea and leaf photosynthetic capacity. Leaf Narea accounted for only 36% and 30% of the temporal variation in Vcmax25 and Jmax25, respectively (p<0.001) (Table 3). There were certain limitations to estimating Vcmax25 based on leaf Narea.
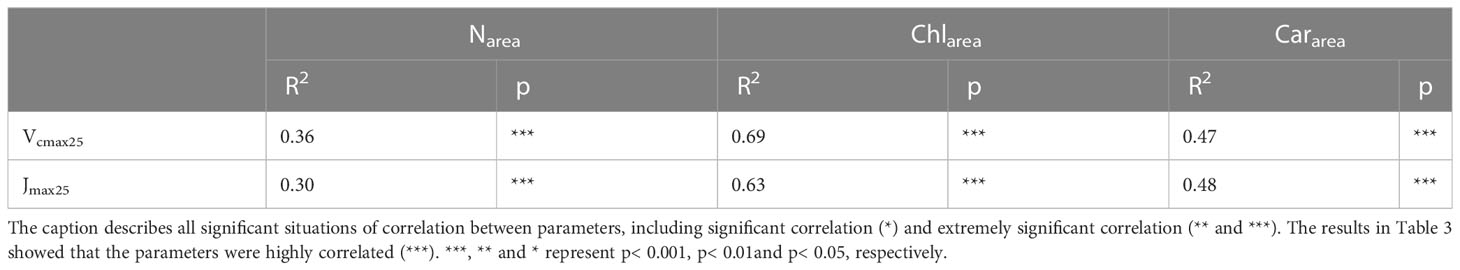
Table 3 Coefficients of determination for simple linear regressions between photosynthetic parameters with both leaf nitrogen and leaf photosynthetic pigment during 2021.
3.3 Changes in leaf nitrogen allocation
The ratios between leaf Chlarea and Narea indicate the allocation of leaf nitrogen between the Rubisco and leaf chlorophyll components (Kenzo et al., 2006). There was little seasonal variation in the ratios between leaf Chlarea to Narea (both units are μg cm-2) after DOY 105 in 2021 (Figure 3A). The leaf Chlarea/Narea ratios showed a rapidly increasing trend at the beginning stage (DOY 92 and DOY 96). The ratios were 0.23 and 0.32 at DOY 92 and 96, respectively. Leaf Chlarea/Narea ratios were maintained at approximately 0.36 from DOY 105 to DOY 147 (Figure 3A).
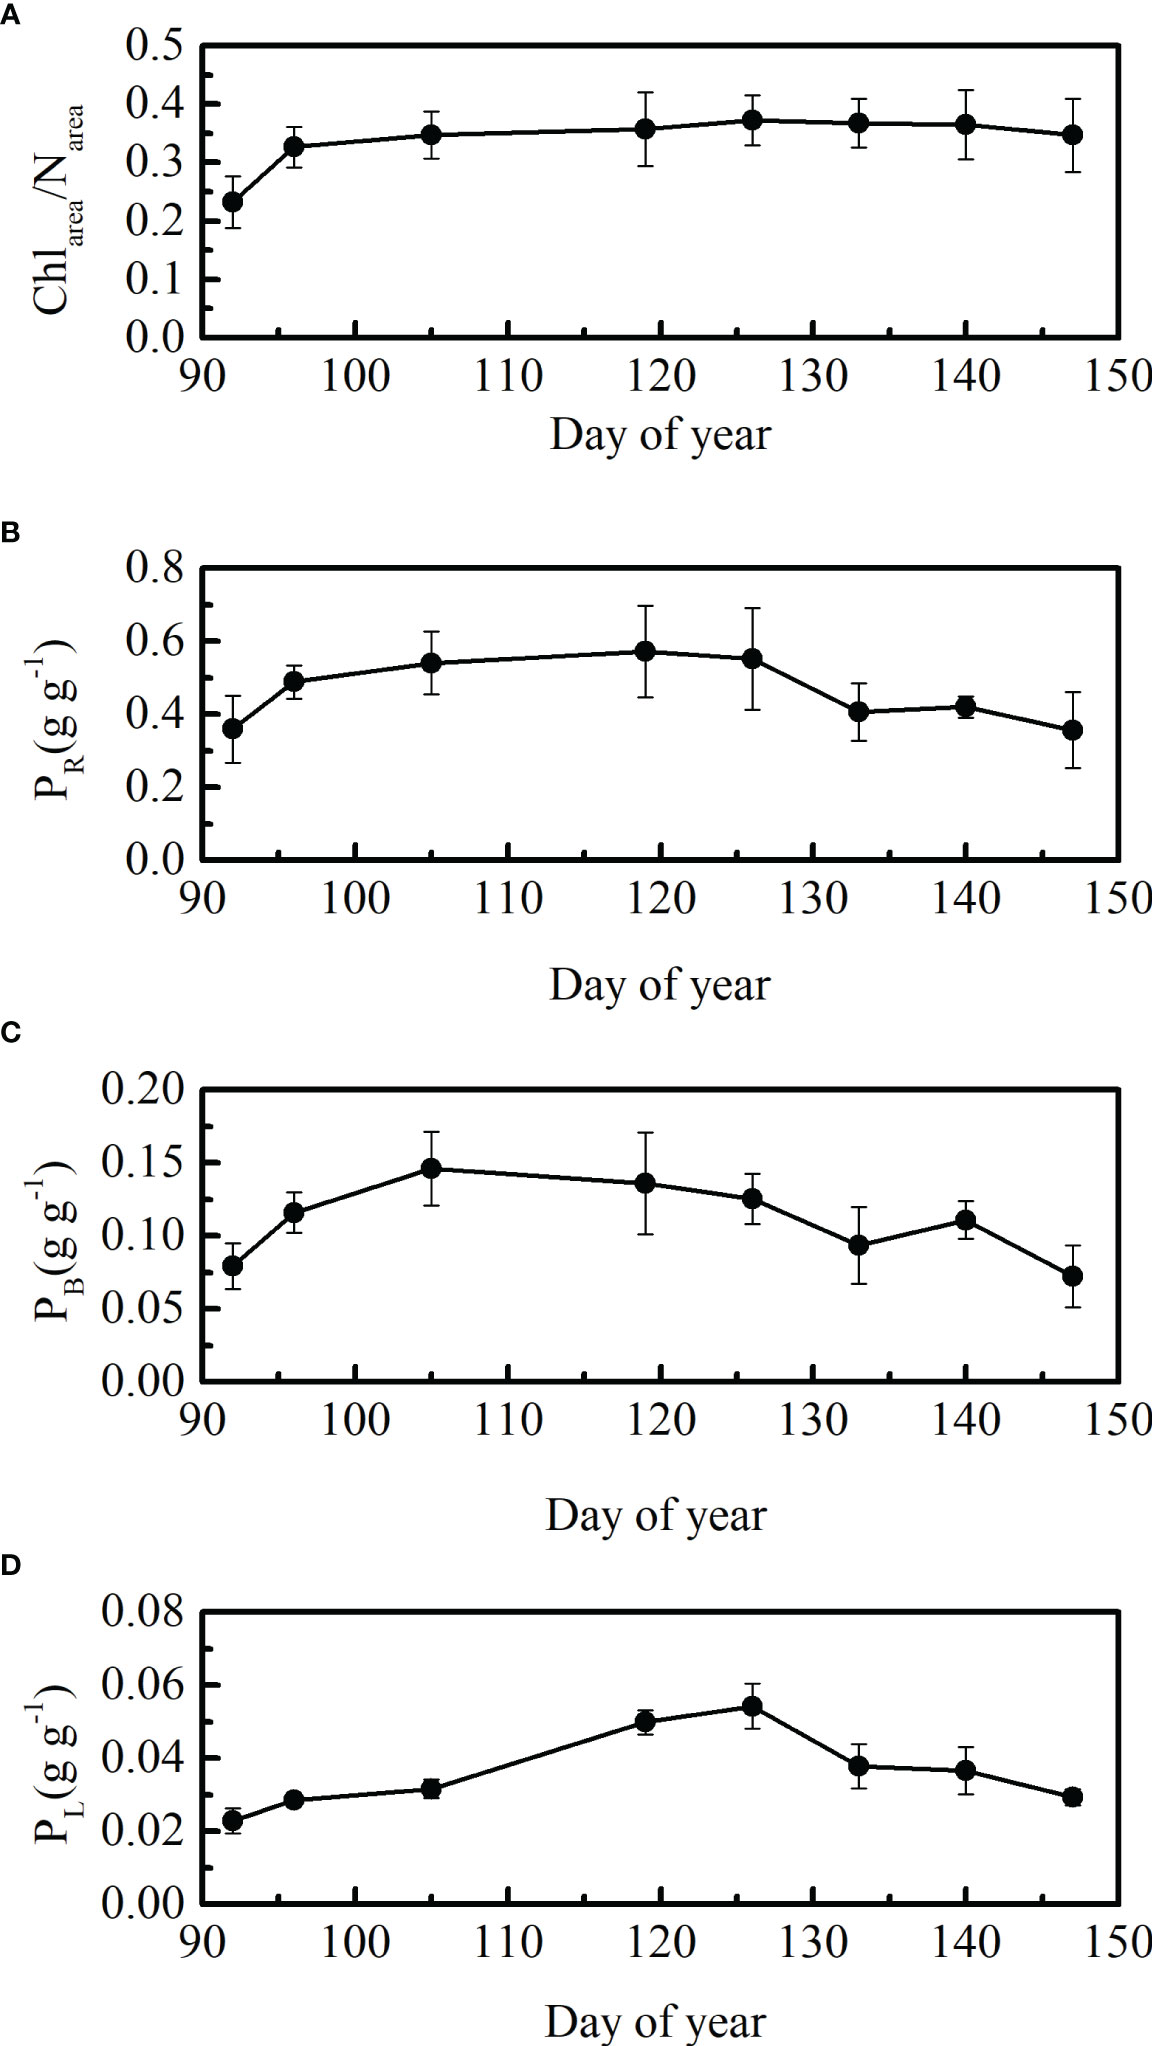
Figure 3 Seasonal patterns in (A) leaf Chlarea to Narea ratios, (B) PR, (C) PB, and (D) PL, ± SD, in 2021.
PR, PB, and PL showed seasonal patterns that first increased and then decreased (Figures 3B–D). The growing stage at which leaf PB reached its highest point in winter wheat differed from that of PR and PL. Temporal variations in leaf PR and PL were coordinated, reaching their highest points at the flowering stage. In general, changes in leaf N allocation to different N pools were dynamic (Figures 3B–D), which may have led to a weak correlation between leaf nitrogen and Vcmax25 (Table 3).
3.4 Relationships among leaf nitrogen, chlorophyll and carotenoid contents
A significant linear relationship between leaf nitrogen and leaf chlorophyll contents (R2 = 0.90, p<0.001) was observed in our study. The observations on DOYs 92 and 96 were outside the 95% confidence intervals of the regression (Figure 4A), which may be attributed to the significant variations in nitrogen allocation to the leaf chlorophyll fractions on these two days (Figure 3A). Leaf Chlarea was also strongly correlated with Cararea (R2 = 0.71, p=0.005) (Figure 4B). However, a weaker relationship between leaf Narea and Cararea was observed (R2 = 0.43, p=0.05) in winter wheat in 2021 (Figure 4C).
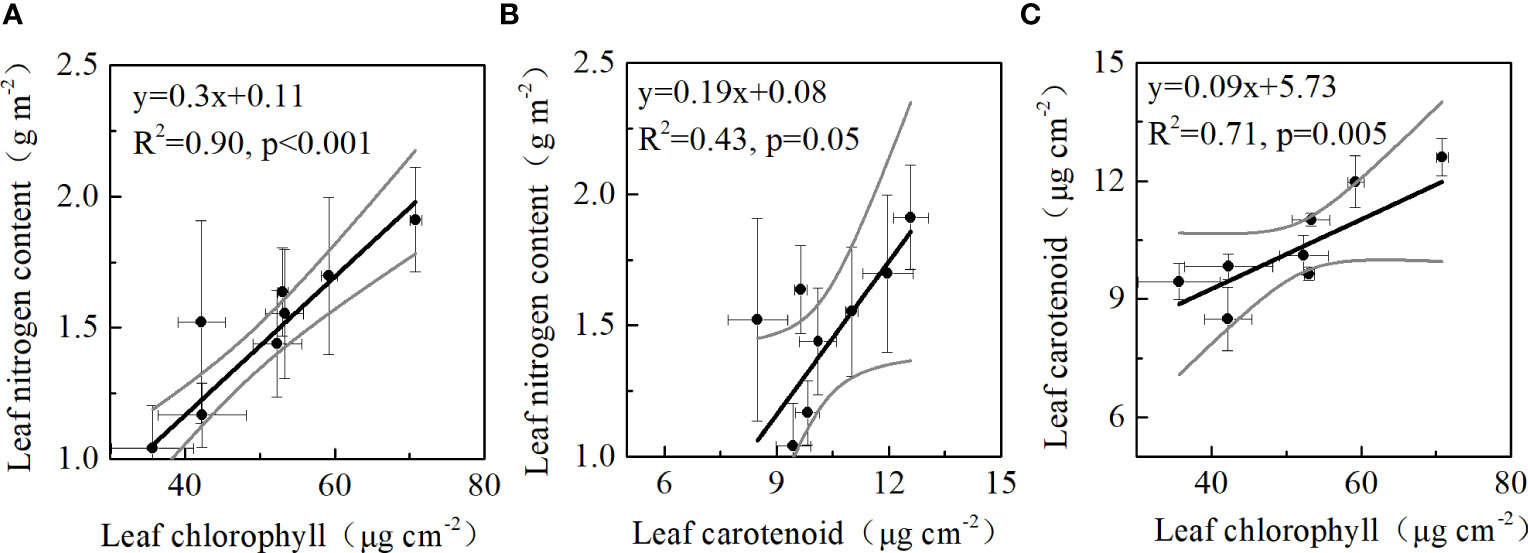
Figure 4 Relationships between (A) leaf nitrogen and chlorophyll contents, (B) leaf nitrogen and carotenoid contents, (C) leaf carotenoid and chlorophyll contents in 2021. Horizontal error bars denote standard deviation of leaf chlorophyll and leaf carotenoid. Vertical error bars refer to standard deviation of leaf nitrogen and leaf carotenoid.
3.5 The importance of each prediction variable to Vcmax25
We used a random forest regression analysis to evaluate the relative importance of each prediction variable for Vcmax25. Leaf Cararea, Chlarea, and leaf Narea were all main prediction variables for Vcmax25 in our study (Figure 5). Leaf Chlarea (%IncMSE = 22.60%) was the most important driver of Vcmax25, followed by leaf Cararea (%IncMSE was 21.47%), and leaf Narea (%IncMSE = 19.08%). The importance of SLA (%IncMSE = 15.66%) to Vcmax25 was far below the importance of leaf photosynthetic pigment and nitrogen content (Figure 5).
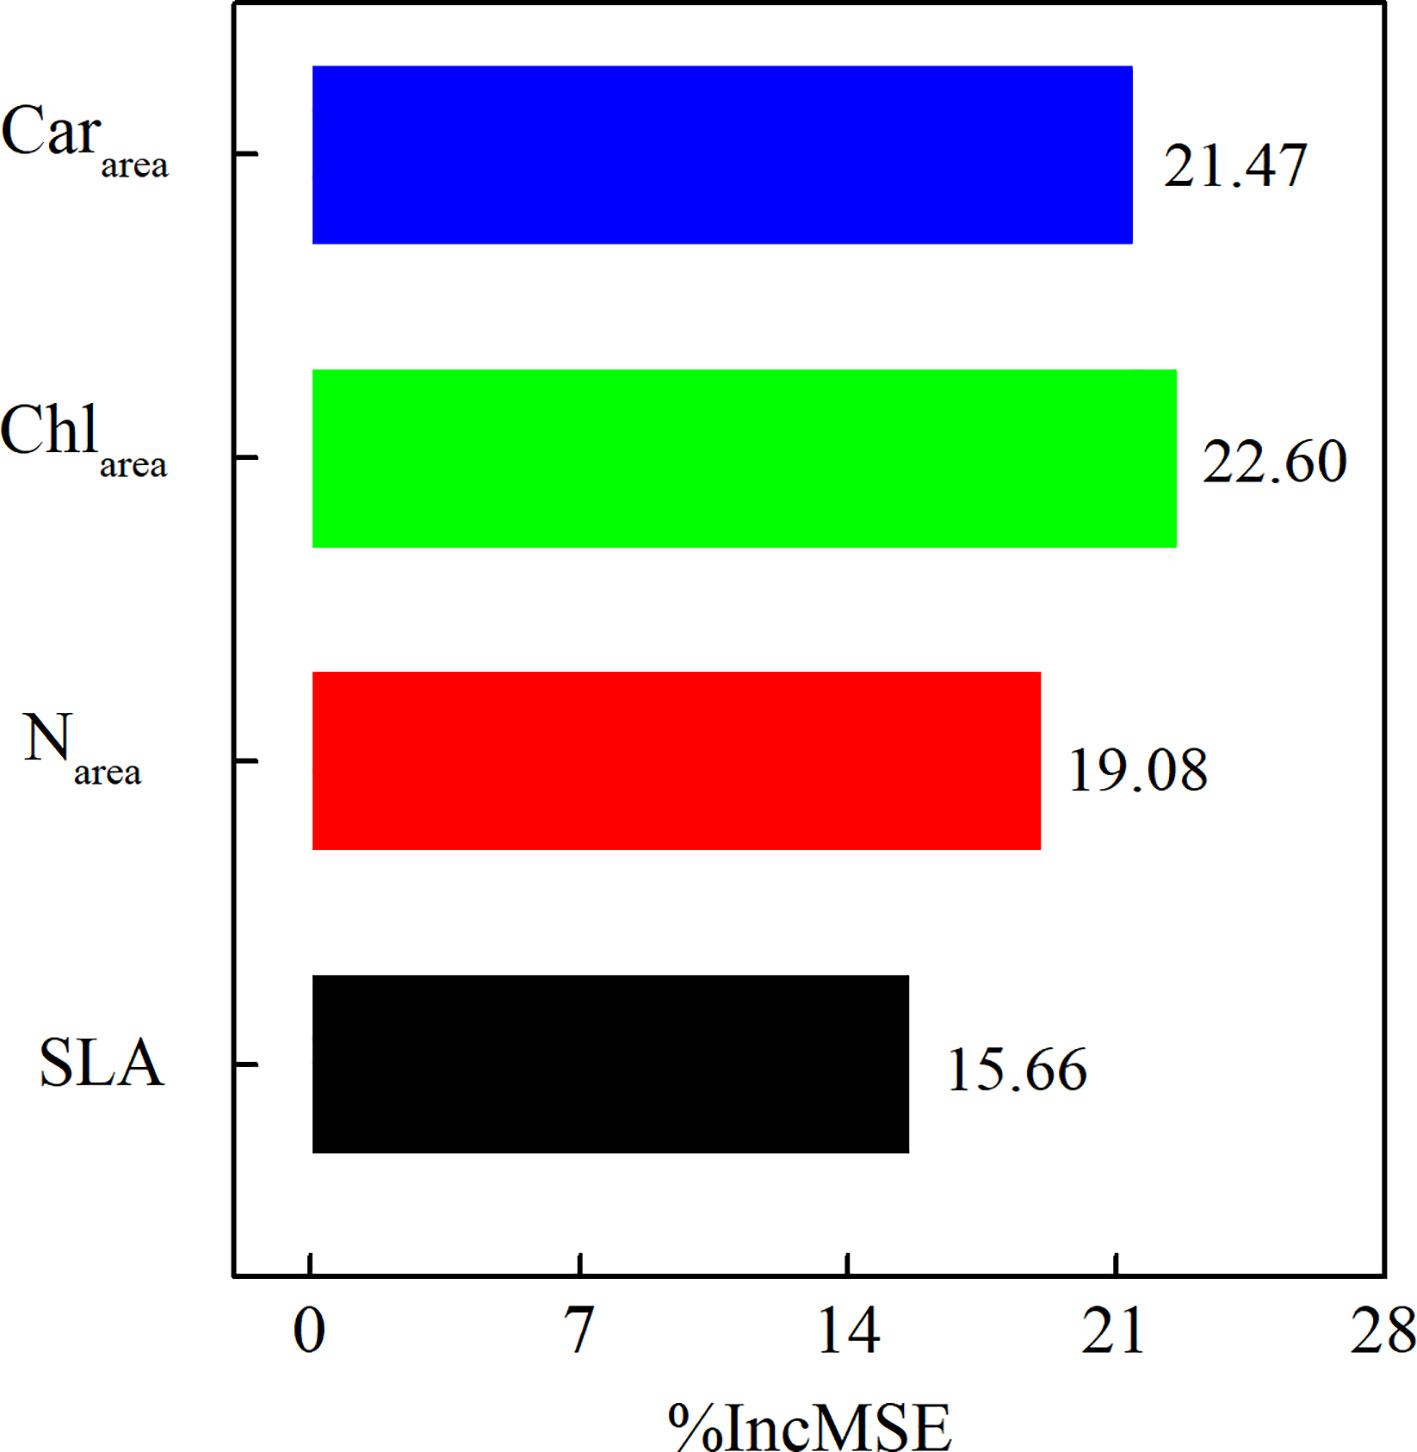
Figure 5 The importance of leaf Cararea, leaf Chlarea, leaf Narea, and SLA to Vcmax25 in 2021.
3.6 Optimization of Vcmax25 model by multiple regression models
Multiple linear regression models were established to improve the accuracy of the Vcmax25 models using leaf Narea, Chlarea, and Cararea (Equations 6-9). The estimation accuracies of the binary linear regression models for Vcmax25 (R2 = 0.72, 0.70, and 0.69, respectively, for f(Narea, Chlarea), f(Chlarea, Cararea), and f(Narea, Cararea)) were all significantly higher than those of the two simple linear regression models for f(Narea) and f(Cararea) (R2 = 0.36 and 0.47, respectively) in our study (Tables 3, 4). However, the estimation accuracy of the simple linear regression models for f(Chlarea) (R2 = 0.69) was not significantly different from that of the binary linear regression models (Tables 3, 4). The model based on leaf Narea, Chlarea, and Cararea had the highest accuracy in estimating Vcmax25 (R2 = 0.75, p<0.001), which was only 0.06 higher than that of the simple linear regression models for f(Chlarea) (R2 = 0.69) (Tables 3, 4). Thus, leaf Chlarea was a better predictor for Vcmax25 than leaf Narea in winter wheat at the YC site (Tables 3, 4). Incorporating leaf photosynthetic pigments (chlorophyll and carotenoid content) into photosynthetic models can significantly improve the estimation accuracy of Vcmax25 model based on leaf nitrogen for winter wheat.
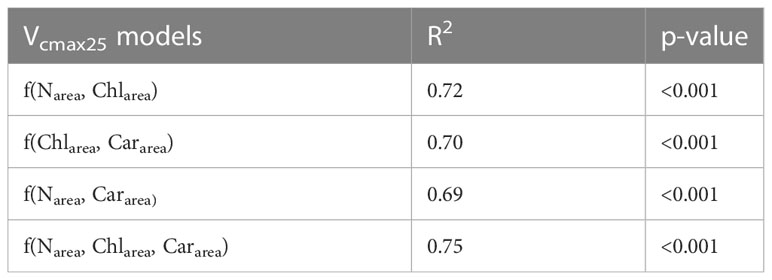
Table 4 Coefficient of determination (r2) of Vcmax25 models based on different leaf traits variables.
4 Discussion
4.1 Differences in seasonal trends of photosynthetic parameters
In our study, leaf Asat and photosynthetic parameters appeared to follow trends in leaf chlorophyll content. However, there were some differences in the seasonal patterns of leaf chlorophyll, nitrogen, and carotenoid contents. Leaf Narea was relatively high at the elongation stage relative to leaf Chlarea (Figures 1A, B), which may be attributed to the inorganic nitrogen present in buds before leaf flushing. The different trends in leaf nitrogen and leaf chlorophyll maybe attributed to dynamic changes in leaf nitrogen partitioning among photosynthetic pools (Croft et al., 2017; Liu et al., 2023a). Fertilization management can also maintain high leaf nitrogen content at the start of season (Lu et al., 2020). Leaf Cararea showed smaller seasonal variations compared to leaf Chlarea in winter wheat, particularly after the flowering stage (Figure 1B). As there is massive loss of leaf chlorophyll in winter wheat during senescence in the filling stage, carotenoids are retained in the leaves for a much longer time (Wong et al., 2019). In the early growth stage, the leaf Chlarea is higher than the leaf Cararea. The leaves appear green because green light is almost completely reflected. In the late stage, leaf chlorophyll is heavily damaged, but leaf carotenoids are only slightly affected, causing the leaves to turn yellow (Stylinski et al., 2002; Garrity et al., 2011). Flowering stage is an important physiological stage for winter wheat, since all the photosynthetic parameters have inflection point in this period. The results are consistent with Lu et al. (2020). The temperature rises gradually after the greening period. At this period, plant root is vigorous, enzyme activity and plant photosynthetic capacity increases. Thus, leaf photosynthetic parameters increase gradually and reach the maximum point at the flowering stage. The reproductive growth of winter wheat is dominant after flowering stage. Leaf and other vegetative organs gradually stop growing and aging. Therefore, leaf photosynthetic parameters decrease gradually (Yang et al., 2020).
4.2 Relationships among leaf Vcmax25, nitrogen and photosynthetic pigments
Leaf nitrogen was closely correlated with leaf chlorophyll in previous studies, with a fixed value of leaf Chlarea/Narea ratio (Sage et al., 1987; Evans, 1989; Houborg et al., 2013). Our results also showed a strong linear relationship between leaf Chlarea and Narea (R2 = 0.90; p< 0.001) (Figure 3A). The robustness of the linear correlation between leaf nitrogen and chlorophyll contents was influenced by changes in leaf nitrogen allocation to chlorophyll (Lu et al., 2020). A relatively stable allocation of leaf nitrogen to leaf chlorophyll (Chlarea/Narea ratio of approximately 0.36) was found in our study for winter wheat (Figure 4A), which contributed to a good linear relationship between leaf Chlarea and Narea (Figure 3A).
Vcmax25 was closely related to leaf Narea, leaf Chlarea, and SLA in previous studies (Houborg et al., 2013; Houborg et al., 2015; Croft et al., 2017; Watanabe et al., 2018; Miner and Bauerle, 2019; Qian et al., 2021; Lu et al., 2022). However, the results are inconsistent in different studies, indicating that these relationships vary among species and are difficult to apply at large scales. Qian et al. (2021) showed a stronger linear relationship between Vcmax25 and Chlarea than between leaf Vcmax25 and Narea across 13 species. In other ecosystems, a strong relationship exists between leaf Vcmax25 and Narea and the slopes vary among species (Walker et al., 2014; Quebbeman and Ramirez, 2016). However, the slopes of the relationship in Narea‐Vcmax25 varies greatly with environmental conditions and PFTs (Walker et al., 2014; Rogers et al., 2017). A weaker correlation between leaf Vcmax25 and leaf Narea than between leaf Vcmax25 and Chlarea were showed in our study (Figure 2; Table 3), which is in agreement with Qian et al. (2021). Rubisco-N allocation (PR), rather than the total leaf nitrogen content, was more related to Vcmax based on the meta-analysis (Ali et al., 2015). PR showed significant seasonal variation during the growing season in our study (Figure 4B). The weak correlation between leaf Narea and Vcmax25 may also be attributed to variations in PR (Figures 2, 4B; Table 3). Therefore, leaf Narea is not an ideal predictor for Vcmax25 in the present study. The temporal variations in leaf PL coordinated with changes in PR, which indicated that the allocation of leaf nitrogen to leaf carotenoids was dynamic. Consequently, A weak correlation between the leaf Narea and leaf Cararea for winter wheat area was showed in our study (Figure 3B).
4.3 Physiological mechanism for the relationships between leaf photosynthetic pigments and Vcmax25
Our results showed a stronger correlation between Vcmax25 with both leaf Chlarea (R2 = 0.69) and Cararea (R2 = 0.47) than with leaf Narea (R2 = 0.36) (Figure 2; Table 3). Leaf photosynthetic pigments are a better predictor for Vcmax25 in winter wheat. The underlying mechanism of this phenomenon is the driving role of leaf pigment in light harvesting of photosynthesis (Zhang et al., 2009; Gitelson et al., 2014; Li et al., 2018b). The random forest regression analysis also showed leaf chlorophyll and carotenoid contents were more important than leaf nitrogen content for Vcmax25 (Figure 5). Compared with other leaf traits, Vcmax25 can be accurately retrieved based on leaf chlorophyll content from remote sensing data (Gitelson et al., 2006; Croft et al., 2013). Moreover, leaf chlorophyll can effectively eliminate the influence of nonphotosynthetic nitrogen since it only reflects the changes of photosynthetic active N pool (Alton, 2017; Croft et al., 2017). Carotenoid, which is important component of plant photosynthesis, participate in the collection of sunlight, especially at wavelengths where leaf chlorophyll molecules are not absorbed strongly (Ritz et al., 2000). Leaf carotenoid also protect chlorophyll molecules from photo-oxidation. Carotenoid is commonly referred to as “auxiliary pigments” in light harvesting center, promoting the transfer of excitation energy to the reaction center (Niyogi et al., 1997). Leaf chlorophyll and carotenoid molecules are usually arranged in clusters to maximize the capture of light energy (Croft and Chen, 2018).
Leaf chlorophyll and carotenoid contents are the most important factors determining photosynthetic rate, owing to their important roles in light capture and absorption of photosynthetic effective radiation (Zhang et al., 2009; Zhang et al., 2011; Kooistra and Clevers, 2016). Therefore, leaf photosynthetic pigments play an important role in simulating vegetation productivity processes (Croft et al., 2017; Luo et al., 2018). The construction of a Vcmax25 model based on photosynthetic pigments can improve the accuracy of ecological process model simulations (Luo et al., 2019; Liu et al., 2023b). The multiple linear regression models established in our study showed that f((Narea, Chlarea, Cararea) had the highest optimization accuracy for the Vcmax25 model (R2 = 0.75), which represents different information expressed by the leaf Narea and leaf photosynthetic pigment. The estimation accuracy of the Vcmax25 model based on Narea, Chlarea, and Cararea (R2 = 0.75) was only 0.05 higher than that of the Vcmax25 model based on Chlarea and Cararea (R2 = 0.70). However, the estimation accuracy of the Vcmax25 model based on Chlarea and Cararea (R2 = 0.70) was 0.34 higher than that of the Vcmax25 model based on Narea (R2 = 0.36). Leaf photosynthetic pigments can significantly improve the estimation accuracy of Vcmax25 based on leaf nitrogen in winter wheat.
Data availability statement
The raw data supporting the conclusions of this article will be made available by the authors, without undue reservation.
Author contributions
YL analysed date and wrote the manuscript. The experiments were designed by TQ. QW and TF performed the experiments. YQ and LH revised the manuscript. All authors contributed to the article and approved the submitted version.
Funding
This work was co-supported by the National Natural Science Foundation of China (32001130) and Natural Science Foundation of Hebei Province, China (Grant No. C2021402011, C2020402022, E2021402031).
Conflict of interest
The authors declare that the research was conducted in the absence of any commercial or financial relationships that could be construed as a potential conflict of interest.
Publisher’s note
All claims expressed in this article are solely those of the authors and do not necessarily represent those of their affiliated organizations, or those of the publisher, the editors and the reviewers. Any product that may be evaluated in this article, or claim that may be made by its manufacturer, is not guaranteed or endorsed by the publisher.
References
Ali, A. A., Xu, C. G., Rogers, A., McDowell, N. G., Medlyn, B. E., Fisher, R. A., et al. (2015). Global-scale environmental control of plant photosynthetic capacity. Ecol. Appl. 25 (8), 2349–2365. doi: 10.1890/14-2111.1.sm
Alton, P. B. (2017). Retrieval of seasonal rubisco-limited photosynthetic capacity at global FLUXNET sites from hyperspectral satellite remote sensing: impact on carbon modelling. Agric.For. Meteorol. 232, 74–88. doi: 10.1016/j.agrformet.2016.08.001
Anav, A., Friedlingstein, P., Beer, C., Ciais, P., Harper, A. (2015). Spatiotemporal patterns of terrestrial gross primary production: a review. Rev. Geophysics 53 (3), 785–818. doi: 10.1002/2015RG000483
Bonan, G. B., Doney, S. C. (2018). Climate, ecosystems, and planetary futures: the challenge to predict life in earth system models. Science 359 (6375), 533–533. doi: 10.1126/science.aam8328
Bondeau, A., Smith, P. C, Zaehle, S., Schaphoff, S., Lucht, W., Cramer, W., et al. (2007). Modelling the role of agriculture for the 20th century global terrestrial carbon balance. Global Change Biol. 13(3), 679–706. doi: 10.1111/j.1365-2486.2006.01305.x
Croft, H., Chen, J. M. (2018). Leaf pigment content - sciencedirect. Comprehensive Remote Sens 3, 117–142. doi: 10.1016/b978-0-12-409548-9.10547-0
Croft, H., Chen, J. M., Luo, X., Bartlett, P., Chen, B., Staebler, R. M. (2017). Leaf chlorophyll content as a proxy for leaf photosynthetic capacity. Global Change Biol. 23 (9), 3513–3524. doi: 10.1111/gcb.13599
Croft, H., Chen, J. M., Wang, R., Mo, G., Luo, S., Luo, X., et al. (2020). The global distribution of leaf chlorophyll content. Remote Sens. Environ. 236, 111479. doi: 10.1016/j.rse.2019.111479
Croft, H., Chen, J. M., Zhang, Y., Simic, A. (2013). Modelling leaf chlorophyll content in broadleaf and needle leaf canopies from ground, CASI, landsat TM 5 and MERIS reflectance data. Remote Sens. Environ. 133, 128–140. doi: 10.1016/j.rse.2013.02.006
Delgado-Baquerizo, M., Eldridge, D. J., Maestre, F. T., Karunaratne, S. B., Trivedi, P., Reich, P. B., et al. (2017). Climate legacies drive global soil carbon stocks in terrestrial ecosystems. Sci. Adv. 3 (4), e1602008. doi: 10.1126/sciadv.1602008
Dietze, M. C. (2014). Gaps in knowledge and data driving uncertainty in models of photosynthesis. Photosynth Res. 119 (1-2), 3–14. doi: 10.1007/s11120-013-9836-z
Dillen, S. Y., Op de Beeck, M., Hufkens, K., Buonanduci, M., Phillips, N. G. (2012). Seasonal patterns of foliar reflectance in relation to photosynthetic capacity and color index in two co-occurring tree species, quercus rubra and betula papyrifera. Agric.For. Meteorol. 160, 60–68. doi: 10.1016/j.agrformet.2012.03.001
Effah, Z., Li, L., Xie, J., Karikari, B., Xu, A., Wang, L., et al. (2023). Widely untargeted metabolomic profiling unearths metabolites and pathways involved in leaf senescence and n remobilization in spring-cultivated wheat under different n regimes. Front. Plant Sci. 14. doi: 10.3389/fpls.2023.1166933
Ethier, G. J., Livingston, N. J. (2004). On the need to incorporate sensitivity to CO2 transfer conductance into the farquhar–von caemmerer–berry leaf photosynthesis model. Plant Cell Environ. 27 (2), 137–153. doi: 10.1111/j.1365-3040.2004.01140.x
Evans, J. R. (1989). Photosynthesis and nitrogen relationships in leaves of c-3 plants. Oecologia 78 (1), 9–19. doi: 10.1007/Bf00377192
Fargasova, A., Molnarova, M. (2010). Assessment of cr and Ni phytotoxicity from cutlery-washing waste-waters using biomass and chlorophyll production tests on mustard sinapis alba l. seedlings. Environ. Sci. pollut. Res. 17 (1), 187–194. doi: 10.1007/s11356-009-0136-2
Farquhar, G. D., Caemmerer, S. V., Berry, J. A. (1980). A biochemical-model of photosynthetic Co2 assimilation in leaves of c-3 species. Planta 149 (1), 78–90. doi: 10.1007/Bf00386231
Garrity, S., Eitel, J., Vierling, L. (2011). Disentangling the relationships between plant pigments and the photochemical reflectance index reveals a new approach for remote estimation of carotenoid content RID a-8929-2011. Remote SENS Environ. 115 (2), 628–635. doi: 10.1016/j.rse.2010.10.007
Gitelson, A. A., Keydan, G. P., Merzlyak, M. N. (2006). Three-band model for noninvasive estimation of chlorophyll, carotenoids, and anthocyanin contents in higher plant leaves. Geophys. Res. Lett. 33 (11), 431–433. doi: 10.1029/2006gl026457
Gitelson, A. A., Peng, Y., Arkebauer, T. J., Schepers, J. (2014). Relationships between gross primary production, green LAI, and canopy chlorophyll content in maize: implications for remote sensing of primary production. Remote Sens. Environ. 144 (Complete), 65–72. doi: 10.1016/j.rse.2014.01.004
Grassi, G., Vicinelli, E., Ponti, F., Cantoni, L., Magnani, F. (2005). Seasonal and interannual variability of photosynthetic capacity in relation to leaf nitrogen in a deciduous forest plantation in northern Italy. Tree Physiol. 25 (3), 349–360. doi: 10.1093/treephys/25.3.349
Hga, B., Jing, L. A., Msa, C., Xxa, C., Zhu, O. (2020). Lowering carbon footprint of wheat-maize cropping system in north China plain: through microbial fertilizer application with adaptive tillage. J. Cleaner Production 268, 122255. doi: 10.1016/j.jclepro.2020.122255
Houborg, R., Cescatti, A., Migliavacca, M., Kustas, W. P. (2013). Satellite retrievals of leaf chlorophyll and photosynthetic capacity for improved modeling of GPP. Agric.For. Meteorol. 177, 10–23. doi: 10.1016/j.agrformet.2013.04.006
Houborg, R., McCabe, M. F., Cescatti, A., Gitelson, A. A. (2015). Leaf chlorophyll constraint on model simulated gross primary productivity in agricultural systems. Int. J. Appl. Earth. Obs. 43, 160–176. doi: 10.1016/j.jag.2015.03.016
Huang, Z., Zhou, L., Chi, Y. G. (2023). Spring phenology rather than climate dominates the trends in peak of growing season in the northern hemisphere. Glob. Chang. Biol. 00, 1–13. doi: 10.1111/gcb.16758
Jin, J., Liu, Y., Hou, W., Cai, Y., Zhang, F., Wang, Y., et al. (2023). Improvement of transpiration estimation based on a two-leaf conductance-photosynthesis model with seasonal parameters for temperate deciduous forests. Front. Plant Sci. 14. doi: 10.3389/fpls.2023.1164078
Kattge, J., Knorr, W., Raddatz, T., Wirth, C. (2009). Quantifying photosynthetic capacity and its relationship to leaf nitrogen content for global-scale terrestrial biosphere models. Global Change Biol. 15 (4), 976–991. doi: 10.1111/j.1365-2486.2008.01744.x
Kenzo, T., Ichie, T., Watanabe, Y., Yoneda, R., Ninomiya, I., Koike, T. (2006). Changes in photosynthesis and leaf characteristics with tree height in five dipterocarp species in a tropical rain forest. Tree Physiol. 26 (7), 865–873. doi: 10.1093/treephys/26.7.865
Knyazikhin, Y., Schull, M. A., Stenberg, P., Mottus, M., Rautiainen, M., Yang, Y., et al. (2013). Hyperspectral remote sensing of foliar nitrogen content. Proc. Natl. Acad. Sci. 110 (3), E185–E192. doi: 10.1073/pnas.1210196109
Kooistra, L., Clevers, J. G. P. W. (2016). Estimating potato leaf chlorophyll content using ratio vegetation indices. Remote Sens Lett. 7 (6), 611–620. doi: 10.1080/2150704x.2016.1171925
Lal, R. (2001). World cropland soils as a source or sink for atmospheric carbon. Adv Agron. 71, 145–191. doi: 10.1016/S0065-2113(01)71014-0
Lebauer, D. S., Wang, D., Richter, K. T., Davidson, C. C., Dietze, M. C. (2013). Facilitating feedbacks between field measurements and ecosystem models. Ecol. Monogr. 83 (2), 133–154. doi: 10.1890/12-0137.1
Li, W., Ciais, P., Wang, Y., Yin, Y., Peng, S., Zhu, Z. (2018a). Recent changes in global photosynthesis and terrestrial ecosystem respiration constrained from multiple observations. Geophys. Res. Lett. 45 (2), 1058–1068. doi: 10.1002/2017GL076622
Li, Y., Liu, C. C., Zhang, J. H., Yang, H., Xu, L., Wang, Q. F., et al. (2018b). Variation in leaf chlorophyll concentration from tropical to cold-temperate forests: association with gross primary productivity. Ecol. Indic. 85, 383–389. doi: 10.1016/j.ecolind.2017.10.025
Liu, Y., Chen, J. M., He, L., Wang, R., Smith, N. G., Keenan, T. F., et al. (2023b). Global photosynthetic capacity of C3 biomes retrieved from solar-induced chlorophyll fluorescence and leaf chlorophyll content. Remote Sens. Environ. 287, 113457. doi: 10.1016/j.rse.2023.113457
Liu, J., Zhang, K., Bi, J., Yu, X., Luo, L., Hu, L. (2023a). Mesophyll conductance and n allocation co-explained the variation in photosynthesis in two canola genotypes under contrasting nitrogen supply. Front. Plant Sci. 14. doi: 10.3389/fpls.2023.1171331
Lu, X., Croft, H., Chen, J. M., Luo, Y., Ju, W. (2022). Estimating photosynthetic capacity from optimized rubisco–chlorophyll relationships among vegetation types and under global change. Environ. Res. Lett. 17 (1), 014028. doi: 10.1088/1748-9326/ac444d
Lu, X., Ju, W., Li, J., Croft, H., Chen, J. M., Luo, Y., et al. (2020). Maximum carboxylation rate estimation with chlorophyll content as a proxy of rubisco content. J. Geophysical Research: Biogeosciences 125 (8). doi: 10.1029/2020jg005748
Luo, X. Z., Croft, H., Chen, J. M., Bartlett, P., Staebler, R., Froelich, N. (2018). Incorporating leaf chlorophyll content into a two-leaf terrestrial biosphere model for estimating carbon and water fluxes at a forest site. Agric.For. Meteorol. 248, 156–168. doi: 10.1016/j.agrformet.2017.09.012
Luo, X., Croft, H., Chen, J. M., He, L., Keenan, T. F. (2019). Improved estimates of global terrestrial photosynthesis using information on leaf chlorophyll content. Glob Chang Biol. 25 (7), 2499–2514. doi: 10.1111/gcb.14624
Medvigy, D., Jeong, S. J., Clark, K. L., Skowronski, N. S., Schafer, K. V. R. (2013). Effects of seasonal variation of photosynthetic capacity on the carbon fluxes of a temperate deciduous forest. J. Geophys Res-Biogeo 118 (4), 1703–1714. doi: 10.1002/2013jg002421
Miner, G. L., Bauerle, W. L. (2019). Seasonal responses of photosynthetic parameters in maize and sunflower and their relationship with leaf functional traits. Plant Cell Environ. 42 (5), 1561–1574. doi: 10.1111/pce.13511
Niinemets, U., Bilger, W., Kull, O., Tenhunen, J. D. (1998). Acclimation to high irradiance in temperate deciduous trees in the field: changes in xanthophyll cycle pool size and in photosynthetic capacity along a canopy light gradient. Plant Cell Environ. 21 (12), 1205–1218. doi: 10.1046/j.1365-3040.1998.00364.x
Niinemets, U., Tenhunen, J. D. (1997). A model separating leaf structural and physiological effects on carbon gain along light gradients for the shade-tolerant species acer saccharum. Plant Cell Environ. 20 (7), 845–866. doi: 10.1046/j.1365-3040.1997.d01-133.x
Niyogi, K. K., Bjorkman, O., Grossman, A. R. (1997). The roles of specific xanthophylls in photoprotection. Proc. Natl. Acad. Sci. 94 (25), 14162–14167. doi: 10.1073/pnas.94.25.14162
Onoda, Y., Wright, I. J., Evans, J. R., Hikosaka, K., Kitajima, K., Niinemets, U., et al. (2017). Physiological and structural tradeoffs underlying the leaf economics spectrum. New Phytol. 214 (4), 1447–1463. doi: 10.1111/nph.14496
Qian, X., Liu, L., Croft, H., Chen, J. (2019). C3 plants converge on a universal relationship between leaf maximum carboxylation rate and chlorophyll content. Biogeosci. Discuss., 1–18. doi: 10.5194/bg-2019-228
Qian, X., Liu, L., Croft, H., Chen, J. (2021). Relationship between leaf maximum carboxylation rate and chlorophyll content preserved across 13 species. J. Geophysical Research: Biogeosciences 126 (2). doi: 10.1029/2020jg006076
Quebbeman, J. A., Ramirez, J. A. (2016). Optimal allocation of leaf-level nitrogen: implications for covariation of vcmax and jmax and photosynthetic downregulation. J. Geophys Res-Biogeo 121 (9), 2464–2475. doi: 10.1002/2016jg003473
Ritz, T., Damjanović, A., Schulten, K., Zhang, J.-P., Koyama, Y. (2000). Efficient light harvesting through carotenoids. Photosynth Res. 66 (1-2), 125–144. doi: 10.1023/A:1010750332320
Robertson, G. P., Paul, E. A., Harwood, R. R. (2000). Greenhouse gases in intensive agriculture: Contributions of individual gases to the radiative forcing of the atmosphere. Science. 289(5486), 1922–1925. doi: 10.1126/science.289.5486.1922
Rogers, A., Medlyn, B. E., Dukes, J. S., Bonan, G., von Caemmerer, S., Dietze, M. C., et al. (2017). A roadmap for improving the representation of photosynthesis in earth system models. New Phytol. 213, 22–42. doi: 10.1111/nph.14283
Sage, R. F., Pearcy, R. W., Seemann, J. R. (1987). The nitrogen use efficiency of c-3 and c-4 plants .3. leaf nitrogen effects on the activity of carboxylating enzymes in chenopodium-album (L) and amaranthus-retroflexus (L). Plant Physiol. 85 (2), 355–359. doi: 10.1104/pp.85.2.355
Sharkey, T. D. (2016). What gas exchange data can tell us about photosynthesis. Plant Cell Environ. 39 (6), 1161–1163. doi: 10.1111/pce.12641
Sharkey, T. D., Bernacchi, C. J., Farquhar, G. D., Singsaas, E. L. (2007). Fitting photosynthetic carbon dioxide response curves for c-3 leaves. Plant Cell Environ. 30 (9), 1035–1040. doi: 10.1111/j.1365-3040.2007.01710.x
Smith, N. G., Dukes, J. S. (2012). Plant respiration and photosynthesis in global-scale models: incorporating acclimation to temperature and CO2. Global Change Biol. 19 (1), 45–63. doi: 10.1111/j.1365-2486.2012.02797.x
Stylinski, C., Gamon, J., Oechel, W. (2002). Seasonal patterns of reflectance indices, carotenoid pigments and photosynthesis of evergreen chaparral species. Oecologia 131 (3), 366–374. doi: 10.1007/s00442-002-0905-9
Taylor, A. M., Amiro, B. D., Fraser, T. J. (2013). Net CO2 exchange and carbon budgets of a three-year crop rotation following conversion of perennial lands to annual cropping in Manitoba, Canada. Agric.For. Meteorol. 182, 67–75. doi: 10.1016/j.agrformet.2013.07.008
Voncaemmerer, S., Farquhar, G. D. (1981). Some relationships between the biochemistry of photosynthesis and the gas-exchange of leaves. Planta 153 (4), 376–387. doi: 10.1007/Bf00384257
Walker, A. P., Beckerman, A. P., Gu, L. H., Kattge, J., Cernusak, L. A., Domingues, T. F., et al. (2014). The relationship of leaf photosynthetic traits - V-cmax and j(max) - to leaf nitrogen, leaf phosphorus, and specific leaf area: a meta-analysis and modeling study. Ecol. Evol. 4 (16), 3218–3235. doi: 10.1002/ece3.1173
Wang, S. Q., Li, Y., Ju, W. (2020). Estimation of leaf photosynthetic capacity from leaf chlorophyll content and leaf age in a subtropical evergreen coniferous plantation. J. Geophysical Research: Biogeosciences 125 (3). doi: 10.1029/2019JG005020
Watanabe, M., Hoshika, Y., Inada, N., Koike, T. (2018). Photosynthetic activity in relation to a gradient of leaf nitrogen content within a canopy of siebold's beech and Japanese oak saplings under elevated ozone. Sci. Total Environ. 636, 1455–1462. doi: 10.1016/j.scitotenv.2018.04.423
Wong, C. Y. S., D'Odorico, P., Bhathena, Y., Arain, M. A., Ensminger, I. (2019). Carotenoid based vegetation indices for accurate monitoring of the phenology of photosynthesis at the leaf-scale in deciduous and evergreen trees. Remote Sens. Environ. 233, 111407. doi: 10.1016/j.rse.2019.111407
Yang, P., Liu, Z., Zhao, Y., Cheng, Y., Huang, J. (2020). Comparative study of vegetative and reproductive growth of different tea varieties response to different fluoride concentrations stress. Plant Physiol. Bioch. 154, 419–428. doi: 10.1016/j.plaphy.2020.05.038
Yang, X., Tang, J. W., Mustard, J. F. (2014). Beyond leaf color: comparing camera-based phenological metrics with leaf biochemical, biophysical, and spectral properties throughout the growing season of a temperate deciduous forest. J. Geophys Res-Biogeo 119 (3), 181–191. doi: 10.1002/2013jg002460
Zhang, Y. G., Guanter, L., Berry, J. A., Joiner, J., van der Tol, C., Huete, A., et al. (2014). Estimation of vegetation photosynthetic capacity from space-based measurements of chlorophyll fluorescence for terrestrial biosphere models. Global Change Biol. 20 (12), 3727–3742. doi: 10.1111/gcb.12664
Zhang, Q. Y., Middleton, E. M., Margolis, H. A., Drolet, G. G., Barr, A. A., Black, T. A. (2009). Can a satellite-derived estimate of the fraction of PAR absorbed by chlorophyll (FAPAR(chl)) improve predictions of light-use efficiency and ecosystem photosynthesis for a boreal aspen forest? Remote Sens. Environ. 113 (4), 880–888. doi: 10.1016/j.rse.2009.01.002
Zhang, Y. J., Xie, Z. K., Wang, Y. J., Su, P. X., An, L. P., Gao, H. (2011). Effect of water stress on leaf photosynthesis, chlorophyll content, and growth of oriental lily. Russ. J. Plant Physl. 58 (5), 844–850. doi: 10.1134/S1021443711050268
Zhu, K., Sun, Z., Zhao, F., Yang, T., Li, S. (2020). Remotely sensed canopy resistance model for analyzing the stomatal behavior of environmentally-stressed winter wheat. ISPRS J. Photogrammetry Remote Sens. 168, 197–207. doi: 10.1016/j.isprsjprs.2020.08.012
Keywords: leaf chlorophyll content, leaf carotenoid content, leaf nitrogen content, maximum rate of carboxylation, photosynthetic capacity
Citation: Li Y, Wang Q, Fu T, Qiao Y, Hao L and Qi T (2023) Leaf photosynthetic pigment as a predictor of leaf maximum carboxylation rate in a farmland ecosystem. Front. Plant Sci. 14:1225295. doi: 10.3389/fpls.2023.1225295
Received: 19 May 2023; Accepted: 19 June 2023;
Published: 04 July 2023.
Edited by:
Haoran Zhou, Yale University, United StatesReviewed by:
Yonggang Chi, Zhejiang Normal University, ChinaMingjie Xu, Shenyang Agricultural University, China
Copyright © 2023 Li, Wang, Fu, Qiao, Hao and Qi. This is an open-access article distributed under the terms of the Creative Commons Attribution License (CC BY). The use, distribution or reproduction in other forums is permitted, provided the original author(s) and the copyright owner(s) are credited and that the original publication in this journal is cited, in accordance with accepted academic practice. No use, distribution or reproduction is permitted which does not comply with these terms.
*Correspondence: Tao Qi, cWl0YW9AaGViZXUuZWR1LmNu