 Juan Yin
 Yingpan Yang1†
 Rasu Eeswaran
 Zhenghu Ma
- 1School of Civil and Water Engineering, Ningxia University, Yinchuan, Ningxia, China
- 2Engineering Research Center for Efficient Utilization of Water Resources in Modern Agriculture in Arid Regions, Yinchuan, China
- 3Ningxia Research Center of Technology on Water-saving Irrigation and Water Resources Regulation, Yinchuan, China
- 4Department of Plant, Soil and Microbial Sciences, Michigan State University, East Lansing, MI, United States
- 5Department of Agronomy, Faculty of Agriculture, University of Jaffna, Kilinochchi, Sri Lanka
Potato is one of the key food crops and China is the largest potato producer in the world. However water scarcity is the major constraint to increase the productivity of potato in the arid regions such as Ningxia in northwest China where this crop is extensively cultivated. The overall objective of this study was to optimize the irrigation for potato cultivated under the drip irrigation. To do this, the AquaCrop model was calibrated and validated using the data obtained from two years of field experiment. Then, the calibrated crop model was used to simulate growth and tuber yield of potato in response to 30 different irrigation schemes under two different irrigation scenarios. The crop model evaluation parameters namely, the root mean square error (RMSE), the index of agreement (d), the normalized root mean square error (NRMSE) and the coefficient of determination (R2) showed that the AquaCrop model could simulate the growth and yield of potato under the drip irrigation with different irrigation treatments with reasonable accuracy. Furthermore, yield of potato has increased with increasing amount of total irrigation under drip irrigation; however, yield begins to decline when the amount of total irrigation exceeds 2500 m3 ha-1. The study also found that the optimum irrigation schedule for potato was 20 mm of irrigation quota at 7 days of irrigation cycle (i.e., 1800 m3 ha-1 or 180 mm of total irrigation). The above irrigation scheduling has achieved 46.77 t ha-1 of tuber yield with 15.74 kg m-3 of water use efficiency. These findings may be evaluated in potato cultivation across different climate and soil conditions for wide applicability at different arid regions of the world.
1 Introduction
China’s Ningxia Hui Autonomous Region is one of the arid regions in the world, where water resources are very limited and socio-economic development is almost dependent on the effective supply of water from the transiting Yellow River (Yao et al., 2020), with water scarcity and drought being the main challenges for potato production in the region. The potato is the fourth largest food crop in the world after maize, rice and wheat, in the order of extent of the area planted (Tang et al., 2018). Furthermore, China is world’s leading potato producer with more than 90 million metric tonnes of potatoes produced from 4.8 million hectares in 2018 (Wang et al., 2023). Meanwhile, different irrigation quotas and irrigation frequencies have a significant effect on the growth and yield of potato (Yang et al., 2023). Therefore, the development of a reasonable irrigation regime and the efficient use of limited water resources (Sammis et al., 2012) is of great importance to the agricultural development of the arid Ningxia region.
The AquaCrop model is one of the widely used process-based crop models and can simulate biomass production and yields of crops, especially in response to water (Abedinpour et al., 2012). Compared with other crop simulation models, the AquaCrop model has the advantages namely, requiring of fewer input parameters, wide applicability, simple user interface, intuitiveness, and high accuracy. The model simulates crop yield through crop canopy cover and harvest index under different agronomic management and irrigation patterns (Shirazi et al., 2021). Currently, researchers from the United States, Canada and Syria have conducted substantial amount of research on localized debugging and validation of AquaCrop model parameters, with models mainly on wheat (Jalil et al., 2020), maize (He et al., 2021) and rice (Kim et al., 2021).
There are studies on simulating the growth and yield of potato in other regions, but fewer studies have been reported on the optimization of irrigation for potato under the drip irrigation in the arid regions such as Ningxia in China, where supplemental irrigation plays a huge role in determining crop productivity. Therefore, the objectives of this study are 1) to investigate the applicability of the AquaCrop model to simulate growth and yield of potatoes grown under drip irrigation, 2) to examine the effects of different irrigation quota and irrigation cycles on the yield and water productivity of potatoes, and 3) to determine the optimal irrigation regime to increase the yield and water productivity of potatoes grown under drip irrigation in an arid environment.
2 Materials and methods
The methodology involved in this research study is sequentially described in this section.
2.1 Experimental location
The experimental site was located in Concentric County, Wuzhong City, Ningxia (36°48′2″N; 106°21′53″E, altitude 1489 m, amsl), a typical area in the central arid zone of Ningxia. The study area has a continental arid climate, with a large temperature difference between day and night, year-around drought and little rainfall, long daytime and strong surface evaporation, with an average multi-year rainfall around 270 mm and an annual evaporation of about 2325 mm. The soil type was sandy loam and the soil properties in the tillage layer of the experimental site before sowing were as follows: total salt of 0.6 g kg-1, organic matter of 6.65 g/kg-1, alkaline nitrogen of 38 mg/kg-1, fast-acting phosphorus of 3.94 mg kg-1, fast-acting potassium of 130 mg kg-1, total nitrogen of 0.027%, total phosphorus of 0.064% and 1.74% of total potassium.
2.2 Experimental design
The field experiment was conducted for two cropping seasons, from April 2019 to October 2020. The field was found with less variability in slope and other uncontrolled variables. Therefore, the experiment was designed as a single-factor completely randomized field experiment with six treatments and three replications of varying irrigation quota under drip irrigation for the period of two years, The trial is repeated in the second year (i.e., 2020) at the same trial site and the irrigation rates were adjusted according to the first year’s trial referring to the “Ningxia Potato Drip Irrigation Planting Technology Regulations” issued by the Water Resources Department of Ningxia Hui Autonomous Region in 2017 (Ningxia Water Resources Department, 2017). The details of the experiment and the treatments are shown in Table 1, and the amount of irrigation applied for each treatment at different growth stages of potato is presented in Table 2.
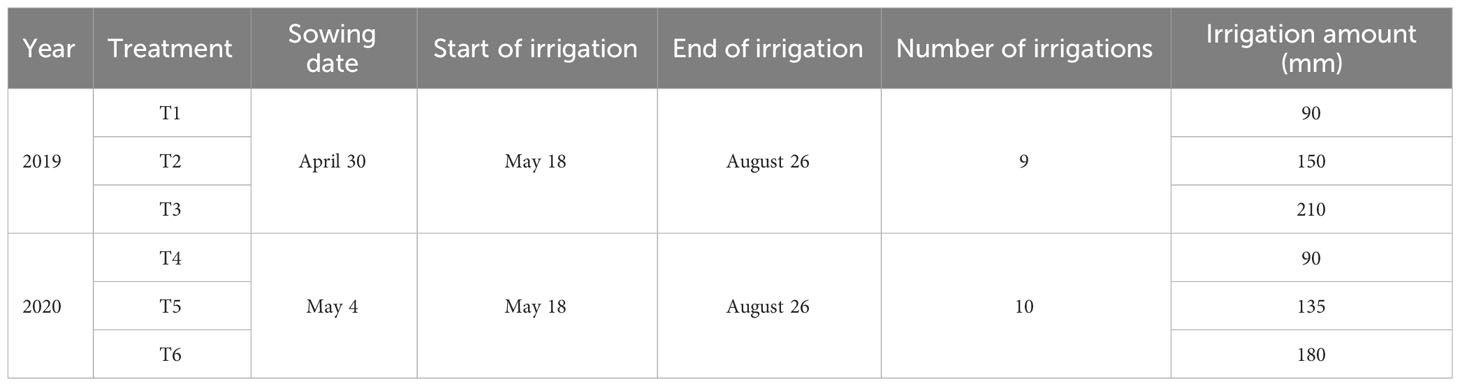
Table 1 Details of the field experiments and treatments.
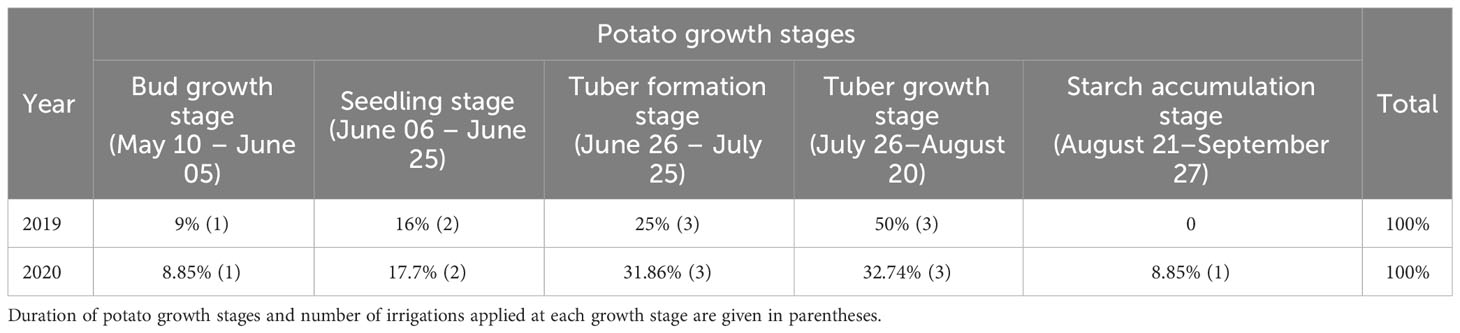
Table 2 Number of irrigations applied at different growth stages of potato during the experimental years of 2019 and 2020.
The potato crops were planted at an inter-row spacing of 60 cm and intra-row spacing of 50 cm, with each row planted with 10 plants and each plot planted with 40 potato plants, with a potato planting density of 33,345 plants ha-1, as explained in Figure 1A. The test plots were all 17.6 m2 in size, 5.5 m long and 3.2 m wide, surrounded by protected rows of 1 m wide between plots and 4.5 m wide at the periphery, with three replications of nine plots for each treatment in the two-year trial, as shown in Figure 1B.
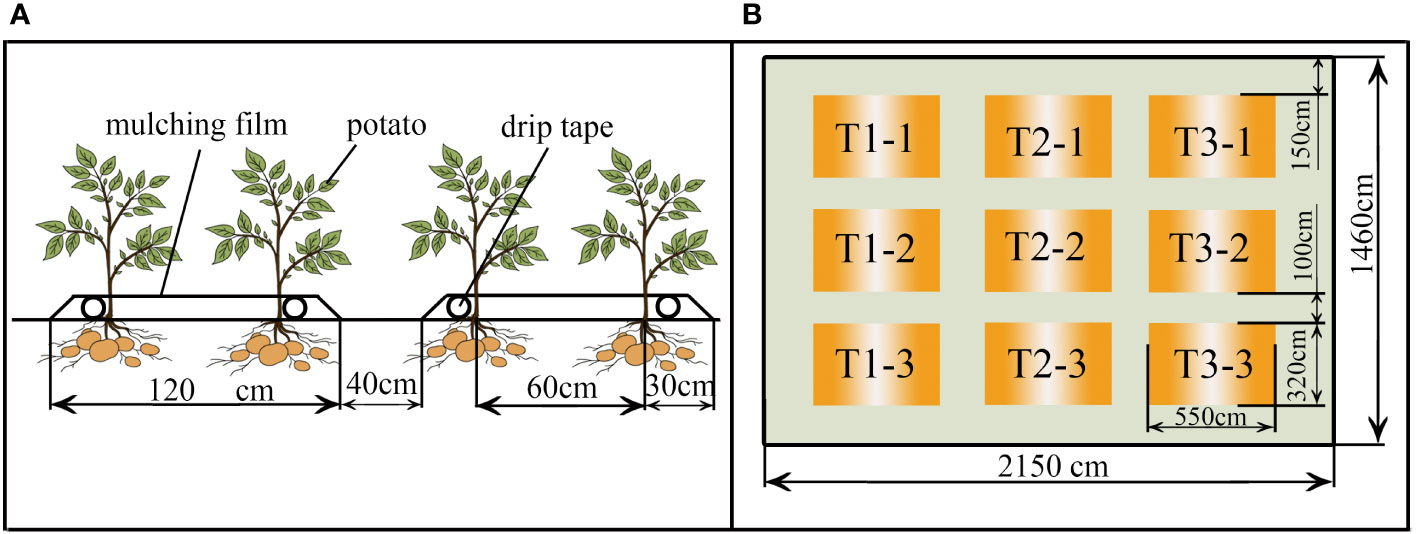
Figure 1 The arrangement of potato crops (A) in this field experiment and the experimental layout of the field trial (B).
The drip irrigation pipe was embedded to supply the water with an inner diameter of 16mm, a wall thickness of 0.15mm, a working pressure of 0.1 KPa, a drip-head flow rate of 2L h-1, and a drip-head spacing of 50cm in such a way that one drip-head is serving one potato plant. Each plot had an independent unit of irrigation control system, including a water meter, gate valve and pressure gauge, etc. Crops were fertilized based on the fertilizer recommendations for potato with Urea (46% nitrogen, 210 kg ha-1), Calcium superphosphate (26% phosphorus, 82.5 kg ha-1) and Potassium sulfate (50% potassium, 150 kg ha-1). The nitrogen fertilizer was applied as split application with water at six times during the seedling stage, tuber formation stage, tuber growth stage and starch accumulation stage at the ratio of 1:2:2:1, respectively. Other crop management practices such as weeding and crop protection were carried out in accordance with the recommended agronomic practices in the region. The potato crop was harvested on September 27 at both years of the experiment.
2.3 Crop measurements
2.3.1 Leaf area index
Leaf area was measured at all growth stages of potato using the LI-3000C portable leaf area meter (LI-COR Biosciences, Lincoln, NE, United States). The leaf area index was calculated as the ratio of total leaf area to the land area (Yan et al., 2021).
2.3.2 Canopy cover
Canopy cover is an important indicator of the crop growth process simulated by the AquaCrop model and is calculated as follows (Hsiao et al., 2009).
where CC is canopy coverage and LAI is the leaf area index.
2.3.3 Above-ground biomass
Three representative plants were randomly selected from each plot at each growth stage of potato, the roots, stems, leaves and tubers were separated and washed with water. The water on the plant samples was blotted by filter paper and the samples were placed in archive bags. These samples were oven dried at 105°C for 30 minutes and then dried at 75°C to a constant weight. The biomass content of each plant part was determined using an electronic balance after cooling to the room temperature (Högy and Fangmeier, 2009).
2.3.4 Tuber yield
An area of 2 x 2 m of potato crops were randomly selected from each treatment plot, weighed for individual yield, then the average yield per plant was calculated. The total yield per hectare of potato for each treatment was then calculated according to the planting density.
2.3.5 Water use efficiency
Water use efficiency (WUE) is the amount yield produced per unit of water consumed, and WUE was calculated using the following equation (Ali and Talukder, 2008).
where Y is yield (t ha-1) and ET is the water consumption of potatoes as crop evapotranspiration (mm).
2.4 Principles of AquaCrop modeling
The AquaCrop model takes days as the simulation step, and it can simulate the processes namely, soil water balance, crop growth and development, crop transpiration, aboveground dry matter production, and final yield formation. The AquaCrop model mainly focuses on the response of crop growth and development to water, and its core formula for yield Y is calculated as follows.
where fHI is the adjustment factor, which can be affected by the effects of stresses such as water stress and temperature stress at the time of yield formation and at the time of crop pollination; HI0 is the reference harvest index, and B is the final above-ground biomass at harvest (Vanuytrecht et al., 2014).
In the absence of cold temperature stress, the above-ground biomass B can be calculated from crop’s transpiration (Tr) using the following equation (Vanuytrecht et al., 2014).
Where WP* is the normalized biomass water productivity, Tr is the crop’s transpiration and ET0 is the reference evapotranspiration.
The crop’s transpiration Tr was calculated as follows.
where Ks is the water stress coefficient (i.e., drought or water logging), CC* is the adjusted green canopy cover and KCTr, x is the maximum crop transpiration coefficient (Raes et al., 2009; Vanuytrecht et al., 2014). The version of AquaCrop model used in this study was Version 6.0.
2.5 Data inputs for the AquaCrop model
2.5.1 Meteorological data
The field meteorological data for the period of 2015 – 2020 were obtained from the China Meteorological Data Network (Concentric site: 53810) that consists of maximum temperature, minimum temperature, precipitation, sunshine hours, relative humidity and average wind speed at daily time scale. The reference crop evapotranspiration (ET0) was calculated according to the Penmen-Monteith formula (López-Urrea et al., 2006), as follows.
where ET0 is reference evapotranspiration (mm day-1); Rn is net radiation at the crop surface (MJ m-2 day-1); G is soil heat flux density (MJ m-2 day-1); T is mean daily air temperature at 2 m height (°C); u2 is wind speed at 2 m height (m s-1); es is saturation vapour pressure (kPa); ea is actual vapour pressure (kPa); es-ea is saturation vapour pressure deficit (kPa); Δ is slope vapour pressure curve (kPa °C-1); γ is psychrometric constant (kPa C-1).
The daily rainfall, maximum and minimum temperatures and ET0 from 2015 to 2020 are presented in Figure 2. The rainfall from May-October during the planting phase of the experiment was 234.2 mm and 266.6 mm in 2019 and 2020, respectively.
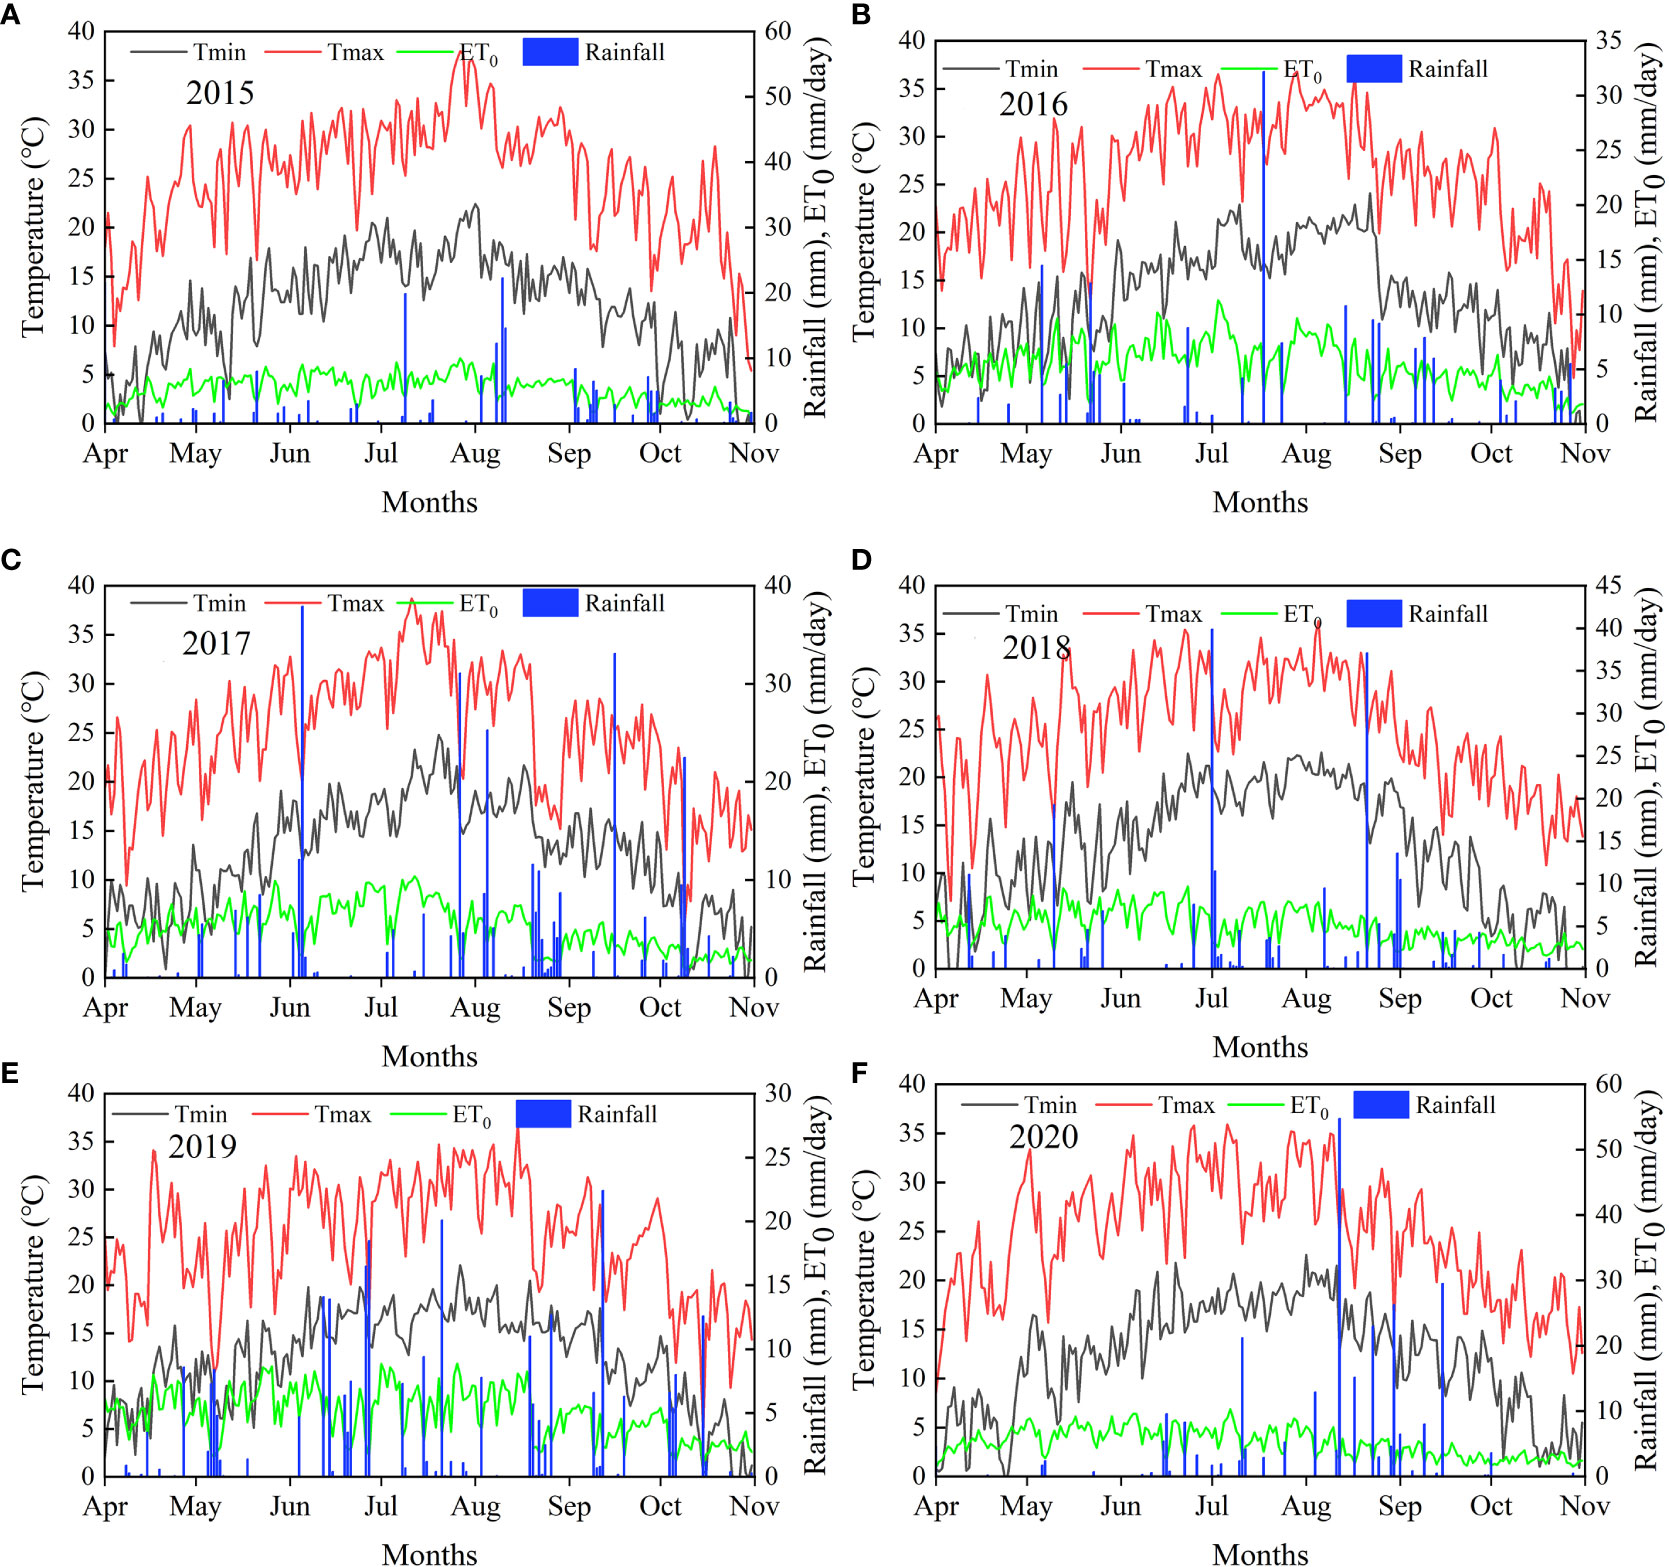
Figure 2 Daily rainfall, minimum temperature (Tmin), maximum temperature (Tmax), and evapotranspiration (ET0) during the period of 2015 – 2020 at the experimental site. Figures (A–F) show meteorological data for 2015, 2016, 2017, 2018, 2019, and 2020, respectively.
2.5.2 Soil data
Soil parameters of AquaCrop model mainly consist of soil compartment number, compartment thickness (m) and associated soil layer number (Vanuytrecht et al., 2014). Before planting the crops, soil samples were taken from five randomly selected plots in the field at different depths, and required soil parameters were measured (Table 3) and imported into the model to create the soil data file (SOL).
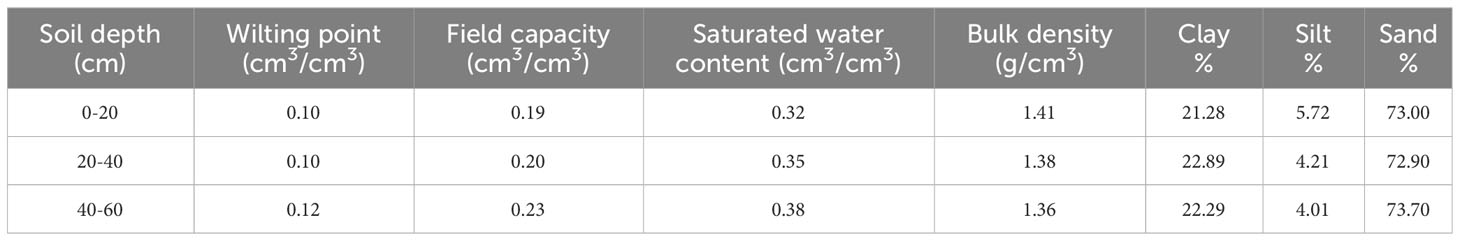
Table 3 Measured soil parameters at different depths of the experimental location.
2.5.3 Crop data
The crop parameter file consists of crop growth, crop evapotranspiration, crop production and moisture, salinity, and temperature stresses. The initial and maximum canopy cover, days taken to flowering, senescence and maturity were obtained from actual field observations, while the water productivity, harvest index, moisture and temperature stress response coefficients of crop production were determined based on the baseline parameters provided by the model. CO2 concentration was derived from the default data recommended by the model namely A1B.CO2, with correction by the ‘trial and error method’. The main model parameters of the calibrated AquaCrop model are presented in Table 4.
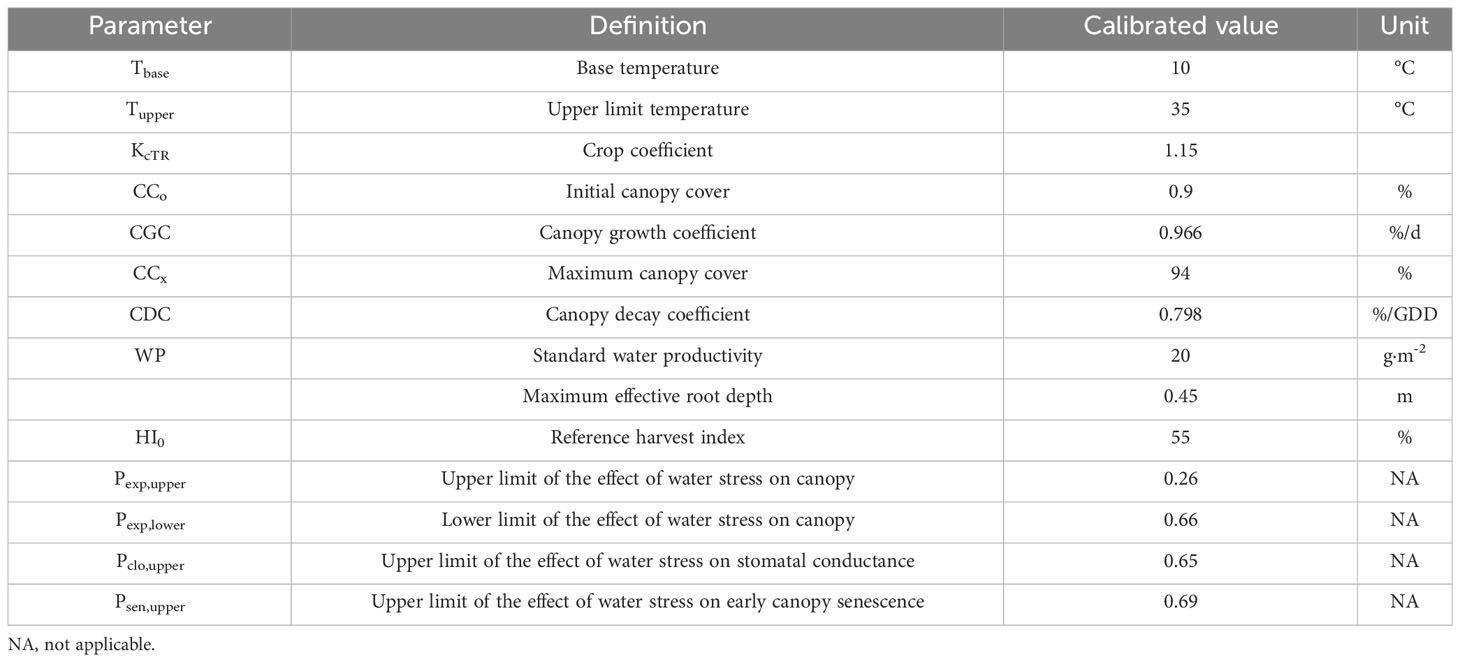
Table 4 Model parameters of the calibrated AquaCrop model.
2.6 Crop model evaluation
To verify the goodness of fit of the simulated values with the measured values, the root mean square error (RMSE), the index of agreement (d), the normalized root mean square error (NRMSE) and the coefficient of determination (R2) were used as model evaluation parameters (Eeswaran et al., 2021).
where, Si is the simulated value, Mi is the measured value, n is the number of measurement samples, and is the average of the measured values. When the calculated values of RMSE and NRMSE are smaller, the more accurate the simulation results will be. When the value of d is close to 1, the better the fit between the simulation results and the measured results and, when the value of R2 is close to 1, the model is reliable, and when the value of R2 is close to 0, the simulation results are average.
2.7 Simulation of different irrigation scenarios
To investigate the effects of different irrigation scenarios (i.e., based on the field experiment) on yield and water use efficiency of potato under the drip irrigation, two different irrigation simulation scenarios were developed based on meteorological data for a period of 6 years from 2015 to 2020. The details of these simulation scenarios are presented in Table 5. Yield, biomass, water use efficiency and water consumption were simulated under both of these simulation scenarios.
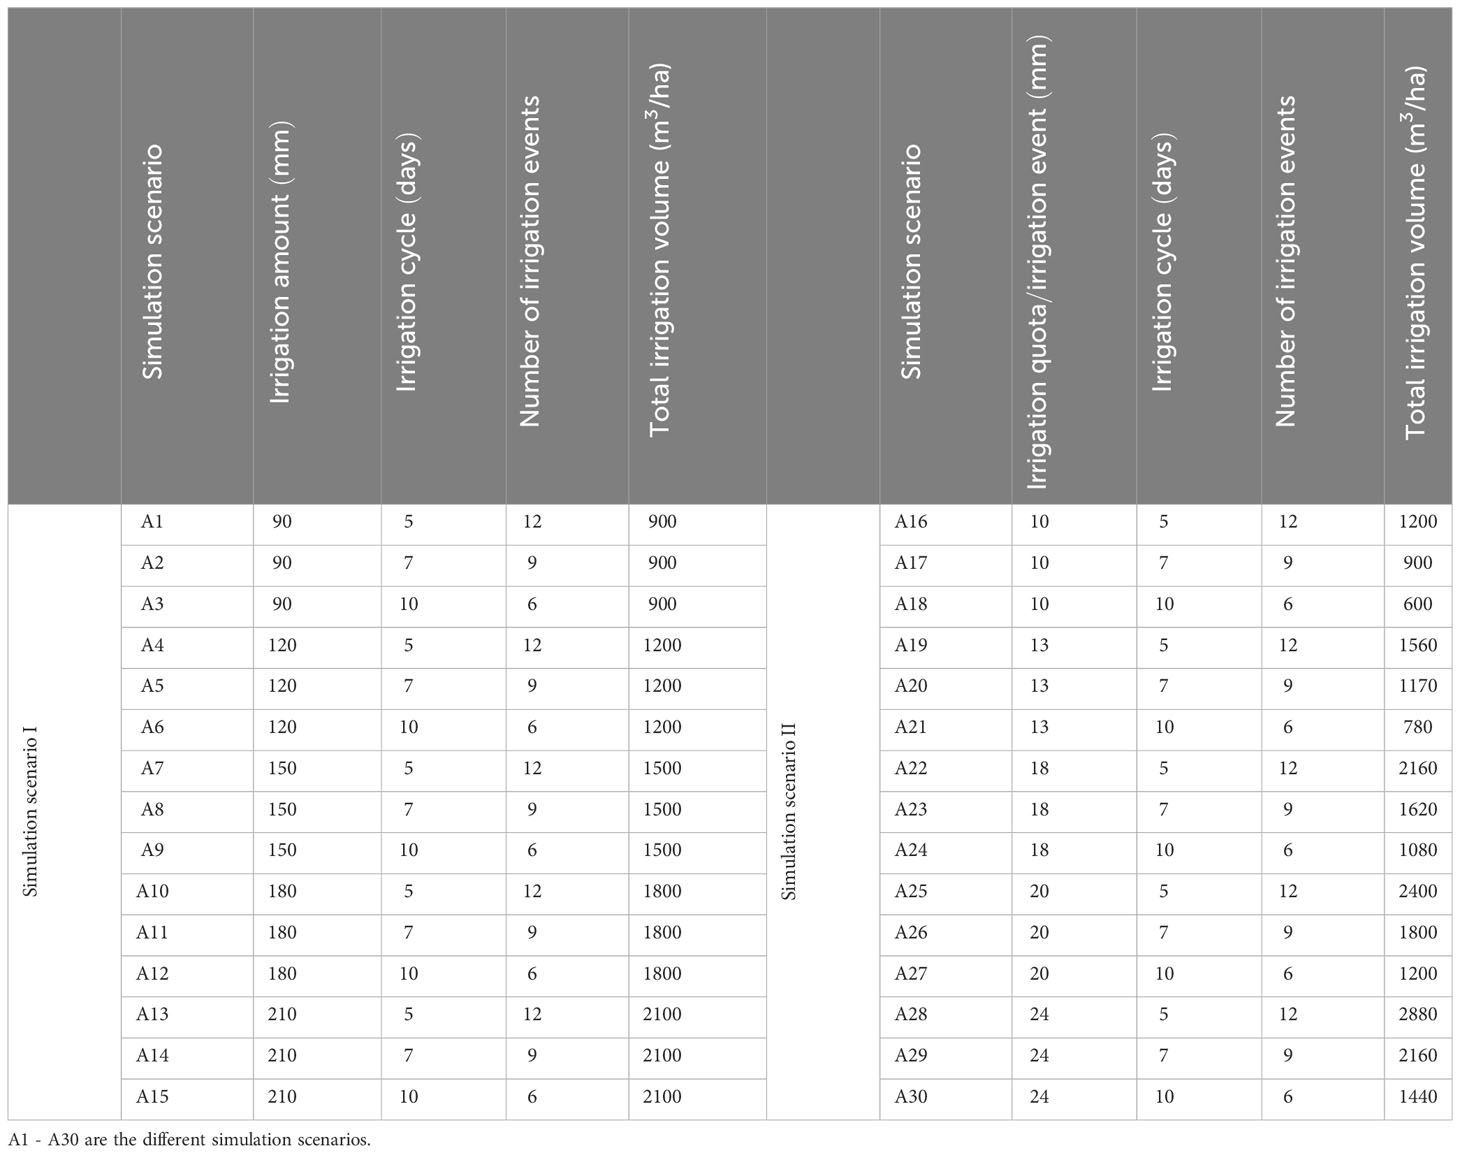
Table 5 Details of the simulation scenarios.
The irrigation amount is the sum of the successive irrigations for the entire crop reproductive period. The irrigation quota is the amount of water that can be filled at an irrigation event. The irrigation cycle is the maximum time interval between two successive irrigations to meet the water requirements of the crop under the conditions of defined irrigation quota and daily water consumption.
3 Results
3.1 Calibration of AquaCrop model
The AquaCrop model was calibrated using the 2019 experimental data for biomass and canopy cover for treatments T1, T2 and T3. The values obtained for the model evaluation parameters are presented in Figure 3. The RMSE values for biomass and canopy cover were less than 10%, indicating very good calibration of the model parameters. Moreover, the NRMSE values for canopy cover and biomass showed moderate (<30%) goodness of fit. As per the index of agreement (d) and the coefficient of determination (R2), excellent (>0.9) goodness of fit was observed between simulated and observed biomass and canopy cover (Eeswaran et al., 2021). These results indicate that the simulated values of the AquaCrop model fit well with the observed values, and the calibrated model parameters can be used to simulate the growth and development process of potato under the drip irrigation in the arid zone of Ningxia.
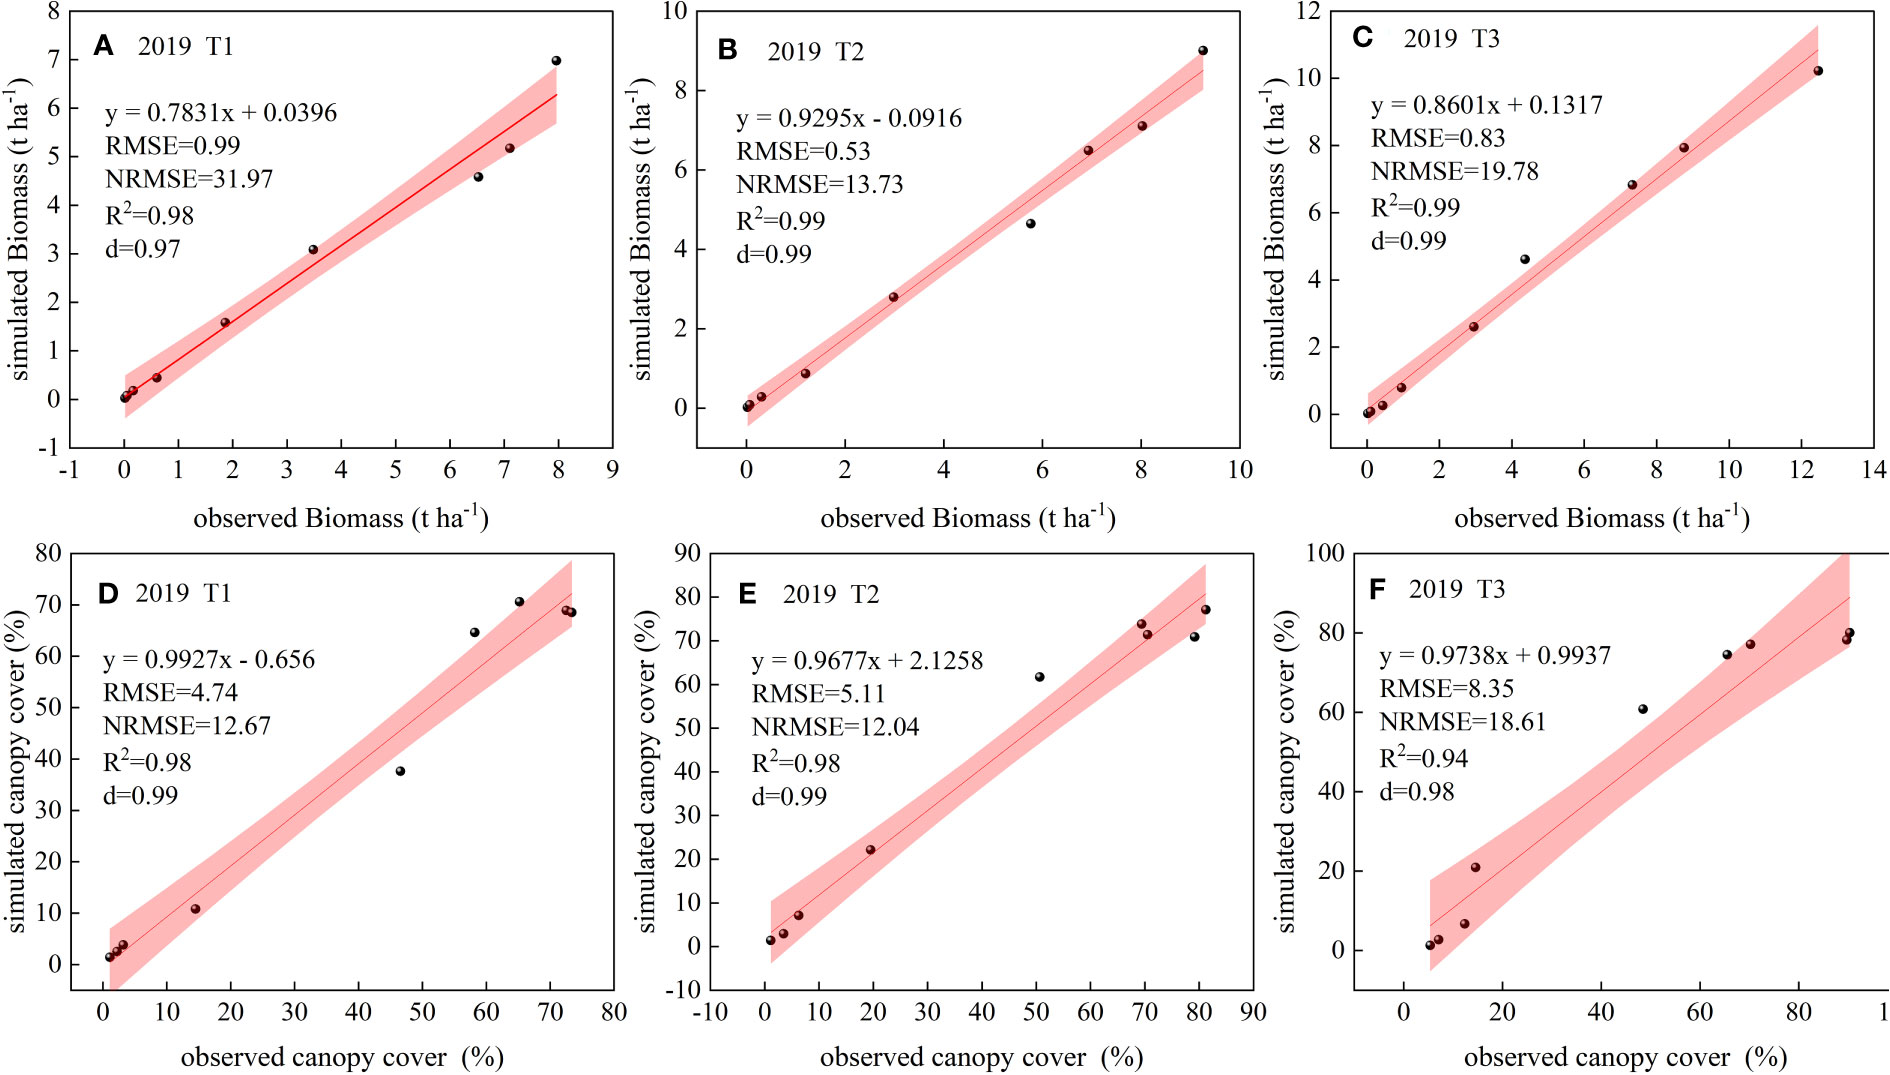
Figure 3 Comparisons of observed and simulated values of biomass (A–C) and canopy cover (D–F) at model calibration with the respective model evaluation parameters.
3.2 Validation of AquaCrop model
The calibrated AquaCrop model was validated using the measured data from T4-T6 irrigation treatments in 2020, and the validation results are shown in Figures 4, 5. Accordingly, the canopy cover was small until 50 days after planting (DAP) and increased rapidly as the potatoes entered the rapid growth phase, and the crop reached the maximum canopy cover at around 110 DAP.
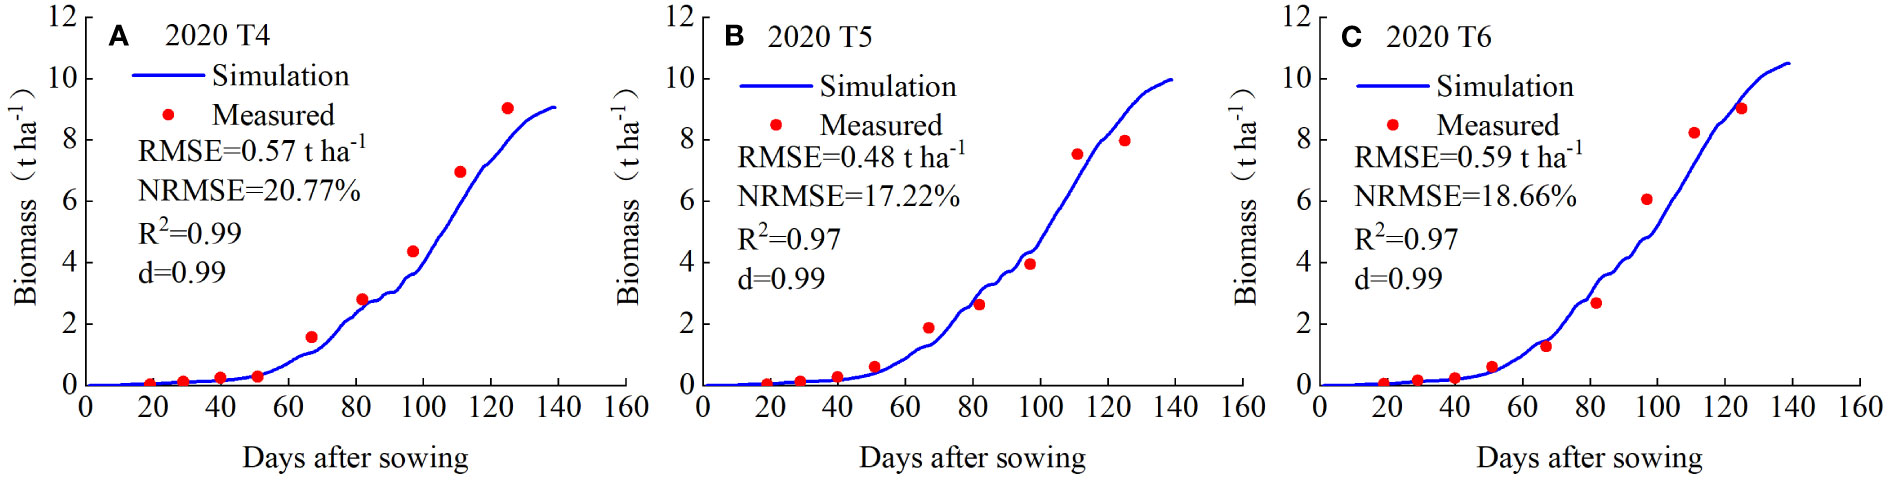
Figure 4 Measured and simulated values of potato biomass for the treatments T4 (A), T5 (B) and T6 (C) in 2020.
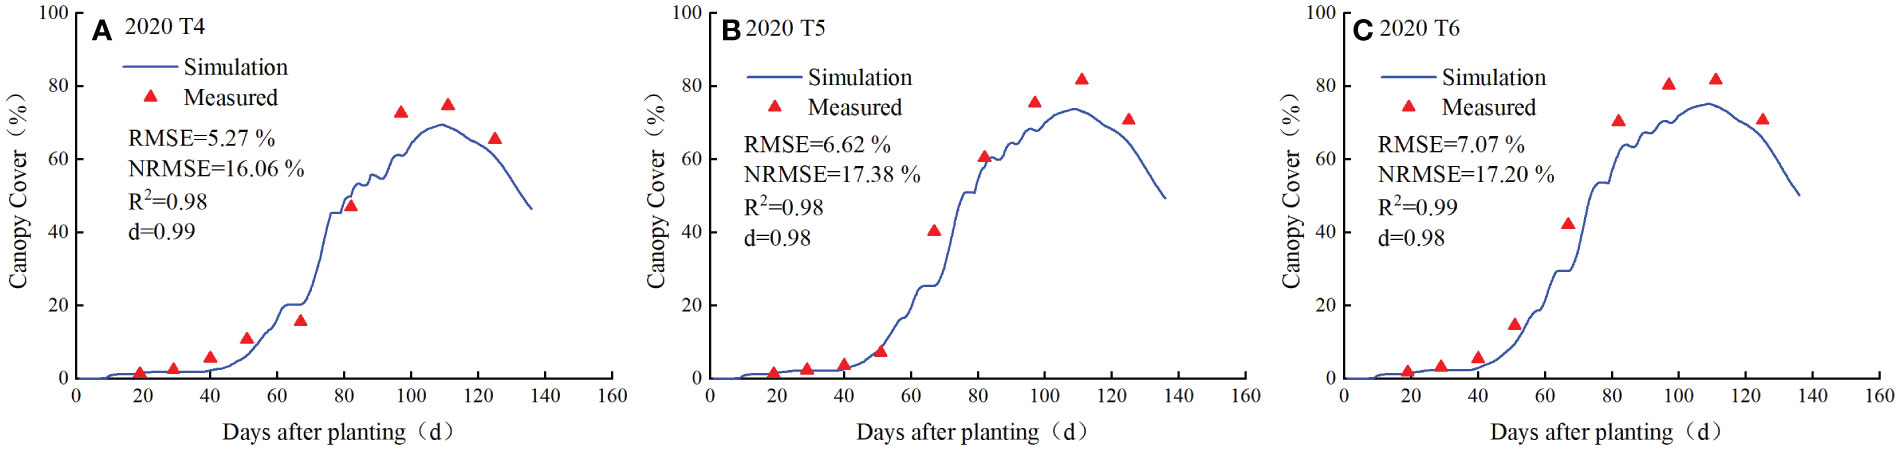
Figure 5 Measured and simulated values of canopy cover of potato for the treatments T4 (A), T5 (B) and T6 (C) in 2020.
As shown in Figure 4, the simulated biomass was consistent with the measured biomass in all three treatments. Potato biomass began to accumulate slowly 20 DAP and entered the rapid growth phase at about 50-60 DAP, the growth rate of potato biomass increased and reached its maximum at about 140 DAP and the growth was ceased thereafter. The goodness of fit indicators (RMSE, NRMSE, R2 and d) highlight that the simulated canopy cover is representative to the measured values under all the treatments (Figure 5). Therefore, the model was reasonably calibrated and validated for the simulation of the growth of potato.
The comparison between the simulated and measured tuber yield of potato when all the treatment results are pooled is presented in Figure 6. Accordingly, the coefficient of determination (R2) obtained was 0.93, highlighting the greater goodness of fit between simulated and measured tuber yield of potatoes.
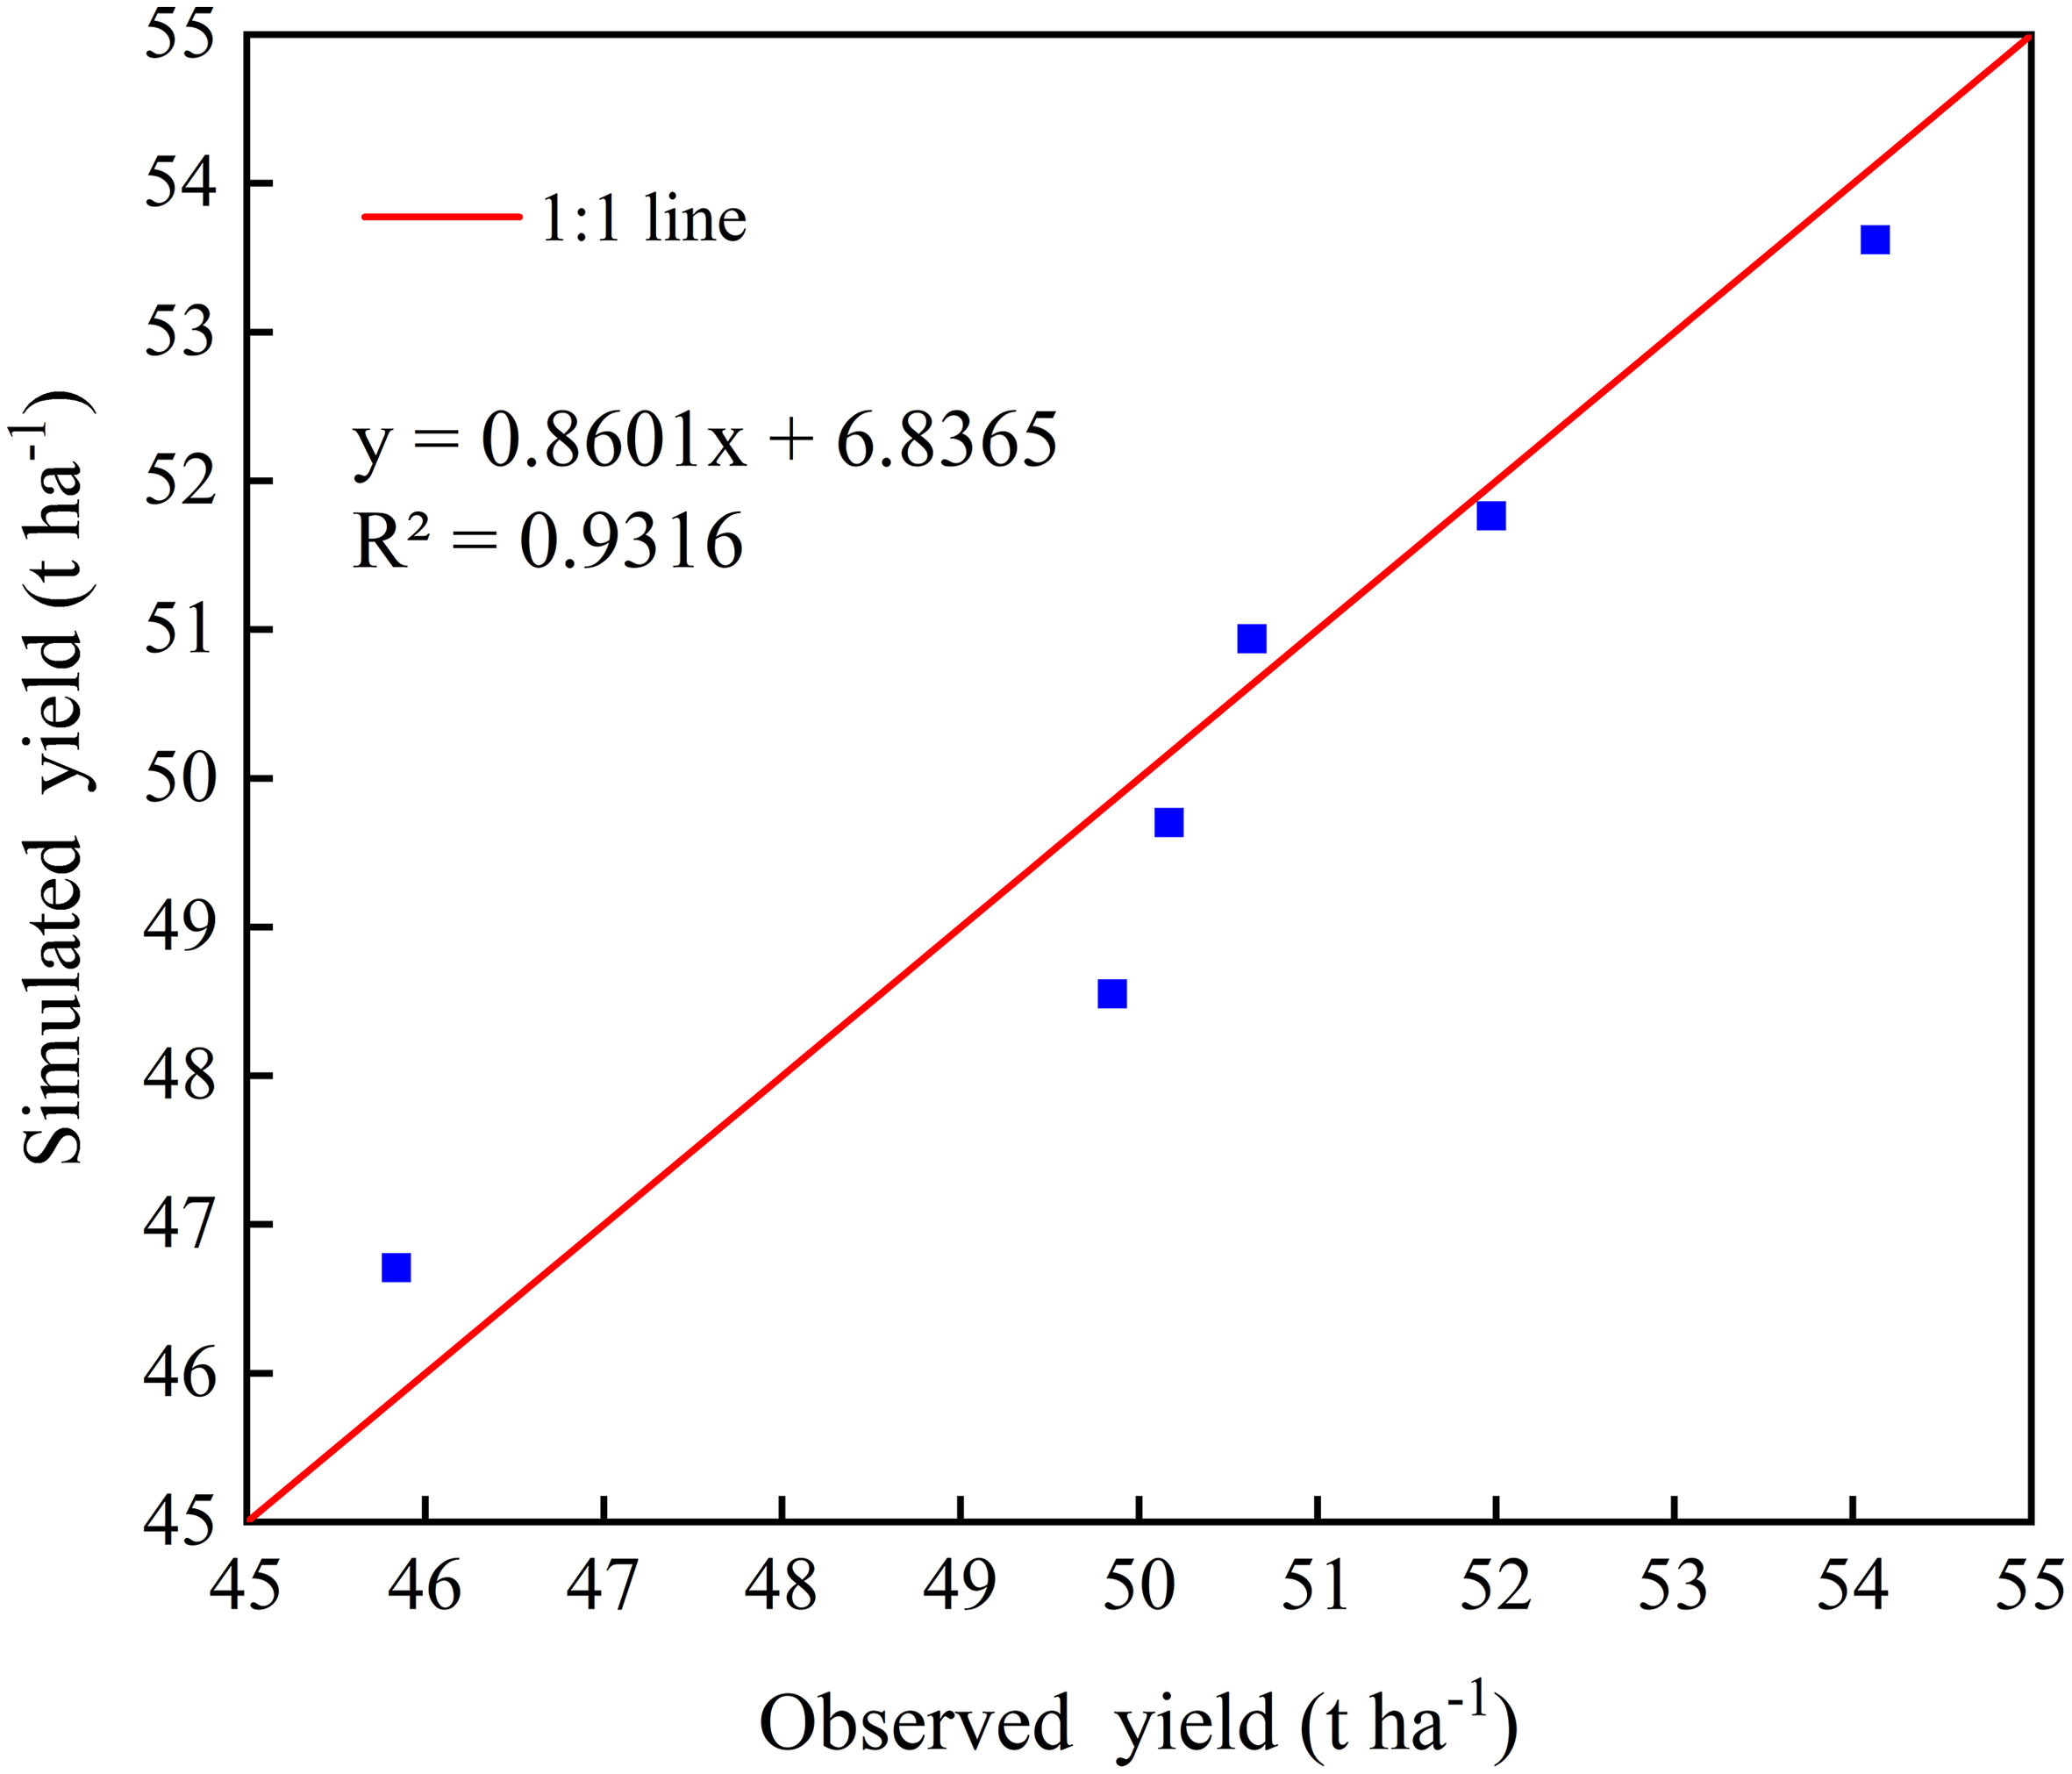
Figure 6 Comparison between measured and simulated tuber yield of potato under all treatments in 2019-2020. The solid red line indicates the line of 1:1 perfect agreement.
3.3 Optimization of irrigation for potatoes grown under drip irrigation
The calibrated and validated AquaCrop model was used to simulate yield and biomass under different irrigation scenarios by importing six years of meteorological data from 2015-2020 and the multi-year averages were calculated. The irrigation cycle is the frequency of irrigation and refers to the longest time interval between irrigations under the condition that the irrigation amount and daily water consumption can meet the water requirements of the crop. Fifteen scenarios with different irrigation frequencies under fixed irrigation amounts were initially simulated (Table 6). Accordingly, tuber yield increased with decreasing frequency at 90 and 120 mm of irrigation, increased with increasing frequency at 150 and 180 mm of irrigation, and increased and then decreased with increasing frequency at 210 mm of irrigation. The maximum tuber yield (43.40 t ha-1) was achieved with the A10 irrigation scheme, and the minimum yield (27.89 t ha-1) was achieved under the A1 scheme. The water use efficiency of potato showed an increasing trend with decreasing irrigation frequency for 90, 120, 150 and 210 mm of irrigation, and a decreasing trend with decreasing irrigation frequency for 180 mm of irrigation, with a maximum water use efficiency being 12.97 kg m-3 under the A10 scheme. Therefore, the A10 scheme increases both the tuber yield and water use efficiency under simulation scenario I (Table 6).
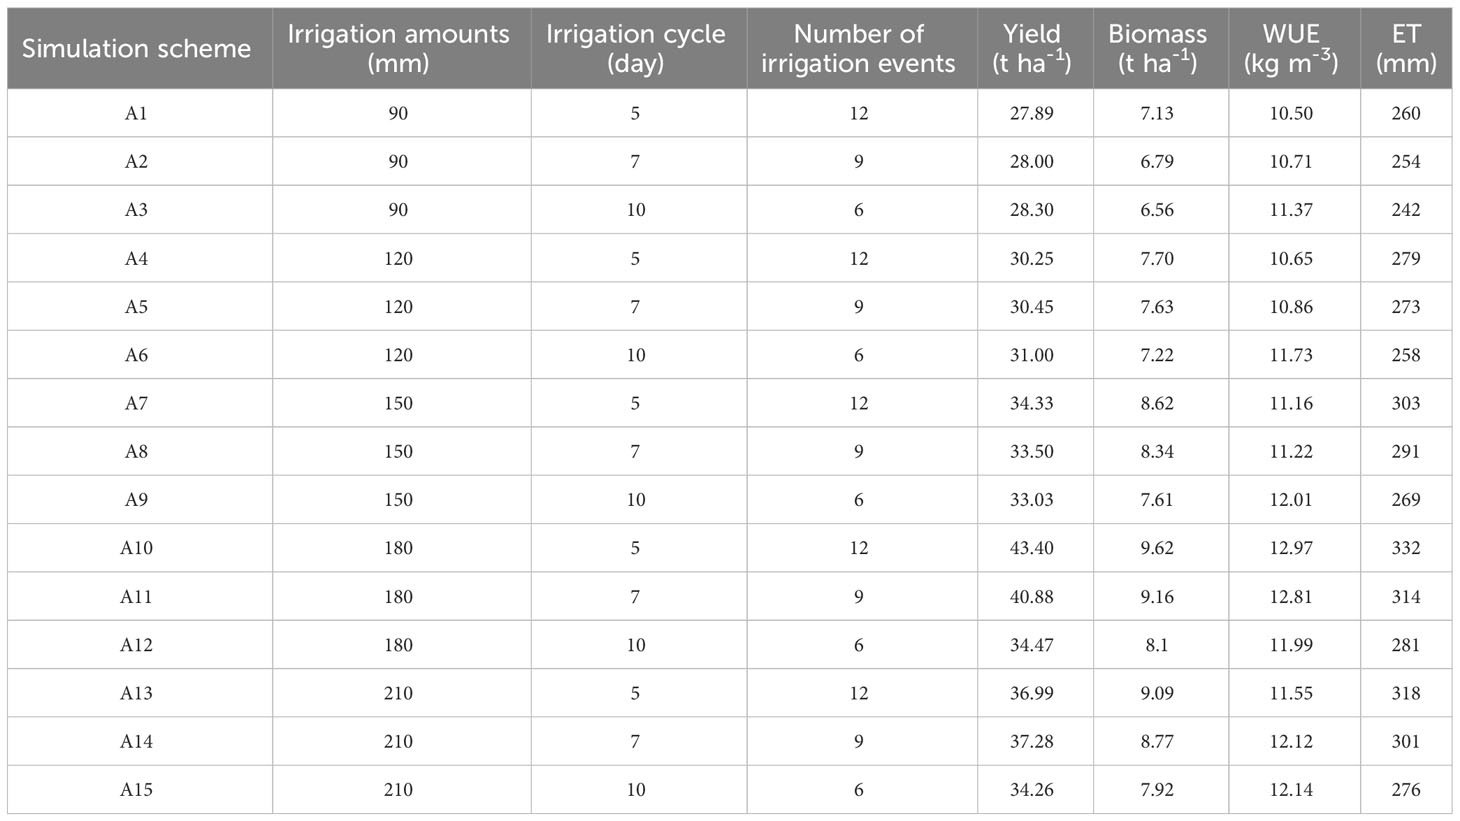
Table 6 Tuber yield, biomass, water use efficiency (WUE) and evapotranspiration (ET) of potato under simulation scenario I.
The simulation of 15 scenarios with different irrigation frequencies at fixed irrigation quota in Table 7 shows that the yield increases with decreasing irrigation frequency at the same irrigation quota, with the highest yield (49.76 t ha-1) and biomass (10.53 t ha-1) at an irrigation quota of 20 mm and 5 days irrigation cycle in scenario A25. The water use efficiency tends to decrease and then increase with decreasing irrigation frequency at 10, 13 and 18 mm of irrigation quota, and decreases with decreasing irrigation frequency at 24 mm of irrigation quota, while it increases and then decreases at 20 mm of irrigation quota The highest water use efficiency (15.74 kg m-3) and yield of 46.77 t ha-1 obtained at 7 days of irrigation cycle under the simulation scheme A26.
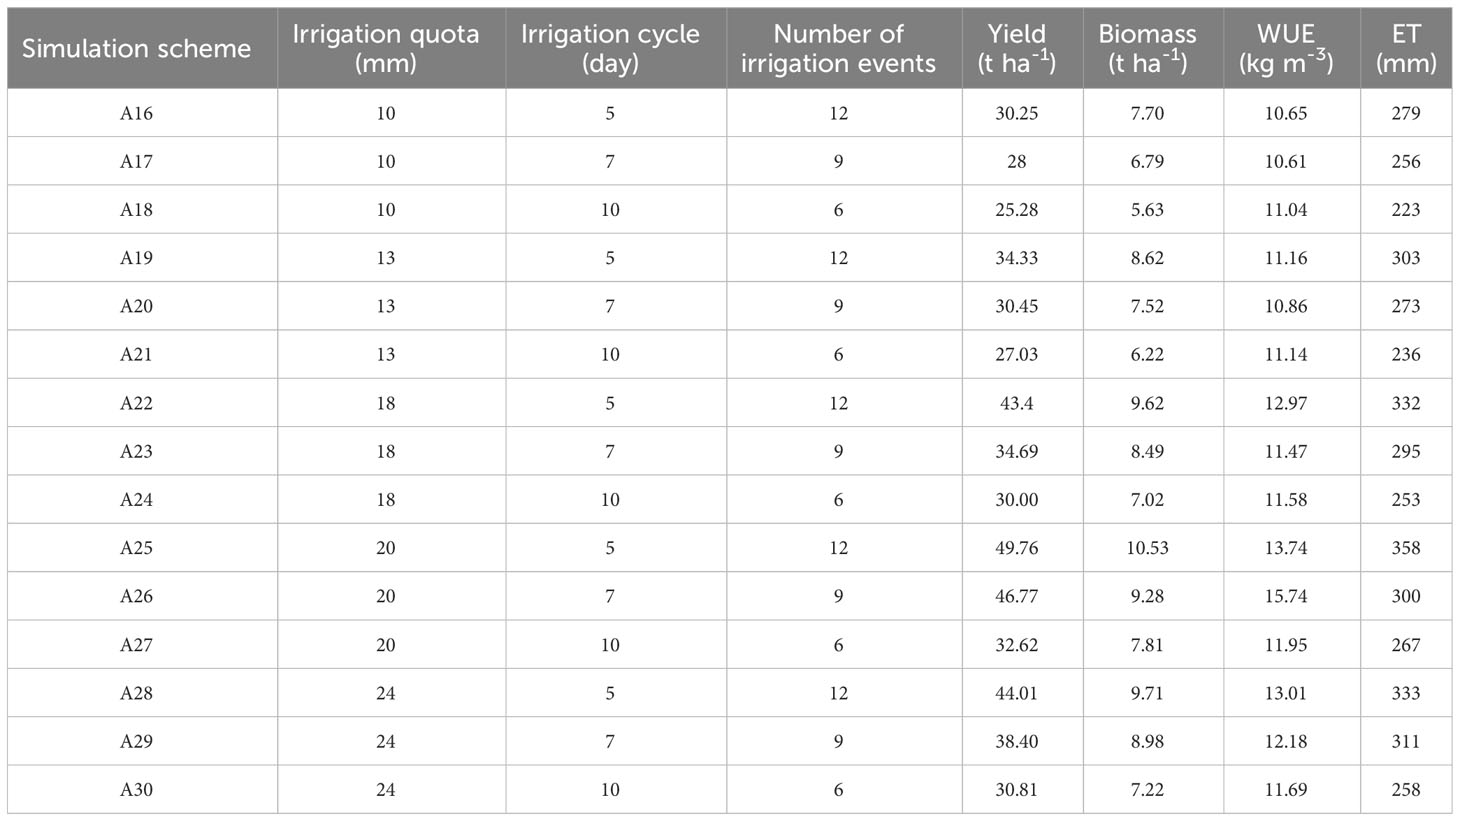
Table 7 Tuber yield, biomass, ET and water use efficiency (WUE) and evapotranspiration (ET) of potato under simulation scenario II.
As the yield was lower with the irrigation cycle at 10 days, we analyzed the data only from the 5 days and 7 days irrigation cycles. Accordingly, the irrigation cycle at 7 days yielded higher when the total irrigation volume was less than 1500 m3 ha-1, and the irrigation cycle at 5 days yielded more when the total irrigation volume was greater than 1500 m3 ha-1. Overall, the potato yield increased and then decreased with increasing irrigation, and the fitted results followed a quadratic equation (Zheng et al., 2013), with R2 of 0.92 for a 5 days irrigation cycle. The R2 was slightly decreased (0.82) for a 7 days irrigation period, with a more pronounced decline in yield with increasing amount of irrigation (Figure 7). Without considering the workload and cost for water resources in the field, the maximum yield (49.76 t ha-1) was achieved from the A25 scheme with 5 days irrigation cycle and 2400 m3 ha-1 of total water application. However, when water economy and field work are considered together, the A26 scheme has produced the optimum yield (46.77 t ha-1).
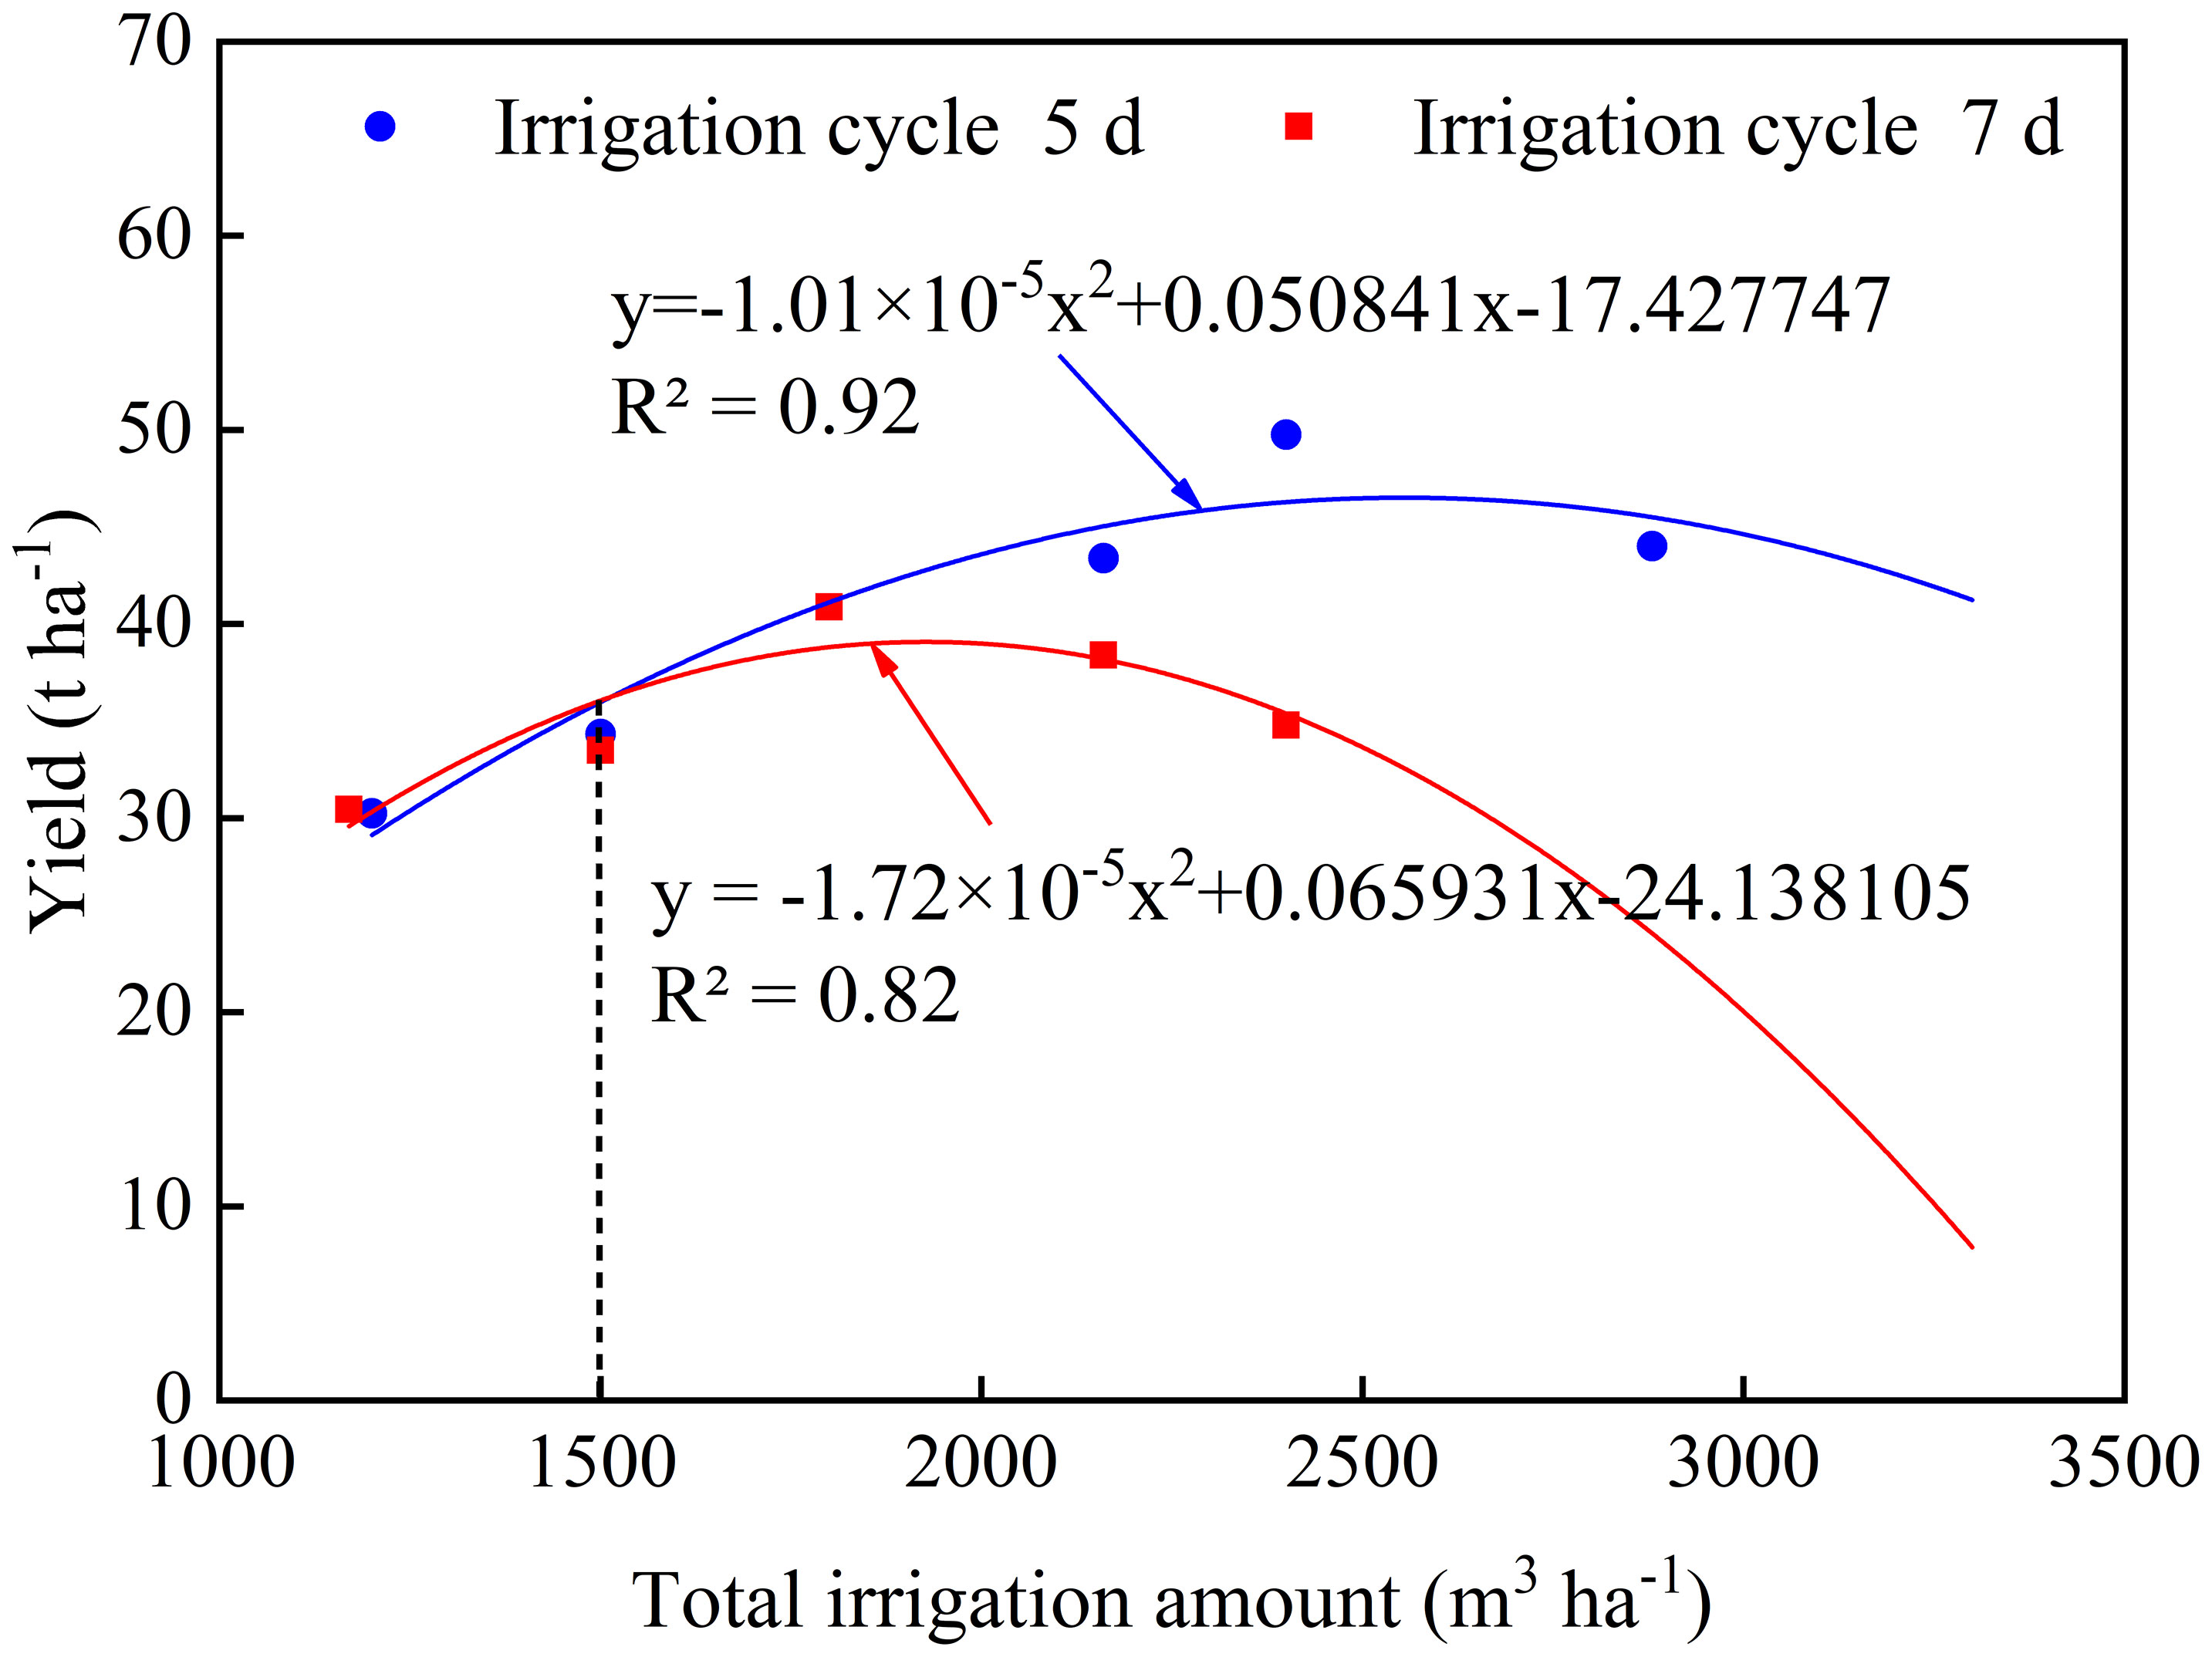
Figure 7 The relationship curve between total irrigation applied and potato yield under different irrigation cycles.
These results provide insights into the growth and yield response of potatoes to different irrigation levels under the drip irrigation thus provide an opportunity to optimize the irrigation recommendations. The implications and utility of these findings are discussed below.
4 Discussion
4.1 Applicability of the AquaCrop model to simulate growth and yield of potato
Although conclusions obtained from field experiments are accurate and reliable, field trials are limited by geographical, climatic, site, financial and human factors (Martins et al., 2018). In this study, two years of field experimental data were used to calibrate and validate the growth and yield of potato under drip irrigation in the arid zone of Ningxia using the AquaCrop model. The values of RMSE, NRMSE, d and R2 for the comparison of simulated vs. observed values of crop biomass, canopy cover and yield have shown the ability of the calibrated AquaCrop model to simulate growth and yield of potato in response to water. Similarly, Rankine et al. (2015) showed that the AquaCrop model can simulate growth and yield of sweet potato under temperate conditions and can be a very useful tool for decision support on irrigation timing and volume. Therefore, this AquaCrop model has reasonable applicability to simulate the growth and yield of potato under the drip irrigation in the arid zone of Ningxia and can provide a theoretical basis for the local potato simulation studies.
4.2 Optimization of different irrigation scenarios for potatoes under the drip irrigation
Crop models have become the most beneficial tools to optimize crop management (Holzworth et al., 2014). Potato production in the central arid zone of Ningxia is substantially affected by water scarcity. Hence, different irrigation scenarios were simulated the calibrated AquaCrop model for potato irrigation fixation with varying irrigation amounts and irrigation cycles. In this paper, we initially simulated 15 scenarios in which the irrigation amount was fixed, and the number of irrigation cycles was changed. The results show that the yield decreases as the irrigation amount decreases, with the highest yield at 180 mm of irrigation at a 5-day irrigation cycle. These results are consistent with those of previous studies (Lehmann and Finger, 2014; Li et al., 2022) where it has been shown that decreasing the irrigation decreased the potato yields, but one simulation study has shown that excessive irrigation resulted in lower yields following the water stress (Jama-Rodzenska et al., 2021). Our second set of simulations of 15 scenarios with fixed irrigation quota and varying irrigation cycles showed that a 20 mm irrigation quota at a 5 -day irrigation cycle resulted in the highest tuber yield than all the other scenarios. The lower yields were observed with lower irrigation amounts and quotas probably due to the moisture stress as the depth of wetting was not reaching the effective root zone of the potato crop and substantially reducing the canopy cover and crop growth (Yuan et al., 2003; Mattar et al., 2021).
4.3 Recommendation of irrigation for potatoes under the drip irrigation
To improve irrigation and water use efficiency, it is important to optimize scheduling of irrigation (Li et al., 2019). Accordingly, A10 scheme of 180 mm maximum of water produced higher yield in simulation scenario I, which is consistent with the maximum yield observed in a previous study with 1800 m3 ha-1 of water at the same level of nitrogen application (Yin et al., 2020).
However, changing the frequency of irrigation (i.e., irrigation cycle) can affect the potato yield (Wang et al., 2006) as the irrigation frequencies can modify plant physiological processes, growth, yield and water use efficiency (Boyle et al., 2016). At the same irrigation frequency, increasing the irrigation quota could increase the biomass (Si et al., 2020), which was similar to the study of Su et al. (2022) on the linear increase of crop biomass with irrigation quota at a certain irrigation range. Furthermore, irrigation scheduling is an important factor affecting water use efficiency, and water-saving irrigation facilitates the conservative use of irrigation water (Li et al., 2020). The analysis of irrigation optimization (Figure 7) showed that A26 scheme (1800 m3 ha-1 of total irrigation at 7 days irrigation cycle) has produced the optimum yield with highest water use efficiency. Although A25 scheme with 5 days irrigation cycle and 2400 m3 ha-1 of total irrigation has produced the highest yield, 600 m3 ha-1 of additional irrigation only improved the yield by 6.4% thus reducing the water use efficiency of the crop. This was because increasing irrigation frequency increased potato yield but failed to increase the water use efficiency in potato as shown by Liu et al. (2019). Therefore, 20 mm of irrigation quota at 7 days of irrigation cycle can be considered as an optimum irrigation scheduling for potato cultivated under the drip irrigation in the arid regions. Nevertheless, the optimum irrigation system should be adjusted considering the local climate, fertilizer application and crop variety (Zheng et al., 2013). These findings can provide the baseline for rational water and fertilizer management for local potato production in the arid regions such as Ningxia in China.
5 Conclusions
The objective of this study was to optimize the irrigation for potato cultivated under the drip irrigation in the arid region of Ningxia, China. The AquaCrop model was calibrated and validated using the data from two years of field experiment in devising the optimal irrigation recommendation. The calibrated crop model was used to simulate the changes in canopy coverage, biomass and tuber yield of potato with 30 different irrigation schemes under two different irrigation scenarios. The results showed that the AquaCrop model could better simulate the growth and yield of potato under the drip irrigation with different irrigation treatments. We found that increasing the total amount of irrigation could increase the yield of potato under the drip irrigation; however, yield begins to decline when the amount of total irrigation exceeds 2500 m3 ha-1. Moreover, the optimum irrigation schedule for potatoes was 20 mm of irrigation quota at 7 days of irrigation cycle which requires 1800 m3 (meter cube) ha-1 of total irrigation. The above irrigation scheduling has achieved 46.77 t ha-1 of tuber yield with 15.74 kg m-3 of water use efficiency. Future research should focus on evaluating the best performing irrigation schemes at different climate and soil conditions for potato cultivation in various parts of the arid regions.
Data availability statement
The original contributions presented in the study are included in the article/supplementary material. Further inquiries can be directed to the corresponding authors.
Author contributions
Conceptualization, JY and YY. Methodology, JY, YY and RE. Open field experiments and data compilation, YY. Software, YY. Validation, YY. Formal analysis, JY, YY. Resources, JY, YY. Data curation, RE, ZM, ZY and FS. Writing—original draft preparation, YY, ZM, ZY and FS. Writing—review and editing, YY and RE. Visualization, YY. All authors contributed to the article and approved the submitted version.
Funding
This research was funded by a grant from the Ningxia Higher Education Institution First-class Discipline Construction Project (NXYLXK2021A03).
Conflict of interest
The authors declare that the research was conducted in the absence of any commercial or financial relationships that could be construed as a potential conflict of interest.
Publisher’s note
All claims expressed in this article are solely those of the authors and do not necessarily represent those of their affiliated organizations, or those of the publisher, the editors and the reviewers. Any product that may be evaluated in this article, or claim that may be made by its manufacturer, is not guaranteed or endorsed by the publisher.
References
Abedinpour, M., Sarangi, A., Rajput, T. B. S., Singh, M., Pathak, H., Ahmad, T. (2012). Performance evaluation of aquacrop model for maize crop in a semi-arid environment. Agr. Water Manage. 110, 55–66. doi: 10.1016/j.agwat.2012.04.001
Ali, M. H., Talukder, M. S. U. (2008). Increasing water productivity in crop production—a synthesis. Agr. Water Manage. 95 (11), 1201–1213. doi: 10.1016/j.agwat.2008.06.008
Boyle, R. K., Mcainsh, M., Dodd, I. C. (2016). Daily irrigation attenuates xylem abscisic acid concentration and increases leaf water potential of pelargonium x hortorum compared with infrequent irrigation. Physiol. Plant 158 (1), 23–33. doi: 10.1111/ppl.12433
Eeswaran, R., Nejadhashemi, A. P., Kpodo, J., Curtis, Z. K., Adhikari, U., Liao, H., et al. (2021). Quantification of resilience metrics as affected by conservation agriculture at a watershed scale. Agriculture Ecosyst. Environ. 320, 107612. doi: 10.1016/j.agee.2021.107612
He, Q., Li, S., Hu, D., Wang, Y., Cong, X. (2021). Performance assessment of the aquacrop model for film-mulched maize with full drip irrigation in northwest China. Irrigation Sci. 39 (2), 277–292. doi: 10.1007/s00271-020-00705-z
Högy, P., Fangmeier, A. (2009). Atmospheric co2 enrichment affects potatoes: 1. Aboveground Biomass production tuber yield. Eur. J. Agron. 30 (2), 78–84. doi: 10.1016/j.eja.2008.07.007
Holzworth, D. P., Huth, N. I., Devoil, P. G., Zurcher, E. J., Herrmann, N. I., Mclean, G., et al. (2014). Apsim – evolution towards a new generation of agricultural systems simulation. Environ. Modell. Software 62, 327–350. doi: 10.1016/j.envsoft.2014.07.009
Hsiao, T. C., Heng, L., Steduto, P., Rojas Lara, B., Raes, D., Fereres, E. (2009). Aquacrop—the fao crop model to simulate yield response to water: iii. Parameterization testing maize. Agron. J. 101 (3), 448–459. doi: 10.2134/agronj2008.0218s
Jalil, A., Akhtar, F., Awan, U. K. (2020). Evaluation of the aquacrop model for winter wheat under different irrigation optimization strategies at the downstream kabul river basin of Afghanistan. Agr. Water Manage. 240, 106321. doi: 10.1016/j.agwat.2020.106321
Jama-Rodzenska, A., Janik, G., Walczak, A., Adamczewska-Sowinska, K., Sowinski, J. (2021). Tuber yield and water efficiency of early potato varieties (solanum tuberosum l.) Cultivated under various irrigation levels. Sci. Rep.-Uk 11, (1). doi: 10.1038/s41598-021-97899-9
Kim, D., Chun, J. A., Inthavong, T. (2021). Managing climate risks in a nutrient-deficient paddy rice field using seasonal climate forecasts and aquacrop. Agr. Water Manage. 256, 107073. doi: 10.1016/j.agwat.2021.107073
Lehmann, N., Finger, R. (2014). Economic and environmental assessment of irrigation water policies: a bioeconomic simulation study. Environ. Modell. Software 51, 112–122. doi: 10.1016/j.envsoft.2013.09.011
Li, P., Cao, X., Tan, H., Wang, J., Ren, S., Yang, P. (2020). Studies on water uptake and heat status of cherry root under water-saving measures. Agr. Water Manage. 242, 106359. doi: 10.1016/j.agwat.2020.106359
Li, Y., Tang, J., Wang, J., Zhao, G., Yu, Q., Wang, Y., et al. (2022). Diverging water-saving potential across China's potato planting regions. Eur. J. Agron. 134, 126450. doi: 10.1016/j.eja.2021.126450
Li, F., Yu, D., Zhao, Y. (2019). Irrigation scheduling optimization for cotton based on the aquacrop model. Water Resour. Manage. 33 (1), 39–55. doi: 10.1007/s11269-018-2087-1
Liu, H., Li, H., Ning, H., Zhang, X., Li, S., Pang, J., et al. (2019). Optimizing irrigation frequency and amount to balance yield, fruit quality and water use efficiency of greenhouse tomato. Agr. Water Manage. 226, 105787. doi: 10.1016/j.agwat.2019.105787
López-Urrea, R., Olalla, F. M. D. S., Fabeiro, C., Moratalla, A. (2006). An evaluation of two hourly reference evapotranspiration equations for semiarid conditions. Agr. Water Manage. 86 (3), 277–282. doi: 10.1016/j.agwat.2006.05.017
Martins, M. A., Tomasella, J., Rodriguez, D. A., Alvalá, R. C. S., Giarolla, A., Garofolo, L. L., et al. (2018). Improving drought management in the Brazilian semiarid through crop forecasting. Agr. Syst. 160, 21–30. doi: 10.1016/j.agsy.2017.11.002
Mattar, M. A., Zin El-Abedin, T. K., Al-Ghobari, H. M., Alazba, A. A., Elansary, H. O. (2021). Effects of different surface and subsurface drip irrigation levels on growth traits, tuber yield, and irrigation water use efficiency of potato crop. Irrigation Sci. 39 (4), 517–533. doi: 10.1007/s00271-020-00715-x
Ningxia Water Resources Department. (2017). “Ningxia institute of water resources science,” in Ningxia drip irrigation engineering planning and design guidelines and technical regulations for drip irrigation planting of advantageous specialty crops (Yinchuan, China: Ningxia People’s Publishing House), 195.
Raes, D., Steduto, P., Hsiao, T. C., Fereres, E. (2009). AquaCrop—the FAO crop model to simulate yield response to water: II. Main algorithms software description. Agron. J. 101 (3), 438–447. doi: 10.2134/agronj2008.0140s
Rankine, D. R., Cohen, J. E., Taylor, M. A., Coy, A. D., Simpson, L. A., Stephenson, T., et al. (2015). Parameterizing the fao aquacrop model for rainfed and irrigated field-grown sweet potato. Agron. J. 107 (1), 375–387. doi: 10.2134/agronj14.0287
Sammis, T., Sharma, P., Shukla, M. K., Wang, J., Miller, D. (2012). A water-balance drip-irrigation scheduling model. Agr. Water Manage. 113, 30–37. doi: 10.1016/j.agwat.2012.06.012
Shirazi, S. Z., Mei, X., Liu, B., Liu, Y. (2021). Assessment of the aquacrop model under different irrigation scenarios in the north China plain. Agr. Water Manage. 257, 107120. doi: 10.1016/j.agwat.2021.107120
Si, Z., Zain, M., Mehmood, F., Wang, G., Gao, Y., Duan, A. (2020). Effects of nitrogen application rate and irrigation regime on growth, yield, and water-nitrogen use efficiency of drip-irrigated winter wheat in the north China plain. Agr. Water Manage. 231, 106002. doi: 10.1016/j.agwat.2020.106002
Su, L., Tao, W., Sun, Y., Shan, Y., Wang, Q. (2022). Mathematical models of leaf area index and yield for grapevines grown in the turpan area, xinjiang, China. Agronomy 12 (5), 988. doi: 10.3390/agronomy12050988
Tang, J., Wang, J., Fang, Q., Wang, E., Yin, H., Pan, X. (2018). Optimizing planting date and supplemental irrigation for potato across the agro-pastoral ecotone in north China. Eur. J. Agron. 98, 82–94. doi: 10.1016/j.eja.2018.05.008
Vanuytrecht, E., Raes, D., Steduto, P., Hsiao, T. C., Fereres, E., Heng, L. K., et al. (2014). Aquacrop: fao's crop water productivity and yield response model. Environ. Modell. Software 62, 351–360. doi: 10.1016/j.envsoft.2014.08.005
Wang, F., Kang, Y., Liu, S. (2006). Effects of drip irrigation frequency on soil wetting pattern and potato growth in north China plain. Agr. Water Manage. 79 (3), 248–264. doi: 10.1016/j.agwat.2005.02.016
Wang, Z., Liu, H., Zeng, F., Yang, Y., Xu, D., Zhao, Y., et al. (2023). Potato processing industry in China: current scenario, future trends and global impact. Potato Res. 66 (2), 543–562. doi: 10.1007/s11540-022-09588-3
Yan, F., Zhang, F., Fan, X., Fan, J., Wang, Y., Zou, H., et al. (2021). Determining irrigation amount and fertilization rate to simultaneously optimize grain yield, grain nitrogen accumulation and economic benefit of drip-fertigated spring maize in northwest China. Agr. Water Manage. 243, 106440. doi: 10.1016/j.agwat.2020.106440
Yang, Y., Yin, J., Ma, Z., Wei, X., Sun, F., Yang, Z. (2023). Water and nitrogen regulation effects and system optimization for potato (solanum tuberosum l.) Under film drip irrigation in the dry zone of ningxia China. Agronomy 13 (2), 308. doi: 10.3390/agronomy13020308
Yao, Y., Sun, J., Tian, Y., Zheng, C., Liu, J. (2020). Alleviating water scarcity and poverty in drylands through telecouplings: vegetable trade and tourism in northwest China. Sci. Total Environ. 741, 140387. doi: 10.1016/j.scitotenv.2020.140387
Yin, J., Zhang, H., Wang, S., Wang, C., Zhao, Y. (2020). Effects of different water and nitrogen treatments on photosynthetic characteristics and yield of potato. Water Saving Irrigation 2020 (06), 8–13. doi: 10.3969/j.issn.1007-4929.2020.06.002
Yuan, B., Nishiyama, S., Kang, Y. (2003). Effects of different irrigation regimes on the growth and yield of drip-irrigated potato. Agr. Water Manage. 63 (3), 153–167. doi: 10.1016/S0378-3774(03)00174-4
Keywords: canopy cover, crop modeling, biomass, water use efficiency, crop water requirement
Citation: Yin J, Yang Y, Eeswaran R, Yang Z, Ma Z and Sun F (2023) Irrigation scheduling for potatoes (Solanum tuberosum L.) under drip irrigation in an arid region using AquaCrop model. Front. Plant Sci. 14:1242074. doi: 10.3389/fpls.2023.1242074
Received: 18 June 2023; Accepted: 12 September 2023;
Published: 26 September 2023.
Edited by:
Fulai Liu, University of Copenhagen, DenmarkReviewed by:
Semih Metin Sezen, Çukurova University, TürkiyeSabri Kanzari, National Research Institute for Rural Engineering, Water and Forestry (INRGREF), Tunisia
Copyright © 2023 Yin, Yang, Eeswaran, Yang, Ma and Sun. This is an open-access article distributed under the terms of the Creative Commons Attribution License (CC BY). The use, distribution or reproduction in other forums is permitted, provided the original author(s) and the copyright owner(s) are credited and that the original publication in this journal is cited, in accordance with accepted academic practice. No use, distribution or reproduction is permitted which does not comply with these terms.
*Correspondence: Juan Yin, eWo3MTE1QDEyNi5jb20=; Rasu Eeswaran, cmFzdWVlc3dAbXN1LmVkdQ==
†These authors have contributed equally to this work and share first authorship