 Matthew D. Lemke
 Jesse D. Woodson
- The School of Plant Sciences, University of Arizona, Tucson, AZ, United States
Introduction: Plants employ intricate molecular mechanisms to respond to abiotic stresses, which often lead to the accumulation of reactive oxygen species (ROS) within organelles such as chloroplasts. Such ROS can produce stress signals that regulate cellular response mechanisms. One ROS, singlet oxygen (1O2), is predominantly produced in the chloroplast during photosynthesis and can trigger chloroplast degradation, programmed cell death (PCD), and retrograde (organelle-to-nucleus) signaling. However, little is known about the molecular mechanisms involved in these signaling pathways or how many different signaling 1O2 pathways may exist.
Methods: The Arabidopsis thaliana plastid ferrochelatase two (fc2) mutant conditionally accumulates chloroplast 1O2, making fc2 a valuable genetic system for studying chloroplast 1O2-initiated signaling. Here, we have used activation tagging in a new forward genetic screen to identify eight dominant fc2 activation-tagged (fas) mutations that suppress chloroplast 1O2-initiated PCD.
Results: While 1O2-triggered PCD is blocked in all fc2 fas mutants in the adult stage, such cellular degradation in the seedling stage is blocked in only two mutants. This differential blocking of PCD suggests that life-stage-specific 1O2-response pathways exist. In addition to PCD, fas mutations generally reduce 1O2-induced retrograde signals. Furthermore, fas mutants have enhanced tolerance to excess light, a natural mechanism to produce chloroplast 1O2. However, general abiotic stress tolerance was only observed in one fc2 fas mutant (fc2 fas2). Together, this suggests that plants can employ general stress tolerance mechanisms to overcome 1O2 production but that this screen was mostly specific to 1O2 signaling. We also observed that salicylic acid (SA) and jasmonate (JA) stress hormone response marker genes were induced in 1O2-stressed fc2 and generally reduced by fas mutations, suggesting that SA and JA signaling is correlated with active 1O2 signaling and PCD.
Discussion: Together, this work highlights the complexity of 1O2 signaling by demonstrating that multiple pathways may exist and introduces a suite of new 1O2 signaling mutants to investigate the mechanisms controlling chloroplast-initiated degradation, PCD, and retrograde signaling.
Introduction
Abiotic environmental stresses can severely and negatively affect plant fitness and, consequently, agricultural yields (Kopecka et al., 2023). As sessile organisms, plants have evolved elaborate signaling mechanisms that allow them to sense environmental changes and acclimate. For instance, plant cells can use their energy-producing organelles (chloroplast and mitochondria) for such purposes. Under stress, the chloroplast can produce retrograde (chloroplast-to-nucleus) signals to regulate nuclear-encoded genes, including those involved in photosynthesis and acclimation (Chan et al., 2016; De Souza et al., 2017; Dogra and Kim, 2019). Although the mechanisms behind these signals are poorly understood, some have been shown to involve the production of reactive oxygen species (ROS) within chloroplasts following abiotic stress. Plants have sophisticated systems to mediate such ROS accumulation, including enzymatic and chemical quenching via ROS scavengers (You and Chan, 2015) and pigments (Foyer, 2018), respectively. When these systems become overwhelmed, ROS can damage cellular components, induce photo-inhibition, and lead to cellular degradation (Foyer, 2018). In the latter case, it is becoming clear that cellular degradation can be genetically initiated by ROS and lead to programmed cell death (PCD) and chloroplast quality control (CQC). PCD pathways can limit systematic damage to local tissue and help prevent water loss, CQC pathways help maintain healthy populations of photosynthesizing chloroplasts, and both pathways help to remobilize nutrients to healthy plant tissue (Van Doorn and Woltering, 2004; Cruz De Carvalho, 2008; Woodson, 2022).
ROS are naturally produced during photosynthesis when excess light (EL) energy is absorbed by chlorophyll (Triantaphylidès et al., 2008). Plants manage excess light energy through photochemical reactions (photosynthesis), the release of photons via chlorophyll fluorescence, or heat dissipation via nonphotochemical chlorophyll fluorescence quenching (NPQ) (Ruban, 2016). Excess energy not dissipated by these mechanisms can lead to the formation of ROS. This includes singlet oxygen (1O2), produced at photosystem II (PSII), and superoxide (O2-) and hydrogen peroxide (H2O2), produced at photosystem I (PSI) (Triantaphylidès and Havaux, 2009; Krieger-Liszkay et al., 2011). Specifically, 1O2 is generated by the transfer of energy from excited chlorophylls to ground-state oxygen (Triantaphylidès and Havaux, 2009). 1O2 is highly reactive, has a short half-life (< 200 ns) (Gorman and Rodgers, 1992), and has an expected diffusion distance of < 155 nm (Ogilby, 2010). Thus, the bulk of 1O2 generated within a chloroplast (an organelle that is 2-3 μm wide and 5-10 μm long) is likely to remain compartmentalized to this organelle and oxidize chloroplast macromolecules, including the proteinaceous photosynthetic machinery, lipids, nucleic acids, and carotenoids, leading to chloroplast dysfunction.
While very high levels of 1O2 are toxic to the cell, studies using Arabidopsis thaliana have demonstrated that cellular degradation can be a genetically controlled response to 1O2 (Wagner et al., 2004; Ramel et al., 2013; Woodson et al., 2015). The Arabidopsis fluorescent in blue light (flu) mutant is defective in a gene encoding a chloroplast-membrane-bound protein that negatively regulates the Mg2+ branch of the tetrapyrrole pathway and accumulates protochlorophyllide (Pchlide), a chlorophyll precursor, in the dark (Meskauskiene et al., 2001). Upon a dark-to-light shift, these mutants bleach and die due to the photo-excitation of excess Pchlide, which produces a burst of 1O2 within chloroplasts. This 1O2 induces 1O2 response genes (SORGs), followed by programmed cell death, a response that was shown to be dependent on a chloroplast retrograde signal involving the Executor 1 (EX1) protein (Wagner et al., 2004).
Another mutant, chlorina (ch1), lacks chlorophyll a oxygenase activity, thereby reducing the production of chlorophyll b. Consequently, these mutants have impaired photoprotection and generation of excess 1O2 at the PSII reaction centers (Ramel et al., 2013). This 1O2 production leads to sensitivity to EL, triggering PCD and retrograde signaling. This PCD is also regulated by a genetic signal, as evidenced by two mutations, plant u-box 4 (pub4-6) and oxidative signal inducible 1(oxi1), which reduce EL-induced photobleaching in ch1 (Shumbe et al., 2016; Tano et al., 2023).
A third mutant used to understand how 1O2 signals regulate nuclear gene expression and PCD is plastid ferrochelatase two (fc2) (Scharfenberg et al., 2015; Woodson et al., 2015), which affects one of the two conserved chloroplast ferrochelatases that generate heme in plants. When grown under diurnal light cycling conditions, fc2 mutants rapidly accumulate protoporphyrin IX (PPIX) (Woodson et al., 2015), the substrate of FC2 and a tetrapyrrole intermediate. Like Pchlide, PPIX can also produce 1O2 upon exposure to light (Duez et al., 2001). Thus, fc2 mutants produce a burst of 1O2 at dawn when grown under cycling light conditions. This 1O2 rapidly changes nuclear gene expression (within 30 minutes) and chloroplast degradation (within three hours). After eight hours, PCD begins to occur (Woodson et al., 2015; Fisher et al., 2022). This response to 1O2 is not stage-specific, as fc2 plants can be grown to adulthood in constant light conditions that avoid PCD. After a shift to cycling light conditions, however, fc2 plants will exhibit PCD and growth inhibition (Woodson et al., 2015; Lemke et al., 2021; Tano et al., 2023).
Although fc2 plants do not exhibit PCD in constant light conditions, they still accumulate low levels of 1O2 (Fisher et al., 2022). This leads to a subset of chloroplasts being degraded via the central vacuole through a process resembling fission-type microautophagy (Lemke et al., 2021; Lemke and Woodson, 2022). It is unknown how 1O2-damaged chloroplasts are recognized by the cell. Chloroplasts in fc2 cotyledons and leaves do, however, become ubiquitinated at the chloroplast envelope, suggesting ubiquitylation as a possible mechanism for the selective turnover of 1O2-damaged chloroplasts (Woodson et al., 2015).
To gain insight into the mechanisms involved in 1O2-mediated PCD, CQC, and retrograde signaling, a forward genetic screen was performed to identify genetic suppressors of these fc2 stress phenotypes in seedlings (Woodson et al., 2015). Here, fc2 mutants were further mutagenized using ethyl methanesulfonate (EMS) mutagenesis and screened for secondary fc2 suppressor (fts) mutations that suppress the conditional PCD phenotype of fc2 seedlings. To date, twelve fts mutations have been identified and mapped to seven loci (Woodson et al., 2015; Alamdari et al., 2020; Alamdari et al., 2021). These fts mutations have been categorized into three classes. Class I fts mutants, reduce 1O2 accumulation by directly or indirectly reducing tetrapyrrole biosynthesis; Class II mutants, block 1O2 signaling without affecting chloroplast development; and Class III mutations, block 1O2 signaling with a concurrent delay in chloroplast development.
Class I mutants include those with lesions in SUBUNIT H OF MG-CHELATASE (ChlH or GUN5), which encodes a subunit of the Mg2+ chelatase that converts PPIX to Magnesium PPIX, the first intermediate of the chlorophyll branch of the tetrapyrrole pathway. Also included are mutants with lesions in TRANSLOCON AT THE OUTER ENVELOPE MEMBRANE OF CHLOROPLASTS 159 (TOC159) and 33 (TOC33), which encode essential plastid protein import components. These mutations reduce the accumulation of 1O2 due to a reduction of tetrapyrrole synthesis (directly (chlh) or indirectly (toc159, toc33)) (Woodson et al., 2015). As such, they also have clear pale seedling phenotypes due to reduced levels of chlorophyll content. Although they may not represent true signaling mutants, they support the hypothesis that 1O2 accumulation leads to PCD and CQC.
The only class II mutant reported has a lesion in PUB4, which encodes a cytoplasmic E3 ubiquitin ligase. As pub4-6 does not reduce chlorophyll or 1O2 levels, it is hypothesized that PUB4 likely acts downstream of the 1O2 signal, possibly by controlling the ubiquitylation of damaged chloroplasts (Woodson et al., 2015). Recent work has shown that PUB4 plays diverse roles in physiology, opening the possibility that PUB4 may target multiple proteins for ubiquitination or that chloroplast turnover pathways play a broader role in plant physiology than previously thought (Wang et al., 2017; Desaki et al., 2019; Jeran et al., 2021; Wang et al., 2022).
Class III mutants include those with lesions in PENTATRICOPEPTIDE-REPEAT-CONTAINING PROTEIN 30 (PPR30), “mitochondrial” TRANSCRIPTION TERMINATION FACTOR 9 (mTERF9) (Alamdari et al., 2020), and CYTIDINE TRIPHOSPHATE SYNTHASE 2 (CTPS2) (Alamdari et al., 2021). PPR30 and mTERF9 are proteins proposed to play a role in the post-transcriptional regulation of plastid gene expression (Barkan and Small, 2014; Wobbe, 2021), while CTPS2 plays a role in maintaining dCTP levels for plastid DNA synthesis (Bellin et al., 2021). As such, all three mutations limit plastid gene expression. Like Class II mutants, Class III mutants still accumulate 1O2 in the seedling stage, suggesting they block a chloroplast 1O2 signal. Unlike Class II mutants, however, Class III mutants are pale as seedlings due to impaired chloroplast development. These mutations led to the hypothesis that a plastid-encoded product is required for the 1O2 signal.
The fts mutant screen only identified single recessive mutant alleles (except for pub4-6, which is semi-dominant) (Woodson et al., 2015). This reflects a limitation of EMS mutagenesis, which is most useful for identifying loss-of-function alleles that generally encode positive, rather than negative, regulators of signaling. To gain a more comprehensive picture of the genes and mechanisms involved in chloroplast 1O2 signaling, we aimed to identify dominant gain-of-function mutations that block these pathways. To this end, we used activation tagging, which involves randomly inserting T-DNAs into the plant genome. These sequences include 35S enhancer elements that can overexpress nearby genes (Weigel et al., 2000).
We have used this method to identify eight dominant fc2 activation-tagged suppressor (fas) mutations that suppress chloroplast 1O2 signaling. Most of these mutations only affect 1O2 signaling in the adult stage, indicating that stage-specific pathways may exist. Furthermore, most fas mutations appear to specifically affect responses to 1O2, rather than general ROS responses, highlighting the specificity of our screen. However, one mutant, fc2 fas2, is tolerant to a wide range of abiotic stresses, suggesting that plants can also employ general stress tolerance mechanisms to overcome 1O2 stress.
Methods
Biological material and standard growth conditions
The wild type (wt) used in this study was Arabidopsis thaliana ecotype Columbia (Col-0). T-DNA lines GABI_766H08 (fc2-1) (Woodson et al., 2011) from the GABI-Kat collection (Kleinboelting et al., 2012) and SAIL_129_B07 (atg5-1) (Thompson et al., 2005) from the SAIL collection (Sessions et al., 2002) were described previously. The fc2 toc159 (fts1), fc2 toc33 (fts4), fc2 chlH (fts8), fc2 pub4-6 (fts29), fc2 ppr30-1 (fts3), fc2 mterf9 (fts32), fc2 ctps2-5 (fts39) mutants were described previously (Woodson et al., 2015; Alamdari et al., 2020; Alamdari et al., 2021). Additional information on these lines is listed in Supplementary Table S1. Activation-tagged fas mutants were generated using the pSKI015 vector (Weigel et al., 2000) to transform Arabidopsis fc2 mutants. fc2 fas double mutants were confirmed by extracting gDNA [following a CTAB-based protocol (Healey et al., 2014)] using PCR-based markers for the GABI_766H08 T-DNA and the pSKI015 activation tag T-DNA. Primer sequences can be found listed in Supplementary Table S2.
Seeds, seedlings, and adult plants were germinated and grown as previously described (Woodson et al., 2015; Lemke et al., 2021) with minor deviations (most notably the use of LED plant growth chambers for adult plant growth) and detailed in the Supplementary methods section. Unless otherwise specified, standard conditions used to grow seedlings were ~110-115 µmol photons m-2 sec-1 at 21°C in fluorescent light chambers [(Percival® model CU-36L5), set to constant light (24h light) or diurnal cycling light (6h light/18h dark) conditions] and standard conditions used to grow adult plants were ~110-120 µmol photons m-2 sec-1 at 21°C with 60% humidity in an LED plant growth chamber [(Hettich PRC 1700), set to constant light (24h light) or diurnal cycling light (16h light/8h dark) conditions]. Note that different light/dark regimens were used when subjecting seedlings or adult plants to cycling light conditions.
Escherichia coli and Agrobacterium tumefaciens were grown in liquid Miller nutrient broth or solid medium containing 1.5% agar (w/v). Cells were grown at 37°C (E. coli) or 28°C (A. tumefaciens) with the appropriate antibiotics.
Mutagenesis by activation-tagging
The pSKI015 vector (containing 35S enhancers and a Basta resistance marker gene) was transformed into the A. tumefaciens strain GV3101, which was subsequently used to transform fc2 mutants via the Agrobacterium-mediated floral dip method (Clough and Bent, 1998). T1 plants were selected on Basta-soaked soil (1.5 ml of Bayer Finale herbicide per 2 liters of H2O per flat) and screened for suppression of the fc2 PCD phenotype in diurnal cycling light (16h light/8h dark) conditions in a fluorescent light growth chamber (Percival model AR-75LX), ~80-100 µmol photons m-2 sec-1 at 21°C). T1 suppressor candidates were propagated (an estimated 11,027 T1 plants were screened, and 736 were selected for further monitoring). T2 lines were monitored for a robust suppressor phenotype (suppression of PCD) in cycling light and co-segregation of this phenotype with Basta resistance. Finally, homozygous fas lines were selected for further testing in the T3 generation based on 100% Basta-resistance and a robust fc2 suppressor (fas) phenotype.
Plant growth hormone and abiotic stress treatments
Exogenous GA3 treatment
Plants were grown in constant light conditions for seven days and then transplanted to soil. Beginning at ten days, plants were sprayed with 1 mL of 10-4 M GA3 (suspended in H2O) every two days, as described in (Ribeiro et al., 2012). For a mock treatment, untreated plants were sprayed with 1 mL of H2O. At 14 days, plants were transferred to cycling light conditions (16h light, 8h dark) for seven days or left in constant light conditions. Physiological observations and measurements were taken at 21 days. For consistency, leaf size and shape were assessed in the youngest fully extended leaves (true leaves #3-6).
Abiotic stress tests
For all abiotic stress tests, plants were grown in constant light LED chambers for 21 days (EL, MV, heat, and freezing treatments) or 23 days (dark-induced carbon starvation) and then subjected to various stresses. Chlorophyll fluorescence measurements were taken at least three times at the beginning of stress treatment. The starting Fv/Fm values of each genotype consistently started within the Fv/Fm range expected for unstressed plants (~0.81-0.84), except fc2 toc33, which consistently had a significantly reduced starting Fv/Fm range of ~0.78-0.81 (Supplementary Figures S1A–C).
Excess light stress
Excess light (EL) treatments used 21-day-old plants, which were exposed to 1450-1550 µmol photons m-2 sec-1 white light at 10°C (to offset for excess heat generated by the EL panel) for 24 hours in a Percival LED 41L1 chamber (with SB4X All-White SciBrite LED tiles). The average leaf temperature from 6 representative plants (after 2 hours in EL conditions) was 19.7°C, which was measured using an Etekcity Lasergrip 630 Infrared Thermometer. Chlorophyll fluorescence measurements of the same plants were collected before treatment and after 6h and 24h of EL treatment. Lesion formation was assessed in the same plants immediately after 24h EL treatment (22-day-old plants), prior to any regreening and/or new growth during recovery. After 24h of EL, plants were returned to a constant light LED chamber and allowed to recover for three days, at which point representative plants were imaged (25-day-old plants).
Methyl viologen stress
MV treatment (20 µM or 200 µM) was applied to 21-day-old plants grown in constant light conditions. MV (Sigma-Aldrich) was dissolved in H2O to create 20 µM or 200 µM solutions, which were applied to plants via a generic perfume atomizer (4 sprays each, approximately 0.5 mL per plant). Upon treatment, plants were returned to their respective growth chambers for 24 hours, at which point chlorophyll fluorescence was measured (22-day-old plants). Plants were subsequently returned to a constant light LED chamber and allowed to recover for three days. After recovery (and time allowed for MV-induced lesion formation), lesions were counted, and representative plants were imaged (25-day-old plants).
Heat stress
Heat stress was applied by placing 21-day-old plants in a 40°C incubator (in the dark) for 16 or 24 hours. For no heat control, a dome was placed over a flat of 21-day-old plants, wrapped in foil, and placed in the dark for 24 hours at 21°C. Plants were allowed to cool on a laboratory bench (20-21°C) in dim light (10-15 µmol photons m-2 sec-1) for one hour, and then chlorophyll fluorescence was subsequently measured (22-day-old plants). Plants were then returned to constant light conditions and allowed to recover for three days, at which point representative plants were imaged (25-day-old plants).
Freezing stress
Freezing stress was applied by incubation at -20°C in a freezer. To account for the possible unequal insulating effect of dry soil or uneven amounts of water saturation, soil pots of 21-day-old plants were weighed individually, and their weights were equalized by adding water to the soil. Pots were then returned to their flats and incubated at 4°C (cold acclimated set) or at 21°C (unacclimated) in the dark for 16 hours. One flat from each condition was then transferred to -20°C for 1 hour. Flats were then removed from the freezer and allowed to thaw for two hours on a laboratory bench in dim light (20-21°C), at which time chlorophyll fluorescence of plants was measured (22-day-old plants). Afterward, the plants were returned to constant light conditions for three days, at which point representative plants were imaged (25-day-old plants).
Carbon starvation
Carbon starvation was achieved by moving 23- or 21-day-old plants into the dark at 21°C for five or seven days, respectively. At the end of each treatment regimen, plants were left on a laboratory bench (20-21°C) in dim light to equilibrate for one hour before chlorophyll fluorescence measurements were taken (28-day-old plants). Plants were then returned to standard constant light conditions to recover for four days, at which point representative plants were imaged (32-day-old plants).
All abiotic stress tests were conducted at least three times with consistent results, and representative experiments are shown.
Confirmation of T-DNA mutant lines by PCR genotyping
Genotyping Primers were designed using the SIGnAL (http://signal.salk.edu/) T-DNA primer design tool or Primer3 https://www.primer3plus.com/ (Untergasser et al., 2012) (Supplementary Table S2). Primers for fc2-1 were used to confirm the background genotype of fas fc2 candidates. Primers were also designed to probe for different regions of the pSKI015 TDNA in fas fc2 candidates. Here, pSKI015-790F/pSKI015-1974R, pSKI015-2261F/pSKI015-2972R, and pSKI015- 3772F/pSKI015-4962R were used to probe different regions of the pSKI015 T-DNA. All PCR was performed as described (Lemke et al., 2021) and detailed in the Supplementary Methods section.
Biomass measurements
Biomass was assessed as previously described (Lemke et al., 2021) and detailed in the Supplementary Methods section.
Chlorophyll fluorescence measurements
Chlorophyll fluorescence measurements were conducted as previously described (Lemke et al., 2021) and detailed in the Supplementary Methods section.
Chlorophyll measurements
Plant chlorophyll content was measured as previously described (Woodson et al., 2015) and detailed in the Supplementary Methods section.
Cell death measurements
Cell death was assessed using trypan blue staining as previously described for seedlings (Alamdari et al., 2020) and detailed in the Supplementary Methods section.
RNA extraction and reverse transcription-quantitative polymerase chain reaction
Total RNA was extracted from plants, cDNA was synthesized, and RT-qPCR was conducted as previously described (Lemke et al., 2021) and detailed in the Supplementary Methods section. All expression data were normalized according to ACTIN2 expression. All primers used for RT-qPCR are listed in Supplementary Table S2.
RT-qPCR data visualization heatmaps. A data matrix reflecting the RT-qPCR %wt change was compiled for each list. The data used for these heatmaps, and their corresponding significance can be found in (Supplementary Tables S3, S6). Heatmaps were generated using the heat mapper package (https://github.com/WishartLab/heatmapper) on http://www.heatmapper.ca/ (Babicki et al., 2016).
Singlet oxygen measurements
1O2 was measured with Singlet Oxygen Sensor Green dye (SOSG, Molecular Probes 2004) using a protocol adapted from (Alamdari et al., 2020) and optimized for adult leaf tissue. Here, plants were grown in standard constant light conditions for 21 days and then transferred to diurnal cycling light conditions (16h light, 8h dark) for two days. At the end of the second day, at least 12 leaf disks (4 mm) were cut (using a cork borer) from true leaves (#’s 3-6) selected from separate plants and placed in 50 mM phosphate buffer, pH 7.5 (250 ul in 1.5 ml tubes), which were then wrapped in foil and returned to the growth chamber overnight (16 hours). One hour before light exposure (subjective dawn) on day three, 100 µg of SOSG was dissolved in 30 μl of 100% MeOH. 70μl of 50 mM phosphate buffer, pH 7.5 + 0.1% tween 20, was added to the SOSG solution (final concentration 1 μg/ul SOSG solution). 45 μl of SOSG solution was added to the leaf disk tubes in a dark room illuminated with dim green light and then placed in a domed desiccator wrapped two times in aluminum foil. Leaf disks were then vacuum infiltrated (~ -25 mmHg) in the dark for 30 minutes, then incubated for another 30 minutes. Leaf disks were then removed from the dark and returned to the growth chamber in light for 30 min. Leaf disks were washed twice with 1 mL 50 mM phosphate buffer, pH 7.5, and returned to the chamber for 1.5 hours. Leaf disks were then imaged, and SOSG fluorescence was measured with a Zeiss Axiozoom 16 fluorescent stereo microscope equipped with a Hamamatsu Flash 4.0 camera and a GFP fluorescence filter. The average SOSG signal (fluorescence per mm2) of each leaf disk was quantified using ImageJ. Experiments were conducted in two separate groups: Group A (wt, fc2, fts4, fts29, fc2 fas1, fc2 fas2, and fc2 fas3) and Group B (wt, fc2, fc2 fas4, fc2 fas6, fc2 fas7, fc2 fas8, and fc2 fas9). Leaf disks from wt and fc2 were also treated with SOSG but left in the dark (- light) to assess the specificity of the signal we were measuring. Any SOSG (-light) signal was negligible relative to SOSG (+light) leaf disks, being only 5.2% of SOSG (+light) in wt and 1.8% of SOSG (+light) in fc2. Leaf disks from wt and fc2, without SOSG treatment, were analyzed to account for possible background fluorescence of plant leaf tissue. Any autofluorescence observed was negligible relative to SOSG-treated leaf disks, 0.0005% of SOSG (+light) in wt and 0.000001% of SOSG (+light) in fc2. The results of this assay development and optimization can be found in Supplementary Figure S2.
Graphical model creation
Supplementary Figure S3 was created using online BioRender software (https://biorender.com/).
Results
Defining the selection criteria for the identification of mutations that suppress fc2 phenotypes in the adult stage
To identify new dominant gain-of-function mutations that suppress 1O2-induced stress responses, we turned to activation tagging, which allows us to screen plants for suppressor phenotypes in the T1 generation. The advantage of this strategy is that all mutants are in a hemizygous state. If they suppress conditional fc2 phenotypes (e.g., do not exhibit PCD in cycling light conditions), they must be dominant alleles. However, this necessitates that the plants be screened as adults after being selected for transgenesis. It has been previously shown that when grown as adults in cycling light conditions, fc2 mutants do initiate 1O2 signaling (Woodson et al., 2015; Lemke et al., 2021; Tano et al., 2023). However, fts suppressor mutants have mostly been characterized as seedlings and it is unclear how they behave as adults (a summary of published fts mutants and their seedling phenotypes can be found in Supplementary Table S7). With this in mind, it was important first to determine if performing a genetic screen with adult fc2 plants can allow for identifying new suppressor mutations.
To this end, wt and fc2 plants along with Class I (fc2 toc159, fc2 toc33, and fc2 chlH), Class II (fc2 pub4-6), and Class III (fc2 ppr30, fc2 mterf9, and fc2 ctps2) suppressor mutants were grown for 21 days in constant light (24h) conditions or for 14 days in constant light conditions and then transferred to diurnal cycling light (16h light/8h dark) conditions for seven days. As previously reported (Woodson et al., 2015), fc2 appears healthy (no leaf lesions) under constant light conditions (Supplementary Figure S4A). Under these conditions, all fc2 fts mutants also appear healthy, but fc2 toc159, fc2 toc33, and fc2 mterf9 exhibit pale and chlorotic phenotypes relative to fc2. After 7 days in cycling light conditions, fc2 mutants form necrotic lesions while wt does not (Supplementary Figure S4A). Class I and Class II suppressor mutants appear to suppress the formation of these lesions, while Class III mutants still accumulate some lesions. When trypan blue stains were conducted to measure cell death in plants grown under cycling light conditions, fc2 exhibited significantly more cell death than wt (Supplementary Figures 4B, C). Compared to fc2, the Class I and Class II suppressor mutants all had significantly reduced trypan blue staining in leaves. On the other hand, Class III suppressor mutants still exhibited trypan blue staining and were not significantly different from fc2.
Next, total chlorophyll content was measured in plants grown in constant light conditions. Here, fc2 appeared to have lower levels of total chlorophyll than wt, but not to a significant extent (Supplementary Figure S4D). Under the same conditions, fc2 toc159, fc2 toc33 and fc2 mterf9 had significantly less chlorophyll than fc2, while fc2 pub4-6, fc2 chlH, fc2 ppr30, and fc2 ctps2 did not. Thus, we established suppressor mutant classification in the adult stage: Class I suppressor mutants significantly block PCD and generally have reduced levels of chlorophyll, Class II suppressor mutants significantly block PCD and do not have reduced levels of chlorophyll, and Class III suppressor mutants do not significantly block PCD and generally do not have reduced levels of chlorophyll (Supplementary Table S8). These results show that Class I and II mutant phenotypes generally translate to the adult stage. As Class II suppressor mutants are expected to affect signaling components, we chose to prioritize their identification, which is easily distinguished by a lack of lesions and chlorosis.
An activation tagging screen to identify dominant suppressors of the fc2 programmed cell death phenotype
The above results suggested that the adult fc2 plants can be screened for suppression of 1O2-mediated PCD signals. As such, we transformed fc2 plants with the pSKI015 activation tagging vector, which contains a transfer DNA (T-DNA) containing four repeats of the cauliflower mosaic virus (CaMV) 35S enhancer sequence (Weigel et al., 2000) (Supplementary Figure S3A). This can lead to the overexpression of proximal genes (Supplementary Figure S3B). Consequently, this enhanced expression is subject to native tissue- and stage-specific transcriptional programming, thereby increasing the probability of identifying biologically relevant genes, as opposed to constitutive ectopic expression by the full CaMV 35S promoter (Benfey et al., 1990). Activation-tagged fc2 transformants (hereafter referred to as mutants) were selected in the T1 generation and grown under diurnal light cycling conditions (16h light/8h dark) (Supplementary Figure S3C). We then chose candidates in the T1 generation that appeared to reduce the number or size of lesions in true leaves caused by 1O2. We screened an estimated 11,000 T1 transformants and chose 736 for more stringent screening in the T2 generation. We isolated a total of seven fas mutants (fc2 fas1, fc2 fas2, fc2 fas3, fc2 fas4, fc2 fas6, fc2 fas7, fc2 fas8, fc2 fas9) that passed T2 screening and two that did not (fc2 fas3 and fc2 fas5). In the case of fc2 fas3 and fc2 fas5, the suppressor phenotype did not co-segregate with Basta resistance. As such, PCR primers were designed to probe for the presence of the pSKI015 TDNA. An intact pSKI015 TDNA was observed to be present in all fas mutants except for fc2 fas3 and fc2 fas5. Notably, the fas phenotype was also observed to co-segregate with altered rosette morphology in fc2 fas2, fc2 fas4, and fc2 fas7, suggesting a linkage between these phenotypes in these mutants.
Finally, these fas mutants were tested for dominance of the fas phenotype. Here, fc2 was fertilized as the maternal line using pollen from each respective fc2 fas mutant as the paternal line (♀fc2 x ♂fas). The F1 generation plants were then grown in cycling light stress conditions alongside their parent plants to monitor for fas phenotypes. The fas phenotypes of fc2 fas1, fc2 fas2, fc2 fas3, fc2 fas4, fc2 fas6, fc2 fas7, fc2 fas8, fc2 fas9 were recapitulated in the F1 generation, confirming their dominance (Supplementary Figure 5A). Trypan blue stains were conducted to measure cell death. All included fc2 fas mutants showed a significant reduction of PCD, relative to fc2, in the F1 generation (Supplementary Figures 5B, C). Although an intact pSKI015 TDNA was no longer detected in fc2 fas3, we included it in this study as it has a dominant phenotype. Consequently, fc2 fas3 likely still contains a mutation generated during the screen, possibly an incomplete T-DNA or an insertion/deletion caused by the excision of the T-DNA. The fc2 fas5 mutant (not pictured) did not have a dominant phenotype and lacked the pSKI015 TDNA. Thus, we excluded it from further testing.
Activation-tagged fc2 fas mutants suppress cell death under light cycling conditions
We first investigated the visual phenotype of our eight confirmed fc2 fas mutants under permissive (constant light conditions) and stress (14 days of constant light conditions and then moved to cycling light conditions (16h light/8h dark) for 7 days) (Figure 1A). Under constant light conditions, fc2 mutants appear healthy without an obviously altered rosette morphology, but are visually smaller than wt. When exposed to cycling light conditions, however, fc2 mutants form necrotic lesions. We also included fts mutants fc2 toc33 (Class I suppressor mutant) and fc2 pub4-6 (Class II suppressor mutant) as controls for different forms of fc2 PCD suppression. Under the same cycling light conditions, all fts and fas mutations suppress the conditional PCD observed in fc2 (Figure 1A). When trypan blue stains were conducted to assess cell death, all fc2 fts and fc2 fas mutants had significantly less PCD compared to fc2 (Figures 1B, C). These data confirm that all fas mutations suppress the conditional fc2 PCD phenotype in the adult stage.
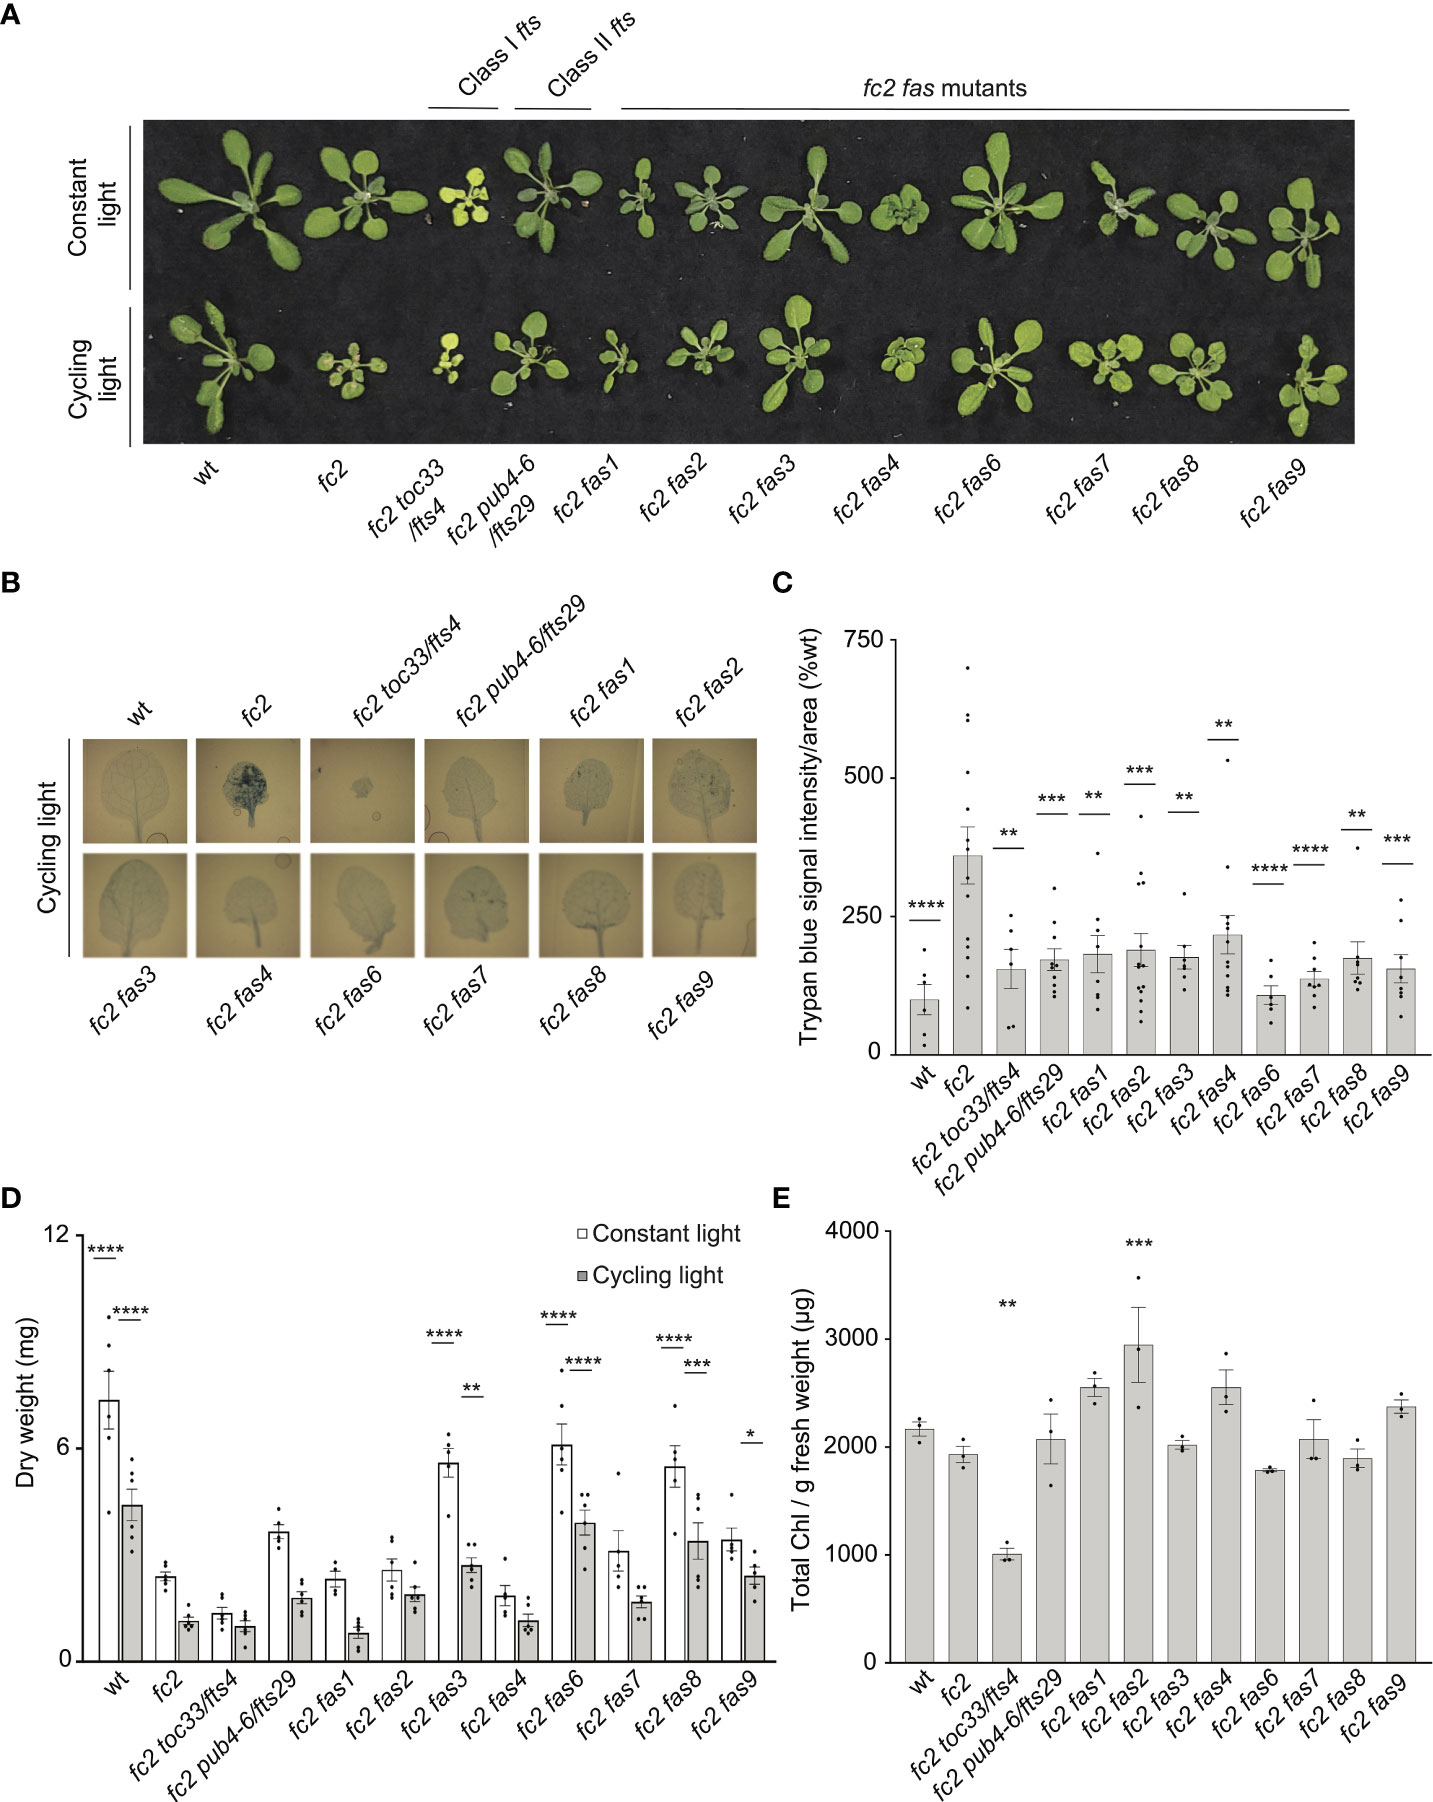
Figure 1 fas mutations suppress light-induced programmed cell death in fc2. Eight dominant fc2 fas mutants were assessed for their capacity to suppress the conditional programmed cell death phenotype of fc2. Plants were grown for 21 days in constant light conditions or 14 days in constant light conditions and then transferred to cycling light conditions (16h light/8h dark) for 7 days. (A) A photograph of representative plants from both light conditions. (B) Representative images reflecting the mean trypan blue stain of leaves. The youngest fully extended leaves (#’s 3-6) were chosen to ensure all selected leaves were of similar age and had experienced a similar level of stress). The dark blue color indicates dead tissue. (C) Quantification of trypan blue stains shown in b (n ≥ 6 leaves from individual plants). (D) Dry weight biomass (mg) of plants (aerial tissue) grown under constant light and cycling light conditions (n ≥ 4 plants). (E) The total chlorophyll content [μg/g fresh weight (FW)] of plants grown in constant light conditions (n = 3 leaves from individual plants). Trypan blue stain (C), biomass (D), and total chlorophyll content (E) quantification were tested using a One-way ANOVA, and Dunnett’s multiple comparisons post hoc was used to test variation between genotypes relative to fc2 (*P ≤ 0.05, **P ≤ 0.01, ***P ≤ 0.001, ****P ≤ 0.0001). Error bars = +/- SEM. Closed circles indicate individual data points.
We next measured the dry-weight biomass of aerial tissue from the same plants. When grown under constant light conditions, fc2 was observed to have reduced biomass relative to wt (Figure 1D). This reduction in biomass relative to wt is even more pronounced in fc2 exposed to cycling light conditions. Under both constant light and cycling light conditions, fc2 fas3, fc2 fas6, and fc2 fas8 were observed to have a biomass greater than fc2 in each respective condition, whereas fc2 fas9 had a greater biomass than fc2 only in cycling light conditions. Conversely, fc2 fas1, fc2 fas2, fc2 fas4, and fc2 fas7 were not observed to have significantly greater biomass than fc2 in either constant light or cycling light conditions.
We also observed no fc2 fas mutants to be obviously pale when grown in constant light conditions (Figure 1A). To assess chlorophyll levels, we measured the total chlorophyll content of these plants. As expected, fc2 toc33 had significantly reduced chlorophyll compared to fc2, while fc2 pub4-6 did not. Finally, none of the fc2 fas mutants had significantly reduced chlorophyll levels compared to fc2 (Figure 1E). We did, however, observe increased chlorophyll content in fc2 fas2 compared to fc2. These data suggest that fas mutations do not lead to reduced chlorophyll levels in the adult stage, and, as such, are unlikely to be Class I suppressor mutations.
As our dominant fas mutants have a PCD suppressor phenotype in the adult stage (21 days old), we next asked if suppression of the fc2 phenotypes is also active at the seedling stage. Under cycling light conditions (6h day/18h night), wt seedlings green normally, whereas fc2 seedlings bleach and die (Figure 2A). As expected, the fc2 fts mutants (fc2 toc33 and fc2 pub4-6 fts) suppress this PCD phenotype. Among the fc2 fas mutants, fc2 fas3 and fc2 fas7 were the only ones observed to visibly suppress PCD at the seedling stage. This pattern of cell death was confirmed via trypan blue stains (Figures 2B, C). When grown under constant light conditions, no fas mutants exhibited a visibly pale phenotype (Figure 2A), or significantly reduced chlorophyll content (Figure 2D) compared to fc2. Together, these data demonstrate that the fas3 and fas7 mutations are the only fas mutations that suppress the conditional fc2 PCD phenotype in the seedling stage, illustrating that the other six fas mutations have a stage-specific effect on stress signaling. Furthermore, the limited changes of chlorophyll content in the eight fc2 fas mutants in the adult and seedling stages suggest that they are not Class I or III suppressor mutants.
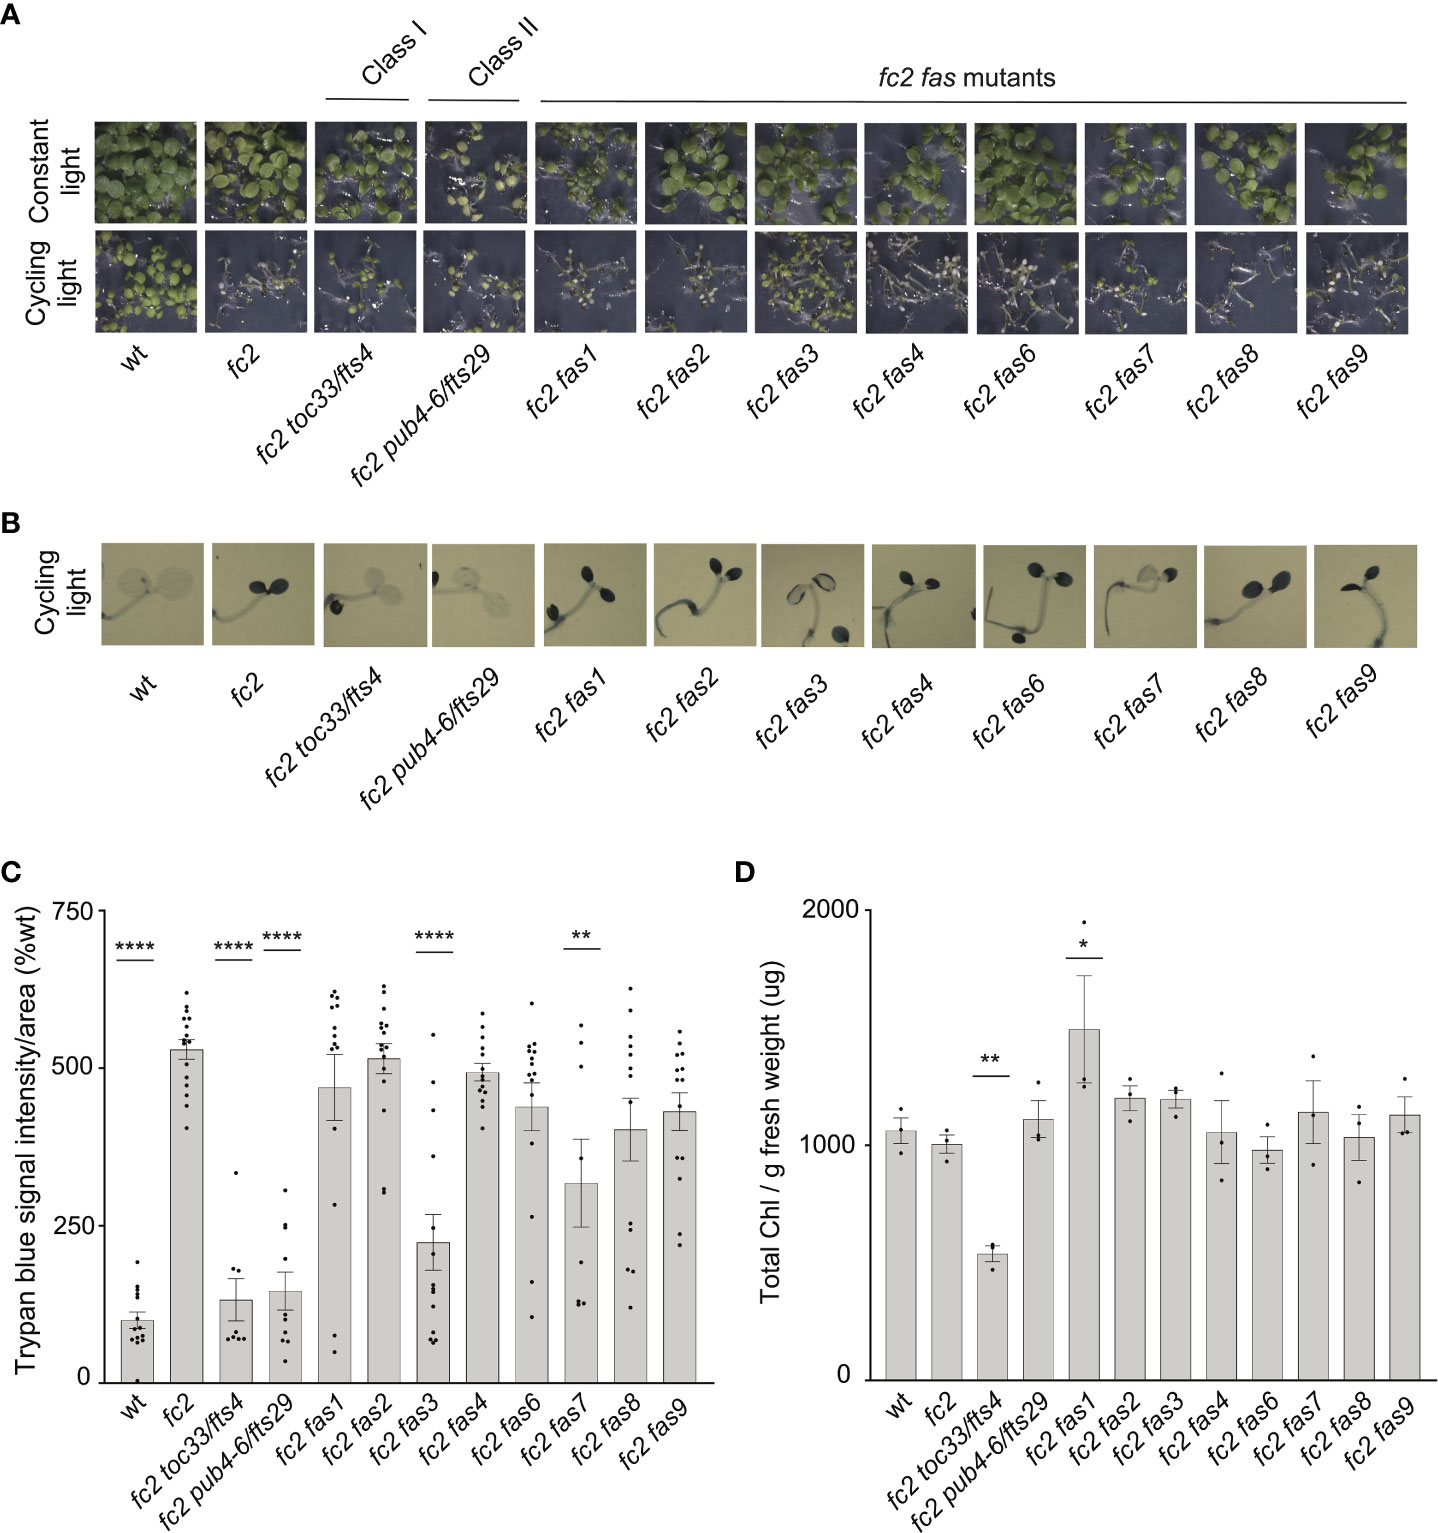
Figure 2 Assessment of seedling stage phenotypes of fc2 fas mutants. Suppression of cell death by the fc2 activation tagged suppressor (fas) mutations was assessed in the seedling stage. Seedlings were grown for seven days in constant light (24h) or cycling light (6h light/18h dark) conditions. (A) Image showing seeding phenotypes of plants grown under constant or cycling light conditions. (B) Representative images reflecting the mean trypan blue stain of seedlings grown under cycling light conditions. The darker blue stain indicates dead tissue (C). Quantification of trypan blue stains shown in b (n ≥ 6 biological replicates). (D) Quantification of chlorophyll content (μg/g fresh weight) of seedlings grown in constant light (n = 3 biological replicates). Trypan blue stain and chlorophyll content quantification were tested using a one-way ANOVA, and a Dunnett’s multiple comparisons post hoc was used to test variation between genotypes relative to fc2 (*P ≤ 0.05, **P ≤ 0.01, ****P ≤ 0.0001). Error bars = +/- SEM. Closed circles indicate individual data points.
fas mutations affect singlet oxygen-induced retrograde signaling
In addition to PCD, chloroplast-generated 1O2 activates retrograde signals to regulate nuclear gene expression (Op Den Camp et al., 2003; Ramel et al., 2013; Woodson et al., 2015). Therefore, we next tested if retrograde signaling is affected by fas mutations. To this end, we probed response marker genes via RT-qPCR in 21-day-old plants grown in cycling light conditions [14 days of constant light conditions and moved to 7 days of cycling light conditions (16h light/8h dark)] These include marker genes that are induced in fc2 seedlings under cycling light stress (Woodson et al., 2015); HSP26.5, HSP22, and SIB1, SORGs (Op Den Camp et al., 2003); BAP1, ATPase, and NOD, general oxidative stress response genes (Baruah et al., 2009); ZAT12, CYC81D8 and GST, and H2O2 response genes (Laloi et al., 2007); APX1 and FER1.
We started with marker genes identified to be induced in fc2 seedlings grown under cycling light conditions (fc2-stress). Here, only HSP26.5 and SIB1 were significantly induced in fc2 (relative to wt), suggesting that some variation exists in the fc2 stress response to cycling light between the seedling and adult stages (Figures 3A, B). SIB1 expression was observed to be reduced to wt levels in fc2 fas mutants, except fc2 fas4. It should be noted that SIB1, a chloroplast-associated transcriptional regulator of nuclear gene expression, was also later identified as a SORG (Dogra et al., 2017). HSP26.5 and HSP22 were also observed to be induced in fc2 fas1 and fc2 fas7, compared to wt, respectively.
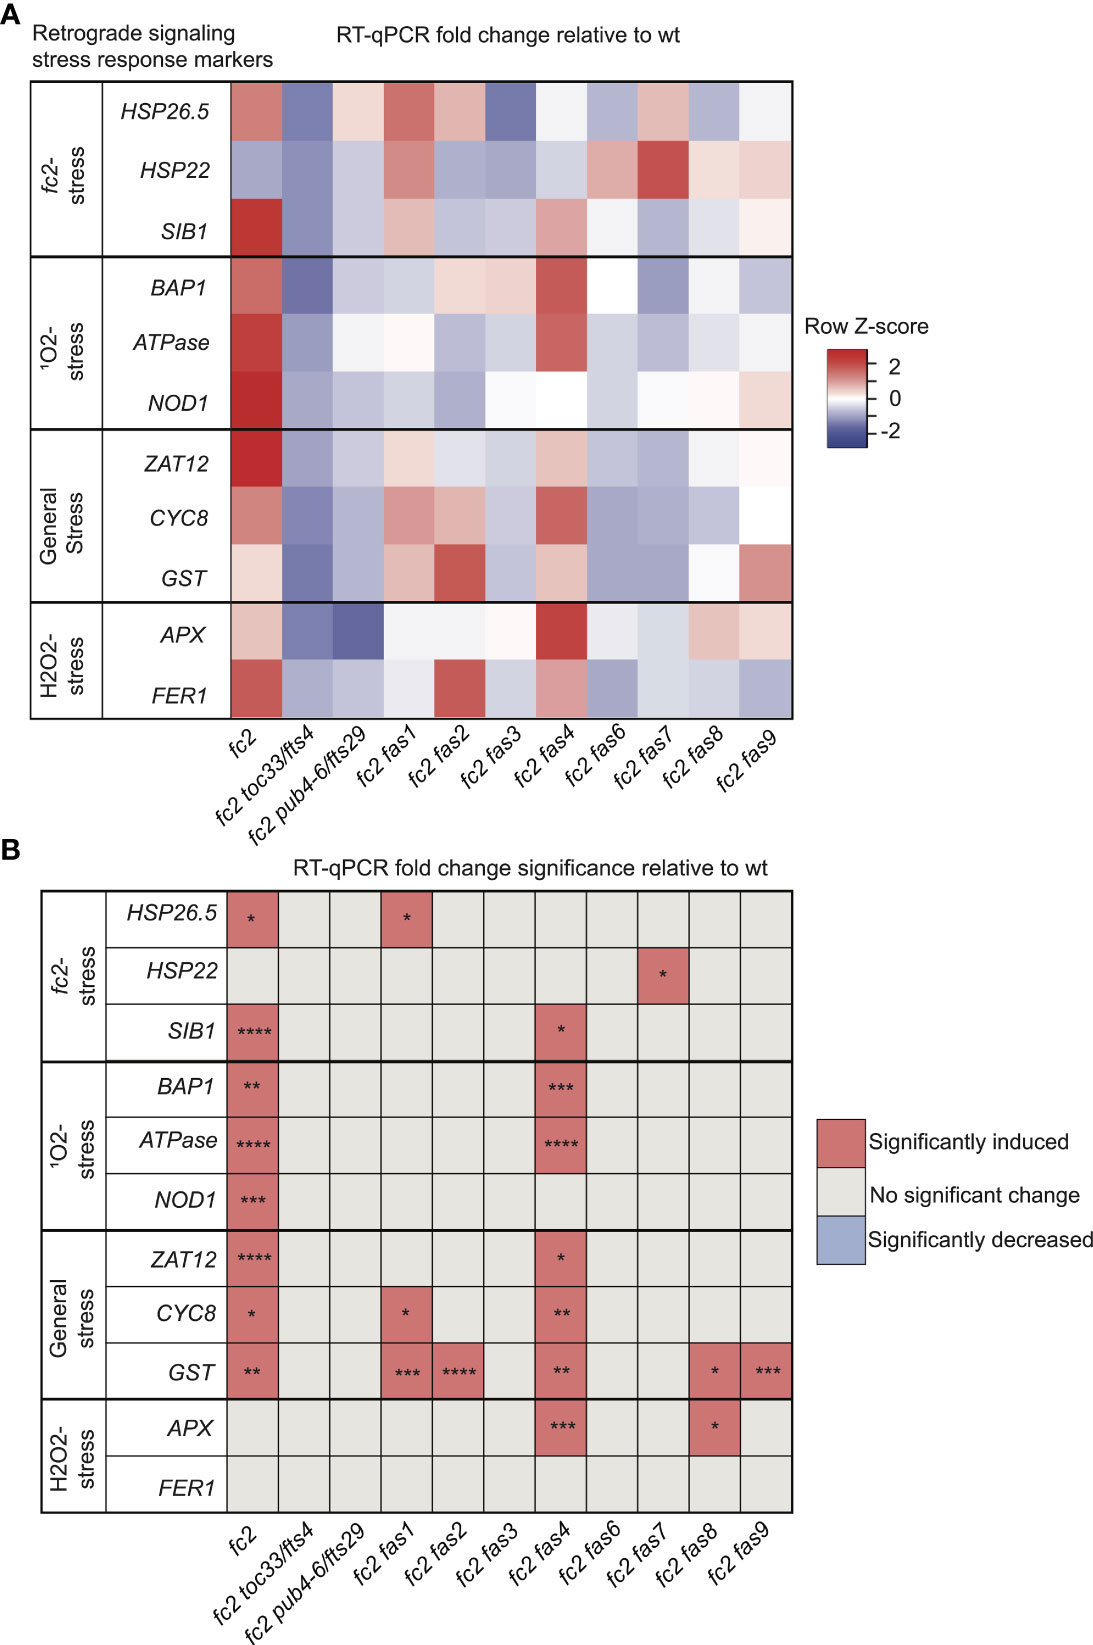
Figure 3 Analysis of reactive oxygen species retrograde signaling in fc2 fas mutants. Reactive oxygen species (ROS) stress marker genes were probed via RT-qPCR to investigate the potential influence of fas mutations on chloroplast retrograde signaling. Transcript abundance was monitored in 21-day-old plants grown for 14 days in constant light conditions and then transferred to cycling light (16h light/8h dark) conditions for 7 days. Marker genes for fc2, singlet oxygen (1O2), general oxidative, and hydrogen peroxide (H2O2) stress were selected to probe for transcriptional responses via RT-qPCR. (A) A heatmap table summarizing the fold-change of transcript abundance relative to wt. Shades of red indicate increased transcript abundance and shades of blue indicate decreased transcript abundance. (B) Table reporting significance of difference in marker transcript abundance, relative to wt. All quantification of qPCR analyses were tested using a one-way ANOVA. A Dunnett’s multiple comparisons post hoc were used to compare variation between genotypes relative to wt (*P ≤ 0.05, **P ≤ 0.01, ***P ≤ 0.001, ****P ≤ 0.0001). n = 3 biological replicates.
As fc2 mutants are 1O2 overproducers, we next probed SORG marker genes. These three genes showed significant induction in stressed fc2 (relative to wt) (Figures 3A, B). The three SORGs were no longer observed to be induced (relative to wt) in all fc2 fas mutants, except for fc2 fas4, which still retained a significant induction of BAP1 and ATPase, compared to wt.
We next probed general oxidative stress response genes, which were all significantly induced in fc2 relative to wt (Figures 3A, B). ZAT12 expression was reduced to wt levels in all fc2 fas mutants, except fc2 fas4. CYC8 expression was decreased to wt levels in all fc2 fas mutants except fc2 fas1 and fc2 fas4. Finally, GST expression was only reduced to wt levels in fc2 fas3, fc2 fas6 and fc2 fas7.
To test if these retrograde signals and PCD were explicitly caused by 1O2, we also probed H2O2 marker genes. Neither APX1 nor FER1 was significantly induced in fc2 at the adult stage [relative to wt (Figures 3A, B)]. However, APX1 expression was increased in fc2 fas4 and fc2 fas8, compared to wt. FER1, on the other hand, was not increased in any of the fc2 fas mutants. These data suggest that 1O2 is the predominant ROS-stress signal involved in adult cycling light-stressed fc2, consistent with observations made in fc2 seedlings (Woodson et al., 2015; Alamdari et al., 2020). Except for fc2 fas4, all fc2 fas mutants reverse the induction of stress marker genes.
Measuring singlet oxygen accumulation in fc2 fas mutants
As all fas mutations reduce 1O2 signaling responses in fc2, we next tested if 1O2 is still accumulating in these plants. To this end, we measured 1O2 accumulation in leaves from 24-day-old plants subjected to 3 days of cycling light conditions (16h light/8h dark) using Singlet Oxygen Sensor Green (SOSG), a dye that fluoresces in the presence of 1O2. When infiltrated with SOSG and subjected to light, fc2 leaf disks accumulated significantly higher fluorescence levels than wt leaf disks (Supplementary Figure S2). This response was light-dependent. When wt and fc2 leaf disks were treated with SOSG but not subjected to light, lower fluorescence levels were observed, with no significant difference between genotypes. Without SOSG, virtually no fluorescence was detected in any leaf discs. Together, these results demonstrate that SOSG can be used to measure bulk 1O2 in leaf discs and that the fc2 mutant still accumulates increased levels of 1O2 in true leaves.
We repeated this assay with the fc2 fts and fc2 fas mutants. Again, fc2 accumulated significantly more bulk 1O2 than wt (Figures 4A, B). 1O2 was also observed to accumulate in fc2 toc33 and fc2 pub4-6 compared to wt. The high level of 1O2 in fc2 toc33 was unexpected as this mutant has low 1O2 levels as a seedling (Woodson et al., 2015). When we measured 1O2 accumulation in the fc2 fas mutants, we observed 1O2 accumulation at significantly increased levels (relative to wt) in fc2 fas1, fc2 fas3, fc2 fas6, fc2 fas7, fc2 fas8, and fc2 fas9. 1O2 levels in fc2 fas4 were observed to be increased (and statistically similar to fc2), but were not significantly different from wt. No significant accumulation of 1O2 was observed in the fc2 fas2 mutant compared to wt. These data suggest that most fas mutations do not reduce bulk 1O2 levels and, therefore, may reduce PCD and retrograde signaling by blocking a 1O2-mediated signal.
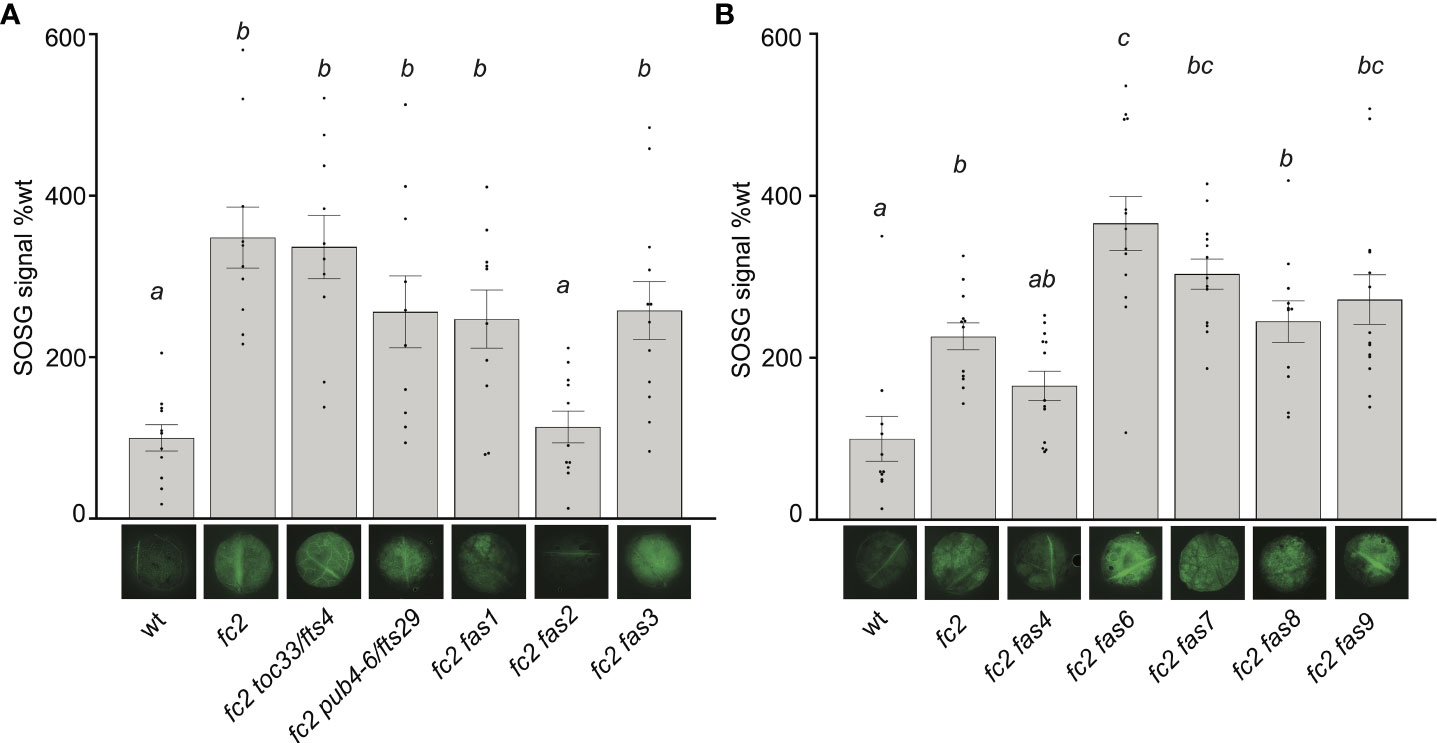
Figure 4 Singlet oxygen accumulation in fc2 fas mutants. Singlet oxygen (1O2) accumulation was monitored in 24-day-old leaf tissue. Plants were grown for 21 days in constant light conditions and then transferred to cycling light conditions (16h light/8h dark) for 3 days. Leaf disks were collected from the youngest fully extended leaves (#’s 3-6) to ensure all selected leaves were of similar age and had experienced a similar level of stress, and then infiltrated with singlet oxygen green (SOSG). (A, B) Images of representative leaf disks showing SOSG fluorescence positioned under graphs quantifying the SOSG signal. Each panel represents an independent experiment with the same conditions and parameters. Experiments were conducted in separate sets to limit the effect of SOSG signal decay during imaging. Brighter green fluorescence indicates higher bulk levels of 1O2. Quantification of the SOSG signal was tested with a one-way ANOVA with Tukey’s multiple comparisons post hoc to compare variation between genotypes. Different letters above bars indicate significant differences within data sets (P ≤ 0.05). n ≥ 10 leaf disks from replicate plants. Error bars = +/- SEM. Closed circles indicate individual data points.
Growth hormone responses are perturbed in fc2 fas mutants
While four fc2 fas mutants (fc2 fas3, fc2 fas6, fc2 fas7, fc2 fas8, and fc2 fas9) do reverse the impaired growth rate of cycling light stressed fc2, another four of the fc2 fas mutants (fc2 fas1, fc2 fas2, fc2 fas4, and fc2 fas7) do not (Figures 1A, D). This variability in growth rate between the different fas mutants led us to question whether growth hormone signaling is affected in these lines. To this end, we designed qPCR probes for key Gibberellic Acid (GA), Brassinosteroid (BR), Auxin (IAA), and Cytokinin (CK) response marker genes. We probed these growth hormone marker genes via RT-qPCR in 21-day-old plants grown in cycling light conditions (14 days of constant light conditions and moved to cycling light conditions (16h light/8h dark) for 7 days).
For GA response markers, we targeted two genes that have been reported to respond to GA: GAST1 PROTEIN HOMOLOG 1 (GASA1) and GIBBERELLIN 3-OXIDASE 1 (GA3OX1) (Herzog et al., 1995; Igielski and Kepczynska, 2017). We observed no differential expression pattern between wt and fc2 (Figures 5A, B). Two fas mutants (fc2 fas2 and fc2 fas7) showed significant induction of GASA1 (relative to wt), whereas only fc2 fas2 showed induction of GA3OX1 relative to wt.
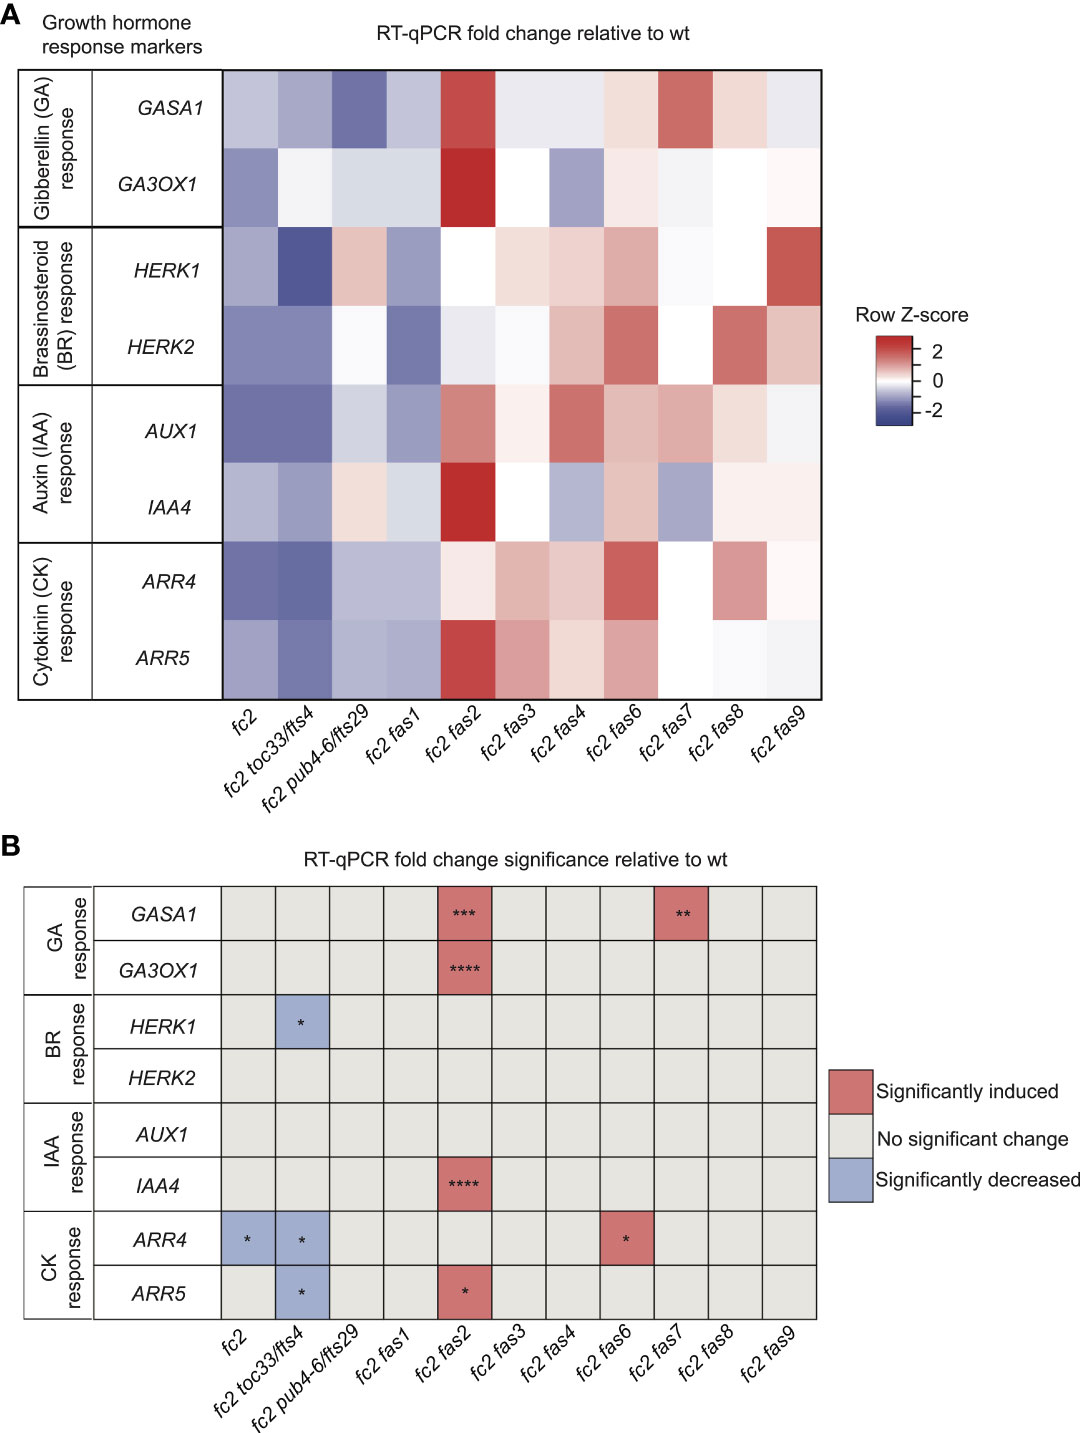
Figure 5 Growth hormone response markers are perturbed in some fc2 fas mutants. Expression of growth hormone response marker genes was probed via RT-qPCR. Transcript abundance was monitored in 21-day-old plants grown for 14 days in constant light conditions and then transferred to cycling light conditions (16h light/8h dark) for 7 days. Gibberellin (GA), brassinosteroid (BR), auxin (IAA), and cytokinin (CK) response marker genes (two of each) were selected from the literature (see main text) to probe growth hormone response. (A) A heatmap table summarizing growth hormone response fold-change relative to wt. (B) Table reporting significance of difference in marker transcript abundance relative to wt. Shades of red indicate increased transcript abundance; shades of blue indicate decreased transcript abundance. All quantification of RT-qPCR analyses were tested using a one-way ANOVA. A Dunnett’s multiple comparisons post hoc were used to compare variation between genotypes relative to wt (*P ≤ 0.05, **P ≤ 0.01, ***P ≤ 0.001, ****P ≤ 0.0001). n = 3 biological replicates. Error bars = +/- SEM. Closed circles indicate individual data points.
To investigate BR signaling, we chose probes for genes reported to respond to BR: HERCULES RECEPTOR KINASE 1 (HERK1) and HERCULES RECEPTOR KINASE 1 (HERK2) (Guo et al., 2009). Here, we did not observe any significant changes of expression between wt and fc2, or any fc2 fas mutants relative to wt (Figures 5A, B). Of the mutants tested, only fc2 toc33 exhibited a significant decrease in the expression of HERK1.
To investigate IAA signaling, we chose probes for genes reported to respond to IAA: AUXIN RESISTANT 1 (AUX1) and INDOLE-3-ACETIC ACID INDUCIBLE 5 (IAA5) (Paponov et al., 2008). We did not observe a change in the expression of these two genes in fc2 relative to wt (Figures 5A, B). However, only IAA5 was significantly induced in fc2 fas2, relative to wt.
Next, we chose probes for genes reported to respond to CK signaling: ARABIDOPSIS RESPONSE REGULATOR 4 (ARR4) and ARABIDOPSIS RESPONSE REGULATOR 5 (ARR5) (D'agostino et al., 2000). Relative to wt, we observed repression of ARR4 in fc2 (Figures 5A, B). This change was reversed in all fc2 fas mutants, except fc2 toc33 and fc2 fas6. Relative to wt, ARR5 was only significantly induced in fc2 fas2.
Together, these data suggest no obvious induction or repression pattern in GA, BR, IAA, and CK marker genes in fc2 relative to wt. Furthermore, while the expression of these growth hormone marker genes is perturbed in a few fc2 fas mutants (fc2 fas2, fc2 fas6, fc2 fas7) relative to wt, there was no obvious pattern of differential expression of these genes amongst all the fc2 fas mutants. The one notable exception was fc2 fas2, which exhibited induction of GA, IAA, and CK response marker genes.
Suppression of programmed cell death in fc2 fas mutants is not generally correlated with reduced growth
Previous studies demonstrate that tolerance to abiotic stress is linked to reduced growth rates. For example, reduced GA signaling can achieve abiotic stress tolerance at the expense of growth, leading to dwarf phenotypes (Colebrook et al., 2014). Indeed, compared to fc2, four fc2 fas mutants (fc2 fas1, fc2 fas2, fc2 fas4, and fc2 fas7) have smaller leaves with altered morphology [we considered the youngest fully extended leaves (true leaves #3-6)] (Figure 6A) and fail to rescue the impaired growth phenotype of cycling light-stressed fc2 (Figure 1D). Furthermore, fc2 fas2 and fc2 fas7 have altered GA marker gene expression (Figures 5A, B). Together, these observations open the possibility that the suppression of PCD in fc2 can be achieved by reducing growth rates. To test this possibility, we applied exogenous GA3 treatment. Under constant light conditions, the GA3 treatment led to wt, fc2, and fc2 fas1, fc2 fas2, fc2 fas7 mutants (but not fc2 fas4) having visually longer petioles than untreated plants (indicative of response to GA3) (Figure 6B). The same lines showed a GA3-dependent increase in biomass (Figure 6C). However, this difference was only statistically significant for fc2 fas2, suggesting that this mutant may be a GA-sensitive dwarf.
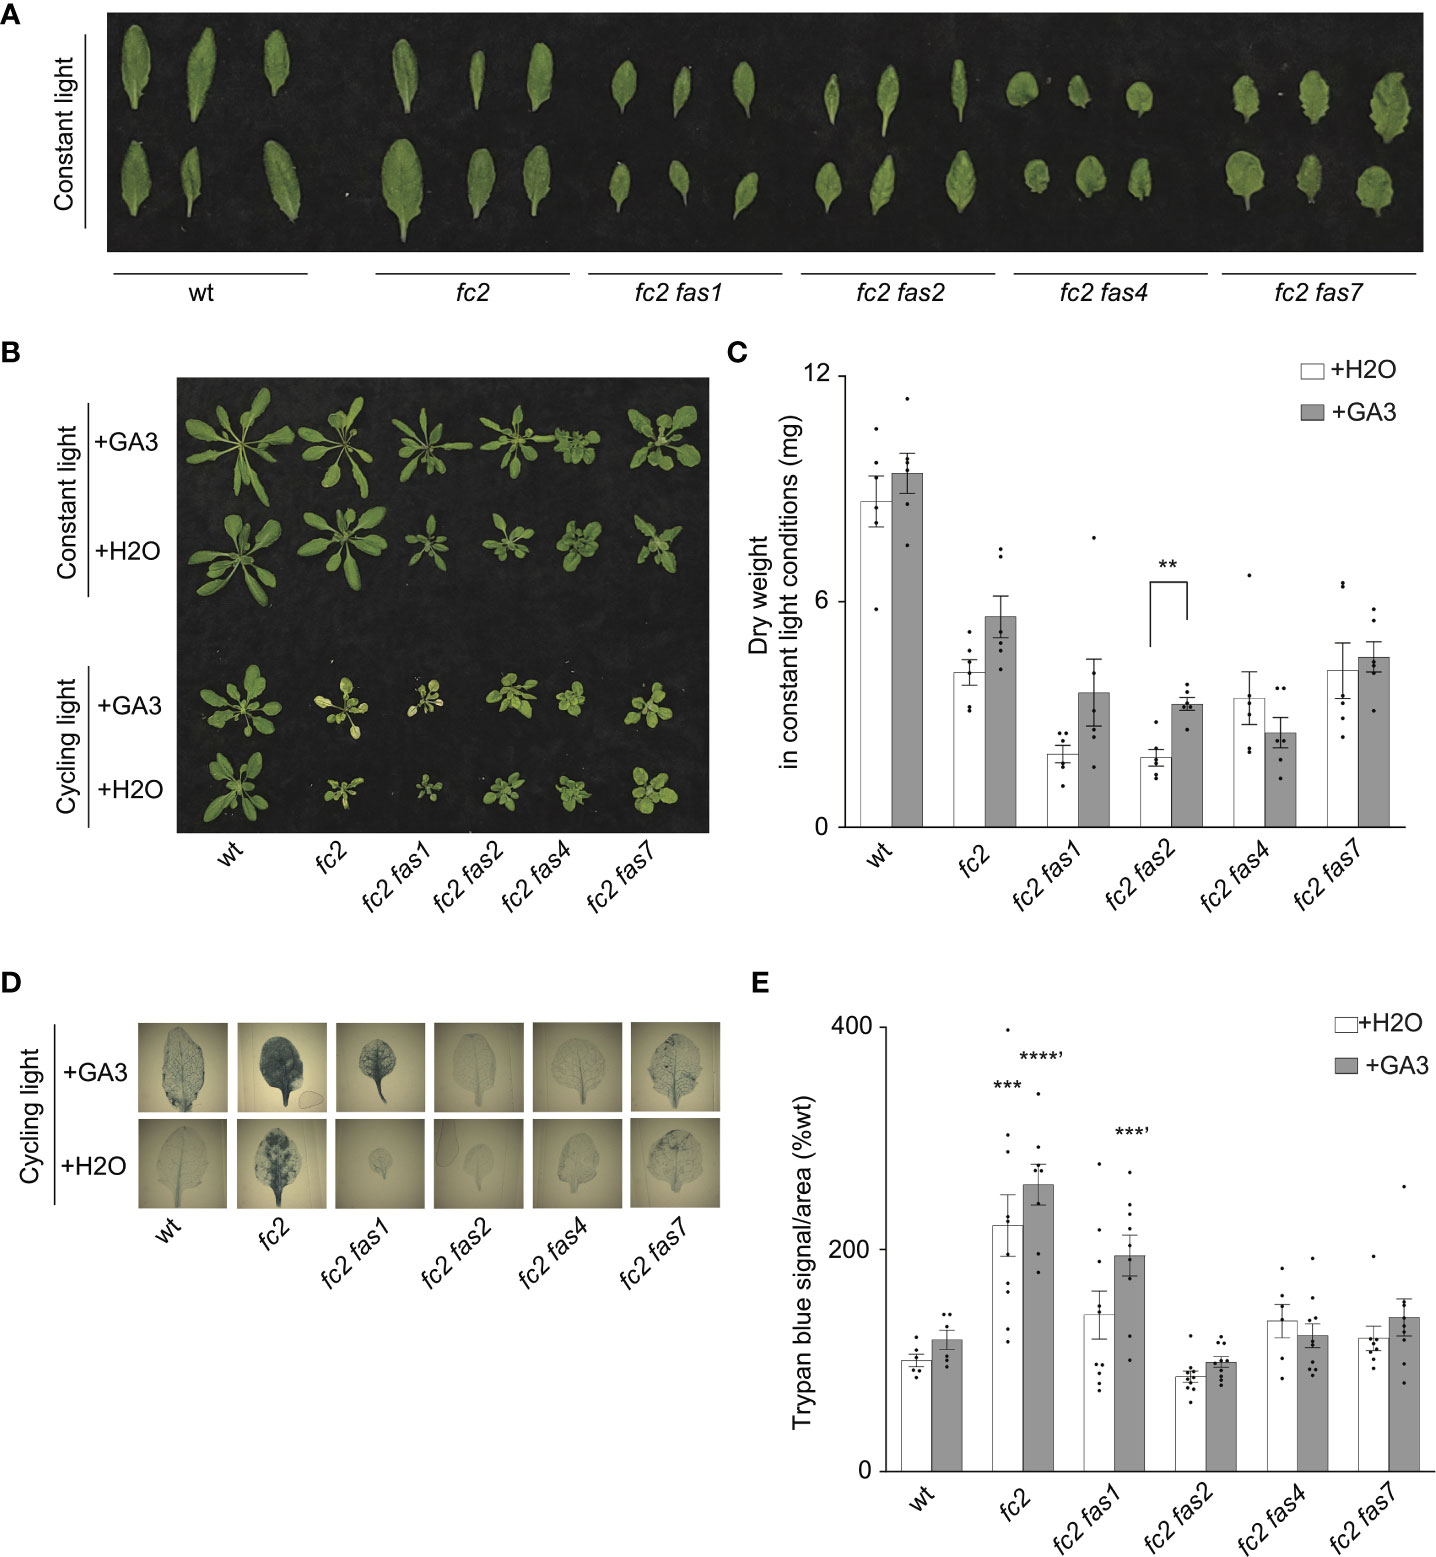
Figure 6 Response of fc2 fas mutants to exogenous GA3 treatments. The ability of gibberellin (GA) to promote programmed cell death in select fc2 fas mutants (those with growth deficiencies) was tested. Plants were grown for 21 days in constant light conditions or 14 days in constant light conditions and then transferred to cycling light conditions (16h light/8h dark) for 7 days. Exogenous GA3 (10-4 M GA3) treatment was administered starting on day 7. (A) Individual leaves from 21-day-old plants grown in constant light conditions. The youngest fully extended leaves were chosen (true leaves #3-6). (B) Representative images of plants grown in constant light conditions (top), or constant light conditions followed by cycling light conditions (bottom), with and without GA3 treatment. (C) Dry weight biomass (mg) was collected from plants grown in constant light, with H2O (mock control) or GA3 treatment. Student t-tests were used to compare differences between treatments (n = 6 biological replicates). (D) Representative images of leaves from plants grown under cycling light conditions, with H2O or GA3 treatment, and then stained with trypan blue. The youngest fully extended true leaves (#’s 3-6) were chosen to ensure all selected leaves were of similar age and had experienced a similar level of stress. The dark blue color indicates cell death. (E) Quantification of trypan blue stains shown in (D) For biomass quantification in c, paired Student’s t-tests were used to compare variation between H2O and GA3 treatments for each genotype (**P ≤ 0.01), n ≥ 6 leaves from individual plants. For trypan blue quantification in e, separate one-way ANOVAs and Dunnett’s multiple comparisons post hoc were used to compare variation between genotypes (relative to wt) treated with H2O or with GA3 (**P ≤ 0.01, ***P ≤ 0.001, ****P ≤ 0.0001, ‘ denotes GA3 treatment group). n ≥ 10 leaves from individual plants. In both (C, E), error bars = +/- SEM. Closed circles indicate individual data points.
Next, we explored the possibility that exogenous GA3 treatment can affect reduced PCD in the fc2 fas mutants. Under cycling light conditions, GA3 treatment restored PCD in the fc2 fas1 mutant (Figures 6B, D, E). However, the other fc2 fas mutants (fc2 fas2, fc2 fas4, and fc2 fas7) still retained their ability to suppress PCD when treated with GA3. These data suggest that the suppression of PCD observed in fc2 fas2, fc2 fas4, and fc2 fas7 is not chemically coupled to GA3-regulated growth enhancement. In contrast, the suppression observed in fc2 fas1 may be due, at least in part, to a GA deficiency and/or a reduced growth rate. Together, these results indicate that a reduced growth rate can protect from PCD in fc2, but it is not a general mechanism among the eight fas mutations.
fas mutations perturb stress hormone signaling in the fc2 mutant
The stress phenotypes of the fc2 fas mutants suggest that stress hormone pathways may be altered. To test this, we focused on the transcriptional responses to four major plant stress hormones, Salicylic Acid (SA), Jasmonic Acid (JA), Abscisic Acid (ABA), and Ethylene (ET), which have all been shown to be regulated in response to 1O2 and play roles in PCD and senescence (Laloi and Havaux, 2015).
To assess SA responses, we chose to probe the SA response genes PATHOGENESIS-RELATED GENE 1 (PR1), PATHOGENESIS-RELATED GENE 2 (PR2), and PATHOGENESIS-RELATED GENE 5 (PR5) (Schmitz et al., 2010). PR1 and PR5 (but not PR2) were induced in fc2 relative to wt (Figures 7A, B). This induction was mostly reversed in the fc2 fts and fc2 fas mutants, except for PR5 still being induced, relative to wt, in fc2 fas4 and fc2 fas7. However, while analyzing the induction of PR2, we noticed that fc2 fas8 had a very large induction of this gene (>260-fold compared to wt). Excluding fc2 fas8 from our analysis, PR2 was determined to be significantly (P ≤ 0.01) induced in fc2 but not in any other fc2 fas mutant compared to wt (Supplementary Table S5). These data suggest that SA signaling is induced in fc2 and is generally returned to wt levels in fc2 fas mutants.
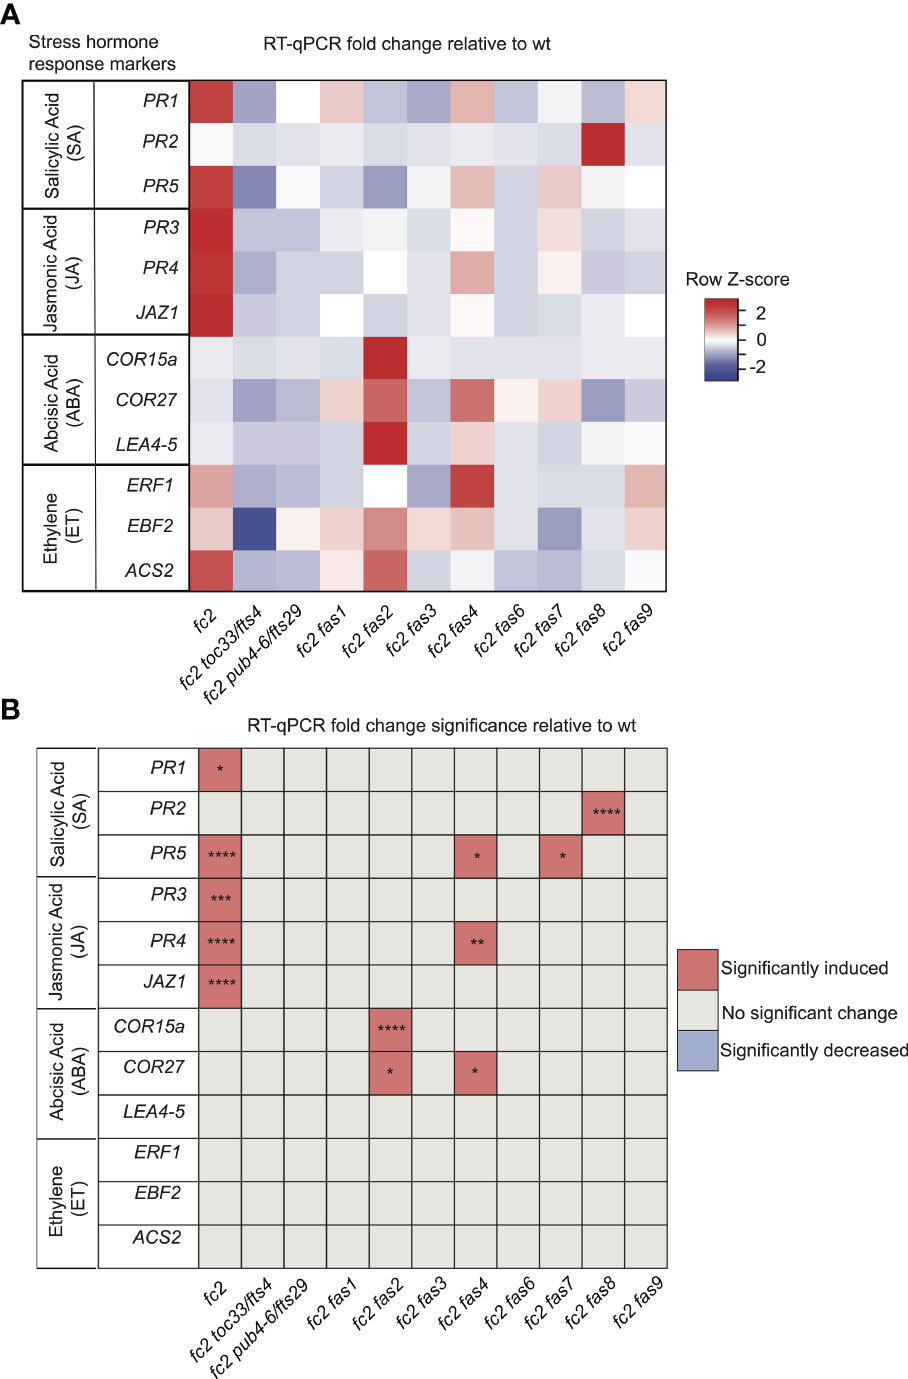
Figure 7 Analysis of stress hormone signaling in fc2 and fc2 fas mutants. Stress hormone signaling in fc2 and fc2 fas mutants was assessed by measuring hormone response marker gene expression by RT-qPCR. Steady-state transcript levels were monitored in plants grown for 14 days in constant light conditions and then transferred to cycling light (16h light/8h dark) conditions for 7 days. Marker genes for salicylic acid (SA), Jasmonic acid (JA), abscisic acid (ABA), and ethylene (ET) were selected to probe stress hormone responses. (A) A heatmap table summarizing stress hormone response transcript abundance fold change relative to wt. Shades of red indicate increased transcript abundance and shades of blue indicate decreased transcript abundance. (B) Table reporting the significance of the difference in stress hormone response marker transcript abundance relative to wt. All quantification of qPCR analyses were tested using a one-way ANOVA. A Dunnett’s multiple comparisons post hoc were used to compare variation between genotypes relative to wt (*P ≤ 0.05, **P ≤ 0.01, ***P ≤ 0.001, ****P ≤ 0.0001). n = 3 biological replicates.
To assess transcriptional responses to JA, we chose to monitor marker genes PATHOGENESIS-RELATED GENE 3 (PR3), PATHOGENESIS-RELATED GENE 4 (PR4), and JASMONATE-ZIM-DOMAIN PROTEIN 1 (JAZ1) (Schmitz et al., 2010; Valenzuela et al., 2016). All three genes were significantly induced in fc2, relative to wt (Figures 7A, B). This induction pattern was reversed in fc2 toc33, fc2 pub4-6, and all fas mutants, except for PR4 in fc2 fas4. As such, JA signaling may be activated in fc2 but is reversed by the fts and fas mutations.
To assess transcriptional responses to ABA, we probed the marker genes COLD-REGULATED 15A (COR15A), COLD REGULATED GENE 27 (COR27), and LATE EMBRYOGENESIS ABUNDANT 4-5 (LEA4-5) (Hoth et al., 2002; De Torres-Zabala et al., 2007; Hundertmark and Hincha, 2008). We observed no significant induction of these ABA markers in fc2 relative to wt (Figures 7A, B). The only marker genes induced, relative to wt, in fc2 fas mutants were COR15a in fc2 fas2 and COR27 in fc2 fas2 and fc2 fas4. These data suggest that ABA signaling is not activated in fc2, but may be altered in fc2 fas2 and fc2 fas4.
Finally, to assess transcriptional responses to ET, we probed the ET signaling marker genes ETHYLENE RESPONSE FACTOR 1 (ERF1), EIN3-BINDING F BOX PROTEIN 2 (EBF2), and 1-AMINO-CYCLOPROPANE-1-CARBOXYLATE SYNTHASE 2 (ACS2) (Muller and Munne-Bosch, 2015; Yu et al., 2021). We did not observe any induction of these ET response genes in any mutant relative to wt, suggesting that ethylene signaling is not broadly affected in fc2 or perturbed by the fas mutations (Figures 7A, B).
As SA and JA hormone response markers can play a role in senescence (Morris et al., 2000; He et al., 2002), we also chose to investigate the expression of known senescence-associated genes (SAGs) (Niu et al., 2020). Here, SAG12, SAG13, SAG21, SAG101, and WRKY53 were probed by RT-qPCR. Only SAG13 and SAG21 were induced in fc2 relative to wt (Supplementary Figures S5A, B). The expression of SAG13 and SAG21 was reduced to levels statistically insignificant from wt in all fc2 suppressor mutants tested. SAG101, on the other hand, was observed to be induced in fc2 fas4, fc2 fas7, and fc2 fas9 relative to wt. Together, these results suggest that SA and JA signaling is induced in stressed fc2 and returned to wt levels in most fc2 fts and fc2 fas mutants. Thus, the stress response in fc2 may also involve the activation of an early senescence program.
Testing the tolerance of fc2 fas mutants to additional forms of oxidative stress
As fas mutants suppress 1O2 signaling phenotypes, we next asked if this suppression is specific to 1O2 overproduction in the chloroplast or if any of these mutants are generally tolerant to photooxidative stress. To investigate this possibility, we first tested the response of fas mutants to two forms of abiotic stress that are expected to produce different forms of ROS in the chloroplast: excess light (EL) and methyl viologen (MV). EL treatment produces high levels of 1O2 at PSII (Vass et al., 1992), while MV treatment produces superoxide (O2-) at PSI (Hassan, 1984), followed by the spontaneous or enzymatic conversion of O2- to H2O2 (Hassan, 1988).
To test the tolerance of fas mutants to EL, 21-day-old plants were subjected to 1450-1500 µmol photons s-1 m-2 for 24 hours. As EL can generate heat, we set the chamber to 10°C to offset this effect (the resulting average leaf temperature was 19.7°C). Here, both wt and fc2 exhibited photobleaching and lesion formation in leaf tissue, which failed to recover 3 days after 24h EL treatment (Figure 8A). In contrast, fc2 pub4-6, fc2 fas1, fc2 fas2, fc2 fas7, and fc2 fas8 exhibited delayed lesion formation. To quantify this response, lesion count ratios (# damaged leaves/# total leaves) were calculated from plants immediately after 24 hours of EL (prior to recovery to limit potential regreening and/or new growth). We observed no significant difference in the lesion count ratio between wt and fc2, both having an average lesion count ratio of ~0.54 (Figure 8B). The formation of necrotic lesions was observed to be delayed (relative to fc2) in fc2 pub4-6 and fc2 fas1, fc2 fas2, fc2 fas7, and fc2 fas8. While conducting lesion counts, we observed that leaf lesions were not always uniform between different genotypes (e.g., in fc2 fas3 and fc2 fas6, lesions appeared larger on the leaves of some plants (Figure 8A). To further quantify EL-induced cell death, trypan blue stains were performed with the youngest fully extended true leaves (#3-6). Again, no significant difference was observed between wt and fc2 (Figures 8C, D). We did observe a significant delay in cell death (relative fc2) in fc2 pub4-6, fc2 fas1, fc2 fas2, fc2 fas7, fc2 fas8, and fc2 fas9, but not in fc2 toc33, fc2 fas3, and fc2 fas6.
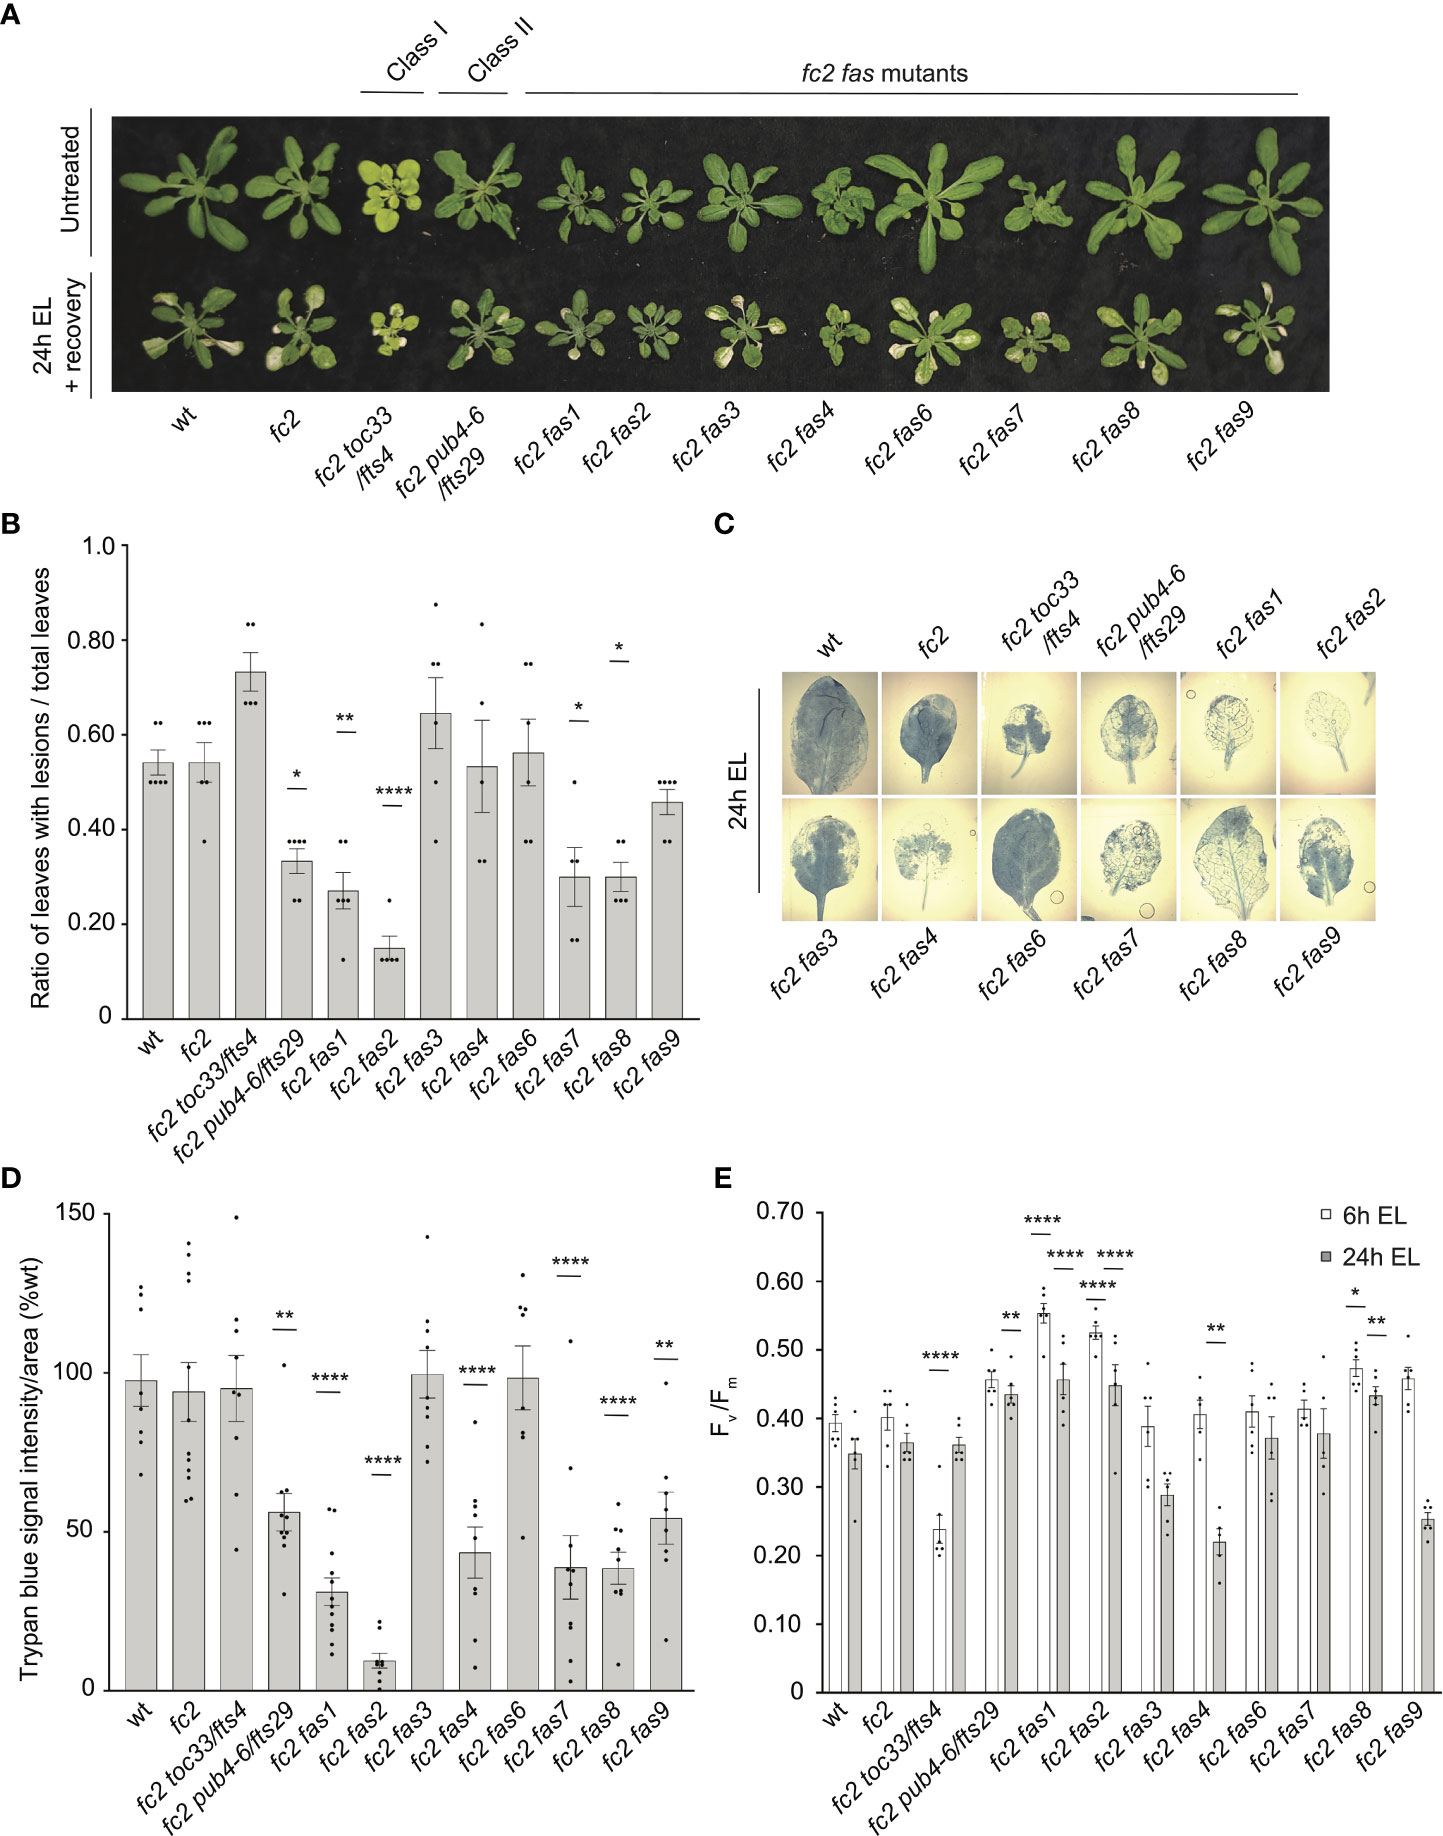
Figure 8 Testing the tolerance of fc2 fas mutants to excess light stress. Excess light (EL) treatments were applied to test the tolerance of fc2 fas mutants to a different source of chloroplast reactive oxygen species (ROS). Plants were grown for 21 days in constant light conditions and then exposed to EL at an intensity of 1450-1550 µmol photons m-2 sec-1 white light at 10°C. (A) Image showing representative 25-day-old plants, either unexposed (top row) or exposed to EL stress for 24 hours and allowed to recover for three days (bottom row). (B) Quantification of lesion counts (ratio of leaves with observable cell death/healthy leaves) immediately after 24h EL exposure, prior to regreening and new growth (n ≥ 5 replicate plants). Prior to treatment, plants had no observable lesions. (C) Representative images of leaves collected from plants assessed for lesion counts in panel b and stained with trypan blue. The youngest fully extended leaves (#’s 3-6) were chosen to ensure all selected leaves were of similar age and had experienced a similar level of stress. The dark blue color indicates dead tissue. (D) Quantification of trypan blue stains shown in c (n ≥ 10 leaves from replicate plants). (E) Quantification of maximum photosynthetic efficiency (Fv/Fm) from whole plants after 6h or 24h EL exposure (n ≥ 5 replicate plants). Prior to treatment, plants had the expected Fv/Fm ratios for unstressed plants (0.80-0.84) (Supplementary Figure S6A). All Fv/Fm measurements, lesion counts, and trypan blue stains were tested with a one-way ANOVA and Dunnett’s multiple comparisons post hoc to compare variation between genotypes relative to fc2 (*P ≤ 0.05, **P ≤ 0.01, ****P ≤ 0.0001). Error bars = +/- SEM. Closed circles indicate individual data points.
We also measured the impact of EL stress on photosynthesis by calculating the maximum potential quantum efficiency of PSII (Fv/Fm). Generally, decreased Fv/Fm ratios correlate with plant stress. To set baseline Fv/Fm values for unstressed plants and to ensure that fas mutants are not starting in a pre-stressed state, chlorophyll fluorescence measurements were taken from untreated, constant light grown plants at 21, 23, and 28 days old (21-28 days being the general age of plants assessed via chlorophyll fluorescence measurements in this study). The Fv/Fm values ranged from ~0.81 to 0.84 (Supplementary Figure S1A–C). The only mutant with constitutively decreased values compared to fc2 was fc2 toc33, which ranged between ~0.78-0.81.
We next measured Fv/Fm values of whole 21-day-old plants immediately after 6h and 24h EL treatment. After 6h EL treatment, Fv/Fm values decreased in all plant lines (Figure 8E). However, we observed no significant difference between fc2 and wt. Compared to fc2, we did observe significantly lower Fv/Fm values in fc2 toc33 and significantly higher Fv/Fm values in fas1, fc2 fas2, and fc2 fas8. Following 24h EL treatment, Fv/Fm values decreased even further in most plant lines. Again, we observed no significant difference between fc2 and wt. However, at this time point, compared to fc2, we observed significantly lower Fv/Fm values in fc2 fas4 and significantly higher Fv/Fm values in fc2 pub4-6, supporting earlier observations that the pub4-6 mutation protects cells from EL stress (Tano et al., 2023). fc2 fas1, fcs fas2, and fc2 fas8 also had significantly higher Fv/Fm values compared to fc2. Together, these results show that six of the eight fas mutations also lead to a similar degree of photoprotection from EL.
To test the tolerance of fas mutants to a different form of photooxidative chloroplast stress, we next applied 20 μM or 200 μM MV to 21-day-old plants grown in constant light to induce the accumulation of O2-, and consequently H2O2 in chloroplasts. Lesion count ratios were calculated four days after treatment (to allow time for lesion formation) to assess MV tolerance. When 20 μM MV was applied, wt and fc2 exhibited similar lesion formation levels (Figures 9A, B). Only fc2 fas2 and fc2 toc33 had reduced lesion formation relative to fc2. None of the plants survived a more stringent (200 uM) MV treatment (Figure 9A). As such, we did not assess lesion formation in response to this treatment regimen. When photoinhibition was measured via chlorophyll fluorescence 24 hours after 20 μM MV treatment, all plant lines exhibited a decrease in Fv/Fm values (Figure 9C). However, no significant difference was observed between fc2 and wt. Compared to these controls, only fc2 fas2 displayed a tolerance to 20 μM MV (Figure 9C) (we did not assess photoinhibition in response to 200 μM MV). Together, these data suggest that fc2 fas2, but not other fas mutants, may have a general tolerance to chloroplast photooxidative stress.
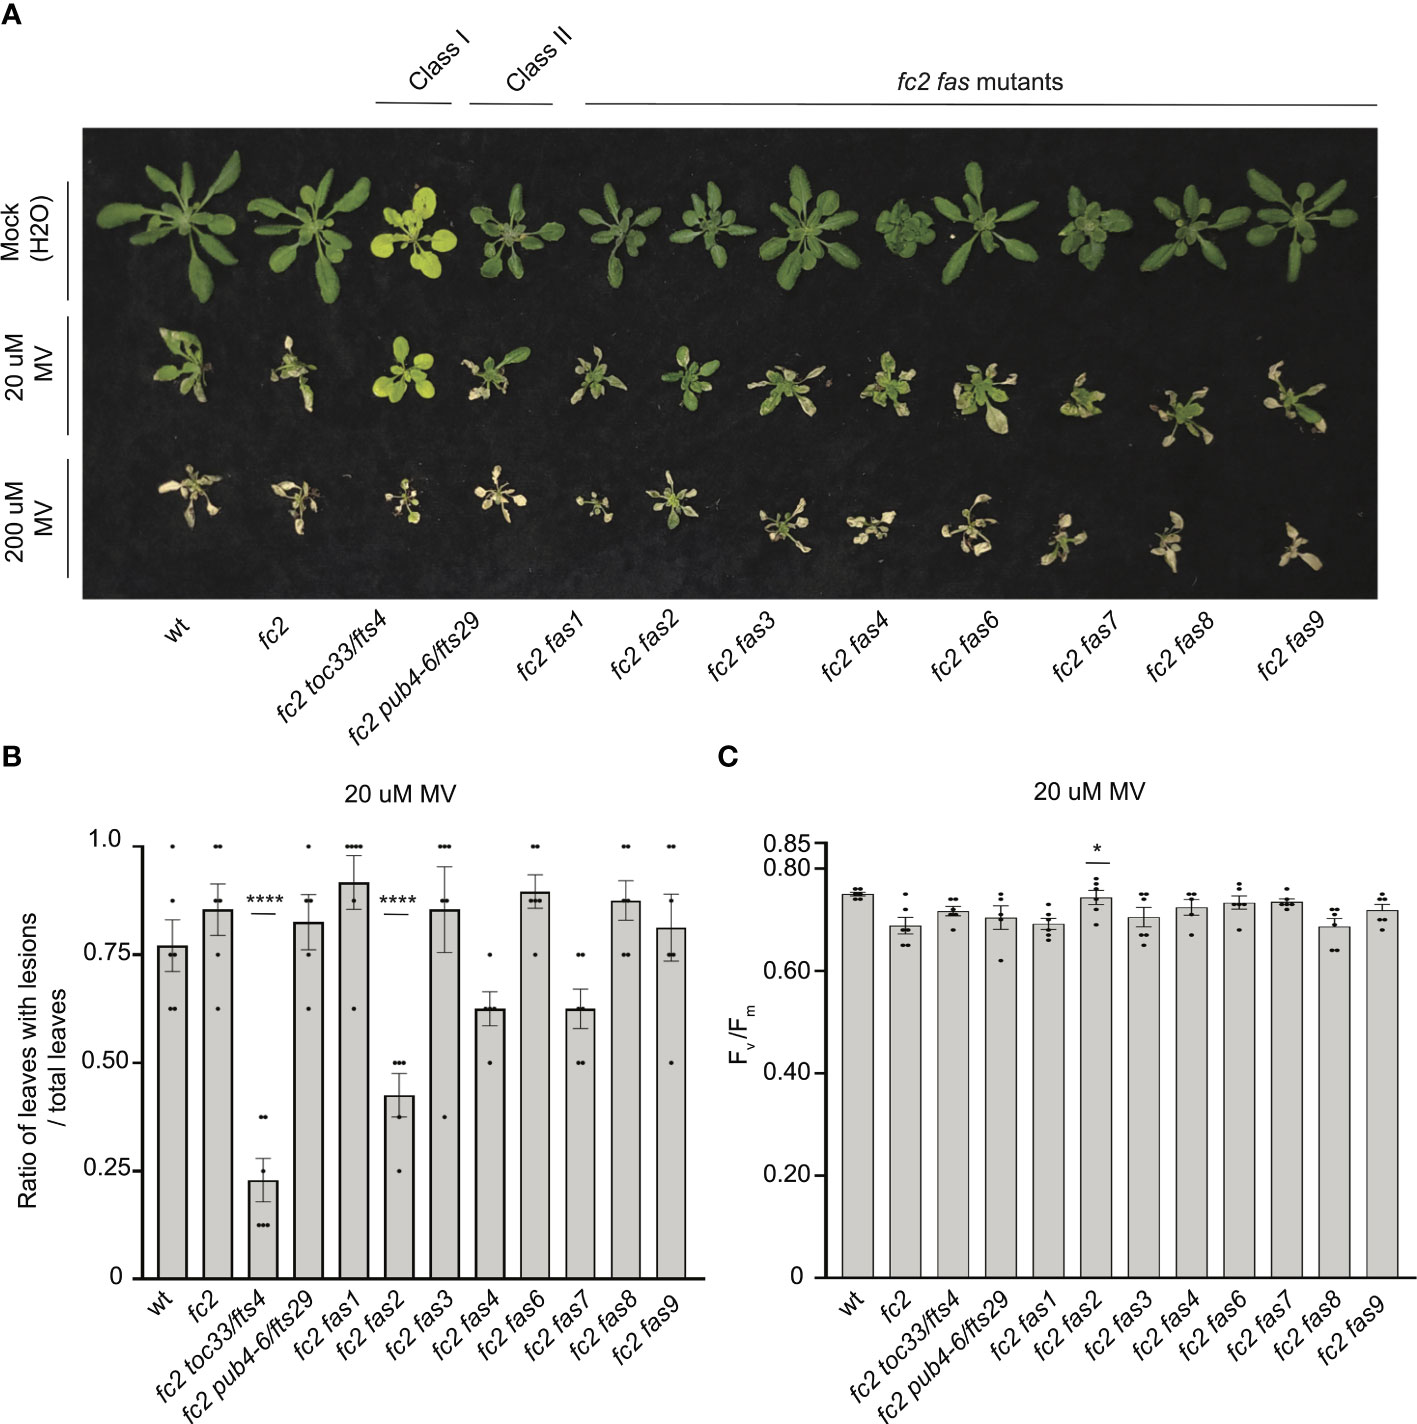
Figure 9 Testing the tolerance of fc2 fas mutants to methyl viologen. Methyl viologen (MV) treatments were applied to test the tolerance of fc2 fas mutants to chloroplast hydrogen peroxide (H2O2). Plants were grown for 21 days in constant light conditions and then treated with MV to generate superoxide (-O2) and, subsequently, H2O2 stress. (A) Image of representative 25-day-old plants treated with either Mock (H2O) treated (top row), 20µm MV (middle row), or 200µm MV (bottom row) at 21 days and then grown for another four days in constant light conditions. (B) Quantification of lesion counts (ratio of leaves with observable cell death/healthy leaves) after 20µm MV treatment from plants in panel a (n ≥ 4 plants). (C) Quantification of maximum photosynthetic efficiency (Fv/Fm) from whole plants, 24h hours after 20µm MV treatment (n ≥ 4 plants). Prior to treatment, plants had the expected Fv/Fm ratios for unstressed plants (~0.80-0.84) (Supplementary Figure S6A). All lesion count and Fv/Fm measurements were tested with a one-way ANOVA and Dunnett’s multiple comparisons post hoc to compare variation between genotypes relative to fc2 (*P ≤ 0.05, ****P ≤ 0.0001). Error bars = +/- SEM. Closed circles indicate individual data points.
Testing the tolerance of fc2 fas mutants to heat, freezing, and carbon starvation stress
To test if fas mutations are specifically affecting responses to chloroplast 1O2 stress or if they are generally tolerant to abiotic stress, we next tested their response to heat (40°C), freezing (-20°C), and dark-induced carbon starvation (for 5-7 days). Such abiotic stress can negatively affect chloroplast function and enhance light-dependent accumulation of chloroplast ROS (Gururani et al., 2015). As such, all three stresses were tested in dark conditions to limit the possible role of light-dependent chloroplast ROS.
For heat treatments, 21-day-old plants were exposed to 40°C in the dark for 16 or 24 hours, and then plants were allowed to recover for three days to assess survival. Plant survival was variable after 16 hours at 40°C. After 24h at 40°C, however, wt and fc2 plants were unable to recover (Figure 10A). While most fc2 suppressors also failed to recover, fc2 pub4-6 and fc2 fas2 were both able to survive. To quantify the level of stress incurred by the plants, we again measured Fv/Fm values, which were taken 1 hour after the heat treatment. After 16h of heat, all lines showed a decrease in Fv/Fm values, indicating a degree of photosynthetic stress (Supplementary Figures S7A). However, we observed no significant difference between wt and fc2. Most fc2 fts/fas mutants had similarly low Fv/Fm values. However, fc2 pub4-6 and fc2 fas2 showed a degree of tolerance with significantly higher Fv/Fm values (compared to fc2). Interestingly, the fcs toc33 mutant appeared sensitive to the heat treatment and had significantly lower Fv/Fm values than fc2. When exposed to a longer heat treatment of 40°C for 24 hours, most of the plant lines still experienced a pronounced reduction of Fv/Fm values (Figure 10B). Again, fc2 pub4-6 and fc2 fas2 still exhibited a significantly higher Fv/Fm values than fc2, while fc2 toc33 exhibited a significantly lower Fv/Fm values than fc2. Together, these data suggest that the abiotic stress tolerance of fts fas mutants does not generally extend to heat tolerance. However, fc2 fas2 and fc2 pub4-6 can protect their photosynthetic machinery during prolonged heat stress.
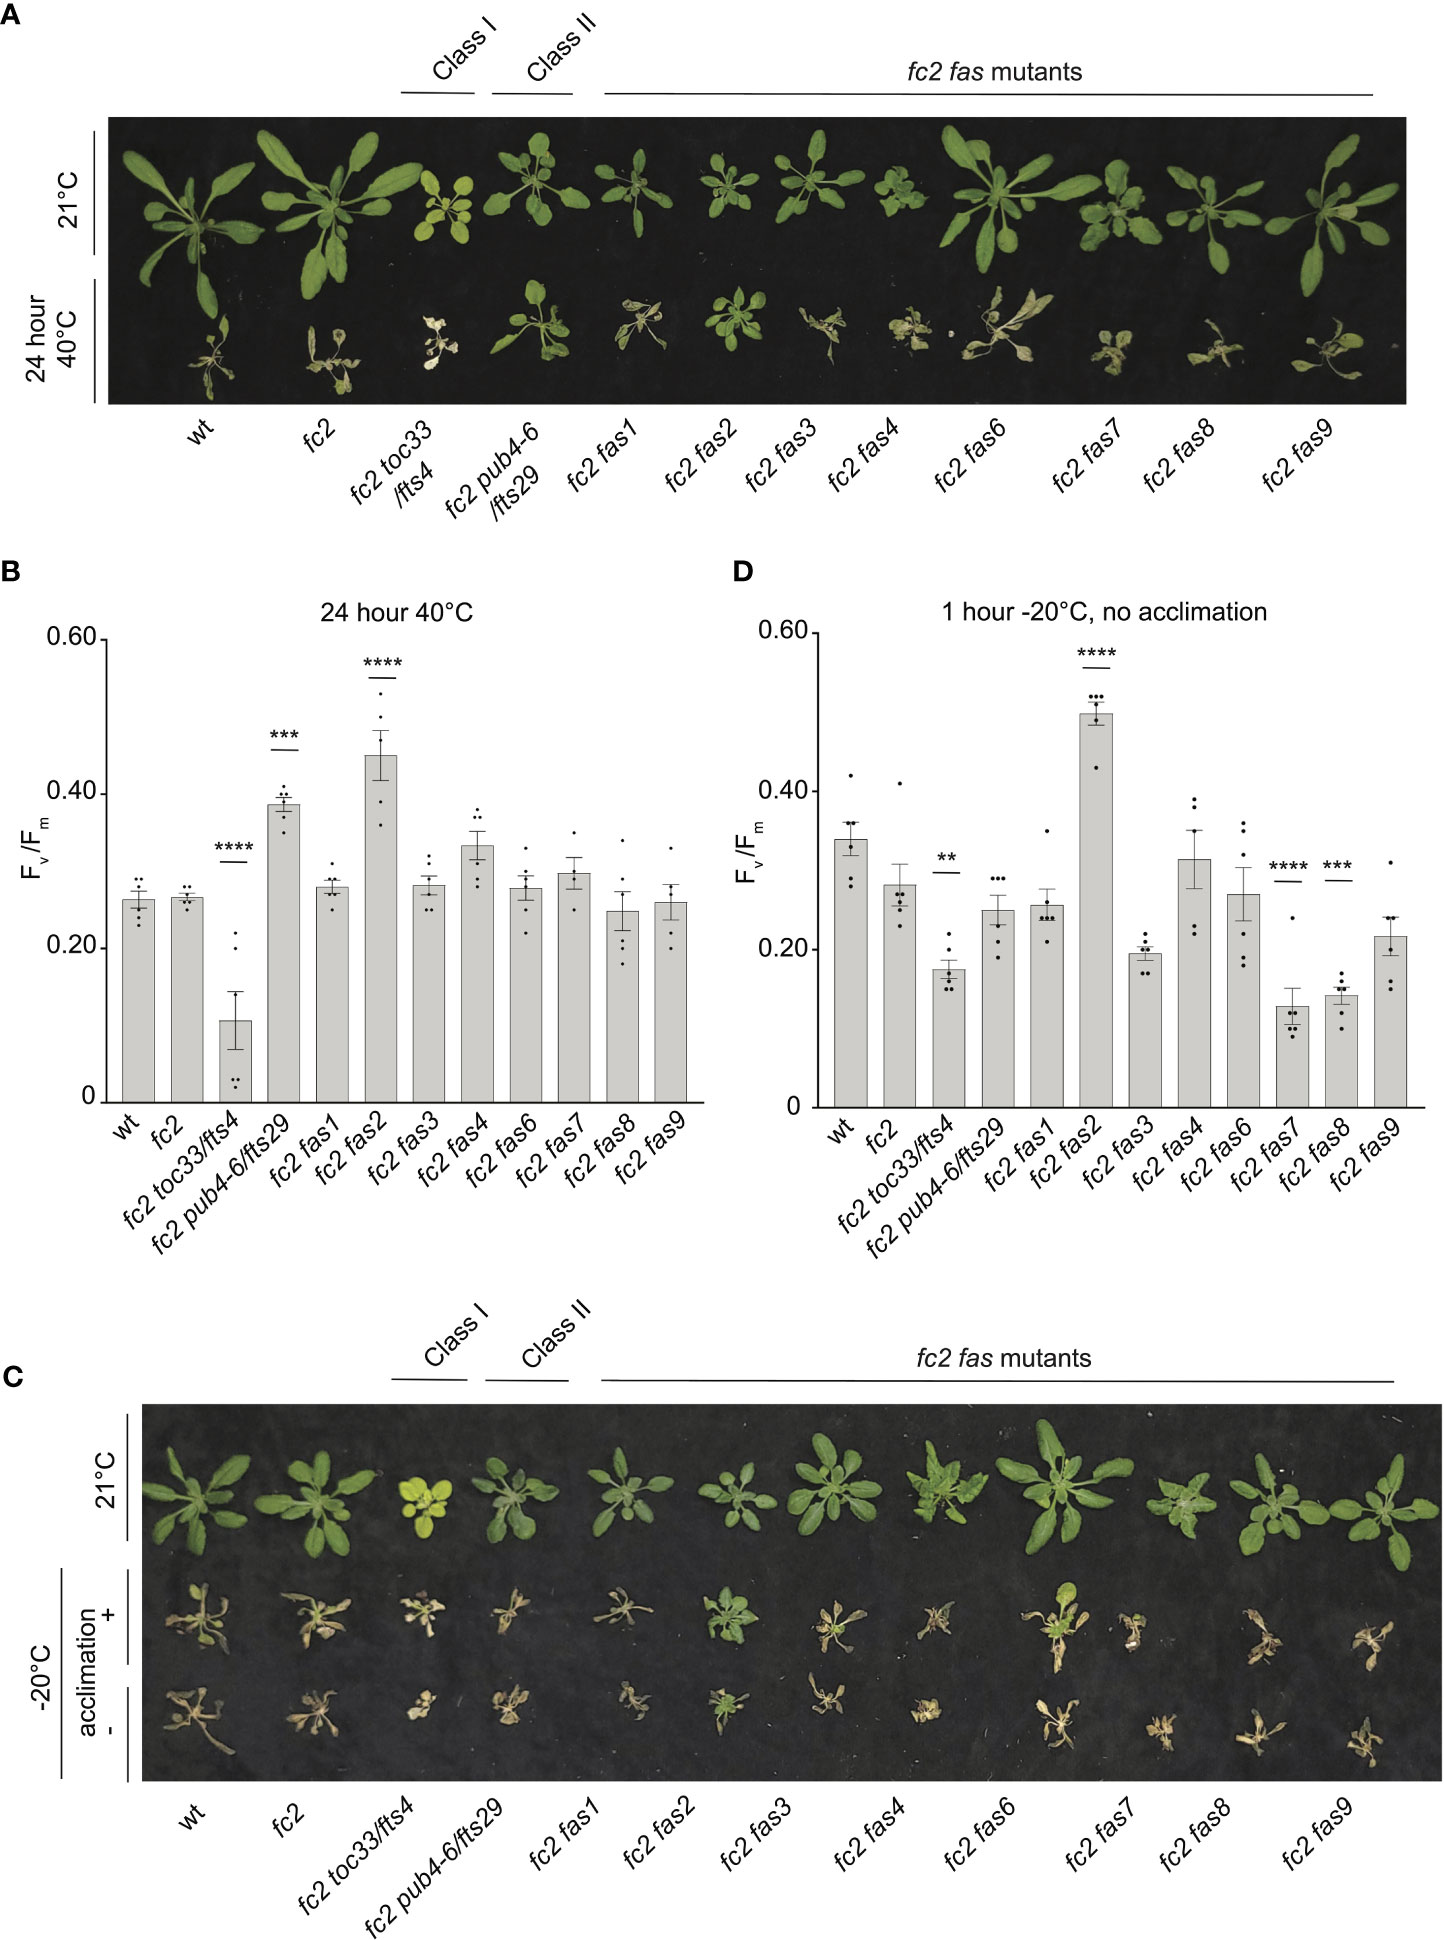
Figure 10 Testing the tolerance of fc2 fas mutants to heat and freezing stresses. fc2 fas mutants were tested for their tolerance to different temperature stresses. Plants were grown for 21 days in constant light conditions and then exposed to heat stress (40°C) (A, B) or freezing stress (-20°C) (C, D). (A) Image showing representative 25-day-old plants, either unexposed (top) or exposed to 40°C for 24h and allowed to recover in constant light at 21°C for three days in constant light conditions. (B) Quantification of maximum photosynthetic efficiency (Fv/Fm) from whole plants after 24h of 40°C treatment and one hour of recovery (n ≥ 4 plants). (C) Images of 25-day-old plants untreated (top row), exposed to freezing (-20°C for 1 hour) with cold acclimation for 16h at 4°C (middle row), or exposed to freezing without cold acclimation (bottom row) and allowed to recover in constant light at 21°C for three days in constant light conditions. (D) Quantification of Fv/Fm measurements taken after freezing treatment (without prior acclimation) and allowed to recover for 2 hours (n ≥ 4 plants). All Fv/Fm measurements were tested with a one-way ANOVA and Dunnett’s multiple comparisons post hoc to compare variation between genotypes relative to fc2 (**P ≤ 0.01, ***P ≤ 0.001, ****P ≤ 0.0001). Error bars = +/- SEM. Closed circles indicate individual data points.
To test mutants for tolerance to freezing stress, 21-day-old plants were first acclimated to cold (16h at 4°C) and then subjected to -20°C for 1 hour in the dark. When allowed to recover for 3 days, most plants failed to survive (Figure 10C). However, fc2 fas2 plants consistently exhibited a degree of survival and remained green. To quantify this stress response, we measured Fv/Fm values of plants 1 hour after freezing treatment. As expected, all plants showed a decrease in Fv/Fm values, but they were significantly higher in fc2 fas2 compared to wt or fc2 (Supplementary Figures S7B), suggesting that fc2 fas2 mutants can protect their chloroplast membranes during freezing stress. We then increased the stringency of the experiment by exposing plants to the same freezing stress without prior cold acclimation. Surprisingly, fc2 fas2 mutants again survived (retained some green leaves) and retained higher Fv/Fm values than wt or fc2 (Figures 10C, D). Under these conditions, fc2 toc33, fc2 fas7, and fc2 fas8 exhibited significantly decreased Fv/Fm values. Together, these data suggest that the fc2 fas mutants are not generally tolerant to freezing stress (fc2 fas7 and fc2 fas8 are sensitive), but fc2 fas2 continues to show a broad tolerance to multiple types of abiotic stress.
Dark-induced carbon starvation activates senescence, autophagy, and chlorophagy and predominantly involves H2O2 signaling (Wada et al., 2009; Perez-Perez et al., 2012). To test the response of fas mutants to dark-induced carbon starvation, 23- or 21-day-old plants were placed in the dark for five or seven days, respectively, and then allowed to recover for four days. We also included autophagy 5 [atg5, a mutation that impairs the assembly of autophagosomes and blocks canonical autophagy pathways (Thompson et al., 2005)] in the wt (atg5) and fc2 (fc2 atg5) backgrounds to visualize dark-induced carbon starvation sensitivity. After five days of dark starvation, wt and fc2 plants accumulate leaf lesions but survive (retain green tissue) (Figure 11A). Consistent with previous work (Thompson et al., 2005), the carbon starvation-sensitive mutant atg5 (as well as the fc2 atg5 double mutant) failed to survive after being subjected to only five days of darkness (no green tissue remained). The fc2 fts and fc2 fas mutants displayed different levels of survival. To quantify this, we measured Fv/Fm values 1 hour after dark treatment. Both wt and fc2 showed a reduction of Fv/Fm values but were statistically similar. However, after five days of dark treatment, fc2 toc33, fc2 fas2, and fc2 fas7 exhibited a higher Fv/Fm than fc2 (Figure 11B). Under a more stringent regimen (7 days dark), all plants failed to survive, except fas2 fc2 and fas7 fc2 (Figure 11A). Only fc2 fas7 was observed to have a significantly increased Fv/Fm values compared to fc2 (Figure 11B). Thus, while fc2 toc33, fc2 fas2, and fc2 fas7 are tolerant to dark-induced carbon starvation and display a “stay-green” phenotype, the remaining six fc2 fas mutants are not tolerant to these stresses.
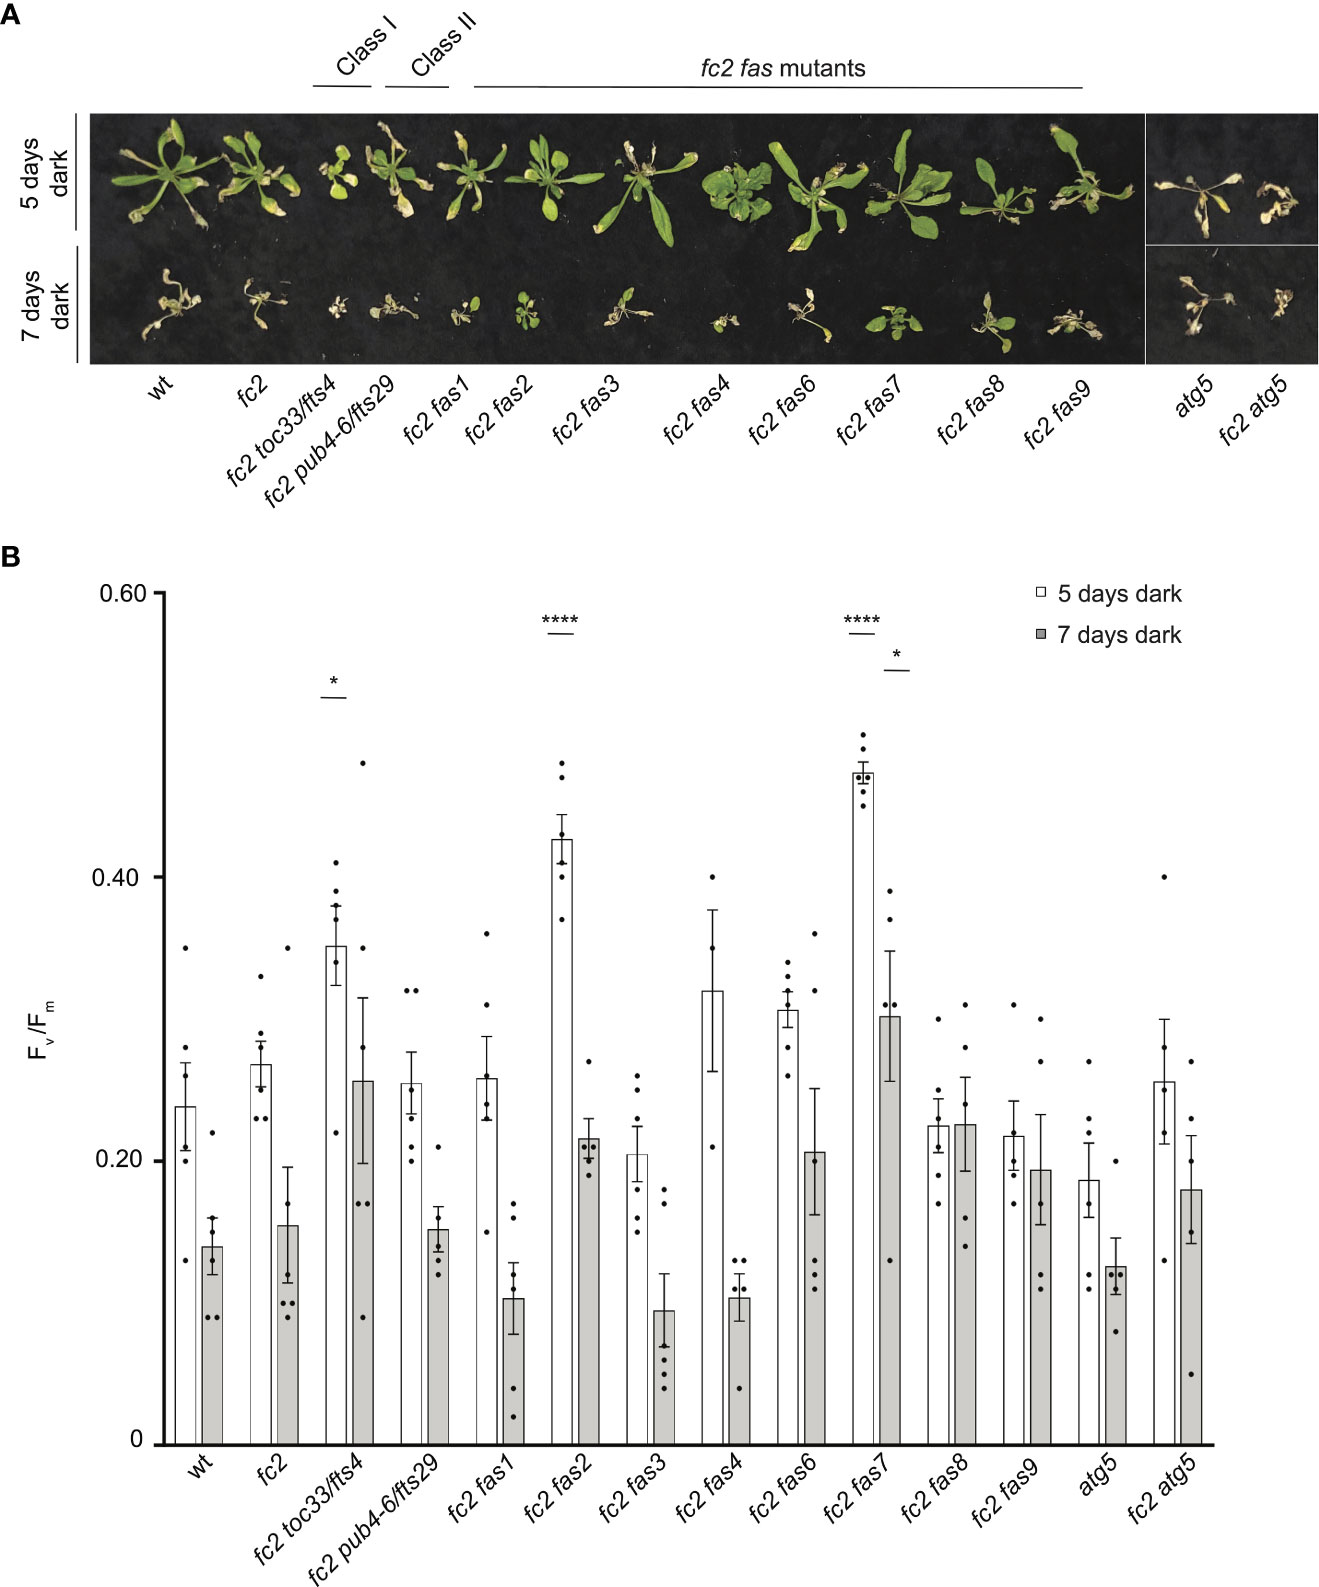
Figure 11 Testing the tolerance of fc2 fas mutants to dark-induced carbon starvation. The tolerance of fc2 fas mutants to dark-induced carbon starvation was assessed. (A) Representative images of 32-day-old plants exposed to dark-induced carbon starvation for five (starting at 23 days old) or seven days (starting at 21 days old). Plants were allowed to recover for four days in constant light conditions. (B) Quantification of maximum photosynthetic efficiency (Fv/Fm) from whole plants 1 hour after removal from dark conditions. All Fv/Fm measurements from each treatment regimen were tested separately with a one-way ANOVA with Dunnett’s multiple comparisons post hoc to compare variation between genotypes relative to fc2 (*P ≤ 0.05, ****P ≤ 0.0001). n ≥ 4 plants. Error bars = +/- SEM. Closed circles indicate individual data points.
Taken together, these data suggest that the fc2 fas mutants are only generally tolerant to abiotic stresses that produce 1O2 in chloroplasts (fc2 stress and EL) and not to those that produce H2O2 in the chloroplast (MV) or ROS outside the chloroplast (heat, freezing, dark starvation). However, the fc2 fas2 mutant proved to be an outlier, being tolerant to every stress we tested. A summary of these phenotypes is in Supplementary Table S9.
Discussion
The accumulation of chloroplast 1O2 can trigger retrograde signaling and cellular degradation, allowing a plant to respond to environmental stress by activating acclimation systems or promoting plant fitness by terminating dysfunctional cells (Wagner et al., 2004; Ramel et al., 2013; Woodson et al., 2015). The mechanisms behind these signals are not well understood, but the use of Arabidopsis genetic model systems such as fc2, which conditionally produce chloroplast 1O2, allow researchers to identify and characterize signaling components. To this end, a forward genetic suppressor screen using EMS had already yielded mutants that suppress chloroplast 1O2-signaling and PCD in fc2 seedlings and has successfully identified proteins involved in ubiquitination (Woodson et al., 2015) and plastid gene expression (Alamdari et al., 2020; Alamdari et al., 2021) as being important in propagating the 1O2 signal from chloroplasts. However, these mutations were generated using EMS, which predominantly produces recessive alleles, and will mostly uncover positive regulators of 1O2-signaling. To “complement” this work and gain a more comprehensive view of the genes involved in chloroplast stress signaling, here we have used activation tagging to generate dominant gain-of-function alleles, which we hypothesized would identify new genes involved in 1O2-signaling, including negative regulators.
Eight dominant fc2 fas mutants that suppress PCD reveal differential stage-specific 1O2 response mechanisms
The screen described above successfully identified eight dominant fas mutants that reduce 1O2-induced retrograde signaling and PCD in adult fc2 plants. (Figures 1B, C). However, only fc2 fas3 and fc2 fas7 block this PCD in the seedling stage (Figures 2A–C), demonstrating that most of the fas mutations are stage-specific suppressors of PCD in fc2. This complication was not specific to the fas mutations. Here, we also demonstrated that some fts mutations also had a stage-specific effect: Class III mutants, which affect plastid gene expression and were isolated for their ability to suppress PCD in the seedlings stage, did not block PCD in the adult stage (Supplementary Figure S3A–C). 1O2 was previously shown to not accumulate in fc2 toc33 seedlings (Woodson et al., 2015). In adults, however, we observed 1O2 to accumulate (Figure 4A), suggesting TOC33 may play different signaling roles in true leaves. Other examples of stage-specific blocking of 1O2-induced PCD have been reported. In fc2 mutants, ex1 executor 2 (ex2) blocked PCD and retrograde signaling in the seedling stage, but not in the adult stage. On the other hand, oxi1 blocked PCD in the adult stage but not the seedling stage (Tano et al., 2023). The suppression of PCD by ex1 ex2 appears to be indirect (reduced tetrapyrrole and 1O2 accumulation), but it is expected that OXI1 likely plays a signaling role in fc2. The mechanisms involved in these stage-specific differences are unknown, but previous studies have suggested that chloroplast biology and development may differ between cotyledon and true leaf mesophyll cells (Albrecht et al., 2006; Albrecht et al., 2008). Nonetheless, this study provides further evidence for the existence of multiple 1O2-signaling pathways that may be activated differentially, dependent on the age of the plant. This is intriguing, as it highlights the possibility that plants have evolved specific spatiotemporal strategies to trigger 1O2-induced PCD under multiple circumstances rather than a general 1O2-induced PCD pathway.
Our results showed that fc2 fas mutants display a wide range of visual phenotypes (Figure 1A), stage-specific suppression of PCD (Figures 2A–D), variation in growth- and stress-hormone responses (Figures 5A, B, 7A, B), and physiological responses to stress (Figures 8A–E, 9A–C, 10A–D, Figures 11A, B). While the causative genes in each fc2 fas mutant have yet to be identified, these observations suggest that the activation tag influences different genes in each mutant. Identifying the causative genes should allow researchers to elucidate the molecular mechanisms by which 1O2 signals induce PCD, chloroplast turnover, and retrograde signaling.
Singlet oxygen signaling is affected in fc2 fas mutants
An analysis of bulk 1O2 levels in the fc2 fas mutants showed that most still accumulate high levels of 1O2 in cycling light conditions (Figures 4A, B). The exceptions are fc2 fas2 and, to an extent, fc2 fas4. This suggests that most of the fas mutations suppress PCD by blocking a chloroplast signal and further supports that chloroplast 1O2-initiated PCD is a genetically encoded pathway in plants. We do not yet know the causal genes in the mutants, but they seem unlikely to be involved in tetrapyrrole accumulation (like class I fts mutants) or plastid gene expression (like class III fts mutants) as they show no obvious signs of reduced chloroplast development as seedlings or adults (e.g., pale phenotypes and reduced chlorophyll accumulation). Thus, it may be expected that the fas mutations act downstream and/or outside the chloroplast. The dominant nature of these alleles further suggests a negative signaling role for affected gene products. Interestingly, except for fas4, these mutations also block most of the retrograde signal to the nucleus (Figures 3A, B), further indicating that 1O2-induced chloroplast retrograde signaling and PCD are coupled. The exact relationship between retrograde signaling and PCD is unknown in any system (Woodson, 2022), and the identification of the causative mutations in these mutants will shed light on the signaling mechanisms involved.
1O2 stress tolerance is not coupled with reduced plant growth
Plant stress tolerance can be influenced by the amount of energy available to mount a response, and plants balance these energy stores by regulating growth hormone pathways controlled by GAs, BRs, IAAs, and CKs (Huot et al., 2014; Zhang et al., 2020). None of our selected growth hormone response marker genes showed a pattern of induction or repression in stressed fc2. However, we did observe perturbation of GA-response genes in fc2 fas2 and fc2 fas7 (Figures 5A, B). These two mutants (along with fc2 fas1 and fc2 fas4) also did not reverse the impaired growth phenotype of cycling light-stressed fc2 (Figure 1D) and had smaller leaves with altered morphologies (Figure 6A). As reduced levels of GA have been documented to lead to stress tolerance (Colebrook et al., 2014), we tested if the PCD suppression is due to reduced GA levels in these fc2 fas mutants. GA3 treatments revealed that PCD suppression in fc2 fas1 is, at least partially, coupled with a reduced growth rate or a reduction in GA-signaling (Figures 6B–E). Conversely, the PCD suppression in fc2 fas2, fc2 fas4, and fc2 fas7 is not coupled with GA-signaling. Furthermore, fc2 fas2 appears to be a classic GA-sensitive dwarf mutant, as its reduced growth can also be rescued via GA3 treatment. Together, these observations suggest that a general decrease in growth is not the primary mechanism of 1O2-induced PCD suppression in the fc2 fas mutants but, under some circumstances, may be able to increase tolerance to chloroplast 1O2 levels.
1O2-induced JA and SA signaling are generally mediated in fc2 fas mutants
A large body of evidence suggests SA and JA signaling is influenced by 1O2 production (D'alessandro et al., 2020). For example, 1O2 accumulation in flu and ch1 has been shown to enhance the accumulation of SA and JA, which have been hypothesized to affect 1O2-induced PCD. In flu mutants, a biotrophic defense protein that plays a role in SA accumulation, EDS1 (ENHANCED DISEASE SUSCEPTIBILITY 1), is induced by 1O2, and PCD is suppressed in flu eds1 double mutants (Ochsenbein et al., 2006). Reducing SA levels in flu also attenuates 1O2-induced PCD (Danon et al., 2005), further implicating a role for SA signaling as a positive regulator of 1O2-induced PCD. Blocking JA signaling in flu has led to conflicting results, with some studies suggesting JA may promote (Danon et al., 2005) or block (Przybyla et al., 2008) PCD in response to 1O2 accumulation in the chloroplast. In the ch1 mutant, JA levels, but not SA levels, correlate to 1O2-induced PCD; the reduction of JA synthesis with the dde2-2 mutation blocked EL-induced lesion formation in the ch1 mutant (Ramel et al., 2013). Together, these studies show that there is likely a relationship between 1O2 and signaling by JA and SA, but it is complex.
For these reasons, we chose to investigate the role of stress hormone signaling in fc2 and fc2 fas mutants. All tested JA-response markers probed were induced in stressed fc2, and this induction was reduced to wt levels in the fc2 suppressors with only one exception (PR4 in fc2 fas4) (Figures 7A, B). A similar pattern was observed with SA marker gene expression. An interesting exception is the fc2 fas8 mutant, which had a strong induction of PR2, suggesting that it may be playing a positive role in regulating SA and/or PR2. Together, these data are compelling as SA and JA signaling have documented roles in PCD and senescence (Morris et al., 2000; Hu et al., 2017). Indeed, some SAGs (SAG13 and SAG21) are also induced in fc2, and this induction is reduced in most fc2 fts/fas mutants (Supplementary Figure S8).
Together, these observations demonstrate that JA and SA stress hormone signaling often correlates to the amount of PCD in the fc2 mutant when exposed to cycling light stress. It is unclear, however, if JA and SA induction is the cause or effect of cellular degradation pathways in fc2. Alternatively, SA and JA may be directly influenced by 1O2-induced retrograde signaling but then act in a parallel, but separate, pathway to PCD. Further studies into the role of SA and JA in fc2 will help us better understand their roles in chloroplast 1O2-induced signaling, CQC, and PCD.
Tolerance of fc2 fas mutants to chloroplast ROS, heat, freezing, and carbon-starvation stresses
Our genetic screen was designed to identify mutations that specifically alter chloroplast 1O2 stress signaling. However, we expect also to uncover mutations that led to a broad tolerance to photo-oxidative or abiotic stress and the multiple types of ROS that can be produced in and outside the chloroplast. To determine if this was the case, we tested the tolerance of fc2 fas mutations to EL and MV treatments, which leads to light-dependent 1O2 and H2O2 accumulation in the chloroplast, respectively (Hassan, 1984; Triantaphylidès et al., 2008) The responses of fc2 fas mutants to EL were complex. However, we did observe that fc2 pub4-6 and nearly all fas mutations (excepting fc2 fas3 and fc2 fas6) delay EL-induced photo-inhibition and/or PCD (Figures 8C, D). This may indicate that EL is a natural stress that mimics what occurs in fc2 mutants under cycling light conditions. However, the observation that fc2 fas3 and fc2 fas6 are not tolerant to EL suggests there are some differences we do not yet understand. In contrast to EL treatment, none of the fc2 fas mutants, except fc2 fas2, exhibited any tolerance to MV (Figures 9A–C), suggesting fas mutations do not generally offer tolerance to chloroplast O2- or H2O2. This may be expected as it does not appear that fc2 mutants produce significant levels of H2O2 as seedlings (Alamdari et al., 2020). Furthermore, it has previously been shown that chloroplast H2O2 likely induces a retrograde signal separate from 1O2 (Op Den Camp et al., 2003).
To test for general stress tolerance, we chose three forms of abiotic stress: heat, freezing, and carbon starvation. Heat stress and freezing stress primarily involve H2O2 accumulation (Devireddy et al., 2021; Sachdev et al., 2021). Darkness-induced carbon starvation also involves H2O2 accumulation and activates senescence, autophagy, and chlorophagy (Wada et al., 2009; Perez-Perez et al., 2012; Izumi and Nakamura, 2017). When these additional stresses were tested, we observed that most fc2 fts/fas mutants behaved like wt and fc2, but a few interesting exceptions were noted (Supplementary Table S9). The fc2 pub4-6 mutant was tolerant to heat stress, while fc2 toc33 and fc2 fas1 were observed to be sensitive to heat (Figures 10A, B). The fc2 fas7 mutant was also tolerant to carbon starvation and exhibited a “stay-green” phenotype (Figures 11A, B). Interestingly, fc2 fas2 was tolerant to all tested stresses, making it distinct among all eight mutants.
Thus, there appears to be little cross-tolerance between chloroplast 1O2 and other abiotic stresses. This conclusion agrees with a transcriptomic data meta-analysis comparing different transcriptional responses to abiotic responses that produce ROS in cells (Rosenwasser et al., 2013). There, it was concluded that chloroplast 1O2 produces a unique transcriptional signature, suggesting that it may initiate a distinct signal. As such, the lack of multi-stress cross-tolerance observed in most fc2 fts/fas mutants may be expected, as chloroplast 1O2 accumulation is unlikely to produce the same transcriptional response as chloroplast or cytosolic H2O2 produced during the other stresses we tested. Furthermore, this suggests that this screen was able to identify mutant alleles that specifically affect chloroplast 1O2 signaling and/or tolerance.
The fc2 fas2 mutant is broadly stress tolerant
Together, these observations show that most fc2 fas mutants were specifically altered in their response to chloroplast 1O2 stress. However, fc2 fas2 was an intriguing exception. This mutant also exhibited tolerance to EL, MV, heat, freezing, and carbon starvation stresses (Figures 8A–E, 9A–C, 10A–D, 11A, B). The reduced accumulation of 1O2 in fc2 fas2 suggests it is not a true signaling mutant. However, it accumulates normal levels of chlorophyll, indicating that it likely retains normal tetrapyrrole synthesis and should be able to produce 1O2 under cycling light conditions (Woodson et al., 2015). Thus, fas2 may be affecting the quenching of ROS via excess scavengers or by another form of photoprotection.
However, as the fc2 fas2 mutant exhibits tolerance to non-1O2-producing stresses, it suggests that the general stress tolerance achieved does not explicitly involve chloroplast 1O2 or 1O2-signaling. fc2 fas2 is a GA-sensitive dwarf mutant (Figure 6C), and a reduction in GA signaling and growth can convey general stress tolerance (Colebrook et al., 2014). However, GA-signaling was pharmacologically uncoupled from the PCD suppression observed in fc2 fas2 (Figures 6B, D, E), suggesting that fc2 fas2 may be using additional mechanisms to increase its stress tolerance.
The tolerance to extreme freezing conditions (-20°C) was striking, particularly as fc2 fas2 tolerates -20°C for an hour without cold priming (Figures 10C, D). The induction of the cold acclimation and ABA-response genes COR15a and COR27 in fc2 fas2 may offer a clue (Figures 7A, B). These observations suggest that fc2 fas2 may be constitutively primed to tolerate freezing stress, possibly by increasing the expression of genes involved in such stresses. It will be interesting to test if such mechanisms can confer general stress tolerance in plants and if 1O2 stress can offer cross-protection to other types of abiotic stresses.
Conclusions
Here, we report the initial characterization of eight new gain-of-function dominant fas mutants that revealed informative lessons about chloroplast 1O2 signaling in the fc2 mutant. First, the ability of fas mutations to block 1O2-initiated PCD is stage-specific and points to the possibility that plants can employ different 1O2 response strategies, depending on the age of the plant. Second, most fas mutations do not lead to broad tolerance to ROS or abiotic stress, indicating that they specifically affect 1O2 signaling to control PCD and retrograde signaling. This further supports the hypothesis that chloroplast 1O2 stress induces a unique signal with limited crosstalk with other known stress signaling pathways. Finally, our results implicate SA and JA signaling in the chloroplast 1O2 response in fc2 mutants, further connecting these two hormones as important players in chloroplast-mediated PCD and retrograde signaling. Further studies characterizing these mutants will undoubtedly clarify these points and provide a deeper understanding of the molecular mechanisms behind these signals.
Data availability statement
The original contributions presented in the study are included in the article/Supplementary Material. Further inquiries can be directed to the corresponding author.
Author contributions
ML: Data curation, Formal analysis, Investigation, Methodology, Validation, Writing – original draft, Writing – review & editing. JW: Data curation, Formal analysis, Investigation, Methodology, Validation, Writing – original draft, Writing – review & editing, Conceptualization, Funding acquisition, Project administration, Supervision, Visualization.
Funding
The author(s) declare financial support was received for the research, authorship, and/or publication of this article. The authors acknowledge the Division of Chemical Sciences, Geosciences, and Biosciences, Office of Basic Energy Sciences of the U.S. Department of Energy grant DE-SC0019573 awarded to JW and support from the Center for Research on Programmable Plants and the National Science Foundation grant DBI-2019674. ML was supported by the NIH T32 GM136536 training grant and the UA Richard A. Harvill Graduate Fellowship. The funding bodies played no role in the design of the study and collection, analysis, and interpretation of data and in writing the manuscript.
Acknowledgments
This work is dedicated in memory of Susan Rhodes Matijasevic, whose encouragement and advice to ML throughout his life and academic career helped make this work possible. The authors also wish to thank Marta Kozlowzka and Rebeca Acevedo Barboza (U of A) for technical support with crosses, Kamran Alamdari, Emma Gevelhoff, and Sophia Daluisio (U of A) for technical assistance with plant maintenance, and Dr. Samantha Orchard (U of A) for the use of lab space. Fluorescence microscopy was performed within the University of Arizona Imaging Cores - Optical Core Facility (RRID : SCR_023355). A similar version of this manuscript (Lemke and Woodson, 2023) was deposited as a preprint on the bioRxiv server on October 29, 2023: https://biorxiv.org/cgi/content/short/2023.10.26.564295v1.
Conflict of interest
The authors declare that the research was conducted in the absence of any commercial or financial relationships that could be construed as a potential conflict of interest.
Publisher’s note
All claims expressed in this article are solely those of the authors and do not necessarily represent those of their affiliated organizations, or those of the publisher, the editors and the reviewers. Any product that may be evaluated in this article, or claim that may be made by its manufacturer, is not guaranteed or endorsed by the publisher.
Supplementary material
The Supplementary Material for this article can be found online at: https://www.frontiersin.org/articles/10.3389/fpls.2023.1331346/full#supplementary-material
References
Alamdari, K., Fisher, K. E., Sinson, A. B., Chory, J., Woodson, J. D. (2020). Roles for the chloroplast-localized PPR Protein 30 and the "Mitochondrial" Transcription Termination Factor 9 in chloroplast quality control. Plant J. 103, 735–751. doi: 10.1111/tpj.14963
Alamdari, K., Fisher, K. E., Tano, D. W., Rai, S., Palos, K. R., Nelson, A. D. L., et al. (2021). Chloroplast quality control pathways are dependent on plastid DNA synthesis and nucleotides provided by cytidine triphosphate synthase two. New Phytol. 231, 1431–1448. doi: 10.1111/nph.17467
Albrecht, V., Ingenfeld, A., Apel, K. (2006). Characterization of the snowy cotyledon 1 mutant of Arabidopsis thaliana: the impact of chloroplast elongation factor G on chloroplast development and plant vitality. Plant Mol. Biol. 60, 507–518. doi: 10.1007/s11103-005-4921-0
Albrecht, V., Ingenfeld, A., Apel, K. (2008). Snowy cotyledon 2: the identification of a zinc finger domain protein essential for chloroplast development in cotyledons but not in true leaves. Plant Mol. Biol. 66, 599–608. doi: 10.1007/s11103-008-9291-y
Babicki, S., Arndt, D., Marcu, A., Liang, Y., Grant, J. R., Maciejewski, A., et al. (2016). Heatmapper: web-enabled heat mapping for all. Nucleic Acids Res. 44, W147–W153. doi: 10.1093/nar/gkw419
Barkan, A., Small, I. (2014). Pentatricopeptide repeat proteins in plants. Annu. Rev. Plant Biol. 65, 415–442. doi: 10.1146/annurev-arplant-050213-040159
Baruah, A., Šimková, K., Hincha, D. K., Apel, K., Laloi, C. (2009). Modulation of 1O2-mediated retrograde signaling by the PLEIOTROPIC RESPONSE LOCUS 1 (PRL1) protein, a central integrator of stress and energy signaling. Plant J. 60, 22–32. doi: 10.1111/j.1365-313X.2009.03935.x
Bellin, L., Scherer, V., Dörfer, E., Lau, A., Vicente, A. M., Meurer, J., et al. (2021). Cytosolic CTP production limits the establishment of photosynthesis in arabidopsis. Front. Plant Sci. 12. doi: 10.3389/fpls.2021.789189
Benfey, P. N., Ren, L., Chua, N. H. (1990). Tissue-specific expression from CaMV 35S enhancer subdomains in early stages of plant development. EMBO J. 9, 1677–1684. doi: 10.1002/j.1460-2075.1990.tb08291.x
Chan, K. X., Phua, S. Y., Crisp, P., Mcquinn, R., Pogson, B. J. (2016). Learning the languages of the chloroplast: retrograde signaling and beyond. Annu. Rev. Plant Biol. 67, 25–53. doi: 10.1146/annurev-arplant-043015-111854
Clough, S. J., Bent, A. F. (1998). Floral dip: a simplified method for Agrobacterium-mediated transformation of Arabidopsis thaliana. Plant J. 16, 735–743. doi: 10.1046/j.1365-313x.1998.00343.x
Colebrook, E. H., Thomas, S. G., Phillips, A. L., Hedden, P. (2014). The role of gibberellin signalling in plant responses to abiotic stress. J. Exp. Biol. 217, 67–75. doi: 10.1242/jeb.089938
Cruz De Carvalho, M. H. (2008). Drought stress and reactive oxygen species: Production, scavenging and signaling. Plant Signal Behav. 3, 156–165. doi: 10.4161/psb.3.3.5536
D'agostino, I. B., Deruere, J., Kieber, J. J. (2000). Characterization of the response of the Arabidopsis response regulator gene family to cytokinin. Plant Physiol. 124, 1706–1717. doi: 10.1104/pp.124.4.1706
D'alessandro, S., Beaugelin, I., Havaux, M. (2020). Tanned or sunburned: how excessive light triggers plant cell death. Mol. Plant 13, 1545–1555. doi: 10.1016/j.molp.2020.09.023
Danon, A., Miersch, O., Felix, G., Camp, R. G., Apel, K. (2005). Concurrent activation of cell death-regulating signaling pathways by singlet oxygen in Arabidopsis thaliana. Plant J. 41, 68–80. doi: 10.1111/j.1365-313X.2004.02276.x
Desaki, Y., Takahashi, S., Sato, K., Maeda, K., Matsui, S., Yoshimi, I., et al. (2019). PUB4, a CERK1-interacting ubiquitin ligase, positively regulates MAMP-triggered immunity in arabidopsis. Plant Cell Physiol. 60, 2573–2583. doi: 10.1093/pcp/pcz151
De Souza, A., Wang, J. Z., Dehesh, K. (2017). Retrograde signals: integrators of interorganellar communication and orchestrators of plant development. Annu. Rev. Plant Biol. 68, 85–108. doi: 10.1146/annurev-arplant-042916-041007
De Torres-Zabala, M., Truman, W., Bennett, M. H., Lafforgue, G., Mansfield, J. W., Rodriguez Egea, P., et al. (2007). Pseudomonas syringae pv. tomato hijacks the Arabidopsis abscisic acid signalling pathway to cause disease. EMBO J. 26, 1434–1443. doi: 10.1038/sj.emboj.7601575
Devireddy, A. R., Tschaplinski, T. J., Tuskan, G. A., Muchero, W., Chen, J. G. (2021). Role of reactive oxygen species and hormones in plant responses to temperature changes. Int. J. Mol. Sci. 22, 8843. doi: 10.3390/ijms22168843
Dogra, V., Duan, J., Lee, K. P., Lv, S., Liu, R., Kim, C. (2017). FtsH2-dependent proteolysis of EXECUTER1 is essential in mediating singlet oxygen-triggered retrograde signaling in arabidopsis thaliana. Front. Plant Sci. 8, 1145. doi: 10.3389/fpls.2017.01145
Dogra, V., Kim, C. (2019). Singlet oxygen metabolism: from genesis to signaling. Front. Plant Sci. 10, 1640. doi: 10.3389/fpls.2019.01640
Duez, P., Hanocq, M., Dubois, J. (2001). Photodynamic DNA damage mediated by delta-aminolevulinic acid-induced porphyrins. Carcinogenesis 22, 771–778. doi: 10.1093/carcin/22.5.771
Fisher, K. E., Krishnamoorthy, P., Joens, M. S., Chory, J., Fitzpatrick, J. A. J., Woodson, J. D. (2022). Singlet Oxygen Leads to Structural Changes to Chloroplasts During their Degradation in the Arabidopsis thaliana plastid ferrochelatase two Mutant. Plant Cell Physiol. 63, 248–264. doi: 10.1093/pcp/pcab167
Foyer, C. H. (2018). Reactive oxygen species, oxidative signaling and the regulation of photosynthesis. Environ. Exp. Bot. 154, 134–142. doi: 10.1016/j.envexpbot.2018.05.003
Gorman, A. A., Rodgers, M. A. (1992). Current perspectives of singlet oxygen detection in biological environments. J. Photochem. Photobiol. B, 14, 159–176. doi: 10.1016/1011-1344(92)85095-c
Guo, H., Ye, H., Li, L., Yin, Y. (2009). A family of receptor-like kinases are regulated by BES1 and involved in plant growth in Arabidopsis thaliana. Plant Signal Behav. 4, 784–786. doi: 10.4161/psb.4.8.9231
Gururani, M. A., Venkatesh, J., Tran, L. S. (2015). Regulation of photosynthesis during abiotic stress-induced photoinhibition. Mol. Plant 8, 1304–1320. doi: 10.1016/j.molp.2015.05.005
Hassan, H. M. (1984). Exacerbation of superoxide radical formation by paraquat. Methods Enzymol. 105, 523–532. doi: 10.1016/S0076-6879(84)05072-2
Hassan, H. M. (1988). Biosynthesis and regulation of superoxide dismutases. Free Radic. Biol. Med. 5, 377–385. doi: 10.1016/0891-5849(88)90111-6
He, Y., Fukushige, H., Hildebrand, D. F., Gan, S. (2002). Evidence supporting a role of jasmonic acid in Arabidopsis leaf senescence. Plant Physiol. 128, 876–884. doi: 10.1104/pp.010843
Healey, A., Furtado, A., Cooper, T., Henry, R. J. (2014). Protocol: A simple method for extracting next-generation sequencing quality genomic DNA from recalcitrant plant species. Plant Methods 10, 21. doi: 10.1186/1746-4811-10-21
Herzog, M., Dorne, A. M., Grellet, F. (1995). GASA, a gibberellin-regulated gene family from Arabidopsis thaliana related to the tomato GAST1 gene. Plant Mol. Biol. 27, 743–752. doi: 10.1007/BF00020227
Hoth, S., Morgante, M., Sanchez, J. P., Hanafey, M. K., Tingey, S. V., Chua, N. H. (2002). Genome-wide gene expression profiling in Arabidopsis thaliana reveals new targets of abscisic acid and largely impaired gene regulation in the abi1-1 mutant. J. Cell Sci. 115, 4891–4900. doi: 10.1242/jcs.00175
Hu, Y., Jiang, Y., Han, X., Wang, H., Pan, J., Yu, D. (2017). Jasmonate regulates leaf senescence and tolerance to cold stress: crosstalk with other phytohormones. J. Exp. Bot. 68, 1361–1369. doi: 10.1093/jxb/erx004
Hundertmark, M., Hincha, D. K. (2008). LEA (late embryogenesis abundant) proteins and their encoding genes in Arabidopsis thaliana. BMC Genomics 9, 118. doi: 10.1186/1471-2164-9-118
Huot, B., Yao, J., Montgomery, B. L., He, S. Y. (2014). Growth-defense tradeoffs in plants: a balancing act to optimize fitness. Mol. Plant 7, 1267–1287. doi: 10.1093/mp/ssu049
Igielski, R., Kepczynska, E. (2017). Gene expression and metabolite profiling of gibberellin biosynthesis during induction of somatic embryogenesis in Medicago truncatula Gaertn. PloS One 12, e0182055. doi: 10.1371/journal.pone.0182055
Izumi, M., Nakamura, S. (2017). Vacuolar digestion of entire damaged chloroplasts in Arabidopsis thaliana is accomplished by chlorophagy. Autophagy 13, 1239–1240. doi: 10.1080/15548627.2017.1310360
Jeran, N., Rotasperti, L., Frabetti, G., Calabritto, A., Pesaresi, P., Tadini, L. (2021). The PUB4 E3 ubiquitin ligase is responsible for the variegated phenotype observed upon alteration of chloroplast protein homeostasis in arabidopsis cotyledons. Genes (Basel) 12, 1387. doi: 10.3390/genes12091387
Kleinboelting, N., Huep, G., Kloetgen, A., Viehoever, P., Weisshaar, B. (2012). GABI-Kat SimpleSearch: new features of the Arabidopsis thaliana T-DNA mutant database. Nucleic Acids Res. 40, D1211–D1215. doi: 10.1093/nar/gkr1047
Kopecka, R., Kameniarova, M., Cerny, M., Brzobohaty, B., Novak, J. (2023). Abiotic stress in crop production. Int. J. Mol. Sci. 24, 6603. doi: 10.3390/ijms24076603
Krieger-Liszkay, A., Kos, P. B., Hideg, E. (2011). Superoxide anion radicals generated by methylviologen in photosystem I damage photosystem II. Physiol. Plant 142, 17–25. doi: 10.1111/j.1399-3054.2010.01416.x
Laloi, C., Havaux, M. (2015). Key players of singlet oxygen-induced cell death in plants. Front. Plant Sci. 6. doi: 10.3389/fpls.2015.00039
Laloi, C., Stachowiak, M., Pers-Kamczyc, E., Warzych, E., Murgia, I., Apel, K. (2007). Cross-talk between singlet oxygen- and hydrogen peroxide-dependent signaling of stress responses in Arabidopsis thaliana. Proc. Natl. Acad. Sci. U.S.A. 104, 672–677. doi: 10.1073/pnas.0609063103
Lemke, M. D., Fisher, K. E., Kozlowska, M. A., Tano, D. W., Woodson, J. D. (2021). The core autophagy machinery is not required for chloroplast singlet oxygen-mediated cell death in the Arabidopsis thaliana plastid ferrochelatase two mutant. BMC Plant Biol. 21, 342. doi: 10.1186/s12870-021-03119-x
Lemke, M. D., Woodson, J. D. (2022). Targeted for destruction: degradation of singlet oxygen-damaged chloroplasts. Plant Signal Behav. 17, 2084955. doi: 10.1080/15592324.2022.2084955
Lemke, M. D., Woodson, J. D. (2023). A genetic screen for dominant chloroplast reactive oxygen species signaling mutants reveals life stage-specific singlet oxygen-signaling networks. bioRxiv. doi: 10.1101/2023.10.26.564295
Meskauskiene, R., Nater, M., Goslings, D., Kessler, F., Op Den Camp, R., Apel, K. (2001). FLU: A negative regulator of chlorophyll biosynthesis in arabidopsis thaliana. Proc. Natl. Acad. Sci. United States America 98, 12826-31. doi: 10.1073/pnas.221252798
Morris, K., Mackerness, S. A., Page, T., John, C. F., Murphy, A. M., Carr, J. P., et al. (2000). Salicylic acid has a role in regulating gene expression during leaf senescence. Plant J. 23, 677–685. doi: 10.1046/j.1365-313x.2000.00836.x
Muller, M., Munne-Bosch, S. (2015). Ethylene response factors: A key regulatory hub in hormone and stress signaling. Plant Physiol. 169, 32–41. doi: 10.1104/pp.15.00677
Niu, F., Cui, X., Zhao, P., Sun, M., Yang, B., Deyholos, M. K., et al. (2020). WRKY42 transcription factor positively regulates leaf senescence through modulating SA and ROS synthesis in Arabidopsis thaliana. Plant J. 104, 171–184. doi: 10.1111/tpj.14914
Ochsenbein, C., Przybyla, D., Danon, A., Landgraf, F., Göbel, C., Imboden, A., et al. (2006). The role of EDS1 (enhanced disease susceptibility) during singlet oxygen-mediated stress responses of Arabidopsis. Plant J. 47, 445–456. doi: 10.1111/j.1365-313X.2006.02793.x
Ogilby, P. R. (2010). Singlet oxygen: There is indeed something new under the sun. Chem. Soc. Rev. 39, 3181–3209. doi: 10.1039/b926014p
Op Den Camp, R. G., Przybyla, D., Ochsenbein, C., Laloi, C., Kim, C., Danon, A., et al. (2003). Rapid induction of distinct stress responses after the release of singlet oxygen in Arabidopsis. Plant Cell 15, 2320–2332. doi: 10.1105/tpc.014662
Paponov, I. A., Paponov, M., Teale, W., Menges, M., Chakrabortee, S., Murray, J. A., et al. (2008). Comprehensive transcriptome analysis of auxin responses in Arabidopsis. Mol. Plant 1, 321–337. doi: 10.1093/mp/ssm021
Perez-Perez, M. E., Lemaire, S. D., Crespo, J. L. (2012). Reactive oxygen species and autophagy in plants and algae. Plant Physiol. 160, 156–164. doi: 10.1104/pp.112.199992
Przybyla, D., Gobel, C., Imboden, A., Hamberg, M., Feussner, I., Apel, K. (2008). Enzymatic, but not non-enzymatic, 1O2-mediated peroxidation of polyunsaturated fatty acids forms part of the EXECUTER1-dependent stress response program in the flu mutant of Arabidopsis thaliana. Plant J. Cell Mol. Biol. 54, 236–248. doi: 10.1111/j.1365-313X.2008.03409.x
Ramel, F., Ksas, B., Akkari, E., Mialoundama, A. S., Monnet, F., Krieger-Liszkay, A., et al. (2013). Light-induced acclimation of the Arabidopsis chlorina1 mutant to singlet oxygen. Plant Cell 25, 1445–62. doi: 10.1105/tpc.113.109827
Ribeiro, D. M., Araujo, W. L., Fernie, A. R., Schippers, J. H., Mueller-Roeber, B. (2012). Action of gibberellins on growth and metabolism of Arabidopsis plants associated with high concentration of carbon dioxide. Plant Physiol. 160, 1781–1794. doi: 10.1104/pp.112.204842
Rosenwasser, S., Fluhr, R., Joshi, J. R., Leviatan, N., Sela, N., Hetzroni, A., et al. (2013). ROSMETER: A bioinformatic tool for the identification of transcriptomic imprints related to reactive oxygen species type and origin provides new insights into stress responses. Plant Physiol. 163, 1071–1083. doi: 10.1104/pp.113.218206
Ruban, A. V. (2016). Nonphotochemical chlorophyll fluorescence quenching: mechanism and effectiveness in protecting plants from photodamage. Plant Physiol. 170, 1903–1916. doi: 10.1104/pp.15.01935
Sachdev, S., Ansari, S. A., Ansari, M. I., Fujita, M., Hasanuzzaman, M. (2021). Abiotic stress and reactive oxygen species: generation, signaling, and defense mechanisms. Antioxidants (Basel) 10, 227. doi: 10.3390/antiox10020277
Scharfenberg, M., Mittermayr, L., Von Roepenack-Lahaye, E., Schlicke, H., Grimm, B., Leister, D., et al. (2015). Functional characterization of the two ferrochelatases in Arabidopsis thaliana. Plant Cell Environ. 38, 280–298. doi: 10.1111/pce.12248
Schmitz, G., Reinhold, T., Gobel, C., Feussner, I., Neuhaus, H. E., Conrath, U. (2010). Limitation of nocturnal ATP import into chloroplasts seems to affect hormonal crosstalk, prime defense, and enhance disease resistance in Arabidopsis thaliana. Mol. Plant Microbe Interact. 23, 1584–1591. doi: 10.1094/MPMI-02-10-0045
Sessions, A., Burke, E., Presting, G., Aux, G., Mcelver, J., Patton, D., et al. (2002). A high-throughput Arabidopsis reverse genetics system. Plant Cell 14, 2985–2994. doi: 10.1105/tpc.004630
Shumbe, L., Chevalier, A., Legeret, B., Taconnat, L., Monnet, F., Havaux, M. (2016). Singlet oxygen-induced cell death in arabidopsis under high-light stress is controlled by OXI1 kinase. Plant Physiol. 170, 1757–1771. doi: 10.1104/pp.15.01546
Tano, D. W., Kozlowska, M. A., Easter, R. A., Woodson, J. D. (2023). Multiple pathways mediate chloroplast singlet oxygen stress signaling. 111, 167–87. Plant Mol. Biol. doi: 10.1007/s11103-022-01319-z
Thompson, A. R., Doelling, J. H., Suttangkakul, A., Vierstra, R. D. (2005). Autophagic nutrient recycling in Arabidopsis directed by the ATG8 and ATG12 conjugation pathways. Plant Physiol. 138, 2097–2110. doi: 10.1104/pp.105.060673
Triantaphylidès, C., Havaux, M. (2009). Singlet oxygen in plants: production, detoxification and signaling. Trends Plant Sci. 14, 219–228. doi: 10.1016/j.tplants.2009.01.008
Triantaphylidès, C., Krischke, M., Hoeberichts, F. A., Ksas, B., Gresser, G., Havaux, M., et al. (2008). Singlet oxygen is the major reactive oxygen species involved in photooxidative damage to plants. Plant Physiol. 148, 960–968. doi: 10.1104/pp.108.125690
Untergasser, A., Cutcutache, I., Koressaar, T., Ye, J., Faircloth, B. C., Remm, M., et al. (2012). Primer3–new capabilities and interfaces. Nucleic Acids Res. 40, e115. doi: 10.1093/nar/gks596
Valenzuela, C. E., Acevedo-Acevedo, O., Miranda, G. S., Vergara-Barros, P., Holuigue, L., Figueroa, C. R., et al. (2016). Salt stress response triggers activation of the jasmonate signaling pathway leading to inhibition of cell elongation in Arabidopsis primary root. J. Exp. Bot. 67, 4209–4220. doi: 10.1093/jxb/erw202
Van Doorn, W. G., Woltering, E. J. (2004). Senescence and programmed cell death: substance or semantics? J. Exp. Bot. 55, 2147–2153. doi: 10.1093/jxb/erh264
Vass, I., Styring, S., Hundal, T., Koivuniemi, A., Aro, E., Andersson, B. (1992). Reversible and irreversible intermediates during photoinhibition of photosystem II: stable reduced QA species promote chlorophyll triplet formation. Proc. Natl. Acad. Sci. U.S.A. 89, 1408–1412. doi: 10.1073/pnas.89.4.1408
Wada, S., Ishida, H., Izumi, M., Yoshimoto, K., Ohsumi, Y., Mae, T., et al. (2009). Autophagy plays a role in chloroplast degradation during senescence in individually darkened leaves. Plant Physiol. 149, 885–893. doi: 10.1104/pp.108.130013
Wagner, D., Przybyla, D., Op Den Camp, R., Kim, C., Landgraf, F., Keun, P. L., et al. (2004). The genetic basis of singlet oxygen-induced stress response of Arabidopsis thaliana. Science 306, 1183–1185. doi: 10.1126/science.1103178
Wang, Y., Wu, Y., Yu, B., Yin, Z., Xia, Y. (2017). EXTRA-LARGE G PROTEINs interact with E3 ligases PUB4 and PUB2 and function in cytokinin and developmental processes. Plant Physiol. 173, 1235–1246. doi: 10.1104/pp.16.00816
Wang, Y., Wu, Y., Zhong, H., Chen, S., Wong, K. B., Xia, Y. (2022). Arabidopsis pub2 and pub4 connect signaling components of pattern-triggered immunity. New Phytol. 233, 2249–2265. doi: 10.1111/nph.17922
Weigel, D., Ahn, J. H., Blázquez, M. A., Borevitz, J. O., Christensen, S. K., Fankhauser, C., et al. (2000). Activation tagging in arabidopsis. 122, 1003–13. Plant Physiol. doi: 10.1104/pp.122.4.1003
Wobbe, L. (2021). The molecular function of plant mTERFs as key regulators of organellar gene expression. Plant Cell Physiol. 61, 2004–2017. doi: 10.1093/pcp/pcaa132
Woodson, J. D. (2022). Control of chloroplast degradation and cell death in response to stress. Trends Biochem. Sci. 47, 851–64. doi: 10.1016/j.tibs.2022.03.010
Woodson, J. D., Joens, M. S., Sinson, A. B., Gilkerson, J., Salomé, P. A., Weigel, D., et al. (2015). Ubiquitin facilitates a quality-control pathway that removes damaged chloroplasts. Science 350, 450–454. doi: 10.1126/science.aac7444
Woodson, J. D., Perez-Ruiz, J. M., Chory, J. (2011). Heme synthesis by plastid ferrochelatase I regulates nuclear gene expression in plants. Curr. Biol. 21, 897–903. doi: 10.1016/j.cub.2011.04.004
You, J., Chan, Z. (2015). ROS regulation during abiotic stress responses in crop plants. Front. Plant Sci. 6, 1092. doi: 10.3389/fpls.2015.01092
Yu, Y., Qi, Y., Xu, J., Dai, X., Chen, J., Dong, C. H., et al. (2021). Arabidopsis WRKY71 regulates ethylene-mediated leaf senescence by directly activating EIN2, ORE1 and ACS2 genes. Plant J. 107, 1819–1836. doi: 10.1111/tpj.15433
Keywords: abiotic stress, Arabidopsis thaliana, chloroplast, Jasmonic acid, programmed cell death, reactive oxygen species, salicylic acid, singlet oxygen
Citation: Lemke MD and Woodson JD (2024) A genetic screen for dominant chloroplast reactive oxygen species signaling mutants reveals life stage-specific singlet oxygen signaling networks. Front. Plant Sci. 14:1331346. doi: 10.3389/fpls.2023.1331346
Received: 31 October 2023; Accepted: 18 December 2023;
Published: 10 January 2024.
Edited by:
Thorsten Seidel, Bielefeld University, GermanyReviewed by:
Yan Lu, Western Michigan University, United StatesPatrick Treffon, University of Massachusetts Amherst, United States
Copyright © 2024 Lemke and Woodson. This is an open-access article distributed under the terms of the Creative Commons Attribution License (CC BY). The use, distribution or reproduction in other forums is permitted, provided the original author(s) and the copyright owner(s) are credited and that the original publication in this journal is cited, in accordance with accepted academic practice. No use, distribution or reproduction is permitted which does not comply with these terms.
*Correspondence: Jesse D. Woodson, amVzc2V3b29kc29uQGFyaXpvbmEuZWR1