 Lidia Cano Pecharroman
 Melissa Oberon Tier
 Elke U. Weber2
- 1The University of Texas at Austin School of Architecture, Austin, TX, United States
- 2School of Public and International Affairs, Princeton University, Princeton, NJ, United States
Efforts are needed to better identify and measure both communities’ exposure to climate hazards and the social vulnerabilities that interact with these hazards, but the science of validating climate risk indicators is still in its infancy. Progress is needed to improve: (1) the selection of variables that are used as proxies to represent hazard exposure and vulnerability; (2) the applicability and scale for which these indicators are intended, including their suitability for transnational comparisons. We draw on an international urban survey in Buenos Aires, Argentina; Johannesburg, South Africa; London, United Kingdom; New York City, United States; and Seoul, South Korea that collected data on: exposure to various types of extreme weather events, socioeconomic characteristics commonly used as proxies for vulnerability (i.e., income, education level, gender, and age), and additional characteristics not often included in existing composite indices (i.e., Queer identity, disability identity, non-dominant primary language, and self-perceptions of both discrimination and vulnerability to climate hazard risk). We use feature importance analysis with gradient-boosted decision trees to measure the importance that these variables have in predicting exposure to various types of extreme weather events. Our results show that non-traditional variables were more relevant to self-reported exposure to extreme weather events than traditionally employed variables such as income or age. Furthermore, differences in variable relevance across different types of hazards and across urban contexts suggest that vulnerability indicators need to be fit to context and should not be used in a one-size-fits-all fashion.
1 Introduction
As this special issue demonstrates, there is a growing interest among policymakers, community members, and academics in designing and documenting best practices for environmentally-just climate adaptation and resilience policies, including planned relocation. Concern over the need for proactive, equity-based planning of such efforts is justifiably escalating in the face of existential climate crises. Moreover, evidence suggests that policymakers tend to default to status quo policies and decision-making – because of their own cognitive biases (Roberts and Wernstedt, 2019; Gifford, 2011), political pressures they face (Mayhew, 2008), and policy entrenchment (Wiering et al., 2018); the status quo, in turn, is likely to preserve historical inequities and injustices (Foster et al., 2024). In particular, community-driven and co-produced planning and research is needed in order to overcome perpetuated social vulnerability and to strive toward transformational climate policies (Foster et al., 2024; Morris et al., 2024; Ajibade et al., 2022).
To this end, there is a need to better incorporate vulnerability indicators into climate adaptation policy planning. A requisite first step is understanding that climate risk – that is, the “potential for adverse consequences” (p. 5) stemming from climate change – is a function of hazard events and both exposure and vulnerability (IPCC, 2022).1 Conversely, resilience is defined as “not just the ability to maintain essential function, identity and structure, but also the capacity for transformation” (p. 7). Policymakers and researchers therefore need to better understand who is vulnerable to increasing climate hazards – as well as who benefits from climate policies and why inequalities in both of these domains persist (Wilson et al., 2021). The above definitions from the IPCC are a starting point, but recent research finds that key concepts like “vulnerability” and “equity” in flood-risk management are currently operationalized in myriad ways (e.g., as outcomes like “funding” or “benefits”; as units of aggregation like “individuals” and “neighborhoods”; as justifications like “reflecting societal values” or “interpreting a policy mandate”; and more) (Pollack et al., 2024) – and also differ depending on whether multiple types of (aggregate, cascading, or compound) hazards are considered (Drakes and Tate, 2022). Additionally, salient components likely vary location to location, and country to country (Rufat et al., 2019).
All of these variations of risk clearly play an important role when designing climate adaptation interventions – such as with regard to managed retreat/planned relocation, where policymakers have to make value-laden distributional and procedural justice decisions about program design and participants’ eligibility (Siders, 2022). Seeteram et al. (2023), for example, offer a two-by-two framework for climate mobility in which: (1) low exposure to sea level rise and low social vulnerability are characteristic of stable neighborhoods; (2) high exposure to sea level rise and low social vulnerability are characteristic of migrating neighborhoods; (3) low exposure to sea level rise and high social vulnerability are characteristic of displaced neighborhoods; and (4) high exposure to sea level rise and high social vulnerability are characteristic of trapped neighborhoods. The authors then use this framework to analyze a set of 13 social vulnerability indicators in one U.S. county, finding that “as [sea level rise] increases, the municipalities with the largest percentages of Trapped residents are home to high proportions of Black and Hispanic residents…as well as those residents who have fewer assets” (p. 12).
But the science of validating exposure and vulnerability indicators – let alone translating them into policy approaches – remains in its infancy (NASEM, 2024). A recent National Academies report (NASEM, 2024) distinguishes disproportionate exposure to environmental hazard from other forms of social vulnerability caused by “combinations of political, economic, social, and institutional processes” (p. 25) that also interact with environmental hazard outcomes – as well as from cumulative impacts of exposure. There are many methods for measuring these hazard exposures, cumulative impacts of exposure, and other relevant social vulnerabilities. Such indicators (e.g., the widely used Social Vulnerability Index) as well as composite sets of indicators (e.g., the White House Council on Environmental Quality’s Climate and Economic Justice Screening Tool2 or the Environmental Defense Fund’s U. S. Climate Vulnerability Index3) can then be used as tools to advance our understanding of patterns of injustice and to determine community eligibility for government resources (NASEM, 2024; Lewis et al., 2023). Given their potential policy impacts, these tools should be scrutinized and used with caution.
The NASEM report also stresses the importance of community engagement in the design of composite indicators, which inherently involves subjective decision-making processes. In addition to community-led or co-produced processes, social science research methods can help to elicit community input on vulnerability indicators, such as via online surveys, in-person interviews, and focus groups (Small and Calarco, 2022; Groves et al., 2009). Incorporating community input can also help to identify location-specific vulnerability profiles and avoid one-size-fits-all policy approaches. Existing tools do not meet this need. For example, the Climate and Economic Justice Screening Tool (CEJST) notably does not include race or ethnicity, age, disability, or other demographic characteristics that have frequently been associated with differential outcomes to climate risk and a profusion of other environmental injustices (see Bolin and Kurtz (2018), Sultana (2021) and Wilson et al. (2021) for several helpful overviews); and neither CEJST nor the Climate Vulnerability Index (CVI) incorporate community input on the selection of vulnerability indicators.4
Furthermore, CEJST is a binary screening tool; that is, census tracts are recognized as “disadvantaged” if they meet the threshold for at least one of eight categories of burden (climate change, energy, health, housing, legacy pollution, transportation, water and wastewater, workforce development) or if they are located within the border of a Federally Recognized Tribe or Alaska Native Village. By contrast, CVI – which was created by the Environmental Defense Fund in partnership with researchers at Texas A&M University and Darkhorse Analytics – includes four types of social vulnerabilities (health, social and economic, infrastructure, and environment) and three types of risks exacerbated by climate change (extreme events, social and economic, and health), each with their own set of holistic sub-categories. Census tracts are then assigned a “national vulnerability percentile” by aggregating data across indicators. Although CVI incorporates a much wider range of social vulnerability categories and more climate hazard types than does CEJST, it still only creates one vulnerability profile for any census tract no matter which risks that community faces. As Tate et al. (2025) point out, the common practice of aggregating vulnerability indicators into just one score can result in surprising obfuscations of key vulnerabilities. Instead, they recommend creating multiple vulnerability profiles for a given location by conducting cluster analyses with a set of vulnerability indicators.
In response to these gaps and recommendations, this paper contributes to the crafting and validation of climate hazard vulnerability indicators that can be employed in policy decision making. In particular, it fills two knowledge gaps by: (1) considering the relevance of indicators that have not been traditionally included in composite indices and that respond to appeals to incorporate community input and lived experienced into the understanding of climate hazard exposure and vulnerability; and (2) providing evidence on, as well as limitations to, the translatability of these indicators across hazard types and urban geographies – thereby contributing to comparative urban studies.
We utilized a subset of elicited participant responses from a large-scale, international survey that previously examined urban residents’ preferences with regard to various flood-related policies. The online survey was translated and administered in five cities globally: Buenos Aires, Argentina; Johannesburg, South Africa; London, United Kingdom; New York City, United States; and Seoul, South Korea. We re-analyzed these survey data with a supervised machine learning approach, XGBoost, to identify feature importance of items in the survey instrument and to create a comprehensive index of vulnerability to extreme weather hazards. XGBoost uses training data with multiple features to predict a target variable; in this case, the target variable was survey participants’ self-reported exposure to extreme weather events. Our analysis measured the importance that two key types of variables from the survey – self-perceptions of vulnerability and more objective demographic characteristics – had on extreme weather exposure.
2 Materials and methods
2.1 Survey items
The present study employs data from a previous international survey of approximately 645 residents per city (total n = 3,224) that gathered data on participants’ exposure in urban settings to various extreme weather events, their experience with flood management interventions, their demographic characteristics, and their preferences among different policies geared toward reducing flood disaster risk. The primary analysis for the full survey instrument is currently under peer review as a manuscript with the Journal of Environmental Psychology (Tier et al., 2025).
Out of this larger survey instrument, we utilize a subset of items related to residents’ exposure to extreme weather events and their demographic characteristics (see Appendix A for this subset of the survey codebook). We discard 829 responses, out of the total surveyed in the sample, from participants who had lived in their city for less than 3 years in order to remove responses from those who may not have had enough time to experience hazards in their city. We then discard an additional 7 responses from participants responding with a non-binary gender identity; because this category is so small, it does not allow for robust statistical conclusions. In total, we use n = 2, 388 responses in this study. More specifically, we utilized the following survey items (a summary of responses to these survey items can be found in the Supplementary Material):
• Exposure to extreme weather events. Participants rated their past exposure to each of eight extreme weather events on a 5-point Likert-type scale (1 Never; 2 Rarely - has occurred for me once or twice in my life; 3 Sometimes - has occurred for me every 2–5 years; 4 Regularly - has typically occurred for me 1–2 times each year; 5 Frequently - has typically occurred for me 3 + times each year). The eight extreme weather events were: flooding from heavy rainfall, flooding from coastal storms, flooding from river overflows, heavy winds, heatwaves/extreme heat, droughts, wildfires, and earthquakes. Seven of these hazard types were selected to represent a breadth of extreme weather events exacerbated by climate change. Earthquakes were included because, in pilot testing, participants frequently added this hazard type as a risk event that they had experienced. We utilize these elicited survey items as a proxy for participants’ true exposure to extreme weather hazards in the past.
• Demographics. We use a variety of self-reported demographic items as measures of climate vulnerability. Demographic questions included: education level, income, age, gender (Woman, Man, Non-binary, or Prefer to self-describe), Queer self-identification (binary yes/no), disability self-identification (binary yes/no), and whether they speak a non-dominant language as their primary language at home (binary yes/no with a text entry if yes; what was listed as the dominant language(s) varied by city). Education, income, age, and gender are common demographic items in survey instruments and moreover, have received attention in the literature on climate and environmental inequities. We also included Queer identity, disability identity, and non-dominant primary language as demographic items in our instrument because they have been understudied as vulnerability indicators. We note that a race/ethnicity item was also included as part of the larger survey instrument; however, we do not include it as a variable in this study for two reasons. First, categorical variables such as race hold no meaning for the feature importance analysis described below; we cannot translate racial/ethnic categories into numerical measures. Second, even if we were to create a yes/no binary variable of minority racial/ethnic identity, it would be difficult to standardize this measure across our city locations and so a comparative analysis would not be possible.
• Self-perceptions of vulnerability. Finally, two survey items asked about participants’ sense of their own vulnerability: (1) an ex-ante assessment of their likely exposure to harm from flood disasters as compared to other residents of their city and (2) an ex-post assessment of their recent experience with discrimination (as a self-reported measure of social vulnerability). Both items were on 5-point Likert-type scales. These two items were included to distinguish between actual exposure to hazard events (albeit self-reported exposure) and participants’ evaluation of their own personal exposure to harm or vulnerability to societal prejudice.
2.2 City selection and survey design
The international survey that we drew on from Tier et al. (2025) was designed through an iterative process that included exploratory work in each of the case study locations. The cities were selected based on similarities in population size, national governance type, economic standing, and experience with extreme weather events. We also selected for global geographic range, and made sure that the case locations included multiple cities in the Global South. The survey instrument was designed as follows: (1) it was first drafted in English; (2) collaborators from each city checked for cultural fit of the questions and we edited the English version as needed; (3) collaborators provided translations in conjunction with additional rounds of translation and back-translation via DeepL and Google Translate; different colleagues from each city edited the translations as needed and we checked for consistency across all locations and versions. The survey platform was built using Qualtrics XM software, approved by Princeton University’s Institutional Review Board (#16462), and beta-tested internationally using Prolific. The actual data collection was conducted via the Centiment survey panel company.
2.3 Estimation: feature importance with XGBoost
This study aims to understand which characteristics of the survey population are more strongly associated with an individual participant’s past exposure to a particular type of extreme weather event. We assess nine participant characteristics, split into three categories: four commonly referenced climate vulnerability demographics (income, age, gender, and education level), three rarely-referenced climate vulnerability demographics (Queer identity, disability identity, and non-dominant primary language), and two self-reported perceptions of vulnerability (self-perceived harm from flood disasters and self-perceived discrimination).
Feature importance indicates the degree to which these participant characteristics are present in urban populations experiencing each of the extreme weather events included in the survey. In other words, feature importance assigns a weight to different participant characteristics (self-perceived discrimination, income, etc.) based on how relevant they are for predicting a given target variable (past exposure to coastal flooding, heatwaves, etc.).
We employ a supervised machine learning approach whereby importance analysis is performed through gradient-boosted decision trees to measure the importance of each of the participant characteristics relative to each other, for a given climate hazard type. We chose to employ this method over OLS or other regression-based approaches for three reasons. First, in this case it is not appropriate to assume a linear relationship between hazard exposure and participant characteristics. Second, decision trees are a better choice for interpreting feature importance because here they rank participant characteristics based on their contribution to exposure to hazard events. In particular, our decision trees create ranks based on how much each participant characteristic contributes to the decision-making at each split in the tree. Hence, those participant characteristics that are selected for splitting higher up in the tree are interpreted as more relevant. Third, the participant characteristic variables are either ordinal (e.g., Likert-type scales, income range, etc.) or binary; decision trees, being a non-linear model, have the capability to include variables of this nature. It is also worth noting that we use gradient-boosting trees as opposed to random forests. Gradient-boosted trees allow for higher accuracy because they are trained sequentially, rather than independently, to correct on each others’ errors.
We perform this analysis through the XGBoost library (Chen and Guestrin, 2016), which allows for implementation of the stochastic gradient-boosting algorithm (Friedman, 2001) with decision trees being used as the weak learner.
Like other supervised learning models, tree boosting training is done by defining an objective function and optimizing it. An additive model (Equation 1),
is fit by stages, also called additive training. In each stage, a weak learner is introduced, which minimizes the loss with each added tree. Trees continue to be added as long as their addition improves the model output. Training stops once the loss function reaches an acceptable level, or when it is no longer possible to improve on an external validation dataset. In this case, we employ a validation set for early stopping to find the optimal number of boosting rounds.
where (Equation 2) for any step m, ensemble step m equals ensemble step m minus 1 plus the learning rate (n) times the weak learner at step m.
The model hence continues training until the validation score stops improving; here our objective is to minimize the log loss. In other words, we employ negative log likelihood as our loss function. This measures how well the model predictions align with the data, or its capability to reproduce true data. This loss function calculates the logarithm of the likelihood of observing the data given the parameters of the model, penalizing the model when it assigns low probability to what in the data would be a correct feature. Following existing convention, the data were split for training (80 percent) and testing (20 percent).
XGBoost provides feature importance in the form of gain, cover, and frequency. Gain measures the improvement in accuracy brought by a feature to the tree branches it is on. Cover looks at the number of samples affected by the feature for each split. Frequency is the percentage of times a covariate is used in splitting. In this case, we employ gain in order to understand the contribution of our covariate of interest to the accuracy of the prediction. Once models are fitted, the weighted root mean square error (RMSE) of the model is used together with visual inspection to determine the appropriate threshold for results. Only models with a robust fit are included in the results. Out of the models represented, results that are not considered are those hazard-city combinations with a high RMSE and poor visual fit.
Figure 1 shows how the validation of the result was conducted. The series of plots show the performance of the top trained models, where the dots represent the median prediction and the bar represents the uncertainty of such prediction for each target class. Performance in this case is measured as the model’s ability to predict the true value of hazard exposure (represented in the x-axis) through the predictions represented along the y-axis. The predictions represent values from 1 to 5, which is the scale at which past exposure to each hazard was measured. For instance, exposure to heavy wind was expressed on a scale of 1 to 5, and the plot shows how accurate the model is at predicting such exposure given the inputted participant characteristics (income, gender, discrimination, etc.). The fit to the line represents the fit of the models: the closer to the dotted line, the better the model can predict exposure. The number in the top right corner of each figure is the weighted RMSE for the model. The transparency of some figures indicates that the fit of the model was not sufficiently strong.
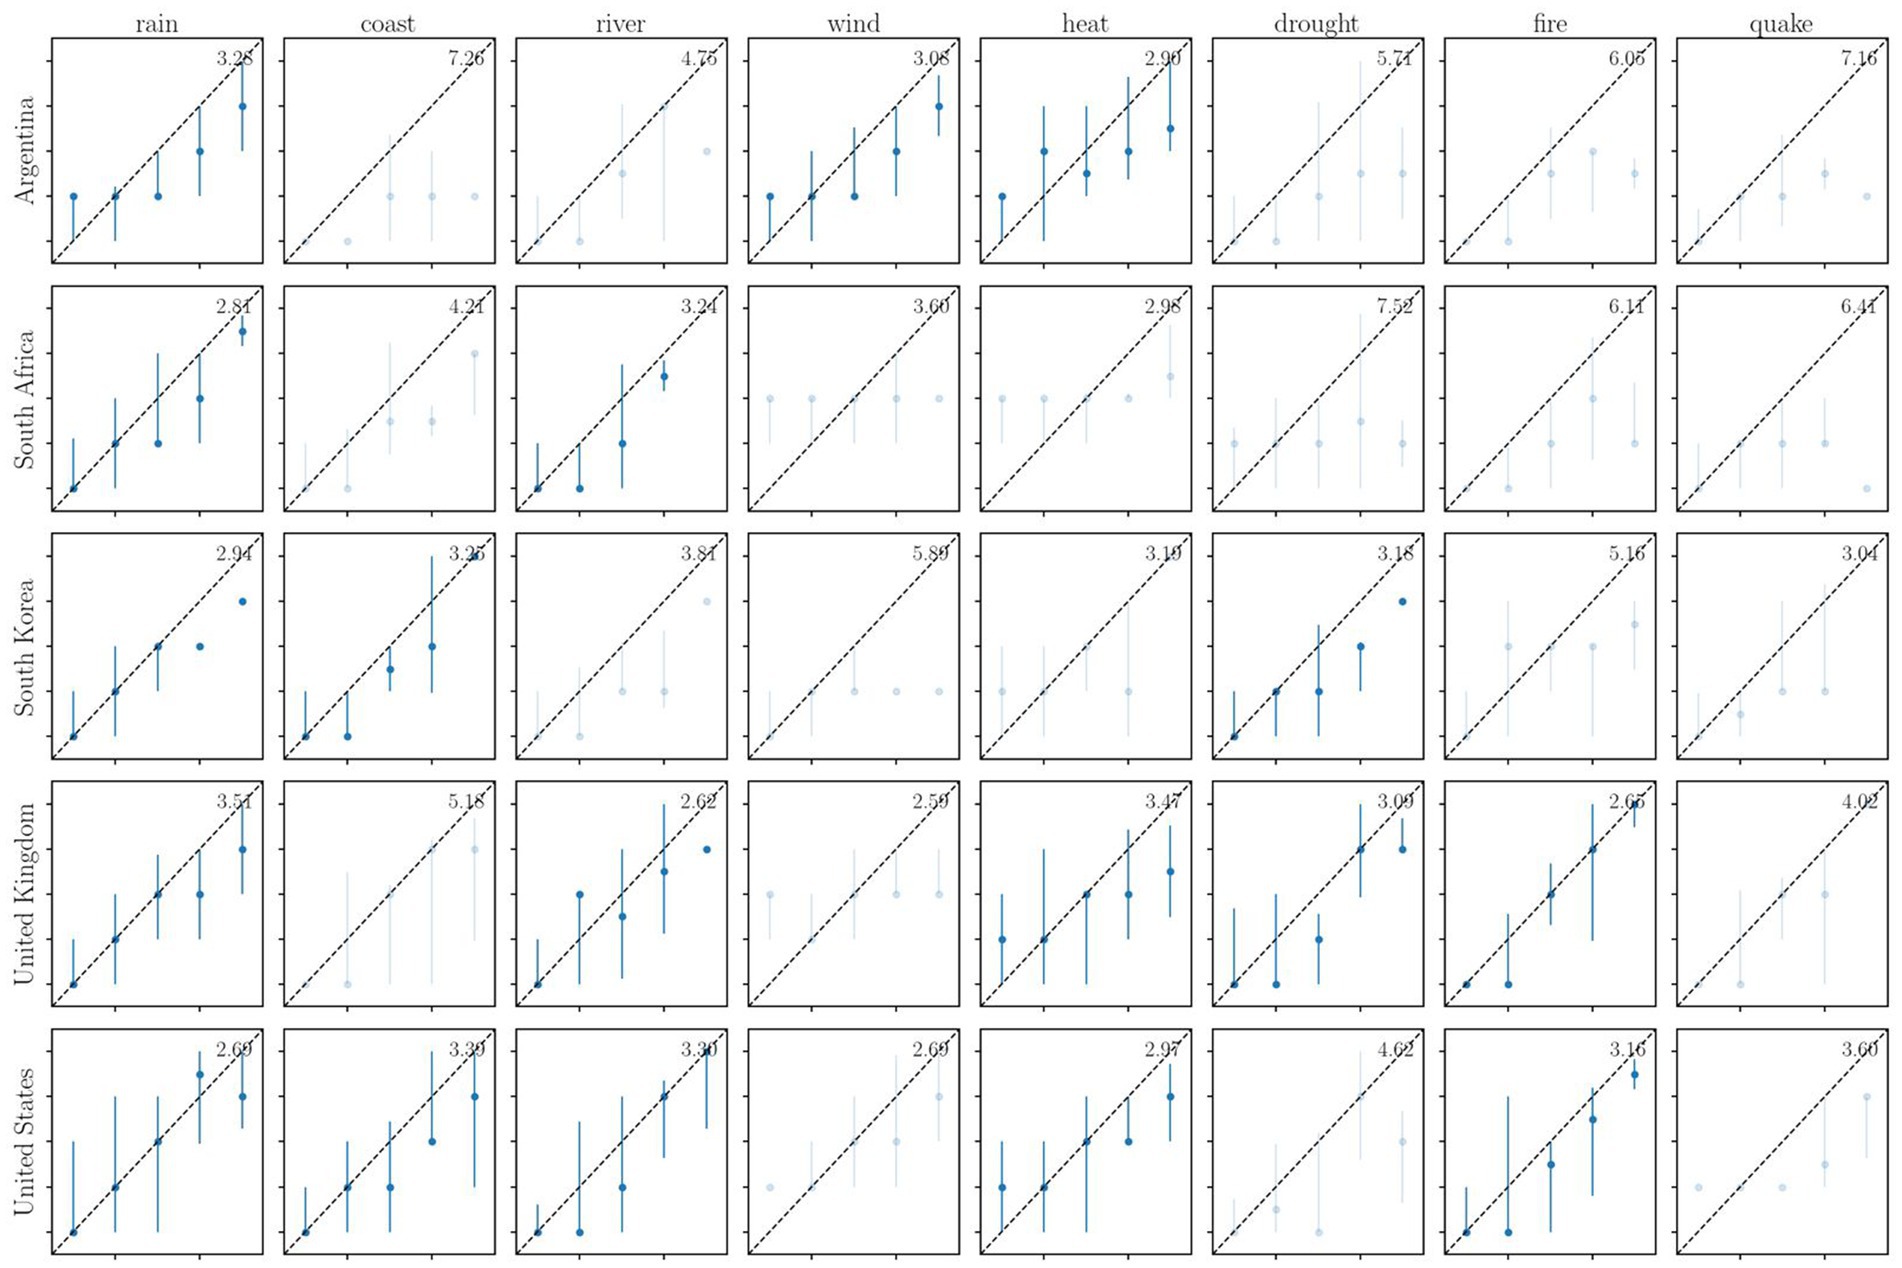
Figure 1. Results validation for all cities and across extreme weather hazard types. The numerical figure in the top right corner of each square is the weighted RMSE for the model. Figures that are transparent are conservatively discarded because the fit of the model was not deemed sufficiently robust. This is determined both by examining the RMSE and with visual inspection. The plot shows the performance of the predictive model. The lines are the plotted median predictions of the five best trained models and the uncertainty of such predictions for the different target classes (in this case, the 1 to 5 scale that measures past exposure to each hazard type) based on the different participant characteristics of importance. The x-axis is the true score, while the y-axis is the predicted score. The dashed line serves as a reference line where predicted values equal true values.
Figure 2 shows the primary results of our study. The histogram bars represent the feature importance calculated by the best fitted model. Each bar represents a given characteristic that our model looks at. The height of histogram bars represents the relative importance of a participant characteristic with respect to the other characteristics for a given city and hazard. The error bar at the top of each histogram bar represents the range in importance when calculated with the top five best fitting models after training. For reference, a total of 1,000 models were trained. This is meant to show not only the model chosen as the best fit, but also the range of results if we had picked alternative models that constitute a good fit. This showcases that even though different training rounds can deliver different results, these are highly consistent across resulting models.
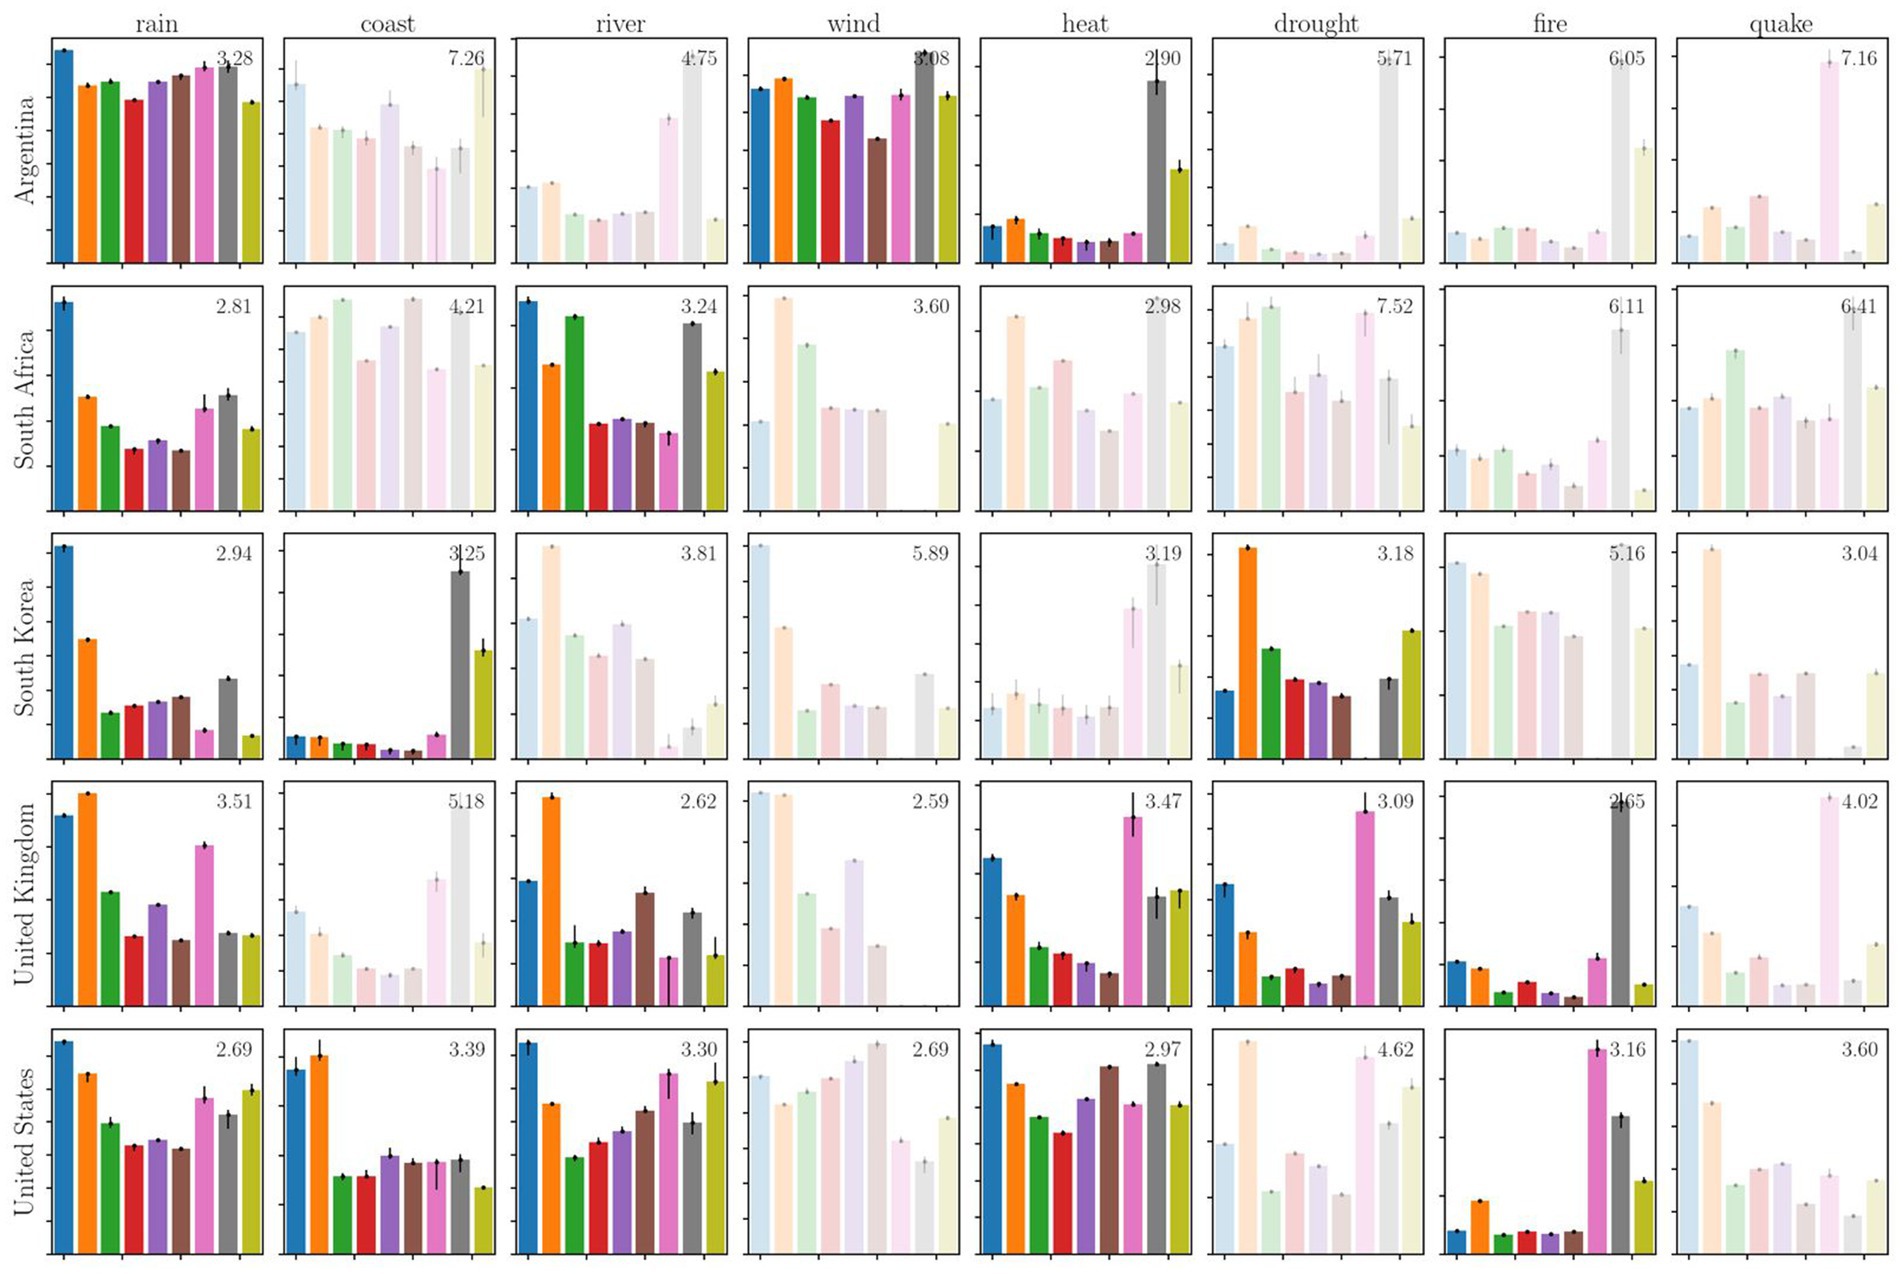
Figure 2. Representation of the “feature importance” of participant characteristics. The height of the bar reflects each characteristic’s relative importance with respect to the other characteristics for a given extreme weather hazard type and city. As in Figure 1, the results corresponding to models not deemed sufficiently robust are transparent. The colored bars represent the following participant characteristics: self-perceived harm from flood disasters (dark blue), self-perceived discrimination (orange), education level (green), income (red), age (violet), gender (brown), Queer identity (pink), disability identity (gray), and non-dominant primary language (yellow). The error bars represent the range of results from the top five models trained.
3 Results
The results show that exposure to extreme weather events is complex and that vulnerability characteristics associated with such exposure are far from homogeneous. Climate risk indicators and screening tools must consider this heterogeneity in order to achieve their intended goals. Our results first suggest that the types of variables that are most commonly associated with climate vulnerability (such as lower income, lower educational attainment, or minoritized identities) are not the only features to keep an eye out for when predicting who faces disproportionate climate risk in urban environments. We also show that different participant characteristics are relevant not only across extreme events but also across urban environments. We discuss each of these findings in further detail, then turn to a policy application in the domain of managed retreat/planned relocation.
3.1 New salient features: additional demographics and self-perceptions of vulnerability
Across the 18 models deemed robust (nontransparent panels in Figure 2), some similarities stand out. First, more traditional social vulnerability indicators (i.e., education level, income, age, and gender) are less frequent among the most important characteristics for any of the surveyed city populations in our feature importance analysis. Second, some additional demographic variables from our survey were in fact more important than traditional vulnerability indicators (i.e., Queer identity, disability identity, and non-dominant primary language). Third, measures of perceived discrimination and perceived harm from flood disasters in particular were frequently the most important predictors across different types of extreme weather events and across cities.
In the Buenos Aires sample, the participant characteristic most important to exposure to flooding from extreme rainfall was self-perceived harm from flood disasters and the least important were income and non-dominant primary language (with relatively high participant characteristic importance across the board). Disability identity was the most important and gender was the least important to exposure to heavy winds (again with relatively high importance across the other characteristics). Disability identity was the most important to exposure to extreme heat, with non-dominant primary language somewhat important and all other characteristics ranked very low.
In the Johannesburg sample, self-perceived harm from flood disasters was by far the most important to exposure to flooding from extreme rainfall, while income and gender were the least important (and moderate importance across the other characteristics). Self-perceived harm from flood disasters was again the most important to exposure to flooding from river overflows, with education level and disability identity also highly important, self-perceived discrimination and non-dominant primary language moderately important, and all others ranked lower.
In the Seoul sample, self-perceived harm from flood disasters was again the most important by a significant amount to exposure to flooding from extreme rainfall, self-perceived discrimination and disability identity were moderately important, and Queer identity and non-dominant primary language ranked very low. Disability identity was the most important by a significant amount to exposure to flooding from coastal storms, non-dominant primary language was moderately important, and all other characteristics were ranked very low. Self-perceived discrimination was by far the most important to exposure to droughts, with moderate importance for all other characteristics (Queer identity was not included due to absence in the sample).
In the London sample, self-perceived discrimination was most important to exposure to flooding from extreme rainfall, with self-perceived harm from flood disasters and Queer identity also very important and all other characteristics moderately important. Self-perceived discrimination was also most important to exposure to flooding from river overflows, with all other characteristics moderately important. Queer identity was most important to exposure to extreme heat, with self-perceived harm from flood disasters, self-perceived discrimination, disability identity, and non-dominant primary language all moderately important and remaining characteristics ranked low. Queer identity was most important to exposure to droughts, with self-perceived harm from flood disasters, self-perceived discrimination, disability identity, and non-dominant primary language all moderately important and remaining characteristics ranked low. Disability identity was by far the most important to exposure to wildfires, with all other characteristics ranked quite low.
In the New York City sample, self-perceived harm from flood disasters was most important to exposure to flooding from extreme rainfall, with self-perceived discrimination as next-most important and all characteristics having moderate to high importance. Self-perceived discrimination was most important to exposure to flooding from coastal storms, with self-perceived harm from flood disasters a close second and all other characteristics moderately important. Self-perceived harm from flood disasters was also most important to exposure to flooding from river overflows, with Queer identity and non-dominant primary language as next-most important in turn and all other characteristics having moderate to high importance. Self-perceived harm from flood disasters was also most important to exposure to extreme heat, with disability identity and gender as next-most important in turn and all other characteristics having moderate to high importance. Finally, Queer identity was most important to exposure to wildfires, with disability identity as next-most important, self-perceived discrimination and non-dominant language as moderately important, and all other characteristics ranked quite low.
If we take frequency counts for which participant characteristics were ranked as most important across all 18 robust models, self-perceived harm from flood disasters is identified the most often (seven times), with self-perceived discrimination and disability identity both identified four times and Queer identity three times. Education level, income, age, gender, and non-dominant primary language are never the most important characteristics for any city-hazard pair. Conversely, gender is identified as the least important characteristic eight times – with non-dominant primary language identified as the least important three times; education level, age, and Queer identity identified two times each, and income identified once. Self-perceived harm from flood disasters, self-perceived discrimination, and disability identity are never the least important characteristic. Notably, non-dominant primary language often falls in the middle of the pack in terms of feature importance – more often than do education level, income, age, and gender.
These findings are important to highlight because composite indicators are typically built to measure proxies for exposure and vulnerability to hazard events. However, proxies are not always well fit to measure the complex relationships that lie behind them. Importantly, they are also not well suited to capture the lived experience of urban residents, which can be crucial in defining their resilience to hazard events. Our results show the importance of including measurements, either quantitative or qualitative, that can help decision-makers to have a sense of context-specific risk characteristics. Measurements of self-perception in particular are as crucial for composite indices as are other proxies of vulnerability. It is important to stress that our survey distinguishes between actual exposure to hazard events (albeit self-reported exposure) and participants’ evaluations of their own vulnerabilities. The hazard exposure survey items queried participants about the number of times that they had experienced each hazard type – rather than their exposure in relation to their neighbors or peers. On the other hand, the two vulnerability questions were posed to have participants consider their relational vulnerability within some perceived societal average. Thus, it is a consequential finding that participants’ perceptions of their own vulnerability does in fact match how their hazard exposure compares to that of others.
As previously mentioned, it is important to emphasize that the results presented here are based on the 18 models that proved to be robust based on their RMSE and visual fit. This translates into limitations on the types of conclusions that can be reached through the available results; although we can assert that commonalities and differences exist across cities and across hazards, we cannot make specific predictions for every hazard-city combination. Additionally, the scarce data related to earthquake vulnerability do not allow for applicability of the findings to this type of hazard.
3.2 Salient features influenced by different hazard types and locations
Despite the commonalities described above, we also find that there is significant heterogeneity regarding feature importance across cities and across hazard types. For example, wildfires – as well as droughts, extreme heat, and coastal flooding for certain cities – were one hazard type in which self-perceptions of vulnerability were much more subdued while Queer and/or disability identity were far more prominent. For the three extreme weather events related to flooding (heavy rainfall, coastal storms, and river overflows), the two measures of self-perceptions of vulnerability (harm from flood disasters and/or discrimination) were more consistently important.
Local context also plays an important role, especially considering pre-existing variation regarding which identities experience marginalization. For example, disability identity repeatedly ranked highly in the Buenos Aires sample – and no other city – as a predictor for the three hazard types represented in this city’s robust models (exposure to flooding from heavy rainfall, heavy winds, and extreme heat), despite more variation in the other participant characteristics across hazard types for Buenos Aires. Another example is that Queer identity in the Seoul sample shows an unusual pattern compared to other cities: it ranks very low in importance for exposure to flooding from heavy rainfall and coastal storms, and has no data for droughts (i.e., no Seoul participants who identified as Queer also had experienced droughts). This could suggest that this participant characteristic is not tied to vulnerability in Seoul (unlike in other cities) – or, perhaps more likely, that participants were much less likely to self-report this identity in this location.
These results are in line with existing literature that highlights the importance of indicator weights (i.e., giving numerical importance to some indicators over others) when employing such vulnerability indicators for disaster decision-making (Papathoma-Köhle et al., 2019), as well as the importance of considering “dynamic vulnerability” to understand disaster risk (de Ruiter and van Loon, 2022). Dynamic vulnerability refers to the fact that vulnerability to a given hazard might change over time and can be influenced by changes in context and even by compound hazards. Our results showcase that climate risks need to be understood within the contextual idiosyncrasies of a given city, and vulnerability indicators cannot fully be generalized across cities or even across hazards within the same city. This is particularly true when selecting the types of questions or measurements that will be assessed about a population. Furthermore, certain aspects key to vulnerability may not be self-reported due to cultural or contextual reasons, so other approaches may need to be considered to truly gauge relevant features and to support those that are most vulnerable.
3.3 Takeaways in the context of managed retreat
This article was written in the context of this journal’s special issue titled, Managed Retreat in Response to Climate Hazards. In this last section we include reflections on planning for managed retreat in order to demonstrate a concrete policy area that could benefit from our findings.
With the “solution space” for managing the global climate crisis shrinking as dangerous effects of greenhouse gas emissions become increasingly “locked-in” (Haasnoot et al., 2021), ambitious and transformative adaptation planning and implementation strategies are needed now. Adaptation actions are commonly categorized as either resistance (such as building a seawall), advancement (such as creating new land through reclamation), accommodation (such as elevating a structure at risk of flooding), avoidance (such as restricting development in high-risk floodplains), or retreat (such as planned relocation) (Mach and Siders, 2021). Retreat, the focal point of this special issue, typically comes into play when other adaptation measures are deemed insufficient given the level of exposure or vulnerability to the hazards that a given community or household is experiencing. Managed retreat refers to instances when relocation is purposeful and coordinated; although managed retreat can be initiated over a variety of different temporal and governance scales using various instruments by actors such as governments, the private sector, and civil society.
Even though effective in reducing hazard exposure, managed retreat faces many other barriers to success – and even the precise terminology for this type of policy initiative is highly debated.5 In the U. S., the limited number of climate-induced managed retreat programs that do exist have largely been tackled through buyout/acquisition strategies (Siders and Gerber-Chavez, 2021). Though there is a growing literature on these buyouts (see Greer et al. (2022) and Mach et al. (2019) for review papers), Greer and Brokopp Binder (2017) also conclude that minimal policy learning has occurred due to lack of both actionable data and formal government guidance. Evidence consistently shows that buyout programs suffer from a wide range of challenges, including: long wait times (Siders and Gerber-Chavez, 2021; Weber and Moore, 2019); inadequate federal funding (CRS, 2022; Peterson et al., 2020); complex and uncoordinated multi-level governance processes (Siders and Gerber-Chavez, 2021; Weber and Moore, 2019); lack of transparency in program procedures/structures (Greer et al., 2022); excessive focus on individual homeowners, as opposed to renters, communities, or other forms of housing tenure (Wilson et al., 2021); failure to incorporate social vulnerability indicators (Wilson et al., 2021) or to capture potential structural causes of immobility (Seeteram et al., 2023); insufficient monitoring and evaluation (McGhee et al., 2020); and misguided targets, such as measuring number of household recipients instead of favorable long-term outcomes (Manda et al., 2023).
Of particular importance to relocation programs is ensuring more distributive, procedural, and other forms of climate justice – especially given that current data suggest poor existing outcomes on these fronts. Mach et al. (2019) find that wealthier and denser counties are more likely to implement buyout programs – but within those counties, households in lower-income and more racially diverse areas are more likely to actually receive a buyout. Loughran et al. (2019) find that “the rate at which minority populations were growing” influences White households’ interest in accepting buyouts. Curran-Groome et al. (2021) also note immense inefficiencies in application processes, which place a burden on lower-income and less staffed local governments. Finally, Marino (2018) contends that buyouts as currently formulated do not work well in many Indigenous communities where property ownership is not always documented and individually-focused relocations conflict with community-oriented decision-making.
The most prevalent typology of managed retreat globally is still what Ajibade et al. (2022) describe as “techno-managerial,” or focused on simple hazard exposure reduction tactics. Present-day interventions lag behind not only in overcoming barriers initiate and implement a retreat process, but also in focusing on the outcomes from a justice and well-being perspective. We argue that the results of our analysis reinforce the pressing need for managed retreat efforts to include a focus on compensatory, transformative approaches that center justice. This is particularly true given the types of participant characteristics that we found to contribute to hazard exposure the most: people’s sense of their own flood hazard vulnerability, their experience with discrimination, and both disability and Queer identity. These characteristics are associated with larger systemic, institutional, and social barriers that have the potential to make residents undergoing relocation even more vulnerable to hazard exposure or subject to even further discrimination in the buyout selection process or in the new locations that they relocate to. Our findings do not necessarily suggest that relocation should not take place, but instead that such initiatives should have a strong focus on justice-centered outcomes.
4 Discussion
This study illuminates the complexities that lie behind efforts to understand the components of climate risk in diverse urban settings. Our analysis shows, in line with previous literature, that exposure to environmental hazards and unequal social structures are deeply intertwined (Adger et al., 2018). These underlying social contributors to climate risk might go unnoticed within existing vulnerability indices. Additionally, while current hazard vulnerability composite indices assume a priori which proxies best represent vulnerability (such as income or education), our results show that these measures need to be coupled with more novel demographic characteristics as well as measurements of self-perception – which can be elicited through surveys, interviews, and focus groups – as well as more robust community-led policy design processes.
We argue that vulnerability indices need to move away from a one-size-fits-all approach. This is in line with a recent systematic review of the literature documenting important differences in urban climate risk (hazard, exposure, and vulnerability) and adaptation strategies among countries (Wannewitz et al., 2024). Our results add the finding that the participant characteristics that are associated with higher hazard exposure differ across types of hazards and across cities. For instance, vulnerability is defined by different participant characteristics when considering extreme rain versus extreme heat. Indices should also be carefully employed with the understanding that the boundaries between resilience and vulnerability are dynamic and complex. While low-income communities might have less access to tangible resources in the face of hazard events, they might also count on stronger social networks that can be crucial to withstanding some of these events.
In practice, these conclusions might translate into efforts to cast a wider net of indicators upfront when trying to pinpoint the social characteristics that lead to climate vulnerability in a given location. To do so, interviews and in-depth knowledge gathered from citizens, grassroots organizations, and practitioners would help to expand the types of indicators to be considered beyond existing metrics. This study hopes to make a contribution in this direction by exploring social vulnerability indicators that have not commonly been considered in past indices in order to demonstrate that current indices are frequently incomplete.
It is also important to acknowledge the limitations in applicability of this study when it comes to defining vulnerability indicators across global locations. Our results are generalizable in that we demonstrate that most current vulnerability indicators are insufficiently operationalized. On the other hand, we are not able to offer a one-size-fits-all alternative that could then be utilized in additional cities for further cross-national comparisons. Instead, we recommend that researchers and practitioners build composite indices from the ground up, drawing on local expertise, when working with a new population. We acknowledge that this tailored approach comes with challenges, as pointed to in the literature – such as lack of standardization and so limits to comparability (Nguyen et al., 2016). One solution proposed by Edmonds et al. (2020) is to create indices that can be tailored to different countries by using “endogenously generated” statistical weights – thus allowing for different constructions while still facilitating meaningful comparisons.
There are also challenges of data collection through an international survey. Despite an iterative translation process to validate survey items across contexts, cultural perceptions of the same question may differ. Additionally, despite deploying a big N survey, the dataset obtained is not always large enough for the present analysis to reach conclusions for every possible way of subsetting the data (e.g., not enough experience of a certain type of hazard event among residents of a particular city). Self-reported experience with extreme weather events would also ideally be validated with comparisons to recorded events – though such validation is challenging on a hyper-local level as well as across distant global locations (especially in locations where geospatial hazard data are not collected or hard to obtain). Hence, in this study we advocate for a conservative approach in the interpretation of our results. For government officials facing resource scarcity, this might translate to the use of composite vulnerability indices when hazard data have already been collected for other ends. Policymakers could then couple this information with interviews, focus groups, or other ways of identifying the most pertinent vulnerability indicators in their communities.
Future work should focus on advancing a causal understanding of the socioeconomic and political mechanisms that generate the results we find in our feature analysis. Research should also aim to further pinpoint the links between urban resilience and vulnerability, especially in individual cities. Utilizing novel methodologies, such as our pairing of survey elicitation and a gradient-boosting framework, can then help to increase the body of comparative urban scholarship. This avenue of research can help to develop new approaches to support those most vulnerable to climate risk and to improve institutional approaches to urban climate adaptation.
Data availability statement
The raw data supporting the conclusions of this article will be made available by the authors, without undue reservation, upon request.
Ethics statement
This survey research involving human subjects was approved by the Princeton University Human Research Protection Program (IRB). Data collection was conducted in accordance with local legislation and institutional requirements. The participants provided their written informed consent to participate in this study.
Author contributions
LC: Conceptualization, Formal analysis, Investigation, Methodology, Project administration, Resources, Software, Validation, Visualization, Writing – original draft, Writing – review & editing. MT: Conceptualization, Data curation, Formal analysis, Funding acquisition, Investigation, Methodology, Project administration, Resources, Software, Supervision, Validation, Visualization, Writing – original draft, Writing – review & editing. EW: Conceptualization, Project administration, Resources, Supervision, Writing – review & editing.
Funding
The author(s) declare that financial support was received for the research and/or publication of this article. Survey administration costs were supported by multiple sources from Princeton University: the Center for Policy Research on Energy and the Environment, the Behavioral Science for Policy Lab, the High Meadows Environmental Institute’s Hack Award for Water and the Environment, and the Princeton Institute for International and Regional Studies. LC’s contribution to this project was funded by the NSF Chishiki AI Fellowship by The University of Texas at Austin. The publication of this manuscript was supported by the Princeton University Library Open Access Fund.
Acknowledgments
We thank ChangHoon Hahn for insightful discussions on the methodology of this paper, and Eric Tate for providing feedback on our conclusions. We also thank the Young Scientists Summer Program at the International Institute for Applied Systems Analysis in Vienna, Austria for supporting MOT in the initial development of the survey instrument. Finally, we thank the many colleagues who were involved in the multiple translations of the survey instrument.
Conflict of interest
The authors declare that the research was conducted in the absence of any commercial or financial relationships that could be construed as a potential conflict of interest.
Generative AI statement
The authors declare that no Gen AI was used in the creation of this manuscript.
Publisher’s note
All claims expressed in this article are solely those of the authors and do not necessarily represent those of their affiliated organizations, or those of the publisher, the editors and the reviewers. Any product that may be evaluated in this article, or claim that may be made by its manufacturer, is not guaranteed or endorsed by the publisher.
Supplementary material
The Supplementary material for this article can be found online at: https://www.frontiersin.org/articles/10.3389/fclim.2025.1521507/full#supplementary-material
Footnotes
1. ^The IPCC Sixth Assessment Report Working Group II on Impacts, Adaptation and Vulnerability defines exposure as “presence of people; livelihoods; species or ecosystems; environmental functions, services and resources; infrastructure; or economic, social or cultural assets in places and settings that could be adversely affected.” It defines vulnerability as “the propensity or predisposition to be adversely affected and encompasses a variety of concepts and elements, including sensitivity or susceptibility to harm and lack of capacity to cope and adapt” (IPCC, 2022: p.5).
2. ^Created under the Biden Administration, but recently taken offline by the Trump Administration (and preserved here by a volunteer coalition called the Public Environmental Data Partners: https://edgi-govdata-archiving.github.io/ j40-cejst-2/en).
3. ^Tool website: https://climatevulnerabilityindex.org.
4. ^As just one example: Mullen et al. (2023) specifically consider CEJST from the perspective of Indigenous communities and offer several recommendations for better designing and contextualizing indicators. Importantly, they note: “Indigenous peoples should be engaged at every level of the development and implementation of screening tools, in ways that affirm Indigenous self-determination and the principle of free, prior, and informed consent” (p. 367). Such principles hold for other local contexts as well.
5. ^Baja (2021) describes that both “being managed” and “retreat” are often seen as undesirable states, and the terms “managed,” “retreat,” and “relocation” all have significant negative connotations in the U. S. – especially for people of color – of past involuntary movements forced by the federal government (including via slavery of Black people, genocide and other removals of Indigenous people, internment of Japanese-Americans, redlining of various minoritized groups, etc.). Ajibade et al. (2022) also note that while managed/planned retreat is a common term in the Global North, relocation and resettlement are more common terms in the Global South.
References
Adger, W. N., de Campos, R. S., and Mortreux, C. (2018). “Mobility, displacement and migration, and their interactions with vulnerability and adaptation to environmental risks” in Routledge handbook of environmental displacement and migration. 1st ed. eds. McLeman R., Gemenne F. (London, UK: Routledge), 29–41.
Ajibade, I., Sullivan, M., Lower, C., Yarina, L., and Reilly, A. (2022). Are managed retreat programs successful and just? A global mapping of success typologies, justice dimensions, and trade-offs. Global Environ. Change 76, 102576–102512. doi: 10.1016/j.gloenvcha.2022.102576
Baja, K. (2021). “Rethinking process and reframing language for climate-induced relocation” in Global views on climate relocation and social justice. eds. Jola Ajibade I., A.R. Siders (London, UK: Routledge), 19–33.
Bolin, B., and Kurtz, L. C. (2018). “Race, class, ethnicity, and disaster vulnerability” in Handbook of disaster research eds. Rodríguez H., Donner W., Trainor, J. E. (Cham, Switzerland: Springer International Publishing), 181–203.
Chen, T., and Guestrin, C. XGBoost: a scalable tree boosting system. In Proceedings of the 22nd ACM SIGKDD International Conference on Knowledge Discovery and Data Mining, KDD 785–794 (2016). doi: 10.1145/2939672.2939785
CRS Flood buyouts: federal funding for property acquisition. Technical report Congressional Research Service (2022)
Curran-Groome, W., Haygood, H., Hino, M., BenDor, T. K., and Salvesen, D. (2021). Assessing the full costs of floodplain buyouts. Clim. Chang. 168, 1–23. doi: 10.1007/s10584-021-03178-x
de Ruiter, M. C., and van Loon, A. F. (2022). The challenges of dynamic vulnerability and how to assess it. iScience 25, 104720–104713. doi: 10.1016/j.isci.2022.104720
Drakes, O., and Tate, E. (2022). Social vulnerability in a multi-hazard context: a systematic review. Environ. Res. Lett. 17, 1–10. doi: 10.1088/1748-9326/ac5140
Edmonds, H. K., Lovell, J. E., and Lovell, C. A. K. (2020). A new composite climate change vulnerability index. Ecol. Indic. 117:106529. doi: 10.1016/j.ecolind.2020.106529
Foster, S. R., Baptista, A., Nguyen, K. H., Tchen, J., Tedesco, M., and Leichenko, R. (2024). NPCC4: advancing climate justice in climate adaptation strategies for New York city. Ann. N. Y. Acad. Sci. 1539, 77–126. doi: 10.1111/nyas.15148
Friedman, J. H. (2001). Greedy function approximation: a gradient boosting machine. Ann. Stat. 29, 1189–1232. doi: 10.1214/aos/1013203451
Gifford, R. (2011). The dragons of inaction: psychological barriers that limit climate change mitigation and adaptation. Am. Psychol. 66, 290–302. doi: 10.1037/a0023566
Greer, A., and Brokopp Binder, S. (2017). A historical assessment of home buyout policy: are we learning or just failing? Hous. Policy Debate 27, 372–392. doi: 10.1080/10511482.2016.1245209
Greer, A., Brokopp Binder, S., and Zavar, E. (2022). From hazard mitigation to climate adaptation: a review of home buyout program literature. Hous. Policy Debate 32, 152–170. doi: 10.1080/10511482.2021.1931930
Groves, R. M., Fowler, F. J., Couper, M. P., Lepkowski, J. M., Singer, E., and Ourangeau, R. (2009) Survey methodology. Wiley series in survey methodology. 2nd. Hoboken, NJ: Edn: Wiley-Blackwell.
Haasnoot, M., Lawrence, J., and Magnan, A. K. (2021). Pathways to coastal retreat. Science 372, 1287–1290. doi: 10.1126/science.abi6594
IPCC (2022). “Summary for policymakers” in Climate change 2022: Impacts, adaptation and vulnerability. Contribution of working group II to the sixth assessment report of the intergovernmental panel on climate change (Intergovernmental Panel on Climate Change) eds. H.-O. Pörtner, D.C. Roberts, M. Tignor, E.S. Poloczanska, K. Mintenbeck, A. Alegría et al. (Cambridge, UK: Cambridge University Press) 3–34.
Lewis, P. G. T., Chiu, W. A., Nasser, E., Proville, J., Barone, A., Danforth, C., et al. (2023). Characterizing vulnerabilities to climate change across the United States. Environ. Int. 172, 1–12. doi: 10.1016/j.envint.2023.107772
Loughran, K., Elliott, J. R., and Kennedy, S. W. (2019). Urban ecology in the time of climate change: Houston, flooding, and the case of federal buyouts. Soc. Currents 6, 121–140. doi: 10.1177/2329496518797851
Mach, K. J., Kraan, C. M., Hino, M., Siders, A. R., Johnston, E. M., and Field, C. B. (2019). Managed retreat through voluntary buyouts of flood-prone properties. Sci. Adv. 5, 1–9. doi: 10.1126/sciadv.aax8995
Mach, K. J., and Siders, A. R. (2021). Reframing strategic, managed retreat for transformative climate adaptation. Science 372, 1294–1299. doi: 10.1126/science.abh1894
Manda, S., Jerolleman, A., and Marino, E. (2023). Assumptions and understanding of success in home buyout programs. Int. J. Dis. Risk Reduc. 95, 103863–103815. doi: 10.1016/j.ijdrr.2023.103863
Marino, E. (2018). Adaptation privilege and voluntary buyouts: perspectives on ethnocentrism in sea level rise relocation and retreat policies in the US. Glob. Environ. Change 49, 10–13.
Mayhew, D. R. (2008). Parties and policies: How the American government works. New Haven, CT: Yale University Press.
McGhee, D. J., Binder, S. B., and Albright, E. A. (2020). First, do no harm: evaluating the vulnerability reduction of post-disaster home buyout programs. Nat. Hazards Rev. 21, 1–11. doi: 10.1061/(ASCE)NH.1527-6996.0000337
Morris, A., Baird-Zars, B., Sanders, V., Gallay, P., Klopp, J. M., Hernandez, A., et al. (2024). Advancing equitable partnerships: frontline community visions for coastal resiliency knowledge co-production, social cohesion, and environmental justice. Geoforum 154, 1–15. doi: 10.1016/j.geoforum.2024.104051
Mullen, H., Whyte, K., and Holifield, R. (2023). Indigenous peoples and the Justice40 screening tool: Lessons from EJSCREEN. Environmental Justice, 16, 360–369. doi: 10.1089/env.2022.0045
NASEM (2024). Constructing valid geospatial tools for environmental justice. National Academies of sciences, engineering, and medicine. Washington, DC: National Academies Press.
Nguyen, T. T. X., Bonetti, J., Rogers, K., and Woodroffe, C. D. (2016). Indicator-based assessment of climate-change impacts on coasts: a review of concepts, methodological approaches and vulnerability indices. Ocean Coast. Manage. 123, 18–43. doi: 10.1016/j.ocecoaman.2015.11.022
Papathoma-Köhle, M., Cristofari, G., Wenk, M., and Fuchs, S. (2019). The importance of indicator weights for vulnerability indices and implications for decision making in disaster management. Int. J. Dis. Risk Reduc. 36, 101103–101112. doi: 10.1016/j.ijdrr.2019.101103
Peterson, K., Apadula, E., Salvesen, D., Hino, M., Kihslinger, R., and BenDor, T. K. (2020). A review of funding mechanisms for US floodplain buyouts. Sustain. For. 12, 1–20. doi: 10.3390/su122310112
Pollack, A. B., Helgeson, C., Kousky, C., and Keller, K. (2024). Developing more useful equity measurements for flood-risk management. Nat. Sustain. 7, 823–832. doi: 10.1038/s41893-024-01345-3
Roberts, P. S., and Wernstedt, K. (2019). Decision biases and heuristics among emergency managers: just like the public they manage for? Am. Rev. Public Adm. 49, 292–308. doi: 10.1177/0275074018799490
Rufat, S., Tate, E., Emrich, C. T., and Antolini, F. (2019). How valid are social vulnerability models? Ann. Am. Assoc. Geogr. 109, 1131–1153. doi: 10.1080/24694452.2018.1535887
Seeteram, N. A., Ash, K., Sanders, B. F., Schubert, J. E., and Mach, K. J. (2023). Modes of climate mobility under sea-level rise. Environ. Res. Lett. 18, 1–16. doi: 10.1088/1748-9326/acfe22
Siders, A. R. (2022). The administrator’s dilemma: closing the gap between climate adaptation justice in theory and practice. Environ. Sci. Pol. 137, 280–289. doi: 10.1016/j.envsci.2022.08.022
Siders, A. R., and Gerber-Chavez, L. (2021). Floodplain buyouts: challenges, practices, and lessons learned. Arlington, VA: TNC white paper report. TNC HQ.
Small, M. L., and Calarco, J. M. (2022). Qualitative literacy: A guide to evaluating ethnographic and interview research. Oakland, CA: University of California Press.
Sultana, F. (2021). Climate change, COVID-19, and the co-production of injustices: a feminist reading of overlapping crises. Soc. Cult. Geogr. 22, 447–460. doi: 10.1080/14649365.2021.1910994
Tate, E., Rufat, S., Rahman, M. A., and Hoover, S. (2025). Profiles of social vulnerability for flood risk reduction. Int. J. Dis. Risk Reduc. 118:105250. doi: 10.1016/j.ijdrr.2025.105250
Tier, M. O., Deubelli-Hwang, T., Calliari, E., and Weber, E. U. (2025). A multi-country comparison of preferences for environmental justice in urban climate adaptation flood policy. SSRN Preprint. doi: 10.2139/ssrn.5283393
Wannewitz, M., Ajibade, I., Mach, K. J., Magnan, A., Petzold, J., Reckien, D., et al. (2024). Progress and gaps in climate change adaptation in coastal cities across the globe. Nat. Cities 1, 610–619. doi: 10.1038/s44284-024-00106-9
Weber, A., and Moore, R. (2019). Going under: Long wait times for post-flood buyouts leave homeowners underwater. Technical report. New York, NY: Natural Resources Defense Council.
Wiering, M., Liefferink, D., and Crabbé, A. (2018). Stability and change in flood risk governance: on path dependencies and change agents: stability and change in flood risk governance. J. Flood Risk Manag. 11, 230–238. doi: 10.1111/jfr3.12295
Keywords: environmental justice (EJ), disaster & risk management, managed retreat, survey analyses, XGBoost (extreme gradient boosting), climate vulnerability analysis
Citation: Cano Pecharroman L, Tier MO and Weber EU (2025) Feature importance of climate vulnerability indicators with gradient boosting across five global cities. Front. Clim. 7:1521507. doi: 10.3389/fclim.2025.1521507
Edited by:
Nadia Seeteram, Columbia University, United StatesReviewed by:
Marianne Bügelmayer-Blaschek, Austrian Institute of Technology (AIT), AustriaBrenna Kays, Florida International University, United States
Copyright © 2025 Cano Pecharroman, Tier and Weber. This is an open-access article distributed under the terms of the Creative Commons Attribution License (CC BY). The use, distribution or reproduction in other forums is permitted, provided the original author(s) and the copyright owner(s) are credited and that the original publication in this journal is cited, in accordance with accepted academic practice. No use, distribution or reproduction is permitted which does not comply with these terms.
*Correspondence: Lidia Cano Pecharroman, TGNhbm9AYXVzdGluLnV0ZXhhcy5lZHU=