 LiHua Luo1†
 Yuzhou Long
- 1Department of Neurology, The Affiliated Hospital of Yunnan University, Kunming, Yunnan, China
- 2The First People’s Hospital of Yunnan Province, Kunming, Yunnan, China
- 3School of Clinical Medicine, Dali University, Dali, Yunnan, China
Background: Parkinson’s disease (PD) is a common chronic degenerative disease, and its exact pathological mechanism remains unclear. In this study, we identified covariates associated with the clinical outcomes of PD using patient data from the Medical Information Mart for Intensive Care IV (MIMIC-IV) database, providing new references for the treatment of patients.
Methods: The data of patients with PD and relevant covariates were obtained from the MIMIC-IV database. The patients were categorized into the in-hospital death and in-hospital survival groups based on their survival status, and the relationship between their outcomes and covariates was investigated. Key covariates markedly associated with the clinical outcomes of PD were further screened using regression analysis. Finally, a nomogram for predicting the risk of in-hospital mortality in patients with PD was constructed and validated.
Results: A total of 143 patients with PD and 37 covariates were included in this study. Of the included patients, 25 were assigned to the in-hospital death group and 118 were assigned to the in-hospital survival group. Covariates such as the respiratory rate, mean arterial pressure (MAP), respiratory failure, anion gap, bicarbonate levels, blood urea nitrogen levels, and sequential organ failure assessment (SOFA) scores were markedly associated with in-hospital mortality in patients with PD. Subsequently, age [hazard ratio (HR) = 1.0565, 95% confidence interval (CI) = 1.0065–1.1090, p < 0.05], bicarbonate levels (HR = 0.8988, 95% CI = 0.8310–0.9722, p < 0.05), BUN levels (HR = 1.0292, 95% CI = 1.0084–1.0503, p < 0.05), and SOFA scores (HR = 1.1510, 95% CI = 1.0324–1.2831, p < 0.05) were identified as key covariates associated with in-hospital mortality. The nomogram incorporating these covariates exhibited favorable performance in predicting the risk of in-hospital mortality in patients with PD.
Conclusion: This study revealed four key covariates associated with the clinical outcomes of PD, providing new references for the treatment of patients.
1 Introduction
Parkinson’s disease (PD) is a chronic, progressive neurodegenerative disorder characterized by the degeneration of dopaminergic (DA) neurons in the substantia nigra pars compacta and the subsequent reduction of striatal dopamine content (1). The loss of DA neurons triggers various motor symptoms, such as tremors, muscle rigidity, bradykinesia, and balance disorders (2). Although PD is defined as a movement disorder, numerous studies have shown that PD causes non-motor symptoms such as cognitive impairment, emotional disturbances, sleep disorders, and autonomic dysfunction in most patients (3). The prevalence of PD is projected to double within the next three decades, making it one of the leading causes of neurodisability (4). While the majority of PD cases are sporadic, approximately 10–15% exhibit familial inheritance patterns linked to mutations in genes such as LRRK2, SNCA, and PARK7. The motor and non-motor symptoms of PD reduce the quality of life and shorten life expectancy, increasing the mortality rate of patients with PD compared with that of the general population (5). Age, gender, and comorbidities have been identified as risk factors of PD (6, 7). The severity of symptoms, timing of symptom onset, and interactions between symptoms vary greatly across patients, making it difficult to establish a uniform prognostic standard (8). In the advanced stages of Parkinson’s disease, patients face an increased risk of complications such as pneumonia, diabetes, and hypertension (9), which often require treatment in the intensive care unit (ICU). Research indicates that individuals with Parkinson’s disease develop these acute conditions more frequently than the general population, leading to a higher likelihood of ICU admissions (10). Furthermore, the dopaminergic medications used to manage Parkinson’s symptoms can interact with commonly administered ICU drugs, such as sedatives, complicating clinical management and potentially worsening patient outcomes (11). Together, these factors contribute to higher mortality rates among Parkinson’s disease patients in the ICU setting. To date, no strategies that can cure or prevent PD have been developed (12). Therefore, identifying novel prognostic factors for PD is necessary, as it may provide a valuable reference for developing more effective treatments.
Medical Information Mart for Intensive Care IV (MIMIC-IV) is a publicly available large-scale medical database developed by the Computer Science Laboratory at Beth Israel Deaconess Medical Center (BIDMC) (13). It provides the health-related data of patients admitted to intensive care units (ICUs), helping medical researchers understand diseases, improve treatments, and develop new therapeutic techniques (14). The breadth and detail of the MIMIC-IV database make it an ideal resource to investigate diseases such as PD, as it contains extensive clinical data that can be used to analyze the epidemiological features, risk factors, and clinical outcomes of diseases (15, 16).
This study focused on sporadic PD cases within the general ICU population. Using the MIMIC-IV database and applying machine learning algorithms such as Least Absolute Shrinkage and Selection Operator (LASSO) regression, the study identified risk factors associated with PD prognosis. The aim was to develop and validate a model for predicting the risk of in-hospital mortality in PD patients, offering new approaches to improve PD prognosis.
2 Manuscript formatting
2.1 Study design
The MIMIC-IV database1 included 906 patients with PD (International Classification of Diseases [ICD10]: “G20”) from 2008 to 2019. The exclusion criteria for this study were as follows: (1) less than 18 years of age at ICU admission, (2) availability of data of only the first ICU admission in patients with multiple ICU admissions, and (3) an ICU stay of less than 24 h. Patients were screened as shown in Figure 1. Eventually, a total of 143 patients (Supplementary Table 1) with PD were included in this study. Patients newly diagnosed with Parkinson’s disease were included in the study. Patient types are shown in Supplementary Table 2, and hospitalization records in Supplementary Table 3. The BIDMC Institutional Review Board waived the requirement for informed consent and approved this study. All data analyzed in this study can be accessed online at https://physionet.org/content/mimiciv/1.0/.
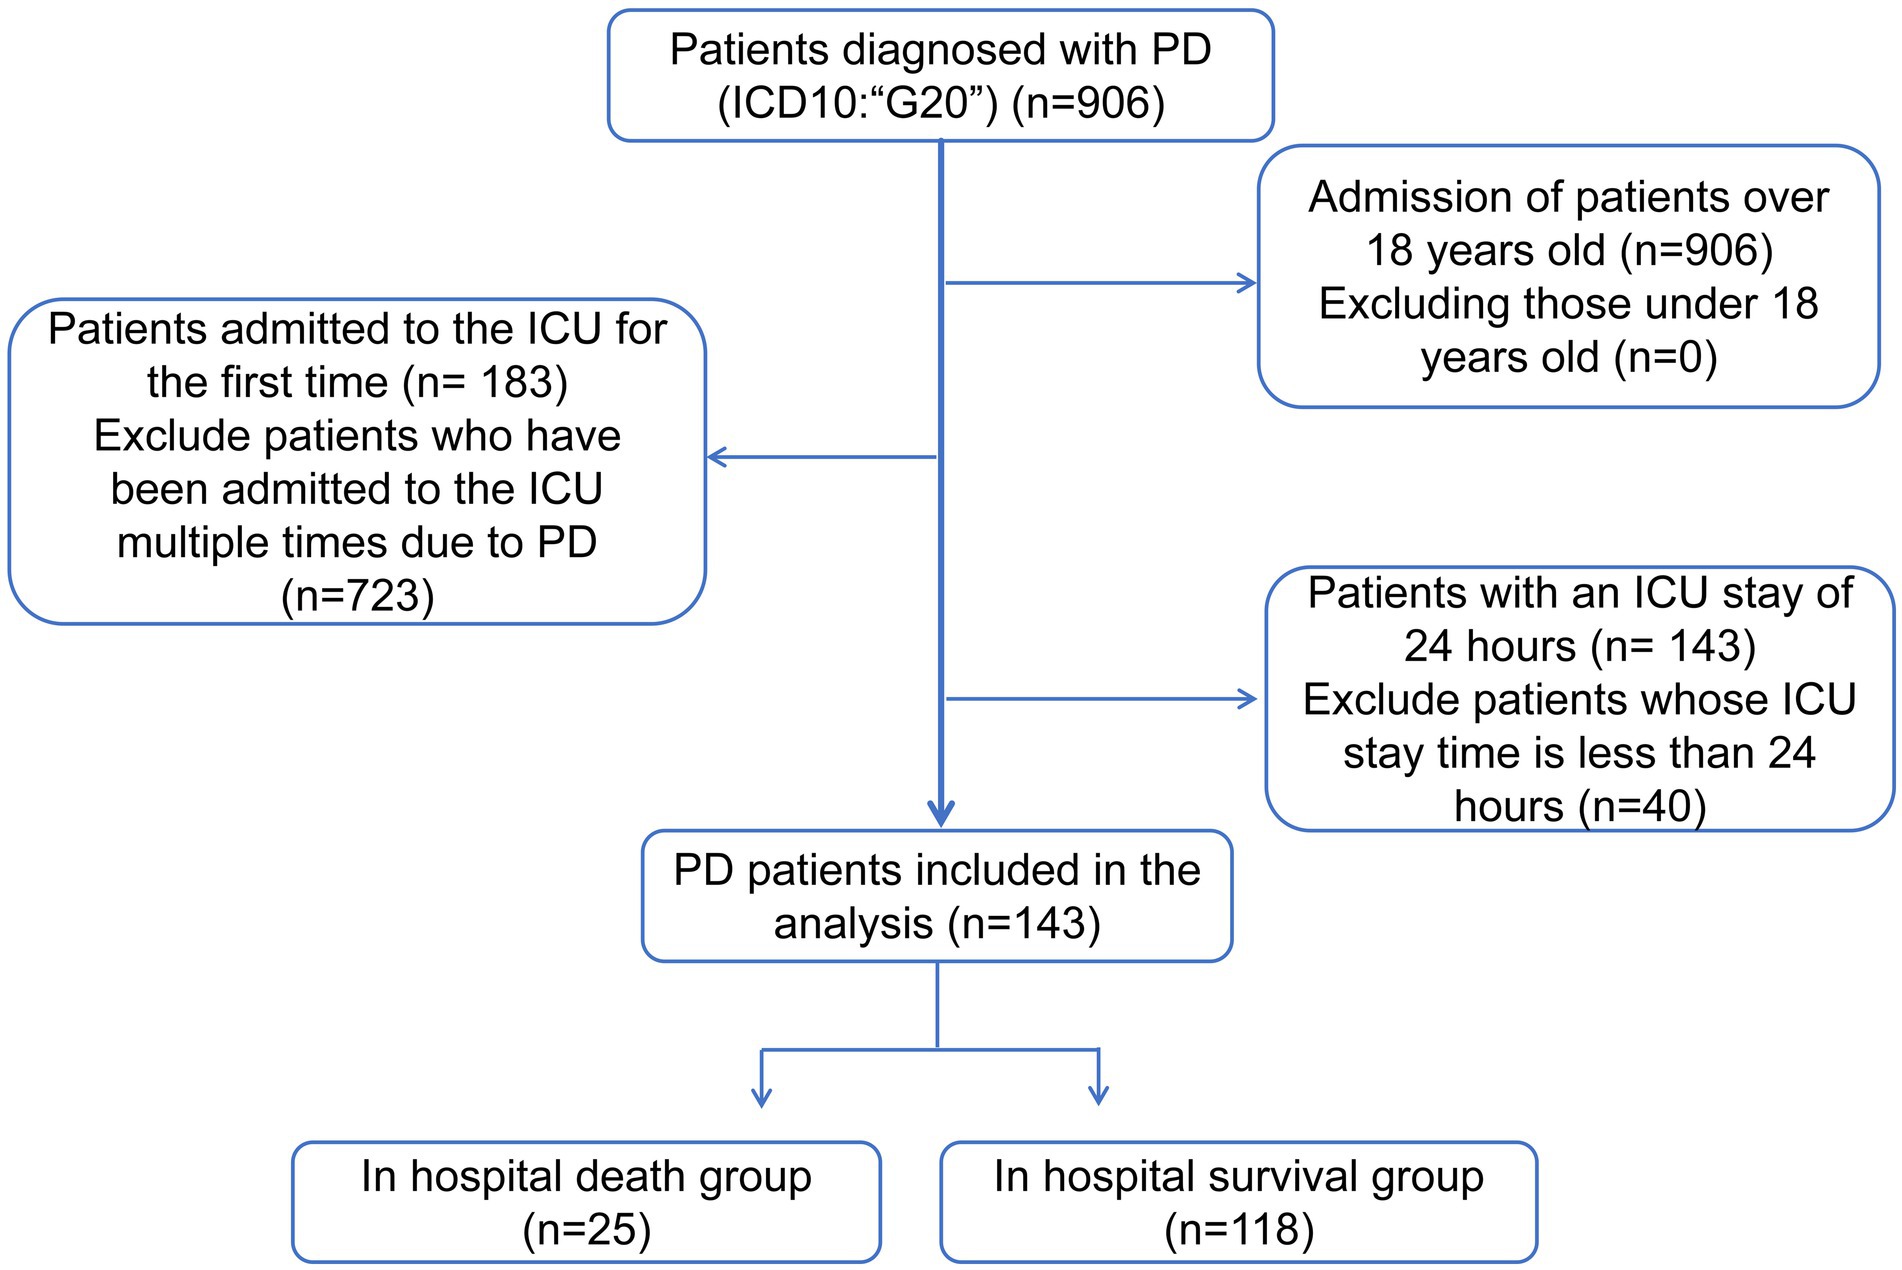
Figure 1. Patient scheduling flowchart.
2.2 Extraction of covariates and baseline characteristics
Patients with PD were divided into the in-hospital death and in-hospital survival groups based on their survival status. Subsequently, 37 baseline characteristics of these patients were extracted as covariates to investigate the relationship between them and clinical outcomes. The specific definitional values are shown in Table 1. Notably, covariates analysis was conducted using the CreateTableOne function from the R package “tableone” (v 0.13.2).2 Continuous variables were presented as mean ± standard deviation. The Shapiro–Wilk normality test was performed for continuous variables. For between-group comparisons, independent samples t-tests (for normally distributed data) and Mann–Whitney U tests (for non-normally distributed data) were performed, with statistical significance set at p < 0.05. Categorical variables were expressed as counts and percentages and compared using chi-square tests (p < 0.05). To evaluate the influence of covariates on PD patients, eligible cases from the MIMIC database between 2008 and 2019 were selected based on predefined inclusion and exclusion criteria. Patients were divided into two groups based on the in-hospital outcomes: the in-hospital mortality group (n = 25) and the in-hospital survival group (n = 118). Covariates were analyzed using t-test for continuous variable to identify statistically significant associations with in-hospital mortality (p < 0.05). To obtain the overall survival trend of 143 patients, we used the Kaplan-Meier method for survival analysis. Survival time was defined as the time from admission to discharge (event = 1), with the last follow-up time as the censoring value for lost-to-follow-up cases. During data preprocessing, we excluded cases with abnormal survival times (e.g., discharge before admission), variables with over 70% missing rates, and patients with ICU stays shorter than 24 h. In the analysis, the survival curve was fitted using the survfit() function from the R package “survminer,” and the curve was visualized with the ggsurvplot() function.
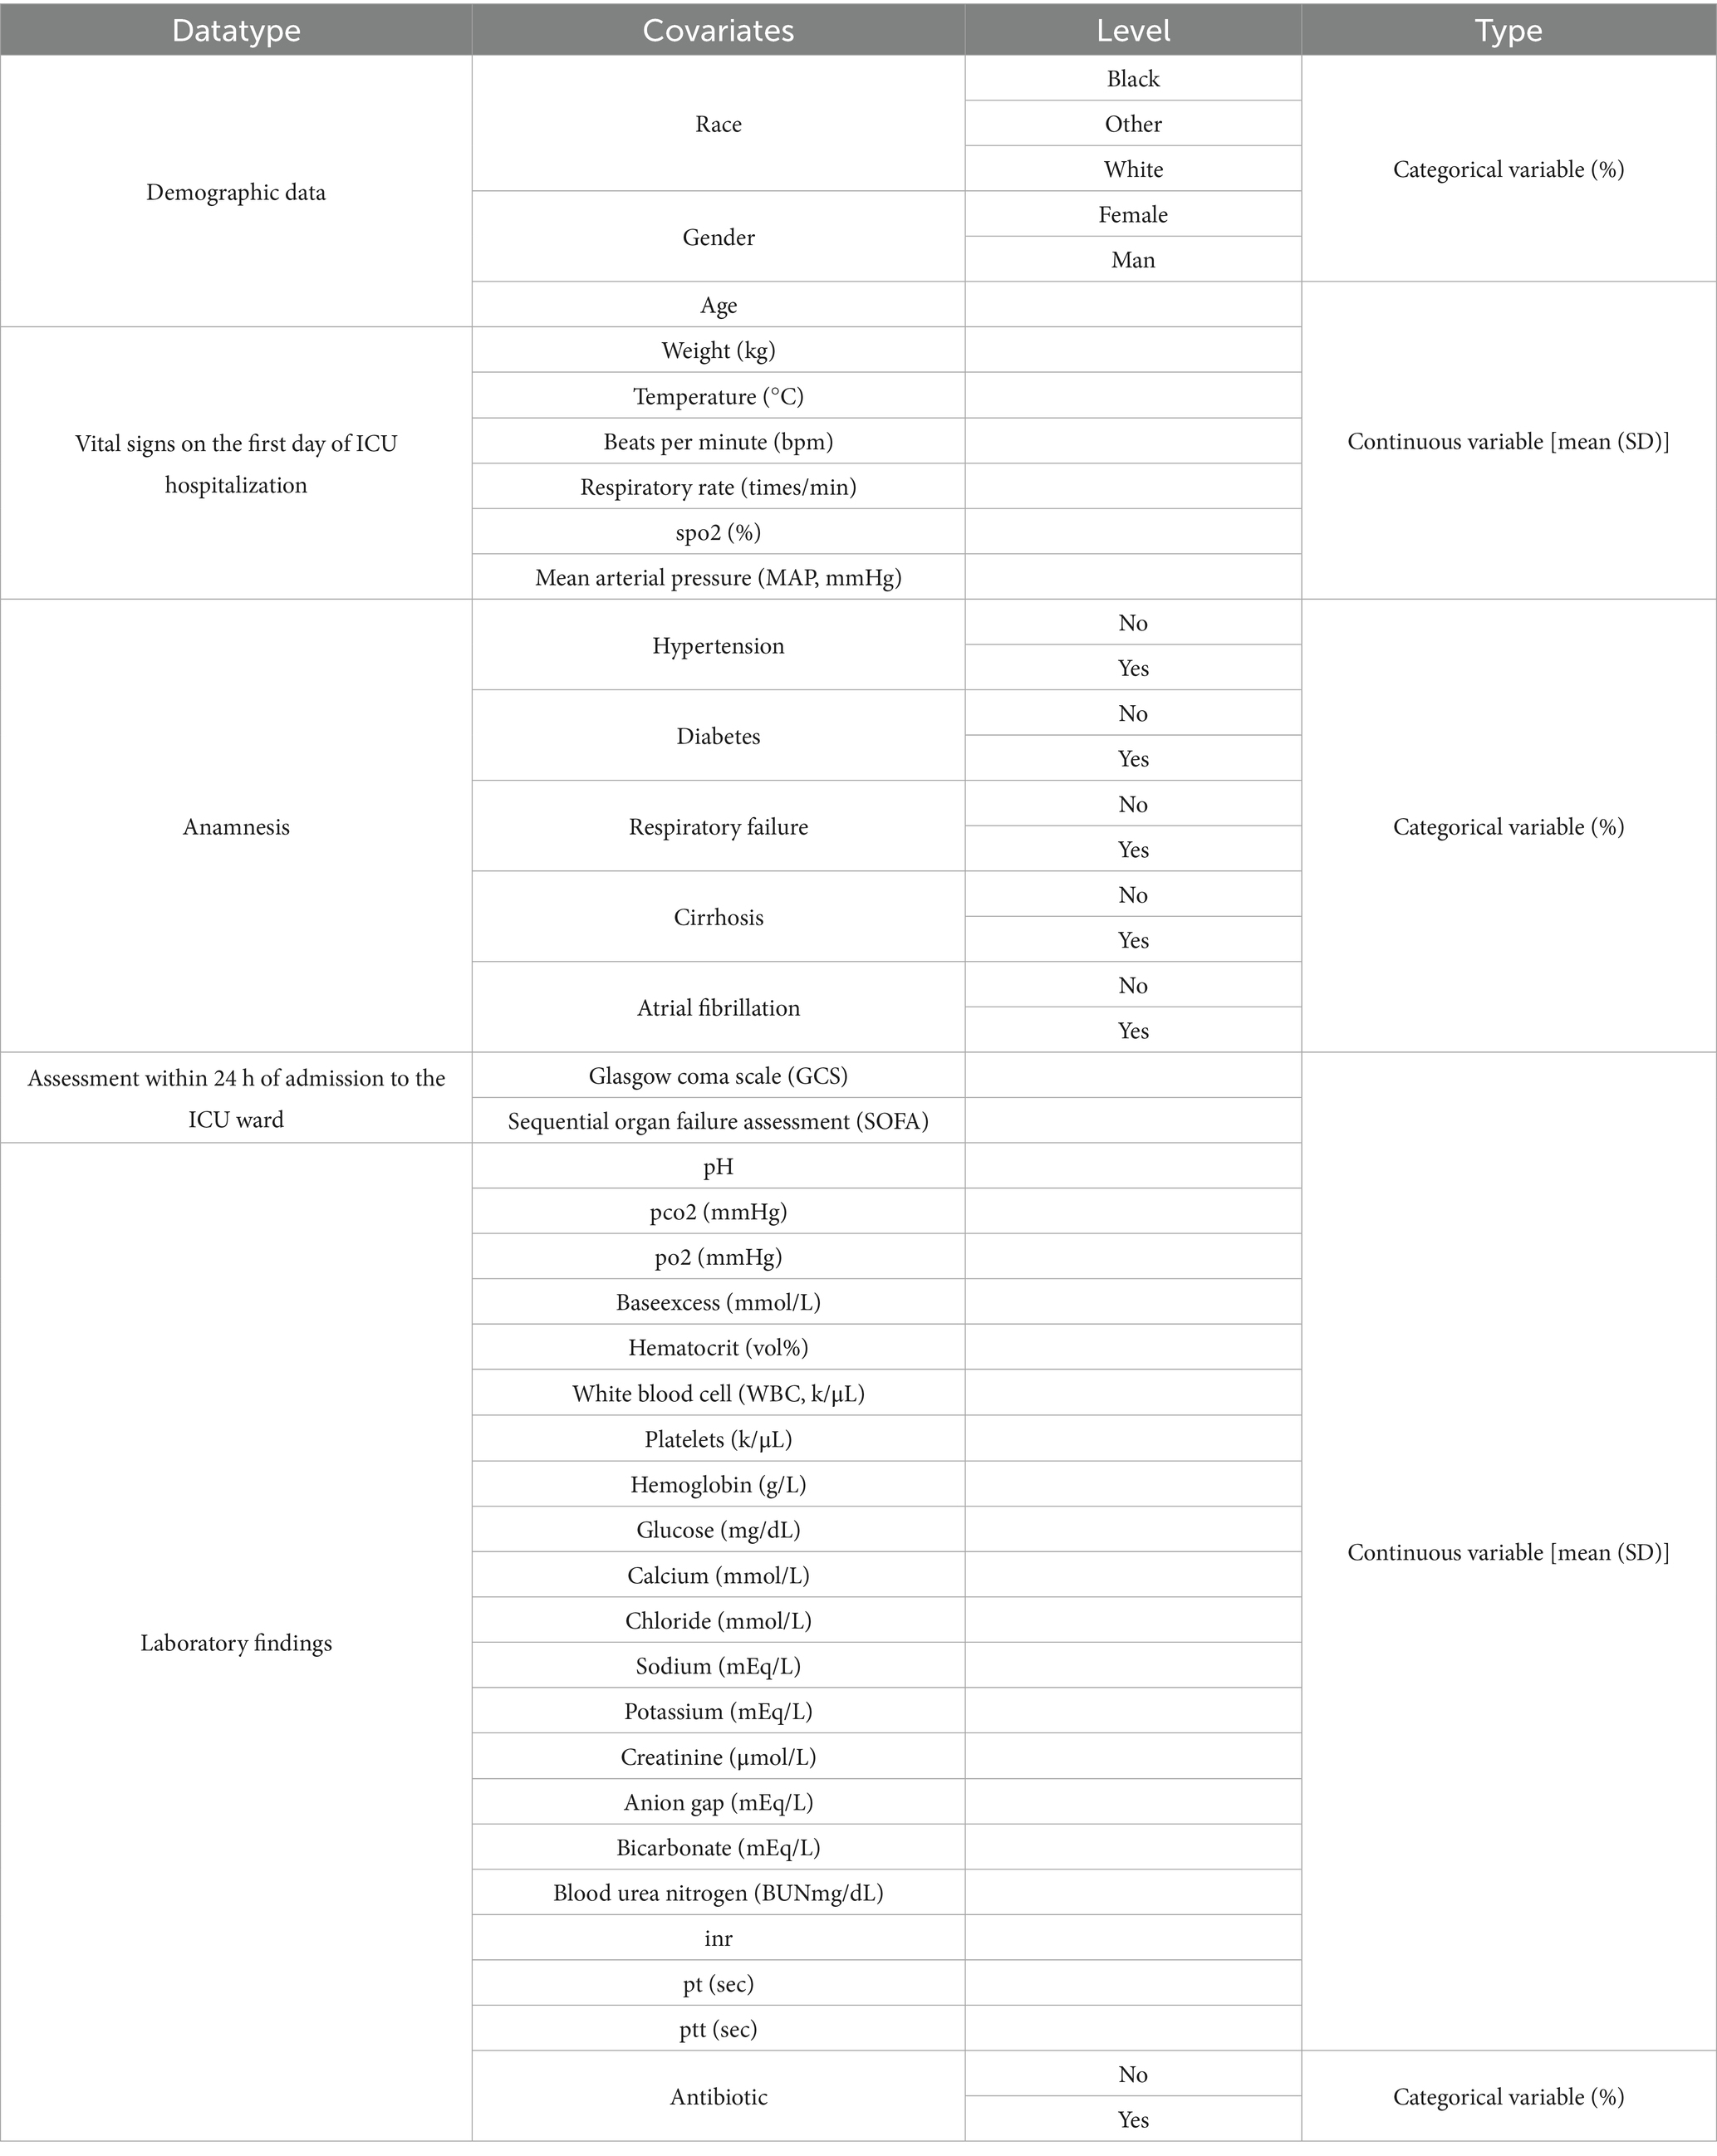
Table 1. Baseline characteristics.
2.3 Correlation analysis
To identify covariates associated with the prognosis of PD, the survival package (version 0.4.9) (17) was used to perform univariate Cox regression analysis (hazard ratio (HR) ≠ 1, p < 0.05). The results were visualized on forest plots using the forestplot package (version 3.1.3) (18). The covariates selected from the univariate analysis were subjected to a proportional hazard (PH) assumption test (p > 0.05) to identify candidate covariates associated with prognosis. Finally, the glmnet package (version 4.1.4) (18) was used to perform LASSO regression. The coefficients of the features that were strongly correlated with the disease were moderately shrunk, while the coefficients of the features with weak correlations were shrunk to zero, thus achieving feature selection. The LASSO regression model was obtained through 10-fold cross-validation, when the model error rate was the smallest, the covariates whose variable coefficients were not penalized to 0 were selected as candidate covariates.
2.4 Identification of key covariates and construction of a nomogram
Key covariates significantly associated with PD outcomes were identified through multivariate Cox proportional hazards regression analysis using the R package “survival” v 3.7.0 (19), based on variables selected via LASSO regression. Variables with statistically significant associations (HR ≠ 1, p < 0.05) were retained. Subsequently, a PH assumption test was conducted on the variables that passed the screening, and p-value > 0.05 indicated that these variables met the PH assumption and remained significantly associated with in-hospital mortality. To further evaluate the impact of the identified factors on PD patients, the rms package (version 6.5-0) (20) was used to construct a nomogram incorporating the key covariates for predicting the risk of in-hospital mortality in patients with PD admitted to the ICU. The total score was calculated by converting the regression coefficients of each risk factor into scores and then summing up these scores. Higher total scores corresponded to higher predicted probabilities of in-hospital death. Subsequently, calibration curves and receiver operating characteristic (ROC) curves were plotted using the pROC package (version 1.18.0) (21) to evaluate the predictive performance of the nomogram. A nomogram model was constructed based on the core variables from the multivariate regression analysis. The values of each variable were converted into corresponding scores according to the regression coefficients and summed to obtain a total score, which was then mapped to the predicted probability of in-hospital death. Subsequently, the actual mortality rates in different predicted probability intervals were determined based on the patients’ actual outcomes. Finally, the R package “rms” was employed to plot a calibration curve, with the model-predicted probabilities on the x-axis and the actual observed probabilities of death on the y-axis. Moreover, a calibration curve was generated via 1,000-fold bootstrap resampling to mitigate overfitting.
2.5 Statistical analysis
All statistical analyses were performed in R (version 4.2.2), with statistical significance defined as a p-value of <0.05. Descriptive statistics for covariates were generated using the CreateTableOne function from the “tableone” R package (v 0.13.2) (see text footnote 2), which provides comprehensive summaries for both continuous and categorical variables. Shapiro–Wilk normality test was used for continuous variables. For between-group comparisons independent samples t-test (for normally distributed data) and Mann–Whitney U test (for non-normally distributed data) were performed, with statistical significance set at p < 0.05. Categorical variables were compared using the chi-square test (p < 0.05). To identify covariates associated with PD prognosis, univariate Cox regression analyses were performed using the survival package (version 0.4.9) (17), and LASSO regression was performed using the glmnet software package (version 4.1.4) (18). Finally, multivariate Cox proportional hazards regression analyses were performed using the R software package “survival” v 3.7.0 (19). Those variables of interest that were statistically significant (HR ≠ 1, p < 0.05) were retained to identify key covariates that were significantly associated with PD outcomes.
3 Results
3.1 Baseline characteristics
After analyzing the influence of covariates on patients with Parkinson’s disease, several variables were found to be significantly associated with in-hospital mortality. These included heart rate (beats per minute, p = 0.008), mean arterial pressure (p = 0.009), respiratory failure (p = 0.01), electrolyte imbalance (p = 0.017), bicarbonate levels (p = 0.005), blood urea nitrogen (p = 0.006), and SOFA score (p = 0.003) (Table 2). Analysis of the survival status of 143 patients revealed that the survival rate showed a downward trend over time (Figure 2).
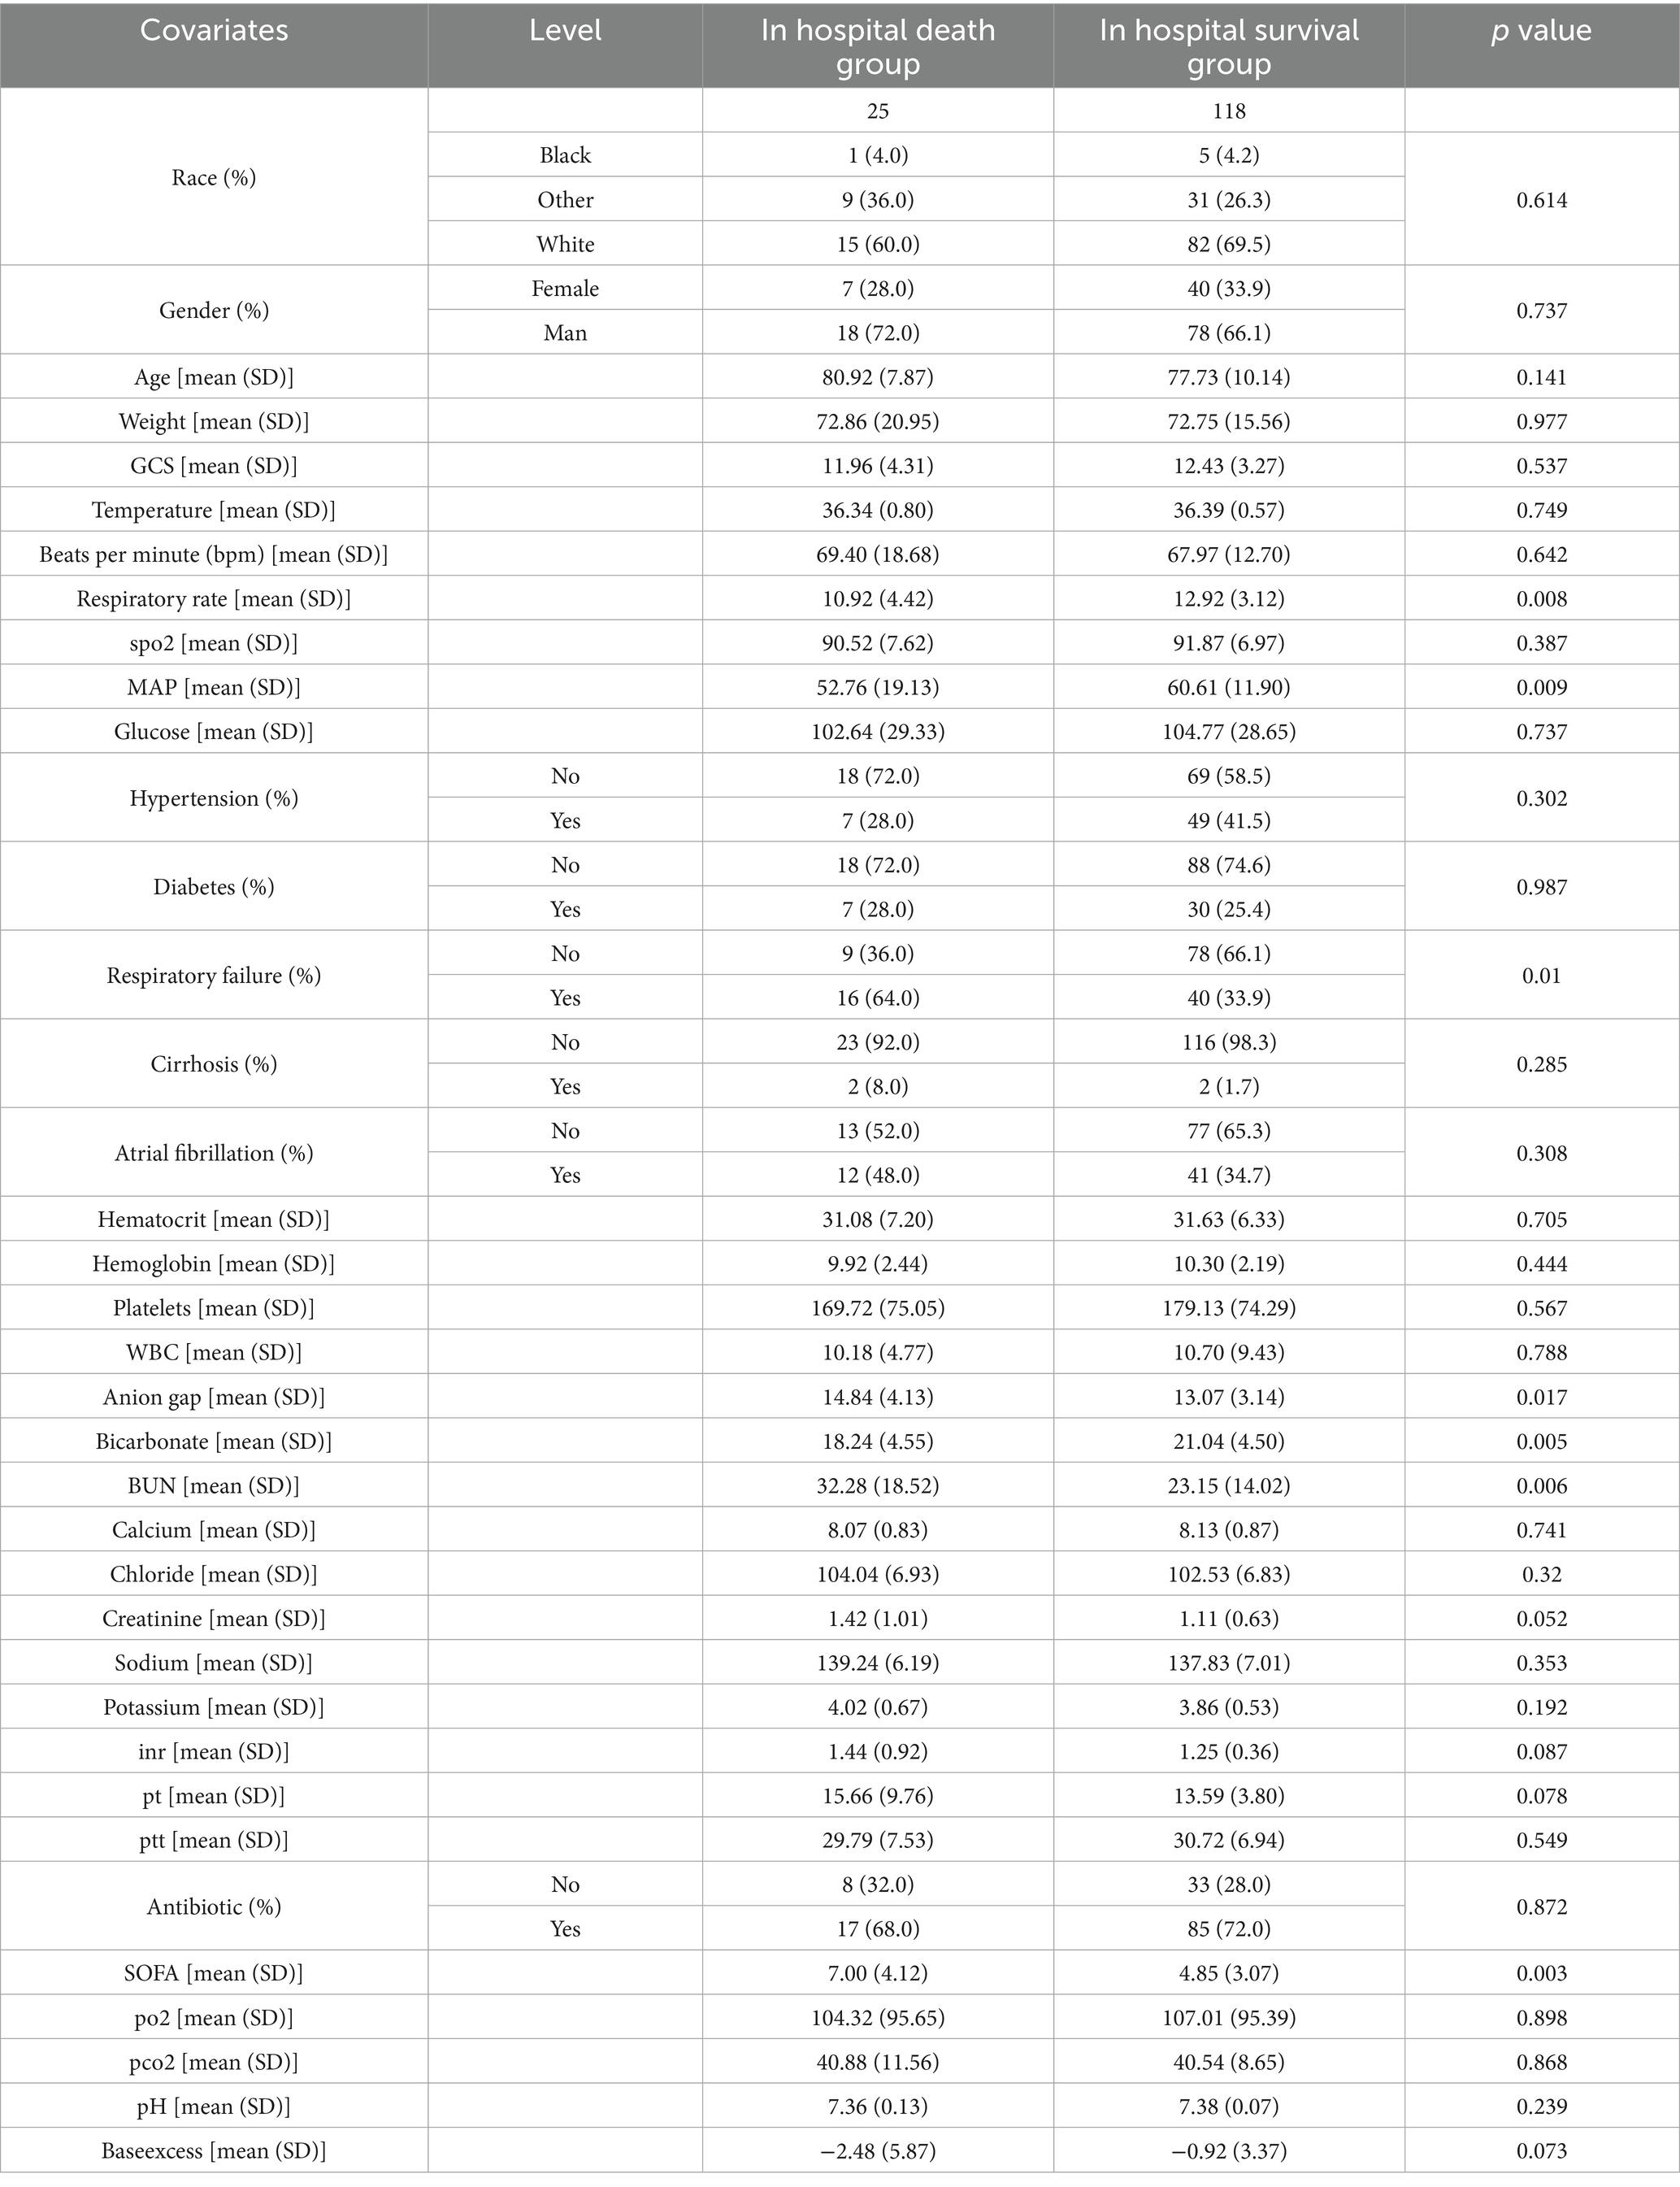
Table 2. Baseline characteristics of PD patients.
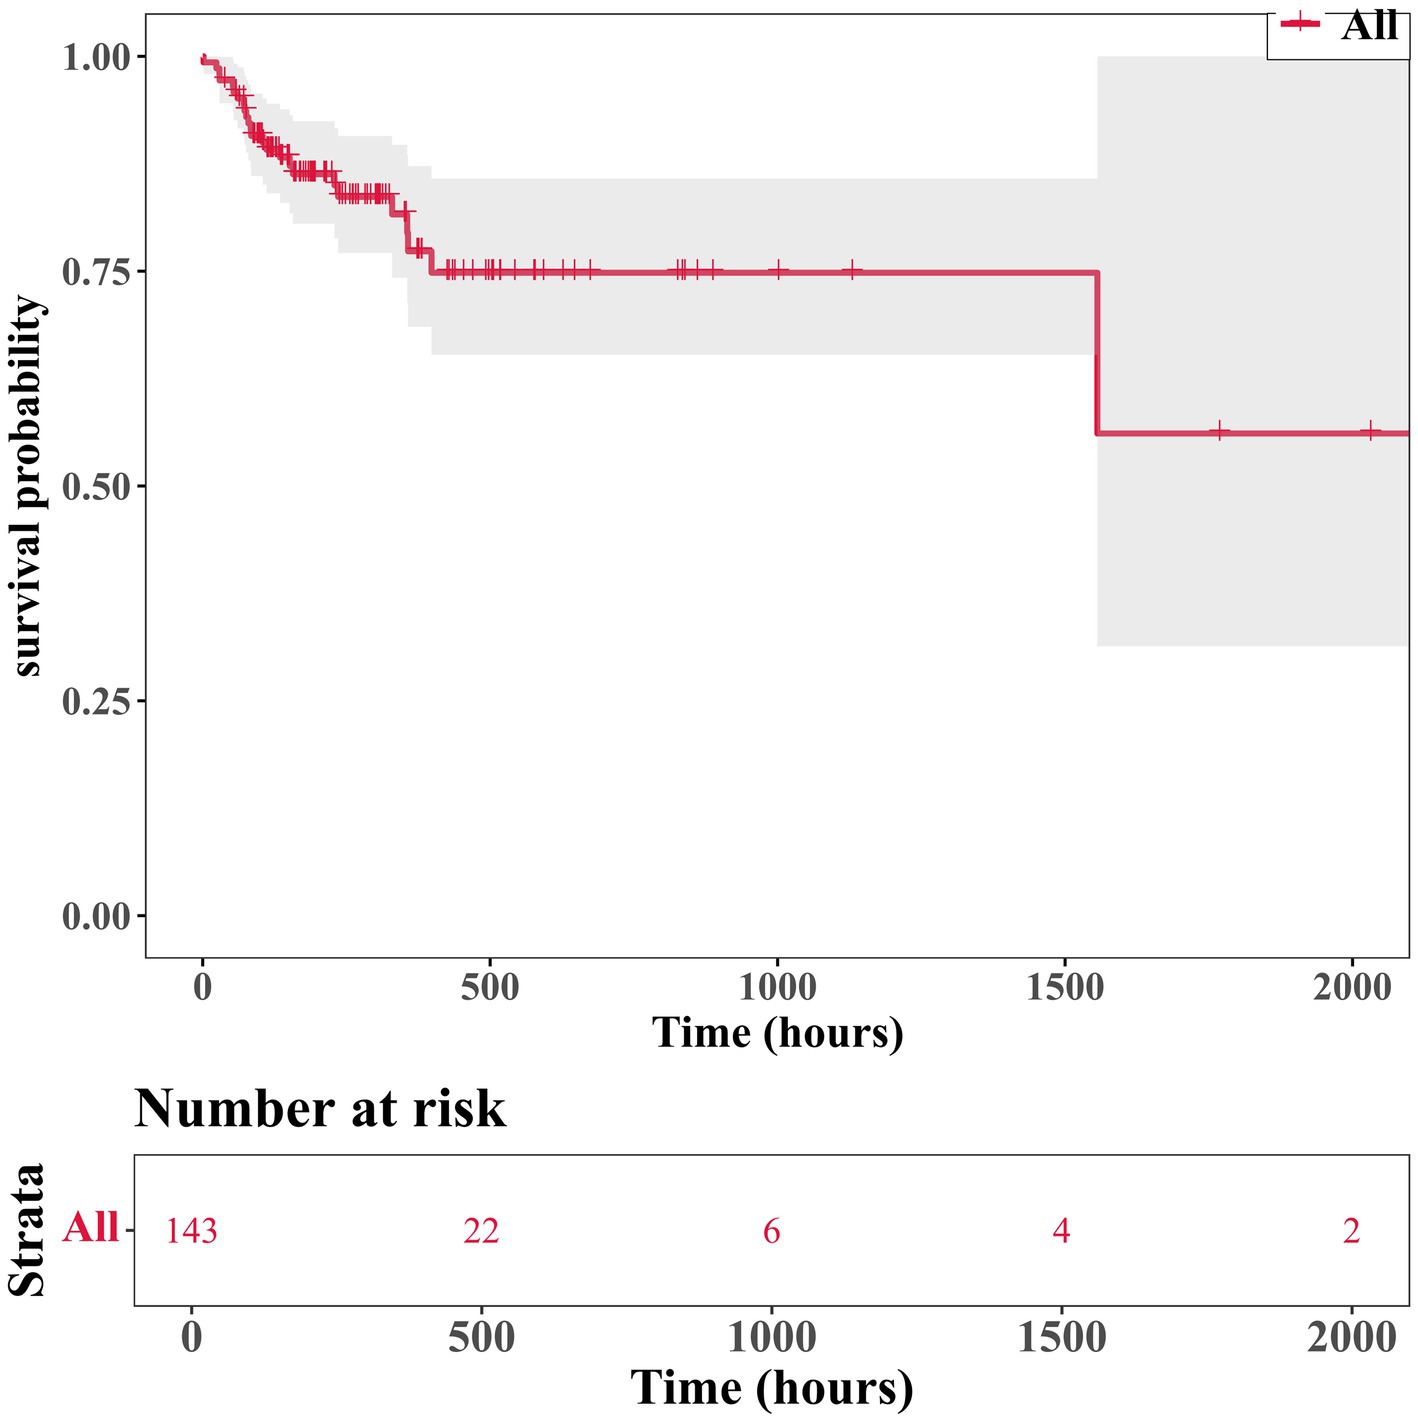
Figure 2. Kaplan–Meier curves of 143 patients.
3.2 Identification of four key covariates
Univariate Cox regression analysis showed that age, anion gap, base excess, bicarbonate levels, BUN levels, creatinine levels, MAP, respiratory rate, respiratory failure, and SOFA scores were associated with the prognosis of PD. The PH assumption test (Figure 3A) revealed age, SOFA scores, bicarbonate levels, BUN levels, creatinine levels, Glasgow Coma Scale (GCS) scores, and respiratory failure as candidate covariates associated with the prognosis of PD (Table 3). Further screening via LASSO regression (lambda.min = 0.01906274 [log lambda.min = −3.96]) revealed age, bicarbonate levels, BUN levels, and SOFA scores as candidate covariates (Figure 3B). Finally, multivariate Cox regression analysis and PH assumption test showed that age (HR = 1.0565, 95% confidence interval [CI] = 1.0065–1.1090, p < 0.05), bicarbonate levels (HR = 0.8988, 95% CI = 0.8310–0.9722, p < 0.05), BUN levels (HR = 1.0292, 95% CI = 1.0084–1.0503, p < 0.05), and SOFA scores (HR = 1.1510, 95% CI = 1.0324–1.2831, p < 0.05) were key covariates associated with the prognosis of PD (Figure 3C; Table 4). Notably, age, BUN levels, and SOFA scores acted as risk factors for PD (HR > 1).
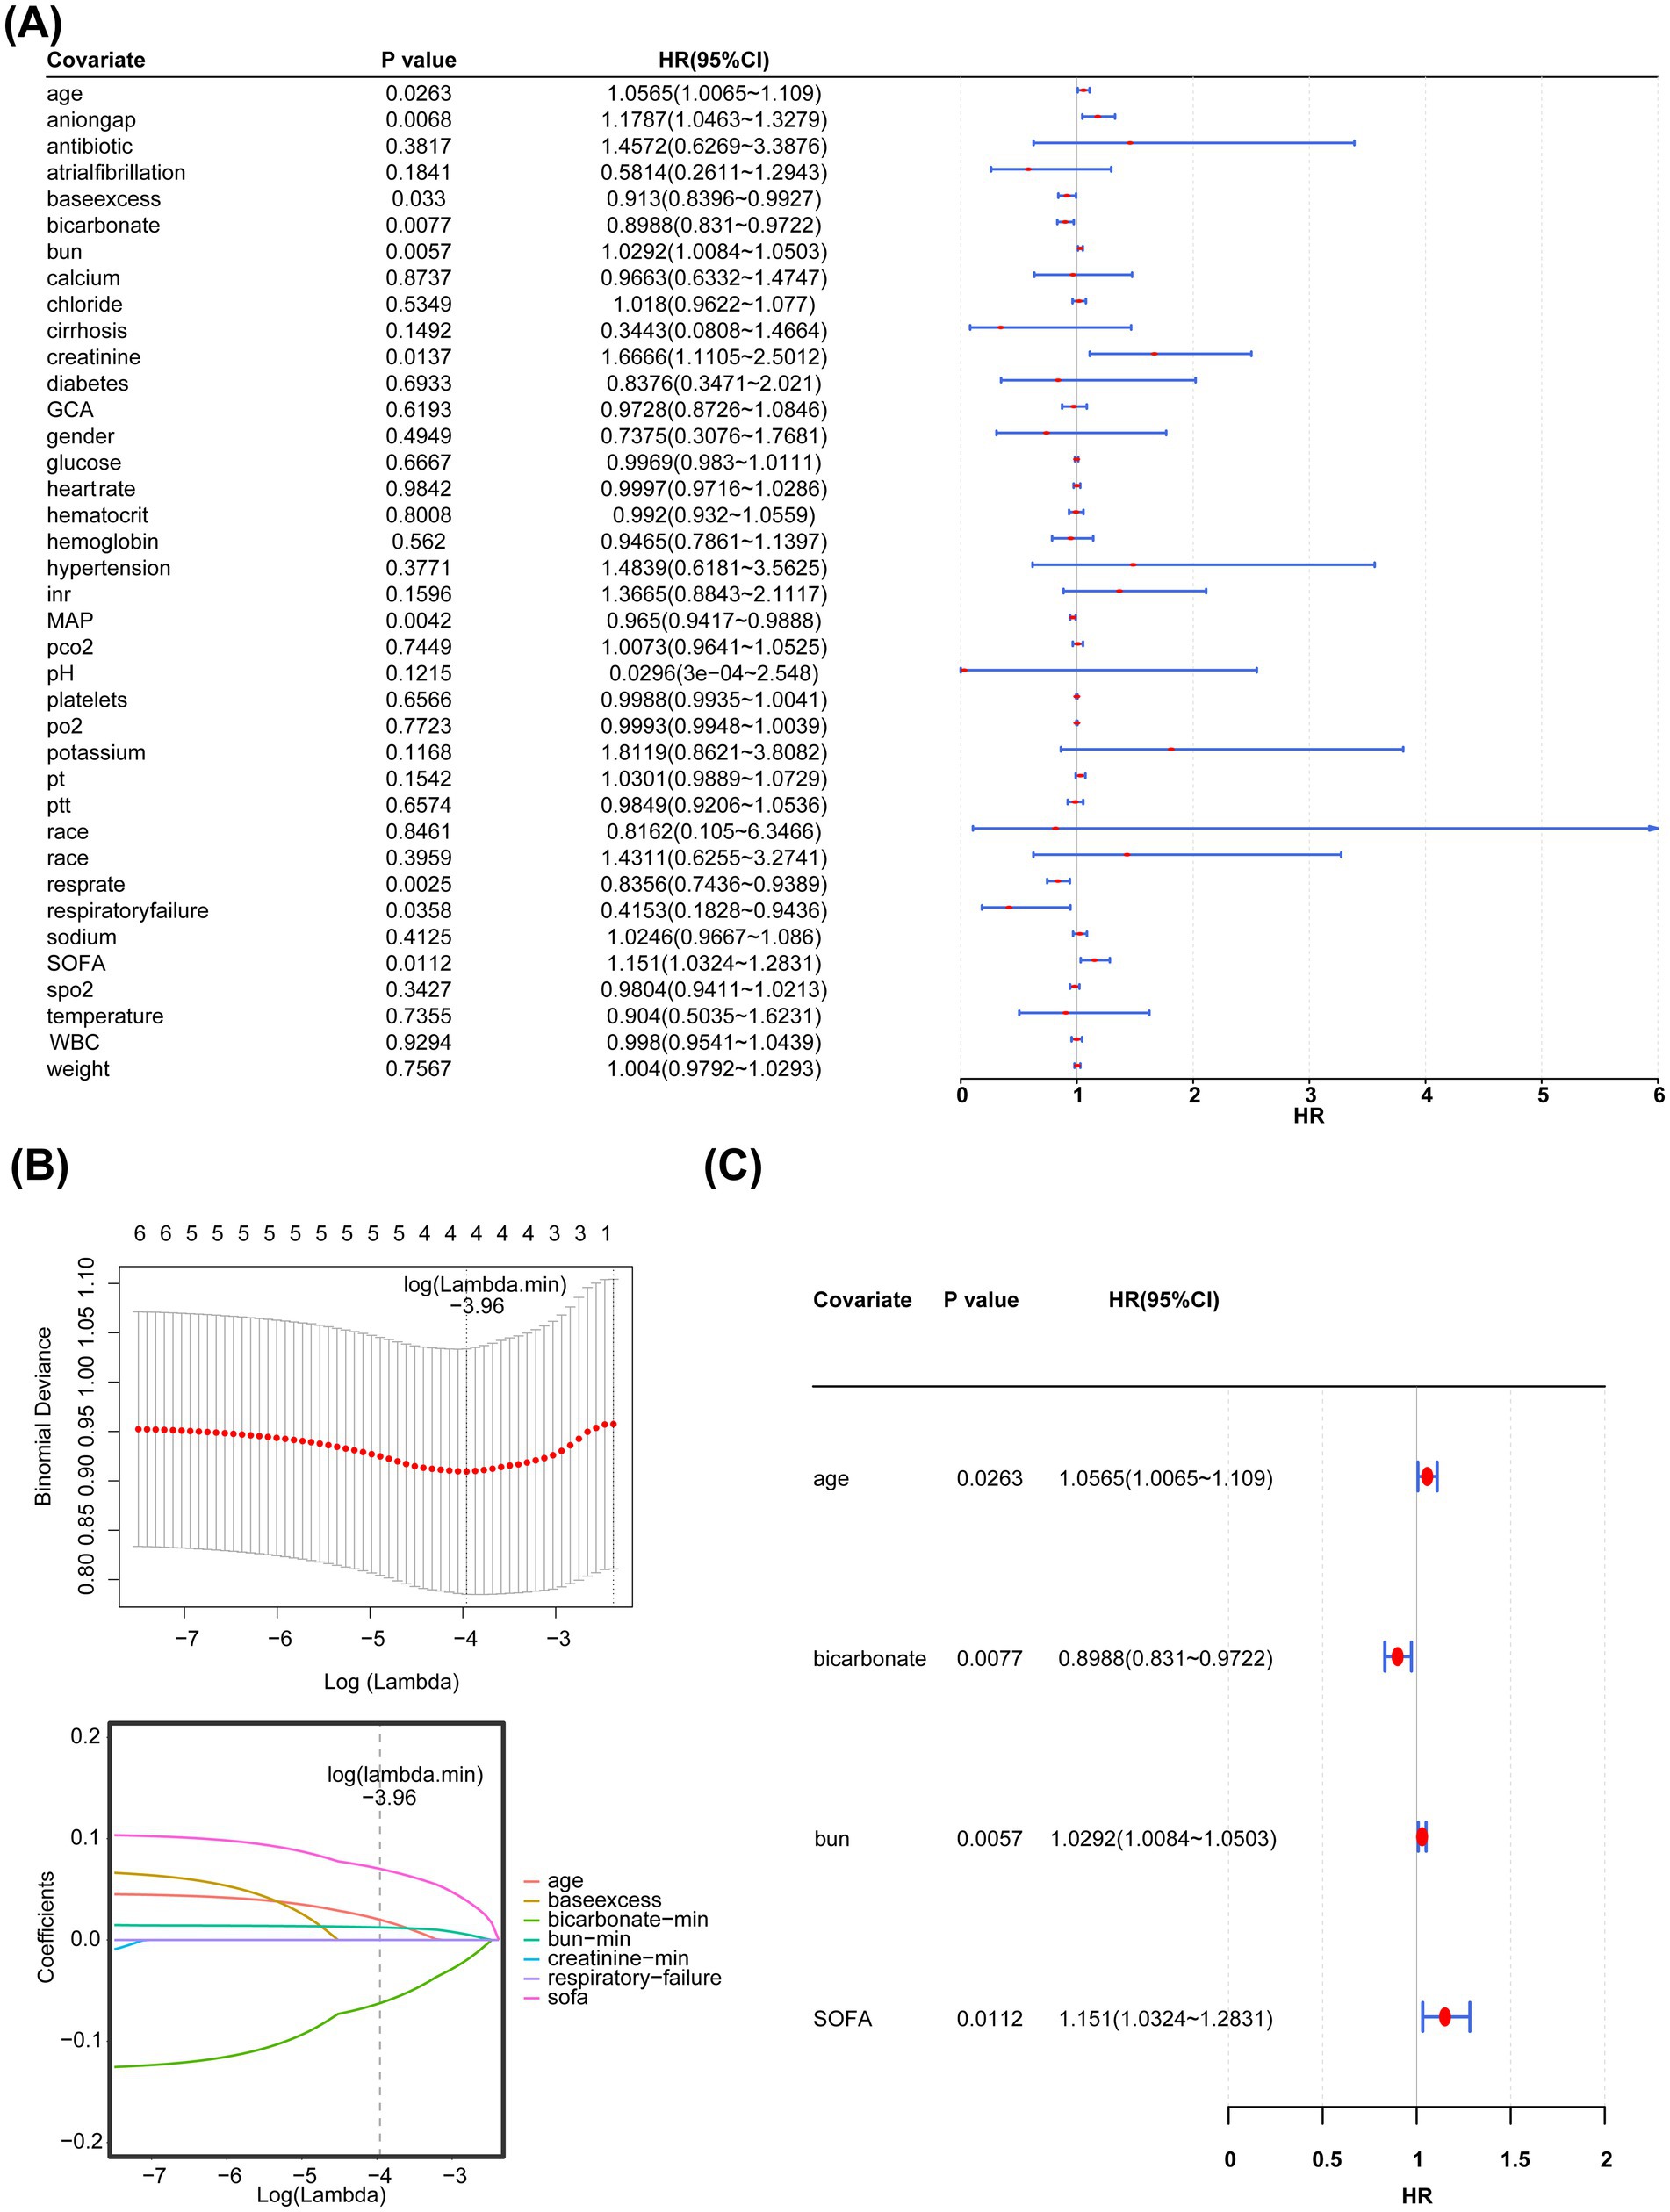
Figure 3. (A) Simple linear regression analysis. (B) Least absolute shrinkage and selection operator regression analysis (LASSO) regression analysis. The horizontal axis represents the logarithm of lambda, whereas the vertical axis represents the model error. (C) Multivariate regression analysis.
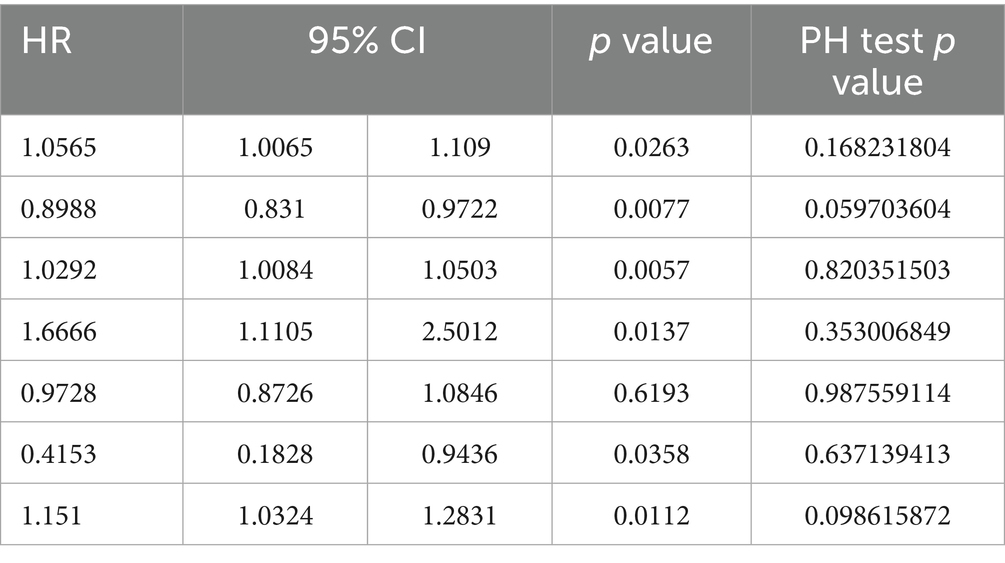
Table 3. PH assumption test of candidate feature covariates.
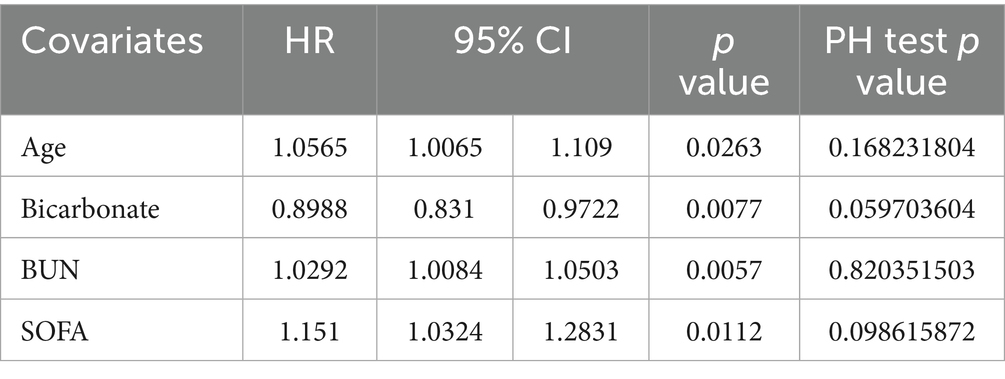
Table 4. PH assumption test of feature covariates.
3.3 Construction and evaluation of a nomogram
A nomogram incorporating the four key covariates was constructed to predict the risk of in-hospital mortality in patients with PD (Figure 4A). Calibration curves demonstrated that the predicted value and the reference line overlapped well (Figure 4B), and the area under the ROC curve (AUC) was 0.709 (Figure 4C). These findings indicated that the nomogram had good accuracy in predicting the risk of in-hospital mortality in patients with PD. Furthermore, DCA showed that the net benefit of the nomogram was >0 and was higher than that of the events wherein all or none of the patients died (Figure 4D). Altogether, the nomogram demonstrated good performance in predicting the risk of in-hospital mortality in patients with PD, representing a new clinical decision-making tool in the management of patients with PD.
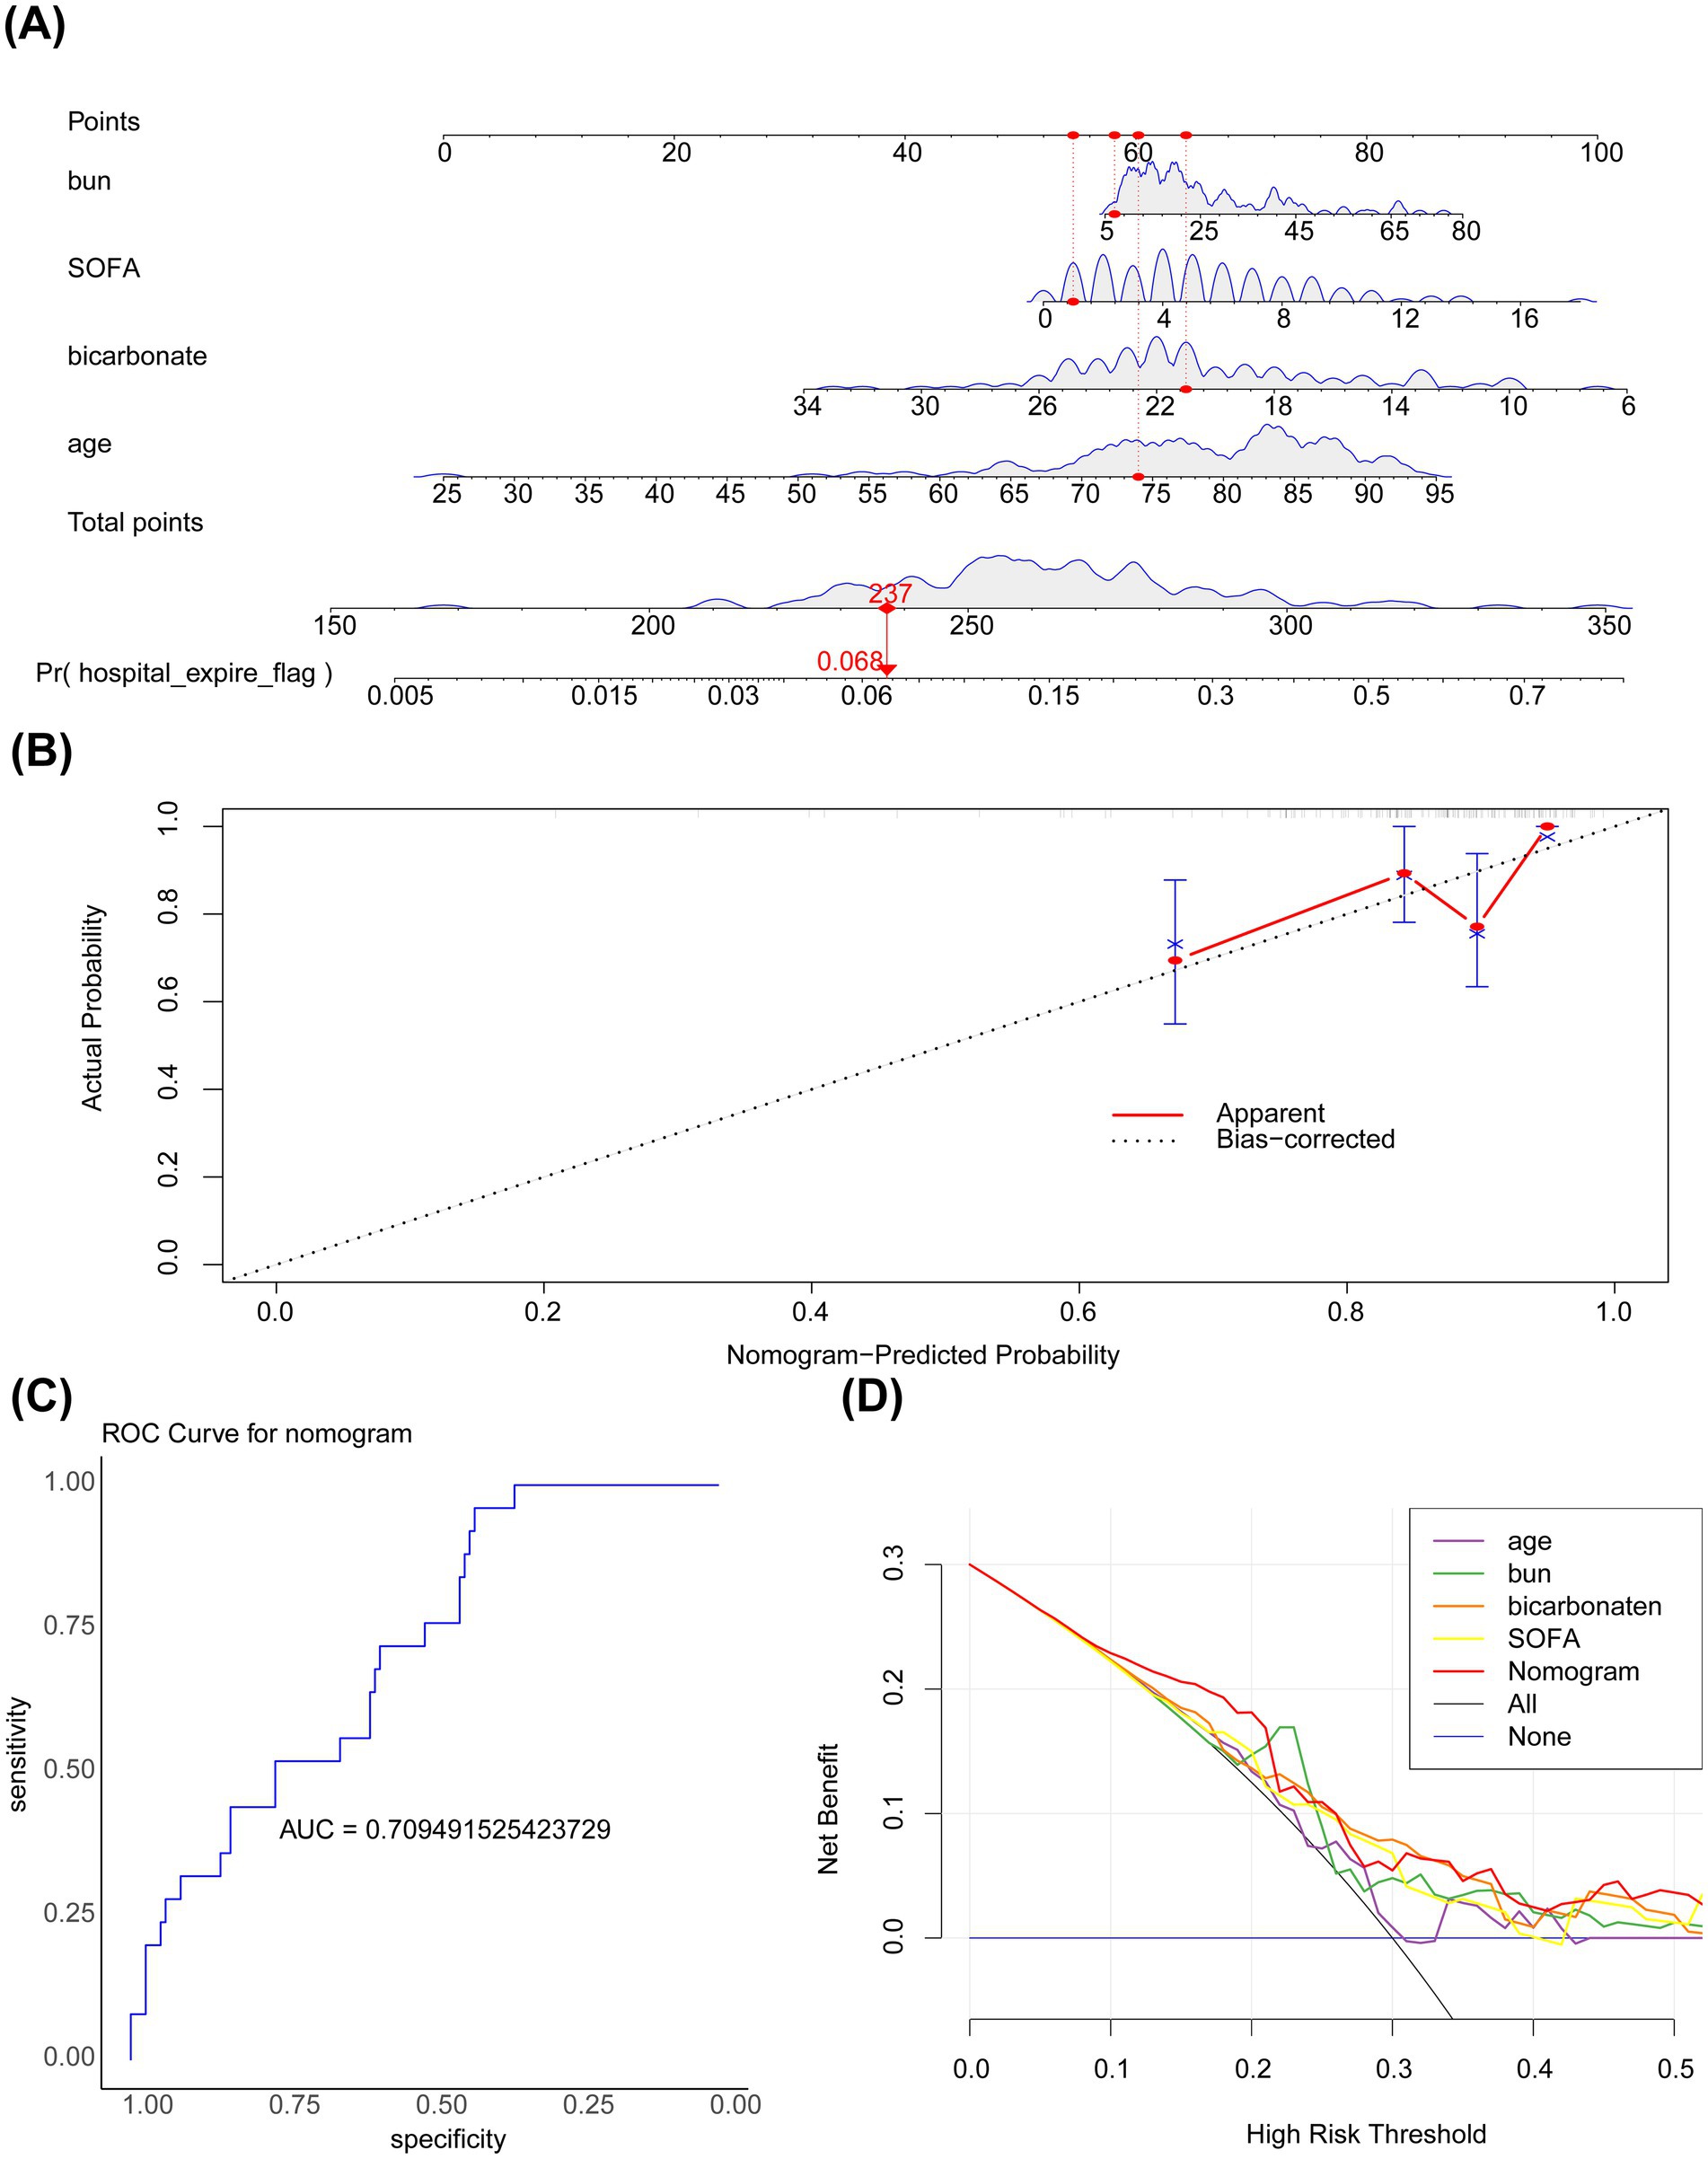
Figure 4. (A) Nomogram. The horizontal axis represents the logarithm of lambda, whereas the vertical axis represents the model error. The nomogram is used to predict the risk of in-hospital mortality in patients with PD admitted to the ICU. The bumps in the figure represent subtle variations in the net benefit of model predictions across different threshold probabilities. (B) Calibration curve. The horizontal axis represents the predicted event rate, whereas the vertical axis represents the actual event rate. The straight line passing through the origin of the coordinate axes with a slope of 1 serves as the reference line indicating that the predicted probability of the nomogram is exactly the same as the true probability. The closer the predicted value is to the reference line, the more reliable the result is with both ranging from 0 to 1. The ideal prediction corresponds to the black dashed line. (C) ROC curve. (D) Decision curve analysis. The horizontal axis represents the risk threshold (Pt), whereas the vertical axis represents the net benefit (NB) after subtracting the harm from the benefit. The line segments in the graph represent the net benefit at each risk threshold. The black line parallel to the horizontal axis indicates that all samples are negative, meaning no intervention is applied to any patient. Therefore, the net benefit is 0. The sloping gray line represents the net benefit when all samples are positive, meaning everyone receives the intervention.
4 Discussion
PD is a common neurodegenerative disorder characterized by the gradual loss of DA neurons in the substantia nigra, leading to the emergence of motor and non-motor symptoms (1). Given the increasing incidence and mortality rates of PD, the necessity of identifying predictive factors for prognosis is becoming increasingly prominent. In this study, we analyzed the clinical data of patients with PD from the MIMIC-IV database to identify risk factors for in-hospital mortality in patients with PD and construct a predictive model based on these factors, providing a clinical risk assessment and decision-making tool (3). Age, bicarbonate levels, BUN levels, and SOFA scores were identified as key covariates associated with the prognosis of PD.
Age, an important risk factor for PD, was found to be associated with the prognosis of PD in this study. In particular, older patients with PD were found to have a higher risk of in-hospital mortality, a finding consistent with that of previous studies that have emphasized the important role of age in the prognosis of PD (4). Although age is positively associated with the risk of PD, the association between age and in-hospital mortality in patients with PD was not significant. These findings suggest that factors other than age play a crucial role in the progression and prognosis of PD (12).
To the best of our knowledge, this study is the first to demonstrate that blood bicarbonate levels are significantly associated with the risk of in-hospital mortality in patients with PD. This association may be attributed to the role of bicarbonate in regulating blood pH, participating in energy metabolism, and contributing to nervous system function (22). In patients with PD, abnormal bicarbonate levels may reflect metabolic disturbances, which may be closely related to the severity and prognosis of the disease. In patients with metabolic acidosis, serum bicarbonate concentrations are associated with inflammatory responses, such as decreased secretion of IL-10 (23). In addition, changes in the concentration of bicarbonate can affect the concentration of hydrogen ions in the central nervous system, affecting the respiratory rate (24). However, the specific underlying mechanism warrants further investigation.
We found that BUN, an important indicator of renal function, was associated with the prognosis of PD (14). Studies have shown that decreased kidney function, such as a decrease in the estimated glomerular filtration rate (eGFR), is associated with an increased risk of PD (25). In patients with PD, impaired renal function may affect drug metabolism, especially the pharmacokinetics of dopamine agonists, which may lead to improper drug dose adjustment and subsequently influence the therapeutic effect (26). Yang et al. found that BUN levels were significantly higher in patients with PD than in control individuals, suggesting that BUN levels serve as a promising biomarker for PD (27). In addition, elevated BUN levels have been associated with a poor prognosis in patients with acute exacerbation of chronic obstructive pulmonary disease (COPD) (28). Therefore, monitoring and regulating kidney function in patients with PD may help improve their long-term survival.
SOFA score, a tool to assess the extent of organ dysfunction in critically ill patients, was identified as a key covariate associated with the prognosis of PD in this study (15). In particular, patients with PD with higher SOFA scores were at higher risk for in-hospital mortality. This finding highlights the importance of a comprehensive assessment of multiple organ dysfunction in the management of patients with PD (16).
The MIMIC-IV database, a public resource containing the clinical data of patients admitted to ICUs, provides a unique opportunity to explore the characteristics and prognostic factors of diseases, such as PD, in real-world clinical settings (29). Compared with data derived from traditional hospital- or clinic-based studies, the data found in the MIMIC-IV database are comprehensive and diverse and better reflect the overall disease burden and treatment response of patients with PD. In this study, we developed a predictive nomogram incorporating the four key covariates associated with the prognosis of PD. This nomogram showed good accuracy and clinical applicability in predicting the risk of in-hospital mortality in patients with PD, demonstrating the value of using databases such as MIMIC-IV for clinical research.
This study identified four key covariates associated with inpatient mortality in critically ill patients with Parkinson’s disease (PD) by analyzing clinical data from the MIMIC-IV database: age, bicarbonate levels, blood urea nitrogen (BUN) levels, and SOFA scores. These covariates influence the prognosis of PD patients through different biological pathways and clinical processes. Increasing age is associated with a decline in physiological function and a higher prevalence of comorbidities (30), while PD-specific pathophysiological changes further amplify this risk. For example, motor impairments due to neuronal degeneration can compromise airway clearance, increasing the risk of aspiration and pneumonia (31). In addition, dysphagia-related malnutrition and dehydration can exacerbate renal dysfunction (32). Abnormal bicarbonate levels may reflect underlying metabolic disturbances and possible respiratory muscle weakness, which can lead to hypoventilation (33). The SOFA score provides a comprehensive assessment of the severity of multiple organ dysfunction, integrating the impact of these interconnected factors (34). Notably, neurodegeneration in PD patients may alter drug pharmacokinetics, potentially affecting the interpretation of markers such as BUN (35). These findings underscore the importance of implementing personalized management strategies for critically ill PD patients, including early assessment of swallowing function, enhanced airway management, and close monitoring of hemodynamic and metabolic parameters. It should be noted that since non-PD critically ill patients were not included as controls in this study, the mechanistic impacts of these key covariates on PD need to be verified by incorporating controls in future studies.
This study not only introduces a tool for risk assessment of patients with PD in clinical settings but also provides a valuable reference for future research in this field. However, several limitations of this study should be acknowledged. First, owing to the limitations of data sources, the findings of this study should be validated in other populations and clinical settings. Second, this study focused only on hospitalized PD patients and lacked certain clinical indicators, thus limiting our understanding of long-term prognosis and disease progression. The understanding of long-term prognosis and disease progression in these patients remains limited. The database currently lacks comprehensive details regarding the duration and progression of diseases, and there is a limited number of samples that include patients with comorbidities, which has resulted in an absence of thorough analysis concerning their effects. Additionally, the study did not incorporate non-Parkinson’s Disease (PD) critically ill patients as a control group, which could impede our ability to ascertain whether the identified risk factors are unique to PD. This study is constrained by a relatively small sample size and lack of real-world clinical validation for the predictive nomogram, which hinders comprehensive risk factor analysis for in-hospital mortality and compromises the reliability of conclusions. The MIMIC-IV database lacks key information, such as indicators of PD severity, equivalent daily doses of levodopa, and complete records of PD-related comorbidities. These gaps may lead to the omission of PD-specific risk factors or underestimation of interactions between covariates.
To address these limitations, future studies should expand the sample size, include non-PD critically ill patients as a comparison group, and incorporate additional clinical indicators and biomarkers—such as hemodynamic parameters and laboratory values—to enable a more thorough assessment of PD patients’ clinical characteristics. Enhancing the dataset to include complete SOFA scores and multidimensional features of PD is crucial for validating the external applicability of the model. Multicenter prospective studies are also needed to generate high-quality datasets for model refinement. Collaborations with PD-specific databases could further enrich the data by integrating variables such as PD severity, medication regimens, and comorbidities. Multicenter cohort studies should be conducted to address data gaps and clarify the impact of unmeasured factors on ICU outcomes, thereby refining risk prediction models for clinical stratified management. Additionally, long-term follow-up of PD patients is essential to better evaluate disease progression and prognosis, providing clinicians with a stronger evidence base for optimizing care strategies. Furthermore, we plan to include non-PD critically ill patients using MIMIC data for comparative analysis, which will help clarify risk factors that are specific to PD and ultimately offer more valuable insights for clinical decision-making.
Despite the abovementioned limitations, the findings of this study have important clinical implications. Identifying key prognostic factors may facilitate the development of personalized treatment and management strategies for Parkinson’s disease (PD) patients. However, these prognostic mechanisms require further investigation. In addition, this study highlights the potential use of large medical databases in clinical research, providing new methods and tools for future research on PD. With the continuous development of medical information technology, more data resources will be used to develop better healthcare services and improve treatment outcomes for patients with PD.
This retrospective study demonstrated the effects of various clinical characteristics on the clinical outcomes of PD. Initially, patients with PD selected from the MIMIC-IV database were divided into the in-hospital death and survival groups, and various clinical characteristics were compared between the two groups. Subsequently, age, bicarbonate levels, BUN levels, and SOFA scores were identified as four key covariates associated with the prognosis of PD. Finally, a nomogram incorporating these covariates was established to predict the risk of in-hospital mortality in patients with PD. The nomogram showed good predictive accuracy, providing a novel and reliable clinical decision-making tool for the management of patients with PD.
Data availability statement
The original contributions presented in the study are included in the article/Supplementary material, further inquiries can be directed to the corresponding author.
Author contributions
LL: Data curation, Formal analysis, Methodology, Project administration, Writing – original draft, Investigation, Conceptualization. YC: Data curation, Investigation, Writing – original draft, Formal analysis, Methodology, Project administration, Conceptualization. HZ: Data curation, Formal analysis, Investigation, Methodology, Writing – original draft. RD: Data curation, Investigation, Methodology, Writing – review & editing. YL: Data curation, Methodology, Formal analysis, Project administration, Resources, Supervision, Validation, Writing – original draft, Writing – review & editing, Conceptualization.
Funding
The author(s) declare that no financial support was received for the research and/or publication of this article.
Acknowledgments
Here, we extend our sincere gratitude to all individuals who have contributed to this research. Special thanks go to sun H, who provided invaluable guidance and assistance in the research design and data analysis. Lastly, we are grateful to all reviewers for their meticulous feedback, which greatly enhanced the quality of our paper. We express our deepest respect to everyone who has supported and helped us.
Conflict of interest
The authors declare that the research was conducted in the absence of any commercial or financial relationships that could be construed as a potential conflict of interest.
Generative AI statement
The authors declare that no Gen AI was used in the creation of this manuscript.
Publisher’s note
All claims expressed in this article are solely those of the authors and do not necessarily represent those of their affiliated organizations, or those of the publisher, the editors and the reviewers. Any product that may be evaluated in this article, or claim that may be made by its manufacturer, is not guaranteed or endorsed by the publisher.
Supplementary material
The Supplementary material for this article can be found online at: https://www.frontiersin.org/articles/10.3389/fneur.2025.1545126/full#supplementary-material
Footnotes
References
1. Pajares, M, IR, A, Manda, G, Boscá, L, and Cuadrado, A. Inflammation in Parkinson's disease: mechanisms and therapeutic implications. Cells. (2020) 9:687. doi: 10.3390/cells9071687
2. Radlicka-Borysewska, A, Jabłońska, J, Lenarczyk, M, Szumiec, Ł, Harda, Z, Bagińska, M, et al. Non-motor symptoms associated with progressive loss of dopaminergic neurons in a mouse model of Parkinson's disease. Front Neurosci. (2024) 18:1375265. doi: 10.3389/fnins.2024.1375265
3. Hayes, MT. Parkinson's disease and parkinsonism. Am J Med. (2019) 132:802–7. doi: 10.1016/j.amjmed.2019.03.001
4. Tolosa, E, Garrido, A, Scholz, SW, and Poewe, W. Challenges in the diagnosis of Parkinson's disease. Lancet Neurol. (2021) 20:385–97. doi: 10.1016/s1474-4422(21)00030-2
5. Seppi, K, Ray Chaudhuri, K, Coelho, M, Fox, SH, Katzenschlager, R, Perez Lloret, S, et al. Update on treatments for nonmotor symptoms of Parkinson's disease-an evidence-based medicine review. Mov Disord. (2019) 34:180–98. doi: 10.1002/mds.27602
6. Jia, H, Yin, K, Zhao, J, and Che, F. Association of inflammation/nutrition-based indicators with Parkinson's disease and mortality. Front Nutr. (2024) 11:1439803. doi: 10.3389/fnut.2024.1439803
7. Gonzalez, MC, Dalen, I, Maple-Grødem, J, Tysnes, OB, and Alves, G. Parkinson's disease clinical milestones and mortality. NPJ Parkinsons Dis. (2022) 8:58. doi: 10.1038/s41531-022-00320-z
8. Kang, K, and Gu, Y. A blockwise mixed membership model for multivariate longitudinal data: Discovering clinical heterogeneity and identifying Parkinson's disease subtypes (2024). Available at: https://arxiv.org/abs/2410.01235
9. Won, JH, Byun, SJ, Oh, BM, Kim, HJ, Park, SJ, and Seo, HG. Pneumonia risk and its associated factors in Parkinson's disease: a National Database Study. J Neurol Sci. (2020) 415:116949. doi: 10.1016/j.jns.2020.116949
10. Aamodt, WW, Dahodwala, N, Bilker, WB, Farrar, JT, and Willis, AW. Unique characteristics of end-of-life hospitalizations in Parkinson disease. Front Aging Neurosci. (2023) 15:1254969. doi: 10.3389/fnagi.2023.1254969
11. Freeman, WD, Tan, KM, Glass, GA, Linos, K, Foot, C, and Ziegenfuss, M. ICU management of patients with Parkinson's disease or parkinsonism. Curr Anaesth Crit Care. (2007) 18:227–36. doi: 10.1016/j.cacc.2007.09.007
12. Pineda-Pardo, JA, Sánchez-Ferro, Á, Monje, MHG, Pavese, N, and Obeso, JA. Onset pattern of nigrostriatal denervation in early Parkinson's disease. Brain. (2022) 145:1018–28. doi: 10.1093/brain/awab378
13. Yang, R, Huang, T, Shen, L, Feng, A, Li, L, Li, S, et al. The use of antibiotics for ventilator-associated pneumonia in the MIMIC-IV database. Front Pharmacol. (2022) 13:869499. doi: 10.3389/fphar.2022.869499
14. Johnson, AEW, Bulgarelli, L, Shen, L, Gayles, A, Shammout, A, Horng, S, et al. MIMIC-IV, a freely accessible electronic health record dataset. Sci Data. (2023) 10:1. doi: 10.1038/s41597-022-01899-x
15. Terracciano, A, Luchetti, M, Karakose, S, Stephan, Y, and Sutin, AR. Loneliness and risk of Parkinson disease. JAMA Neurol. (2023) 80:1138–44. doi: 10.1001/jamaneurol.2023.3382
16. Chen, Z, Wu, B, Li, G, Zhou, L, Zhang, L, and Liu, J. Age and sex differentially shape brain networks in Parkinson's disease. CNS Neurosci Ther. (2023) 29:1907–22. doi: 10.1111/cns.14149
17. Shi, Y, Wang, Y, Dong, H, Niu, K, Zhang, W, Feng, K, et al. Crosstalk of ferroptosis regulators and tumor immunity in pancreatic adenocarcinoma: novel perspective to mRNA vaccines and personalized immunotherapy. Apoptosis. (2023) 28:1423–35. doi: 10.1007/s10495-023-01868-8
18. Li, Y, Lu, F, and Yin, Y. Applying logistic LASSO regression for the diagnosis of atypical Crohn's disease. Sci Rep. (2022) 12:11340. doi: 10.1038/s41598-022-15609-5
19. Núñez, E, Steyerberg, EW, and Núñez, J. Regression modeling strategies. Rev Esp Cardiol. (2011) 64:501–7. doi: 10.1016/j.recesp.2011.01.019
20. Liu, TT, Li, R, Huo, C, Li, JP, Yao, J, Ji, XL, et al. Identification of CDK2-related immune forecast model and ceRNA in lung adenocarcinoma, a Pan-Cancer analysis. Front Cell Dev Biol. (2021) 9:682002. doi: 10.3389/fcell.2021.682002
21. Lin, Z, He, Y, Wu, Z, Yuan, Y, Li, X, and Luo, W. Comprehensive analysis of copper-metabolism-related genes about prognosis and immune microenvironment in osteosarcoma. Sci Rep. (2023) 13:15059. doi: 10.1038/s41598-023-42053-w
22. Pisani, S, Gosse, L, Aarsland, D, Ray Chaudhuri, K, Ballard, C, Ffytche, D, et al. Parkinson's disease psychosis associated with accelerated multidomain cognitive decline. BMJ Ment Health. (2024) 27:1–10. doi: 10.1136/bmjment-2024-301062
23. Ori, Y, Zingerman, B, Bergman, M, Bessler, H, and Salman, H. The effect of sodium bicarbonate on cytokine secretion in CKD patients with metabolic acidosis. Biomed Pharmacother. (2015) 71:98–101. doi: 10.1016/j.biopha.2015.02.012
24. Hoop, B, Shih, VE, and Kazemi, H. Relationship between central nervous system hydrogen ion regulation and amino acid metabolism in hypercapnia, part II. Am Rev Respir Dis. (1985) 132:248–53. doi: 10.1164/arrd.1985.132.2.248
25. Peng, H, Wu, L, Chen, Q, Chen, S, Wu, S, Shi, X, et al. Association between kidney function and Parkinson's disease risk: a prospective study from the UK biobank. BMC Public Health. (2024) 24:2225. doi: 10.1186/s12889-024-19709-x
26. You, X, Wu, W, Xu, J, Jiao, Z, Ke, M, Huang, P, et al. Development of a physiologically based pharmacokinetic model for prediction of pramipexole pharmacokinetics in Parkinson's disease patients with renal impairment. J Clin Pharmacol. (2020) 60:999–1010. doi: 10.1002/jcph.1593
27. Yang, G, Wang, LZ, Zhang, R, Zhang, XY, Yu, Y, Ma, HR, et al. Study on the correlation between blood urea nitrogen, creatinine level, proteinuria and Parkinson's disease. Neurol India. (2023) 71:1217–21. doi: 10.4103/0028-3886.391388
28. Giri, M, He, L, Hu, T, Puri, A, Zheng, X, Dai, H, et al. Blood urea nitrogen is associated with in-hospital mortality in critically ill patients with acute exacerbation of chronic obstructive pulmonary disease: a propensity score matching analysis. J Clin Med. (2022) 11:709. doi: 10.3390/jcm11226709
29. Jin, R, Yoshioka, H, Sato, H, and Hisaka, A. Data-driven disease progression model of Parkinson's disease and effect of sex and genetic variants. CPT Pharmacometrics Syst Pharmacol. (2024) 13:649–59. doi: 10.1002/psp4.13112
30. Tysnes, OB, and Storstein, A. Epidemiology of Parkinson's disease. J Neural Transm Vienna. (2017) 124:901–5. doi: 10.1007/s00702-017-1686-y
31. Suttrup, I, and Warnecke, T. Dysphagia in Parkinson's disease. Dysphagia. (2016) 31:24–32. doi: 10.1007/s00455-015-9671-9
32. Qu, Y, Qin, QX, Wang, DL, Li, JT, Zhao, JW, An, K, et al. Estimated glomerular filtration rate is a biomarker of cognitive impairment in Parkinson's disease. Front Aging Neurosci. (2023) 15:1130833. doi: 10.3389/fnagi.2023.1130833
33. Moghari, L, Taghizadeh, M, Soleimani, A, Akbari, H, and Sharifi, N. Dietary acid load and Predialysis serum bicarbonate levels in patients with end-stage renal disease. J Ren Nutr. (2023) 33:172–80. doi: 10.1053/j.jrn.2022.05.004
34. Vincent, JL, Mendonça, A, Cantraine, F, Moreno, R, Takala, J, Suter, PM, et al. Use of the SOFA score to assess the incidence of organ dysfunction/failure in intensive care units: results of a multicenter, prospective study Working group on "sepsis-related problems" of the European Society of Intensive Care Medicine. Crit Care Med. (1998) 26:1793–800. doi: 10.1097/00003246-199811000-00016
Keywords: Parkinson’s disease, MIMIC IV database, covariate, nomogram, prognostic factors, in-hospital mortality
Citation: Luo L, Chen Y, Zhao H, Dong R and Long Y (2025) Identifying key covariates of clinical outcomes for critically ill patients with Parkinson’s disease: analysis of the MIMIC-IV database. Front. Neurol. 16:1545126. doi: 10.3389/fneur.2025.1545126
Edited by:
Oscar Arias-Carrión, National Institute of Rehabilitation Luis Guillermo Ibarra Ibarra, MexicoReviewed by:
Natalia Szejko, Medical University of Warsaw, PolandRaniki Kumari, Johns Hopkins University, United States
Emmanuel Ortega-Robles, National Polytechnic Institute of Mexico (CINVESTAV), Mexico
Copyright © 2025 Luo, Chen, Zhao, Dong and Long. This is an open-access article distributed under the terms of the Creative Commons Attribution License (CC BY). The use, distribution or reproduction in other forums is permitted, provided the original author(s) and the copyright owner(s) are credited and that the original publication in this journal is cited, in accordance with accepted academic practice. No use, distribution or reproduction is permitted which does not comply with these terms.
*Correspondence: Yuzhou Long, bG9uZ3l1emhvdUB5bnUuZWR1LmNu
†These authors have contributed equally to this work and share first authorship