 Miyako Kusano1*
 Pär Jonsson2
 Atsushi Fukushima1
 Jonas Gullberg3 Michael Sjöström2 Johan Trygg2 and Thomas Moritz3*
- 1 Metabolomics Research Division, RIKEN Plant Science Center, Yokohama, Japan
- 2 Computational Life Science Cluster, Department of Chemistry, Umeå University, Umeå, Sweden
- 3 Department of Forest Genetics and Plant Physiology, Umeå Plant Science Centre, Swedish University of Agricultural Sciences, Umeå, Sweden
The photoperiod is an important environmental signal for plants, and influences a wide range of physiological processes. For woody species in northern latitudes, cessation of growth is induced by short photoperiods. In many plant species, short photoperiods stop elongational growth after a few weeks. It is known that plant daylength detection is mediated by Phytochrome A (PHYA) in the woody hybrid aspen species. However, the mechanism of dormancy involving primary metabolism remains unclear. We studied changes in metabolite profiles in hybrid aspen leaves (young, middle, and mature leaves) during short-day-induced growth cessation, using a combination of gas chromatography–time-of-flight mass spectrometry, and multivariate projection methods. Our results indicate that the metabolite profiles in mature source leaves rapidly change when the photoperiod changes. In contrast, the differences in young sink leaves grown under long and short-day conditions are less distinct. We found short daylength induced growth cessation in aspen was associated with rapid changes in the distribution and levels of diverse primary metabolites. In addition, we conducted metabolite profiling of leaves of PHYA overexpressor (PHYAOX) and those of the control to find the discriminative metabolites between PHYAOX and the control under the short-day conditions. The metabolite changes observed in PHYAOX leaves, together with those in the source leaves, identified possible candidates for the metabolite signature (e.g., 2-oxo-glutarate, spermidine, putrescine, 4-amino-butyrate, and tryptophan) during short-day-induced growth cessation in aspen leaves.
Introduction
The initiation of cold acclimation and dormancy for tree species in northern latitudes is synchronized with the end of the growth season and the onset of low temperatures in the autumn. Elongation growth stops in many woody species with indeterminate growth patterns after a few weeks under short photoperiods in controlled environments (Thomas and Vince-Prue, 1997). The photoperiodic timing of growth processes are dependent on photoreceptors that detect the day/night cycle, along with an endogenous circadian oscillator that perceives and resets the endogenous clock according to the environmental conditions (Eriksson and Millar, 2003; Schultz and Kay, 2003; Salome and Mcclung, 2005; Mcclung, 2008; Hoffman et al., 2010).
In Populus, the site of daylength detection and cessation of stem elongation is in the leaf-rib meristem area (Ruonala et al., 2008). One of the main players in the signaling pathways involved in short-day-induced growth cessation is the flowering locus T (FT) protein. However, flower induction generally occurs by transmission of FT and its ortholog from phloem to the shoot apex in Arabidopsis (Corbesier et al., 2007) and in rice (Tamaki et al., 2007). Studies of the FT in aspen species (Populus spp.), suggest that FT has dual roles in wood species (Bohlenius et al., 2006). Research indicates that FT is involved in the regulation of both flowering and short-day induced growth cessation. Transgenic poplars overexpressing the Populus FT-gene under the cauliflower mosaic virus 35S-promotor do not form buds during short photoperiods (Bohlenius et al., 2006). This suggests that the FT protein is a key mobile regulator of daylength-controlled shoot elongation in Populus, similar to the FT protein role in flowering in Arabidopsis (Corbesier et al., 2007) and rice (Tamaki et al., 2007).
Previous research suggests that plant daylength detection is mediated by Phytochrome A (PHYA) in the woody hybrid aspen species, Populus tremula × P. tremuloides (Olsen et al., 1997; Kozarewa et al., 2010). Antisense PHYA hybrid aspen shows earlier bud-set in short winter photoperiod than in the corresponding wild-type (WT) plants (Kozarewa et al., 2010), and hybrid aspens expressing oat PHYA are severely dwarfed and insensitive to induction of dormancy by short days (Olsen et al., 1997). Furthermore, levels of the gibberellin group of plant hormones (GAs) are down-regulated in the PHYA overexpressing hybrid aspen (PHYAOX). Researchers have hypothesized that this is the reason for the loss of induced growth cessation under short photoperiods in hybrid aspen (Olsen et al., 1995; Eriksson and Moritz, 2002). Nevertheless, many other possible candidates acting as a transmittable metabolic signal that mediate photoperiod controlled elongation exist, including plant hormones (Baba et al., 2011) and primary and secondary metabolites (Ruttink et al., 2007).
In metabolomics, the goal is to identify and quantify every metabolite in a biological system (Fiehn, 2002; Fernie et al., 2004; Hall, 2006). Although this method is not technologically feasible (Saito and Matsuda, 2010), relevant metabolic profiles of different samples can be obtained and contrasted. Using a metabolomics approach, we investigated metabolite profiles in leaves at different developmental stages using hybrid aspen (P. tremula × P. tremuloides) during short-day-induced growth cessation. Our aim was to reveal at which developmental stage of the foliar metabolite responses to changes in photoperiod were most prominent. The metabolite profiles of those leaves were further explored in PHYAOX and the controls. The observed metabolic changes may provide candidates for the “metabolic signature” of short-day-induced growth cessation in hybrid aspen leaves. These candidates might belong to the PHYA-associated signaling pathways or primary metabolic responses. However, because PHYAOX are dwarfed, differential metabolites might be related with the developmental shift in these transgenic poplars rather than with their photoperiod insensitivity. Therefore, developmental shift- or age-dependent metabolites were annotated in a separate time-course study of wild-type leaves taking into account the photoperiod.
Materials and Methods
Plant Growth and Harvesting
Twenty-eight hybrid aspen trees were grown under long photoperiods (long-day conditions, LDs) of 18 h/6 h day/night cycle using photosynthetic active radiation (PAR) light for 12 h at 400 μmol m−2s−1, and extended for another 6 h at 30 μmol m−2s−1. After 3 months, 20 consecutive leaves (the length of the first leaf below the apex was approximately 1 cm) and the apex (defined as apical tissue from which all major leaf primordia had been removed) were sampled from seven plants (LD0-samples). Two days later another seven plants were sampled (LD2-samples), and the daylength was changed to short winter photoperiods (short-day conditions, SDs): 12/12 h day/night). After 2 and 6 days under short photoperiods (SD2 and SD6), seven plants were sampled. To examine the effect of 35S:: oat PHYA-overexpression, we sampled 10 leaves from 22-PHYAOX and 21-control plants. We used two different photoperiods [LD0 and short photoperiod at day 7 (SD7)] to obtain PHYOX and the control plants (wild-type, WT). After removal from the plant samples were dipped in liquid nitrogen and stored at −80°C until required.
Metabolite Profiling Analysis
Leaf samples were crushed, extracted, and their metabolite profiles were analyzed according to (Gullberg et al., 2004). Stable isotope reference compounds (15 ng μl−1 each of [13C3]-myristic acid, [13C4]-hexadecanoic acid, [2H4]-succinic acid, [13C5, 15N]-glutamic acid, [2H7]-cholesterol, [13C5]-proline, [13C4]-disodium α-ketoglutarate, [13C12]-sucrose, [2H4]-putrescine, [2H6]-salicylic acid, and [13C6]-glucose) were added to an extraction mixture of chloroform:MeOH:H2O (3:1:1). The samples (10 mg fresh weight each) were then extracted in 1 ml of the extraction mixture using a MM 301 Vibration Mill (Retsch GmbH & Co. KG, Haan, Germany) at a frequency of 30 Hz s−1 for 3 min using a 3-mm of tungsten carbide bead (Retsch GmbH & Co. KG, Haan, Germany) per tube to increase the extraction efficiency. After extraction samples were placed in an Eppendorf centrifuge (Model 5417C) for 10 min at 14,000 rpm. Following this, 200 μl of the supernatant was transferred to a GC-vial and evaporated to dryness. The samples were then derivatized by shaking them with 30 μl of methoxyamine hydrochloride (15 mg ml−1) in pyridine for 10 min at 5°C. Samples were then incubated overnight at room temperature. The samples were then trimethylsilylated by adding 30 μl of MSTFA with 1% TMCS and incubating for 1 h at room temperature. After silylation, 30 μl of heptane was added.
The samples were analyzed according to Gullberg et al. (2004) using gas chromatography–time-of-flight mass spectrometry (GC–MS). We used blank control samples and a series of n-alkanes (C12–C40) to allow us to calculate retention indices (Schauer et al., 2005). One microliter of each derivatized sample was injected using a split/splitless injector in splitless mode of an Agilent 7683 autosampler (Agilent, Atlanta, GA, USA) into an Agilent 6890 gas chromatograph equipped with a 10-m × 0.18-mm i.d. fused silica capillary column with a chemically bonded 0.18 μm DB 5-MS stationary phase (J&W Scientific, Folsom, CA, USA). The injector temperature was 270°C, the septum purge flow rate was 20 ml min−1 and the purge was turned on after 60 s. The gas flow rate through the column was 1 ml min−1, the column temperature was held at 70°C for 2 min, then increased by 40°C min−1 to 320°C, and held for 2 min. The column effluent was introduced into the ion source of a Pegasus III time-of-flight mass spectrometer, GC–MS (LECO Corp., St Joseph, MI, USA). The transfer line and the ion source temperatures were 250 and 200°C, respectively. Ions were generated by a 70-eV electron beam at an ionization current of 2.0 mA, and 30 spectra s−1 were recorded in the mass range 50–800 m/z. The acceleration voltage was turned on after a solvent delay.
All non-processed metabolite profile data were exported from the ChromaTOF software in NetCDF format to MATLAB™ software 7.0 (MathWorks, Natick, MA, USA), in which data pre-treatment procedures such as base-line correction chromatogram alignment, data compression, and hierarchical multivariate curve resolution (H-MCR), were performed using custom scripts following Jonsson et al. (2005). All manual integrations were performed using ChromaTOF 2.00 software (LECO Corp., St Joseph, MI, USA) or custom scripts as described in Kusano et al. (2007).
Statistical Data Analysis
Multivariate statistical investigations were performed using SIMCA-P + 12 software (Umetrics, Umeå, Sweden). All variables were log10-transformed, centered, and scaled to unit variance for the analysis. To connect the information of two-block variables (X and Y) to each other, we used an orthogonal projection to latent structures (OPLS). OPLS is one of the supervised methods which is commonly applied in metabolomics. An OPLS regression model (Trygg and Wold, 2002) was calculated to investigate potential relationships between the metabolic compositions (X) of the aspen leaves and their positions (Y) on the stem. Peak areas under the resolved GC–MS peaks were used as descriptors (X) and the leaf positions as the response (Y) in the OPLS model. R2X is the cumulative modeled variation in X, R2Y is the cumulative modeled variation in Y, and Q2Y is the cumulative predicted variation in Y, according to cross-validation. The range of these parameters is 0–1, where 1 indicates a perfect fit.
To determine metabolites which were affected only by time periods (i.e., day 0, day 2, day 4, and day 6), or only by daylength (i.e., LD or SD), which do not show any interaction, we used a two-way analysis of variance (ANOVA) as described in Pavlidis (2003). Here, we assume that the metabolite level was expressed as
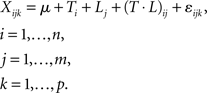
This indicates a linear model of metabolite accumulation in replicate k of level i of factor T (time-period) and level j of factor L (daylength) with n and m levels, respectively; p represents replicates per group; µ is the mean metabolite level, and ε represents random error. The level of significance was set at p < 0.05 when corrected for the false-discovery rate (FDR) method (Benjamini and Hochberg, 1995). In PHYAOX samples, we calculated two-way ANOVA (factors: genotype × daylength). The ANOVA analyses were carried out using the R statistical environment (http://cran.r-project.org).
Results
Design and Experimental Set-Up for Sampling
We investigated which positions on hybrid aspen trees were representative of young (sink), middle, and mature (source) leaves for this study, to obtain insights into the extent of differences of metabolite composition of leaf samples across different developmental stages (Figure 1A). To validate the sampling strategy, a preliminary study was conducted with an aspen plant grown in LDs (18 h). After 3 weeks, 20 consecutive leaves were sampled, from the first leaf below the apex approximately 1 cm long (which was numbered 1, Figures 1A,B). This sampling strategy provided a sequence of 20 leaves in different developmental stages, ranging from actively growing sink leaves to mature source leaves. Plant metabolites were extracted, derivatized, and analyzed from leaf samples using GC–MS (Gullberg et al., 2004; Jonsson et al., 2005). The OPLS model obtained showed a clear relationship between the leaf number and the corresponding metabolite profile (Figure 1C). Substantial differences between the leaves were anticipated from the differences in their developmental stages. Although similar age-related differences have previously been found in metabolite profiles of Populus leaves (Jeong et al., 2004), the validation result demonstrated that evaluation of the sampling strategy using OPLS is important when examining a large number of plants. Therefore, we chose leaf 2, leaf 10, and leaf 20 as representative of young sink, middle, and mature source leaves, respectively.
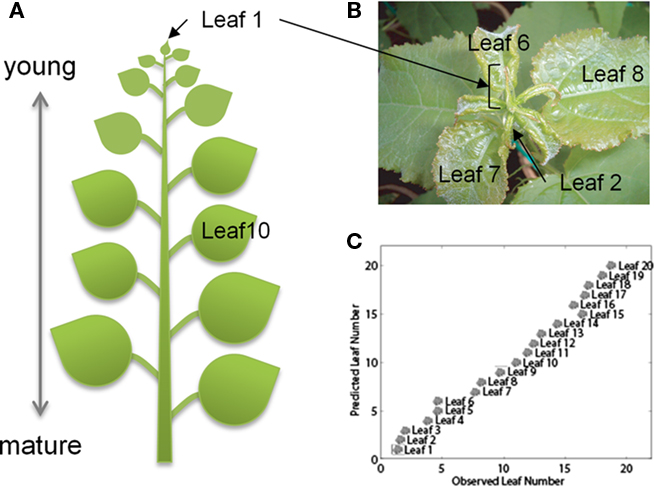
Figure 1. The OPLS model of the metabolite profile of Populus leaves at different sampling positions. (A) The leaf numbers (leaf) refers to the sampling position, where leaf one is the first leaf longer than 1 cm. We sampled leaves from position 1 (leaf 1) to position 20 (leaf 20). (B) Expansion of upper side including apex, leaf 1 to leaf 8 of an aspen plant. (C) The number of components in the OPLS model was determined as two (one orthogonal and one predictive) according to seven-fold full cross-validation (Wold, 1978). The model explains 98.1% of the variation in Y (R2Y = 0.981) and the estimated ability to predict 92.1% of the variation in Y (Q2Y = 0.921) according to cross-validation. The model was able to model 47.8% of the variation in X, 22.9% of the variation is correlated to leaf position (Y) and 24.9% is uncorrelated.
Mature Source Leaves Show Rapid Responses to Changes in Daylength
The second step in the study was to investigate how the metabolite profiles of aspen leaves sampled from different developmental stages differ under long- and short-day conditions (18 and 12 h respectively). Metabolite profiling was conducted on leaf samples (see Materials and Methods above) from 28 aspen plants grown continuously in LD, or from plants grown first under LD and then SD (for 2 or 6 days). The data, including unknown and annotated peaks, were first evaluated by principal component analysis (PCA) in an unsupervised manner (Figure A1 in Appendix). The PCA of leaf 20 samples shows a clear separation between the different photoperiods on the first component 1 (Figure A1C in Appendix). However, the PCA scores of leaf 2 and 10 samples revealed no clear photoperiod differences s (Figures A1A,B in Appendix). Therefore, any further analysis of metabolite data were carried out on samples from the leaf 20 position. The supervised method orthogonal projection to latent structures discriminant analysis (OPLS-DA) was used for metabolite profiling data of leaf 20 samples to maximize the information related to the differences in the four different photoperiods (Figure 2). For leaf 20, the LD0-samples were predicted to be similar to LD2, with the SD2-samples to be intermediate between LD2 and SD6 (Figure 2B). This is consistent with the hypothesis that samples grown for two more days in LD (LD2) should group with the LD0-samples. Plants exposed to only two SD days should have intermediate profiles between those of LD2 and SD6. The loading plot suggests that the most of the detected peaks increased in their levels during short-day treatment (Figure 2B).
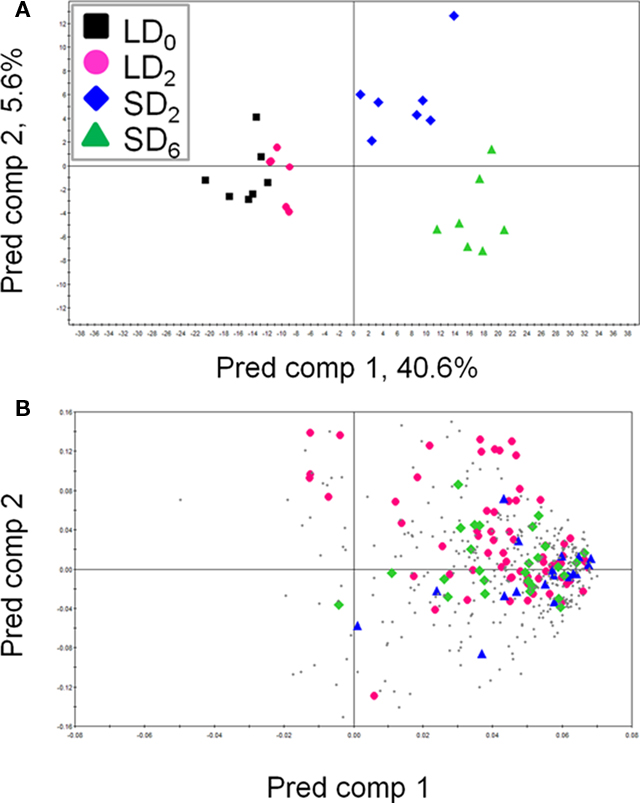
Figure 2. The OPLS-DA score scatter plot (A) and loading plot (B) of leaf 20 samples under different photoperiods. Each point represents an independent plant in the score scatter plots and an individual peak in the loading plots. The OPLS-DA model for leaf 20 samples shows two significant components, with R2X, R2Y, and Q2Y values of 0.58, 0.55, and 0.32, respectively. (A) Black square, LD0; pink circle, LD2; blue diamond, SD2; green triangle, SD6. (B) Pink diamond, identified metabolite peak; blue triangle, annotated metabolite peak; green square, MST; gray dot, unclassified peak. Abbreviations: Pred comp, predictive component; MST, mass spectral tag.
Metabolic Alternations between LD and SD Conditions in Mature Leaves
To identify the metabolites contributing the differences between the LD and SD samples in mature leaves, we conducted a two-way ANOVA (factors: time periods × daylength) to determine metabolites that showed significant changes between LD and SD. Among 454 peaks, 12 peaks showed significant changes in accordance with different photoperiods (LD and SD) after the FDR correction (Figure A2 in Appendix; Data Sheet 1 in Supplementary Material). These changes were visualized in box plots (Figure A2 in Appendix). Furthermore, 303 peaks, such as intermediates belonging to tricarboxylic acid (TCA) cycle, showed significant changes with different time periods (Data Sheet 1 in Supplementary Material) and reflect rather developmental or age-associated changes in the leaf. Of the 12 metabolite peaks, serine, aspartate, pyroglutamate, glutamate, and three unknown peaks also showed significant alternations across different days of growth (Data Sheet 1 in Supplementary Material).
Metabolite Profiling of Leaves of Phyaox Grown under LD and SD
Metabolite profiling of WT leaves enabled us to find the metabolites that altered their levels between different photoperiods. To investigate which metabolites remain unchanged in the metabolite profiles of PHYAOX, but changed in those of WT between LD and SD, we performed metabolite profiling of leaves of PHYAOX and the control plants (WT). We conducted a PCA to investigate the distribution of PHYAOX and WT samples under LD and SD conditions (Figure 3). The PCA plot showed that metabolite profiles of PHYAOX and those of WT differ in the first component and difference between LD and SD appeared in the second component (Figure 3). The results of OPLS-DA suggested that genotype-dependent and photoperiod-dependent differences were likely to exist, though the latter differences were very small (Figure A3 in Appendix). Since the PHYAOX plants do not induce growth cessation in SD (Olsen et al., 1997), we hypothesized that: candidate metabolite levels of which the levels can be regarded as “metabolite signature” for SD treatment should (1) differ in PHYAOX samples compared to WT, and (2) show no photoperiod-dependent changes in PHYAOX samples as PHYAOX is insensitive to short-day-induced dormancy. To identify such metabolites, an ANOVA (factors: daylength × genotype; Data Sheet 2 in Supplementary Material) was conducted and the results presented in a Venn diagram. This revealed 97 metabolite peaks that are genotype-specific and, thus, candidates for this “metabolite signature” (Figure A4 in Appendix). Of these, 39 peaks were annotated as known metabolites. In addition to the 97 genotype-specific peaks, the abundance of 20 peaks differed between PHYAOX and wild-type poplar, yet differences due to the photoperiod were also apparent; among these peaks were serine, aspartate, and glutamate. These metabolites showed an increase in their metabolite levels in mature WT leaves under SD (Figure A2 in Appendix).
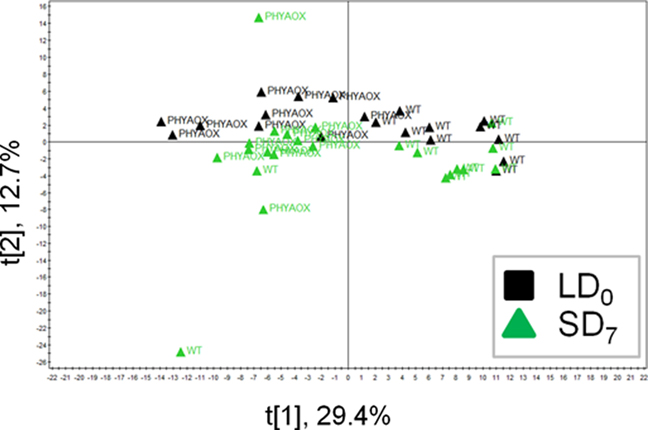
Figure 3. The PCA score scatter plot of PHYAOX and WT samples under LD and SD conditions. Black square, LD0; green triangle, SD7. Abbreviations: PHYAOX, PHYA overexpressor; WT, wild-type.
Comparison of Genotype-Dependent Metabolites with Age-Dependent Metabolites
The result of the two-way ANOVA on the leaf 20 dataset demonstrated that WT leaves showed metabolite changes across the four different time periods (day 0, day 2, day 4, and day 6). These metabolites were thought to be involved in plant growth from day 0 to day 6 and are called age-dependent changes. Because PHYAOX have a dwarfed phenotype and is able to grow under short-day conditions, age-dependent changes might contribute to the observed genotype-specific differences. To reduce the number of the candidates for the “metabolite signature” of short-day-induced growth cessation, the age-dependent metabolites found in the leaf 20 dataset were filtered out from the genotype-specific metabolites in the PHYAOX dataset (Figure A5 in Appendix). We focused on known metabolites to compare the two different datasets (Data Sheet 1 and 2 in Supplementary Material). As visualized in the Venn diagram (Figure A5 in Appendix), 14 of the 38 known genotype-specific metabolites were retained. Of these, the levels of 3-cyano-alanine, caffeate, 2-oxo-glutarate, spermidine, putrescine, and 4-amino-butyrate were increased in PHYAOX samples, whereas there was a significant decrease in the levels of threonate and tryptophan (Table 1; Figure A5 in Appendix).
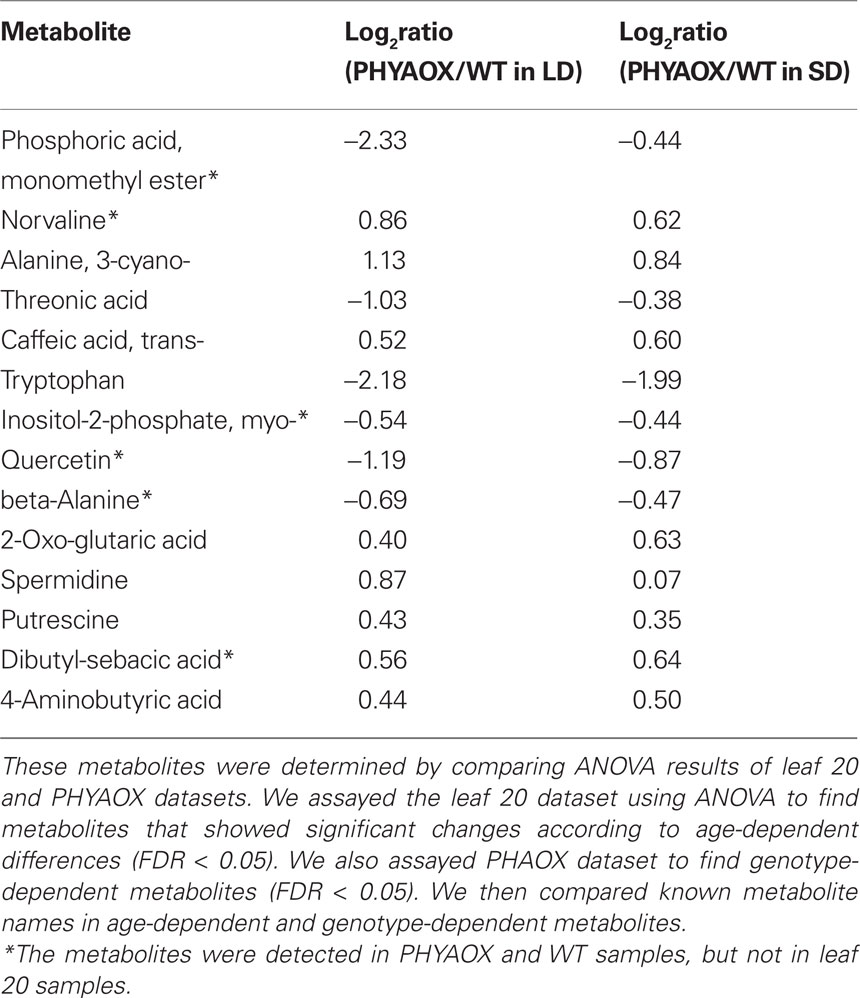
Table 1. The candidate metabolites for metabolite signature found in PHYAOX dataset.
Pathway Projection of Changes of the Candidate Metabolites for Metabolite Signature during Growth Cessation
Among the candidate metabolites, several metabolites belong to the 4-aminobutyric acid (GABA) shunt and polyamine pathway. To visualize the changed peak levels on metabolic pathway, we projected the corresponding metabolites onto a metabolic map (Figure 4). In the GABA shunt pathway, the levels of 2-oxo-glutarate and 4-amino-butyrate in PHYAOX samples were higher than those in WT under LD and SD. However, there were no significant changes in the level of succinate (Figure 4A). Concerning the polyamine pathway, the levels of putrescine and spermidine showed a significant increase in PHYAOX, particularly under LD (Figure 4A; Table 1).
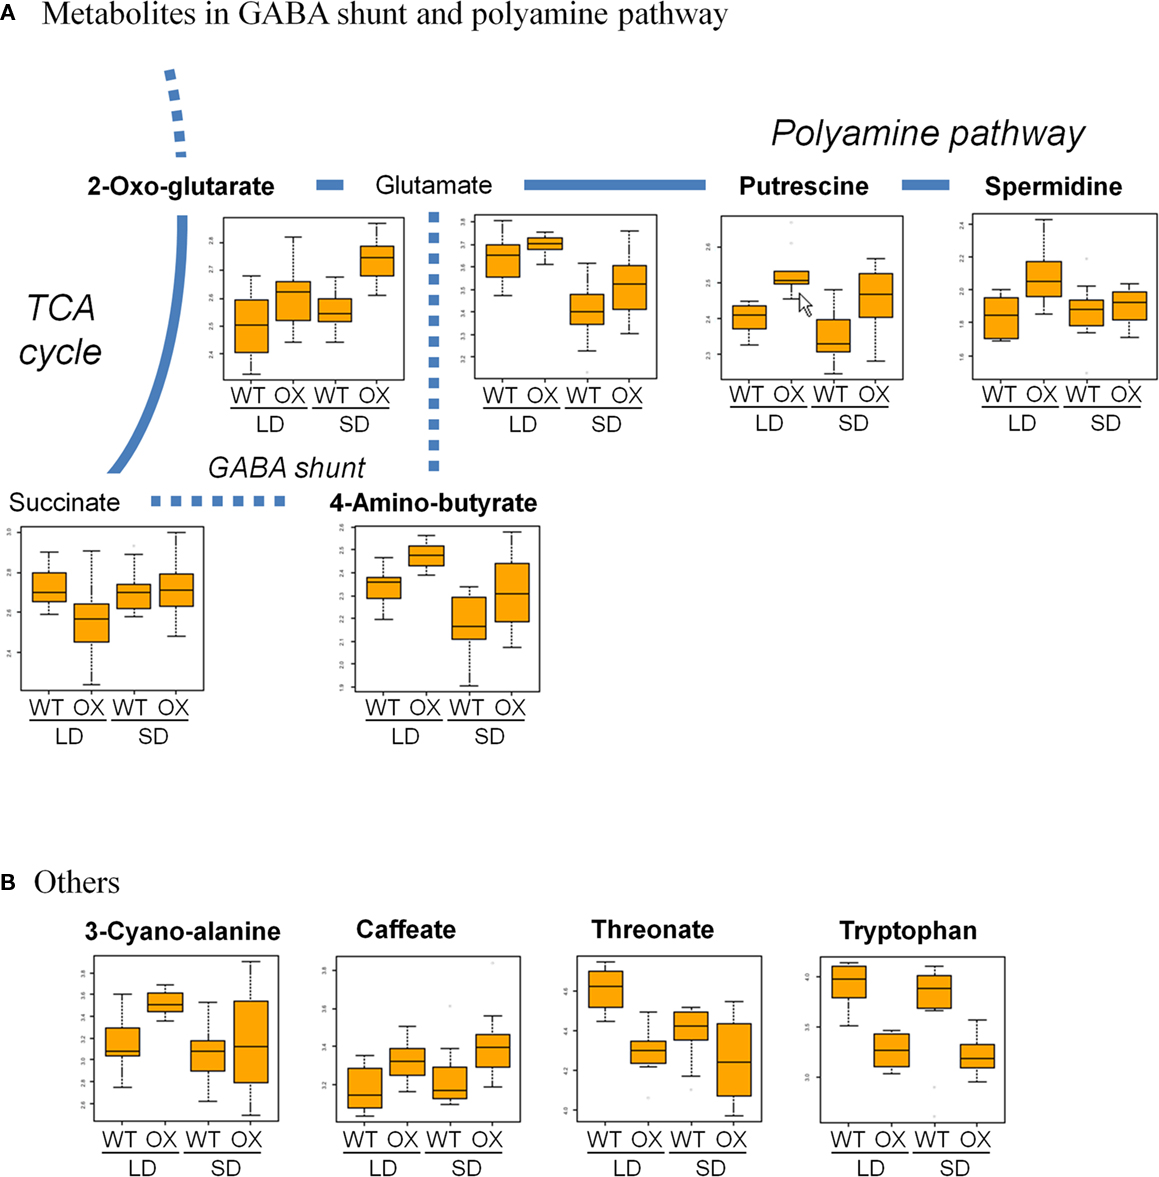
Figure 4. Overlay of changes in the candidates for metabolite signature and related metabolites observed in PHYAOX and WT samples onto the metabolic map. (A) Changes in the levels of four candidate metabolites (in bold) and related metabolites in GABA shunt and polyamine pathway and (B) those of other cadidate metabolites for metabolite signature. In each box plot, x-axis represents metabolites detected in WT and PHYAOX (OX) in LD and SD, while y-axis shows the normalized response of metabolite levels after log10-transfromation.
For another candidate metabolite, tryptophan, the level in PHYAOX was lower than that in WT under LD and SD (Figure 4B). Tryptophan is a known precursor of indole-3-acetic acid (IAA) which is a plant hormone in higher plants (Zhao, 2010).
Discussion
Metabolite Profiling Analysis Can Recognize Difference of Metabolite Composition of Aspen Leaves in Their Positions, Different Time Frames and Photoperiods
Our aim was to examine foliar metabolite alterations to changes in photoperiod at different developmental stages of the leaf. Metabolite composition of aspen leaves can be captured using GC–MS analysis with respect to the extent of leaf expansion (Jeong et al., 2004). In this study, we analyzed aspen leaf extracts from position 1 (leaf 1) to position 20 (leaf 20) using GC–TOF-MS by applying the definition of each leaf position as shown in Figure 1A. The OPLS analysis, which is one of the supervised methods, clearly showed that metabolite profiles of aspen leaves were well correlated with their leaf positions (Figures 1A,C).
A scatter plot of the score values provides an overview of the samples (observations) and their inter-relationships, e.g., groupings, trends, and deviating samples. The PCA score scatter plots of leaf 2 (young leaves), leaf 10 (middle), and leaf 20 (mature) showed that the profiles of mature leaves reflected better metabolite changes related to different time frames and change of photoperiods as compared to those of young and middle leaves, while young and middle leaves did not (Figure A1 in Appendix). To interpret the patterns found in the score plots of the leaf 20 dataset, we examined the corresponding loading plots (Figure 2). This method revealed how each variable contributed to the separation among samples in the model plane, indicating the relative importance of each variable. Using multivariate projection methods, we validated our data. We used preliminary data sets in our models that enabled us to predict external sample data verifying the usefulness of our calculated models (Figure 2). This strategy is essential when multivariate projection methods are used to avoid problems associated with over-fitting of the data (Eriksson et al., 2004). Our study demonstrated that after a few days in SD the mature source leaves form hybrid aspen trees showed a clear metabolic response.
Dissection of the Candidate Metabolites for Metabolite Signature during Growth Cessation from Multivariate Datasets
Changes in the metabolome of plants grown under different photoperiods are complex phenomena. Various parts of the metabolome may be affected by other variables, depending on the experimental set-up, diurnal effects, differences in the time at which the lights turn on, differences in the PAR availability, or differences in the photoperiods per se (Thomas and Vince Prue, 1997). These aspects should be taken into account when interpreting our results. For example, large effects on the primary carbohydrate metabolism may indicate that some of the changes observed are from differences in photosynthesis, especially over a relatively short time-period. Our study used similar amounts of PAR in both LD and SD treatments, and extended the days in SD with low light conditions. Therefore, we reduced the possibility that the differences in metabolite changes are due to the amount of light that plants received. Furthermore, we emphasize that some of the alterations in metabolite profiles we observed after transferring hybrid aspen from LD to SDs are due to the aging of the plant, i.e., from first sampling time (LD0) to the last sampling time (SD6). Since PHYAOX plants grow under SD (Olsen et al., 1997; Ruonala et al., 2008), we need to consider the age-dependent differences. The results of the ANOVA of leaf 20 samples demonstrated that many metabolite peaks are likely to be involved in age-dependent differences even though the time frame is only 1 week (Data Sheet 1 in Supplementary Material). By comparing the age-dependent metabolites found in the leaf 20 dataset with those in the PHYAOX dataset, we selected candidate metabolites of which the levels are a metabolite signature during growth cessation. Similar approaches could be applied to other datasets using this multivariate approach. For example, using a multivariate analyses may be useful when trying to detect changes that occur during growth cessation that involve transcript and metabolite levels in hybrid aspen (Bylesjo et al., 2007) and Populus (Ruttink et al., 2007) at a global scale.
Possible Link between Growth Cessation and Nitrogen Metabolism in Hybrid Aspen
Levels of the candidate metabolites were altered in PHYAOX after 1 week with a short photoperiod. The expression level of FT2 in WT source leaves was down-regulated after 1 week of SD (Ruonala et al., 2008). Constitutive expression of Populus FT1 and oat PHYA in mature aspen leaves suppresses short-day-induced growth cessation. This is because the plants fail to down-regulation of FT1 and CONSTANS2 (CO2) within a week under SDs (Bohlenius et al., 2006). Furthermore, FT protein and the protein encoded by a rice ortholog of FT can mobilize to the apex via phloem as a long-distance signal for flowering in Arabidopsis (Corbesier et al., 2007) and rice (Tamaki et al., 2007). This suggests that a phloem-unloading mechanism has to be well developed in leaves before any signal can be transmitted. Thus, our observations that sink leaves are not affected by daylength change in aspen may have a physiological explanation.
For the candidate metabolites belonging to the GABA shunt pathway, the level of 2-oxo-glutarate was increased in PHYAOX samples after transferring to the SD treatment while metabolites in WT remained unchanged (Figure 4A). In contrast, the GABA level decreased in the WT during short-day-induced growth cessation. We found no significant changes in PHYAOX samples (Figure 4A). 2-Oxo-glutarate is not only one of the intermediates in the TCA cycle but serves as a carbon assimilation precursor that is derived from nitrogen metabolism (Foyer et al., 2011; Millar et al., 2011). The significant increase in the level of 2-oxo-glutarate in PHYAOX samples may provide a source of carbon skeletons for macromolecules from source leaves that maintains their growth in short photoperiod (Ruonala et al., 2008).
GABA is an important component of signaling systems in both vertebrates and invertebrates, but its role in plants is largely unknown (Bouche and Fromm, 2004; Fait et al., 2008). GABA has been suggested to have various roles. For instance, in the regulation of nitrogen metabolism and transport, in oxidative stress, and in controlling pollen tube growth. Our results suggest that the level of GABA in WT decreased during short-day-induced growth cessation, implying that it may not only act as a protector from stress, but may also play a role during growth cessation. GABA can be detected in xylem sap and phloem exudates of walnut trees (Frak et al., 2002) and in a Brassica species (Beuve et al., 2004). GABA might be a signal molecule remobilized from source leaves to apex after a week of exposure to the short-day treatment. Like GABA, levels of its precursor glutamate were lower in WT under SD (Figure 4A), suggesting that short days induce changes in the flow through GABA shunt.
We also found the tryptophan level is lower in PHYAOX samples than that in WT under LD and SD (Figure 4B). Recently, Baba et al. (2011) described that IAA has a critical role for growth cessation in aspen (Baba et al., 2011). In the leaves of Ricinus communis, the level of tryptophan and IAA showed an inverse distribution in accordance with their position (Allen and Baker, 1980). In addition, the free tryptophan content was most abundant in mature leaves, while sink leaves showed less accumulation of tryptophan content in the Ricinus leaves. This suggests that mature leaves of PHAOX plants are likely to have a similar ability as sink leaves to produce IAA, although further experiments are required, e.g., measurement of IAA in sink and source leaves. Indeed, the level of IAA is more abundant in tobacco sink leaves than that in source leaves (Sitbon et al., 1990).
In summary, we could choose the candidate metabolites for metabolite signature in mature leaves during growth cessation. To investigate metabolic dynamics for these metabolites from mature leaves to apex, metabolite profiling of phloem and xylem sap and labeling experiments to trace the candidate metabolites should be conducted for future analysis.
Conflict of Interest Statement
The authors declare that the research was conducted in the absence of any commercial or financial relationships that could be construed as a potential conflict of interest.
Acknowledgments
We thank K. Saito for fruitful discussions. This work was supported by grants from Swedish Research Council, FORMAS, SLU, the KEMPE foundation, and former Wallenberg Consortium North (Thomas Moritz).
Supplementary Material
The Data sheets 1 and 2 for this article can be found online at http://www.frontiersin.org/plant_physiology/10.3389/fpls.2011.00029/abstract
Data Sheet 1. ANOVA of leaf 20 samples.
Data Sheet 2. ANOVA of PHYAOX samples.
References
Allen, J. R. F., and Baker, D. A. (1980). Free-tryptophan and indole-3-acetic-acid levels in the leaves and vascular pathways of Ricinus-Communis L. Planta 148, 69–74.
Baba, K., Karlberg, A., Schmidt, J., Schrader, J., Hvidsten, T. R., Bako, L., and Bhalerao, R. P. (2011). Activity-dormancy transition in the cambial meristem involves stage-specific modulation of auxin response in hybrid aspen. Proc. Natl. Acad. Sci. U.S.A. 108, 3418–3423.
Benjamini, Y., and Hochberg, Y. (1995). Controlling the false discovery rate – a practical and powerful approach to multiple testing. J. R. Stat. Soc. Series B Methodol. 57, 289–300.
Beuve, N., Rispail, N., Laine, P., Cliquet, J. B., Ourry, A., and Le Deunff, E. (2004). Putative role of gamma-aminobutyric acid (GABA) as a long distance signal in up-regulation of nitrate uptake in Brassica napus L. Plant Cell Environ. 27, 1035–1046.
Bohlenius, H., Huang, T., Charbonnel-Campaa, L., Brunner, A. M., Jansson, S., Strauss, S. H., and Nilsson, O. (2006). CO/FT regulatory module controls timing of flowering and seasonal growth cessation in trees. Science 312, 1040–1043.
Bylesjo, M., Eriksson, D., Kusano, M., Moritz, T., and Trygg, J. (2007). Data integration in plant biology: the O2PLS method for combined modeling of transcript and metabolite data. Plant J. 52, 1181–1191.
Corbesier, L., Vincent, C., Jang, S., Fornara, F., Fan, Q., Searle, I., Giakountis, A., Farrona, S., Gissot, L., Turnbull, C., and Coupland, G. (2007). FT protein movement contributes to long-distance signaling in floral induction of Arabidopsis. Science 316, 1030–1033.
Eriksson, L., Antti, H., Gottfries, J., Holmes, E., Johansson, E., Lindgren, F., Long, I., Lundstedt, T., Trygg, J., and Wold, S. (2004). Using chemometrics for navigating in the large data sets of genomics, proteomics, and metabonomics (gpm). Anal. Bioanal. Chem. 380, 419–429.
Eriksson, M. E., and Millar, A. J. (2003). The circadian clock. A plant’s best friend in a spinning world. Plant Physiol. 132, 732–738.
Eriksson, M. E., and Moritz, T. (2002). Daylength and spatial expression of a gibberellin 20-oxidase isolated from hybrid aspen (Populus tremula L. x P. tremuloides Michx.). Planta 214, 920–930.
Fait, A., Fromm, H., Walter, D., Galili, G., and Fernie, A. R. (2008). Highway or byway: the metabolic role of the GABA shunt in plants. Trends Plant Sci. 13, 14–19.
Fernie, A. R., Trethewey, R. N., Krotzky, A. J., and Willmitzer, L. (2004). Metabolite profiling: from diagnostics to systems biology. Nat. Rev. Mol. Cell Biol. 5, 763–769.
Fiehn, O. (2002). Metabolomics – the link between genotypes and phenotypes. Plant Mol. Biol. 48, 155–171.
Foyer, C. H., Noctor, G., and Hodges, M. (2011). Respiration and nitrogen assimilation: targeting mitochondria-associated metabolism as a means to enhance nitrogen use efficiency. J. Exp. Bot. 62, 1467–1482.
Frak, E., Millard, P., Le Roux, X., Guillaumie, S., and Wendler, R. (2002). Coupling sap flow velocity and amino acid concentrations as an alternative method to (15)N labeling for quantifying nitrogen remobilization by walnut trees. Plant Physiol. 130, 1043–1053.
Gullberg, J., Jonsson, P., Nordstrom, A., Sjostrom, M., and Moritz, T. (2004). Design of experiments: an efficient strategy to identify factors influencing extraction and derivatization of Arabidopsis thaliana samples in metabolomic studies with gas chromatography/mass spectrometry. Anal. Biochem. 331, 283–295.
Hall, R. D. (2006). Plant metabolomics: from holistic hope, to hype, to hot topic. New Phytol. 169, 453–468.
Hoffman, D. E., Jonsson, P., Bylesjo, M., Trygg, J., Antti, H., Eriksson, M. E., and Moritz, T. (2010). Changes in diurnal patterns within the Populus transcriptome and metabolome in response to photoperiod variation. Plant Cell Environ. 33, 1298–1313.
Jeong, M. L., Jiang, H., Chen, H. S., Tsai, C. J., and Harding, S. A. (2004). Metabolic profiling of the sink-to-source transition in developing leaves of quaking aspen. Plant Physiol. 136, 3364–3375.
Jonsson, P., Johansson, A. I., Gullberg, J., Trygg, J., A, J., Grung, B., Marklund, S., Sjostrom, M., Antti, H., and Moritz, T. (2005). High-throughput data analysis for detecting and identifying differences between samples in GC/MS-based metabolomic analyses. Anal. Chem. 77, 5635–5642.
Kozarewa, I., Ibanez, C., Johansson, M., Ogren, E., Mozley, D., Nylander, E., Chono, M., Moritz, T., and Eriksson, M. E. (2010). Alteration of PHYA expression change circadian rhythms and timing of bud set in Populus. Plant Mol. Biol. 73, 143–156.
Kusano, M., Fukushima, A., Arita, M., Jonsson, P., Moritz, T., Kobayashi, M., Hayashi, N., Tohge, T., and Saito, K. (2007). Unbiased characterization of genotype-dependent metabolic regulations by metabolomic approach in Arabidopsis thaliana. BMC Syst. Biol. 1, 53.
Millar, A. H., Whelan, J., Soole, K. L., and Day, D. A. (2011). Organization and regulation of mitochondrial respiration in plants. Annu. Rev. Plant Biol. 62, 79–104.
Olsen, J. E., Junttila, O., and Moritz, T. (1995). A localised decrease of GA(1) in shoot tips of Salix pentandra seedlings precedes cessation of shoot elongation under short photoperiod. Physiol. Plant 95, 627–632.
Olsen, J. E., Junttila, O., Nilsen, J., Eriksson, M. E., Martinussen, I., Olsson, O., Sandberg, G., and Moritz, T. (1997). Ectopic expression of oat phytochrome A in hybrid aspen changes critical daylength for growth and prevents cold acclimatization. Plant J. 12, 1339–1350.
Pavlidis, P. (2003). Using ANOVA for gene selection from microarray studies of the nervous system. Methods 31, 282–289.
Ruonala, R., Rinne, P. L., Kangasjarvi, J., and Van Der Schoot, C. (2008). CENL1 expression in the rib meristem affects stem elongation and the transition to dormancy in Populus. Plant Cell 20, 59–74.
Ruttink, T., Arend, M., Morreel, K., Storme, V., Rombauts, S., Fromm, J., Bhalerao, R. P., Boerjan, W., and Rohde, A. (2007). A molecular timetable for apical bud formation and dormancy induction in poplar. Plant Cell 19, 2370–2390.
Saito, K., and Matsuda, F. (2010). Metabolomics for functional genomics, systems biology, and biotechnology. Annu. Rev. Plant Biol. 61, 463–489.
Salome, P. A., and Mcclung, C. R. (2005). What makes the Arabidopsis clock tick on time? A review on entrainment. Plant Cell Environ. 28, 21–38.
Schauer, N., Steinhauser, D., Strelkov, S., Schomburg, D., Allison, G., Moritz, T., Lundgren, K., Roessner-Tunali, U., Forbes, M. G., Willmitzer, L., Fernie, A. R., and Kopka, J. (2005). GC-MS libraries for the rapid identification of metabolites in complex biological samples. FEBS Lett. 579, 1332–1337.
Schultz, T. F., and Kay, S. A. (2003). Circadian clocks in daily and seasonal control of development. Science 301, 326–328.
Sitbon, F., Sundberg, B., Olsson, O., and Sandberg, G. (1990). Free and conjugated indoleacetic acid (IAA) contents in transgenic tobacco plants expressing the iaam and iaah iaa biosynthesis genes from Agrobacterium tumefaciens. Plant Physiol. 95, 480–485.
Tamaki, S., Matsuo, S., Wong, H. L., Yokoi, S., and Shimamoto, K. (2007). Hd3a protein is a mobile flowering signal in rice. Science 316, 1033–1036.
Thomas, B., and Vince Prue, D. (1997). Photoperiodism in Plants, 2nd Edn. San Diego, CA: Academic Press, xv 428.
Trygg, J., and Wold, S. (2002). Orthogonal projections to latent structures (O-PLS). J. Chemom. 16, 119–128.
Wold, S. (1978). Cross-validatory estimation of number of components in factor and principal components models. Technometrics 20, 397–405.
Keywords: aspen, Phytochrome A, metabolite profiling, GC–TOF-MS, dormancy, growth cessation
Citation: Kusano M, Jonsson P, Fukushima A, Gullberg J, Sjöström M, Trygg J and Moritz T (2011) Metabolite Signature during Short-Day Induced Growth Cessation in Populus . Front. Plant Sci. 2:29. doi: 10.3389/fpls.2011.00029
Received: 01 May 2011;
Accepted: 29 June 2011;
Published online: 12 July 2011.
Edited by:
Alisdair Fernie, Max Planck Institute for Plant Physiology, GermanyCopyright: © 2011 Kusano, Jonsson, Fukushima, Gullberg, Sjöström, Trygg and Moritz. This is an open-access article subject to a non-exclusive license between the authors and Frontiers Media SA, which permits use, distribution and reproduction in other forums, provided the original authors and source are credited and other Frontiers conditions are complied with.
*Correspondence: Miyako Kusano, RIKEN Plant Science Center, 1-7-22 Suehiro, Tsurumi, Yokohama 230-0045, Japan. e-mail:bWt1c2FubzAwNUBwc2MucmlrZW4uanA=; Thomas Moritz, Department of Forest Genetics and Plant Physiology, Umeå Plant Science Centre, Swedish University of Agricultural Sciences, SE-901 87 Umeå, Sweden. e-mail:dGhvbWFzLm1vcml0ekBnZW5meXMuc2x1LnNl