
- Department of Plant Breeding and Genetics, Max Planck Institute for Plant Breeding Research, Köln, Germany
Most characteristics in living organisms show continuous variation, which suggests that they are controlled by multiple genes. Quantitative trait loci (QTL) analysis can identify the genes underlying continuous traits by establishing associations between genetic markers and observed phenotypic variation in a segregating population. The new high-throughput sequencing (HTS) technologies greatly facilitate QTL analysis by providing genetic markers at genome-wide resolution in any species without previous knowledge of its genome. In addition HTS serves to quantify molecular phenotypes, which aids to identify the loci responsible for QTLs and to understand the mechanisms underlying diversity. The constant improvements in price, experimental protocols, computational pipelines, and statistical frameworks are making feasible the use of HTS for any research group interested in quantitative genetics. In this review I discuss the application of HTS for molecular marker discovery, population genotyping, and expression profiling in QTL analysis.
Introduction
For almost one century scientists have dissected the genetic architecture of quantitative traits in plants using Quantitative trait loci (QTL) analysis (Fisher, 1918). These analyses establish associations between genetic markers and the phenotypic variation of a quantitative trait in a segregating population. The techniques used to obtain markers and physiological phenotypes have been constantly improved through history (Schlotterer, 2004; Montes et al., 2007). Recently, the price drop of high-throughput technologies have allowed plant researchers to quantify the general abundance of transcripts, proteins, or metabolites in segregating populations (Kirst et al., 2005; Vuylsteke et al., 2005, 2006; Decook et al., 2006; Keurentjes et al., 2007; West et al., 2007; Lisec et al., 2008; Potokina et al., 2008; Drost et al., 2010). These studies show that there are multiple benefits in using “omic” technologies for QTL analyses, even when the goal is to characterize physiological phenotypic diversity. First, molecular phenotypes are the initial step toward the production of physiological phenotypes and its regulation underlies much of phenotypic diversity (Hoekstra and Coyne, 2007; Stern and Orgogozo, 2008). Second, the availability of genome-wide information significantly increases the ability to identify candidate genes for QTLs (Jimenez-Gomez et al., 2010). Third, molecular traits measured at system scale allow estimation of the effect of QTLs in the genetic pathways of interest, or identification of additional gene networks altered by the loci responsible for the variation (Kliebenstein et al., 2006). Finally, molecular traits offer researchers a better understanding of how mutation drives physiological variation and what are the evolutionary forces acting at primary levels.
High-throughput sequencing, or HTS, allows the rapid and cost–effective generation of massive amounts of short sequences or reads (Metzker, 2010). The potential of this technology for mapping loci responsible for phenotypic differences in plants has already been demonstrated by identifying genes containing EMS-induced mutations in samples of pooled F2 individuals (Schneeberger et al., 2009; Austin et al., 2011). HTS technologies have been in the market for a few years, and new methods are being developed that will be cheaper, require less sample processing, and will produce more and longer reads (Munroe and Harris, 2010; Glenn, 2011; Niedringhaus et al., 2011). It is therefore clear that very soon HTS will be the tool of choice for QTL analyses. One important limiting factor remains to be eliminated: Data analysis. It requires long and computationally intensive pipelines that need to be customized for each particular experimental set up. An increasing number of new algorithms are constantly released to the community, and the debate on which pipelines return the most accurate results is still ongoing. Comparing, combining, and customizing these pipelines requires simple Unix or Linux commands and greatly benefits from knowledge in powerful statistical software such as R, and in scripting languages, such as Perl or Python (R Development Core Team, 2009). For non-bioinformaticians, integrated solutions with convenient interfaces are becoming popular both from collaborative open projects and companies (Blankenberg et al., 2010; Goecks et al., 2010). A popular website that keeps an actualized list of the available software tools is www.seqanswers.com, where users and developers also discuss new technological advances and pipelines. In terms of the computational equipment required for HTS data analysis, the majority of tools are developed for Linux or Unix based systems. Although parts of the analysis can be performed in any modern computer, machines with dozens of gigabytes of RAM are recommended in cases where reference sequences form the species considered are available, or with hundreds if no reference exists. An alternative option that is likely to become popular is to rent storage and computing power in specialized centers, or “the cloud” (Stein, 2010).
Due to the fast improvement of HTS, this review intends only to capture a snapshot in time of the possibilities that it offers for molecular marker discovery, genotyping, and molecular phenotyping in segregating populations of plants. This review has the purpose of helping researchers who have not incorporated this technology to their work to think about the requirements and possibilities of HTS. By no means this review refers to all available experimental designs or analysis tools, and the solutions proposed here are mere suggestions that will certainly soon be substituted by new and better ones. A guide map of the methods proposed in this review is depicted in Figure 1.
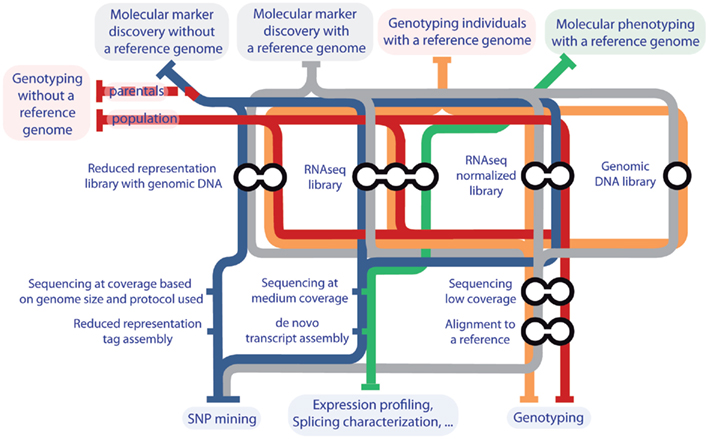
Figure 1. Guide map to the proposed pipelines for SNP identification, genotyping, and molecular phenotyping for QTL analysis in plants. Medium coverage is considered from 20× to 100× the genome or transcriptome size under study. Low coverage is considered under 15× the genome or transcriptome size under study.
Library Preparation
Sample preparation protocols are continuously improved to use fewer amounts of biological material, be completed faster, and reduce the bias in their output. As an example, most current protocols allow multiplexing samples by adding a short sequence tag to all reads in a library, a convenient feature given the increasing numbers of reads produced per HTS run. The same companies that developed the HTS sequencers commercialize library preparation protocols optimized for the most common experimental designs. There are also kits from other companies that give comparable results and may be more cost efficient. Finally, many researchers are developing custom protocols to obtain specific information such as the transcribed strand in RNA-seq experiments, the rate of RNA degradation, or the positions occupied by RNA polymerases, just to name a few (Addo-Quaye et al., 2008; Core et al., 2008; German et al., 2008; Parkhomchuk et al., 2009).
Quality Control and Pre-Processing
Assessing the quality of HTS reads includes detection of biases on base composition, base quality, and sample complexity. The quality of the sequences has an impact on the reliability of the biological interpretations resulting from the analysis (Dohm et al., 2008). Part of these biases are introduced by the sample preparation protocols (Schwartz et al., 2011), particularly during cDNA synthesis in RNA-seq experiments (Hansen et al., 2010; Li et al., 2010b) and PCR amplification (Aird et al., 2011). Additional biases are particular to each HTS technology (Smith et al., 2008; Quince et al., 2011) or specific to each run of the sequencers (Auer and Doerge, 2010).
After quality control it is usually necessary to pre-process the reads by trimming low quality nucleotides and adapter sequences. At this stage, foreign sequences such as vectors or DNA from organisms contaminating the samples can also be removed. Depending of the type of libraries sequenced further pre-processing may be needed, such as trimming poly A or poly T tails and terminal transferase tails in RNA-seq libraries. In cases where several libraries have been multiplexed, reads should be separated by their barcode.
Both quality control and pre-processing can be easily performed with basic scripts written in Perl (Bioperl), R (Bioconductor), or Python (Biopython; Stajich et al., 2002; Gentleman et al., 2004; Cock et al., 2009; R Development Core Team, 2009). For non-programmers, there are some convenient tools that can carry out all or some of these tasks (FastQC, 2008; FASTX-Toolkit, 2009; Blankenberg et al., 2010; Falgueras et al., 2010; Goecks et al., 2010; Cutadapt, 2010; Schmieder et al., 2010; Schmieder and Edwards, 2011).
Molecular Marker Discovery
Depending on the availability of a reference sequence short reads will be aligned or de novo assembled using one of the multiple tools available. There are a number of recent articles that compare the most popular algorithms and software available for these purposes (Bao et al., 2011; Lin et al., 2011; Ruffalo et al., 2011). Please note that the methods proposed below are directed to developing molecular markers for QTL analysis and not to identify the mutation underlying the QTL, which requires much deeper sequencing.
With a Reference Sequence
A cost efficient solution to obtain molecular markers is to sequence DNA or RNA from the parental genotypes and mine polymorphisms from the resulting reads. These polymorphisms can be used later to design PCR markers or a high-throughput genotyping assay for the full population. This approach works remarkably well in diploid and polyploidy species using as low an amount of sequence as 5× coverage, meaning five times the size of the genome under study (Ossowski et al., 2008; Gore et al., 2009; Trick et al., 2009; Lai et al., 2010; Lam et al., 2010; Arai-Kichise et al., 2011; Geraldes et al., 2011). A recent article reviews the methods and tools available for single nucleotide polymorphism (SNP) identification and genotyping (Nielsen et al., 2011). To align the reads to the reference, mapping softwares based in “seed methods” are preferred despite their slower nature because their robustness to polymorphisms. Before SNP calling users may consider removal of the reads that map to multiple locations in the reference, and of duplicated reads that may have been generated from PCR artifacts. A recent pipeline also recalibrates the quality of the nucleotides in the reads to correct for the high error rates in HTS, and realigns reads in complex genomic positions where the fast processing alignment algorithms may have failed (Depristo et al., 2011). Commonly used indicators of the veracity of polymorphisms are based in the amount and quality of reads showing the polymorphism, frequency of the observed alleles, quality of the alignment, and/or proximity to other polymorphisms. There are some basic and popular options for calling polymorphisms from aligned reads (Li et al., 2009a,b; Depristo et al., 2011), tools specialized in the analysis of reads from particular sequencing platforms (Souaiaia et al., 2011), that have the ability to detect structural variation (Chen et al., 2009; Hormozdiari et al., 2009, 2010), or that have into account the quality of the reference in addition to the quality of the reads (Frohler and Dieterich, 2010). An essential method to control for the quality of the data analysis process is visual inspection through genome viewers specialized in HTS datasets (Huang and Marth, 2008; Bao et al., 2009; Milne et al., 2010; Robinson et al., 2011).
Without a Reference Sequence
High-throughput sequencing sequences can serve to construct the necessary reference to identify molecular markers if it is not already available. Although assembling de novo a complete genome sequence is possible with HTS, it requires very deep sequencing and extensive bioinformatic analysis, even more given the relatively large size of most plant genomes. A more efficient option is sequencing mRNA, which greatly reduces sample complexity in comparison with genome sequencing and has the advantage of offering functional information such as coding polymorphisms or expression levels (Graham et al., 2010; Mizrachi et al., 2010; Bancroft et al., 2011; Everett et al., 2011; Garg et al., 2011; Guo et al., 2011; Ibarra-Laclette et al., 2011; Ness et al., 2011; Su et al., 2011; Wei et al., 2011). A comprehensive compilation of the methods and tools available for transcriptome assembly has been recently published (Martin and Wang, 2011). De novo assembly algorithms greatly benefit from long and paired-end reads, but are extremely sensitive to errors and polymorphisms and will not perform well during assembly of datasets from mixed genotypes or highly heterozygous individuals. The amount of new genomic positions detected in RNA-seq experiments decrease exponentially as the number of reads increases (Figure 2). The majority of medium and highly expressed transcripts in a sample are detected at low coverage, and increasing coverage will mainly add non-coding RNAs and low expressed transcripts at a very high cost (Tarazona et al., 2011). If the objective is to assemble complete transcriptomes, obtaining samples from diverse tissues, time points, and conditions is preferred to depth of sequencing. Even in the best possible conditions assemblies from RNA-seq reads will return only a subset of the existing transcripts, many of which will be fragmented. This is expected due to low expression of particular transcripts, the non-uniform read coverage, and the presence of different isoforms per gene. To help assembly of low expressed transcripts researchers can use normalization protocols that deplete the most abundant transcripts from the samples (Christodoulou et al., 2011). In any case, contigs resulting from de novo assembly can be effectively used as a reference for molecular marker detection and characterization of transcripts in un-sequenced genomes (Parchman et al., 2010; Wang et al., 2010e; Angeloni et al., 2011; Hiremath et al., 2011; Kaur et al., 2011).
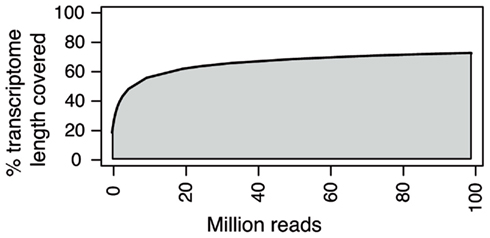
Figure 2. Percentage of transcriptome covered versus number of RNA-seq reads used. Eighty-one base pair paired-end RNA-seq reads from S. lycopersicum were randomly sampled in different subset sizes and aligned to the S. lycopersicum genome reference. The percentage of the length of the transcriptome covered by at least one read is represented at different coverages.
When highly similar genotypes are compared, RNA-seq may not be the best option since it mostly targets coding regions, which are less diverse than non-coding regions. In these cases researchers can construct reduced representation libraries by shearing DNA using restriction endonucleases and size-selecting the fragments that will be sequenced. Reads from these libraries can be clustered by similarity and mined for polymorphisms close to the restriction sites; or used to detect the presence–absence of particular tags, indicating a polymorphism in the restriction site itself (Kerstens et al., 2009; Sanchez et al., 2009; Etter et al., 2011). Obtaining polymorphisms from reduced representation libraries is more efficient when a reference sequence is available (Van Tassell et al., 2008; Wu et al., 2010). However, researchers have already developed tools to genotype samples from these tags using a low number of reads from organisms without a reference (Ratan et al., 2010), or to reconstruct part of the targeted genome using paired-end sequencing (Willing et al., 2011). Additional protocols to obtain markers from reduced representation libraries exist in which different combination of restriction enzymes are used for each of the genotypes involved (Hyten et al., 2010), or that do not shear the DNA but filter the reads for single copy sequences (You et al., 2011). The amount of reads necessary to perform this type of analysis depends on the size of the genome, the restriction enzymes used, and the availability of a reference.
Genotyping Populations
With the price drop of the HTS technologies and the possibility of multiplexing samples, genotyping an entire population has become realistic (Schneeberger and Weigel, 2011). In the case of a sequenced system such as rice, generating reads from the individuals of a population at 0.02–0.055× coverage allowed high-density genotyping by comparisons with the parental genotypes (Huang et al., 2009), or by inferring the parental genotypes from the polymorphisms found in the population (Xie et al., 2010). Since erroneous polymorphism calls are expected at low coverage, more or less complex algorithms need to be defined to correctly genotype each polymorphism in each individual (Huang et al., 2009; Xie et al., 2010; Li et al., 2011). In addition, a reference sequence can serve researchers to design enrichment essays that will target their preferred genomic locations, although at high cost (Blow, 2009; Mamanova et al., 2010; Nijman et al., 2010; Kenny et al., 2011). For species where a genome sequence is not available, a very practical approach is to sequence reduced representation libraries as mentioned above (Baird et al., 2008; Emerson et al., 2010b; Hohenlohe et al., 2010, 2011).
Molecular Phenotyping
The list of molecular phenotypes that can be quantified with HTS is extensive and is rapidly increasing (Hawkins et al., 2010). Examples of these phenotypes are protein–RNA interactions (Licatalosi et al., 2008; Hafner et al., 2010), translation rates (Ingolia et al., 2009; Ingolia, 2010), transcription rates (Core et al., 2008; Churchman and Weissman, 2011), protein–DNA interactions (Albert et al., 2007; Barski et al., 2007; Johnson et al., 2007; Mikkelsen et al., 2007; Robertson et al., 2007; Chen et al., 2008; Hesselberth et al., 2009), RNA degradation rates (Addo-Quaye et al., 2008; German et al., 2008), RNA secondary structure (Kertesz et al., 2010; Underwood et al., 2010), transcription start positions (Plessy et al., 2010), chromatin accessibility (Boyle et al., 2008), methylation states (Cokus et al., 2008; Down et al., 2008; Lister et al., 2008; Meissner et al., 2008), natural antisense transcription (Cloonan et al., 2008; Core et al., 2008; He et al., 2008; Armour et al., 2009; Parkhomchuk et al., 2009) or small RNA profiles (Lu et al., 2005). QTL analysis using these phenotypes as traits is an exciting field that remains un-explored. Therefore, the computational frameworks to quantitatively compare these phenotypes between individuals will need to be established.
Expression Profiling with HTS
Although many cases of phenotypic variation caused by coding polymorphisms have been documented, variation in gene expression has been shown to underlie much of phenotypic diversity (Reviewed in Hoekstra and Coyne, 2007; Wray, 2007; Stern and Orgogozo, 2008). One method to detect differences in expression between individuals using HTS is to sequence 26–27 nucleotide-long tags from expressed transcripts (Matsumura et al., 2010; Hong et al., 2011). A recent study shows that this method reaches saturation in mice with 6–8 million reads per sample (Hong et al., 2011). Its advantages over sequencing full transcripts are the lower cost, higher sensitivity, reduced bias during amplification due to the fixed fragment lengths, and use of simplified statistical models to calculate differential expression. On the other hand, methods based in tags will not detect the majority of coding polymorphisms and isoforms, and require a close enough reference sequence to extract biologically meaningful results.
RNA-seq is rapidly becoming a standard in expression profiling because of its simple protocol of preparation, digital nature, large dynamic range, and high sensitivity in comparison with previous technologies (Marioni et al., 2008; Bradford et al., 2010; Liu et al., 2010). In addition, it can serve to genotype individuals, identify novel transcripts, characterize alternative splicing, and quantify allele specific expression (Reviewed in Wang et al., 2009; Costa et al., 2010; Marguerat and Bahler, 2010). Due to the novelty of the technique there is no consensus on which sample preparation protocols present fewer biases (Raz et al., 2011). However, strand-specific methods could become a standard because of their increased precision due to their ability to distinguish between sense and antisense transcripts (He et al., 2008; Levin et al., 2010). In terms of experimental designs, it is necessary to randomize and replicate biological samples, as with any other type of genome-wide analysis (Auer and Doerge, 2010; Fang and Cui, 2011; Hansen et al., 2011). There is little consensus about the depth of sequence needed for expression profiling with RNA-seq. Recent estimates range between 30 million reads to compare the expression profiles of two samples, to 100 million reads to detect most transcribed genes and quantify isoforms, to 500 million to obtain accurate profiles, including low expressed transcripts (Zhang et al., 2010; ENCODE, 2011; Toung et al., 2011). In any case, it is advisable to balance the number of reads between samples in the same experiment in order to perform accurate expression comparisons (Tarazona et al., 2011).
Expression profiling from HTS datasets is necessarily based on counting the reads mapped to each transcript in a reference sequence. When a reference genome or transcriptome is not available, it can be reconstructed using de novo assembly of the reads for at least one of the genotypes as described above. The simpler and less computational intensive protocol for expression profiling is to map the RNA-seq reads to known (or de novo assembled) transcripts and a set of possible exon–exon junctions (when available) to detect alternative splicing. However, in organisms with sequenced genomes this protocol will not allow detection of novel exons, transcripts, and isoforms. The preferred pipeline involves aligning the reads to the genomic reference using an alignment tool that splices the reads to detect intron–exon junctions (For example Trapnell et al., 2009; Ameur et al., 2010; Au et al., 2010; Guttman et al., 2010; Wang et al., 2010b; Lou et al., 2011).
A challenge for expression analyses in samples from two unrelated individuals is the need to perform robust quantification of reads generated from two or more alleles. This implies that reads with the closer genotype to the reference will align better than reads from a more distant genotype, in which more polymorphisms may interfere with their ability to map (Fontanillas et al., 2010). In these cases, aligners based in seed methods will perform better than those based in the Burrows–Wheeler Transform algorithm (For a review see Garber et al., 2011). Although most studies ignore this problem, there are solutions that go from identifying and removing the polymorphisms that cause these biases (Degner et al., 2009), aligning the reads to all references from the genotypes involved (Bullard et al., 2010a) or including the polymorphisms found in the references (Gan et al., 2011). When two references are used, a potential problem may arise from motifs that are more abundant in one reference with respect to the other if only uniquely mapped reads are counted. The use of longer reads and/or paired-end reads greatly decreases the number of ambiguously mapped reads. In addition, there are robust methods to assign these multi-mapped reads to a single location (Faulkner et al., 2008; Mortazavi et al., 2008; Hashimoto et al., 2009; Li et al., 2010a; Wang et al., 2010a; Ji et al., 2011).
There are a number of tools to count the number of reads aligned to each transcriptional unit to calculate expression, most of which require knowledge of Perl, Phyton, Linux/Unix, or R (Carlson et al., 2009; Bio::DB::Sam, 2009; Anders, 2010; Morgan and Pagès, 2010; Quinlan and Hall, 2010). Some alignment tools can directly calculate the number of reads per transcript and/or a measure of expression based in the reads (or fragments) per gene size in kilobases per million reads mapped, called RPKM (or FPKM; Mortazavi et al., 2008; Trapnell et al., 2010). However, these expression units show biases depending on the length, number, abundance of the transcripts present in the samples, or because of technical replication (Oshlack and Wakefield, 2009; Bullard et al., 2010b; Mcintyre et al., 2011). For this reason researchers have developed dedicated R/Bioconductor packages to calculate differential expression between samples based on raw read counts per transcript (Anders and Huber, 2010; Bullard et al., 2010b; Hardcastle and Kelly, 2010; Robinson et al., 2010; Wang et al., 2010c). In addition, there are software packages that take into consideration the biases inherent to RNA-seq when calculating expression or performing downstream analyses such as gene ontology over-representation studies (Young et al., 2010; Zheng et al., 2011).
High-throughput sequencing datasets allow quantification of expression for each isoform separately, resulting in significantly more accurate estimates than calculating expression at the gene level (Wang et al., 2010d). For this, users must first identify splicing events from the reads that align to exon–exon junctions. Quantifying isoform expression is complicated since most reads in an alternatively spliced transcript cannot be assigned to a single isoform. The most promising methods to address this complex problem take advantage from the information offered by paired-end and/or unambiguously mapped reads (Guttman et al., 2010; Katz et al., 2010; Li et al., 2010a; Trapnell et al., 2010; Nicolae et al., 2011). One advantage of going through the intricate process of identification of alternative splicing is that it can also be used as a trait for QTL analysis (Li et al., 2010c; Montgomery et al., 2010; Pickrell et al., 2010; Lalonde et al., 2011).
Allele Specific Expression in Hybrids
An alternative to sequencing a full segregating population to perform eQTL analyses is to sequence F1 hybrid individuals, where allele specific expression can be calculated for loci with coding polymorphisms (Babak et al., 2008, 2010; Bullard et al., 2010a; Emerson et al., 2010a; Mcmanus et al., 2010; Pickrell et al., 2010). For any gene, both alleles in the hybrid share the same cellular environment and, as a result, changes in expression between alleles must necessarily be due to cis-acting regulators (Cowles et al., 2002). Trans-acting eQTLs can be inferred by performing RNA-seq in the parentals and comparing the differences in expression levels between alleles in the hybrid with the differences between the parentals (Wittkopp et al., 2004). Despite the considerable reduction in price and simplicity of experimental design, this method has several drawbacks. Allele specific expression can only be calculated in transcripts with coding polymorphisms that are highly covered, and it is very dependent on read and transcript length (Degner et al., 2009; Fontanillas et al., 2010). New statistical approaches are being developed that will overcome these limitations, starting by being able to estimate false discovery rates and allele specific alternative splicing (Skelly et al., 2011).
In summary, HTS is changing the way we perform QTL analysis by allowing high-throughput genotyping of populations and phenotyping of traits with a precision not achievable before. It is clear that HTS has not reached its peak of development, and that tools and algorithms will have to be modified according to the new technological improvements. Nevertheless, the first experiments using this technology have already identified exciting possibilities for the characterization of natural variation in plants.
Conflict of Interest Statement
The author declares that the research was conducted in the absence of any commercial or financial relationships that could be construed as a potential conflict of interest.
References
Addo-Quaye, C., Eshoo, T. W., Bartel, D. P., and Axtell, M. J. (2008). Endogenous siRNA and miRNA targets identified by sequencing of the Arabidopsis degradome. Curr. Biol. 18, 758–762.
Aird, D., Ross, M. G., Chen, W. S., Danielsson, M., Fennell, T., Russ, C., Jaffe, D. B., Nusbaum, C., and Gnirke, A. (2011). Analyzing and minimizing PCR amplification bias in Illumina sequencing libraries. Genome Biol. 12, R18.
Albert, I., Mavrich, T. N., Tomsho, L. P., Qi, J., Zanton, S. J., Schuster, S. C., and Pugh, B. F. (2007). Translational and rotational settings of H2A.Z nucleosomes across the Saccharomyces cerevisiae genome. Nature 446, 572–576.
Ameur, A., Wetterbom, A., Feuk, L., and Gyllensten, U. (2010). Global and unbiased detection of splice junctions from RNA-seq data. Genome Biol. 11, R34.
Anders, S. (2010). HTSeq: Analysing High-Throughput Sequencing Data With Python. Available at: http://www-huber.embl.de/users/anders/HTSeq/doc/overview.html#author
Anders, S., and Huber, W. (2010). Differential expression analysis for sequence count data. Genome Biol. 11, R106.
Angeloni, F., Wagemaker, C. A., Jetten, M. S., Op Den Camp, H. J., Janssen-Megens, E. M., Francoijs, K. J., Stunnenberg, H. G., and Ouborg, N. J. (2011). De novo transcriptome characterization and development of genomic tools for Scabiosa columbaria L. using next-generation sequencing techniques. Mol. Ecol. Resour. 11, 662–674.
Arai-Kichise, Y., Shiwa, Y., Nagasaki, H., Ebana, K., Yoshikawa, H., Yano, M., and Wakasa, K. (2011). Discovery of genome-wide DNA polymorphisms in a landrace cultivar of Japonica rice by whole-genome sequencing. Plant Cell Physiol. 52, 274–282.
Armour, C. D., Castle, J. C., Chen, R., Babak, T., Loerch, P., Jackson, S., Shah, J. K., Dey, J., Rohl, C. A., Johnson, J. M., and Raymond, C. K. (2009). Digital transcriptome profiling using selective hexamer priming for cDNA synthesis. Nat. Methods 6, 647–649.
Au, K. F., Jiang, H., Lin, L., Xing, Y., and Wong, W. H. (2010). Detection of splice junctions from paired-end RNA-seq data by SpliceMap. Nucleic Acids Res. 38, 4570–4578.
Auer, P. L., and Doerge, R. W. (2010). Statistical design and analysis of RNA sequencing data. Genetics 185, 405–416.
Austin, R. S., Vidaurre, D., Stamatiou, G., Breit, R., Provart, N. J., Bonetta, D., Zhang, J., Fung, P., Gong, Y., Wang, P. W., Mccourt, P., and Guttman, D. S. (2011). Next-generation mapping of Arabidopsis genes. Plant J. 67, 715–725.
Babak, T., Deveale, B., Armour, C., Raymond, C., Cleary, M. A., Van Der Kooy, D., Johnson, J. M., and Lim, L. P. (2008). Global survey of genomic imprinting by transcriptome sequencing. Curr. Biol. 18, 1735–1741.
Babak, T., Garrett-Engele, P., Armour, C. D., Raymond, C. K., Keller, M. P., Chen, R., Rohl, C. A., Johnson, J. M., Attie, A. D., Fraser, H. B., and Schadt, E. E. (2010). Genetic validation of whole-transcriptome sequencing for mapping expression affected by cis-regulatory variation. BMC Genomics 11, 473. doi:10.1186/1471-2164-11-473
Baird, N. A., Etter, P. D., Atwood, T. S., Currey, M. C., Shiver, A. L., Lewis, Z. A., Selker, E. U., Cresko, W. A., and Johnson, E. A. (2008). Rapid SNP discovery and genetic mapping using sequenced RAD markers. PLoS ONE 3, e3376. doi:10.1371/journal.pone.0003376
Bancroft, I., Morgan, C., Fraser, F., Higgins, J., Wells, R., Clissold, L., Baker, D., Long, Y., Meng, J., Wang, X., Liu, S., and Trick, M. (2011). Dissecting the genome of the polyploid crop oilseed rape by transcriptome sequencing. Nat. Biotechnol. 29, 762–766.
Bao, H., Guo, H., Wang, J., Zhou, R., Lu, X., and Shi, S. (2009). MapView: visualization of short reads alignment on a desktop computer. Bioinformatics 25, 1554–1555.
Bao, S., Jiang, R., Kwan, W., Wang, B., Ma, X., and Song, Y. Q. (2011). Evaluation of next-generation sequencing software in mapping and assembly. J. Hum. Genet. 56, 406–414.
Barski, A., Cuddapah, S., Cui, K., Roh, T. Y., Schones, D. E., Wang, Z., Wei, G., Chepelev, I., and Zhao, K. (2007). High-resolution profiling of histone methylations in the human genome. Cell 129, 823–837.
Bio::DB::Sam. (2009). Available at: http://search.cpan.org/∼lds/Bio-SamTools/lib/Bio/DB/Bam/Alignment.pm
Blankenberg, D., Gordon, A., Von Kuster, G., Coraor, N., Taylor, J., and Nekrutenko, A. (2010). Manipulation of FASTQ data with galaxy. Bioinformatics 26, 1783–1785.
Boyle, A. P., Davis, S., Shulha, H. P., Meltzer, P., Margulies, E. H., Weng, Z., Furey, T. S., and Crawford, G. E. (2008). High-resolution mapping and characterization of open chromatin across the genome. Cell 132, 311–322.
Bradford, J. R., Hey, Y., Yates, T., Li, Y., Pepper, S. D., and Miller, C. J. (2010). A comparison of massively parallel nucleotide sequencing with oligonucleotide microarrays for global transcription profiling. BMC Genomics 11, 282. doi:10.1186/1471-2164-11-282
Bullard, J. H., Mostovoy, Y., Dudoit, S., and Brem, R. B. (2010a). Polygenic and directional regulatory evolution across pathways in Saccharomyces. Proc. Natl. Acad. Sci. U.S.A. 107, 5058–5063.
Bullard, J. H., Purdom, E., Hansen, K. D., and Dudoit, S. (2010b). Evaluation of statistical methods for normalization and differential expression in mRNA-seq experiments. BMC Bioinformatics 11, 94. doi:10.1186/1471-2105-11-94
Carlson, M., Pages, H., Aboyoun, P., Falcon, S., Morgan, M., Sarkar, D., and Lawrence, M. (2009). Genomic Features: Tools for Making and Manipulating Transcript Centric Annotations. Available at: http://www.bioconductor.org/packages/2.6/bioc/html/GenomicFeatures.html
Chen, K., Wallis, J. W., Mclellan, M. D., Larson, D. E., Kalicki, J. M., Pohl, C. S., Mcgrath, S. D., Wendl, M. C., Zhang, Q., Locke, D. P., Shi, X., Fulton, R. S., Ley, T. J., Wilson, R. K., Ding, L., and Mardis, E. R. (2009). BreakDancer: an algorithm for high-resolution mapping of genomic structural variation. Nat. Methods 6, 677–681.
Chen, X., Xu, H., Yuan, P., Fang, F., Huss, M., Vega, V. B., Wong, E., Orlov, Y. L., Zhang, W., Jiang, J., Loh, Y. H., Yeo, H. C., Yeo, Z. X., Narang, V., Govindarajan, K. R., Leong, B., Shahab, A., Ruan, Y., Bourque, G., Sung, W. K., Clarke, N. D., Wei, C. L., and Ng, H. H. (2008). Integration of external signaling pathways with the core transcriptional network in embryonic stem cells. Cell 133, 1106–1117.
Christodoulou, D. C., Gorham, J. M., Herman, D. S., and Seidman, J. (2011). Construction of normalized RNA-seq libraries for next-generation sequencing using the crab duplex-specific nuclease. Curr. Protoc. Mol. Biol. 94, 4.12.1–4.12.11.
Churchman, L. S., and Weissman, J. S. (2011). Nascent transcript sequencing visualizes transcription at nucleotide resolution. Nature 469, 368–373.
Cloonan, N., Forrest, A. R., Kolle, G., Gardiner, B. B., Faulkner, G. J., Brown, M. K., Taylor, D. F., Steptoe, A. L., Wani, S., Bethel, G., Robertson, A. J., Perkins, A. C., Bruce, S. J., Lee, C. C., Ranade, S. S., Peckham, H. E., Manning, J. M., Mckernan, K. J., and Grimmond, S. M. (2008). Stem cell transcriptome profiling via massive-scale mRNA sequencing. Nat. Methods 5, 613–619.
Cock, P. J., Antao, T., Chang, J. T., Chapman, B. A., Cox, C. J., Dalke, A., Friedberg, I., Hamelryck, T., Kauff, F., Wilczynski, B., and De Hoon, M. J. (2009). Biopython: freely available Python tools for computational molecular biology and bioinformatics. Bioinformatics 25, 1422–1423.
Cokus, S. J., Feng, S., Zhang, X., Chen, Z., Merriman, B., Haudenschild, C. D., Pradhan, S., Nelson, S. F., Pellegrini, M., and Jacobsen, S. E. (2008). Shotgun bisulphite sequencing of the Arabidopsis genome reveals DNA methylation patterning. Nature 452, 215–219.
Core, L. J., Waterfall, J. J., and Lis, J. T. (2008). Nascent RNA sequencing reveals widespread pausing and divergent initiation at human promoters. Science 322, 1845–1848.
Costa, V., Angelini, C., De Feis, I., and Ciccodicola, A. (2010). Uncovering the complexity of transcriptomes with RNA-seq. J. Biomed. Biotechnol. 2010, 853916.
Cowles, C. R., Hirschhorn, J. N., Altshuler, D., and Lander, E. S. (2002). Detection of regulatory variation in mouse genes. Nat. Genet. 32, 432–437.
Cutadapt. (2010). A Tool That Removes Adapter Sequences From DNA Sequencing Reads. Available at: http://code.google.com/p/cutadapt/
Decook, R., Lall, S., Nettleton, D., and Howell, S. H. (2006). Genetic regulation of gene expression during shoot development in Arabidopsis. Genetics 172, 1155–1164.
Degner, J. F., Marioni, J. C., Pai, A. A., Pickrell, J. K., Nkadori, E., Gilad, Y., and Pritchard, J. K. (2009). Effect of read-mapping biases on detecting allele-specific expression from RNA-sequencing data. Bioinformatics 25, 3207–3212.
Depristo, M. A., Banks, E., Poplin, R., Garimella, K. V., Maguire, J. R., Hartl, C., Philippakis, A. A., Del Angel, G., Rivas, M. A., Hanna, M., Mckenna, A., Fennell, T. J., Kernytsky, A. M., Sivachenko, A. Y., Cibulskis, K., Gabriel, S. B., Altshuler, D., and Daly, M. J. (2011). A framework for variation discovery and genotyping using next-generation DNA sequencing data. Nat. Genet. 43, 491–498.
Dohm, J. C., Lottaz, C., Borodina, T., and Himmelbauer, H. (2008). Substantial biases in ultra-short read data sets from high-throughput DNA sequencing. Nucleic Acids Res. 36, e105.
Down, T. A., Rakyan, V. K., Turner, D. J., Flicek, P., Li, H., Kulesha, E., Graf, S., Johnson, N., Herrero, J., Tomazou, E. M., Thorne, N. P., Backdahl, L., Herberth, M., Howe, K. L., Jackson, D. K., Miretti, M. M., Marioni, J. C., Birney, E., Hubbard, T. J., Durbin, R., Tavare, S., and Beck, S. (2008). A Bayesian deconvolution strategy for immunoprecipitation-based DNA methylome analysis. Nat. Biotechnol. 26, 779–785.
Drost, D. R., Benedict, C. I., Berg, A., Novaes, E., Novaes, C. R., Yu, Q., Dervinis, C., Maia, J. M., Yap, J., Miles, B., and Kirst, M. (2010). Diversification in the genetic architecture of gene expression and transcriptional networks in organ differentiation of Populus. Proc. Natl. Acad. Sci. U.S.A. 107, 8492–8497.
Emerson, J. J., Hsieh, L. C., Sung, H. M., Wang, T. Y., Huang, C. J., Lu, H. H., Lu, M. Y., Wu, S. H., and Li, W. H. (2010a). Natural selection on cis and trans regulation in yeasts. Genome Res. 20, 826–836.
Emerson, K. J., Merz, C. R., Catchen, J. M., Hohenlohe, P. A., Cresko, W. A., Bradshaw, W. E., and Holzapfel, C. M. (2010b). Resolving postglacial phylogeography using high-throughput sequencing. Proc. Natl. Acad. Sci. U.S.A. 107, 16196–16200.
Etter, P. D., Preston, J. L., Bassham, S., Cresko, W. A., and Johnson, E. A. (2011). Local de novo assembly of RAD paired-end contigs using short sequencing reads. PLoS ONE 6, e18561. doi:10.1371/journal.pone.0018561
Everett, M. V., Grau, E. D., and Seeb, J. E. (2011). Short reads and nonmodel species: exploring the complexities of next-generation sequence assembly and SNP discovery in the absence of a reference genome. Mol. Ecol. Resour. 11(Suppl. 1), 93–108.
Falgueras, J., Lara, A. J., Fernandez-Pozo, N., Canton, F. R., Perez-Trabado, G., and Claros, M. G. (2010). SeqTrim: a high-throughput pipeline for pre-processing any type of sequence read. BMC Bioinformatics 11, 38. doi:10.1186/1471-2105-11-38
Fang, Z., and Cui, X. (2011). Design and validation issues in RNA-seq experiments. Brief. Bioinform. 12, 280–287.
FastQC. (2008). Available at: http://www.bioinformatics.bbsrc.ac.uk/projects/fastqc/
FASTX-Toolkit. (2009). Available at: http://hannonlab.cshl.edu/fastx_toolkit/index.html
Faulkner, G. J., Forrest, A. R., Chalk, A. M., Schroder, K., Hayashizaki, Y., Carninci, P., Hume, D. A., and Grimmond, S. M. (2008). A rescue strategy for multi mapping short sequence tags refines surveys of transcriptional activity by CAGE. Genomics 91, 281–288.
Fisher, R. A. (1918). The correlation between relatives on the supposition of Mendelian inheritance. Philos. Trans. R. Soc. Edinb. 52, 399–433.
Fontanillas, P., Landry, C. R., Wittkopp, P. J., Russ, C., Gruber, J. D., Nusbaum, C., and Hartl, D. L. (2010). Key considerations for measuring allelic expression on a genomic scale using high-throughput sequencing. Mol. Ecol. 19(Suppl. 1), 212–227.
Frohler, S., and Dieterich, C. (2010). ACCUSA – accurate SNP calling on draft genomes. Bioinformatics 26, 1364–1365.
Gan, X., Stegle, O., Behr, J., Steffen, J. G., Drewe, P., Hildebrand, K. L., Lyngsoe, R., Schultheiss, S. J., Osborne, E. J., Sreedharan, V. T., Kahles, A., Bohnert, R., Jean, G., Derwent, P., Kersey, P., Belfield, E. J., Harberd, N. P., Kemen, E., Toomajian, C., Kover, P. X., Clark, R. M., Ratsch, G., and Mott, R. (2011). Multiple reference genomes and transcriptomes for Arabidopsis thaliana. Nature 477, 419–423.
Garber, M., Grabherr, M. G., Guttman, M., and Trapnell, C. (2011). Computational methods for transcriptome annotation and quantification using RNA-seq. Nat. Methods 8, 469–477.
Garg, R., Patel, R. K., Jhanwar, S., Priya, P., Bhattacharjee, A., Yadav, G., Bhatia, S., Chattopadhyay, D., Tyagi, A. K., and Jain, M. (2011). Gene discovery and tissue-specific transcriptome analysis in chickpea with massively parallel pyrosequencing and web resource development. Plant Physiol. 156, 1661–1678.
Gentleman, R. C., Carey, V. J., Bates, D. M., Bolstad, B., Dettling, M., Dudoit, S., Ellis, B., Gautier, L., Ge, Y., Gentry, J., Hornik, K., Hothorn, T., Huber, W., Iacus, S., Irizarry, R., Leisch, F., Li, C., Maechler, M., Rossini, A. J., Sawitzki, G., Smith, C., Smyth, G., Tierney, L., Yang, J. Y., and Zhang, J. (2004). Bioconductor: open software development for computational biology and bioinformatics. Genome Biol. 5, R80.
Geraldes, A., Pang, J., Thiessen, N., Cezard, T., Moore, R., Zhao, Y., Tam, A., Wang, S., Friedmann, M., Birol, I., Jones, S. J., Cronk, Q. C., and Douglas, C. J. (2011). SNP discovery in black cottonwood (Populus trichocarpa) by population transcriptome resequencing. Mol. Ecol. Resour. 11(Suppl. 1), 81–92.
German, M. A., Pillay, M., Jeong, D. H., Hetawal, A., Luo, S., Janardhanan, P., Kannan, V., Rymarquis, L. A., Nobuta, K., German, R., De Paoli, E., Lu, C., Schroth, G., Meyers, B. C., and Green, P. J. (2008). Global identification of microRNA-target RNA pairs by parallel analysis of RNA ends. Nat. Biotechnol. 26, 941–946.
Goecks, J., Nekrutenko, A., and Taylor, J. (2010). Galaxy: a comprehensive approach for supporting accessible, reproducible, and transparent computational research in the life sciences. Genome Biol. 11, R86.
Gore, M. A., Chia, J. M., Elshire, R. J., Sun, Q., Ersoz, E. S., Hurwitz, B. L., Peiffer, J. A., Mcmullen, M. D., Grills, G. S., Ross-Ibarra, J., Ware, D. H., and Buckler, E. S. (2009). A first-generation haplotype map of maize. Science 326, 1115–1117.
Graham, I. A., Besser, K., Blumer, S., Branigan, C. A., Czechowski, T., Elias, L., Guterman, I., Harvey, D., Isaac, P. G., Khan, A. M., Larson, T. R., Li, Y., Pawson, T., Penfield, T., Rae, A. M., Rathbone, D. A., Reid, S., Ross, J., Smallwood, M. F., Segura, V., Townsend, T., Vyas, D., Winzer, T., and Bowles, D. (2010). The genetic map of Artemisia annua L. identifies loci affecting yield of the antimalarial drug artemisinin. Science 327, 328–331.
Guo, S., Liu, J., Zheng, Y., Huang, M., Zhang, H., Gong, G., He, H., Ren, Y., Zhong, S., Fei, Z., and Xu, Y. (2011). Characterization of transcriptome dynamics during watermelon fruit development: sequencing, assembly, annotation and gene expression profiles. BMC Genomics 12, 454. doi:10.1186/1471-2164-12-454
Guttman, M., Garber, M., Levin, J. Z., Donaghey, J., Robinson, J., Adiconis, X., Fan, L., Koziol, M. J., Gnirke, A., Nusbaum, C., Rinn, J. L., Lander, E. S., and Regev, A. (2010). Ab initio reconstruction of cell type-specific transcriptomes in mouse reveals the conserved multi-exonic structure of lincRNAs. Nat. Biotechnol. 28, 503–510.
Hafner, M., Landthaler, M., Burger, L., Khorshid, M., Hausser, J., Berninger, P., Rothballer, A., Ascano, M. Jr., Jungkamp, A. C., Munschauer, M., Ulrich, A., Wardle, G. S., Dewell, S., Zavolan, M., and Tuschl, T. (2010). Transcriptome-wide identification of RNA-binding protein and microRNA target sites by PAR-CLIP. Cell 141, 129–141.
Hansen, K. D., Brenner, S. E., and Dudoit, S. (2010). Biases in Illumina transcriptome sequencing caused by random hexamer priming. Nucleic Acids Res. 38, e131.
Hansen, K. D., Zhijin, W., Irizarry, R. A., and Leek, J. T. (2011). Sequencing technology does not eliminate biological variability. Nat. Biotechnol. 29, 575–573.
Hardcastle, T. J., and Kelly, K. A. (2010). baySeq: empirical Bayesian methods for identifying differential expression in sequence count data. BMC Bioinformatics 11, 422. doi:10.1186/1471-2105-11-422
Hashimoto, T., De Hoon, M. J., Grimmond, S. M., Daub, C. O., Hayashizaki, Y., and Faulkner, G. J. (2009). Probabilistic resolution of multi-mapping reads in massively parallel sequencing data using MuMRescueLite. Bioinformatics 25, 2613–2614.
Hawkins, R. D., Hon, G. C., and Ren, B. (2010). Next-generation genomics: an integrative approach. Nat. Rev. Genet. 11, 476–486.
He, Y., Vogelstein, B., Velculescu, V. E., Papadopoulos, N., and Kinzler, K. W. (2008). The antisense transcriptomes of human cells. Science 322, 1855–1857.
Hesselberth, J. R., Chen, X., Zhang, Z., Sabo, P. J., Sandstrom, R., Reynolds, A. P., Thurman, R. E., Neph, S., Kuehn, M. S., Noble, W. S., Fields, S., and Stamatoyannopoulos, J. A. (2009). Global mapping of protein-DNA interactions in vivo by digital genomic footprinting. Nat. Methods 6, 283–289.
Hiremath, P. J., Farmer, A., Cannon, S. B., Woodward, J., Kudapa, H., Tuteja, R., Kumar, A., Bhanuprakash, A., Mulaosmanovic, B., Gujaria, N., Krishnamurthy, L., Gaur, P. M., Kavikishor, P. B., Shah, T., Srinivasan, R., Lohse, M., Xiao, Y., Town, C. D., Cook, D. R., May, G. D., and Varshney, R. K. (2011). Large-scale transcriptome analysis in chickpea (Cicer arietinum L.), an orphan legume crop of the semi-arid tropics of Asia and Africa. Plant Biotechnol. J. 9, 922–931.
Hoekstra, H. E., and Coyne, J. A. (2007). The locus of evolution: evo devo and the genetics of adaptation. Evolution 61, 995–1016.
Hohenlohe, P. A., Amish, S. J., Catchen, J. M., Allendorf, F. W., and Luikart, G. (2011). Next-generation RAD sequencing identifies thousands of SNPs for assessing hybridization between rainbow and west slope cutthroat trout. Mol. Ecol. Resour. 11(Suppl. 1), 117–122.
Hohenlohe, P. A., Bassham, S., Etter, P. D., Stiffler, N., Johnson, E. A., and Cresko, W. A. (2010). Population genomics of parallel adaptation in threespine stickleback using sequenced RAD tags. PLoS Genet. 6, e1000862. doi:10.1371/journal.pgen.1000862
Hong, L. Z., Li, J., Schmidt-Kuntzel, A., Warren, W. C., and Barsh, G. S. (2011). Digital gene expression for non-model organisms. Genome Res. doi: 10.1101/gr.122135.111. [Epub ahead of print].
Hormozdiari, F., Alkan, C., Eichler, E. E., and Sahinalp, S. C. (2009). Combinatorial algorithms for structural variation detection in high-throughput sequenced genomes. Genome Res. 19, 1270–1278.
Hormozdiari, F., Hajirasouliha, I., Dao, P., Hach, F., Yorukoglu, D., Alkan, C., Eichler, E. E., and Sahinalp, S. C. (2010). Next-generation VariationHunter: combinatorial algorithms for transposon insertion discovery. Bioinformatics 26, i350–i357.
Huang, W., and Marth, G. (2008). EagleView: a genome assembly viewer for next-generation sequencing technologies. Genome Res. 18, 1538–1543.
Huang, X., Feng, Q., Qian, Q., Zhao, Q., Wang, L., Wang, A., Guan, J., Fan, D., Weng, Q., Huang, T., Dong, G., Sang, T., and Han, B. (2009). High-throughput genotyping by whole-genome resequencing. Genome Res. 19, 1068–1076.
Hyten, D. L., Song, Q., Fickus, E. W., Quigley, C. V., Lim, J. S., Choi, I. Y., Hwang, E. Y., Pastor-Corrales, M., and Cregan, P. B. (2010). High-throughput SNP discovery and assay development in common bean. BMC Genomics 11, 475. doi: 10.1186/1471-2164-11-475
Ibarra-Laclette, E., Albert, V. A., Perez-Torres, C. A., Zamudio-Hernandez, F., Ortega-Estrada Mde, J., Herrera-Estrella, A., and Herrera-Estrella, L. (2011). Transcriptomics and molecular evolutionary rate analysis of the bladderwort (Utricularia), a carnivorous plant with a minimal genome. BMC Plant Biol. 11, 101. doi:10.1186/1471-2229-11-101
Ingolia, N. T. (2010). Genome-wide translational profiling by ribosome footprinting. Meth. Enzymol. 470, 119–142.
Ingolia, N. T., Ghaemmaghami, S., Newman, J. R., and Weissman, J. S. (2009). Genome-wide analysis in vivo of translation with nucleotide resolution using ribosome profiling. Science 324, 218–223.
Ji, Y., Xu, Y., Zhang, Q., Tsui, K.-W., Yuan, Y., Norris, C. Jr., Liang, S., and Liang, H. (2011). BM-map: Bayesian mapping of multireads for next-generation sequencing data. Biometrics. doi: 10.1111/j.1541-0420.2011.01605.x. [Epub ahead of print].
Jimenez-Gomez, J. M., Wallace, A. D., and Maloof, J. N. (2010). Network analysis identifies ELF3 as a QTL for the shade avoidance response in Arabidopsis. PLoS Genet. 6, e1001100. doi:10.1371/journal.pgen.1001100
Johnson, D. S., Mortazavi, A., Myers, R. M., and Wold, B. (2007). Genome-wide mapping of in vivo protein-DNA interactions. Science 316, 1497–1502.
Katz, Y., Wang, E. T., Airoldi, E. M., and Burge, C. B. (2010). Analysis and design of RNA sequencing experiments for identifying isoform regulation. Nat. Methods 7, 1009–1015.
Kaur, S., Cogan, N. O., Pembleton, L. W., Shinozuka, M., Savin, K. W., Materne, M., and Forster, J. W. (2011). Transcriptome sequencing of lentil based on second-generation technology permits large-scale unigene assembly and SSR marker discovery. BMC Genomics 12, 265. doi:10.1186/1471-2164-12-265
Kenny, E. M., Cormican, P., Gilks, W. P., Gates, A. S., O’dushlaine, C. T., Pinto, C., Corvin, A. P., Gill, M., and Morris, D. W. (2011). Multiplex target enrichment using DNA indexing for ultra-high throughput SNP detection. DNA Res. 18, 31–38.
Kerstens, H., Crooijmans, R., Veenendaal, A., Dibbits, B., Chin-a-Woeng, T., Den Dunnen, J., and Groenen, M. (2009). Large scale single nucleotide polymorphism discovery in unsequenced genomes using second generation high throughput sequencing technology: applied to turkey. BMC Genomics 10, 479. doi:10.1186/1471-2164-10-479
Kertesz, M., Wan, Y., Mazor, E., Rinn, J. L., Nutter, R. C., Chang, H. Y., and Segal, E. (2010). Genome-wide measurement of RNA secondary structure in yeast. Nature 467, 103–107.
Keurentjes, J. J. B., Fu, J., Terpstra, I. R., Garcia, J. M., Van Den Ackerveken, G., Snoek, L. B., Peeters, A. J. M., Vreugdenhil, D., Koornneef, M., and Jansen, R. C. (2007). Regulatory network construction in Arabidopsis by using genome-wide gene expression quantitative trait loci. Proc. Natl. Acad. Sci. U.S.A. 104, 1708–1713.
Kirst, M., Basten, C. J., Myburg, A. A., Zeng, Z. B., and Sederoff, R. R. (2005). Genetic architecture of transcript-level variation in differentiating xylem of a eucalyptus hybrid. Genetics 169, 2295–2303.
Kliebenstein, D. J., West, M. A., Van Leeuwen, H., Loudet, O., Doerge, R. W., and St Clair, D. A. (2006). Identification of QTLs controlling gene expression networks defined a priori. BMC Bioinformatics 7, 308. doi:10.1186/1471-2105-7-308
Lai, J., Li, R., Xu, X., Jin, W., Xu, M., Zhao, H., Xiang, Z., Song, W., Ying, K., Zhang, M., Jiao, Y., Ni, P., Zhang, J., Li, D., Guo, X., Ye, K., Jian, M., Wang, B., Zheng, H., Liang, H., Zhang, X., Wang, S., Chen, S., Li, J., Fu, Y., Springer, N. M., Yang, H., Wang, J., Dai, J., and Schnable, P. S. (2010). Genome-wide patterns of genetic variation among elite maize inbred lines. Nat. Genet. 42, 1027–1030.
Lalonde, E., Ha, K. C., Wang, Z., Bemmo, A., Kleinman, C. L., Kwan, T., Pastinen, T., and Majewski, J. (2011). RNA sequencing reveals the role of splicing polymorphisms in regulating human gene expression. Genome Res. 21, 545–554.
Lam, H. M., Xu, X., Liu, X., Chen, W., Yang, G., Wong, F. L., Li, M. W., He, W., Qin, N., Wang, B., Li, J., Jian, M., Wang, J., Shao, G., Sun, S. S., and Zhang, G. (2010). Resequencing of 31 wild and cultivated soybean genomes identifies patterns of genetic diversity and selection. Nat. Genet. 42, 1053–1059.
Levin, J. Z., Yassour, M., Adiconis, X., Nusbaum, C., Thompson, D. A., Friedman, N., Gnirke, A., and Regev, A. (2010). Comprehensive comparative analysis of strand-specific RNA sequencing methods. Nat. Methods 7, 709–715.
Li, B., Ruotti, V., Stewart, R. M., Thomson, J. A., and Dewey, C. N. (2010a). RNA-seq gene expression estimation with read mapping uncertainty. Bioinformatics 26, 493–500.
Li, J., Jiang, H., and Wong, W. H. (2010b). Modeling non-uniformity in short-read rates in RNA-seq data. Genome Biol. 11, R50.
Li, Y., Breitling, R., Snoek, L. B., Van Der Velde, K. J., Swertz, M. A., Riksen, J., Jansen, R. C., and Kammenga, J. E. (2010c). Global genetic robustness of the alternative splicing machinery in Caenorhabditis elegans. Genetics 186, 405–410.
Li, H., Handsaker, B., Wysoker, A., Fennell, T., Ruan, J., Homer, N., Marth, G., Abecasis, G., and Durbin, R. (2009a). The sequence alignment/map format and SAM tools. Bioinformatics 25, 2078–2079.
Li, R., Li, Y., Fang, X., Yang, H., Wang, J., and Kristiansen, K. (2009b). SNP detection for massively parallel whole-genome resequencing. Genome Res. 19, 1124–1132.
Li, Y., Sidore, C., Kang, H. M., Boehnke, M., and Abecasis, G. R. (2011). Low-coverage sequencing: implications for design of complex trait association studies. Genome Res. 21, 940–951.
Licatalosi, D. D., Mele, A., Fak, J. J., Ule, J., Kayikci, M., Chi, S. W., Clark, T. A., Schweitzer, A. C., Blume, J. E., Wang, X., Darnell, J. C., and Darnell, R. B. (2008). HITS-CLIP yields genome-wide insights into brain alternative RNA processing. Nature 456, 464–469.
Lin, Y., Li, J., Shen, H., Zhang, L., Papasian, C. J., and Deng, H. W. (2011). Comparative studies of de novo assembly tools for next-generation sequencing technologies. Bioinformatics 27, 2031–2037.
Lisec, J., Meyer, R. C., Steinfath, M., Redestig, H., Becher, M., Witucka-Wall, H., Fiehn, O., Torjek, O., Selbig, J., Altmann, T., and Willmitzer, L. (2008). Identification of metabolic and biomass QTL in Arabidopsis thaliana in a parallel analysis of RIL and IL populations. Plant J. 53, 960–972.
Lister, R., O’malley, R. C., Tonti-Filippini, J., Gregory, B. D., Berry, C. C., Millar, A. H., and Ecker, J. R. (2008). Highly integrated single-base resolution maps of the epigenome in Arabidopsis. Cell 133, 523–536.
Liu, S., Lin, L., Jiang, P., Wang, D., and Xing, Y. (2010). A comparison of RNA-seq and high-density exon array for detecting differential gene expression between closely related species. Nucleic Acids Res. 39, 578–588.
Lou, S. K., Ni, B., Lo, L. Y., Tsui, S. K., Chan, T. F., and Leung, K. S. (2011). ABMapper: a suffix array-based tool for multi-location searching and splice-junction mapping. Bioinformatics 27, 421–422.
Lu, C., Tej, S. S., Luo, S., Haudenschild, C. D., Meyers, B. C., and Green, P. J. (2005). Elucidation of the small RNA component of the transcriptome. Science 309, 1567–1569.
Mamanova, L., Coffey, A. J., Scott, C. E., Kozarewa, I., Turner, E. H., Kumar, A., Howard, E., Shendure, J., and Turner, D. J. (2010). Target-enrichment strategies for next-generation sequencing. Nat. Methods 7, 111–118.
Marguerat, S., and Bahler, J. (2010). RNA-seq: from technology to biology. Cell. Mol. Life Sci. 67, 569–579.
Marioni, J. C., Mason, C. E., Mane, S. M., Stephens, M., and Gilad, Y. (2008). RNA-seq: an assessment of technical reproducibility and comparison with gene expression arrays. Genome Res. 18, 1509–1517.
Martin, J. A., and Wang, Z. (2011). Next-generation transcriptome assembly. Nat. Rev. Genet. 12, 671–682.
Matsumura, H., Yoshida, K., Luo, S., Kimura, E., Fujibe, T., Albertyn, Z., Barrero, R. A., Kruger, D. H., Kahl, G., Schroth, G. P., and Terauchi, R. (2010). High-throughput SuperSAGE for digital gene expression analysis of multiple samples using next generation sequencing. PLoS ONE 5, e12010. doi:10.1371/journal.pone.0012010
Mcintyre, L. M., Lopiano, K. K., Morse, A. M., Amin, V., Oberg, A. L., Young, L. J., and Nuzhdin, S. V. (2011). RNA-seq: technical variability and sampling. BMC Genomics 12, 293. doi:10.1186/1471-2164-12-293
Mcmanus, C. J., Coolon, J. D., Duff, M. O., Eipper-Mains, J., Graveley, B. R., and Wittkopp, P. J. (2010). Regulatory divergence in Drosophila revealed by mRNA-seq. Genome Res. 20, 816–825.
Meissner, A., Mikkelsen, T. S., Gu, H., Wernig, M., Hanna, J., Sivachenko, A., Zhang, X., Bernstein, B. E., Nusbaum, C., Jaffe, D. B., Gnirke, A., Jaenisch, R., and Lander, E. S. (2008). Genome-scale DNA methylation maps of pluripotent and differentiated cells. Nature 454, 766–770.
Mikkelsen, T. S., Ku, M., Jaffe, D. B., Issac, B., Lieberman, E., Giannoukos, G., Alvarez, P., Brockman, W., Kim, T. K., Koche, R. P., Lee, W., Mendenhall, E., O’donovan, A., Presser, A., Russ, C., Xie, X., Meissner, A., Wernig, M., Jaenisch, R., Nusbaum, C., Lander, E. S., and Bernstein, B. E. (2007). Genome-wide maps of chromatin state in pluripotent and lineage-committed cells. Nature 448, 553–560.
Milne, I., Bayer, M., Cardle, L., Shaw, P., Stephen, G., Wright, F., and Marshall, D. (2010). Tablet – next generation sequence assembly visualization. Bioinformatics 26, 401–402.
Mizrachi, E., Hefer, C. A., Ranik, M., Joubert, F., and Myburg, A. A. (2010). De novo assembled expressed gene catalog of a fast-growing Eucalyptus tree produced by Illumina mRNA-seq. BMC Genomics 11, 681.
Montes, J. M., Melchinger, A. E., and Reif, J. C. (2007). Novel throughput phenotyping platforms in plant genetic studies. Trends Plant Sci. 12, 433–436.
Montgomery, S. B., Sammeth, M., Gutierrez-Arcelus, M., Lach, R. P., Ingle, C., Nisbett, J., Guigo, R., and Dermitzakis, E. T. (2010). Transcriptome genetics using second generation sequencing in a Caucasian population. Nature 464, 773–777.
Morgan, M., and Pagès, H. (2010). Rsamtools: Import Aligned BAM File Format Sequences Into R/Bioconductor. Available at: http://bioconductor.org/packages/release/bioc/html/Rsamtools.html
Mortazavi, A., Williams, B. A., Mccue, K., Schaeffer, L., and Wold, B. (2008). Mapping and quantifying mammalian transcriptomes by RNA-seq. Nat. Methods 5, 621–628.
Munroe, D. J., and Harris, T. J. (2010). Third-generation sequencing fireworks at Marco Island. Nat. Biotechnol. 28, 426–428.
Ness, R. W., Siol, M., and Barrett, S. C. (2011). De novo sequence assembly and characterization of the floral transcriptome in cross- and self-fertilizing plants. BMC Genomics 12, 298. doi:10.1186/1471-2164-12-298
Nicolae, M., Mangul, S., Mandoiu, I. I., and Zelikovsky, A. (2011). Estimation of alternative splicing isoform frequencies from RNA-seq data. Algorithms Mol. Biol. 6, 9.
Niedringhaus, T. P., Milanova, D., Kerby, M. B., Snyder, M. P., and Barron, A. E. (2011). Landscape of next-generation sequencing technologies. Anal. Chem. 83, 4327–4341.
Nielsen, R., Paul, J. S., Albrechtsen, A., and Song, Y. S. (2011). Genotype and SNP calling from next-generation sequencing data. Nat. Rev. Genet. 12, 443–451.
Nijman, I. J., Mokry, M., Van Boxtel, R., Toonen, P., De Bruijn, E., and Cuppen, E. (2010). Mutation discovery by targeted genomic enrichment of multiplexed barcoded samples. Nat. Methods 7, 913–915.
Oshlack, A., and Wakefield, M. J. (2009). Transcript length bias in RNA-seq data confounds systems biology. Biol. Direct 4, 14.
Ossowski, S., Schneeberger, K., Clark, R. M., Lanz, C., Warthmann, N., and Weigel, D. (2008). Sequencing of natural strains of Arabidopsis thaliana with short reads. Genome Res. 18, 2024–2033.
Parchman, T. L., Geist, K. S., Grahnen, J. A., Benkman, C. W., and Buerkle, C. A. (2010). Transcriptome sequencing in an ecologically important tree species: assembly, annotation, and marker discovery. BMC Genomics 11, 180. doi:10.1186/1471-2164-11-180
Parkhomchuk, D., Borodina, T., Amstislavskiy, V., Banaru, M., Hallen, L., Krobitsch, S., Lehrach, H., and Soldatov, A. (2009). Transcriptome analysis by strand-specific sequencing of complementary DNA. Nucleic Acids Res. 37, e123.
Pickrell, J. K., Marioni, J. C., Pai, A. A., Degner, J. F., Engelhardt, B. E., Nkadori, E., Veyrieras, J. B., Stephens, M., Gilad, Y., and Pritchard, J. K. (2010). Understanding mechanisms underlying human gene expression variation with RNA sequencing. Nature 464, 768–772.
Plessy, C., Bertin, N., Takahashi, H., Simone, R., Salimullah, M., Lassmann, T., Vitezic, M., Severin, J., Olivarius, S., Lazarevic, D., Hornig, N., Orlando, V., Bell, I., Gao, H., Dumais, J., Kapranov, P., Wang, H., Davis, C. A., Gingeras, T. R., Kawai, J., Daub, C. O., Hayashizaki, Y., Gustincich, S., and Carninci, P. (2010). Linking promoters to functional transcripts in small samples with nanoCAGE and CAGEscan. Nat. Methods 7, 528–534.
Potokina, E., Druka, A., Luo, Z., Wise, R., Waugh, R., and Kearsey, M. (2008). Gene expression quantitative trait locus analysis of 16 000 barley genes reveals a complex pattern of genome-wide transcriptional regulation. Plant J. 53, 90–101.
Quince, C., Lanzen, A., Davenport, R. J., and Turnbaugh, P. J. (2011). Removing noise from pyrosequenced amplicons. BMC Bioinformatics 12, 38. doi:10.1186/1471-2105-12-38
Quinlan, A. R., and Hall, I. M. (2010). BEDTools: a flexible suite of utilities for comparing genomic features. Bioinformatics 26, 841–842.
R Development Core Team. (2009). R: A Language and Environment for Statistical Computing. Vienna, Austria.
Ratan, A., Zhang, Y., Hayes, V., Schuster, S., and Miller, W. (2010). Calling SNPs without a reference sequence. BMC Bioinformatics 11, 130. doi:10.1186/1471-2105-11-130
Raz, T., Kapranov, P., Lipson, D., Letovsky, S., Milos, P. M., and Thompson, J. F. (2011). Protocol dependence of sequencing-based gene expression measurements. PLoS ONE 6, e19287. doi:10.1371/journal.pone.0019287
Robertson, G., Hirst, M., Bainbridge, M., Bilenky, M., Zhao, Y., Zeng, T., Euskirchen, G., Bernier, B., Varhol, R., Delaney, A., Thiessen, N., Griffith, O. L., He, A., Marra, M., Snyder, M., and Jones, S. (2007). Genome-wide profiles of STAT1 DNA association using chromatin immunoprecipitation and massively parallel sequencing. Nat. Methods 4, 651–657.
Robinson, J. T., Thorvaldsdottir, H., Winckler, W., Guttman, M., Lander, E. S., Getz, G., and Mesirov, J. P. (2011). Integrative genomics viewer. Nat. Biotechnol. 29, 24–26.
Robinson, M. D., Mccarthy, D. J., and Smyth, G. K. (2010). edgeR: a bioconductor package for differential expression analysis of digital gene expression data. Bioinformatics 26, 139–140.
Ruffalo, M., Laframboise, T., and Koyuturk, M. (2011). Comparative analysis of algorithms for next-generation sequencing read alignment. Bioinformatics 27, 2790–2796.
Sanchez, C. C., Smith, T. P., Wiedmann, R. T., Vallejo, R. L., Salem, M., Yao, J., and Rexroad, C. E. III. (2009). Single nucleotide polymorphism discovery in rainbow trout by deep sequencing of a reduced representation library. BMC Genomics 10, 559. doi:10.1186/1471-2164-10-559
Schlotterer, C. (2004). The evolution of molecular markers – just a matter of fashion? Nat. Rev. Genet. 5, 63–69.
Schmieder, R., and Edwards, R. (2011). Quality control and preprocessing of metagenomic datasets. Bioinformatics 27, 863–864.
Schmieder, R., Lim, Y. W., Rohwer, F., and Edwards, R. (2010). TagCleaner: identification and removal of tag sequences from genomic and metagenomic datasets. BMC Bioinformatics 11, 341. doi:10.1186/1471-2105-11-341
Schneeberger, K., Ossowski, S., Lanz, C., Juul, T., Petersen, A. H., Nielsen, K. L., Jorgensen, J. E., Weigel, D., and Andersen, S. U. (2009). SHOREmap: simultaneous mapping and mutation identification by deep sequencing. Nat. Methods 6, 550–551.
Schneeberger, K., and Weigel, D. (2011). Fast-forward genetics enabled by new sequencing technologies. Trends Plant Sci. 16, 282–288.
Schwartz, S., Oren, R., and Ast, G. (2011). Detection and removal of biases in the analysis of next-generation sequencing reads. PLoS ONE 6, e16685. doi:10.1371/journal.pone.0016685
Skelly, D. A., Johansson, M., Madeoy, J., Wakefield, J., and Akey, J. M. (2011). A powerful and flexible statistical framework for testing hypotheses of allele-specific gene expression from RNA-seq data. Genome Res. doi: 10.1101/gr.119784.110. [Epub ahead of print].
Smith, D. R., Quinlan, A. R., Peckham, H. E., Makowsky, K., Tao, W., Woolf, B., Shen, L., Donahue, W. F., Tusneem, N., Stromberg, M. P., Stewart, D. A., Zhang, L., Ranade, S. S., Warner, J. B., Lee, C. C., Coleman, B. E., Zhang, Z., Mclaughlin, S. F., Malek, J. A., Sorenson, J. M., Blanchard, A. P., Chapman, J., Hillman, D., Chen, F., Rokhsar, D. S., Mckernan, K. J., Jeffries, T. W., Marth, G. T., and Richardson, P. M. (2008). Rapid whole-genome mutational profiling using next-generation sequencing technologies. Genome Res. 18, 1638–1642.
Souaiaia, T., Frazier, Z., and Chen, T. (2011). ComB: SNP calling and mapping analysis for color and nucleotide space platforms. J. Comput. Biol. 18, 795–807.
Stajich, J. E., Block, D., Boulez, K., Brenner, S. E., Chervitz, S. A., Dagdigian, C., Fuellen, G., Gilbert, J. G., Korf, I., Lapp, H., Lehvaslaiho, H., Matsalla, C., Mungall, C. J., Osborne, B. I., Pocock, M. R., Schattner, P., Senger, M., Stein, L. D., Stupka, E., Wilkinson, M. D., and Birney, E. (2002). The Bioperl toolkit: Perl modules for the life sciences. Genome Res. 12, 1611–1618.
Stern, D. L., and Orgogozo, V. (2008). The loci of evolution: how predictable is genetic evolution? Evolution 62, 2155–2177.
Su, C. L., Chao, Y. T., Alex Chang, Y. C., Chen, W. C., Chen, C. Y., Lee, A. Y., Hwa, K. T., and Shih, M. C. (2011). De novo assembly of expressed transcripts and global analysis of the Phalaenopsis aphrodite transcriptome. Plant Cell Physiol. 52, 1501–1514.
Tarazona, S., Garcia-Alcalde, F., Dopazo, J., Ferrer, A., and Conesa, A. (2011). Differential expression in RNA-seq: a matter of depth. Genome Res. doi: 10.1101/gr.124321.111. [Epub ahead of print].
Toung, J. M., Morley, M., Li, M., and Cheung, V. G. (2011). RNA-sequence analysis of human B-cells. Genome Res. 21, 991–998.
Trapnell, C., Pachter, L., and Salzberg, S. L. (2009). TopHat: discovering splice junctions with RNA-seq. Bioinformatics 25, 1105–1111.
Trapnell, C., Williams, B. A., Pertea, G., Mortazavi, A., Kwan, G., Van Baren, M. J., Salzberg, S. L., Wold, B. J., and Pachter, L. (2010). Transcript assembly and quantification by RNA-seq reveals unannotated transcripts and isoform switching during cell differentiation. Nat. Biotechnol. 28, 511–515.
Trick, M., Long, Y., Meng, J., and Bancroft, I. (2009). Single nucleotide polymorphism (SNP) discovery in the polyploid Brassica napus using Solexa transcriptome sequencing. Plant Biotechnol. J. 7, 334–346.
Underwood, J. G., Uzilov, A. V., Katzman, S., Onodera, C. S., Mainzer, J. E., Mathews, D. H., Lowe, T. M., Salama, S. R., and Haussler, D. (2010). FragSeq: transcriptome-wide RNA structure probing using high-throughput sequencing. Nat. Methods 7, 995–1001.
Van Tassell, C. P., Smith, T. P., Matukumalli, L. K., Taylor, J. F., Schnabel, R. D., Lawley, C. T., Haudenschild, C. D., Moore, S. S., Warren, W. C., and Sonstegard, T. S. (2008). SNP discovery and allele frequency estimation by deep sequencing of reduced representation libraries. Nat. Methods 5, 247–252.
Vuylsteke, M., Daele, H., Vercauteren, A., Zabeau, M., and Kuiper, M. (2006). Genetic dissection of transcriptional regulation by cDNA-AFLP. Plant J. 45, 439–446.
Vuylsteke, M., Van Eeuwijk, F., Van Hummelen, P., Kuiper, M., and Zabeau, M. (2005). Genetic analysis of variation in gene expression in Arabidopsis thaliana. Genetics 171, 1267–1275.
Wang, J., Huda, A., Lunyak, V. V., and Jordan, I. K. (2010a). A Gibbs sampling strategy applied to the mapping of ambiguous short-sequence tags. Bioinformatics 26, 2501–2508.
Wang, K., Singh, D., Zeng, Z., Coleman, S. J., Huang, Y., Savich, G. L., He, X., Mieczkowski, P., Grimm, S. A., Perou, C. M., Macleod, J. N., Chiang, D. Y., Prins, J. F., and Liu, J. (2010b). MapSplice: accurate mapping of RNA-seq reads for splice junction discovery. Nucleic Acids Res. 38, e178.
Wang, L., Feng, Z., Wang, X., and Zhang, X. (2010c). DEGseq: an R package for identifying differentially expressed genes from RNA-seq data. Bioinformatics 26, 136–138.
Wang, X., Wu, Z., and Zhang, X. (2010d). Isoform abundance inference provides a more accurate estimation of gene expression levels in RNA-seq. J. Bioinform. Comput. Biol. 8(Suppl. 1), 177–192.
Wang, Z., Fang, B., Chen, J., Zhang, X., Luo, Z., Huang, L., Chen, X., and Li, Y. (2010e). De novo assembly and characterization of root transcriptome using Illumina paired-end sequencing and development of cSSR markers in sweet potato (Ipomoea batatas). BMC Genomics 11, 726. doi:10.1186/1471-2164-11-726
Wang, Z., Gerstein, M., and Snyder, M. (2009). RNA-seq: a revolutionary tool for transcriptomics. Nat. Rev. Genet. 10, 57–63.
Wei, W., Qi, X., Wang, L., Zhang, Y., Hua, W., Li, D., Lv, H., and Zhang, X. (2011). Characterization of the sesame (Sesamum indicum L.) global transcriptome using Illumina paired-end sequencing and development of EST-SSR markers. BMC Genomics 12, 451. doi:10.1186/1471-2164-12-451
West, M. A. L., Kim, K., Kliebenstein, D. J., Van Leeuwen, H., Michelmore, R. W., Doerge, R. W., and St Clair, D. A. (2007). Global eQTL mapping reveals the complex genetic architecture of transcript-level variation in Arabidopsis. Genetics 175, 1441–1450.
Willing, E. M., Hoffmann, M., Klein, J. D., Weigel, D., and Dreyer, C. (2011). Paired-end RAD-seq for de novo assembly and marker design without available reference. Bioinformatics 27, 2187–2193.
Wittkopp, P. J., Haerum, B. K., and Clark, A. G. (2004). Evolutionary changes in cis and trans gene regulation. Nature 430, 85–88.
Wray, G. A. (2007). The evolutionary significance of cis-regulatory mutations. Nat. Rev. Genet. 8, 206–216.
Wu, X., Ren, C., Joshi, T., Vuong, T., Xu, D., and Nguyen, H. T. (2010). SNP discovery by high-throughput sequencing in soybean. BMC Genomics 11, 469. doi:10.1186/1471-2164-11-469
Xie, W., Feng, Q., Yu, H., Huang, X., Zhao, Q., Xing, Y., Yu, S., Han, B., and Zhang, Q. (2010). Parent-independent genotyping for constructing an ultrahigh-density linkage map based on population sequencing. Proc. Natl. Acad. Sci. U.S.A. 107, 10578–10583.
You, F. M., Huo, N., Deal, K. R., Gu, Y. Q., Luo, M. C., Mcguire, P. E., Dvorak, J., and Anderson, O. D. (2011). Annotation-based genome-wide SNP discovery in the large and complex Aegilops tauschii genome using next-generation sequencing without a reference genome sequence. BMC Genomics 12, 59. doi:10.1186/1471-2164-12-59
Young, M. D., Wakefield, M. J., Smyth, G. K., and Oshlack, A. (2010). Gene ontology analysis for RNA-seq: accounting for selection bias. Genome Biol. 11, R14.
Zhang, G., Guo, G., Hu, X., Zhang, Y., Li, Q., Li, R., Zhuang, R., Lu, Z., He, Z., Fang, X., Chen, L., Tian, W., Tao, Y., Kristiansen, K., Zhang, X., Li, S., Yang, H., and Wang, J. (2010). Deep RNA sequencing at single base-pair resolution reveals high complexity of the rice transcriptome. Genome Res. 20, 646–654.
Keywords: QTL analysis, plant genetics, next generation sequencing, genomics, eQTL analysis, RNA-seq
Citation: Jiménez-Gómez JM (2011) Next generation quantitative genetics in plants. Front. Plant Sci. 2:77. doi: 10.3389/fpls.2011.00077
Received: 29 April 2011;
Accepted: 23 October 2011;
Published online: 15 November 2011.
Edited by:
Alisdair Fernie, Max Planck Institute for Plant Physiology, GermanyReviewed by:
Alisdair Fernie, Max Planck Institute for Plant Physiology, GermanyMathilde Causse, National Institute of Agricultural Research, France
Copyright: © 2011 Jiménez-Gómez. This is an open-access article subject to a non-exclusive license between the authors and Frontiers Media SA, which permits use, distribution and reproduction in other forums, provided the original authors and source are credited and other Frontiers conditions are complied with.
*Correspondence: José M. Jiménez-Gómez, Department of Plant Breeding and Genetics, Max Planck Institute for Plant Breeding Research, Carl-von-Linné-Weg 10, 50829 Köln, Germany. e-mail:am1qaW1lbmV6QG1waXB6Lm1wZy5kZQ==