 Alexandre P. Magalhães1
 Nuno Verde1Francisca Reis1Inês Martins1
 Daniela Costa1Teresa Lino-Neto1
 Pedro H. Castro1Rui M. Tavares1*
 Herlânder Azevedo2*
- 1BioSystems and Integrative Sciences Institute, Plant Functional Biology Center, University of Minho, Braga, Portugal
- 2CIBIO, InBIO – Research Network in Biodiversity and Evolutionary Biology, Universidade do Porto, Vairão, Portugal
Quercus suber (cork oak) is a West Mediterranean species of key economic interest, being extensively explored for its ability to generate cork. Like other Mediterranean plants, Q. suber is significantly threatened by climatic changes, imposing the need to quickly understand its physiological and molecular adaptability to drought stress imposition. In the present report, we uncovered the differential transcriptome of Q. suber roots exposed to long-term drought, using an RNA-Seq approach. 454-sequencing reads were used to de novo assemble a reference transcriptome, and mapping of reads allowed the identification of 546 differentially expressed unigenes. These were enriched in both effector genes (e.g., LEA, chaperones, transporters) as well as regulatory genes, including transcription factors (TFs) belonging to various different classes, and genes associated with protein turnover. To further extend functional characterization, we identified the orthologs of differentially expressed unigenes in the model species Arabidopsis thaliana, which then allowed us to perform in silico functional inference, including gene network analysis for protein function, protein subcellular localization and gene co-expression, and in silico enrichment analysis for TFs and cis-elements. Results indicated the existence of extensive transcriptional regulatory events, including activation of ABA-responsive genes and ABF-dependent signaling. We were then able to establish that a core ABA-signaling pathway involving PP2C-SnRK2-ABF components was induced in stressed Q. suber roots, identifying a key mechanism in this species’ response to drought.
Introduction
Cork oak (Quercus suber) is an evergreen species of the Fagaceae family, and one of the most significant forest species in the Mediterranean region, due to both its ecological dominance and economic value (Nixon, 1993; Belahbib et al., 2001). Q. suber is a slow growing, extremely long-lived tree, reaching a height of up to 20 m, with massive branches forming a round crown (Faria et al., 1996). The modern distribution of cork oak is rather discontinuous, ranging from the Atlantic coasts of North Africa and Iberian Peninsula to the south-eastern regions of Italy, Sicily and Sardinia, as well as the coastal belts of Algeria and Tunisia, France and Spain (Lumaret et al., 2005; Magri et al., 2007). As a species that is endemic to the Western Mediterranean region, Q. suber is mostly present in semi-natural stands known as Montados, which are open woods with a delicate and particular ecosystem, created and maintained by man (Sánchez-González et al., 2008). Montados and cork oak management represent an important economical resource, as they are associated not only with the harvesting of acorns, but also with the use of bark as the source of cork (Lopes et al., 2001). Presently, Q. suber forests cover 2.2 million hectares worldwide, providing 340,000 tons/year of cork. Yet, Montados are currently threatened and in decline due to multiple factors, the main of which is the occurrence of severe drought periods over several consecutive years (Toumi and Lumaret, 1998). As opposed to other oaks which have a greater ecological amplitude, this species is a sclerophyllous tree that is adapted to a 4-month-long hot-dry summer period, with at least 450 mm mean annual rainfall (Faria et al., 1996; Toumi and Lumaret, 1998). Mediterranean-climate regions are characterized by a cycle of temperatures out of phase with the rainfall, producing mild to cool rainy winters and dry summers. However, the proneness for hydrological variability of Mediterranean climate regions make these areas particularly sensitive to global climatic changes, and an increase in drought period frequency is expected in forthcoming years. These events are likely to have a significant impact on Q. suber distribution, sustainability and commercial exploitation.
Mediterranean vegetation dealing with the peculiar soil moisture dynamics of this region, developed a number of physiological mechanisms to tolerate drought stress and growth under adverse climatic conditions. Mechanisms include early responses involving stomatal closure, to prevent or delay tissue dehydration, and antioxidant biosynthesis as a photoprotection mechanism (Flexas et al., 2014). Long term acclimation responses include decreased growth, to reduce water and nutrient demands (Nuche et al., 2014), changes in allocation of resources from support tissues to assimilating organs (Nuche et al., 2014), and development of strategies to prevent xylem cavitation, like refilling mechanisms, regulation of hydraulic conductance, and xylem margin reinforcement and repair (Nardini et al., 2014). At the molecular level, plants have developed numerous advanced response mechanisms to cope with the challenges facing a sessile organism, including microRNA regulation (Lu and Huang, 2008; Khraiwesh et al., 2012), chromatin remodeling (Golldack et al., 2011; Luo et al., 2012) and examples of post-translational modification of proteins (Castro et al., 2012). However, the best-characterized mechanisms involve gene expression regulation, engaging signal transduction pathways to trigger changes in metabolic processes, management of resources, and organ morphology (Wang et al., 2003; Danquah et al., 2014). Gene regulatory pathways include environmental sensing mechanisms, membrane-localized elements, signaling transduction components such as MAP kinase cascades, hormone-dependent signaling modules, and induction of several classes of transcription factors (TFs), such as ABF, AP2/ERF, NAC, MYB, DREB/CBF and HSF TFs (Wang et al., 2003, 2004; Yoshida et al., 2010; Lata and Prasad, 2011; Atkinson and Urwin, 2012; Chen et al., 2012; Mizoi et al., 2012; Nakashima et al., 2012, 2014; Osakabe et al., 2013; Danquah et al., 2014). In drought stress resistance, four major signaling pathways have been described, involving both ABA-dependent and ABA-independent signal transduction, and ABF, MYC, DREB and NAC TFs. The foremost, best characterized signaling pathway, also designated the core ABA transduction pathway, involves a signalosome composed of several components, namely PYR/PYL/RCAR (ABA receptor), PP2C (type 2C protein phosphatases) and SnRK2s (SNF1-related protein kinase 2), and is traditionally associated with the regulation of ABF TFs (Kuromori et al., 2014). These regulatory events manage the expression of functional downstream response genes, involved in growth regulation, water management, ROS scavenging and induction of secondary metabolism (Wang et al., 2003).
Next generation sequencing (NGS) technology is revolutionizing our capacity to perform research in various areas of the biological field. The ability to generate massive sequencing libraries with a lower cost and high degree of performance has profoundly affected present research strategies, facilitating studies in non-model systems and easily moving species toward an Omics age. In plants, the number of genomes being sequenced has been consistently increasing, and accompanying this trend, RNA-sequencing (RNA-Seq) has also provided a massive increase in the number of information generated by NGS. This method has been replacing other transcriptomics methodologies as the main research tool for RNA expression profiling, providing high resolution transcriptomes capable of quantifying whole-genome expression more accurately and at higher detection limits (Martin et al., 2013). Possibly the most important recent development in Q. suber research was the Portuguese nation-wide initiative, the Cork oak ESTs Consortium (COEC), which performed 454 de novo sequencing of the Q. suber transcriptome. It used cDNA samples derived from 21 normalized libraries, representing multiple tissues, organs, developmental stages and physiological/environmental conditions (Pereira-Leal et al., 2014). Within this framework, a number of parallel projects were carried out with the objective of analyzing differential expression of the Q. suber transcriptome on non-normalized libraries (Rocheta et al., 2014; Sebastiana et al., 2014; Teixeira et al., 2014). Here, we report one such study, which addressed the transcriptional reprogramming of Q. suber root tissues in response to long-term water deficit. This RNA-Seq approach allowed identification of over 500 differentially expressed unigenes, including a significant number of different TFs and other signal transduction components. In order to functionally characterize the differential transcriptome, an in silico, homology-based gene network analysis was performed, ultimately uncovering the activation of a complete canonical ABA/ABF-dependent signaling pathway in Q. suber roots responding to long-term drought stress.
Materials and Methods
Plant Material and Physiological Assessments
Quercus suber acorns were supplied by Instituto Superior de Agronomia (ISA, Lisbon). Acorns were stratified at 4°C for 2 weeks and subsequently sowed in a soil mixture consisting of a 2:1:1 volume mix of turf, vermiculite and silicate sand. A total of 123 vases were sowed and grown in a 16 h light/8 h dark photoperiod regime (100 μmol Photon m-2 s-1). After 80 days, drought treatments were initiated. Treatments used 90 plants presenting the best fitness, divided into 18 groups, with five plants each. Plants from each group were subjected to five different drought treatments, corresponding to 100, 90, 50, 25, and 10% of the field capacity of the soil mixture, respectively identified as D100, D90, D50, D25, and D10. Watering was performed three times a week. In each group, plants were watered with 100, 90, 50, 25, or 10% of the pot weight loss measured in D100 samples. Quantum yield of photosystem II (Fv/Fm) was assessed by pulse amplitude modulated (PAM) fluorometry, after adapting plants to the dark for 15 min, using a portable Pulse Amplitude Modulated fluorometer (Junior-PAM, Gademann Instruments GmbH, Germany). Blue light was used as the light source. For each condition, three healthy leaves were selected in three independent plants, and Fv/Fm was evaluated throughout the drought assay. Chlorophyll and carotenoid pigments were quantified spectrophotometrically as previously reported (Hipkins and Baker, 1986). Quantification of L-proline levels in roots was performed using the ninhydrin method, as previously reported (Bates et al., 1973). Commercially available L-Proline was used for the standard curve.
454 Sequencing
Total RNA was isolated from secondary roots. These were snap-frozen and grinded in liquid nitrogen. Total RNA was extracted following the Hot Borate method (Wan and Wilkins, 1994) and further purified using the RNeasy Plant Mini Kit (Qiagen). Sequencing was carried out in a Genome Sequencer GS FLX Titanium (Roche-454 Life Sciences, Brandford, CT, USA) according to the manufacturer’s instructions, at Biocant (Cantanhede, Portugal). Each library (D100/D90, D50 and D25/10) occupied one half of a picotiter plate. Raw reads were subsequently subjected to trimming, removal of adapters/primers and low quality reads using SeqTrim (minimum read length = 50 bp; number of error allowed in MID = 2; average limit filter quality = 13; size window filter quality = 7; max undetermined nucleotides = 2) (Falgueras et al., 2010). Sequences were deposited in the National Center for Biotechnology Information (NCBI), under the Short Read Archive (SRA) accession number SRP055382.
Sequence Assembly and Differential Expression Analysis
De novo assembly was carried out using Newbler (GS De Novo Assembler V2.9) with default parameters and the resulting assembly file was submitted to the CD-HIT-EST web server (95% identity; Huang et al., 2010) to eliminate redundancies originated from the de novo assembly. Sequences with less than 100 bp were removed and the remaining isotigs and contigs were named Unigenes. Unigenes were given an accession number using an in-house Perl script. Fasta sequences are available in Supplementary File S1. Unigenes were subjected to homology search using BLASTx (BLASTX 2.2.28+) against the non-redundant protein database (nr) with an E-value threshold of 1e-6. GI numbers were extracted and submitted to Uniprot’s Retrived/ID mapping tool1 to generate GO enrichment. Coverage for the assembled transcriptome was assessed with BLASTx (BLASTX 2.2.28+) analysis, against the Castanea molissima predicted transcriptome and Quercus rubra Unigene V2 transcriptome from Fagaceae Genomics Web2, and A. thaliana predicted transcriptome3, with an E-value threshold of 1e-6.
To determine the set of differentially expressed genes (DEGs) between the three experimental conditions, high quality (HQ) reads from each sequencing effort were mapped against the assembled transcriptome using the Burrows–Wheeler Aligner (BWA4). The algorithm chosen was BWA-MEM as it features long-read support and split alignment that is suitable for 454 reads, and is faster and more accurate when compared to BWA-SW. Parameters were set to promote single alignments for each read (-c command with parameter of “1”). Summarization of results was performed using Tablet (Milne et al., 2012). Venn diagrams were generated using Venny v2.05. Identification of DEGs was performed in DESeq (Anders and Huber, 2010). Using DESeq, we modeled count data using a negative binomial distribution, paring all conditions (D100/D90 vs. D50; D25/D10 vs. D50; D100/D90 vs. D25/D10). We retained unigenes that displayed differential expression (significance value < 0.05) in at least one comparison. In the absence of replicates, we used DESeq’s blind method for dispersion estimates: FDR correction was disabled and Padj reported as “1”. CDBFasta6 was used to retrieve specific Fasta sequences from the assembled unigenes file. For Hierarchical clustering (HCL; Eisen et al., 1999), normalized read counts for each DEG were retrieved from DESeq; HCL was performed by Euclidean distance and average linkage clustering on Multiple Experiment Viewer (MeV v4.07). Gene clusters were identified using the MeV feature Self Organizing Tree Algorithm (SOTA; Herrero et al., 2001), using Euclidean distance. Expression plots were rendered considering SOTA clustering, and DEGs were separated into up-regulated and down-regulated genes based on the Expression plot profile.
Protein Prediction, Functional Annotation and Ortholog Assessment
BLASTx results for the differentially expressed unigenes (Supplementary File S2) were extracted from the previously established BLASTx results of the whole transcriptome (see Sequence Assembly and Differential Expression Analysis). The ORF Predictor8 tool was used to identify open reading frames (ORFs). For this purpose, BLASTx results and nucleotide sequences were uploaded to the ORF Predictor server, so frame shift errors and incomplete sequences could be accounted for. Corrected CDS and protein sequences were retrieved for later analysis. Nucleotide sequences were also analyzed using the Blast2GO pipeline (level 3; Conesa et al., 2005), using standard settings and the local BLASTx previously generated. Gene subsets were created within the Blast2GO software, comprising the genes assigned to each cluster defined earlier by SOTA analysis. GO enrichment analysis for Biological process was then carried out on each gene cluster individually, using an E-value threshold of 1e-5. To establish A. thaliana orthologs, DEG protein sequences were subjected to BLASTp analysis (E-value of 1e-6) against the reference A. thaliana TAIR10 annotation9. Only the gene model was considered for later analysis.
Functional Data Mining in Arabidopsis and Validation by qPCR
Transcription factors were identified from Arabidopsis DEG orthologs using the AGRIS Arabidopsis TF database (AtTFDB10; Davuluri et al., 2003), MapMan (transcripton pathway bin; Thimm et al., 2004), and manual curation. Cis-element enrichment analysis was carried using AtCOECis (Vandepoele et al., 2009) and Athena (O’Connor et al., 2005), with default parameters. Gene networks were predicted in Cytoscape, using the Genemania App (Warde-Farley et al., 2010; Saito et al., 2012) (Supplementary Methods S1). Phylogenetic reconstruction was carried out by maximum likelihood, after automated retrieval of Arabidopsis TF gene family members (Supplementary Methods S2). For quantitative Real-Time PCR (qPCR) analysis, a second independent drought induction assay was performed, and total RNA was isolated from secondary roots by a CTAB-based method adapted from Azevedo et al. (2003). Validation of differential expression by qPCR was performed according to standard procedures (Supplementary Methods S3), using primer sequences described in Supplementary Table S1.
Results and Discussion
Physiological Response to Long-Term Drought
The cork oak root-level response to drought was investigated at the transcriptional level by an RNA-Seq approach. Q. suber plantlets were subjected to prolonged drought stress and characterized in their morphological and physiological responses. More specifically, 2-month-old plantlets were subjected for 1 month to five different watering regimes (herein designated D100, D90, D50, D25, and D10), that restored 100, 90, 50, 25, or 10% of the water lost between watering periods. This imposed a progressive loss in water availability, resulting in moderate to extreme drought stress over an extended period of time (Figure 1A). The consequences of drought stress imposition were visible in leaf morphology, with leaves displaying increasing stress-related symptoms such as leaf area drop, leaf rolling, edge and tip necrosis, and changes in coloration observable as reddening and yellowing (Figures 1B–D). To support morphological data, alterations to plant fitness throughout the treatment period were monitored using PAM fluorometry. This technique has been successfully used to study alterations in photosynthetic electron transport in vivo (Papageorgiou, 2007). A progressive loss in efficiency of PSII, determined by the Fv/Fm parameter (maximum quantum efficiency of PSII photochemistry) was detected for all major drought treatments, especially for D25 and D10 (Figure 1E). This may be related to inhibition of the photosynthetic electron transport activity or down-regulation of metabolic activity, resulting in a reduction in CO2 assimilation which is associated with drought-stress response in plants (Li et al., 2006). Also, long-term drought stress can result in physical destabilization and reorganization of the PSII (Giardi et al., 1996), therefore the decrease in Fv/Fm could be related to such events. Our results are also consistent with other studies in oak species undergoing water deprivation, in which a decrease in Fv/Fm was observed (Epron et al., 1993; Méthy et al., 1996). Additionally, we estimated chlorophyll and carotenoid contents in leaves at the end of the experiment, observing a reduction in both pigments that was proportional to the severity of the drought treatment (Figures 1F,G). Overall results are consistent with previous reports that associate molecular and physiological responses to water deficit with chlorophyll bleaching, decline in photosynthesis, accumulation of carotenoid-like molecules, remobilization of nutrients, dismantling of cellular organelles, and programmed cell death events (Shao et al., 2008). Finally, to confirm drought stress imposition we quantified the root’s proline content. Proline is a standard indicator of low water potential (Ψw) caused by environmental stresses, acting as a compatible solute that accumulates to high concentrations following decreases in water availability (Lambers et al., 2008). A significant and dose dependent increase in the proline content was detected in drought-stressed Q. suber roots (Figure 1H), thus confirming the imposition of drought stress. In sum, we clearly established that in our physiological model, different watering regimes matched different intensities of long-term drought stress imposition.
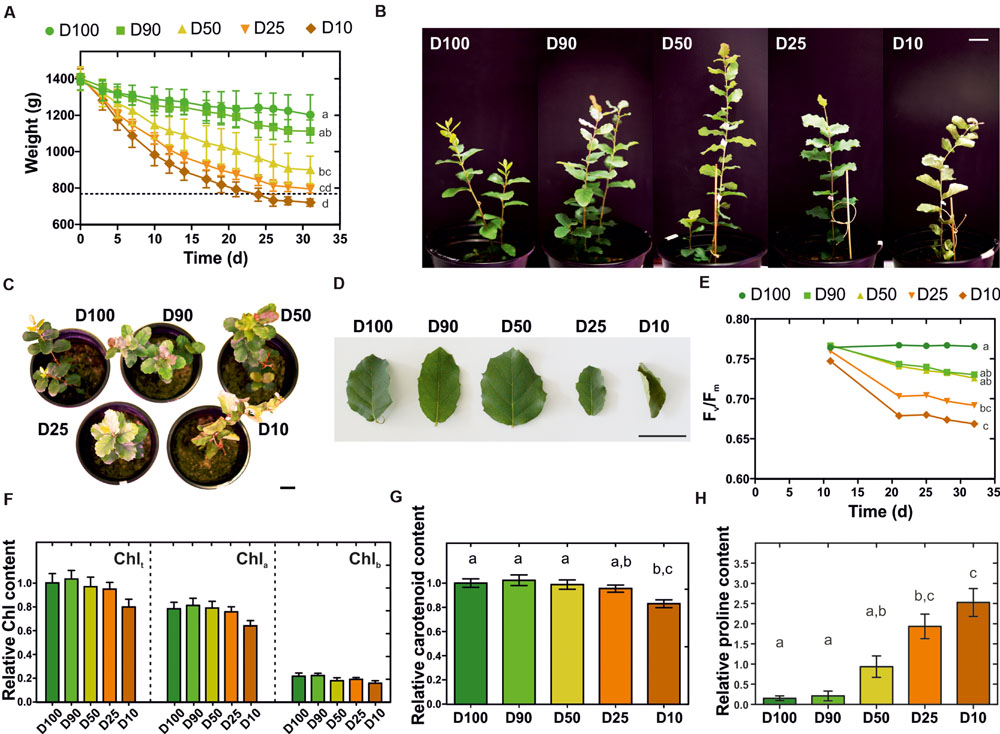
FIGURE 1. Characterization of morphological and physiological traits of Q. suber plantlets subjected to long-term drought stress. (A) Eighty-day-old plantlets were subjected to five different watering regimens (D100, D90, D50, D25, D10) for one month; pot weight was determined before each watering period, (n = 6). (B–D) Plant (B,C) and leaf (D) morphology at the end of the drought stress period. (E) Effect of each watering regimen in the quantum yield of photosystem II (Fv/Fm), (n = 9). (F) Total chlorophyll (Chlt), chlorophyll a (Chla) and chlorophyll b (Chlb) contents at the end of the drought stress period, (n = 15). (G) Carotenoid content at the end of the drought stress period, (n = 15). (H) Quantification of L-proline in Q. suber roots at the end of the drought stress period, (n = 15). Letters represent statistically similar results (one-way ANOVA with post hoc Tukey test to compare all columns; p > 0.05). Scale bars represent 3 cm.
Assembly of the Q. suber Root Transcriptome
We were involved in a Portuguese nation-wide initiative, the COEC, that performed de novo sequencing of the Q. suber transcriptome by 454 NGS (11Pereira-Leal et al., 2014). Within this initiative, we performed a parallel RNA-Seq analysis of the Q. suber root response to long term drought. RNA was extracted from roots of plantlets subjected to different watering conditions (D100+D90, D50 and D25+D10), and used to generate non-normalized libraries that were then sequenced by 454 GS FLX Titanium technology, using half-plate runs for each experimental condition (Figure 2). Results from the sequencing effort are presented in Table 1. Raw read number (1.8 million) and length (∼400 bp) followed expected standards for this technology. Raw reads were subjected to a pre-processing/trimming step to remove short or low quality sequences and adaptor/primer sequences. HQ reads amounted to 88.1% of original reads, and totaled 470.8 Mbp (Table 1). HQ reads displayed no significant differences in number or length frequency, between different drought stress regimes (Table 1; Supplementary Figure S1A), corroborating the quality of the cDNA library and sequencing processes. Subsequently, we assembled a reference transcriptome using HQ reads, resulting in a total of 22,455 raw sequences; these were uploaded to the CD-HIT-EST web server (Huang et al., 2010) for clustering and redundancy elimination, resulting in 21,012 unigenes of which 18,367 were isotigs and 2,645 were contigs (Figure 2, Table 1). Frequency analysis demonstrated that the assembled unigenes were as long as 2,600 bp, averaged at 758 bp and peaked in the 400–500 bp range (Supplementary Figure S1B). Of the total amount of reads that could be aligned, 70% had a HQ alignment score. Gene Ontology (GO) category enrichment was calculated for the whole transcriptome (Supplementary Figure S1C), demonstrating a foreseeable abundance in metabolic and cellular processes, as well as catalytic and binding protein functions.
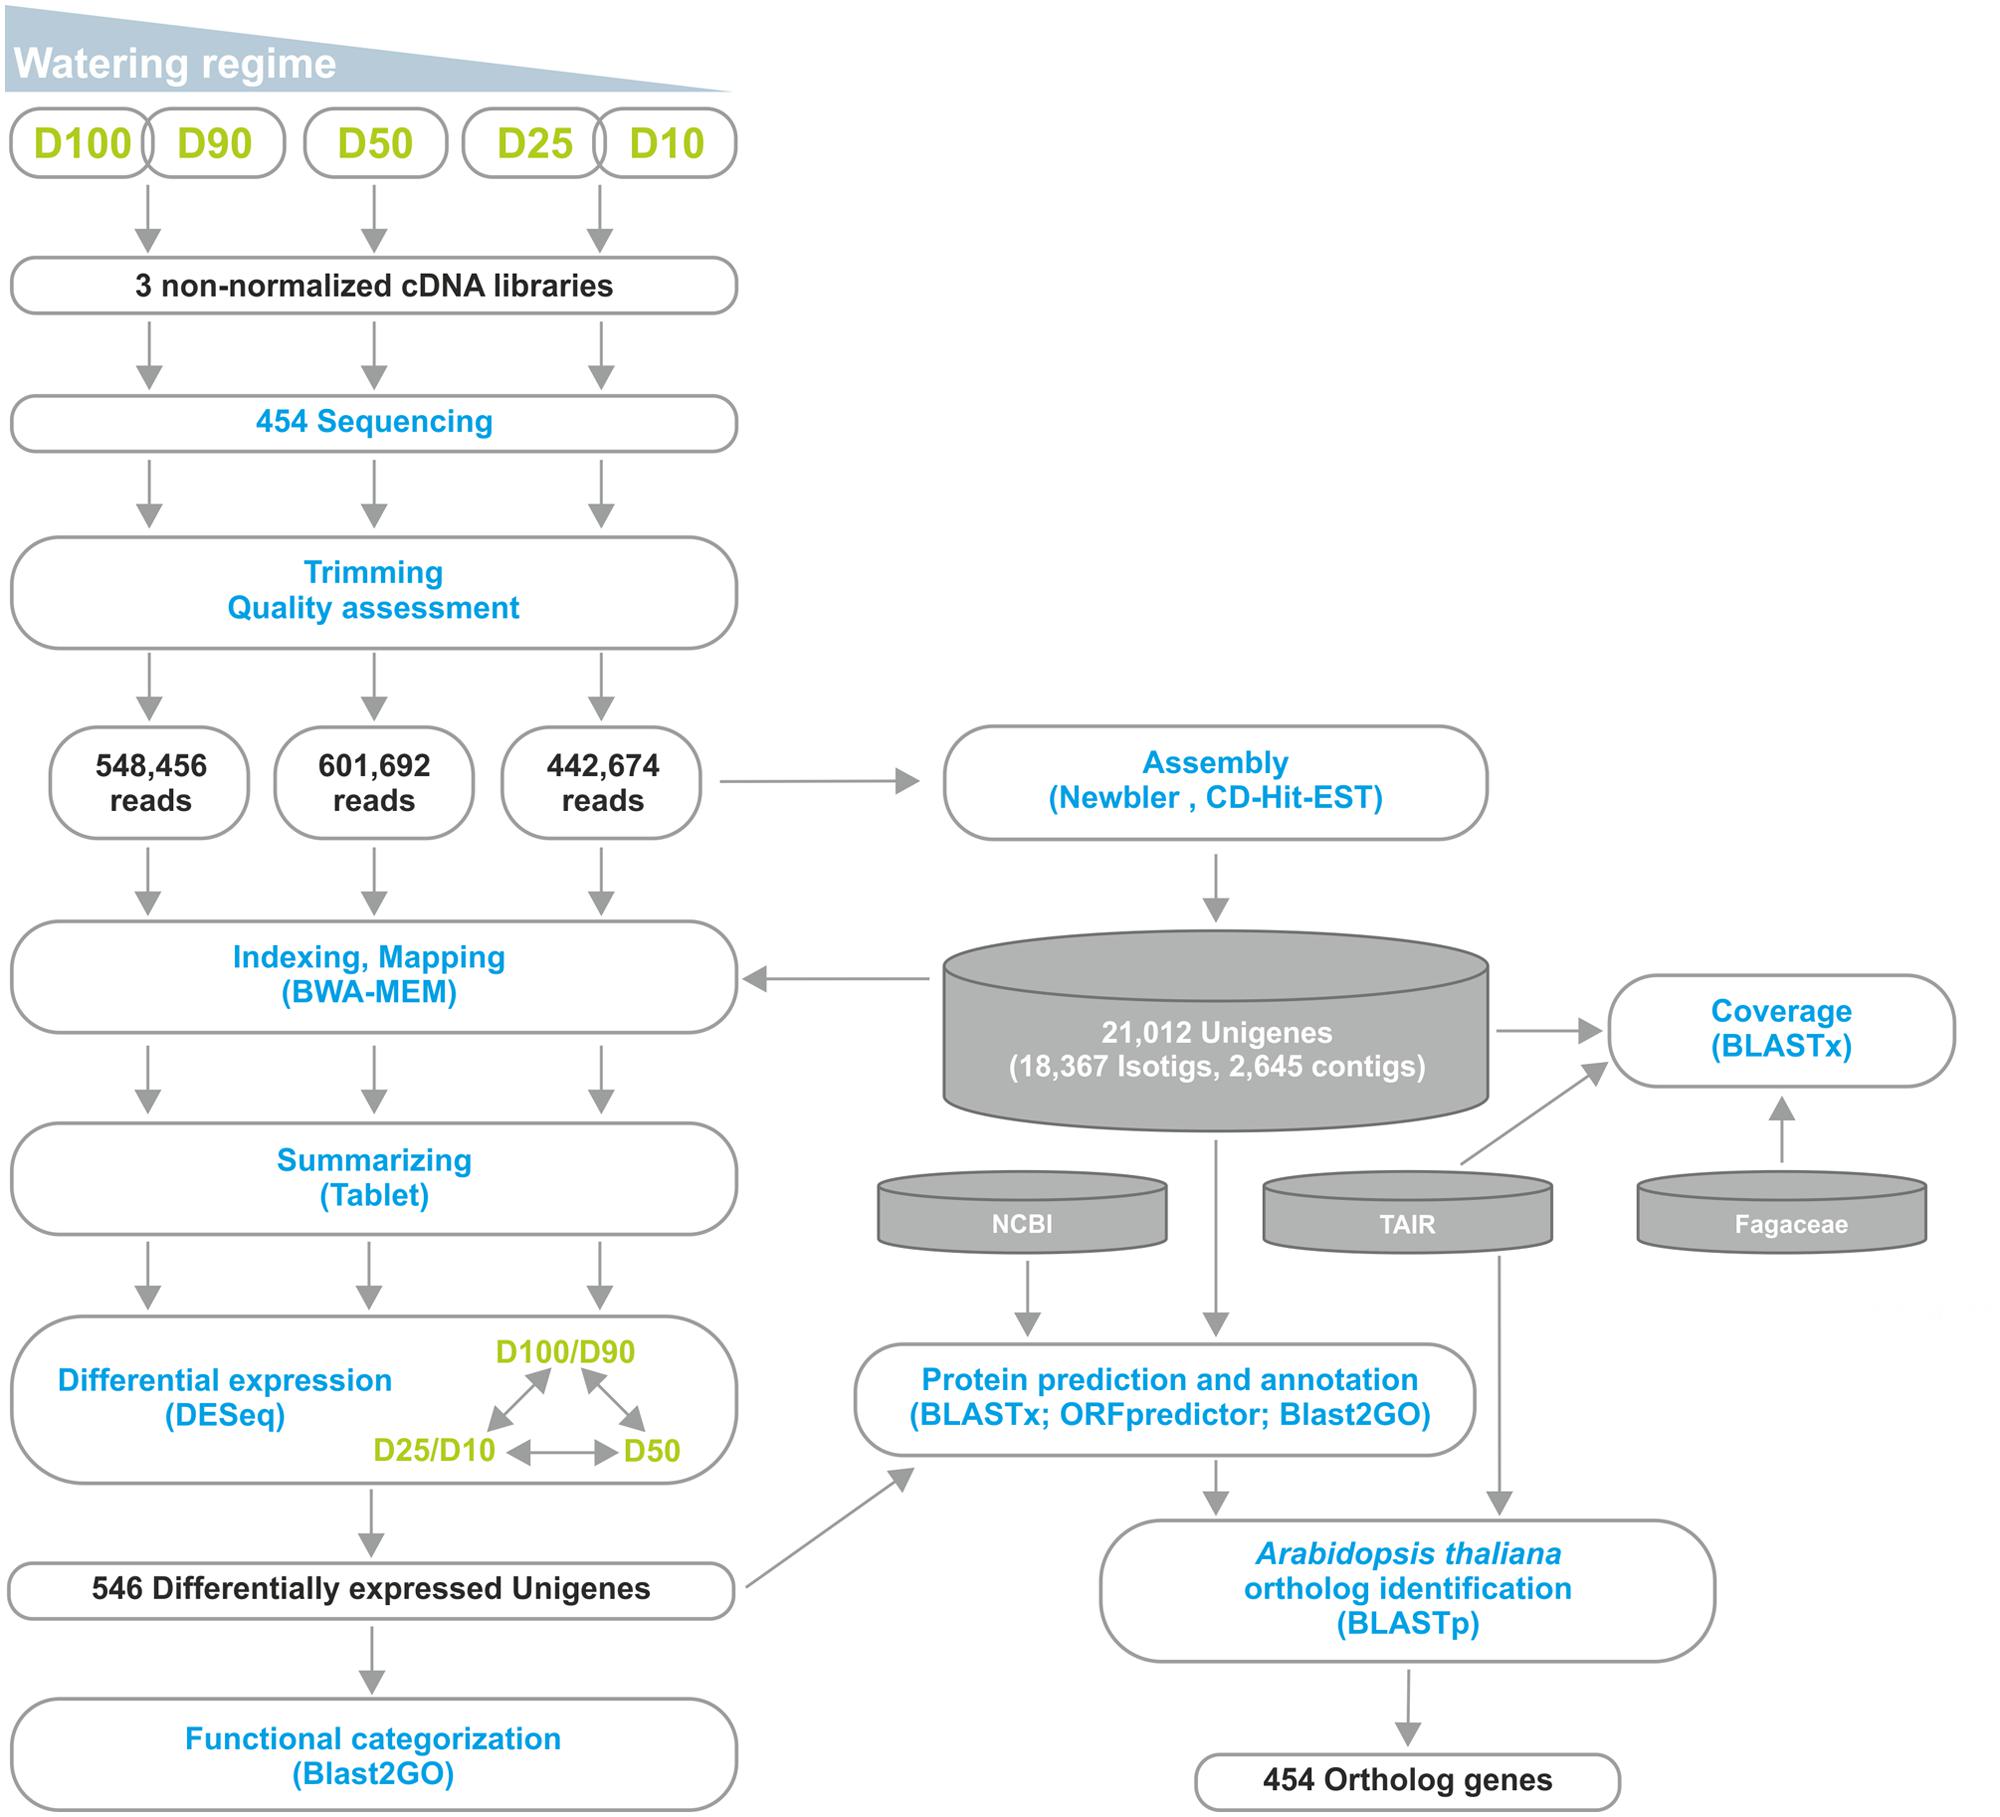
FIGURE 2. Outline of the RNA-Seq strategy employed in the identification of the Q. suber differential root transcriptome in response to long-term drought. Functional characterization was extended by identification of Arabidopsis thaliana orthologs for the differentially expressed genes.
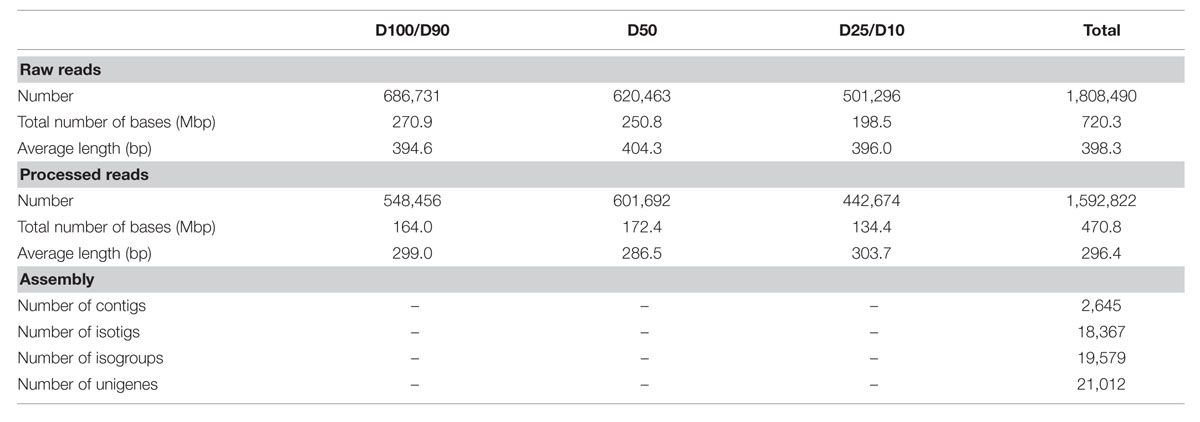
TABLE 1. Statistics of the sequencing and assembly steps.
For quality validation, the assembled transcriptome’s coverage was established against the Quercus rubra Unigene V2 transcriptome, Castanea molissima predicted transcriptome, and A. thaliana transcriptome, as well as the Q. suber total transcriptome, previously established by COEC (Pereira-Leal et al., 2014; herein total transcriptome). Results demonstrated that the present Q. suber transcriptome had a very high coverage, with 80–90% unigenes matching 45–70% of transcriptomes from other species (Figure 3). Furthermore, 98.5% of unigenes were present in the previous total transcriptome (Supplementary Figure S2). In support of the present strategy to perform a de novo drought-associated transcriptome assembly, we observed that our N50 for transcript length (758 bp) was over 4 times higher than that of the total transcriptome (N50 = 179 bp), and ∼20 thousand unigenes matched over 80 thousand transcripts of the total transcriptome, indicating that present unigenes are proportionally representing contigs that failed to assemble in the total transcriptome. Moreover, the present N50 value is similar to equivalent recent Q. suber transcriptomes that also adopted a de novo assembly strategy (N50 = 689 bp, Sebastiana et al., 2014; N50 = 914 bp, Rocheta et al., 2014; N50 = 770 bp, Teixeira et al., 2014). Our results further suggest that Newbler-based assembly (present report; Rocheta et al., 2014; Teixeira et al., 2014) is more suited for 454 libraries than MIRA-based assembly (Pereira-Leal et al., 2014; Sebastiana et al., 2014), since the latter studies presented poorer metrics (lower N50, significantly higher unigene number). This evidence supports the previous claim that Newbler outperforms other assemblers with regards to 454 pyrosequencing data (Kumar and Blaxter, 2010).
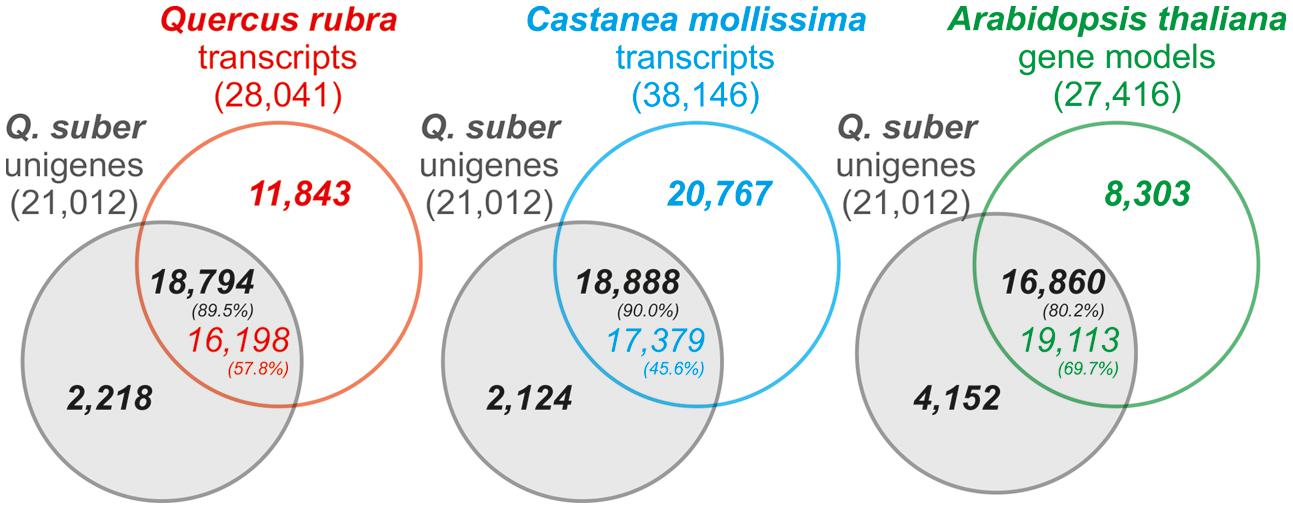
FIGURE 3. Venn diagram representation of the number of homology hits (E-value < 1e-6) between Q. suber unigenes and Arabidopsis thaliana TAIR 10 gene models, Quercus rubra putative transcripts and the Castanea mollissima predicted transcriptome. Percentages indicate the proportion of matching genes between reference transcriptomes and Q. suber unigene models.
Differential Expression Analysis of the Drought Root Transcriptome
For differential expression analysis, HQ reads from each sample were mapped to the reference transcriptome (Figure 2). Distribution analysis for the number of reads mapped to each unigene demonstrated that approximately 98% of unigenes displayed a fairly low number of reads (<100; Supplementary Figure S3A). Consistently, the different watering regimes showed similar distribution profiles. To establish differential expression, unigenes were then subjected to read count differential analysis by Negative Binomial Distribution (Anders and Huber, 2010). Briefly, all three experimental situations were paired for differential expression and genes that displayed p-value <0.05 in at least one comparison were selected, resulting in a total of 546 DEGs (Figures 2 and 4). Interestingly, comparative analysis showed that most DEGs (79%) were expressed differentially throughout the three transcriptional pools (Figure 4A), suggesting the existence of dramatic/extensive transcriptional rearrangement between control, moderately- and severely stressed plants. HCL analysis was subsequently performed on DEGs (Figure 4B). Based on expression patterns, we differentiated nine gene clusters containing 353 up-regulated and 193 down-regulated unigenes (Figure 4B; Supplementary Figures S3B,C). Clusters of up-regulated genes were enriched in response to stress GO categories, whereas clusters of down-regulated genes were enriched in transport and energy pathway-related genes (Supplementary Figure S3C). In response to long term drought, up-regulated genes surpassed down-regulated genes by over twofold. Results support that the present transcriptomics strategy was efficient in resolving transcriptional changes. Data specifically suggests that the switch from moderate to severe drought (D50 vs. D25/D10) was transcriptionally more dramatic, considering that it evidenced (1) the highest number of unique DEGs (Figure 4A), (2) the most scattered pattern in MA plot projections (Supplementary Figure S3D), (3) the most significant differences in fold change values (Figure 4B; Supplementary Figure S3B).
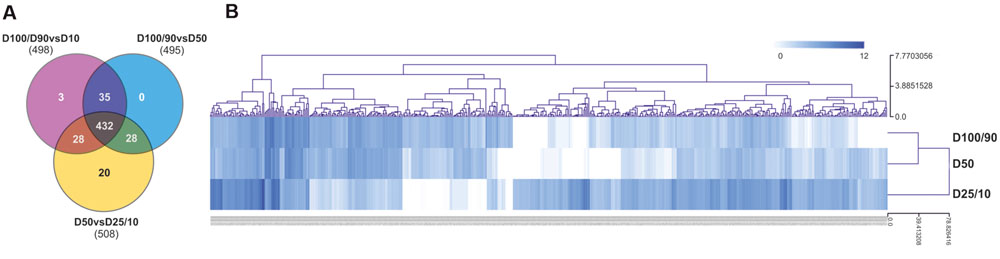
FIGURE 4. Characterization of differential gene expression in D100/90 vs. D50, D100/90 vs. D25/10 and D50 vs. D25/10 transcriptional comparisons. (A) Venn diagram representing unigenes in each experimental comparison. (B) Hierarchical clustering analysis of DEG gene expression values.
Annotation of Differentially Expressed Genes
To functionally annotate DEGs, these were subjected to BLASTx homology search against the Non-redundant GenBank Protein Database, as well as Blast2GO analysis (Conesa et al., 2005). The complete set of annotated genes is compiled in Supplementary File S2. Quality of the sequencing/assembly strategy was validated by various forms. Figure 5A depicts that the majority of unigene homology hits had extremely low E-values. Only 5.7% of DEGs failed to annotate with known proteins, even when threshold E-values were raised up to 1e-1 (data not shown). Finally, species distribution for BLAST hits placed unigene homologs within plant species (Figure 5B), supporting the initial trimming step that eliminated foreign sequences and contaminants.
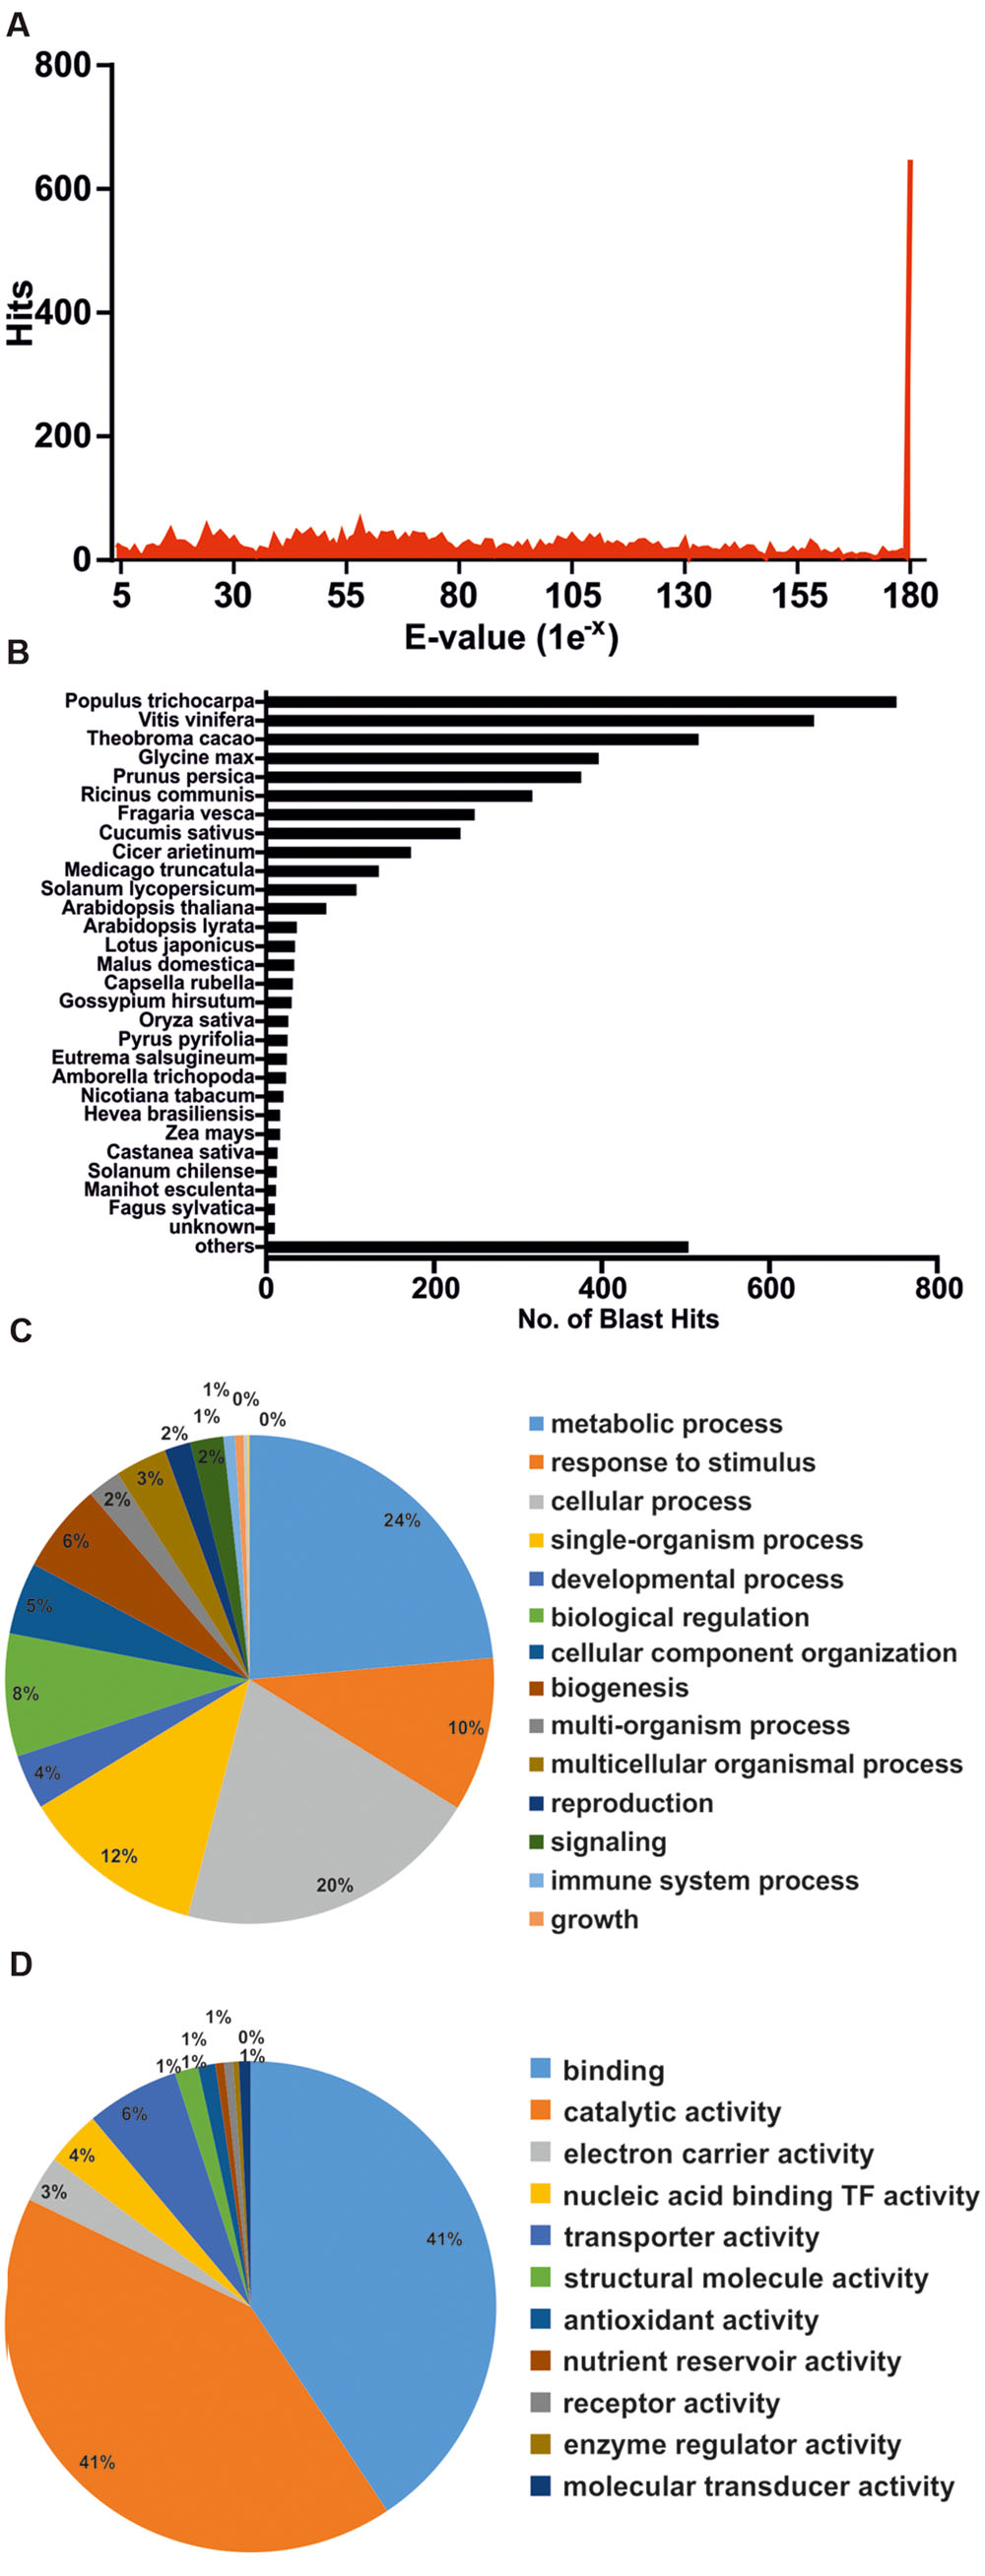
FIGURE 5. Annotation of differentially expressed genes by BLAST homology search. (A) E-value distribution of the first 50 BLAST hits per each unigene. (B) Species distribution of the first 50 BLAST hits per each unigene. (C) Functional categorization of annotated genes by Blast2GO (GO Biological Process) analysis. (D) Functional categorization of annotated genes by Blast2GO (GO Molecular Function) analysis.
Table 2 highlights the most significant DEGs based on functional categories that are of interest to our study. DEGs included an important number of effector proteins traditionally associated with drought responses, such as proteins with chaperone activity (dehydrins and LEA proteins) (Umezawa et al., 2006; Shao et al., 2008), solute transporters and biosynthetic genes of compatible osmolites (Wang et al., 2003), and proteins associated with cell wall remodeling (Tenhaken, 2014). DEGs also included regulatory components of known drought-related signaling pathways, such as TFs, Protein Phosphatase 2C (PP2Cs) (Schweighofer et al., 2004) and serine/threonine kinases (SnRKs) (Yoshida et al., 2002), as well as genes associated with ubiquitin-mediated protein degradation (Lee and Kim, 2011), suggesting a tight control of drought responses at both the transcriptional and protein turnover levels. Subsequently, Blast2GO was used to classify genes according to GO terms (Figures 5C,D). In support of our differential expression analysis, foremost GO Biological Process terms included metabolic processes and response to stimulus, while significant GO Molecular Function terms included nucleic acid binding TF activity and transporter activity. Interestingly, a series of genes normally considered to have housekeeping functions could be observed, including ribosomal-, actin-, and tubulin-gene family members (Supplementary File S2). Since genes belonging to these categories have already been used as constitutive expressors in Q. suber (Marum et al., 2012; Rocheta et al., 2014; Sebastiana et al., 2014; Teixeira et al., 2014), the present and ongoing NGS-based transcriptional studies will be important for a future revision of constitutive expressor genes.
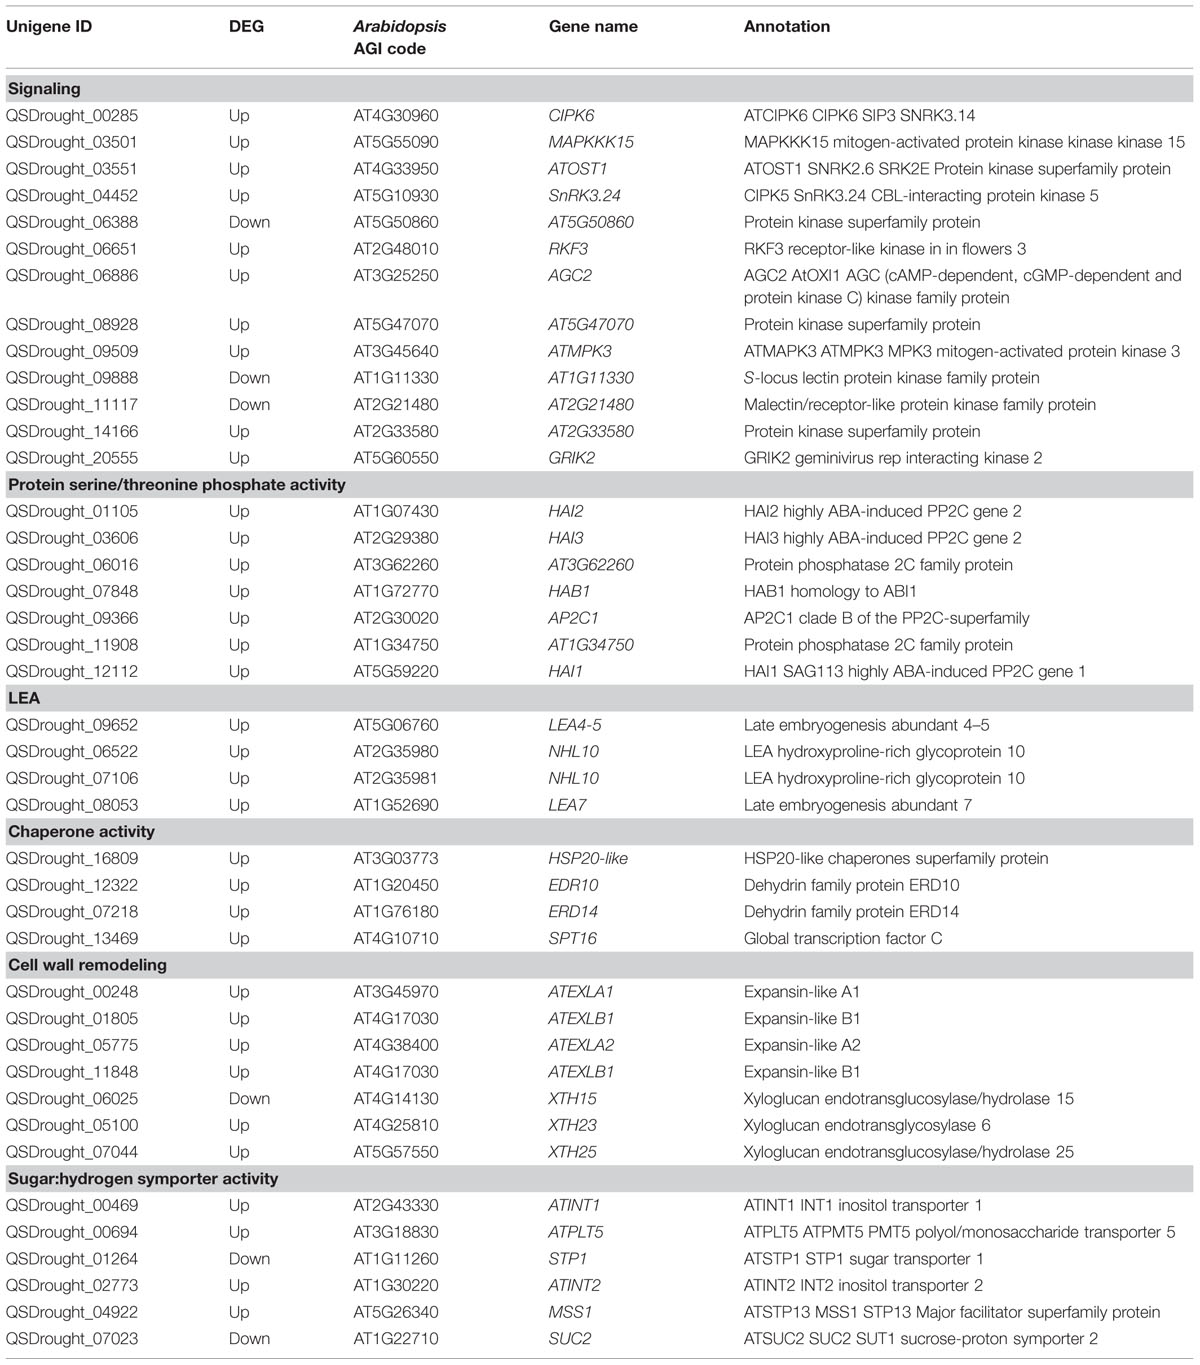
TABLE 2. Selection and categorization of significant Quercus suber unigenes differentially expressed in response to drought.
Functional Data Mining of the Differential Transcriptome
To obtain functional data from Q. suber DEGs, we used a homology-based approach to identify DEG orthologs in the model plant A. thaliana, using BLASTp homology search against the Arabidopsis TAIR 10 genome annotation (Figure 2). Of the initial 546 Q. suber unigenes, 41 failed to annotate to any known sequence, and 15 did not annotate to Arabidopsis protein models, resulting in 490 BLAST hits. We also observed redundancy within these hits, leading to the identification of 454 unique DEG orthologs (Figure 2, Supplementary File S2). Functional data mining was subsequently performed by means of gene network analysis, using the Genemania plugin at Cytoscape (Warde-Farley et al., 2010; Saito et al., 2012). First, a functional network was created to represent known genetic interactions, protein interactions and protein structural features (Figure 6A). We used the built-in feature of Genemania to calculate and display the most over-represented GO categories of our dataset, uncovering a central gene cluster that was enriched in water responsive genes (the most over-represented GO category in the Genemania analysis), including various genes related to ABA-signaling categories, such as phosphatases of the PP2C family that are key regulatory components of ABA-signaling pathways, and other low Ψw responsive genes (Supplementary Figure S4A) (Saez et al., 2004; Bhaskara et al., 2012; Zhang et al., 2013).
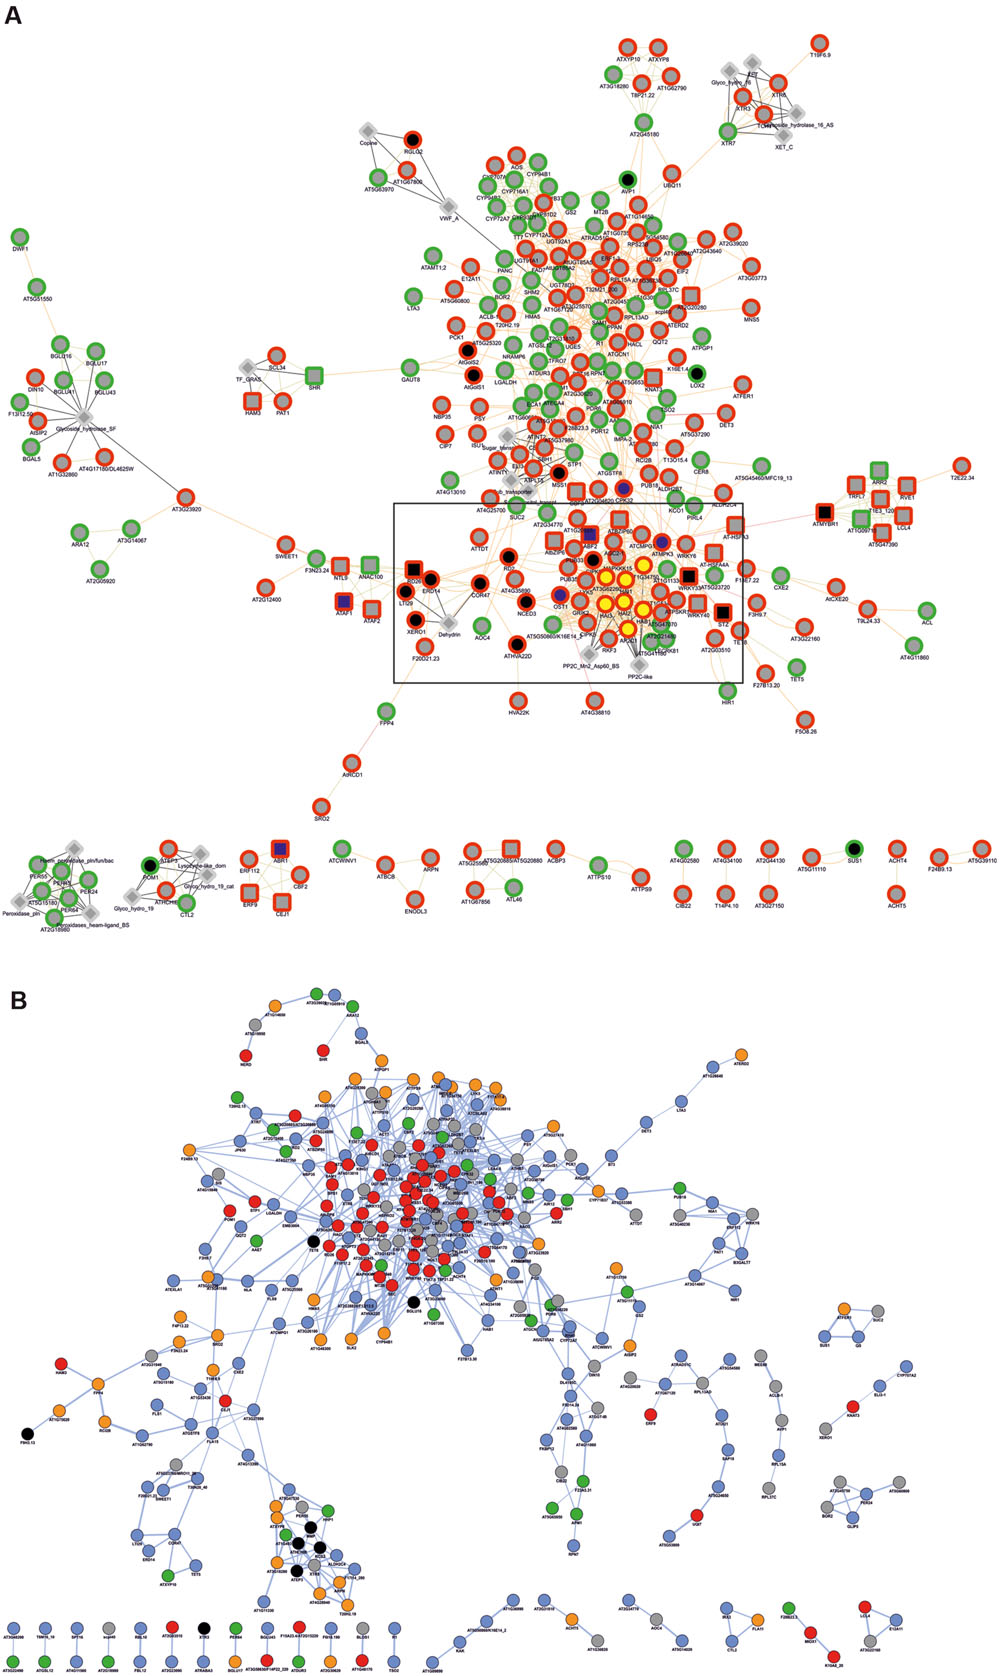
FIGURE 6. Gene network analysis of Arabidopsis DEG orthologs. (A) Analysis regarding functional features (attributes, genetic interactions, physical interactions, predicted protein interactions and shared protein domains), performed in the Genemania App of Cytoscape. Genes are generally represented as gray circles; attributes are represented as gray diamonds; genes automatically annotated as belonging to the GO category Response to water are represented as black nodes, and within these, those belonging to ABA-related subcategories are represented by blue nodes; genes automatically annotated as belonging to the GO category Protein serine/threonine phosphatase activity are represented as yellow nodes. Borders indicate up-regulated (red) and down-regulated (green) genes. Interactions are represented as edges (edge thickness represents normalized link weights) and edge color indicates physical interaction (magenta), predicted interaction (orange), shared protein domain (light green) and InterPro protein classification (gray). (B) Predicted protein co-localization analysis. Edge thickness represents normalized co-localization strength of the gene pair. Genes are represented by color code, reflecting predicted sub-cellular targeting of their coding proteins, based on GO Cellular Component categorization toward the nucleus (red), cytoplasm (blue), plasma membrane (orange), organelle (green), extracellular region (black) and unknown (gray).
A second network was generated to represent cellular co-localization (Figure 6B). Analysis revealed a major gene cluster associated with protein targeting to the nucleus, suggesting once more the existence of extensive transcriptional regulatory events. Based on this evidence, and considering that genes with identical expression patterns will be controlled by the same TFs and share common cis-elements in their promoters, we identified statistically over-represented cis-elements in the promoters of DEG orthologs (Table 3). We could observe that a significant number of over-represented TF-binding site motifs belonged to the conserved ABA-responsive cis-element (ABRE), and ABRE-like motifs. These elements are the binding site of ABRE-binding factor (ABF) TFs that have been previously associated to promoter regions of ABA-regulated, drought-responsive genes (Yoshida et al., 2010). All DEG orthologs that displayed ABRE and/or ABRE-like motifs were considered for co-expression network prediction using Cytoscape, and as expected, a complex gene co-expression network could be observed, indicating the existence of an ABA-mediated ABF-dependent regulon (Supplementary Figure S4B).
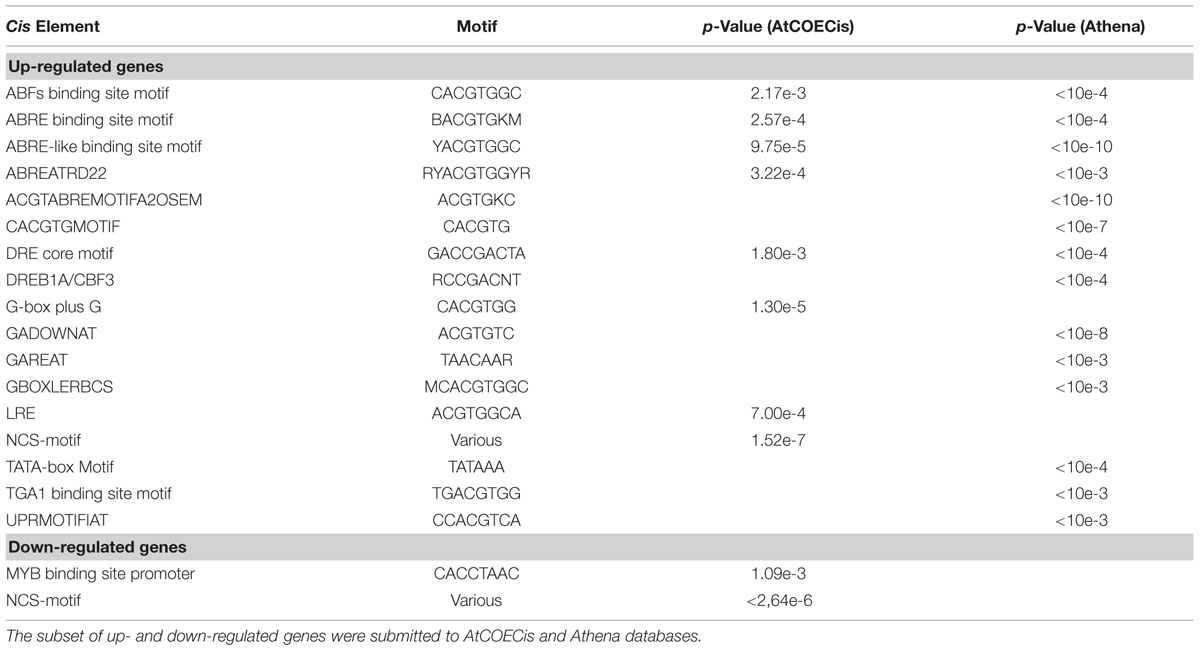
TABLE 3. Cis-elements over-represented in the promoter region of DEG orthologs.
Next we performed an automated search for TFs within DEG orthologs, and observed that drought imposition transcriptionally regulated a large variety of TFs (Table 4). The most abundant classes included NAC, AP2/ERF, WRKY and MYB TFs. The existence of various TF classes in the differential transcriptome of Q. suber roots responding to drought is extremely noteworthy. NAC, AP2/ERF, WRKY and MYB TFs have all been functionally associated with drought stress response mechanisms (Wang et al., 2003; Mahajan and Tuteja, 2005; Shao et al., 2008). For instance, in A. thaliana, loss- or gain-of-function mutants for ATAF1 (Lu et al., 2007), MYB44 (Persak and Pitzschke, 2014), ABR1 (Pandey et al., 2005) and WRKY40 (Chen et al., 2010; Wang et al., 2013) have been established as drought/osmotic stress determinants, regulating signaling pathways, ROS scavenging, cell wall remodeling and stomatal aperture. In order to validate BLAST homology searches and the existence of drought-related Q. suber TFs, these were phylogenetically resolved against the totality of annotated Arabidopsis TFs, in each of the four most represented TF classes (Supplementary Figure S5). Results allowed us to identify the closest Arabidopsis orthologs to our Q. suber genes-of-interest, which is important for two reasons. On the one hand, identification of Arabidopsis orthologs with known functional association with drought resistance can be used to functionally validate Q. suber genes as novel cork oak determinants of root level drought stress resistance, namely by complementation of Arabidopsis functional mutants with Q. suber orthologs. Secondly, phylogenetic mapping of Q. suber drought-responsive genes can be used in exploratory analysis to identify novel drought stress determinants in Arabidopsis, which can then be validated by subsequent functional mutant approaches in this model species. For instance, QSDrought_01793, a MYB TF, is the ortholog of At5g67300 (MYB44) and is likely to be its functional equivalent: MYB44 is a known determinant of salt and drought stress responses. On the other hand, within the same MYB TF family, QSDrought_16911 suggests that the functionally unresolved Arabidopsis At1g26580 gene is possibly a drought stress determinant.
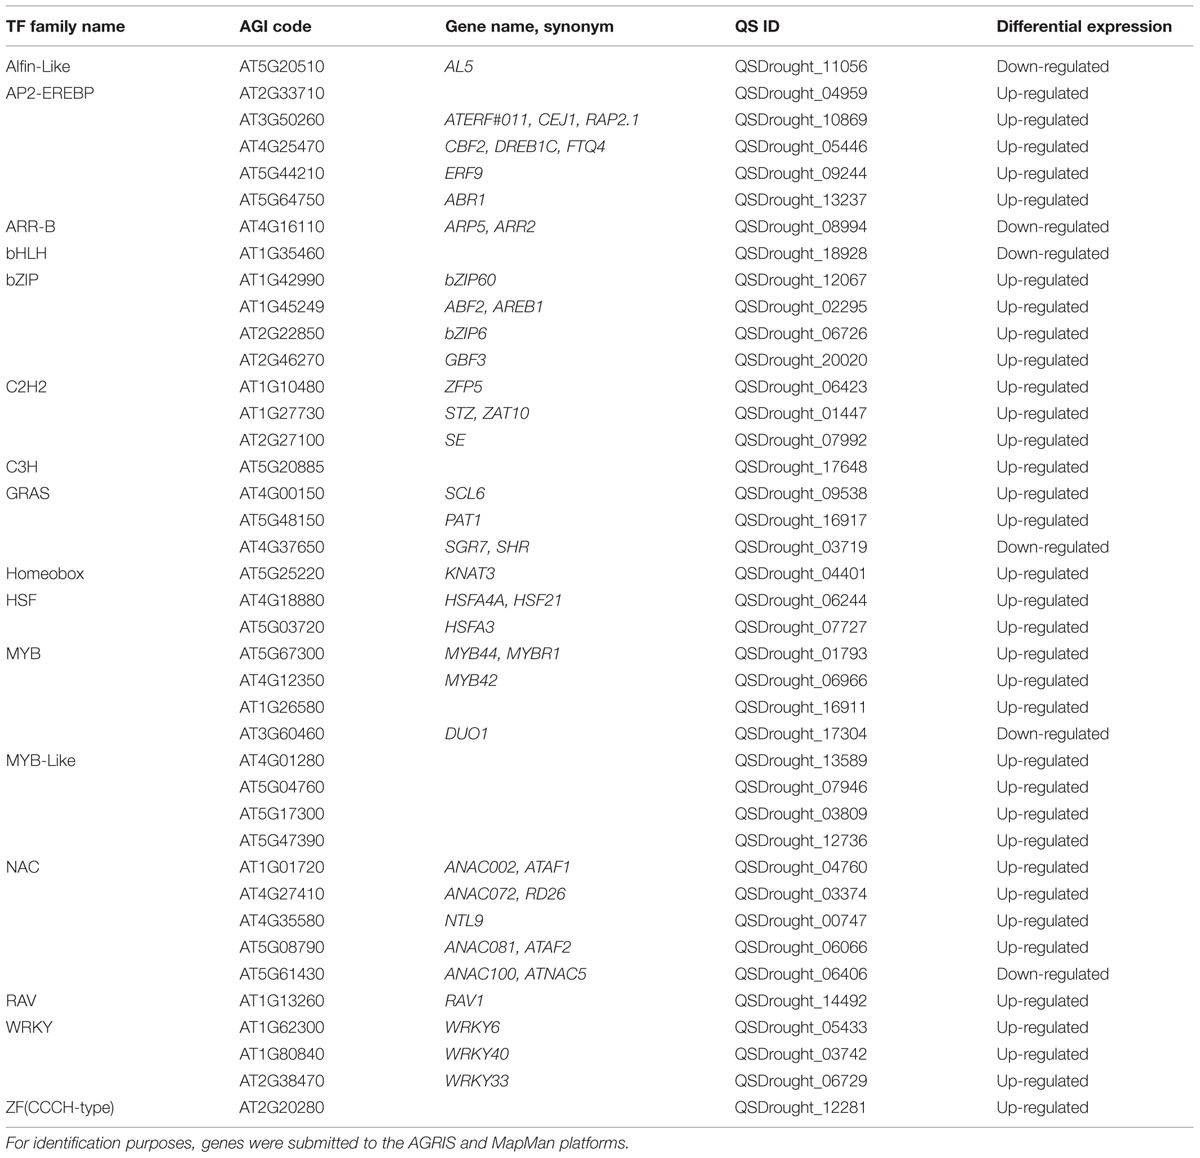
TABLE 4. List of transcription factors (TFs) present within DEG orthologs.
Identification of a Core ABA-Dependent Signaling Network
In plants, drought stress responses have been functionally mapped to four major signaling pathways that involve both ABA-dependent and ABA-independent pathways (Shinozaki and Yamaguchi-Shinozaki, 2007; Kuromori et al., 2014). Present results strongly supported the involvement of an ABA-dependent signaling network in the Q. suber root-level response to drought, given that (1) analysis of GO category enrichment highlighted the up-regulation of known ABA-signaling components, (2) cis-element analysis proposed an enrichment in ABRE and ABRE-like motifs, (3) several ABA-related TFs and response marker genes were identified. Present evidence specifically suggested the existence of ABF-related signaling events, therefore we performed an intersection network, merging the DEG functional network and components of the ABA- and ABF-dependent signal transduction pathway (Figure 7A). Surprisingly, we uncovered evidence for the transcriptional activation of the complete core ABA signal transduction pathway in long-term drought-stressed Q. suber roots. ABA levels can be sensed by a series of different cellular receptors (Golldack et al., 2014). In the best established case, PYR/PYL/RCAR nucleocytoplasmic receptors bind ABA and inhibit PP2Cs, preventing them from negatively regulating SnRK2 kinases. SnRK2s are then free to phosphorylate and activate key components that include ABF TFs, thus modulating the activity of a series of ABA-responsive genes (Figure 7B) (Raghavendra et al., 2010; Nakashima and Yamaguchi-Shinozaki, 2013; Golldack et al., 2014; Kuromori et al., 2014). Here we observed that, with the exception of the PYR/PYL/RCAR sensor, all components could be found within Q. suber DEGs, and all appeared to be up-regulated upon stress imposition. One Q. suber PYR/PYL/RCAR gene was found in the assembled Q. suber transcriptome, suggesting that the sensor is constitutively expressed.
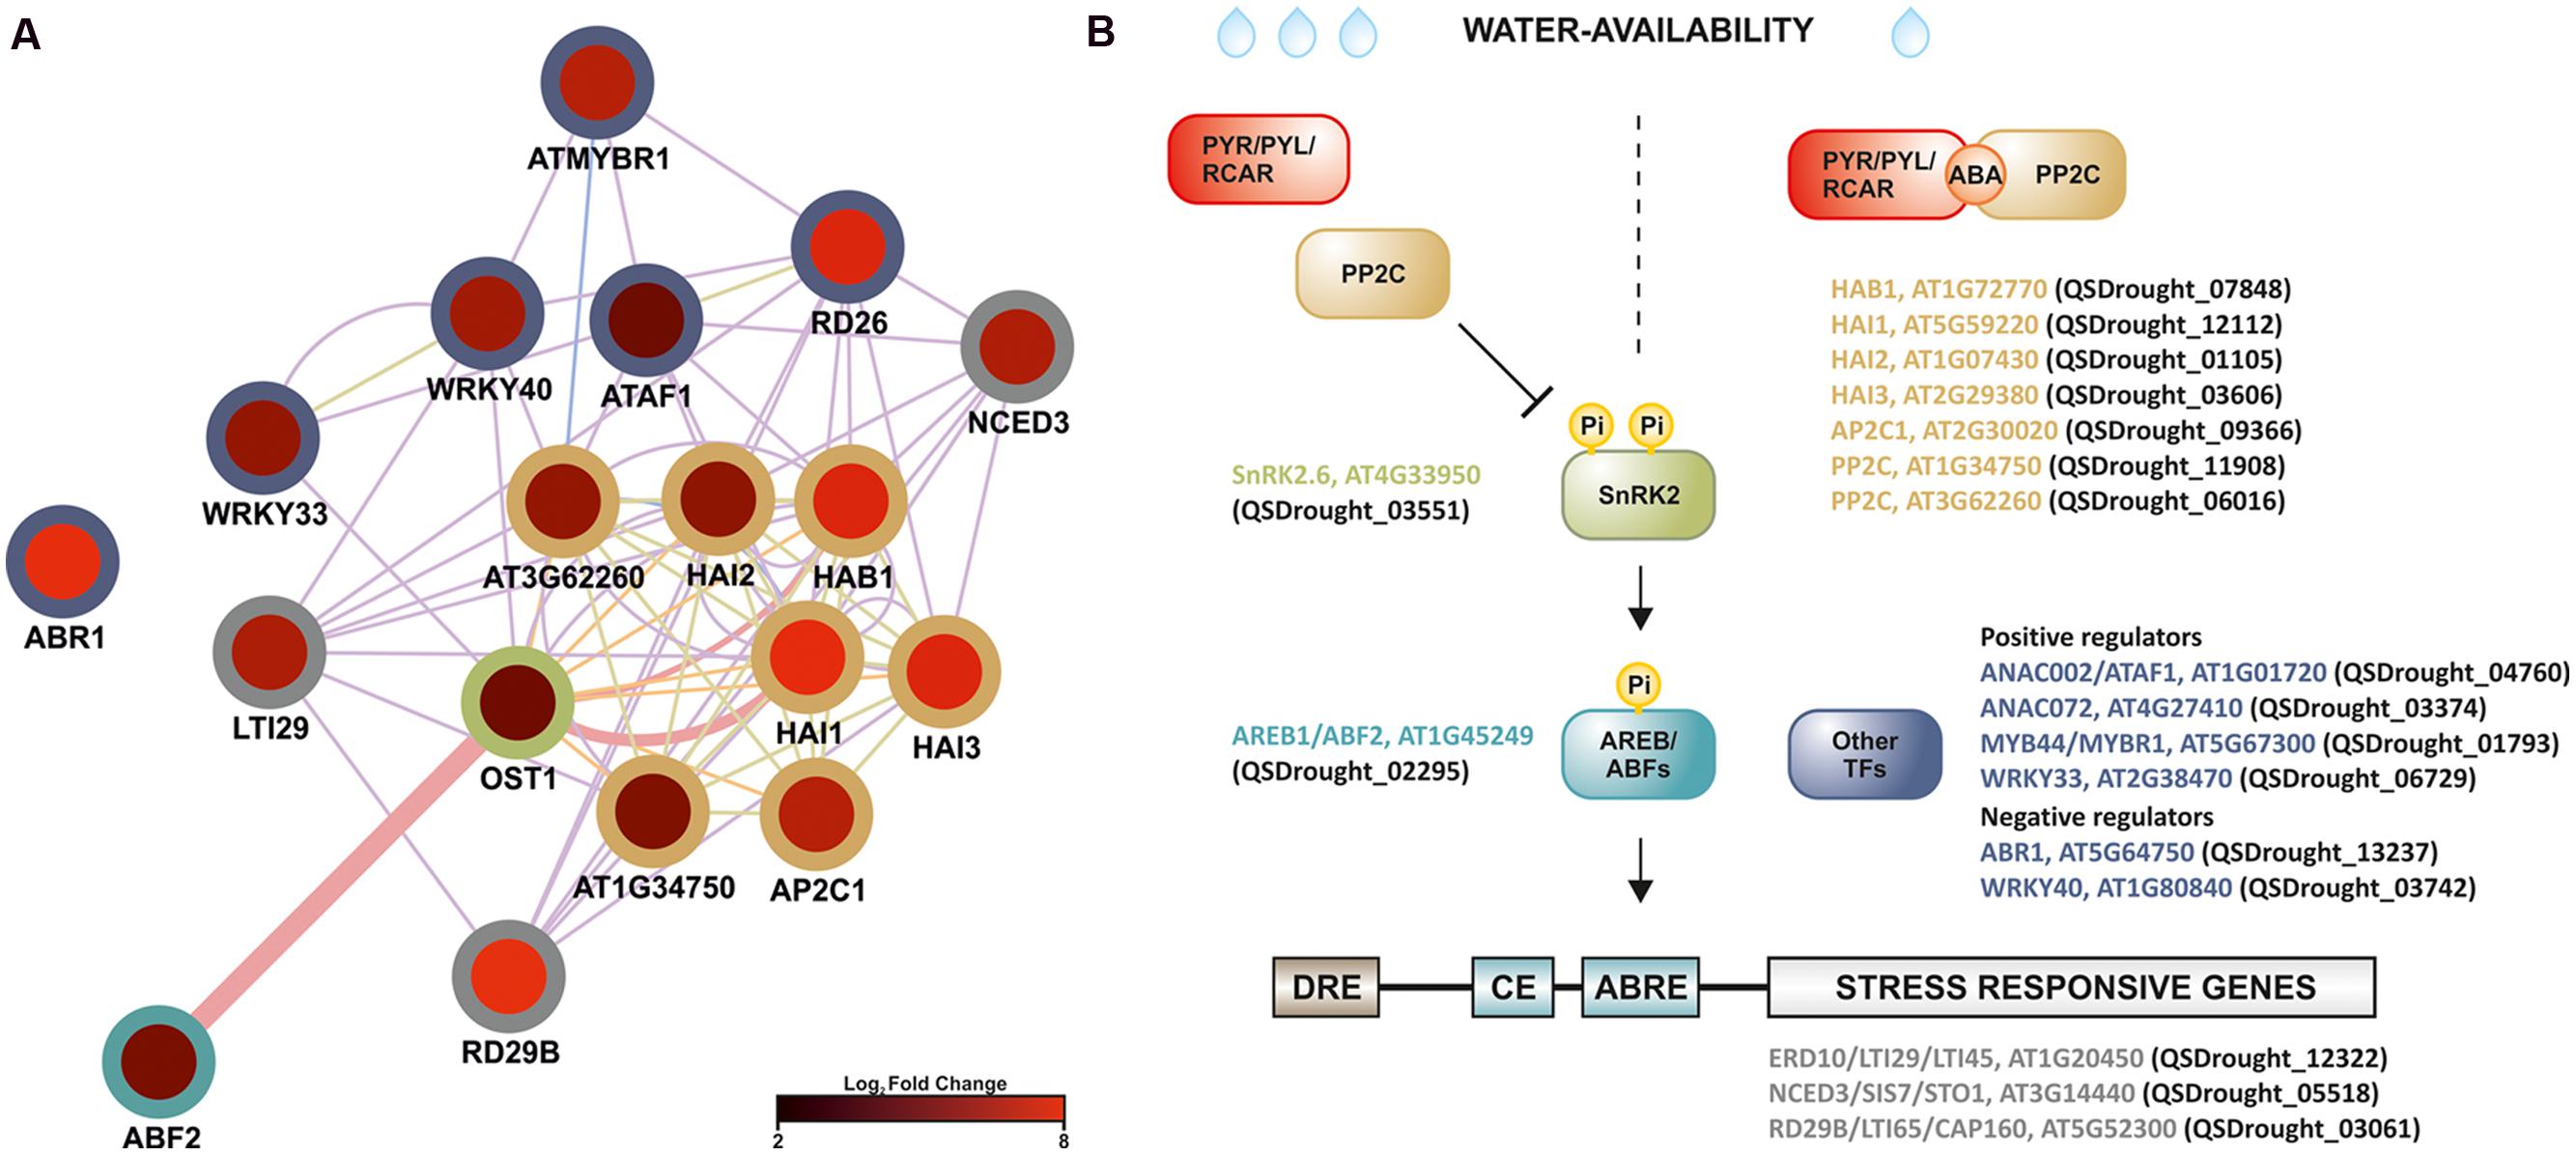
FIGURE 7. Model for the regulation of long-term drought responses in Q. suber roots, where ABF-dependent signaling pathway components are up-regulated in roots exposed to long-term drought. (A) Functional network (functional features on Cytoscape), based on known Arabidopsis ABF-dependent signaling components (Miyakawa et al., 2013; Nakashima and Yamaguchi-Shinozaki, 2013), cross-referenced against the complete DEG functional network. Edge thickness represents normalized link weights and edge color indicates physical interaction (magenta), predicted interaction (orange), shared protein domain (light green) and co-expression (purple). Node color represents expression in Log2 of fold change, while border color represents different classes of signaling components. (B) Schematic model of the proposed ABF-dependent signaling cascade: colors refer to different Arabidopsis signaling cascade components (gene name plus AGI code), while brackets highlight matching Quercus ID unigenes, found in the present analysis to be differentially expressed. Low water availability induces ABA production, which is recognized by the PYR/PYL/RCAR receptors. PYR/PYL/RCAR’s structural conformation changes after binding to ABA, thus recruiting Protein Phosphatase 2C (PP2C) phosphatases. PP2Cs are unavailable to dephosphorylate SnRK2 kinases. Phosphorylated (active) SnRK2s activate AREB/ABF transcription factors (TFs), which recognize ABRE cis-element motifs, mediating induction of stress-related gene expression (e.g., RD29b and NCED3). Other TF families are also likely to play a role in drought-signaling, including ANAC, AP2/EREB, MYB and WRKY TFs.
The most observed enrichment related to the PP2C gene family, with seven up-regulated genes (Table 2, Figure 7B). Q. suber PP2C were phylogenetically resolved against the Arabidopsis PP2C gene family (Supplementary Figure S6). Components included orthologs of Arabidopsis HAB1, a negative regulator of the ABA signaling pathway (Saez et al., 2004), HAI1, also associated with negative regulation of ABA signaling pathway (Zhang et al., 2013), and HAI2 and HAI3, that together with HAI1 have been associated with negative regulation of osmotic adjustment-related genes (Bhaskara et al., 2012). Interestingly, ortholog PP2Cs also include AP2C1, reported as being both a negative regulator of MAPK signaling proteins, and a regulator of ABA-related genes and signaling components (Schweighofer et al., 2007; Brock et al., 2010). Positive components of the pathway (SnRK2 and ABF elements) were also observed and found to be up-regulated, possibly contributing for the transcriptional accumulation of drought stress marker genes such as RD29b and NCED3, both of which respond to ABF by containing ABRE cis-elements (Figure 7B) (Nakashima et al., 2006; Behnam et al., 2013). NCED3 is a component of the ABA biosynthetic pathway (Iuchi et al., 2001), and may thus contribute to signal amplification via a positive feedback loop.
Additional signaling pathways may be involved in the Q. suber root response to long-term drought, given the extension of TFs and genes involved in the overall transcriptional response to drought, and the capacity of this organism to sustain long periods of water deficit. Figure 7B acknowledges the existence of additional regulatory elements of the Q. suber differential transcriptome, namely TFs that have been previously highlighted (Table 4), and that act as both positive and negative determinants of drought-related effector genes (Fujita et al., 2004; Pandey et al., 2005; Lu et al., 2007; Yoshida et al., 2010; Nakashima and Yamaguchi-Shinozaki, 2013; Wang et al., 2013; Persak and Pitzschke, 2014). To functionally validate our observations, qPCR was used to determine gene expression and compare it to RNA-Seq data (Figure 8). Emphasis was given to the above-mentioned ABA-dependent ABF signaling pathway. Therefore, genes selected for qPCR analysis incorporated at least one example of the components of the pathway, from PP2C to effector genes. All ten genes closely matched the relative expression values calculated via RNA-Seq analysis, thus supporting the current experimental strategy.
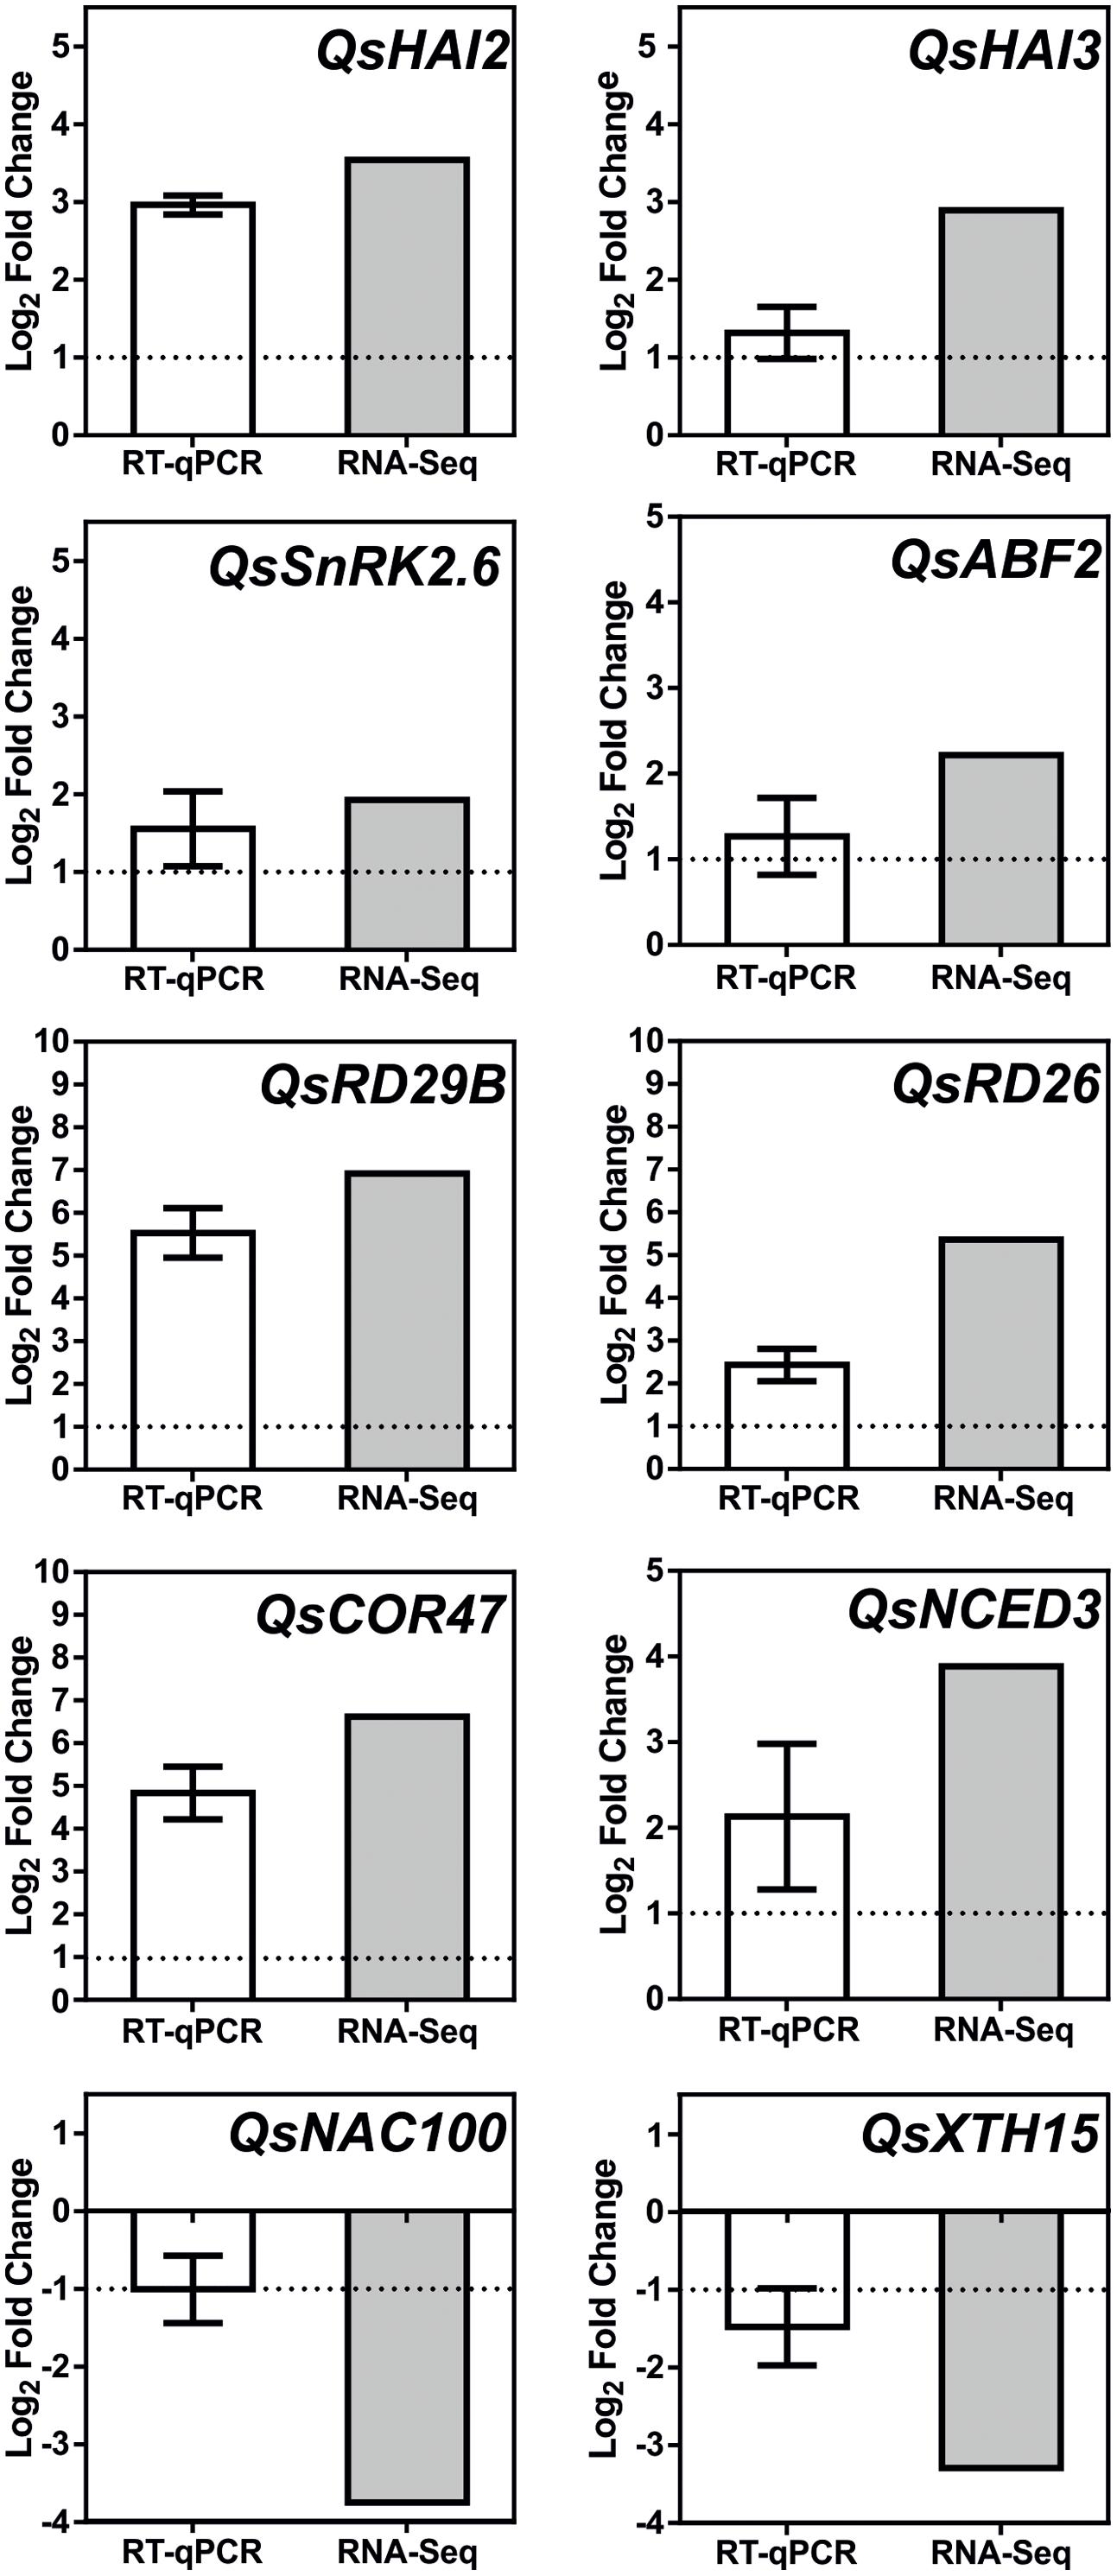
FIGURE 8. Real-time PCR (qPCR) analysis of selected Q. suber drought stress responsive genes. White bar represents changes in mRNA levels of root tissues under severe drought stress (D25/D10), in comparison to control samples (D100/90). Expression was normalized using QsPP2A-3 as a reference gene. Results represent mean values ± SD (n = 3) and are expressed as Log2 values of the fold change. Gray bar represents matching relative expression values, derived from RNA-Seq analysis of the D100/90 vs. D25/10 condition.
Conclusion
As environmental changes in the Mediterranean basin keep raising concern on the future resilience of Q. suber, and as numbers of cork oak populations keep declining, more and more efforts are required to understand the biology and physiology of such an economically significant species. Over the last years, tools have been developed to study several aspects of cork oak biology at the genetic and molecular levels, such as gene/protein characterization, population genomics and dEST transcriptomics. However, the advent of an Omics age for this species is essential for the future characterization of cork oak at a systems level. A significant step will be accomplished with the ongoing sequencing of its full genome. In the present report, we used an RNA-Seq approach to uncover that, upon long-term drought stress imposition, Q. suber roots induce all known components of an ABA-dependent signaling network involving ABF TFs. This pathway seems to be part of an even larger transcriptional rearrangement that should be the subject of future studies, bringing new insight onto the cork oak response to low water availability. Moreover, the present report opens new research possibilities, as it can be used as an exploratory study towards the identification of novel stress determinants in the model species A. thaliana.
Author Contributions
HA, RT, and TL-N designed and supervised the drought experiment; AM, NV, DC, FR, TL-N and HA grew plants, performed RNA extraction and physiological characterization; HA and PHC designed and supervised the bioinformatics and gene network analysis strategies; AM, IM, NV, and HA performed bioinformatics; AM, NV, FR, and PC performed qPCR analysis; All authors discussed the data. HA, RT, TL-N, PC, and AM discussed the data and wrote the manuscript.
Conflict of Interest Statement
The authors declare that the research was conducted in the absence of any commercial or financial relationships that could be construed as a potential conflict of interest.
Acknowledgments
This work was supported by FEDER through the Operational Competitiveness Program – COMPETE – and by national funds through the Foundation for Science and Technology – FCT – within the scope of projects SOBREIRO/0033/2009 “Cork oak ESTs Consortium – Abiotic stress: drought, salt and oxidative stresses” and PTDC/AGRGPL/118505/2010 “An integrated approach to identify stress-related regulatory genes in cork oak (SuberStress).” PHC was supported by FEDER through COMPETE, and by national funds (FCT) within the scope of project “SUMOdulator” [Refs. FCOMP-01-0124-FEDER-028459 and PTDC/BIA-PLA/3850/2012]. HA was supported by the “Genomics and Evolutionary Biology” project, co-financed by North Portugal Regional Operational Programme 2007/2013 (ON.2 – O Novo Norte), under the National Strategic Reference Framework (NSRF), through the European Regional Development Fund (ERDF).
Supplementary Material
The Supplementary Material for this article can be found online at: http://journal.frontiersin.org/article/10.3389/fpls.2015.01195
FILE S1 | FASTA file of transcriptome sequences.
FILE S2 | Complete annotation of DEGs.
Footnotes
- ^ http://www.uniprot.org/uploadlists/
- ^ http://www.fagaceae.org/
- ^ http://www.arabidopsis.org/
- ^ http://bio-bwa.sourceforge.net
- ^ http://bioinfogp.cnb.csic.es/tools/venny/index.html
- ^ http://cdbfasta.sourceforge.net/
- ^ http://www.tm4.org/mev.html
- ^ http://bioinformatics.ysu.edu/tools/OrfPredictor.html
- ^ http://www.arabidopsis.org
- ^ http://arabidopsis.med.ohio-state.edu/AtTFDB/
- ^ http://www.corkoakdb.org/
References
Anders, S., and Huber, W. (2010). Differential expression analysis for sequence count data. Genome Biol. 11:R106. doi: 10.1186/gb-2010-11-10-r106
Atkinson, N. J., and Urwin, P. E. (2012). The interaction of plant biotic and abiotic stresses: from genes to the field. J. Exp. Bot. 63, 3523–3543. doi: 10.1093/jxb/ers100
Azevedo, H., Lino-Neto, T., and Tavares, R. M. (2003). An improved method for high-quality RNA isolation from needles of adult maritime pine trees. Plant Mol. Biol. Rep. 21, 333–338. doi: 10.1007/BF02772582
Bates, L., Waldren, R., and Teare, I. (1973). Rapid determination of free proline for water-stress studies. Plant Soil 39, 205–207. doi: 10.1007/BF00018060
Behnam, B., Iuchi, S., Fujita, M., Fujita, Y., Takasaki, H., Osakabe, Y., et al. (2013). Characterization of the promoter region of an Arabidopsis gene for 9-cis-epoxycarotenoid dioxygenase involved in dehydration-inducible transcription. DNA Res. 20, 315–324. doi: 10.1093/dnares/dst012
Belahbib, N., Pemonge, M. H., Ouassou, A., Sbay, H., Kremer, A., and Petit, R. J. (2001). Frequent cytoplasmic exchanges between oak species that are not closely related: Quercus suber and Q. ilex in Morocco. Mol. Ecol. 10, 2003–2012. doi: 10.1046/j.0962-1083.2001.01330.x
Bhaskara, G. B., Nguyen, T. T., and Verslues, P. E. (2012). Unique drought resistance functions of the highly ABA-induced clade A protein phosphatase 2Cs. Plant Physiol. 160, 379–395. doi: 10.1104/pp.112.202408
Brock, A. K., Willmann, R., Kolb, D., Grefen, L., Lajunen, H. M., Bethke, G., et al. (2010). The Arabidopsis mitogen-activated protein kinase phosphatase PP2C5 affects seed germination, stomatal aperture, and abscisic acid-inducible gene expression. Plant Physiol. 153, 1098–1111. doi: 10.1104/pp.110.156109
Castro, P. H., Tavares, R. M., Bejarano, E. R., and Azevedo, H. (2012). SUMO, a heavyweight player in plant abiotic stress responses. Cell. Mol. Life Sci. 69, 3269–3283. doi: 10.1007/s00018-012-1094-2
Chen, H., Lai, Z., Shi, J., Xiao, Y., Chen, Z., and Xu, X. (2010). Roles of Arabidopsis WRKY18, WRKY40 and WRKY60 transcription factors in plant responses to abscisic acid and abiotic stress. BMC Plant Biol. 10:281. doi: 10.1186/1471-2229-10-281
Chen, L., Song, Y., Li, S., Zhang, L., Zou, C., and Yu, D. (2012). The role of WRKY transcription factors in plant abiotic stresses. Biochim. Biophys. Acta 1819, 120–128. doi: 10.1016/j.bbagrm.2011.09.002
Conesa, A., Götz, S., García-Gómez, J. M., Terol, J., Talón, M., and Robles, M. (2005). Blast2GO: a universal tool for annotation, visualization and analysis in functional genomics research. Bioinformatics 21, 3674–3676. doi: 10.1093/bioinformatics/bti610
Danquah, A., de Zelicourt, A., Colcombet, J., and Hirt, H. (2014). The role of ABA and MAPK signaling pathways in plant abiotic stress responses. Biotechnology Adv. 32, 40–52. doi: 10.1016/j.biotechadv.2013.09.006
Davuluri, R. V., Sun, H., Palaniswamy, S. K., Matthews, N., Molina, C., Kurtz, M., et al. (2003). AGRIS: Arabidopsis gene regulatory information server, an information resource of Arabidopsis cis-regulatory elements and transcription factors. BMC Bioinformatics 4:25. doi: 10.1186/1471-2105-4-25
Eisen, M. B., Spellman, P. T., Brown, P. O., and Botstein, D. (1999). Cluster analysis and display of genome-wide expression patterns. Proc. Natl. Acad. Sci. U.S.A. 96, 10943. doi: 10.1073/pnas.96.19.10943-c
Epron, D., Dreyer, E., and Aussenac, G. (1993). A comparison of photosynthetic responses to water stress in seedlings from 3 oak species: Quercus petraea (Matt) Liebl, Q. rubra L and Q. cerris L. Ann. For. Sci. 50, 48s–60s. doi: 10.1051/forest:19930704
Falgueras, J., Lara, A. J., Fernández-Pozo, N., Cantón, F. R., Pérez-Trabado, G., and Claros, M. G. (2010). SeqTrim: a high-throughput pipeline for pre-processing any type of sequence read. BMC Bioinformatics 11:38. doi: 10.1186/1471-2105-11-38
Faria, T., Garcia-Plazaola, J. I., Abadia, A., Cerasoli, S., Pereira, J. S., and Chaves, M. M. (1996). Diurnal changes in photoprotective mechanisms in leaves of cork oak (Quercus suber) during summer. Tree Physiol. 16, 115–123. doi: 10.1093/treephys/16.1-2.115
Flexas, J., Diaz-Espejo, A., Gago, J., Gallé, A., Galmés, J., Gulías, J., et al. (2014). Photosynthetic limitations in Mediterranean plants: a review. Environ. Exp. Bot. 103, 12–23. doi: 10.1016/j.envexpbot.2013.09.002
Fujita, M., Fujita, Y., Maruyama, K., Seki, M., Hiratsu, K., Ohme-Takagi, M., et al. (2004). A dehydration-induced NAC protein, RD26, is involved in a novel ABA-dependent stress-signaling pathway. Plant J. 39, 863–876. doi: 10.1111/j.1365-313X.2004.02171.x
Giardi, M., Cona, A., Geiken, B., Kučera, T., Masojidek, J., and Mattoo, A. (1996). Long-term drought stress induces structural and functional reorganization of photosystem II. Planta 199, 118–125. doi: 10.1007/BF00196888
Golldack, D., Li, C., Mohan, H., and Probst, N. (2014). Tolerance to drought and salt stress in plants: unraveling the signaling networks. Front. Plant Sci. 5:151. doi: 10.3389/fpls.2014.00151
Golldack, D., Lüking, I., and Yang, O. (2011). Plant tolerance to drought and salinity: stress regulating transcription factors and their functional significance in the cellular transcriptional network. Plant Cell Rep. 30, 1383–1391. doi: 10.1007/s00299-011-1068-0
Herrero, J., Valencia, A., and Dopazo, J. (2001). A hierarchical unsupervised growing neural network for clustering gene expression patterns. Bioinformatics 17, 126–136. doi: 10.1093/bioinformatics/17.2.126
Hipkins, M., and Baker, N. R. (1986). Photosynthesis: Energy Transduction: A Practical Approach. London: IRL Press Limited.
Huang, Y., Niu, B., Gao, Y., Fu, L., and Li, W. (2010). CD-HIT Suite: a web server for clustering and comparing biological sequences. Bioinformatics 26, 680–682. doi: 10.1093/bioinformatics/btq003
Iuchi, S., Kobayashi, M., Taji, T., Naramoto, M., Seki, M., Kato, T., et al. (2001). Regulation of drought tolerance by gene manipulation of 9-cis-epoxycarotenoid dioxygenase, a key enzyme in abscisic acid biosynthesis in Arabidopsis. Plant J. 27, 325–333. doi: 10.1046/j.1365-313x.2001.01096.x
Khraiwesh, B., Zhu, J.-K., and Zhu, J. (2012). Role of miRNAs and siRNAs in biotic and abiotic stress responses of plants. Biochim. Biophys. Acta 1819, 137–148. doi: 10.1016/j.bbagrm.2011.05.001
Kumar, S., and Blaxter, M. L. (2010). Comparing de novo assemblers for 454 transcriptome data. BMC Genomics 11:571. doi: 10.1186/1471-2164-11-571
Kuromori, T., Mizoi, J., Umezawa, T., Yamaguchi-Shinozaki, K., and Shinozaki, K. (2014). “Drought stress signaling network,” in Molecular Biology, ed. S. H. Howell (New York, NY: Springer), 383–409.
Lambers, H., Chapin, F. S., Iii, C., and Pons, T. (2008). “Plant Water Relations” in Plant Physiological Ecology. New York, NY: Springer, 163–223.
Lata, C., and Prasad, M. (2011). Role of DREBs in regulation of abiotic stress responses in plants. J. Exp. Bot. 62, 4731–4748. doi: 10.1093/jxb/err210
Lee, J.-H., and Kim, W. (2011). Regulation of abiotic stress signal transduction by E3 ubiquitin ligases in Arabidopsis. Mol. Cells 31, 201–208. doi: 10.1007/s10059-011-0031-9
Li, R.-H., Guo, P.-G., Michael, B., Stefania, G., and Salvatore, C. (2006). Evaluation of chlorophyll content and fluorescence parameters as indicators of drought tolerance in barley. Agric. Sci. China 5, 751–757. doi: 10.1016/S1671-2927(06)60120-X
Lopes, M. H., Barros, A. S., Neto, C. P., Rutledge, D., Delgadillo, I., and Gil, A. M. (2001). Variability of cork from portuguese Quercus suber studied by solid-state (13)C-NMR and FTIR spectroscopies. Biopolymers 62, 268–277. doi: 10.1002/bip.1022
Lu, P.-L., Chen, N.-Z., An, R., Su, Z., Qi, B.-S., Ren, F., et al. (2007). A novel drought-inducible gene, ATAF1, encodes a NAC family protein that negatively regulates the expression of stress-responsive genes in Arabidopsis. Plant Mol. Biol. 63, 289–305. doi: 10.1007/s11103-006-9089-8
Lu, X.-Y., and Huang, X.-L. (2008). Plant miRNAs and abiotic stress responses. Biochem. Biophys. Res. Commun. 368, 458–462. doi: 10.3389/fpls.2015.00057
Lumaret, R., Tryphon-Dionnet, M., Michaud, H., Sanuy, A., Ipotesi, E., Born, C., et al. (2005). Phylogeographical variation of chloroplast DNA in cork oak (Quercus suber). Ann. Bot. 96, 853–861. doi: 10.1093/aob/mci237
Luo, M., Liu, X., Singh, P., Cui, Y., Zimmerli, L., and Wu, K. (2012). Chromatin modifications and remodeling in plant abiotic stress responses. Biochim. Biophy. Acta 1819, 129–136. doi: 10.1016/j.bbagrm.2011.06.008
Magri, D., Fineschi, S., Bellarosa, R., Buonamici, A., Sebastiani, F., Schirone, B., et al. (2007). The distribution of Quercus suber chloroplast haplotypes matches the palaeogeographical history of the western Mediterranean. Mol. Ecol. 16, 5259–5266. doi: 10.1111/j.1365-294X.2007.03587.x
Mahajan, S., and Tuteja, N. (2005). Cold, salinity and drought stresses: an overview. Arch. Biochem. Biophys. 444, 139–158. doi: 10.1016/j.abb.2005.10.018
Martin, L. B., Fei, Z., Giovannoni, J. J., and Rose, J. K. (2013). Catalyzing plant science research with RNA-seq. Front. Plant Sci. 4:66. doi: 10.3389/fpls.2013.00066
Marum, L., Miguel, A., Ricardo, C. P., and Miguel, C. (2012). Reference gene selection for quantitative real-time PCR normalization in Quercus suber. PLoS ONE 7:e35113. doi: 10.1371/journal.pone.0035113
Méthy, M., Damesin, C., and Rambal, S. (1996). Drought and photosystem II activity in two Mediterranean oaks. Annal. Sci. For. 53, 255–262. doi: 10.1051/forest:19960208
Milne, I., Stephen, G., Bayer, M., Cock, P. J., Pritchard, L., Cardle, L., et al. (2012). Using tablet for visual exploration of second-generation sequencing data. Brief. Bioinform. 14, 193–202. doi: 10.1093/bib/bbs012
Miyakawa, T., Fujita, Y., Yamaguchi-Shinozaki, K., and Tanokura, M. (2013). Structure and function of abscisic acid receptors. Trends Plant Sci. 18, 259–266. doi: 10.1016/j.tplants.2012.11.002
Mizoi, J., Shinozaki, K., and Yamaguchi-Shinozaki, K. (2012). AP2/ERF family transcription factors in plant abiotic stress responses. Biochim. Biophys. Acta 1819, 86–96. doi: 10.1016/j.bbagrm.2011.08.004
Nakashima, K., Fujita, Y., Katsura, K., Maruyama, K., Narusaka, Y., Seki, M., et al. (2006). Transcriptional regulation of ABI3- and ABA-responsive genes including RD29B and RD29A in seeds, germinating embryos, and seedlings of Arabidopsis. Plant Mol. Biol. 60, 51–68. doi: 10.1007/s11103-005-2418-5
Nakashima, K., Takasaki, H., Mizoi, J., Shinozaki, K., and Yamaguchi-Shinozaki, K. (2012). NAC transcription factors in plant abiotic stress responses. Biochim. Biophys. Acta 1819, 97–103. doi: 10.1016/j.bbagrm.2011.10.005
Nakashima, K., and Yamaguchi-Shinozaki, K. (2013). ABA signaling in stress-response and seed development. Plant Cell Rep. 32, 959–970. doi: 10.1007/s00299-013-1418-1
Nakashima, K., Yamaguchi-Shinozaki, K., and Shinozaki, K. (2014). The transcriptional regulatory network in the drought response and its crosstalk in abiotic stress responses including drought, cold, and heat. Front. Plant Sci. 5:170. doi: 10.3389/fpls.2014.00170
Nardini, A., Lo Gullo, M. A., Trifilò, P., and Salleo, S. (2014). The challenge of the Mediterranean climate to plant hydraulics: responses and adaptations. Environ. Exp. Bot. 103, 68–79. doi: 10.1016/j.envexpbot.2013.09.018
Nixon, K. (1993). Infrageneric classification of Quercus (Fagaceae) and typification of sectional names. Ann. For. Sci. 50, 25s–34s. doi: 10.1051/forest:19930701
Nuche, P., Komac, B., Camarero, J. J., and Alados, C. L. (2014). Developmental instability as an index of adaptation to drought stress in a Mediterranean oak. Ecol. Indic. 40, 68–75. doi: 10.1016/j.ecolind.2013.12.023
O’Connor, T. R., Dyreson, C., and Wyrick, J. J. (2005). Athena: a resource for rapid visualization and systematic analysis of Arabidopsis promoter sequences. Bioinformatics 21, 4411–4413. doi: 10.1093/bioinformatics/bti714
Osakabe, Y., Yamaguchi-Shinozaki, K., Shinozaki, K., and Tran, L. S. (2013). Sensing the environment: key roles of membrane-localized kinases in plant perception and response to abiotic stress. J. Exp. Bot. 64, 445–458. doi: 10.1093/jxb/ers354
Pandey, G. K., Grant, J. J., Cheong, Y. H., Kim, B. G., Li, L., and Luan, S. (2005). ABR1, an APETALA2-domain transcription factor that functions as a repressor of ABA response in Arabidopsis. Plant Physiol. 139, 1185–1193. doi: 10.1104/pp.105.066324
Papageorgiou, G. C. (2007). Chlorophyll A Fluorescence: A Signature of Photosynthesis. Norwell, MA: Kluwer Academic.
Pereira-Leal, J. B., Abreu, I. A., Alabaça, C. S., Almeida, M. H., Almeida, P., Almeida, T., et al. (2014). A comprehensive assessment of the transcriptome of cork oak (Quercus suber) through EST sequencing. BMC Genomics 15:371. doi: 10.1186/1471-2164-15-371
Persak, H., and Pitzschke, A. (2014). Dominant repression by Arabidopsis transcription factor MYB44 causes oxidative damage and hypersensitivity to abiotic stress. Int. J. Mol. Sci. 15, 2517–2537. doi: 10.3390/ijms15022517
Raghavendra, A. S., Gonugunta, V. K., Christmann, A., and Grill, E. (2010). ABA perception and signalling. Trends Plant Sci. 15, 395–401. doi: 10.1016/j.tplants.2010.04.006
Rocheta, M., Sobral, R., Magalhães, J., Amorim, M. I., Ribeiro, T., Pinheiro, M., et al. (2014). Comparative transcriptomic analysis of male and female flowers of monoecious Quercus suber. Front. Plant Sci. 5:599. doi: 10.3389/fpls.2014.00599
Saez, A., Apostolova, N., Gonzalez-Guzman, M., Gonzalez-Garcia, M. P., Nicolas, C., Lorenzo, O., et al. (2004). Gain-of-function and loss-of-function phenotypes of the protein phosphatase 2C HAB1 reveal its role as a negative regulator of abscisic acid signalling. Plant J. 37, 354–369. doi: 10.1046/j.1365-313X.2003.01966.x
Saito, R., Smoot, M. E., Ono, K., Ruscheinski, J., Wang, P.-L., Lotia, S., et al. (2012). A travel guide to Cytoscape plugins. Nat. Methods 9, 1069–1076. doi: 10.1038/nmeth.2212
Sánchez-González, M., Cañellas, I., and Montero, G. (2008). Base-age invariant cork growth model for Spanish cork oak (Quercus suber L.) forests. Eur. J. For. Res. 127, 173–182. doi: 10.1007/s10342-007-0192-4
Schweighofer, A., Hirt, H., and Meskiene, I. (2004). Plant PP2C phosphatases: emerging functions in stress signaling. Trends Plant Sci. 9, 236–243. doi: 10.1016/j.tplants.2004.03.007
Schweighofer, A., Kazanaviciute, V., Scheikl, E., Teige, M., Doczi, R., Hirt, H., et al. (2007). The PP2C-type phosphatase AP2C1, which negatively regulates MPK4 and MPK6, modulates innate immunity, jasmonic acid, and ethylene levels in Arabidopsis. Plant Cell 19, 2213–2224. doi: 10.1105/tpc.106.049585
Sebastiana, M., Vieira, B., Lino-Neto, T., Monteiro, F., Figueiredo, A., Sousa, L., et al. (2014). Oak root response to ectomycorrhizal symbiosis establishment: RNA-Seq derived transcript identification and expression profiling. PLoS ONE 9:e98376. doi: 10.1371/journal.pone.0098376
Shao, H.-B., Chu, L.-Y., Jaleel, C. A., and Zhao, C.-X. (2008). Water-deficit stress-induced anatomical changes in higher plants. C. R. Biol. 331, 215–225. doi: 10.1016/j.crvi.2008.01.002
Shinozaki, K., and Yamaguchi-Shinozaki, K. (2007). Gene networks involved in drought stress response and tolerance. J. Exp. Bot. 58, 221–227. doi: 10.1093/jxb/erl164
Teixeira, R. T., Fortes, A. M., Pinheiro, C., and Pereira, H. (2014). Comparison of good- and bad-quality cork: application of high-throughput sequencing of phellogenic tissue. J. Exp. Bot. 65, 4887–4905. doi: 10.1093/jxb/eru252
Tenhaken, R. (2014). Cell wall remodeling under abiotic stress. Front. Plant Sci. 5:771. doi: 10.3389/fpls.2014.00771
Thimm, O., Bläsing, O., Gibon, Y., Nagel, A., Meyer, S., Krüger, P., et al. (2004). MapMan: a user-driven tool to display genomics data sets onto diagrams of metabolic pathways and other biological processes. Plant J. 37, 914–939. doi: 10.1111/j.1365-313X.2004.02016.x
Toumi, L., and Lumaret, R. (1998). Allozyme variation in cork oak (Quercus suber L.): the role of phylogeography and introgression by other Mediterranean oak species and human activities. Theor. Appl. Genet. 97, 647–656. doi: 10.1007/s001220050941
Umezawa, T., Fujita, M., Fujita, Y., Yamaguchi-Shinozaki, K., and Shinozaki, K. (2006). Engineering drought tolerance in plants: discovering and tailoring genes to unlock the future. Curr. Opin. Biotechnol. 17, 113–122. doi: 10.1016/j.copbio.2006.02.002
Vandepoele, K., Quimbaya, M., Casneuf, T., De Veylder, L., and Van De Peer, Y. (2009). Unraveling transcriptional control in Arabidopsis using cis-regulatory elements and coexpression networks. Plant Physiol. 150, 535–546. doi: 10.1104/pp.109.136028
Wan, C.-Y., and Wilkins, T. A. (1994). A modified hot borate method significantly enhances the yield of high-quality RNA from cotton (Gossypium hirsutum L.). Anal. Biochem. 223, 7–12. doi: 10.1006/abio.1994.1538
Wang, W., Vinocur, B., and Altman, A. (2003). Plant responses to drought, salinity and extreme temperatures: towards genetic engineering for stress tolerance. Planta 218, 1–14. doi: 10.1007/s00425-003-1105-5
Wang, W., Vinocur, B., Shoseyov, O., and Altman, A. (2004). Role of plant heat-shock proteins and molecular chaperones in the abiotic stress response. Trends Plant Sci. 9, 244–252. doi: 10.1016/j.tplants.2004.03.006
Wang, X., Du, B., Liu, M., Sun, N., and Qi, X. (2013). Arabidopsis transcription factor WRKY33 is involved in drought by directly regulating the expression of CesA8. Am. J. Plant Sci. 4, 21–27. doi: 10.4236/ajps.2013.46A004
Warde-Farley, D., Donaldson, S. L., Comes, O., Zuberi, K., Badrawi, R., Chao, P., et al. (2010). The GeneMANIA prediction server: biological network integration for gene prioritization and predicting gene function. Nucleic Acids Res. 38, W214–W220. doi: 10.1093/nar/gkq537
Yoshida, R., Hobo, T., Ichimura, K., Mizoguchi, T., Takahashi, F., Aronso, J., et al. (2002). ABA-activated SnRK2 protein kinase is required for dehydration stress signaling in Arabidopsis. Plant Cell Physiol. 43, 1473–1483. doi: 10.1093/pcp/pcf188
Yoshida, T., Fujita, Y., Sayama, H., Kidokoro, S., Maruyama, K., Mizoi, J., et al. (2010). AREB1, AREB2, and ABF3 are master transcription factors that cooperatively regulate ABRE-dependent ABA signaling involved in drought stress tolerance and require ABA for full activation. Plant J. 61, 672–685. doi: 10.1111/j.1365-313X.2009.04092.x
Keywords: ABA, ABF, drought, Quercus suber, RNA-Seq, root transcriptomics
Citation: Magalhães AP, Verde N, Reis F, Martins I, Costa D, Lino-Neto T, Castro PH, Tavares RM and Azevedo H (2016) RNA-Seq and Gene Network Analysis Uncover Activation of an ABA-Dependent Signalosome During the Cork Oak Root Response to Drought. Front. Plant Sci. 6:1195. doi: 10.3389/fpls.2015.01195
Received: 09 August 2015; Accepted: 14 December 2015;
Published: 11 January 2016.
Edited by:
Zhulong Chan, Chinese Academy of Sciences, ChinaReviewed by:
Chuan Jiang, Shanghai Center for Plant Stress Biology, ChinaIsabelle Lesur, Institut National de la Recherche Agronomique, France
Copyright © 2016 Magalhães, Verde, Reis, Martins, Costa, Lino-Neto, Castro, Tavares and Azevedo. This is an open-access article distributed under the terms of the Creative Commons Attribution License (CC BY). The use, distribution or reproduction in other forums is permitted, provided the original author(s) or licensor are credited and that the original publication in this journal is cited, in accordance with accepted academic practice. No use, distribution or reproduction is permitted which does not comply with these terms.
*Correspondence: Herlânder Azevedo, aGF6ZXZlZG9AY2liaW8udXAucHQ=; Rui M. Tavares, dGF2YXJlc0BiaW8udW1pbmhvLnB0