 Tiantian Ye
 Haitao Shi
 Yanping Wang
 Fan Yang
 Zhulong Chan
- 1Key Laboratory of Plant Germplasm Enhancement and Specialty Agriculture, Sino-Africa Joint Research Center, Wuhan Botanical Garden, Chinese Academy of Sciences, Wuhan, China
- 2University of Chinese Academy of Sciences, Beijing, China
Bermudagrass (Cynodon dactylon) is one of tolerant grass species to drought and salt. The comparative analyses of bermudagrass in response to drought and salt stresses at the physiological, proteomic, and metabolomic levels were performed in this study. The physiological results indicated that osmolytes accumulation, ROS level and antioxidant enzyme activities were extensively changed by drought and salt stresses. Through comparative proteomic analyses, we successfully identified a total of 77 proteins involved in photosynthesis, oxidative pentose phosphate, glycolysis, and redox metabolic pathways when exposed to drought and salt stresses. Among them, 36 proteins were commonly regulated by both treatments, while other 40 and 13 proteins were specifically regulated by drought and salt, respectively. Totally 15 proteins were involved in carbon metabolic pathway. Moreover, contents of 37 metabolites including amino acids, organic acids, sugars, and sugar alcohols were regulated by drought and salt treatments. Among them, 18 commonly modulated metabolites were involved in carbon and amino acid metabolic pathways. Drought treatment for 21 days caused less accumulation of sugars and sugar alcohols and increased ROS level in bermudagrass which led to relatively more severe cell membrane reflected by high EL-value and lower survival rate when compared to 400 mM salt treatment for 21 days. These results suggested that drought and 400 mM NaCl stresses for 21 days treatment affected common and specific changes in bermudagrass, which would provide new insights to understand the underlying molecular mechanisms and metabolic homeostasis of bermudagrass in responses to abiotic stresses.
Introduction
Drought and salt are two major abiotic factors limiting plant growth and development, which induce various changes at different levels, such as morphological, physiological, proteomic, and metabolic levels (Zhu, 2002; Gibbs and Greenway, 2003). As one of the most important warm-season turfgrasses, bermudagrass (Cynodon dactylon) is widely used in the construction of golf courses, sport fields, and lawns, and wetland vegetation restoration (Shi et al., 2012, 2013a,b). Previous studies indicated that the bermudagrass exhibited tolerance to several abiotic stresses including drought and salt (Shi et al., 2012, 2013a,b, 2014b), and developed complex strategies such as physiological, proteomic, metabolic changes to cope with stress conditions. Shi et al. (2012) suggested that changes of water status, osmolyte accumulation and antioxidant defense system partly reflected the drought stress tolerance of bermudagrass varieties. Exogenous application of NO, H2S and polyamines enhanced the tolerances of bermudagrass to abiotic stresses such as drought, salt, osmotic and cold (Shi et al., 2013a,b, 2014b). In addition, salt, chilling, and submergence tolerances of some bermudagrass varieties might be correlated with variations of root and shoot responses (Qian et al., 1997), relative leaf water content (RWC) (Tan et al., 2010), dehydrin abundance (Hu et al., 2010), chlorophyll content, proline content, soluble sugars content, ethylene accumulation, reactive oxygen species (ROS) level and antioxidant enzyme activities (Lu et al., 2007; Bailey-Serres and Voesenek, 2010).
Recently, proteins changed by stress treatments were identified through proteomics approach in turfgrass. Zhao et al. (2011) identified 54 proteins associated with water-deficit tolerance in bermudagrass leaves. A total of 39 proteins showing different abundance in leaves and stems of two drought contrasting bermudagrass varieties (Yukon and Tifgreen) were found to be responded to drought stress, and these proteins were mainly involved in photosynthesis (PS), glycolysis, N-metabolism, tricarboxylicacid (TCA), and redox pathways (Shi et al., 2014a). In addition, 51 proteins enriched in redox, tricarboxylicacid cycle, glycolysis, photosynthesis, oxidative pentose phosphate pathway, and amino acid metabolisms were regulated by CaCl2 treatment in cold stressed bermudagrass leaves (Shi et al., 2014c). Metabolites including amino acids, organic acids, sugars, and sugar alcohols in bermudagrass leaves were commonly modulated by CaCl2 and cold treatments (Shi et al., 2014c).
Drought condition causes water deficit and osmotic stress in plants, while high salinity causes both an ionic and an osmotic stress (Zhu, 2002). Therefore, plants not only develop common signaling transduction pathways in response to drought and salt stress conditions, but possess some unique pathways to cope with drought and salt signaling. Several bermudagrass varieties showed relatively high tolerance to both drought and salt stress when compared to crop plants (Shi et al., 2013a,b). We hypothesized that the bermudagrass developed common and contrasting mechanisms to cope with drought and salt stresses. Although specific mechanisms of drought and salt tolerances have been investigated extensively in bermudagrass, limited information is available on the simultaneously comparative analyses of drought and salt stress responses at the proteomic and metabolomic levels. Therefore, investigation of the proteomic and metabolomic changes in responses to abiotic stresses in bermudagrass will be important to reveal different mechanisms involved in drought and salt stress responses and to improve plant stress tolerance.
In the present study, comparative analyses on proteomic and metabolomic responses of bermudagrass to different abiotic stresses were performed. The results showed that drought and salt stress treatments resulted in similar and contrasting changes in bermudagrass. These data would provide some novel insights to understand the molecular mechanisms and metabolic homeostasis of bermudagrass in response to drought and salt stresses. Identification of stress regulated proteins in bermudagrass would provide gene candidates to improve tolerance of bermudagrass and crop plants to abiotic stresses.
Materials and Methods
Plant Materials and Experimental Design
The bermudagrass Yukon seeds were kindly provided by American Seed Research of Oregon Company. After 3 days of stratification at 4°C in the dark, the seeds were sown in the flowerpot filled with soil in the greenhouse in Wuhan Botanical Garden, Chinese Academy of Sciences. The growth condition were maintained at 25 ± 2°C average temperature, 65–75% relative humidity, and 16 h light irradiance of about 150 μmol quanta m−2s−1 per day. The plants were irrigated with nutrient solution (18–18–18 of nitrogen–phosphorus–potassium per 100 g fertilizer, plus 3% magnesium and microelement) twice every week. Three-week-old bermudagrass healthy seedlings with nearly same crown size were used for the next drought and salt treatments.
A completely randomized design with two factors (drought and salt) was employed. For drought treatment, two different watering regimes were performed as follows: a well-watered treatment and a water deficit treatment (watering for 21 days and then drought for 21 days). For salt stress treatment, the concentration of NaCl was gradually increased to the final concentration 400 mM (adding 100 mM each day). The survival rate of stressed bermudagrass was recorded at 7 days re-watering after 21 days stress treatment. The leaf samples were collected at 0, 7, 14, 21 days after treatments for physiological indexes analyses. The leaf samples at 14 day subjected to control and stress conditions were harvested for proteomic and metabolomic assays based on measured electrolyte leakage data. The whole experimental design was displayed as Figure S1. For each independent experiment, every plant sample was extracted from at least 35 bermudagrass plants. All the experiments in this study were carried out three times at different time interval with three technical replications for each treatment.
Determination of Electrolyte Leakage (EL) and Relative Leaf Water Content (RWC)
EL was determined according to the methods of Shi et al. (2012). In brief, the initial conductivity was determined after gently shaking at room temperature for 6 h at 150 rpm using a conductivity meter (Leici-DDS-307A, Shanghai, China). The fully releasing conductivity was measured after boiling at 121°C for 20 min using previous samples. The percentage of electrolyte leakage was determined as the ratio of the initial conductivity to fully releasing conductivity.
The RWC were determined according to the methods of Shi et al. (2012). The fresh weight (FW) was weighed immediately after collection, and the dry weight (DW) was quantified after incubation for 16 h at 80°C, and the RWC (%) was measured as (FW − DW)/FW × 100%.
Measurement of Proline Content
Briefly, 0.25 g leaf samples were grinded to power and then extracted in 3% (w/v) sulfosalicylic acid for 10 min at 100°C. After that, 2 ml ninhydrin reagent and 2 ml glacial acetic acid were added to the 2 ml extraction solution. The mixed solution was boiled at 100°C for 40 min. After cooling to room temperature, the proline level of sample was determined by measurement of absorbance at 520 nm as described previously (Shi et al., 2012).
Determination of Malondialdehyde (MDA) Content
The MDA content was extracted using thiobarbituric acid (TBA) reagent and boiled at 100°C for 20 min as previously described by Yang et al. (2010). After cooling to room temperature and centrifugation at 15000 g for 10 min, the MDA concentrations were determined at 450, 532, and 600 nm of absorbance with a spectrometer. The MDA concentration can be estimated through the following formula (μmol l−1) = 6.45 (A532 − A600) − 0.56A450 (Yang et al., 2010; Shi et al., 2012).
Quantification of Sucrose and Soluble Total Sugars
The sucrose and soluble total sugars were determined according to the methods of Shi et al. (2012). The sucrose content and soluble total sugar content of samples were measured at 480 nm of absorbance and calculated by using the standard curve with known concentration of sucrose and glucose.
Determination of ROS Accumulation and Antioxidant Enzyme Activities
The protein concentration was quantified according to the method of Bradford with bovine serum albumin (BSA) as the standard (Bradford, 1976). The concentration of H2O2 was determined as described by Shi et al. (2012). The H2O2 level was calculated according to a standard curve of H2O2. The content was assayed by the plant ELISA Kit based on antibody-antigen-enzyme-antibody complex following the manufacturer's instruction (Dingguo, Beijing, China). The absorbance was quantified at 405 nm.
The antioxidant enzyme activities of catalase (CAT), glutathione reductase (GR), and peroxidase (POD) were determined using CAT Assay Kit (S0051, Beyotime, China), GR Assay Kit (Beyotime, Shanghai, China), and plant POD Assay Kit (Nanjing Jiancheng Bioengineering Institute, Nanjing, China), respectively, according to the manufacturer's instructions.
Protein Extraction and 2-DE
Total protein was extracted according to the previously described method with slight modifications (Chan et al., 2007). Briefly, 1 g frozen powder from plant leave were homogenized extensively with 5 ml of pre-cooled homogenization buffer [20 mM Tris-HCl (pH 7.5), 1.05 M sucrose, 10 mM EGTA, 1 mM DTT, 1 mM PMSF and 1% (v/v) Triton X-100] on ice, and centrifuged at 10,000 g for 30 min at 4°C. The supernatant was then mixed with equal volume of Tris-HCl (pH 7.8) buffered phenol. After centrifugation at 10,000 g for 30 min at 4°C, the above phenol phase was mixed with five volumes of ice-cold saturated ammonium acetate in methanol overnight at −20°C. The total proteins were collected through centrifugation was stored at −80°C or dissolved in the lysis buffer [7 M urea, 2 M mithiourea, 4% (w/v) of 3-[(3-cholamidopropyl)-dimethylammo-nio]-1-propane sulfonate (CHAPS), 65 mM DTT and 0.2% (w/v) of carrier ampholyte (pH3.5–10)]. After dissolving extensively and centrifugation, the protein supernatant was quantified through the Bradford's method (Bradford, 1976).
The 2-DE was performed as described by Shi et al. (2013a) with minor modification. Briefly, 1 mg of total proteins was applied onto an immobilized pH gradient (IPG) strip (17 cm, pH 4–7, Bio-Rad, USA) and rehydrated extensively at room temperature overnight. The next day, the rehydrated strips were transferred to isoelectric focus (IEF) in the Protein IEF system (Bio-Rad, USA). The conditions of IEF and SDS-PAGE were the same as described by Shi et al. (2012).
Gel Image Analysis and Protein Spot Identification by MALDI-TOF-MS
The 2-D gels stained by Coomassie brilliant blue (CBB) R250 [containing 50% (v/v) of methanol, 15% (v/v) of acetic acid and 0.1% (w/v) of CBB-R250] were scanned using an EPSON PERFECTION V700 PHOTO scanner (Epson), and protein spots of 2-D gel with different abundance changes were analyzed using PDQuest 2-DE Analysis Software (BIO-RAD, USA). The protein spots (fold change ≥2) were used for trypsin digestion and MALDI-TOF-MS analysis with AXIMA-CFR plus (Shimadzu Biotech, Kyoto, Japan) as reported by Li et al. (2012) and Shi et al. (2013a). MASCOT software (Mascot Wizard 1.2.0, Matrix Science Ltd., http://www.matrixscience.com) was used to analyze the MS data. Since bermudagrass is an un-sequenced species, the homologous proteins were blasted against sequenced plant species. In the searching process against NCBInr and Swiss-Port protein sequence databases, peptide masses were assumed to be monoisotopic, and 100 ppm was used as mass accuracy, and one missing cleavage site was the maximum, and modifications were also considered. The minimum score of 43 and the minimum sequence coverage of 6% in MOWSE analysis were used to keep the confidence of the identification results.
Quantification of Metabolites
The metabolites extraction and derivatization were performed as described by Lisec et al. (2006) and Sanchez-Villarreal et al. (2013). Briefly, 100 mg of plant leaves was ground in liquid nitrogen, and 1.4 mL of 100% methanol (pre-cooled at −20°C) was then added and vortexed for 10 s. After that, 60 μL of 0.2 mg /mL Ribitol was added as an internal quantitative standard and vortexed for 10 s. After shaking for 10 min at 70°C in a thermomixer, the mixed solution was centrifuged at 11,000 g for 10 min. The supernatant was transferred to a new tube, and 750 μL chloroform and 1.4 mL ddH2O were added to the sample. After vortex, the sample was centrifuged at 2200 g for 15 min. Then 150 μL supernatant was transferred into a 1.5 mL tube, and 40 mL methoxyamination reagent was added. The sample was mixed well and shaken at 37°C for 2 h before 70 μL MSTFA reagent and time standards (alkane mixtures) were added. The sample was shaken at 37°C for another 30 min. Derivatization reaction of an empty reaction tube was also prepared as a control. Then the metabolites were analyzed using GC-TOF-MS (Agilent 7890A/5975C, CA, USA) according to the procedure of Lisec et al. (2006) and Shi et al. (2014c).
For GC-TOF-MS, 1 μL of derivatizated sample was injected into a DB-5MS capillary (30 m × 0.25 mm × 0.25 mm, Agilent J&W GC Column, USA), and was analyzed by an Agilent 7890 gas chromatograph with a model 5975 mass spectrometer (Agilent Technologies, Palo Alto, CA, USA) according to the procedure of Lisec et al. (2006) and Shi et al. (2014c). The inlet temperature was set at 260°C. After a solvent delay for 6 min, initial GC oven temperature was set at 60°C; after injection for 1 min, the GC oven temperature was raised to 280°C with 15°C/min, and held at 280°C for 15 min finally. The injection temperature was set to 280°C and ion source temperature was adjusted to 230°C. Helium was used as the carrier gas with a constant flow rate set at 1 mL/min. The measurement was performed with electron impact ionization (70 eV) in the full scan mode (m/z from 30 to 600). Metabolite Data Processing and Analysis Peak finding, peak integration, and retention time correction were performed with the Agilent MSD Productivity Chemstation software. The metabolites were identified based on retention time index specific masses, via comparing with reference spectra in mass spectral libraries (NIST 2005, Wiley 7.0). After metabolite identification, quantification of metabolites was performed based on the pre-added Ribitol in the process of metabolite extraction that was used as an internal standard. For the derivatization, an empty reaction tube was prepared as a blank control, and also a C10, C12, C15, C19, C22, C28, C32, and C36 n-alkane mixtures were used for the determination of RIs to improve the accuracy of qualitation. The data acquisition was done in multiple batches with one batch including one replicate for all treatments that was to minimize run order effects. Three biological replicates and two technical replicates, totally six replicates were used for the metabolomics analysis.
Cluster and Metabolic Pathway Analyses
Hierarchical cluster analysis was performed using CLUSTER program (http://bonsai.hgc.jp/~mdehoon/software/cluster/) (de Hoon et al., 2004), and resulting tree figures were displayed using the software package and Java Treeview (http://jtreeview.sourceforge.net/) as Shi et al. (2013a) described. The proteins showing significant abundance changes were classified using the Classification SuperViewer Tool (http://bar.utoronto.ca/ntools/cgi-bin/ntools_classification_superviewer.cgi) (Provart and Zhu, 2003), and functional categories of every protein were assigned using MapMan (http://mapman.mpimp-golm.mpg.de/general/ora/ora.html) (Thimm et al., 2004). The pathway graph of carbon metabolism was obtained from KEGG (http://www.genome.jp/kegg/pathway.html). Normalized frequency (NF) of each functional category was assayed as sample frequency of each category in this experiment/background frequency of each category in genome.
Statistical Analysis
All the experiments in this study were repeated three times, and the data shown are the means ± SEs. For each independent experiment, plant sample was extracted from at least 35 bermudagrass plants. SPSS 13.0 software was used for statistical analysis. Analyses of variance (ANOVA) for variables from measurements were used for testing the species and treatment differences according to Duncan's method. Different letters above the columns in each figure indicate significant differences at P < 0.05.
Results
Comparison of Morphological and Physiological Responses to Drought and Salt
Drought and salt stresses had imposed significant effects on the growth and development of bermudagrass. When exposed to 21-days drought and salt treatments, significant differences in the growth of bermudagrass were observed. Drought stress caused serious damages (growth inhibition, drooped leaves) on bermudagrass with short shoot, whereas salt stress had little effect on plant growth (green leaves) (Figures 1A–C). Drought and salt stresses progressively decreased the RWC with the duration of the treatment (Figure 1D). However, drought and salt stresses progressively increased the EL with the duration of the treatment. Additionally, drought treatment imposed more serious damage to leaves in terms of EL during the 14–21 days in comparison to salt stress (Figure 1E). Accordingly, drought stress had serious effects on the survival rates of bermudagrass, while the salt stress had less effect on plant survival (Figure 1F).
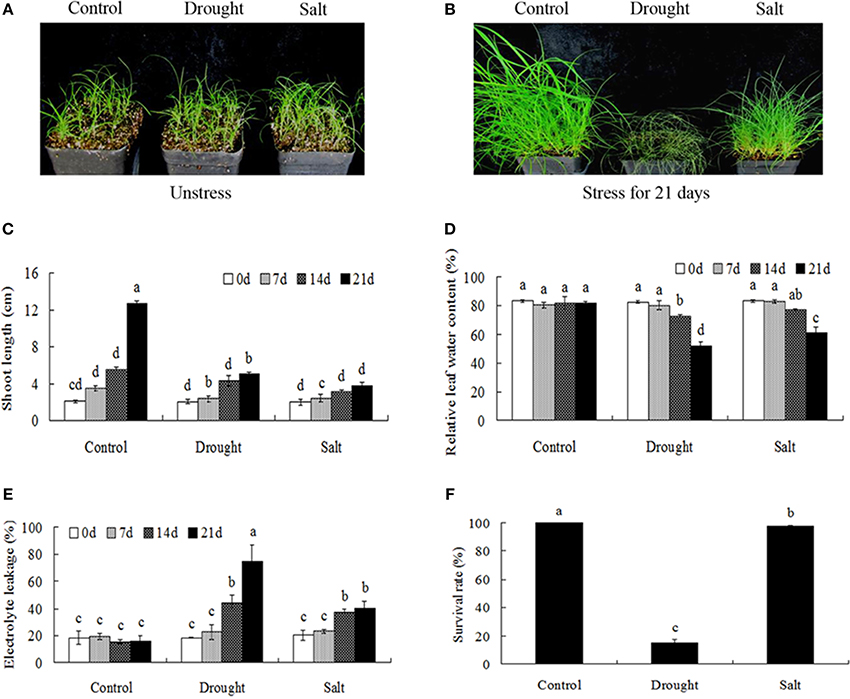
Figure 1. Comparison of physiological responses to drought and salt in bermudagrass. (A) The photograph showing 3-week-old Bermudagrass that subjected to control condition and stress conditions for 21 days. Shoot length (B), RWC (C), chlorophyll content (D), EL (E) of Bermudagrass under unstress and stress condition at designated time intervals. (F) Survival rate of Bermudagrass after 21 days of control and stress treatments. The data represent the means of three independent experiment ± SE, and data followed by different letters are significantly different from each other at P < 0.05 according to Duncan's method.
Regulation of Osmolytes in Bermudagrass under Drought and Salt Conditions
Drought and salt stress treatments largely induced proline accumulation with the duration of the treatments (Figure 2A). In addition, the contents of soluble sugars and sucrose were largely increased after drought and salt treatments (Figures 2B–C).
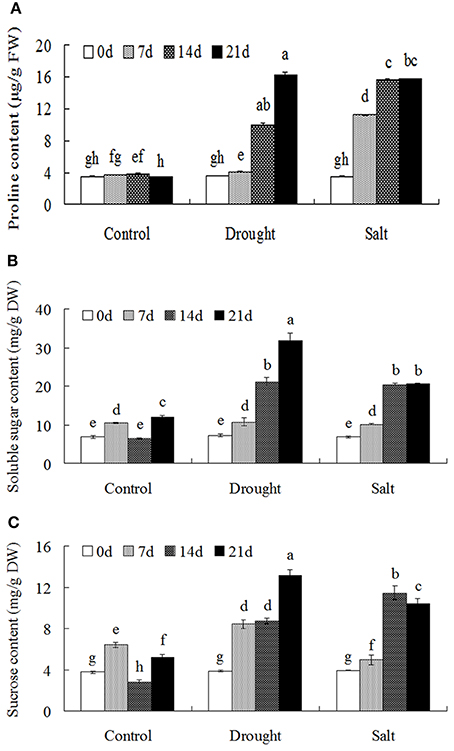
Figure 2. Osmolytes accumulation of bermudagrass that subjected to unstress and stress conditions at designated time intervals. Changes of proline content (A), soluble sugars (B) and sucrose content (C) of bermudagrass during under control and stress conditions at indicated days. The results shown are means ± SE (n = 4), and the results followed by different letters are significantly different from each other at P < 0.05 according to Duncan's method.
Comparative Proteomic Analyses of Bermudagrass in Response to Drought and Salt Stresses
To identify proteins of bermudagrass simultaneously affected by drought and salt treatments, proteomic analyses based on 2-DE were performed using 14 days stressed samples which showed about 50% EL (Figure 1D). Generally, more than 300 spots were reproducibly detected on all gels. Compared to controls, in total 105 proteins were significantly (2-fold change) affected by at least two types of stress treatment (Figure 3A), and 77 of 105 proteins were successfully identified via MALDI-TOF-MS (Table 1). Among 77 proteins, abundances of 76 and 49 proteins were changed by drought and salt treatments, respectively. The MS results were matched against NCBInr and Swiss-Port protein sequence databases using MASCOT software, and the best matched protein with high confidence score was selected as the final result of each protein spot (Table 1 and Table S1). Although Viridiplantae (Green Plants) was chosen as taxonomy during Mascot database search, most putatively identified proteins were matched to those in Poaceae like Oryza sativa, Triticum urartu, Zea mays, and Setaria italic, which are very close to bermudagrass based on gene sequence alignment like dehydration responsive element binding protein (DREB) and heat shock protein (HSP) (data not shown). The hierarchical cluster (Figure 3D) and venn diagram analyses (Figure 3C) of the significantly changed proteins were performed. The results of hierarchical cluster and venn diagram analysis showed that 33 up-regulated proteins (spots 1, 2, 3, 4, 5, 9, 11, 15, 19, 20, 21, 22, 23, 26, 28, 29, 30, 32, 33, 35, 36, 37, 38, 48, 49, 51, 52, 56, 58, 61, 64, 65, and 72) and 3 down-regulated protein (spots 32, 67, and 71) of 77 identified proteins were simultaneously affected by drought and salt stresses (Figures 3B–D). Among 53 up-regulated proteins, 13 and 7 proteins were specifically induced by drought and salt stresses, respectively. Accordingly, among 36 down-regulated proteins, 27 and 6 proteins were specifically induced by drought and salt stresses, respectively (Figure 3).
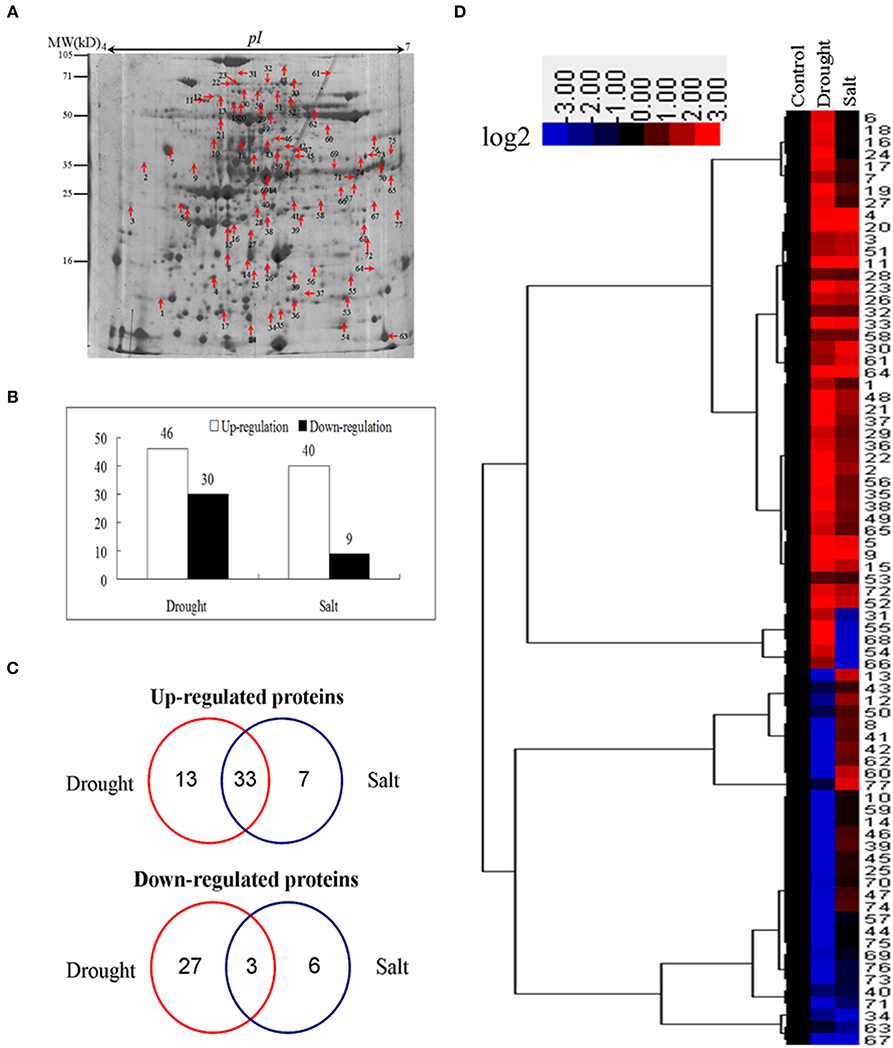
Figure 3. Cluster analysis and comparative distribution of co-regulated proteins by drought and salt treatments. (A) A sketch map to show proteome patterns of bermudagrass in responses to drought and salt. The protein spots induced at least two folds by drought and salt were marked with arrows as shown. Proteins were separated in the first dimension on the IPG strip (pH 4−7), and in the second dimension on 12.5% SDS-PAGE. (B) The number of proteins up and down regulated by drought and salt treatments. (C) Hierarchical cluster analysis of fold change of coregulated proteins by drought and salt treatments. Resulting tree figure was displayed using the software package and Java Treeview. (D) Venn diagram showing the number and of proteins that overlapped among three types of drought and salt.
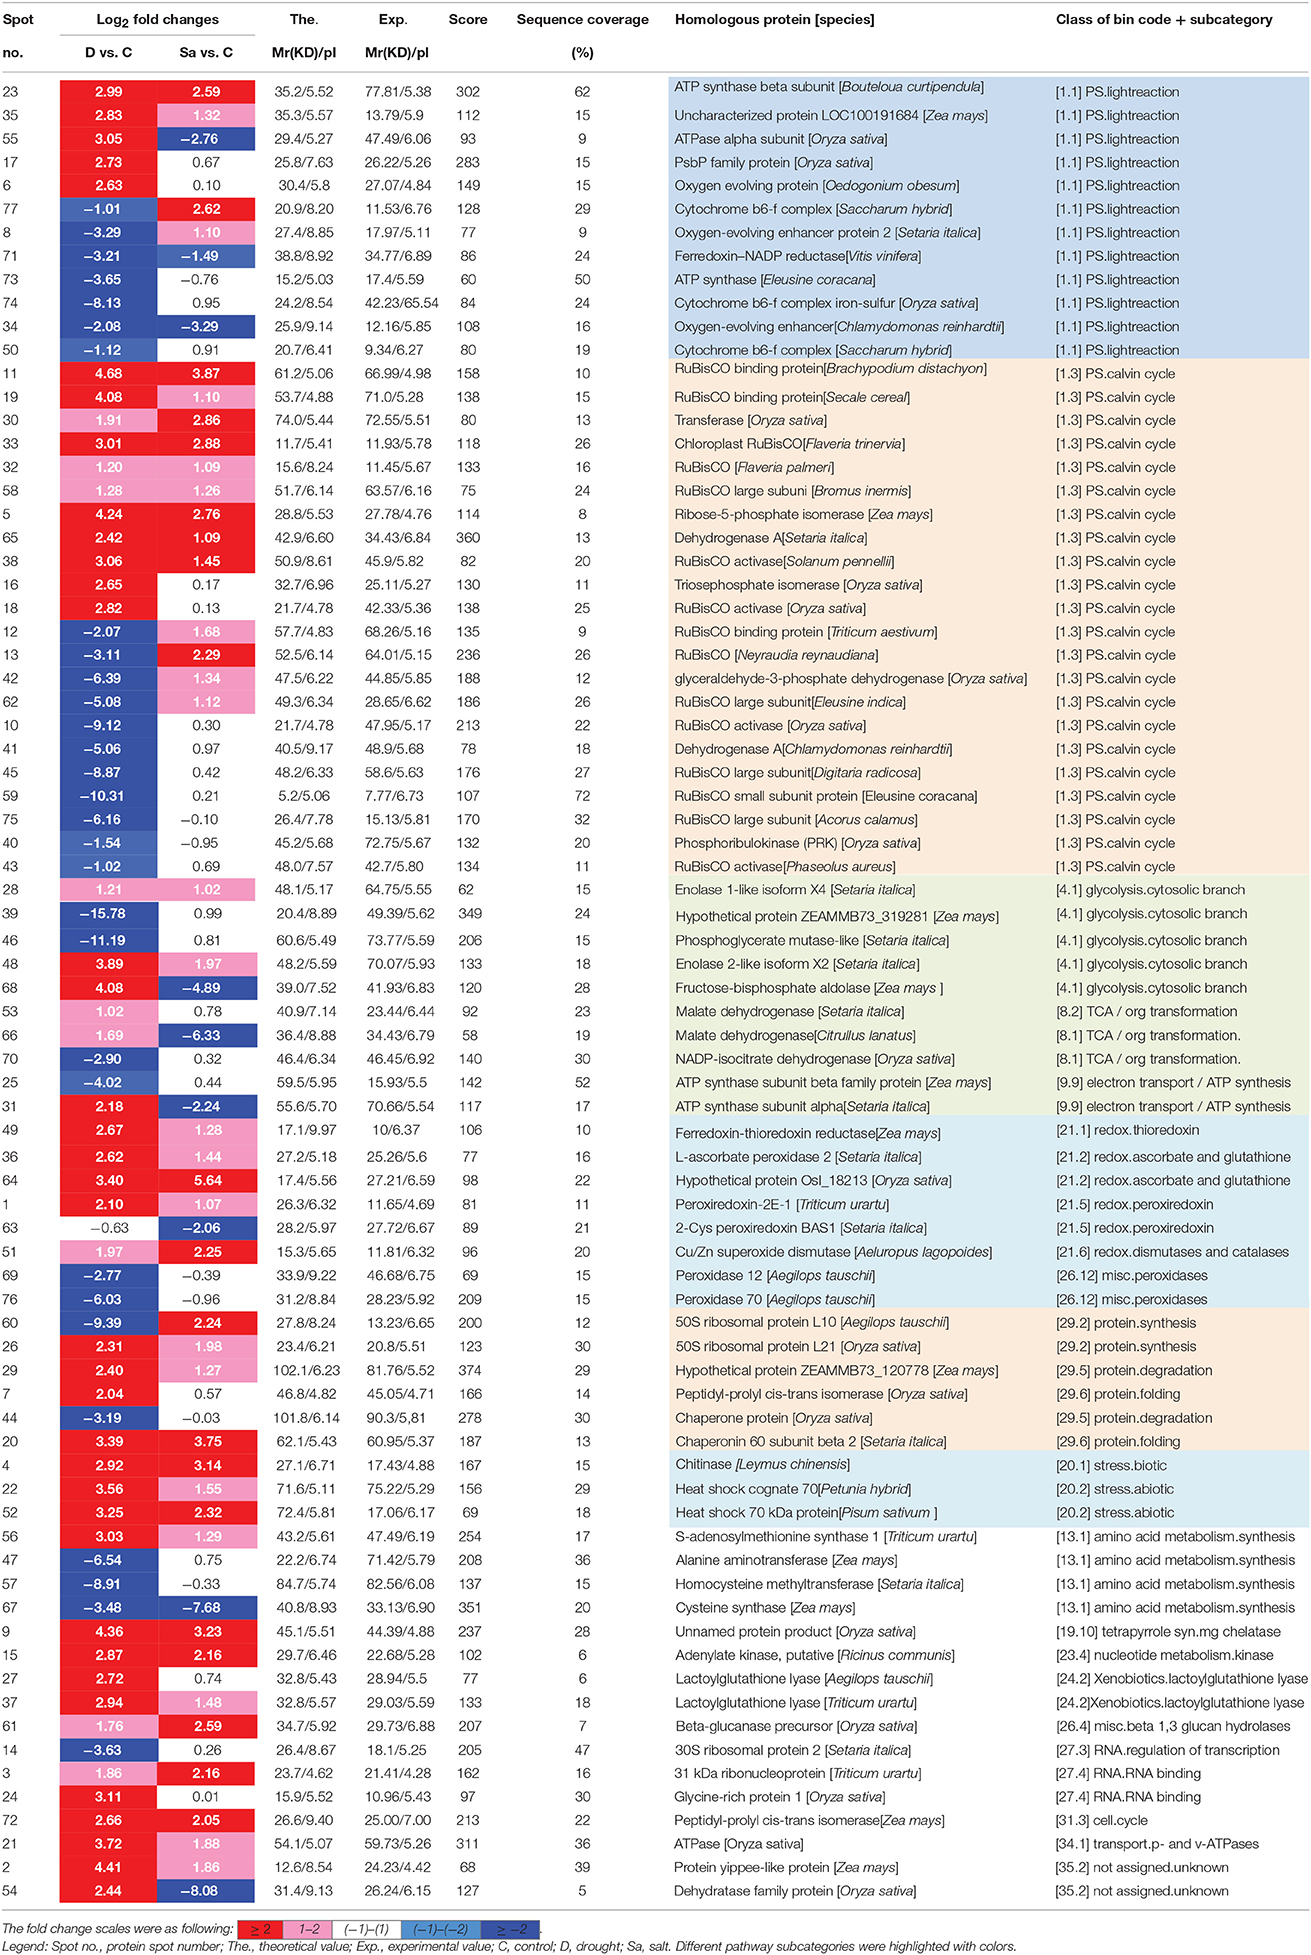
Table 1. List of proteins changed under drought (D) and salt (Sa) stress conditions in bermudagrass.
Pathway Enrichment Analysis of Proteins Induced by Drought and Salt Stresses
Because of limited reference genome information for bermudagrass, the homologous proteins were blasted against sequenced plant species and functional categories were also assigned using MapMan. The information of homologous protein and functional category of each protein was shown in Table 1 and Table S1. The MapMan pathway enrichment analysis revealed that functions of commonly regulated proteins by drought and salt stresses were involved in metabolism pathways including photosynthesis (PS), biodegradation of xenobiotics, oxidative pentose phosphate pathway (OPP), glycolysis and redox (Table 2, Group I). Other pathways including N-metabolism, TCA/org transformation, amino acid metabolism, and mitochondrial electron transport/ATP synthesis were specifically affected by drought or salt stress (Table 2, Group II). Additionally, 15 proteins were involved in carbon metabolic pathway (Figure 4A). Abundances of these proteins were increased or decreased in response to drought and salt stresses. For example, the abundance of protein spot 5 was significantly induced by drought and salt stresses, while that of protein spot 57 was significantly decreased after drought treatment (Figure 4B).
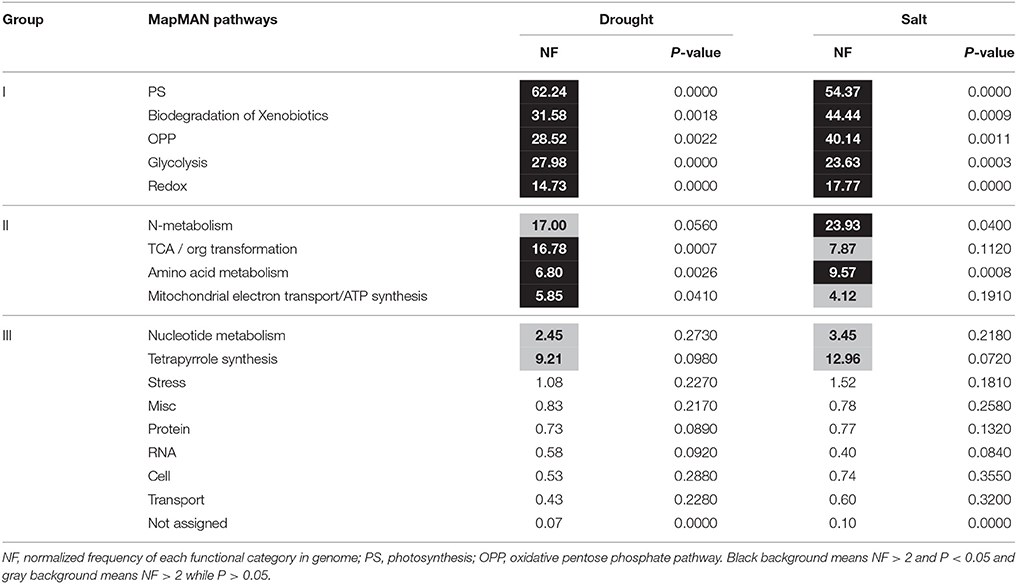
Table 2. Pathway enrichment analysis of proteins changed by drought and salt treatments in bermudagrass.
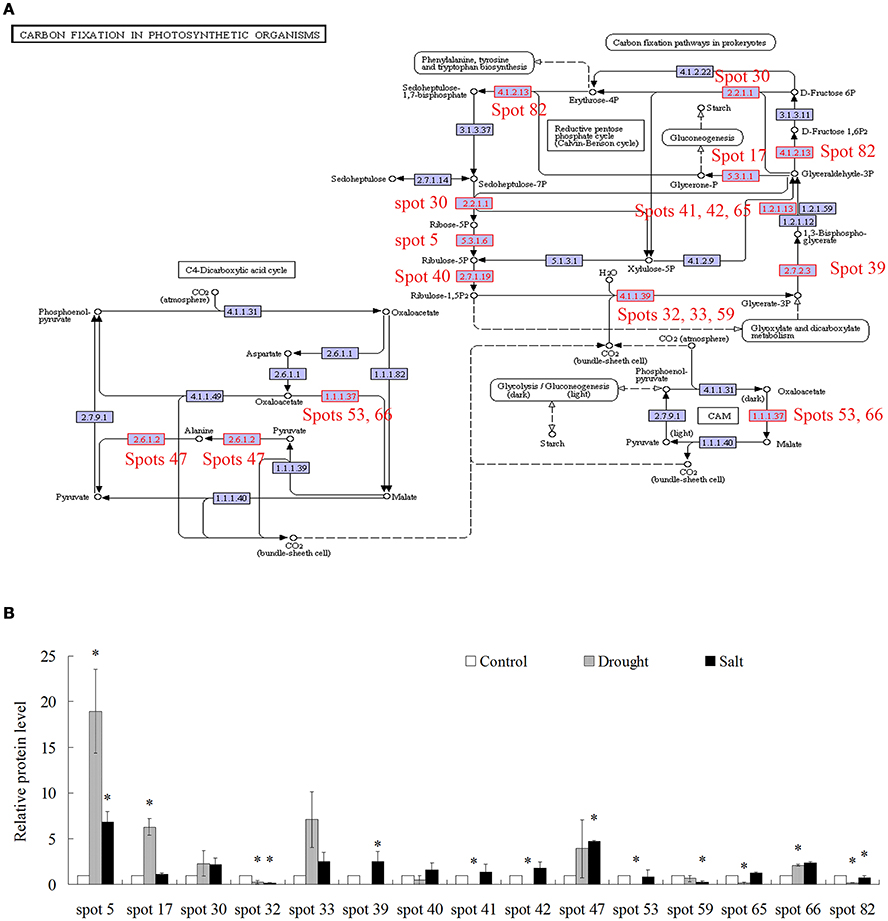
Figure 4. Proteins whose abundance was changed by treatments of drought and salt were involved in carbon fixation in photosynthetic organisms. (A) Proteins changed by drought and salt treatments were involved in carbon fixation in photosynthetic organisms. (B) The relative protein levels of 15 proteins changed by drought and salt treatments. The results shown are the means ± SE, and the means are the average of three gels from three independent experiments. Asterisk symbols (*) indicate P < 0.05 (t-test).
Modulation of ROS Metabolism in Bermudagrass after Drought and Salt Treatments
Through proteomics approach we identified several ROS metabolism related proteins in bermudagrass after drought and salt treatments, including POD (protein spot 36, 69, and 76), SOD (protein spot 51) and peroxiredoxin (protein spot 1 and 63). To further investigate ROS homeostasis caused by drought and salt stresses, H2O2, and MDA contents were analyzed (Figures 5A–C). In terms of H2O2, , and MDA, drought stress caused significantly higher levels at the end of experiment in comparison to salt treatment (Figures 5A–C). In addition, the levels of H2O2, , and MDA were progressively induced by salt stress, especially at 21 days after treatment (Figures 5A–C).
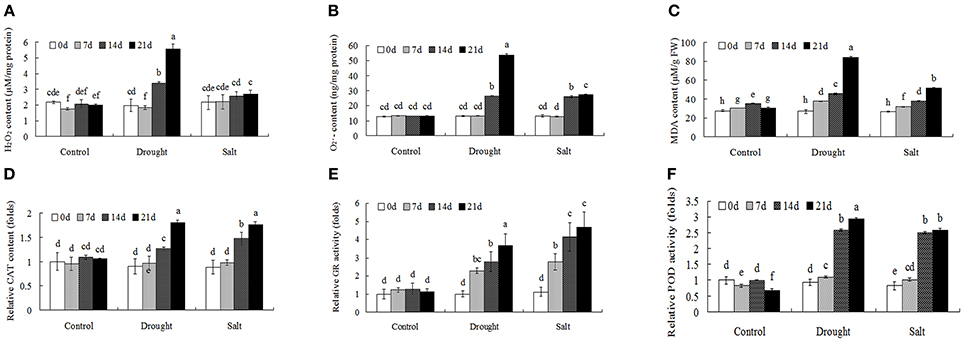
Figure 5. ROS level and antioxidant enzyme activities of bermudagrass under control and stress conditions at designated time intervals. Changes of H2O2 content (A), content (B), and MDA level (C) of bermudagrass under control and stress conditions at indicated days. (D–F) Comparisons of CAT (D), GR (E), and POD (F) activities of bermudagrass under control and stress conditions at designated time intervals. The relative activities were quantified as fold change in comparison with bermudagrass under unstress condition. The data represent the means of three independent experiment ± SE, and data followed by different letters are significantly different from each other at P < 0.05 according to Duncan's method.
Antioxidant enzymes activities, including CAT, GR, and POD, were then analyzed to reveal changes of enzymatic defense systems (Figures 5D–F). When exposed to drought and salt conditions, the activities of CAT, GR, and POD had similar changes, which were largely induced with the duration of the treatments. (Figures 5D–F).
Modulation of Metabolic Homeostasis in Response to Drought and Salt Stresses
Proteomic analysis indicated that functions of several proteins were involved in carbon fixation pathway (Figure 4A). To further reveal the modulation of metabolic homeostasis in bermudagrass regulated by drought and salt stresses, metabolomic analyses based on chromatography time-of-flight mass spectrometry (GC-TOF-MS) were performed using 14 days stressed samples. The results showed that totally 37 metabolites, including 12 amino acids, 14 sugars, 5 organic acids, 2 sugar alcohols, and 2 fatty acid were successfully detected (Figure 6A, Table S2). Generally, 30 of 37 metabolites were reproductively detected after drought and salt treatments (Figure 6A and Table S2). Interestingly, contents of most metabolites increased after drought and salt stress treatments. Several metabolites including threonine, serine, propanoic acid, and ethanedioic acid simultaneously showed higher level by drought and salt, whereas lactose concentration simultaneously decreased by two kinds of stress (Figure 6A). Among 37 metabolites, 18 metabolites involved in carbon and amino acid metabolic pathways (Figure 6B) were commonly modulated by drought and salt stresses, further confirming the carbon and amino acid metabolisms were extensively changed in response to abiotic stresses.
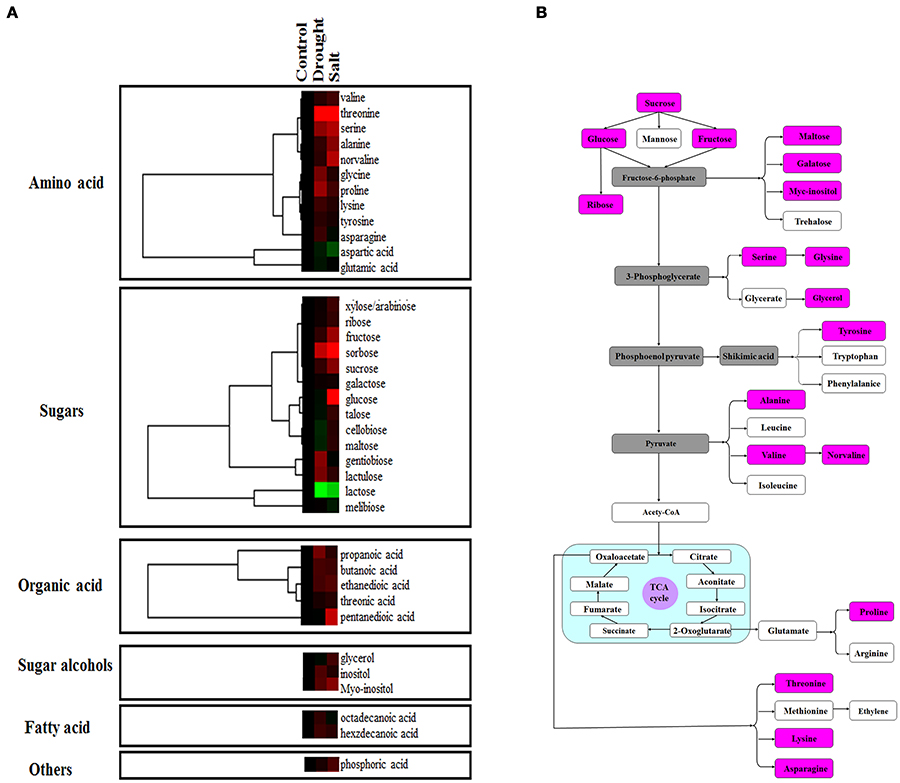
Figure 6. Effects of drought and salt stresses on metabolites in bermudagrass. (A) Hierarchical cluster analysis of 37 compounds affected by drought and salt stress conditions in bermudagrass. The resulting tree figure was obtaining using the Java Treeview and the CLUSTER software package. The metabolites that were shown in panel (B) were indicated with rose red colors. (B) Assignment of the 18 metabolites studied to pathways. A total of 18 metabolites were indicated in boxes with rose red colors, and the concentrations of these metabolites were shown in Table S2.
Discussion
Drought and salt are common stress conditions that severely affect plant growth and crop production. In this study, comparative analyses of bermudagrass in response to drought and salt stresses at physiological, proteomic, and metabolomic levels were performed. The results provided evidences that bermudagrass showed both common and contrasting responses to drought and salt treatments.
Cell Membrane Damages Caused by Drought and Salt
In plant cells, osmotic stress caused by drought and salt conditions leads to cell membrane damages. EL is a key parameter to assess cell membrane stability in response to water stress. Although drought and salt treatments caused increased EL and membrane damage (Figure 1E), salt stress showed less effect on EL and plant survival rate (Figures 1E,F) indicating that bermudagrass was highly tolerant to 400 mM NaCl within 21 days treatment which was consistent with previous studies (Shi et al., 2013a,b; Lu et al., 2007). In bermudagrass variety “WBD128” collected in China, 200 mM NaCl treatment for 5 days resulted in a slight increase of EL when compared to the control (Liu et al., 2016). These results indicated that several bermuagrass varieties are salt tolerant and salt stress caused slight cell membrane damages in these bermudagrass varieties.
Modulation of Photosynthesis and Carbon Fixation by Drought and Salt
Comparative proteomic analyses suggested that abundance of 33 proteins commonly increased and abundance of 3 proteins commonly decreased by both drought and salt (Figures 3, 4). Among them, the majority of proteins involved in PS and carbon fixation pathways were commonly regulated by drought and salt stresses. Ribulose-1, 5-bisphosphate carboxylase/oxygenase (Rubisco) is a predominant protein in photosynthesizing parts of plant and considered as the most important protein in PS. As reported, Rubisco efficiency is closely involved in plants abiotic stress responses (Feller et al., 2008). In this study, 7 RuBisCO-related proteins (spots 11, 19, 32, 33, 38, 58, 75), 3 other proteins involved in calvin cycle (spots 5, 30, 650), and 2 proteins involved in light reaction (spots 23, 35) were commonly activated by both drought and salt stresses (Table 1). However, 7 other RuBisCO-related proteins (spots 10, 12, 13, 43, 45, 59, 62) were mainly inhibited by drought, but activated or showed no changes by salt (Table 1). After water deficit, the quantity of RuBP and photorespiration in the leaves declined in three different C4 grasses, including bermudagrass (Carmo-Silva et al., 2008, 2010). All these data showed that proteins involved in light reaction and carbon fixation were partially impressed by drought, but mainly activated by salt. These results were in agreement with changes of metabolites content, which showed that sugars and sugar alcohols increased significantly by salt, but most of them slightly by drought (Figure 6). Therefore, both proteomic and metabolomic approaches indicated that drought stress caused complex changes on carbon fixation, while salt stress increased carbonhydrate biosynthesis. Soluble sugars and sugar alcohols function as compatible solutes which are responsible for osmotic balance and protect protein and other macromolecules from stress caused damages (Zhu, 2002). Accumulation of compatible solutes under salt condition enhanced bermudagrass tolerance to salt stress, while under drought condition, relative lower compatible solutes content resulted in more severe cell membrane damages as evidenced by increased EL and decreased survival rate in bermudagrass (Figures 1E–F).
Modulation of Energy Supply by Drought and Salt
Proteomic analysis showed that several proteins (spots 25, 31) involved in photosynthesis electron transport were inhibited by drought and salt stresses in bermudagrass, indicating that the modulation of these proteins might be directly relative with drought and salt tolerance signaling pathway in bermudagrass (Yang et al., 2003). Ferredoxin-thioredoxin reductase (spot 49) and ferredoxin-NADP reductase (spot 71) were differentially induced by drought and salt treatments. Chloroplast ferredoxin acted as a redox protein in photosynthesis participates in both cyclic and non-cyclic photophosphorylation reactions (Yang et al., 2003). Ferredoxin is the last electron acceptor and reduces the enzyme NADP+ reductase in non-cyclic photophosphorylation (Fukuyama, 2004). These results showed the energy supply adjustments in bermudagrass under abiotic stress conditions.
Moreover, glycolysis provides energy such as ATP and NADH and generates precursors for anabolism such as fatty acids and amino acids (Plaxton, 1996; Shi et al., 2014c). In present study, five proteins (spots 28, 39, 46, 48, 68) involved in glycolysis metabolic pathway were differentially affected when exposed to drought and salt stresses. For example, the abundance of glyceraldehyde 3-phosphate dehydrogenase (GAPDH, spots 41, 42) increased by salt stress, but decreased by drought. Cytosolic GAPDH was induced by abiotic stresses and overexpression of GAPDH increased plant abiotic stress tolerances (Zhang et al., 2011; Guo et al., 2012). In addition, the abundance of fructose-bisphosphate aldolase (spot 68) and malate dehydrogenase (spots 53, 66) was significantly increased by drought, but inhibited by salt stress. Moreover, one ATP synthase subunit alpha (spot 31) was enhanced by drought but inhibited by salt, while an ATPase (spot 21) was activated by both drought and salt (Table 1). Based on RNA seq data, Hu et al. (2015) identified 536 and 848 differentially expressed genes in two bermudagrass varieties after salt treatment. Genes involved in ATP catabolic process pathway were downregulated by salt. These data indicated that metabolisms for energy supply were more extensively affected by drought than by salt in bermudagrass, resulting in faster energy production and more quick carbohydrate degradation. This hypothesis was consistent with content changes of sugars and sugar alcohols as detected by GC-TOF-MS (Figure 6).
Redox and Stress Related Proteins Modulated by Drought and Salt
When exposed to stress conditions, plants often suffer oxidative damages due to ROS accumulation (Morita et al., 2011). Protection against oxidative damages is a key component of stress tolerance in plants (Alscher et al., 2002; Atamna and Boyle, 2006). In this study, several antioxidant enzymes including POD (spots 36, 69, 76) and superoxide dismutase (SOD) (spot 51) were regulated by drought and salt stresses. Physiological analysis also showed that both drought treatment resulted in accumulation of H2O2 and contents, while 400 mM salt treatment only increased contents. Both drought and salt increased activities of CAT, POD, and GR (Figure 5). These results were in line with protein abundance changes through proteomics approach (Table 1). ROS plays key roles during plant abiotic stress response. In response to abiotic stress condition, Shi et al. (2012) and Liu et al. (2016) also found that drought or salt stress induced ROS production and increased activities of antioxidant enzymes, including CAT, SOD, and POD. Accumulation of ROS might act as stress signaling in bermudagrass which in turn activated downstream stress responsive genes.
Several other proteins (spots 7, 20, 26, 29, 44, and 60) related to the protein folding, protein synthesis and protein degradation were regulated by drought and salt stresses. For example, the ribosomal protein (spots 26, 60) involved in the cellular process of translation (Balmer et al., 2003) was commonly regulated by drought and salt. Moreover, one chitinase (spot 4), and two heat shock protein 70 (spots 22 and 55) were commonly induced by drought and salt, which play pivotal roles in plant stress responses (Wang et al., 2004; Dana et al., 2006), indicating that bermudagrass sensed environmental stress signaling and responded to stress conditions through modulation of stress responsive genes. Most recently, overexpression of bermudagrass genes CtHsfA2b and NF-YC improved abiotic stress tolerance in Arabidopsis and rice, respectively (Chen et al., 2015; Wang et al., 2016). These results indicated that candidate genes from bermudagrass might be effective to improve stress tolerance in model and crop plants. Since several bermudagrass varieties showed high tolerance to drought and salt, identification and functional characterization of stress responsive genes would provide new gene resources for genetic modification of bermudagrass with increased stress tolerance.
Taken together, the responses of bermudagrass to drought and salt stresses were compared at proteomics and metabolomics levels. The results indicated that photosynthesis and carbon fixation pathways were extensively affected under both drought and salt conditions. Drought stress caused relatively less carbohydrate accumulation and more energy production which might result in carbon starvation. Conversely, salt stress induced sugars and sugar alcohols accumulation which functioned as compatible solutes. Moreover, drought and salt stresses increased ROS levels and modulated proteins involving in stress tolerance in bermudagrass. Therefore, 21 days drought treatment finally led to relatively more severe cell membrane damage and lower survival rate in relative to 400 mM NaCl treatment (Figure 7).
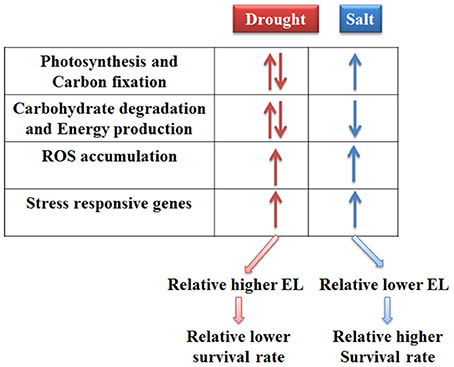
Figure 7. A proposed model for drought and salt stress responses in bermudagrass.
Author Contributions
TY designed and performed the experiments, analyzed the data, and wrote the manuscript; HS performed the experiments, analyzed the data, and revised the manuscript; YW analyzed the data; FY revised the manuscript; ZC designed the experiments, and revised the manuscript; and all authors approved the manuscript.
Conflict of Interest Statement
The authors declare that the research was conducted in the absence of any commercial or financial relationships that could be construed as a potential conflict of interest.
Acknowledgments
This research was supported by Chinese Academy of Sciences (No. Y154761O01076 and Y455446O05) to ZC.
Supplementary Material
The Supplementary Material for this article can be found online at: http://journal.frontiersin.org/article/10.3389/fpls.2016.01694/full#supplementary-material
Abbreviations
APX, ascorbate peroxidase; CAT, catalase; 2-DE, two-dimensional electrophoresis; EL, electrolyte leakage; FBAs, Fructose-1,6-bisphosphate aldolases; GAPDH, gyceraldehyde 3-phosphate dehydrogenase; GR, glutathione reductase; IEF, isoelectric focusing; IPG, immobilized protein gradient; RWC, relative leaf water content; MDA, malondialdehyde; NF, normalized frequency; OPP, oxidative pentose phosphate pathway; OEE2, oxygen-evolving enhancer protein 2; POD, peroxidase; PRK, phosphoribulokinase; PS, photosynthesis; ROS, reactive oxygen species; Rubisco, ribulose-1,5-bisphosphate carboxylase/oxygenase; RuBP, ribulose-1,5-bisphosphate; SOD, superoxide dismutase; TCA, tricarboxylicacid; WAK1, wall-associated receptor kinase.
References
Alscher, R. G., Erturk, N., and Heath, L. S. (2002). Role of superoxide dismutases (SODs) in controlling oxidative stress in plants. J. Exp. Bot. 53, 1331–1341. doi: 10.1093/jexbot/53.372.1331
Atamna, H., and Boyle, K. (2006). Amyloid-β peptide binds with heme to form a peroxidase: relationship to the cytopathologies of Alzheimer's disease. Proc. Natl. Acad. Sci. U.S.A. 103, 3381–3386. doi: 10.1073/pnas.0600134103
Bailey-Serres, J., and Voesenek, L. A. C. J. (2010). Life in the balance: a signaling network controlling survival of flooding. Curr. Opin. Plant Biol. 13, 489–494. doi: 10.1016/j.pbi.2010.08.002
Balmer, Y., Koller, A., Del Val, G., Manieri, W., Schürmann, P., and Buchanan, B. B. (2003). Proteomics gives insight into the regulatory function of chloroplast thioredoxins. Proc. Natl. Acad. Sci. U.S.A. 100, 370–375. doi: 10.1073/pnas.232703799
Bradford, N. M. (1976). A rapid and sensitive for the quantitation of microgram quantitites of protein utilizing the principle of protein-dye binding. Anal. Biochem. 72, 248–254.
Carmo-Silva, A. E., Keys, A. J., Andralojc, P. J., Powers, S. J., Arrabaça, M. C., and Parry, M. A. (2010). Rubisco activities, properties, and regulation in three different C4 grasses under drought. J Exp Bot. 61, 2355–2366. doi: 10.1093/jxb/erq071
Carmo-Silva, A. E., Powers, S. J., Keys, A. J., Arrabaça, M. C., and Parry, M. A. (2008). Photorespiration in C4 grasses remains slow under drought conditions. Plant Cell Environ. 31, 925–940. doi: 10.1111/j.1365-3040.2008.01805.x
Chan, Z., Qin, G., Xu, X., Li, B., and Tian, S. (2007). Proteome approach to characterize proteins induced by antagonist yeast and salicylic acid in peach fruit. J. Proteome Res. 6, 1677–1688. doi: 10.1021/pr060483r
Chen, M., Zhao, Y., Zhuo, C., Lu, S., and Guo, Z. (2015). Overexpression of a NF-YC transcription factor from bermudagrass confers tolerance to drought and salinity in transgenic rice. Plant Biotechnol. J. 13, 482–491. doi: 10.1111/pbi.12270
Dana, M. M., Pintor-Toro, J. A., and Cubero, B. (2006). Transgenic tobacco plants overexpressing chitinases of fungal origin show enhanced resistance to biotic and abiotic stress agents. Plant Physiol. 142, 722–730. doi: 10.1104/pp.106.086140
de Hoon, M. J. L., Imoto, S., Nolan, J., and Miyano, S. (2004). Open source clustering software. Bioinformatics 20, 1453–1454. doi: 10.1093/bioinformatics/bth078
Feller, U., Anders, I., and Mae, T. (2008). Rubiscolytics: fate of Rubisco after its enzymatic function in a cell is terminated. J. Exp. Bot. 59, 1615–1624. doi: 10.1093/jxb/erm242
Fukuyama, K. (2004). Structure and function of plant-type ferredoxins. Photosynth. Res. 81, 289–301. doi: 10.1023/B:PRES.0000036882.19322.0a
Gibbs, J., and Greenway, H. (2003). Mechanisms of anoxia tolerance in plants. I. Growth, survival and anaerobic catabolism. Funct. Plant Biol. 30, 1–47. doi: 10.1071/PP98095
Guo, L., Devaiah, S. P., Narasimhan, R., Pan, X., Zhang, Y., Zhang, W., et al. (2012). Cytosolic glyceraldehyde-3-phosphate dehydrogenases interact with phospholipase Dδ to transduce hydrogen peroxide signals in the Arabidopsis response to stress. Plant Cell 24, 2200–2212. doi: 10.1105/tpc.111.094946
Hu, L., Li, H., Chen, L., Lou, Y., Amombo, E., and Fu, J. (2015). RNA-seq for gene identification and transcript profiling in relation to root growth of bermudagrass(Cynodon dactylon) under salinity stress. BMC Genomics 16:575. doi: 10.1186/s12864-015-1799-3
Hu, L., Wang, Z., Du, H., and Huang, B. (2010). Differential accumulation of dehydrins in response to water stress for hybrid and common bermudagrass genotypes differing in drought tolerance. J. Plant Physiol. 167, 103–109. doi: 10.1016/j.jplph.2009.07.008
Li, M., Sha, A., Zhou, X., and Yang, P. (2012). Comparative proteomic analyses reveal the changes of metabolic features in soybean (Glycine max) pistils upon pollination. Sex. Plant Reprod. 25, 281–291. doi: 10.1007/s00497-012-0197-0
Lisec, J., Schauer, N., Kopka, J., Willmitzer, L., and Fernie, A. R. (2006). Gas chromatography mass spectrometry-based metabolite profiling in plants. Nat. Protoc. 1, 3873–3896. doi: 10.1038/nprot.2006.59
Liu, A., Hu, Z., Bi, A., Fan, J., Gitau, M. M., Amombo, E., et al. (2016). Photosynthesis, antioxidant system and gene expression of bermudagrass in response to low temperature and salt stress. Ecotoxicology 25, 1445–1457. doi: 10.1007/s10646-016-1696-9
Lu, S., Peng, X., Guo, Z., Zhang, G., Wang, Z., Wang, C., et al. (2007). In vitro selection of salinity tolerant variants from triploid bermudagrass (Cynodon transvaalensis × C. dactylon) and their physiological responses to salt and drought stress. Plant Cell Rep. 26, 1413–1420. doi: 10.1007/s00299-007-0339-2
Morita, S., Nakatani, S., Koshiba, T., Masumura, T., Ogihara, Y., and Tanaka, K. (2011). Differential expression of two cytosolic ascorbate peroxidases and two superoxide dismutase genes in response toabiotic stress in rice. Rice Sci. 18, 157–166. doi: 10.1016/S1672-6308(11)60023-1
Plaxton, W. C. (1996). The organization and regulation of plant glycolysis. Annu. Rev. Plant Biol. 47, 185–214. doi: 10.1146/annurev.arplant.47.1.185
Provart, N. J., and Zhu, T. (2003). A browser-based functional classification SuperViewer for Arabidopsis genomics. Curr. Comput. Mol. Biol. 2003, 271–272.
Qian, Y., Fry, J. D., and Upham, W. S. (1997). Rooting and drought avoidance of warm-season turfgrasses and tall fescue in Kansas. Crop Sci. 47, 2162–2169. doi: 10.2135/cropsci1997.0011183x003700030034x
Sanchez-Villarreal, A., Shin, J., Bujdoso, N., Obata, T., Neumann, U., Du, S. X., et al. (2013). TIME FOR COFFEE is an essential component in the maintenance of metabolic homeostasis in Arabidopsis thaliana. Plant J. 76, 188–200. doi: 10.1111/tpj.12292
Shi, H., Wang, Y., Cheng, Z., Ye, T., and Chan, Z. (2012). Analysis of natural variation in bermudagrass (Cynodon dactylon) reveals physiological responses underlying drought tolerance. PLoS ONE 7:e53422. doi: 10.1371/journal.pone.0053422
Shi, H., Ye, T., and Chan, Z. (2013a). Comparative proteomic and physiological analyses reveal the protective effect of exogenous polyamines in the bermudagrass (Cynodon dactylon) response to salt and drought stresses. J. Proteome Res. 12, 4951–4964. doi: 10.1021/pr400479k
Shi, H., Ye, T., and Chan, Z. (2013b). Exogenous application of hydrogen sulfide donor sodium hydrosulfide enhanced multiple abiotic stress tolerance in bermudagrass (Cynodon dactylon (L). Pers.). Plant Physiol. Biochem. 71, 226–234. doi: 10.1016/j.plaphy.2013.07.021
Shi, H., Ye, T., and Chan, Z. (2014a). Comparative proteomic responses of two bermudagrass (Cynodon dactylon (L). Pers.) varieties contrasting in drought stress resistance. Plant Physiol. Biochem. 82C, 218–228. doi: 10.1016/j.plaphy.2014.06.006
Shi, H., Ye, T., and Chan, Z. (2014b). Nitric oxide activated hydrogen sulfide is essential for cadmium stress response in bermudagrass (Cynodon dactylon (L). Pers.). Plant Physiol. Biochem. 74C, 99–107. doi: 10.1016/j.plaphy.2013.11.001
Shi, H., Ye, T., Zhong, B., Liu, X., and Chan, Z. (2014c). Comparative proteomic and metabolomic analyses reveal mechanisms of improved cold stress tolerance in bermudagrass (Cynodon dactylon (L). Pers.) by exogenous calcium. J. Integr. Plant Biol. 56, 1064–1079. doi: 10.1111/jipb.12167
Tan, S., Zhu, M., and Zhang, Q. (2010). Physiological responses of bermudagrass (Cynodon dactylon) to submergence. Acta Physiol. Plant. 32, 133–140. doi: 10.1007/s11738-009-0388-y
Thimm, O., Blasing, O., Gibon, Y., Nagel, A., Meyer, S., Kruger, P., et al. (2004). MAPMAN: a userdriven tool to display genomics data sets onto diagrams of metabolic pathways and other biological processes. Plant J. 37, 914–939. doi: 10.1111/j.1365-313X.2004.02016.x
Wang, W., Vinocur, B., Shoseyov, O., and Altman, A. (2004). Role of plant heat-shock proteins and molecular chaperones in the abiotic stress response. Trends Plant Sci. 9, 244–252. doi: 10.1016/j.tplants.2004.03.006
Wang, X., Huang, W., Yang, Z., Liu, J., and Huang, B. (2016). Transcriptional regulation of heat shock proteins and ascorbate peroxidase by CtHsfA2b from African bermudagrass conferring heat tolerance in Arabidopsis. Sci Rep. 6:28021. doi: 10.1038/srep28021
Yang, E. J., Oh, Y. A., Lee, E. S., Park, A. R., Cho, S. K., Yoo, Y. J., et al. (2003). Oxygen-evolving enhancer protein 2 is phosphorylated by glycine-rich protein 3/wall-associated kinase 1 in Arabidopsis. Biochem. Bioph. Res. Commun. 305, 862–868. doi: 10.1016/S0006-291X(03)00851-9
Yang, F., Wang, Y., and Miao, L. (2010). Comparative physiological and proteomic responses to drought stress in two poplar species originating from different altitudes. Physiol. Plant. 139, 388–400. doi: 10.1111/j.1399-3054.2010.01375.x
Zhang, X., Rao, X., Shi, H., Li, R., and Lu, Y. (2011). Overexpression of a cytosolic glyceraldehyde-3-phosphate dehydrogenase gene OsGAPC3 confers salt tolerance in rice. Plant Cell Tiss. Organ. Cult. 107, 1–11. doi: 10.1007/s11240-011-9950-6
Zhao, Y., Du, H., Wang, Z., and Huang, B. (2011). Identification of proteins associated with water-deficit tolerance in C4 perennial grass species, Cynodon dactylon × Cynodon transvaalensis and Cynodon dactylon. Physiol. Plant 141, 40–55. doi: 10.1111/j.1399-3054.2010.01419.x
Keywords: abiotic stress, bermudagrass, carbon metabolism, metabolomic, photosynthesis, proteomic
Citation: Ye T, Shi H, Wang Y, Yang F and Chan Z (2016) Contrasting Proteomic and Metabolomic Responses of Bermudagrass to Drought and Salt Stresses. Front. Plant Sci. 7:1694. doi: 10.3389/fpls.2016.01694
Received: 30 August 2016; Accepted: 27 October 2016;
Published: 11 November 2016.
Edited by:
Maoteng Li, Huazhong University of Science and Technology, ChinaReviewed by:
Bin Xu, Nanjing Agricultural University, ChinaLiebao Han, Beijing Forestry University, China
Copyright © 2016 Ye, Shi, Wang, Yang and Chan. This is an open-access article distributed under the terms of the Creative Commons Attribution License (CC BY). The use, distribution or reproduction in other forums is permitted, provided the original author(s) or licensor are credited and that the original publication in this journal is cited, in accordance with accepted academic practice. No use, distribution or reproduction is permitted which does not comply with these terms.
*Correspondence: Zhulong Chan, emh1bG9uZ2NoQHdiZ2Nhcy5jbg==
†These authors have contributed equally to this work.