 Baosheng Dai
 Huanle Guo
 Cong Huang
 Muhammad M. Ahmed
 Zhongxu Lin
- National Key Laboratory of Crop Genetic Improvement, College of Plant Science and Technology, Huazhong Agricultural University, Wuhan, China
Segregation distortion is commonly detected via genetic mapping and this phenomenon has been reported in many species. However, the genetic causes of the segregation distortion regions in a majority of species are still unclear. To genetically dissect the SD on chromosome 18 in cotton, eight reciprocal backcross populations and two F2 populations were developed. Eleven segregation distortion loci (SDL) were detected in these ten populations. Comparative analyses among populations revealed that SDL18.1 and SDL18.9 were consistent with male gametic competition; whereas SDL18.4 and SDL18.11 reflected female gametic selection. Similarly, other SDL could reflect zygotic selection. The surprising finding was that SDL18.8 was detected in all populations, and the direction was skewed towards heterozygotes. Consequently, zygotic selection or heterosis could represent the underlying genetic mechanism for SDL18.8. Among developed introgression lines, SDL18.8 was introgressed as a heterozygote, further substantiating that a heterozygote state was preferred under competition. Six out of 11 SDL on chromosome 18 were dependent on the cytoplasmic environment. These results indicated that different SDL showed varying responses to the cytoplasmic environment. Overall, the results provided a novel strategy to analyze the molecular mechanisms, which could be further exploited in cotton interspecific breeding programs.
Introduction
Segregation distortion (SD) is defined as a deviation of the observed allelic frequencies at a locus from the expected Mendelian ratio in a segregating population. This phenomenon is commonly detected via genetic mapping and has been documented in various species, including mouse (Eversley et al., 2010; Casellas et al., 2012), Drosophila (Phadnis and Orr, 2009; Larracuente and Presgraves, 2012; McDermott and Noor, 2012), Tigriopus (Pritchard et al., 2011), rice (Koide et al., 2012; Reflinur et al., 2014; Xu et al., 2014), maize (Tang et al., 2013), and cotton (Yu et al., 2011; Hulse-Kemp et al., 2015). SD, a powerful evolutionary force, has been suggested as a selection mechanism among different gametophyte and/or sporophyte genotypes (Sandler and Novitski, 1957). Moreover, SD could be involved in the alleviation of population divergence leading to speciation (McDermott and Noor, 2010).
Several factors could affect gametophyte and zygote formation and ultimately lead to SD. Several genetic mechanisms of SD have been insightfully studied in plants and animals (Larracuente and Presgraves, 2012; Yang et al., 2012). For example, zygotic selection rather than gametic selection might play an important role in SD in diploid alfalfa (Li et al., 2011). However, both male gametic and zygotic selection contributed to the severe SD of a locus during maternal haploid induction in maize (Xu et al., 2013). Furthermore, meiotic drive could increase the frequency of distorted alleles, which eventually become fixed in the population. A sex ratio distortion has previously been reported in mosquito via meiotic drive (Shin et al., 2012). In addition, conspecific pollen precedence has been recognized as a potential major source for SD in closely related species of Mimulus with divergent mating systems (Fishman et al., 2008).
Molecular markers with SD are typically distributed in clusters and are primarily skewed in the same direction; these regions are generally defined as segregation distortion regions (SDRs) (Lu et al., 2002; Eversley et al., 2010; Li et al., 2010; Leppala et al., 2013). For example, in maize, 14 SDRs were detected among 9 different chromosomes, and 4 SDRs were located in the vicinity of gametophyte genes, suggesting that these SDRs might be partially induced by gametophyte genes (Yan et al., 2003). Lu et al. (2002) reported that 18 chromosomal regions on 10 maize chromosomes were associated with SD, and three known gametophytic factors were potential genetic stimulants of these SDRs. In barley, a total of 14 SDRs have been identified, and the association of the identified SDRs and haploid production genes were compared (Li et al., 2010).
The most prospective explanation for the SDRs could be that specific loci in the genome are conduced to viability differentiation (Luo and Xu, 2003; Zhu and Zhang, 2007). The selection of an allele at the locus would result in nearby markers that deviate from the expected ratio, consistent with the theory of genetic hitchhiking. Thus, analysis of the mapped molecular markers in the vicinity along the genome would be helpful to analyze segregation distortion loci (SDL). Based on the genotypic frequency of the markers, Luo et al. (2005) developed a quantitative genetics model for mapping SDL, assuming a continuous liability that controls the viability of individuals. Subsequently, an SDL mapping module based on the EM (expectation-maximization) algorithm was integrated in PROC QTL software, making this method friendly to use (Xu and Hu, 2009).
In a previous study, our laboratory constructed a cotton interspecific genetic linkage map that included 2316 loci on 26 chromosomes using a BC1 population of 141 individuals (Yu et al., 2011). A total of 21 SDRs were detected, with 5 SDRs on chromosome 18, and the molecular markers on chromosome 18 were severely distorted. However, thus far, little is known about the genetic mechanism of SD on chromosome 18 in cotton. In the present study, eight reciprocal backcross populations and two F2 populations were developed to reveal SDRs, primarily focusing on the exploitation of the genetic mechanism of SD in severely distorted chromosome 18. We investigated the marker segregation in the ten populations, and subsequently we identified SDL using Proc QTL. Moreover, we substantiated the putative genetic mechanism underlying these SDL.
Materials and Methods
Plant Materials
The Gossypium hirsutum cv. Emian22 and G. barbadense acc. 3–79 were used as the parents to develop eight reciprocal BC1F1 populations and two F2 populations (Figure 1). Emian22 is an elite cultivar cultivated in Hubei province, China; and 3-79 is considered as a genetic and cytogenetic standard line for G. barbadense (Yu et al., 2011).
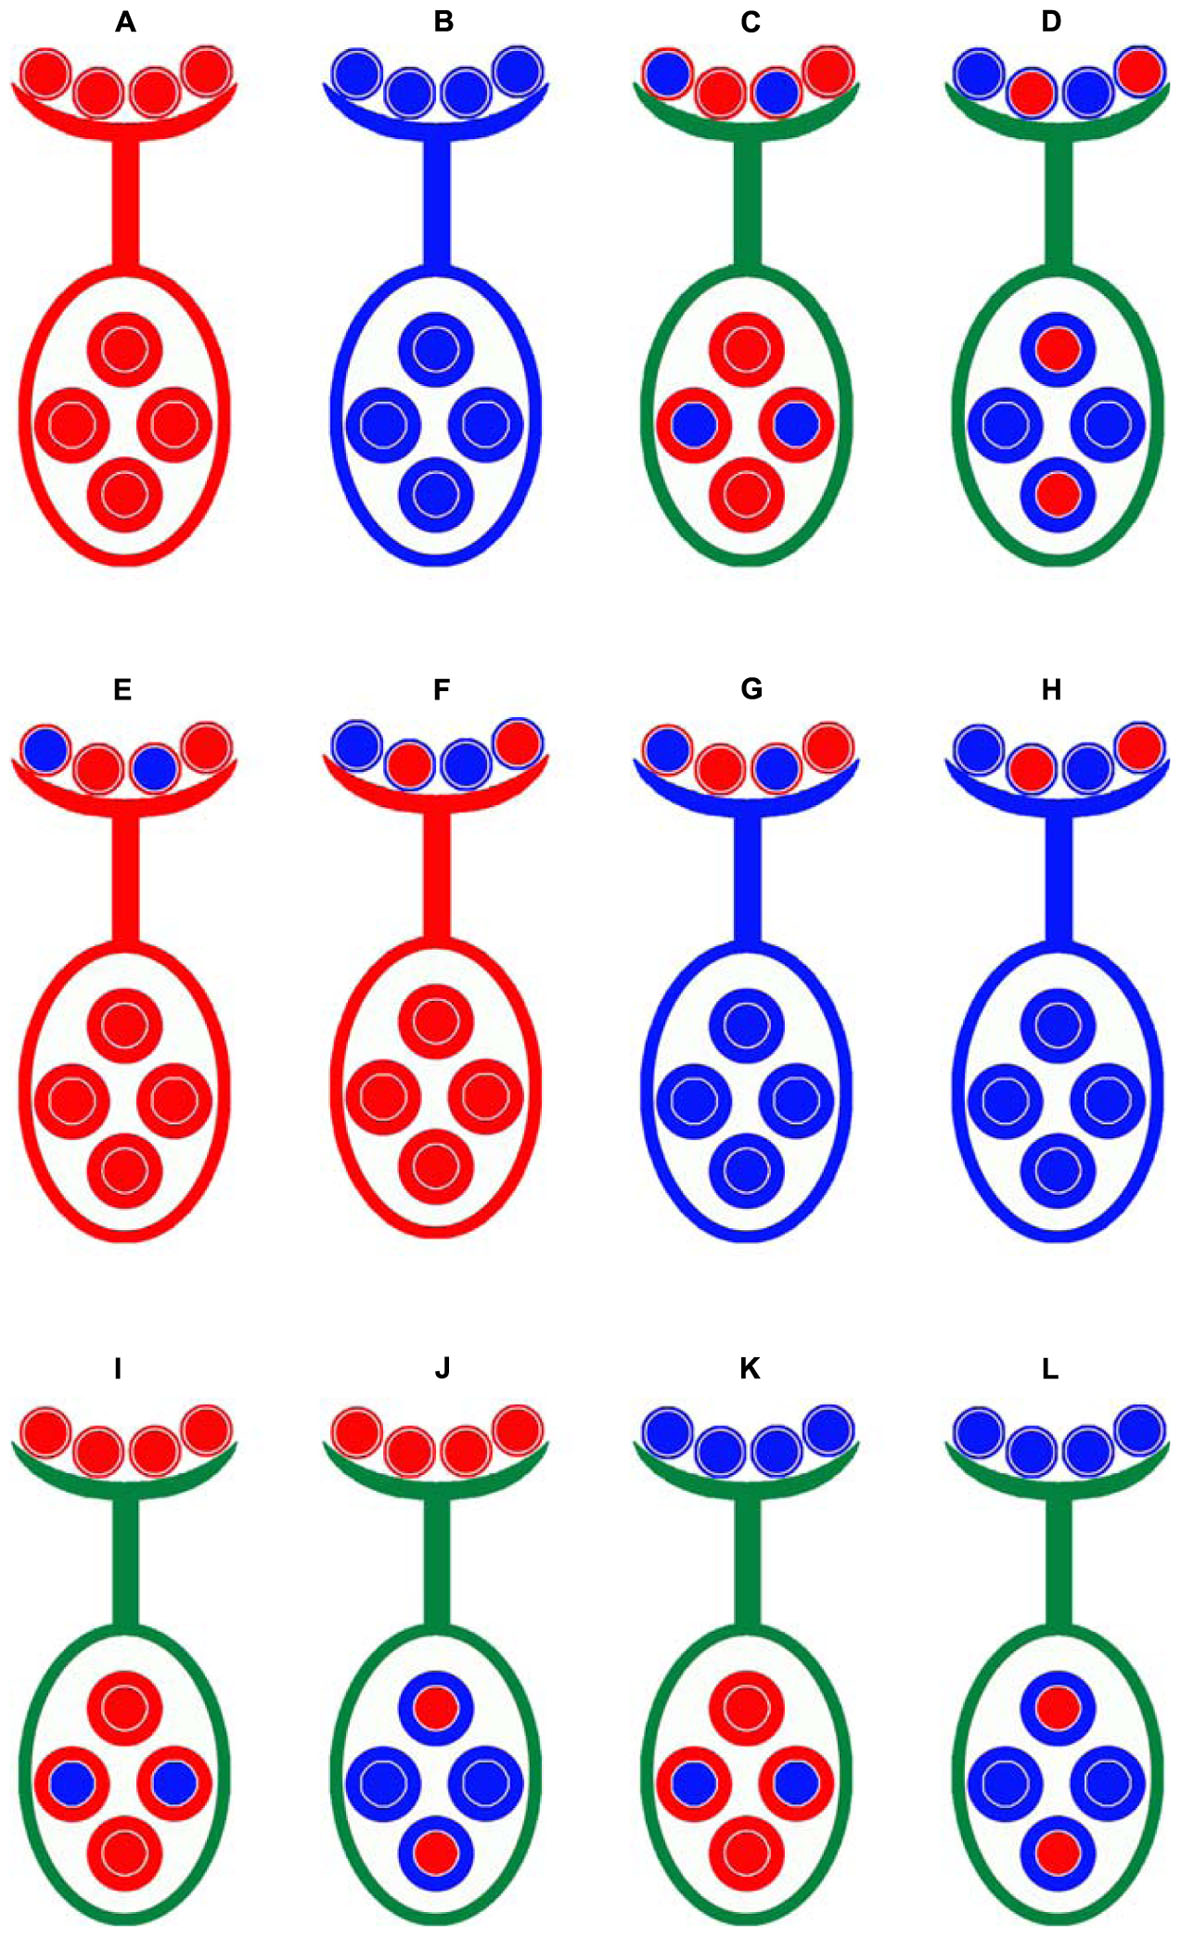
FIGURE 1. Crossing design for distinguishing gametic and zygotic selection and the maternal effects for SD. Emian22 (A) was crossed with 3-79 (B) to produce two types of F1 plants, these F1 hybrid plants were self-pollinated to generate F2 populations, (E3)F2 (C) and (3E)F2 (D). Four male-segregating backcross populations, E(E3) (E), E(3E) (F), 3(E3) (G), and 3(3E) (H), and four female-segregating backcross populations, (3E)E (I), (E3)E (J), (3E)3 (K), and (E3)3 (L), were developed. Smaller circles indicate pollen on stigma and larger circles indicate ovules. The colors of patterns outside of the two types of circles are indicated as the cytoplasmic backgrounds, red is indicated for Emian22, and blue is indicated for 3-79.
Emian22 was crossed with 3-79 to produce reciprocal F1 plants, namely, Emian22/3-79 and 3-79/Emian22, and the reciprocal F1 hybrid plants were self-pollinated to generate the F2 mapping populations (Emian22/3-79) F2 and (3-79/Emian22) F2, designated (E3)F2 and (3E)F2, respectively. Subsequently, two sets of reciprocal BC1F1 populations were developed in the present study. The F1 plant derived from the cross Emian22/3-79 was backcrossed with the Emian22 or 3-79, and the pedigrees of these populations are Emian22 // (Emian22/3-79), (Emian22/3-79) // Emian22, 3-79 // (Emian22/3-79) and (Emian22/3-79) // 3-79, designated E(E3), (E3)E, 3(E3), and (E3)3, respectively. Additionally, the other four reciprocal BC1F1 populations were produced by backcrossing the F1 derived from 3-79/Emian22 and Emian22 or 3-79, and the pedigrees of these populations are Emian22 // (3-79/Emian22), (3-79/Emian22) // Emian22, 3-79 // (3-79/Emian22) and (3-79/Emian22) // 3-79, designated E(3E), (3E)E, 3(3E), and (3E)3, respectively.
The following numbers of progeny from the BC1F1 populations and F2 were used for mapping and SD analysis: 142 for (E3)E, 142 for (E3)3, 142 for (3E)E, 142 for (3E)3, 190 for E(E3), 190 for E(3E), 142 for 3(E3), 138 for 3(3E), 142 for (3E)F2, and 142 for (E3)F2. All plant materials were planted during the cotton-growing season in 2012 at the experimental farm of Huazhong Agricultural University, Wuhan, China.
Molecular Marker Genotyping
Total genomic DNA from the parents and individuals of the eight BC1F1 and two F2 populations were extracted from young leaves according to Paterson et al. (1993). To compare the population difference, co-dominant markers were selected to genotype the ten populations. A total of fifty polymorphic molecular markers covering 136.9 cM along chromosome 18 were genotyped in the ten populations. The primer sequences of the molecular markers were obtained from CottonGen1 (Yu et al., 2014). Polymerase chain reaction (PCR) analysis, electrophoresis and silver staining were performed according to Lin et al. (2005).
SDL Detection
For each locus, deviations from the Mendelian ratios (1:1 ratio for BC1F1 population, and 1:2:1 for F2 population) were estimated and examined for significance using chi-square analysis. To account for multiple testing, the Benjamini-Hochberg False Discovery Rate (FDR) correction method was applied to the segregation data of each population to avoid type-I errors deriving from the large number of tests. The method was performed calling the p.adjust function incorporated in the R program STATS. To avoid false positives, the adjusted p-values were used to determine significance. The loci showing non-Mendelian segregation (P < 0.05) were considered to exhibit SD. The SD of an individual marker could reflect linkage to an SDL. The identification of candidate regions containing SDL is an effective method to resolve the genetic architecture of SD. The EM (expectation–maximization) method used for mapping SDL in a segregating population provided an efficient approach to estimate the positions and effects of putative SDL in the genetic map (Xu and Hu, 2009). SDL were detected by using the PROC QTL according to the method of Xu and Hu (2009). The detailed procedure is available in the PROC QTL manual2. In the output result table, the loci were designated as significant SDL with a LOD value of 3.0 (Tang et al., 2013).
Identification and Annotation of Genes in the SDL
To investigate the genes in these SDL, the sequences containing SSRs were acquired from CottonGen (Yu et al., 2014). Using the BLASTX (Altschul et al., 1990), these sequences were mapped to the cotton genome (TM-1) (Zhang et al., 2015), and the physical positions of these SDL were identified. The genes in the adjacent region were obtained for every SDL. Further, gene ontology (GO) enrichment analysis was investigated using Fisher’s exact test in Blast2Go with a cut-off E-value of 0.001 (Conesa et al., 2005). Blast2Go was used to compare the frequency of the GO terms in the reference genes with the cotton genome and the test genes.
Results
Patterns of Marker Segregation Across the Chromosome 18
To facilitate a comparative analysis between populations, a total of 50 co-dominant SSR markers were used to genotype these ten populations; dominant markers were not used. Figures 2 and 3 show the frequencies and chi-square values of the two genotypes of SSR markers on chromosome 18 in all populations. According to the Mendel’s segregation laws, the genotype ratio at a locus should be 1:1 in BC1F1 populations and 1:2:1 in F2 populations; however, there could be several severely distorted regions along chromosome 18.
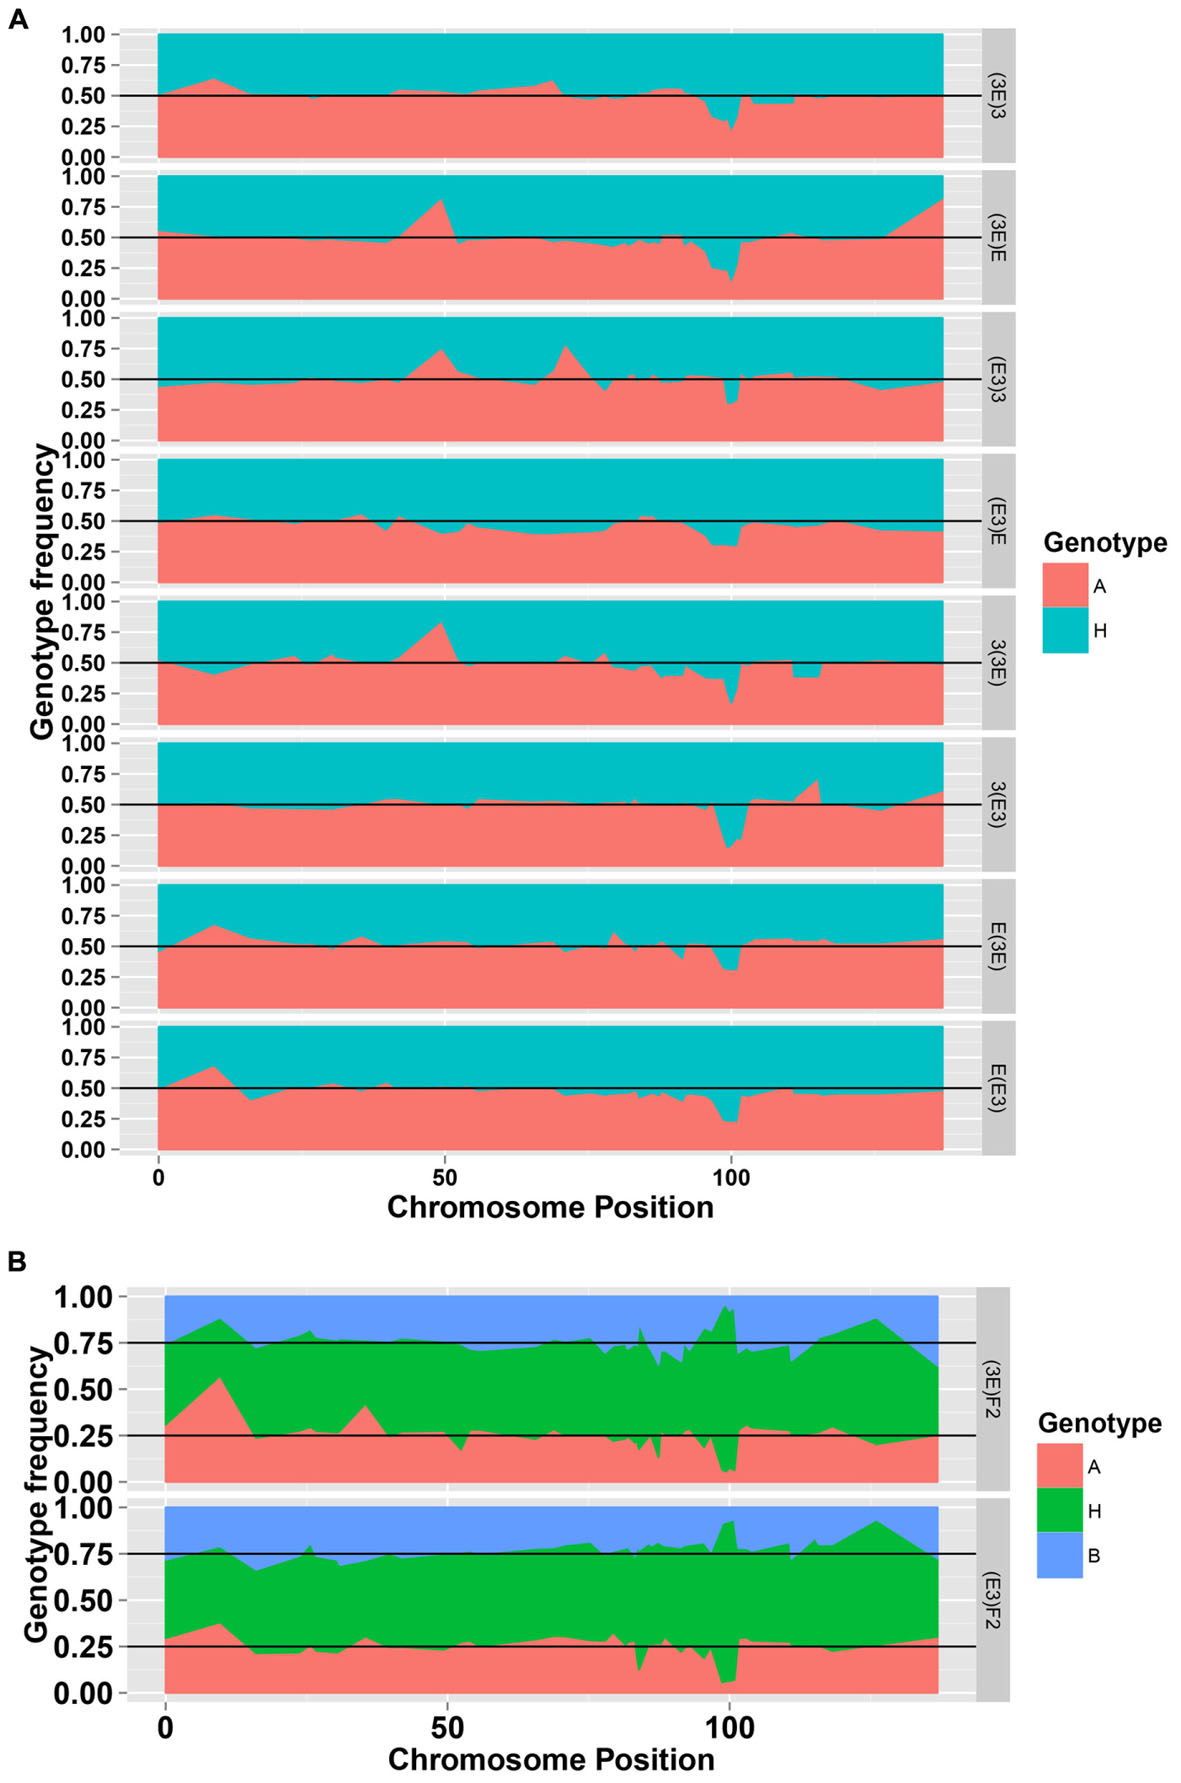
FIGURE 2. The genotype frequencies of the SSR markers on chromosome 18 in the eight BC1F1 populations (A) and two F2 populations (B).
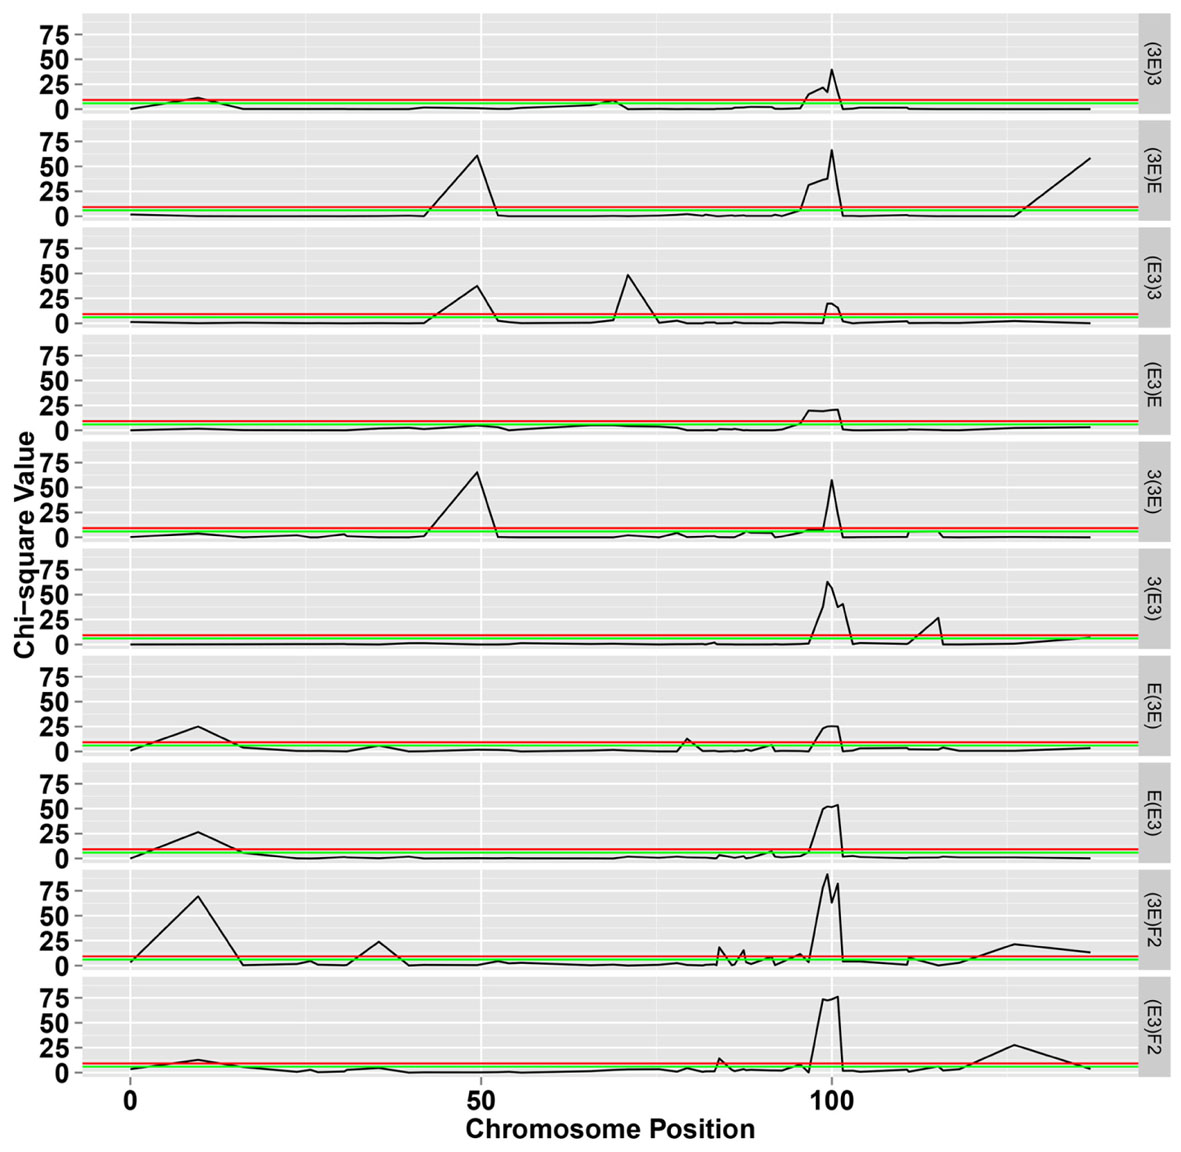
FIGURE 3. The chi-square test for segregation of Mendelian inheritance on chromosome 18. The green and black lines represent the significance level at 0.05 and 0.01, respectively.
The markers of distorted segregation in the eight reciprocal BC1F1 populations and two F2 populations are presented in Table 1. The results indicated that a total of 17 markers showed distorted segregation. Among these markers, three markers, HAU1908, MUSS140 and NAU3398 were synchronously distorted in all populations. The region spanning 99.368–100.854 cM showed continuous SD. In addition, the adjacent markers, NAU3232 and HAU2992, were distorted in several populations. NAU2980a was synchronously distorted in the three BC1F1 populations and the (3E)F2 population. Similarly, JESPR178 was synchronously distorted in the three BC1F1 populations, and HAU2631a was synchronously distorted in the two F2 populations. Similarly, TMB2762 was distorted in the two BC1F1 populations. The other markers were distorted in only one population.
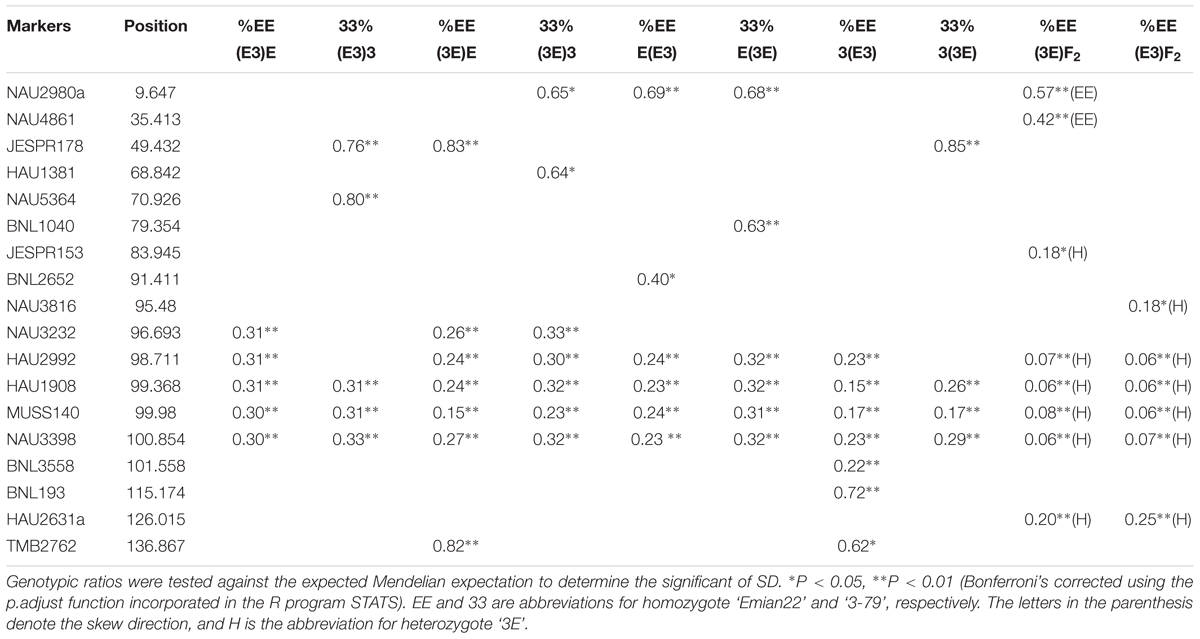
TABLE 1. Markers of distorted segregation along chromosome 18.
The patterns of marker segregation were different in each population, indicating that the genetic mechanism of SD had distinct population specificity as a result of complex genetic systems. Among these 17 distorted markers, ten markers were skewed towards heterozygotes and seven markers were skewed towards homozygotes, indicating that heterozygotes were transmitted at a higher frequency than homozygotes.
SDL Detection Along the Chromosome 18
The LOD profiles for the detected SDL are presented in Figure 4, and peaks with LOD scores more than 3.0 indicated the presence of SDL. Eleven SDL were detected in all populations, and details of these SDL are presented in Table 2. SDL18.1, located at 9.65 cM on chromosome 18, was detected in the E(E3), E(3E), and (3E)F2 populations; SDL18.2, located at 35.41 cM, was detected in the (3E)F2 populations; SDL18.3, located at 49.432 cM, was detected in the (E3)3, (3E)E, and 3(3E) populations; SDL18.4, located at 70.962 cM, was detected in the (E3)3 population; SDL18.5 and SDL18.6, located at 83.95 cM, 87.41 cM, respectively, were detected in the (3E)F2 populations; SDL18.7, located at 95.48 cM, was detected in both F2 populations; SDL18.8, located at 99.98 cM, was detected in all populations; SDL18.9, located at 115.174 cM, was detected in the 3(E3) population; SDL18.10, located at 126.02 cM, was detected in both F2 populations; and SDL18.11, located at 136.867 cM, was detected in the (3E)E population. The results presented in the present study vividly demonstrated that the regions contained certain genetic factors, which could be responsible for the SD on chromosome 18.
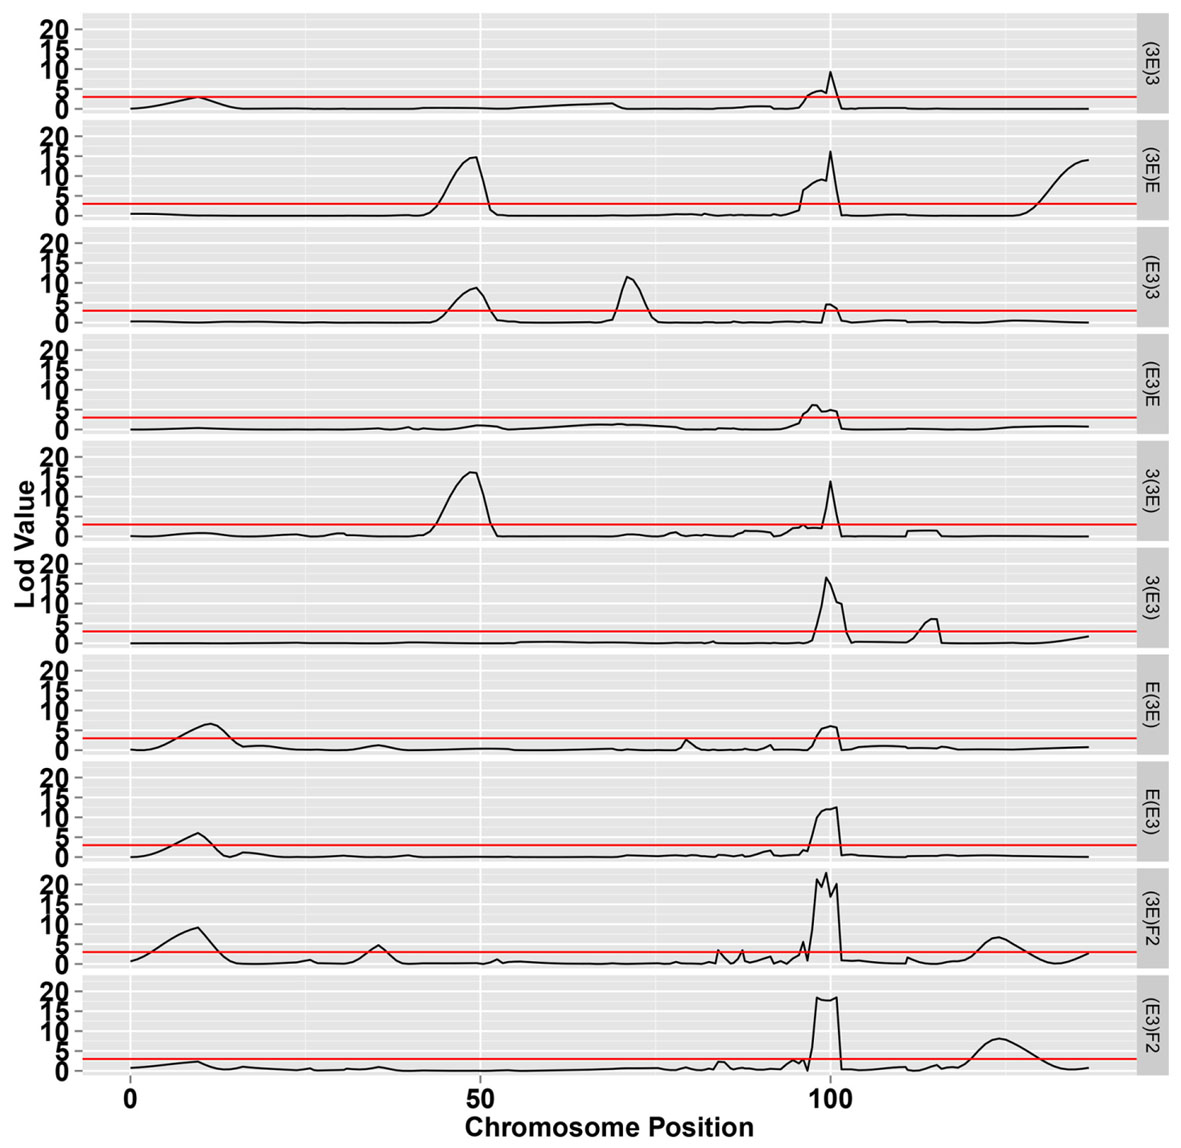
FIGURE 4. The LOD score for segregation distortion loci (SDL) on chromosome 18. The black line represents the significance level at LOD value = 3.0.
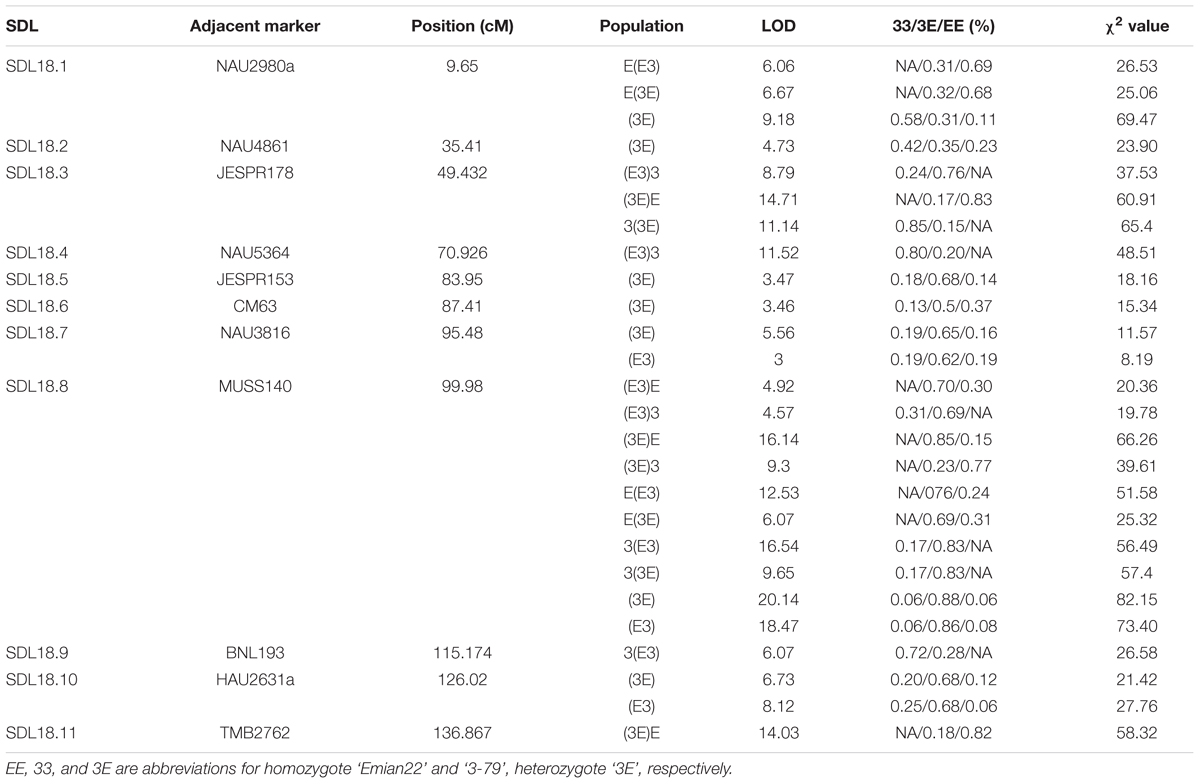
TABLE 2. Segregation distortion loci (SDL) detected along chromosome 18 in the 10 populations.
Among these SDL, six loci including SDL18.6, SDL18.7, SDL18.8, SDL18.9, SDL18.10, and SDL18.11, have previously been reported (Yu et al., 2011). SDL18.6, SDL18.7, and SDL18.8 were positioned in the previous SDR18.3, which spanned 85.727–102.297 cM; SDL18.9 was positioned in the previous SDR18.4, which spanned 110.264–115.838 cM; and SDL18.10 and SDL18.11 were positioned in the previous SDR18.5, which spanned 126.015–136.867 cM.
Characterization of SDL Underlying Gametic Selection or Zygotic Selection
SDL18.1 was distorted in the two male-segregating backcross populations, E(E3) and E(3E), and the (3E)F2 population. In backcross populations, the direction was skewed towards Emian22 homozygotes, suggesting that in competition, pollens containing the Emian22 allele were preferred compared with pollens containing the 3-79 allele; but it was not distorted in the reciprocal female-segregating backcross populations, (E3)E and (3E)E, implying that this SD reflected male gametic competition. In addition, SDL18.1 was not distorted in the other male-segregating backcross populations, 3(E3) and 3(3E), suggesting that this SD reflected stigma and embryo sac effects. In the (3E)F2 population, the skew direction was skewed towards 3-79 homozygotes, implying that zygotic selection might contribute to this SD, i.e., 3-79 homozygotes were preferred in the zygotic embryo stage.
SDL18.2 was detected only in the (3E)F2 population, suggesting that this SD resulted from zygotic selection. However, this locus was not distorted in the (E3)F2 population, indicating that nucleocytoplasmic interactions could affect this SD; namely, this SD only occurred in embryo sacs with 3-79 cytoplasm. The direction was skewed towards 3-79 homozygotes in the (E3)3 population, suggesting that the 3-79 homozygote was preferred in the zygotic embryo stages under competition.
SDL18.3 was also distorted in the female-segregating backcross populations, (E3)3 and (3E)E, and the male-segregating backcross population, 3(3E), suggesting that this SD might result from zygotic selection. However, SDL18.3 was not distorted in the other five backcross populations, indicating that nucleocytoplasmic interactions could affect this SD. The direction was skewed towards homozygotes in these three populations, suggesting that homozygotes were preferred under competition.
SDL18.4 was detected only in one backcross female-segregating population, (E3)3, and was not distorted in the reciprocal male-segregating backcross population, 3(E3), implying that this SD resulted from female gametic selection. However, this locus was not distorted in the female-segregating population, (3E)3, indicating that nucleocytoplasmic interactions could affect this SD; namely, this SD only occurred in the embryo sacs with Emian22 cytoplasm. The direction was skewed towards homozygotes in the (E3)3 population, suggesting that female gametes containing the 3-79 allele were preferred under prezygotic competition.
SDL18.5 and SDL18.6 were only distorted in (3E)F2 population and not in all the backcross populations, implying that this SD was resulted from zygotic selection. Furthermore, this locus was not distorted in the reciprocal (E3)F2 population, indicating that the maternal environment could affect this SD; namely, this SD only occurred in the F1 plants having 3-79 cytoplasm.
SDL18.7 was distorted in both F2 populations, but was not distorted in all the backcross populations, implying that this SD resulted from zygotic selection. Furthermore, the direction was skewed towards heterozygotes, suggesting the preference of this genotype in the zygotic embryo stage under competition.
SDL18.8 was detected in all the backcross and F2 populations, implying that this SD resulted from zygotic selection. The direction was skewed towards heterozygotes in these populations, suggesting that heterozygotes were preferred under competition, and consequently, zygotic selection, such as the differentiation of zygote viability or heterosis, may be the genetic mechanism for the observed SD.
SDL18.9 was distorted in only one backcross male-segregating population, 3(E3), but was not distorted in the reciprocal female-segregating backcross population, (E3)3, and F2 populations, implying that this SD resulted from male gametic selection. In addition, this locus was not distorted in the male-segregating population, 3(3E), indicating that nucleocytoplasmic interactions could affect this SD; namely, this SD only occured in the pollen mother cells with Emian22 cytoplasm. The direction was skewed towards homozygotes in the 3(E3) population, suggesting that pollens containing the 3-79 allele were preferred under competition compared with pollens containing the Emian22 allele.
SDL18.10 was coincidentally distorted in the two F2 populations but was not distorted in all the backcross populations, implying that this SD resulted from zygotic selection. In addition, the direction was skewed towards heterozygote, suggesting that the heterozygote was preferred in the zygotic phase.
SDL18.11 was detected only in one of the backcross female-segregating populations, (3E)E, and was not distorted in the reciprocal male-segregating backcross population, E(3E), and F2 populations. These results indicated that female gametic competition, resulting in the preferential fertilization or abortion of gametes or zygotes, was the main factor influencing this SD. In addition, this locus was not distorted in the female-segregating population, (E3)E, indicating that nucleocytoplasmic interactions could affect this SD; namely, this SD only occurred in the embryo sacs with 3-79 cytoplasm. The direction was skewed towards homozygotes in the (3E)E population, suggesting that female gametes containing the Emian22 allele were preferred to female gametes containing the 3-79 allele under competition.
To assess the gametic transmission in the progeny resulting from the interspecific hybridization between the two parents, we examined the genotypes of the 337 introgression lines developed through the continuous crossing of the (E22/3-79)F1s with Emian22 as the female and the 515 markers used for assisted selection (Li, 2013). Only SDL18.8 was detected in one introgression line (#M219, BC7F3), and the genotype remained heterozygote (Supplementary Figure S1), although this line had been self-pollinated three times. The results indicated that SDL18.8 was heterozygously transmitted, and the heterozygote indeed has a competitive advantage.
Cytoplasmic Effects on SD
The cross design in the present study enabled us to determine whether SDL were dependent on the cytoplasmic environment. SDL18.2, SDL18.4, SDL18.5, SDL18.6, SDL18.9, and SDL18.11 were distorted in the (3E)F2, (E3)3, (3E)F2, (3E)F2, 3(E3), and (3E)E populations, respectively. However, these loci were not distorted in their corresponding mutual backcross populations, (E3)F2, (3E)3, (E3)F2, (E3)F2, 3(3E), and (E3)E, respectively, suggesting that these SDL were dependent on the specific cytoplasmic environment, i.e.; the cytoplasmic environment had an important effect on these SDL. SDL18.3, SDL18.7, SDL18.8, and SDL18.10 were simultaneously distorted in the male and female segregating backcross populations, indicating that these SDL were independent on the cytoplasmic environment.
Characterization of Genes in the SDL
Owing to the recently published tetraploid cotton genomes, we identified the genes in the SDL. For the 11 SDL on chromosome 18, the genomic locations were determined in the cotton genome after mapping the sequences of the adjacent markers. Thereafter, the genes in the regions were acquired from the cotton genome (TM-1) (Zhang et al., 2015). A total of 174 genes were identifed among these 11 SDL, and 112 genes were annotated with their predicted function and GO terms (Supplementary Table S1). The functional annotation of the genes showed a diversity of molecular functions (F) and biological processes (P).
Compared with randomly selected cotton genes, the genes in these SDL regions were significantly enriched with GO terms within the categories of carbohydrate metabolic process and gene expression (Table 3). Importantly, terms related to glycometabolism, including fructose-bisphosphate aldolase activity (GO:0004332), aldehyde-lyase activity (GO:0016832), glycolysis (GO:0006096), and catabolic process (GO:0009056) were also identified.
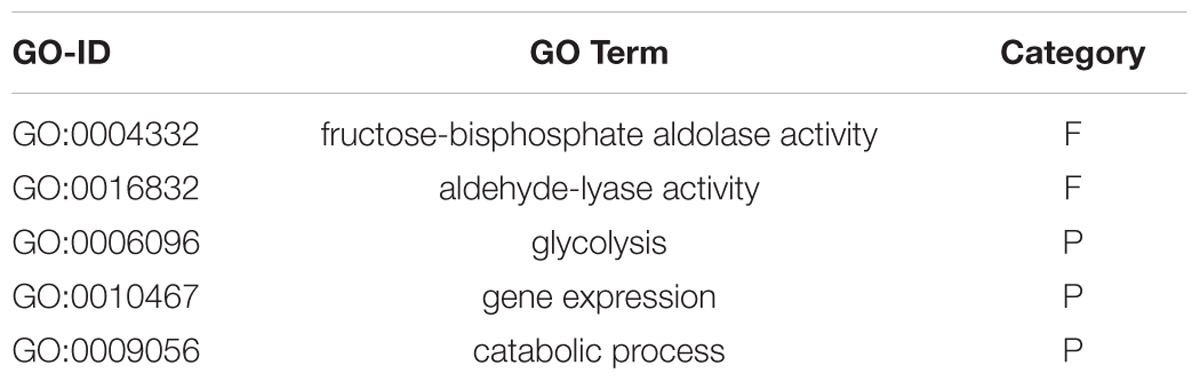
TABLE 3. Gene ontology (GO) enrichment analysis of the genes in the eleven SDL (p-value < 0.01).
Discussion
With the development of molecular markers, SD has been widely reported in several plant species, particularly in interspecific crosses for genetic mapping, such as rice (Shanmugavadivel et al., 2013), wheat (Takumi et al., 2013; Adamski et al., 2014), chickpea (Ravikumar et al., 2013), Arabidopsis (Leppala et al., 2013), coffee (Gartner et al., 2013), soybean (Baumbach et al., 2012), potato (Manrique-Carpintero et al., 2016), Brassica rapa (Kitashiba et al., 2016), and Populus deltoids (Zhou et al., 2015). SD has previously been reported in interspecific populations of cotton (Guo et al., 2007; Blenda et al., 2012; Byers et al., 2012; Liang et al., 2012; Yu et al., 2013; Diouf et al., 2014; Zhang et al., 2014; Li et al., 2016), intraspecific populations of G. barbadense (Wang et al., 2013), intraspecific populations of G. hirsutum (Lin et al., 2009; Zhang et al., 2012, 2016; Ning et al., 2014), and intraspecific populations of G. arboreum (Li et al., 2007); however, the genetic mechanism of SD in cotton remains unclear.
Considering evolutionary biology, SD is a selection mechanism that may occur in any stage of the life history, including the gametophyte and zygote. In a backcross population with the F1 hybrid serving as the male parent, we can rule out female gametic-specific mechanisms from the male/zygotic mechanisms for SD. However, in a backcross population in which the F1 hybrid served as the female parent, we can rule out male gametic-specific mechanisms from the female/zygotic mechanisms for SD (Fishman et al., 2008). In the present study, we developed ten populations to dissect the effects of gametophytic and zygotic selection on chromosome 18 in cotton. Eleven SDL were detected in the ten populations, among which, SDL18.1 and SDL18.9 resulted from male gametic competition, and SDL18.4 and SDL18.11 resulted from female gametic selection. The other SDL likely reflected zygotic selection. These results provided a better understanding of the putative mechanism of SD, which has been reported in many plant species (Anhalt et al., 2008; Fishman et al., 2008; Cai et al., 2011; Castro et al., 2011; Diouf and Mergeai, 2012; Tang et al., 2013).
Several agronomic traits related QTL were mapped on cotton chromosome 18, such as fiber strength (qFS-C18-1), uniformity (qFU-C18-1), micronaire (qFMi-C18-1), maturity (qFMa-C18-1), lint weight (qLW-C18-1), seed index (qSI-C18-1), lint percentage (qLP-C18-1), and bud opening (Fu et al., 2013). Moreover, the genic male-sterile genes, ms5, ms6, and ms15, were mapped on chromosomes 12, 26, and 12 in cotton, respectively (Chen et al., 2009). However, no locus related to gametic competition and zygotic selection has been reported on chromosome 18. According to the results of the present study, a total of eleven SDL were detected on chromosome 18. In maize, the SDRs were examined to locate gametophyte genes (Yan et al., 2003). The results indicated several gametophyte genes on chromosome 18. A total of 112 annotated genes were predicted in these 11 SDL after blasting to tetraploid cotton genome sequences (Zhang et al., 2015). GO enrichment analysis showed that a number of the terms were related to glycometabolism, including the pathway of fructose-bisphosphate aldolase activity (GO:0004332), etc. These results indicated that these complicated glycometabolism pathways may contribute to the SD on cotton chromosome 18.
Cytoplasmic effects might be involved in the viability selection of gametes and zygotes because cytoplasm provides an environment for nuclear gene expression and cellular metabolic reactions. Tang et al. (2013) showed that the maternal cytoplasmic environment might be involved in the viability selection of gametes and zygotes resulting from dramatic changes in the genotypic frequencies of the SDL in the two reciprocal cross populations. In the present study, six out of eleven SDL on chromosome 18 were dependent on the cytoplasmic environment, but other SDL were not. These results indicated that the SDL on different locus had different reactions to the cytoplasmic environment.
To broaden the genetic base of G. hirsutum germplasm for genetic improvement, interspecific hybridization and introgression between G. hirsutum and G. barbadense were extensively employed. However, few successes have been reported, primarily reflecting genetic barriers between the two species, including accumulated gene mutations and gene order rearrangements, particularly SD (Zhang et al., 2014). The success of the breeding programs between the two species is highly dependent on understanding the genetic mechanisms of SD, providing guidance for the selection of a suitable female parent, and marker-assisted selection for SDL will avoid the loss of the desired traits (Li et al., 2010). Hence, further studies are needed to increase the current understanding of the genetic molecular mechanisms related to SDL, which would be useful for breeding programs.
Author Contributions
BD genotyped the molecular markers, analyzed the genetic data and drafted the manuscript. HG, CH, and MA genotyped molecular markers and generated the figures. ZL designed the study and supervised the experiments and analyses. All authors read and approved the final manuscript.
Conflict of Interest Statement
The authors declare that the research was conducted in the absence of any commercial or financial relationships that could be construed as a potential conflict of interest.
Acknowledgment
This work was financially supported through a grant form the National Science Foundation of China (No. 31171593).
Supplementary Material
The Supplementary Material for this article can be found online at: http://journal.frontiersin.org/article/10.3389/fpls.2016.02037/full#supplementary-material
Footnotes
References
Adamski, T., Krystkowiak, K., Kuczynska, A., Mikolajczak, K., Ogrodowicz, P., Ponitka, A., et al. (2014). Segregation distortion in homozygous lines obtained via anther culture and maize doubled haploid methods in comparison to single seed descent in wheat (Triticum aestivum L.). Electron. J. Biotechnol. 17, 6–13. doi: 10.1016/j.ejbt.2013.12.002
Altschul, S. F., Gish, W., Miller, W., Myers, E. W., and Lipman, D. J. (1990). Basic local alignment search tool. J. Mol. Biol. 215, 403–410. doi: 10.1016/S0022-2836(05)80360-2
Anhalt, U. C. M., Heslop-Harrison, P., Byrne, S., Guillard, A., and Barth, S. (2008). Segregation distortion in Lolium: evidence for genetic effects. Theor. Appl. Genet. 117, 297–306. doi: 10.1007/s00122-008-0774-7
Baumbach, J., Rogers, J. P., Slattery, R. A., Narayanan, N. N., Xu, M., Palmer, R. G., et al. (2012). Segregation distortion in a region containing a male-sterility, female-sterility locus in soybean. Plant Sci. 195, 151–156. doi: 10.1016/j.plantsci.2012.07.003
Blenda, A., Fang, D. D., Rami, J. F., Garsmeur, O., Luo, F., and Lacape, J. M. (2012). A high density consensus genetic map of tetraploid cotton that integrates multiple component maps through molecular marker redundancy check. PLoS ONE 7:e45739. doi: 10.1371/journal.pone.0045739
Byers, R. L., Harker, D. B., Yourstone, S. M., Maughan, P. J., and Udall, J. A. (2012). Development and mapping of SNP assays in allotetraploid cotton. Theor. Appl. Genet. 124, 1201–1214. doi: 10.1007/s00122-011-1780-8
Cai, J., Zhang, X., Wang, B., Yan, M., Qi, Y., and Kong, L. (2011). A genetic analysis of segregation distortion revealed by molecular markers in Lophopyrum ponticum chromosome 7E. J. Genet. 90, 373–376. doi: 10.1007/s12041-011-0084-8
Casellas, J., Gularte, R. J., Farber, C. R., Varona, L., Mehrabian, M., Schadt, E. E., et al. (2012). Genome scans for transmission ratio distortion regions in mice. Genetics 191, 247–259. doi: 10.1534/genetics.111.135988
Castro, P., Rubio, J., Cabrera, A., Millan, T., and Gil, J. (2011). A segregation distortion locus located on linkage group 4 of the chickpea genetic map. Euphytica 179, 515–523. doi: 10.1007/s10681-011-0356-7
Chen, D., Ding, Y., Guo, W., and Zhang, T. (2009). Molecular mapping of genic male-sterile genes ms15,ms5 and ms6 in tetraploid cotton. Plant Breed. 128, 193–198. doi: 10.1111/j.1439-0523.2008.01562.x
Conesa, A., Gotz, S., Garcia-Gomez, J. M., Terol, J., Talon, M., and Robles, M. (2005). Blast2GO: a universal tool for annotation, visualization and analysis in functional genomics research. Bioinformatics 21, 3674–3676. doi: 10.1093/bioinformatics/bti610
Diouf, F., Benbouza, H., Nacoulima, N., Ndir, K., Konan, O., and Mergeai, G. (2014). Segregation distortions in an interspecific cotton population issued from the [(Gossypium hirsutum × G. raimondii) 2 × G. sturtianum] Hybrid. Tropicultura 32, 73–79.
Diouf, F. B. H., and Mergeai, G. (2012). Segregation distortions and their consequences for plant breeding. Biotechnol. Agron. Soc. Environ. 16, 499–508. doi: 10.1186/1471-2229-10-65
Eversley, C. D., Clark, T., Xie, Y., Steigerwalt, J., Bell, T. A., De Villena, F. P. M., et al. (2010). Genetic mapping and developmental timing of transmission ratio distortion in a mouse interspecific backcross. BMC Genet. 11:98. doi: 10.1186/1471-2156-11-98
Fishman, L., Aagaard, J., and Tuthill, J. C. (2008). Toward the evolutionary genomics of gametophytic divergence: patterns of transmission ratio distortion in monkeyflower (Mimulus) hybrids reveal a complex genetic basis for conspecific pollen precedence. Evolution 62, 2958–2970. doi: 10.1111/j.1558-5646.2008.00475.x
Fu, Y., Yuan, D. D., Hu, W. J., Cai, C. P., and Guo, W. Z. (2013). Development of Gossypium barbadense chromosome 18 segment substitution lines in the genetic standard line TM-1 of Gossypium hirsutum and mapping of QTLs related to agronomic traits. Acta Agron. Sin. 21–28. doi: 10.3724/SP.J.1006.2013.00021
Gartner, G. L., Mccouch, S. R., and Moncada, M. D. P. (2013). A genetic map of an interspecific diploid pseudo testcross population of coffee. Euphytica 192, 305–323. doi: 10.1007/s10681-013-0926-y
Guo, W., Cai, C., Wang, C., Han, Z., Song, X., Wang, K., et al. (2007). A microsatellite-based, gene-rich linkage map reveals genome structure, function and evolution in Gossypium. Genetics 176, 527–541. doi: 10.1534/genetics.107.070375
Hulse-Kemp, A. M., Lemm, J., Plieske, J., Ashrafi, H., Buyyarapu, R., Fang, D. D., et al. (2015). Development of a 63k SNP array for cotton and high-density mapping of intraspecific and interspecific populations of Gossypium spp. G3 5, 1187–1209. doi: 10.1534/g3.115.018416
Kitashiba, H., Taguchi, K., Kaneko, I., Inaba, K., Yokoi, S., Takahata, Y., et al. (2016). Identification of loci associated with embryo yield in microspore culture of Brassica rapa by segregation distortion analysis. Plant Cell Rep. 35, 2197–2204. doi: 10.1007/s00299-016-2029-4
Koide, Y., Shinya, Y., Ikenaga, M., Sawamura, N., Matsubara, K., Onishi, K., et al. (2012). Complex genetic nature of sex-independent transmission ratio distortion in Asian rice species: the involvement of unlinked modifiers and sex-specific mechanisms. Heredity 108, 242–247. doi: 10.1038/hdy.2011.64
Larracuente, A. M., and Presgraves, D. C. (2012). The selfish segregation distorter gene complex of Drosophila melanogaster. Genetics 192, 33–53. doi: 10.1534/genetics.112.141390
Leppala, J., Bokma, F., and Savolainen, O. (2013). Investigating incipient speciation in Arabidopsis lyrata from patterns of transmission ratio distortion. Genetics 194, 697–708. doi: 10.1534/genetics.113.152561
Li, H. B., Kilian, A., Zhou, M. X., Wenzl, P., Huttner, E., Mendham, N., et al. (2010). Construction of a high-density composite map and comparative mapping of segregation distortion regions in barley. Mol. Genet. Genomics 284, 319–331. doi: 10.1007/s00438-010-0570-3
Li, W., Lin, Z., and Zhang, X. (2007). A novel segregation distortion in intraspecific population of Asian cotton (Gossypium arboretum L.) detected by molecular markers. J. Genet. Genomics 34, 634–640. doi: 10.1016/S1673-8527(07)60072-1
Li, X., Jin, X., Wang, H., Zhang, X., and Lin, Z. (2016). Structure, evolution, and comparative genomics of tetraploid cotton based on a high-density genetic linkage map. DNA Res. 23, 283–293. doi: 10.1093/dnares/dsw016
Li, X. H., Wang, X. J., Wei, Y. L., and Brummer, E. C. (2011). Prevalence of segregation distortion in diploid alfalfa and its implications for genetics and breeding applications. Theor. Appl. Genet. 123, 667–679. doi: 10.1007/s00122-011-1617-5
Li, X. M. (2013). Construction of Introgression Lines, Development of New Markers, and Construction of High-Density Genetic Linkage Map in Cotton. Master’s thesis, Huazhong Agricultural University, Wuhan.
Liang, Z., Lv, Y. D., Cai, C. P., Tong, X. C., Chen, X. D., Zhang, W., et al. (2012). Toward allotetraploid cotton genome assembly: integration of a high-density molecular genetic linkage map with DNA sequence information. BMC Genomics 13:539. doi: 10.1186/1471-2164-13-539
Lin, Z., He, D., Zhang, X., Nie, Y., Guo, X., Feng, C., et al. (2005). Linkage map construction and mapping QTL for cotton fibre quality using SRAP, SSR and RAPD. Plant Breed. 124, 180–187. doi: 10.1111/j.1439-0523.2004.01039.x
Lin, Z., Zhang, Y., Zhang, X., and Guo, X. (2009). A high-density integrative linkage map for Gossypium hirsutum. Euphytica 166, 35–45. doi: 10.1534/g3.115.018416
Lu, H., Romero-Severson, J., and Bernardo, R. (2002). Chromosomal regions associated with segregation distortion in maize. Theor. Appl. Genet. 105, 622–628. doi: 10.1007/s00122-002-0970-9
Luo, L., and Xu, S. (2003). Mapping viability loci using molecular markers. Heredity 90, 459–467. doi: 10.1038/sj.hdy.6800264
Luo, L., Zhang, Y. M., and Xu, S. (2005). A quantitative genetics model for viability selection. Heredity 94, 347–355. doi: 10.1038/sj.hdy.6800615
Manrique-Carpintero, N. C., Coombs, J. J., Veilleux, R. E., Buell, C. R., and Douches, D. S. (2016). Comparative analysis of regions with distorted segregation in three diploid populations of potato. G3 6, 2617–2628. doi: 10.1534/g3.116.030031
McDermott, S. R., and Noor, M. A. (2012). Mapping of within-species segregation distortion in Drosophila persimilis and hybrid sterility between D. persimilis and D. pseudoobscura. J. Evol. Biol. 25, 2023–2032. doi: 10.1111/j.1420-9101.2012.02581.x
McDermott, S. R., and Noor, M. A. F. (2010). The role of meiotic drive in hybrid male sterility. Philos. Trans. R. Soc. B Biol. Sci. 365, 1265–1272. doi: 10.1098/rstb.2009.0264
Ning, Z. Y., Chen, H., Mei, H. X., and Zhang, T. Z. (2014). Molecular tagging of QTLs for fiber quality and yield in the upland cotton cultivar Acala-Prema. Euphytica 195, 143–156. doi: 10.1007/s10681-013-0990-3
Paterson, A. H., Brubaker, C. L., and Wendel, J. F. (1993). A rapid method for extraction of cotton (Gossypium spp.) genomic DNA suitable for RFLP or PCR analysis. Plant Mol. Biol. Rep. 11, 122–127. doi: 10.1007/BF02670470
Phadnis, N., and Orr, H. A. (2009). A single gene causes both male sterility and segregation distortion in Drosophila hybrids. Science 323, 376–379. doi: 10.1126/science.1163934
Pritchard, V. L., Dimond, L., Harrison, J. S., Velazquez, C. C. S., Zieba, J. T., Burton, R. S., et al. (2011). Interpopulation hybridization results in widespread viability selection across the genome in Tigriopus californicus. BMC Genet. 12:54. doi: 10.1186/1471-2156-12-54
Ravikumar, R. L., Chaitra, G. N., Choukimath, A. M., and Soregaon, C. D. (2013). Gametophytic selection for wilt resistance and its impact on the segregation of wilt resistance alleles in chickpea (Cicer arietinum L.). Euphytica 189, 173–181. doi: 10.1007/s10681-012-0745-6
Reflinur, Kim, B., Jang, S. M., Chu, S. H., Bordiya, Y., Akter, M. B., et al. (2014). Analysis of segregation distortion and its relationship to hybrid barriers in rice. Rice 7:3. doi: 10.1186/s12284-014-0003-8
Sandler, L., and Novitski, E. (1957). Meiotic drive as an evolutionary force. Am. Nat. 91, 105–110. doi: 10.1086/281969
Shanmugavadivel, P. S., Mithra, S. V. A., Dokku, P., Kumar, K. A. R., Rao, G. J. N., Singh, V. P., et al. (2013). Mapping quantitative trait loci (QTL) for grain size in rice using a RIL population from Basmati × indica cross showing high segregation distortion. Euphytica 194, 401–416. doi: 10.1007/s10681-013-0964-5
Shin, D., Mori, A., and Severson, D. W. (2012). Genetic mapping a meiotic driver that causes sex ratio distortion in the Mosquito Aedes aegypti. J. Hered. 103, 303–307. doi: 10.1093/jhered/esr134
Takumi, S., Motomura, Y., Iehisa, J. C. M., and Kobayashi, F. (2013). Segregation distortion caused by weak hybrid necrosis in recombinant inbred lines of common wheat. Genetica 141, 463–470. doi: 10.1007/s10709-013-9745-2
Tang, Z. X., Wang, X. F., Zhang, M. Z., Zhang, Y. H., Deng, D. X., and Xu, C. W. (2013). The maternal cytoplasmic environment may be involved in the viability selection of gametes and zygotes. Heredity 110, 331–337. doi: 10.1038/hdy.2012.89
Wang, X., Yu, Y., Sang, J., Wu, Q., Zhang, X., and Lin, Z. (2013). Intraspecific linkage map construction and QTL mapping of yield and fiber quality of Gossypium babrdense. Aust. J. Crop Sci. 7, 1252–1261.
Xu, P., Zhou, J. W., Li, J., Hu, F. Y., Deng, X. N., Feng, S. F., et al. (2014). Mapping three new interspecific hybrid sterile loci between Oryza sativa and O. glaberrima. Breed. Sci. 63, 476–482. doi: 10.1270/jsbbs.63.476
Xu, S., and Hu, Z. (2009). Mapping quantitative trait Loci using distorted markers. Int. J. Plant Genomics 2009:410825. doi: 10.1155/2009/410825
Xu, X., Li, L., Dong, X., Jin, W., Melchinger, A. E., and Chen, S. (2013). Gametophytic and zygotic selection leads to segregation distortion through in vivo induction of a maternal haploid in maize. J. Exp. Bot. 64, 1083–1096. doi: 10.1093/jxb/ers393
Yan, J. B., Tang, H., Huang, Y. Q., Zheng, Y. L., and Li, J. S. (2003). Genetic analysis of segregation distortion of molecular markers in maize F2 population. J. Genet. Genomics 30, 913–918.
Yang, J. Y., Zhao, X. B., Cheng, K., Du, H. Y., Ouyang, Y. D., Chen, J. J., et al. (2012). A killer-protector system regulates both hybrid sterility and segregation distortion in rice. Science 337, 1336–1340. doi: 10.1126/science.1223702
Yu, J., Jung, S., Cheng, C. H., Ficklin, S. P., Lee, T., Zheng, P., et al. (2014). CottonGen: a genomics, genetics and breeding database for cotton research. Nucleic Acids Res. 42, D1229–D1236. doi: 10.1093/nar/gkt1064
Yu, J., Zhang, K., Li, S., Yu, S., Zhai, H., Wu, M., et al. (2013). Mapping quantitative trait loci for lint yield and fiber quality across environments in a Gossypium hirsutum × Gossypium barbadense backcross inbred line population. Theor. Appl. Genet. 126, 275–287. doi: 10.1007/s00122-012-1980-x
Yu, Y., Yuan, D. J., Liang, S. G., Li, X. M., Wang, X. Q., Lin, Z. X., et al. (2011). Genome structure of cotton revealed by a genome-wide SSR genetic map constructed from a BC1 population between Gossypium hirsutum and G. barbadense. BMC Genomics 12:15. doi: 10.1186/1471-2164-12-15
Zhang, J., Percy, R. G., and Mccarty, J. C. Jr. (2014). Introgression genetics and breeding between Upland and Pima cotton: a review. Euphytica 198, 1–12. doi: 10.1007/s10681-014-1094-4
Zhang, K., Zhang, J., Ma, J., Tang, S., Liu, D., Teng, Z., et al. (2012). Genetic mapping and quantitative trait locus analysis of fiber quality traits using a three-parent composite population in upland cotton (Gossypium hirsutum L.). Mol. Breed. 29, 335–348. doi: 10.1007/s11032-011-9549-y
Zhang, T., Hu, Y., Jiang, W., Fang, L., Guan, X., Chen, J., et al. (2015). Sequencing of allotetraploid cotton (Gossypium hirsutum L. acc. TM-1) provides a resource for fiber improvement. Nat. Biotechnol. 33, 531–537. doi: 10.1038/nbt.3207
Zhang, Z., Shang, H., Shi, Y., Huang, L., Li, J., Ge, Q., et al. (2016). Construction of a high-density genetic map by specific locus amplified fragment sequencing (SLAF-seq) and its application to quantitative trait loci (QTL) analysis for boll weight in upland cotton (Gossypium hirsutum.). BMC Plant Biol. 16:79. doi: 10.1186/s12870-016-0741-4
Zhou, W. C., Tang, Z. X., Hou, J., Hu, N., and Yin, T. M. (2015). Genetic map construction and detection of genetic loci underlying segregation distortion in an intraspecific cross of Populus deltoides. PLoS ONE 10:e0126077. doi: 10.1371/journal.pone.0126077
Keywords: cotton, segregation distortion, gametic competition, zygotic selection, maternal effect
Citation: Dai B, Guo H, Huang C, Ahmed MM and Lin Z (2017) Identification and Characterization of Segregation Distortion Loci on Cotton Chromosome 18. Front. Plant Sci. 7:2037. doi: 10.3389/fpls.2016.02037
Received: 23 June 2016; Accepted: 20 December 2016;
Published: 12 January 2017.
Edited by:
Daniel Pinero, National Autonomous University of Mexico, MexicoReviewed by:
Ing-Feng Chang, National Taiwan University, TaiwanMehboob-ur- Rahman, National Institute for Biotechnology and Genetic Engineering, Pakistan
Copyright © 2017 Dai, Guo, Huang, Ahmed and Lin. This is an open-access article distributed under the terms of the Creative Commons Attribution License (CC BY). The use, distribution or reproduction in other forums is permitted, provided the original author(s) or licensor are credited and that the original publication in this journal is cited, in accordance with accepted academic practice. No use, distribution or reproduction is permitted which does not comply with these terms.
*Correspondence: Zhongxu Lin, bGluemhvbmd4dUBtYWlsLmh6YXUuZWR1LmNu