 Kun Lu1*†
 Liu Peng1,2†Chao Zhang1,3Junhua Lu1Bo Yang1Zhongchun Xiao1Ying Liang1
 Xingfu Xu1
 Cunmin Qu1
 Kai Zhang1
 Liezhao Liu1Qinlong Zhu4Minglian Fu5Xiaoyan Yuan5
 Jiana Li1*
- 1College of Agronomy and Biotechnology, Southwest University, Chongqing, China
- 2School of Management, Xihua University, Chengdu, China
- 3Oil Research Institute of Guizhou Province, Guizhou Academy of Agricultural Sciences, Guiyang, China
- 4College of Life Sciences, South China Agricultural University, Guangzhou, China
- 5Industrial Crops Institute, Yunnan Academy of Agricultural Sciences, Kunming, China
Yield is one of the most important yet complex crop traits. To improve our understanding of the genetic basis of yield establishment, and to identify candidate genes responsible for yield improvement in Brassica napus, we performed genome-wide association studies (GWAS) for seven yield-determining traits [main inflorescence pod number (MIPN), branch pod number (BPN), pod number per plant (PNP), seed number per pod (SPP), thousand seed weight, main inflorescence yield (MIY), and branch yield], using data from 520 diverse B. napus accessions from two different yield environments. In total, we detected 128 significant single nucleotide polymorphisms (SNPs), 93 of which were revealed as novel by integrative analysis. A combination of GWAS and transcriptome sequencing on 21 haplotype blocks from samples pooled by four extremely high-yielding or low-yielding accessions revealed the differential expression of 14 crucial candiate genes (such as Bna.MYB83, Bna.SPL5, and Bna.ROP3) associated with multiple traits or containing multiple SNPs associated with the same trait. Functional annotation and expression pattern analyses further demonstrated that these 14 candiate genes might be important in developmental processes and biomass accumulation, thus affecting the yield establishment of B. napus. These results provide valuable information for understanding the genetic mechanisms underlying the establishment of high yield in B. napus, and lay the foundation for developing high-yielding B. napus varieties.
Introduction
Yield is one of the most complex and important crop traits (Shi et al., 2009). An end product of the interaction between genotypes and the environment during the course of crop growth and development. Yield is determined by the yield-determining traits (YDTs), including direct effects of yield component traits (YCTs) and indirect effects of yield-related traits (YRTs), which have been validated in different crops (Yin et al., 2002; Liu et al., 2008; Cai et al., 2014). As the second largest oilseed crop in the world, Brassica napus (rapeseed, oilseed rape or canola) was formed from recursive and independent hybridizations between Brassica rapa (A genome) and Brassica oleracea (C genome) diploid species. For B. napus, seed yield (SY) is mainly determined by three YCTs: silique number (SN), seed number per silique (SPS), and thousand seed weight (TSW; Özer et al., 1999). YRTs such as plant height (PH), first branch height (FBH), inflorescence length (IL), silique length (SL), seed density (SD), silique breadth (SB), silique thickness (ST), and silique volume (SV) also influence SY by affecting the YCTs in B. napus (Quijada et al., 2006; Chen et al., 2007; Shi et al., 2009; Cai et al., 2014; Wang X. et al., 2016). Therefore, investigating the genetic basis of YDTs will improve our understanding of yield establishment in B. napus, and may be used in high-yield B. napus breeding programs.
Quantitative trait locus (QTL) mapping based on molecular markers is widely used to genetically analyze agronomically important traits in B. napus (Quijada et al., 2006; Udall et al., 2006; Chen et al., 2007, 2011; Shi et al., 2009; Yan et al., 2009; Yang et al., 2011; Ding et al., 2012). Recently, QTL mapping studies have shed light on the genetic architecture of YDTs in B. napus, and so far, hundreds of QTLs have been identified to have significant associations with YDTs in different bi-parental populations (Zhao et al., 2016). Li et al. (2007) constructed a genetic linkage map using an F2 population, and identified 133 QTLs for 12 yield traits (including SN, TSW and SPS, etc.), including 14 consistent ones across the two trail locations. They also found that most of the QTLs were clustered, especially on linkage groups (LGs) N2 and N7. Radoev et al. (2008), employing a doubled-haploid (DH) lines and their corresponding testcrosses at four locations, identified 33 QTLs for SY and three YCTs, of which 10 showed significant dominance effects. Shi et al. (2009) identified 85 QTLs for SY along with 785 QTLs for eight yield-associated traits (such as seed-number, seed-weight, biomass-yield, etc.) based on the analysis of two (TNDH and RC-F2) populations in 10 natural environments. Yang et al. (2012) identified a major QTL (cqSWA9) for SL and seed weight (SW), in two environments, which explained as much as 28.2% of the total SW variation. And this QTL was validated by Fu et al. (2015) in another DH and DH-derived reconstructed F2 populations. By fine mapping and association analysis, Liu et al. (2015) cloned the first QTL in polyploidy crops at the same region, and revealed that a 165-bp deletion in auxin-response factor 18 (ARF18) is associated with increased SW and SL.
Recently, these QTLs have been further integrated into consensus QTLs according to high-density consensus linkage maps constructed from different studies, using meta-analysis method. Zhou et al. (2014) carried out in silico integration of 1960 QTLs associated with 13 SY and YRTs from 15 B. napus mapping studies, and mapped 736 QTLs onto 283 loci in the A and C genomes of B. napus. Zhao et al. (2016) constructed a high-density consensus map and integrated 226 QTLs for SY and YRTs into 144 consensus QTLs, which was further integrated into 72 pleiotropic unique QTLs by trait-by-trait meta-analysis. Several candidate genes controlling YDTs in the consensus QTL regions were also observed based on comparative mapping among Arabidopsis, B. rapa, B. oleracea, and B. napus, including five each for SY (GASA4, CLH1, RBCS1A, LQY1, and GGH1) and TSW (PTH2, AP2, LCR64, LCR65, and PDF1; Zhao et al., 2016). However, the majority of consensus QTLs were environment specific, 70.8 and 23.6% of QTLs were only detected in winter and spring regions, respectively. Only a few QTLs (5.6%) were detected in both regions (Zhao et al., 2016), which present a barrier to apply QTLs associated with YDTs to marker-based breeding efforts aimed at developing high-yield B. napus varieties.
Genome-wide association studies (GWAS) were used first to identify loci associated with complex human diseases (Donnelly, 2008). With improvements in sequencing technologies, and the reduction in the cost of sequencing and genotyping, this method is widely applied to unravel complex quantitative traits in many crops, especially those for which genome sequences are available (Clark, 2010; Huang et al., 2010; Tian et al., 2010; Huang and Han, 2014; Zhou et al., 2015). The recent release of the genome sequences for B. napus and its parental species B. rapa and B. oleracea (Wang et al., 2011; Chalhoub et al., 2014; Liu et al., 2014; Parkin et al., 2014), and the development of high-density customized single nucleotide polymorphism (SNP) arrays (i.e., the Brassica 60K Illumina Infinium SNP array, and the B. napus 6K Illumina Infinium SNP array) provided the Brassica scientific community with powerful tools for unraveling the genetic architecture of important traits and identifying the loci and candidate genes underlying traits of interest in Brassica crops (Li et al., 2014; Körber et al., 2016). Based on Brassica 60 K SNP array, 9 and 312 SNPs have been identified to be significantly associated with harvest index and flowering time in B. napus, respectively (Luo et al., 2015; Xu et al., 2015; Wang N. et al., 2016). In addition, a total of 50, 25, and 8 loci were detected to be associated with seed oil content, branch angle and PH in different B. napus natural populations, respectively (Li F. et al., 2016; Liu J. et al., 2016; Liu S. et al., 2016; Sun et al., 2016). For SY and YDTs, Schiessl et al. performed a GWAS with a 60 K SNP array for a panel of 158 European winter-type accessions grown in highly diverse field environments, and identified 36 genome regions associating with SY in B. napus (Schiessl et al., 2015). Cai et al. conducted a GWAS for 6 YDTs and detected 7 and 9 associated markers for SPS and TSW using a panel of 192 inbred lines of B. napus, which was genotyped using 451 single-locus microsatellite markers and 740 amplified fragment length polymorphism markers (Cai et al., 2014). However, GWAS has not yet been used to systematically and separately elucidate the genetic basis of YDTs on the main inflorescence and branches of B. napus.
To extend our knowledge of the genetic control of YDTs, and to identify candidate genes to improve B. napus yield, we conducted GWAS on an association panel of 520 B. napus accessions grown in two different yield conditions. Yunnan (YN) was chosen to represent a typical high-yielding Chinese production region, with average yields of over 5.3 tons per hectare, and Chongqing (CQ) was chosen to represent a standard production region, with an average yield of about 2.7 tons per hectare (Zhang et al., 2012; Cai et al., 2016; Lu et al., 2016). We also sequenced the transcriptomes of eight tissues from high-yield and low-yield B. napus accessions from the two aforementioned regions. Finally, differentially expressed candidate genes were selected from haplotype blocks (HBs) of significant loci affecting the YDTs. These results provide insight into the genetic basis underlying the establishment of high yield in B. napus, and lay the foundation for marker-based breeding efforts to develop high-yield varieties.
Materials and Methods
Plant Materials and Field Trails
Detailed information on the 520 diverse B. napus accessions and genotypes are described in our previous study (Lu et al., 2016). All B. napus accessions were grown in a randomized block design with three replications in three natural environments at two locations. The three natural environments were E1 (Chongqing, CQ; 29°45′ N, 106° 22′ E, 238.57 m) in the 2012–13 growing seasons, and E2 (CQ) and E3 (Yunnan, YN; 23° 43′ N, 100° 02′ E, 1819.50 m) in the 2013–14 growing season. Each accession was grown in a plot with three rows, 10 plants per row, with a distance of 20 cm between plants in each row and 30 cm between rows. Meteorological data for the two sites during cultivation are listed in Supplementary Table 1.
Measurement of Yield-Determining Traits
Using the Biologische Bundesanstalt, Bundessortenamt, and CHemical (BBCH) industry scale (Lancashire et al., 1991), five representative plants from the middle of each plot were harvested at growth stage 89 (fully ripe), and seven YDTs were measured, including main inflorescence pod number (MIPN), branch pod number (BPN), pod number per plant (PNP), seed number per pod (SPP), TSW (g), main inflorescence yield (MIY, g/plant), and branch yield (BY, g/plant). TSW was the average dry weight in grams of 1,000 well-filled seeds mixed from five sampled plants. MIPN and MIY were the number of effective pods and seed yield on the main inflorescence of each harvested individual, respectively. BPN and BY were the number of effective pods and seed yield on the secondary and tertiary branches of each harvested individual, respectively. PNP and SPP were measured as effective pod number per plant and seed number per pod, respectively. All the traits investigated in this study, and corresponding measurement method, cultivation environments and unit were summarized in the Supplementary Table 2.
A virtual environment (E4) was used to identify significant signals underlying environmental variation in YTRs. Trait value in E4 was calculated according to the following formula: 2 × (E3 − E2)/(E3 + E2).
Statistical Analysis
Descriptive statistics, analysis of variance (ANOVA) and correlation analysis of YDTs were performed using SAS version 8.0 (SAS Institute Inc.). Broad-sense heritability was calculated as:
Where: , , and are estimates of the variances of genotype, genotype × environment interactions, and error, respectively. E is the number of environments, and R is the number of replications per environment (Kowles, 2001).
The ANOVA model was as follows:
Where: yger was the phenotypic trait value of the gth genotype in the eth environment for the rth replicate, μ the grand mean, αg the effect of the gth genotype, βe the main effect of the eth environment, (αβ)ge the interaction effect of the gth genotype and the eth environment, γr(e) the block effect within the eth environment, and εger the residual (Freund and Littell, 1981). All effects were treated as random.
Genotyping, Quality Control, and Location of SNPs
The genotype of the association panel was assayed using a Brassica 60K Illumina Infinium SNP array, according to the manufacturer's protocol (Infinium HD Assay Ultra Protocol Guide; Li et al., 2014). SNP alleles were called using GenomeStudio software v2011.1 (Illumina, Inc., San Diego, CA) with the Genotyping module (v1.9.4).
Only SNPs with a percentage of missing data of <10% across all genotypes and a minor allele frequency (MAF) of >0.05 were retained. From 52,157 SNPs in the array, 20,678 SNPs were filtered, and 31,839 were analyzed further. Physical localization of SNPs was assigned using BLASTN searches against the B. napus “Darmor-bzh” reference genome version 4.1, with an E-value cut-off of 1E-5 (Altschul et al., 1997; Chalhoub et al., 2014). Only SNPs with a maximum bit-score were retained as unique SNPs, and subjected to further analysis.
Population Structure and Genome-Wide Association Mapping
The population structure (Q) matrix was generated using STRUCTURE 2.3.4 (Pritchard et al., 2000), as reported in our previous study (Lu et al., 2016). In short, three runs were performed for each number of populations (k) varying from 1 to 10, with a burn-in period of 100,000 and 1,000,000 Monte Carlo Markov Chain (MCMC) iterations. The most likely K-value was determined by the log probability of the data (LnP(D)) and delta K as proposed by previous study (Evanno et al., 2005). The relative kinship matrix (K) of the association population was calculated using TASSEL 5.2.1 (Bradbury et al., 2007). Linkage disequilibrium (LD) between pairs of SNPs on each chromosome was estimated as the correlation of allele frequencies (r2) using TASSEL 5.2.1.
Two statistical models were used to test trait–SNP associations. First, the general linear model (GLM) was used, without controlling for population structure (Q) or relative kinship (K), and containing only the SNP that was tested as a fixed effect. Second, the mixed linear model (MLM) was used, controlling for Q and K as fixed and random effects, respectively (Liu S. et al., 2016). Both the GLM and MLM were implemented in TASSEL 5.2.1.
Suggestive (1/n) and significant (0.05/n) P-value thresholds were set to control the genome-wide type 1 error rate derived from MLM and GLM, respectively (Duggal et al., 2008); n represented the effective number of independent SNPs calculated using Genetic Type I Error Calculator (GEC) software (Li et al., 2012). Due to the estimated the effective number of independent tests was 12873.97, the P-value thresholds used to identify significantly associated SNPs were set at 7.77 × 10⁻⁵ [suggestive, −log10(P) = 4.11] and 3.88 × 10⁻⁶ [significant, −log10(P) = 5.41]. The Manhattan plot was generated using the R package qqman (Turner, 2014).
To determine the explanatory power of significant SNPs, stepwise regression was applied to estimate the total variance explained by using the R function “stepAIC” in the MASS package (Venables and Ripley, 2002). The best stepwise model was determined according to Akaike information criterion (AIC) values, using the genotypes of significant SNPs as predictor variables in different stepwise models fitted to phenotypic variables. The adjusted R2 of the best stepwise model was represented as the total variance explained by multiple significant SNPs.
Transcriptome Sequencing and Gene Ontology (GO) Enrichment Analysis
Total RNA was extracted from eight tissues of high-SY and low-SY accessions grown at CQ and YN (Supplementary Tables 3, 4). Tissues from mature leaves (Le) and stems (St), and buds on the primary branch (BP) and the main inflorescence (BM), were harvested at BBCH flowering stage 63–65 (Lancashire et al., 1991), according to our previous description (Lu et al., 2015). Seed and silique pericarps on the main inflorescence (SM and SPM, respectively) and on the primary branch (SB and SPB, respectively) were harvested 20 days after flowering. Then, equal amounts of total RNA from four high-SY and low-SY B. napus accessions were separately pooled. For each sample, two biological replicates, each obtained from three independent plants, were collected for RNA sequencing (RNA-seq) and quantitative reverse-transcription polymerase chain reaction (qRT-PCR) analysis.
Sixty-four RNA-seq libraries (eight tissues × two different kinds of SY accessions × two environments × two biological replicates per sample) were prepared by the Biomarker Technologies Corporation (Beijing, China) and sequenced using an Illumina HiSeq 2500 sequencer (Illumina Inc., San Diego, CA). Briefly, mRNA was enriched with oligo(dT)-rich magnetic beads and then broken into short fragments using an RNA Fragmentation Kit (Beckman Coulter, Brea, CA, USA). The first- and second-strand cDNAs were synthesized using the cleaved mRNA fragments as templates. After end repair and the addition of single nucleotide A, the sequencing adaptors were ligated to these cDNA fragments. The desired fragments were separated using AMPure XP beads (Beckman Coulter, Brea, CA, USA), and the purified cDNA fragments were enriched through PCR. Finally, the 64 libraries were constructed and sequenced, and 125 bp paired-end reads were generated.
Original RNA-seq data have been deposited in the National Center for Biotechnology Information (NCBI) Short Read Archive under reference number SRP072900. Sequence data quality filtering was performed using Trimmomatic-0.33 (Bolger et al., 2014). Filtered reads were then mapped to the B. napus reference genome v4.1 using STAR 2.4.2a (Dobin et al., 2013). Differentially expressed genes (DEGs) were detected using the cuffdiff program, filtered with the following requirements: false discovery rate (FDR, Benjamini–Hochberg multiple test correction) <0.05 and absolute fold change >2 (Benjamini and Hochberg, 1995). To cluster the different RNA-seq samples, principal component analysis (PCA) and cluster analysis were performed as our previously described (Lu et al., 2016).
Gene ontology (GO) terms were assigned to all B. napus proteins based on BLASTP analysis against the Arabidopsis proteome (TAIR10), with an E-value cut-off of 1E-5 (Altschul et al., 1997). BinGO v2.4.4 was used to identify significantly enriched GO terms (FDR < 0.05; Maere et al., 2005). The P-values of significantly overrepresented GO terms were corrected for multiple comparisons using the Benjamini–Hochberg method (Benjamini and Hochberg, 1995). Only terms with an FDR of <0.01 were included and visualized using the R package ggplot2 (Ginestet, 2011).
Candidate Gene Mining
To identify reliable significant association signals in our GWAS, LD analysis was used to determine the haplotype block (HB) for each significant SNP. Only HBs associated with multiple traits, or containing multiple SNPs associated with the same trait, were used to identify candidate genes. LD was estimated as the correlation coefficient r2 between all SNP pairs, and calculated using Haploview 4.2 (Barrett et al., 2005). The Four Gamete Rule, with a fourth haplotype frequency cutoff of 0.1, was used to define haplotype blocks (HBs) based on LD. If significant SNPs were located outside of all the HBs, the 100-kb flanking regions on either side of the markers were treated as an HB. Candidate genes regulating YDTs were identified by screening DEGs within HBs.
To identify candidate genes controlling YDTs, results from GWAS and RNA-seq analysis were integrated and, between the high-SY and low-SY accessions within the HBs, only DEGS associated with multiple traits, or containing multiple SNPs associated with the same trait, were chosen for functional annotation based on their Arabidopsis orthologs. In each HB, only the most likely candidate gene was selected from DEGs underlying flower or seed developmental processes, cell organization and biogenesis, or transcription factor activity.
Validation of DEGs by qRT-PCR
Quantitative PCR analysis of differentially expressed (DE) candidate genes was performed as described previously (Lu et al., 2015). Briefly, RNA samples prepared for the aforementioned RNA-seq were used for cDNA synthesis and qRT-PCR detection. Melting curve analysis ranging from 55 to 95°C was used to assess specificity. Two independent biological replicates, each with three technical replicates, were employed for each tested sample and template-free negative controls. Gene-specific primers were designed using Geneious Pro 8.1.5 (Supplementary Table 5; Kearse et al., 2012). Relative quantification was normalized to the B. napus housekeeping genes Bna.UBC21 and Bna.ACT7, and a fold-change in gene expression calculation was performed using the 2−ΔΔCt method (Qu et al., 2015).
Results
Phenotypic Analysis of YDTs
In trait evaluation under three natural environments, descriptive statistics revealed extensive phenotypic variation for seven YDTs: MIPN, BPN, PNP, SPP, TSW, MIY, and BY (Table 1 and Figure 1). TSW was the most stable, ranging from 1.65 to 5.87 g, with a coefficient of variation (CV) ranging from 16.01 to 16.22%. Conversely, MIY ranged from 0.55 to 15.27 g, with the highest CV ranging from 40.37 to 48.46%. This shows extensive variation in the association panel. CVs of all eight traits in the virtual environment (E4) were much higher than those in the natural environments (E1, E2, and E3), illustrating that YDTs are influenced by environmental variation, consistent with the ANOVA results that revealed significant differences in 3 investigated traits in terms of genotype, environment, and genotype-by-environment interactions. Relatively high broad-sense heritability (h2) was calculated for six traits (MIPN, BPN, PNP, SPP, TSW, and MIY), ranging from 56.52 to 82.30% (Table 1). Normal or approximately normal distribution was observed for all assessed traits (Figure 1). Significant positive correlations were observed between PNP and BPN, SPP and MIY, SPP and BY, BY and BPN, and BY and PNP. Negative correlations were observed between SPP and BPN, SPP and PNP, SPP and TSW, and MIY and BPN (Table 2).
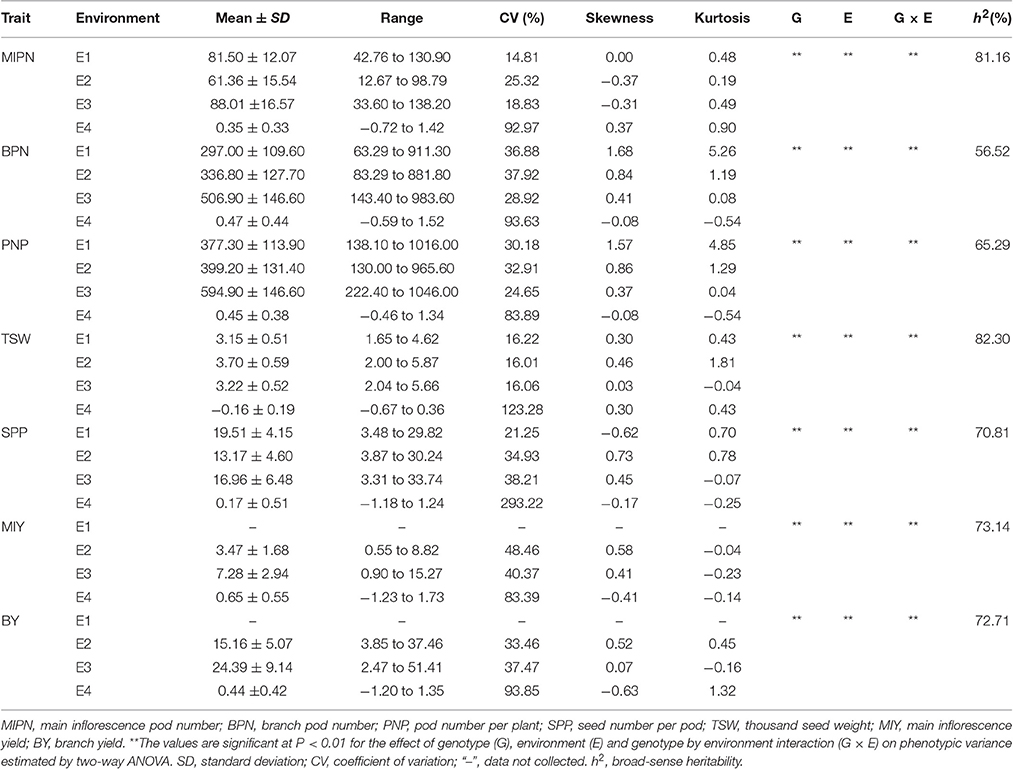
Table 1. Phenotypic variations for YDTs in the association panel.
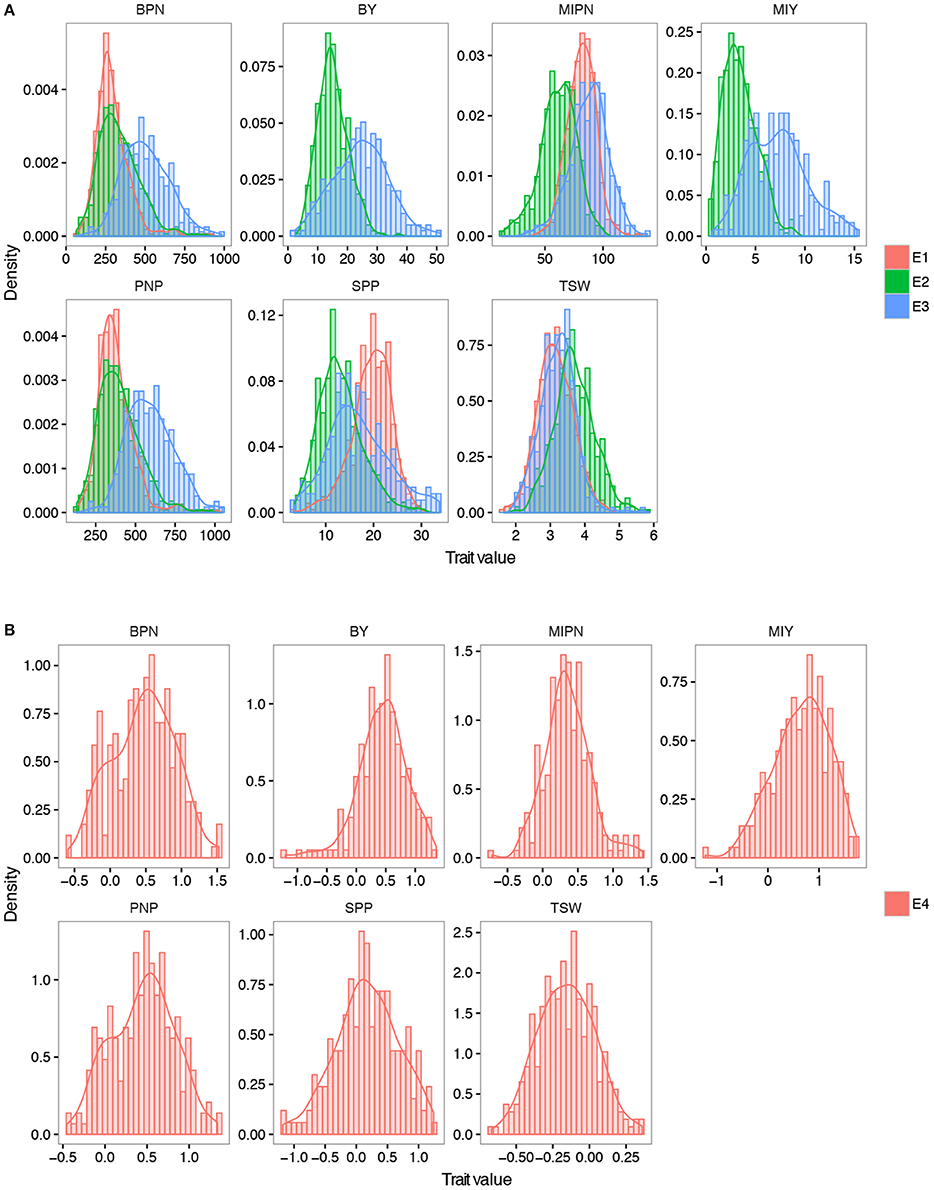
Figure 1. Frequency distribution of seven YDTs. (A) Density plot of all the YDTs in three natural environments. (B) Density plot of traits in the virtual environments. MIPN, main inflorescence pod number; BPN, branch pod number; PNP, pod number per plant; SPP, seed number per pod; TSW, thousand seed weight; MIY, main inflorescence yield; BY, branch yield. E1, E2, and E3 refer to plants grown in CQ 2013, CQ in 2014, and YN in 2014, respectively. E4 refers to plants grown in a virtual environment. The trait value in E4 was calculated by the formula: 2 × (E3 − E2)/(E3 + E2).
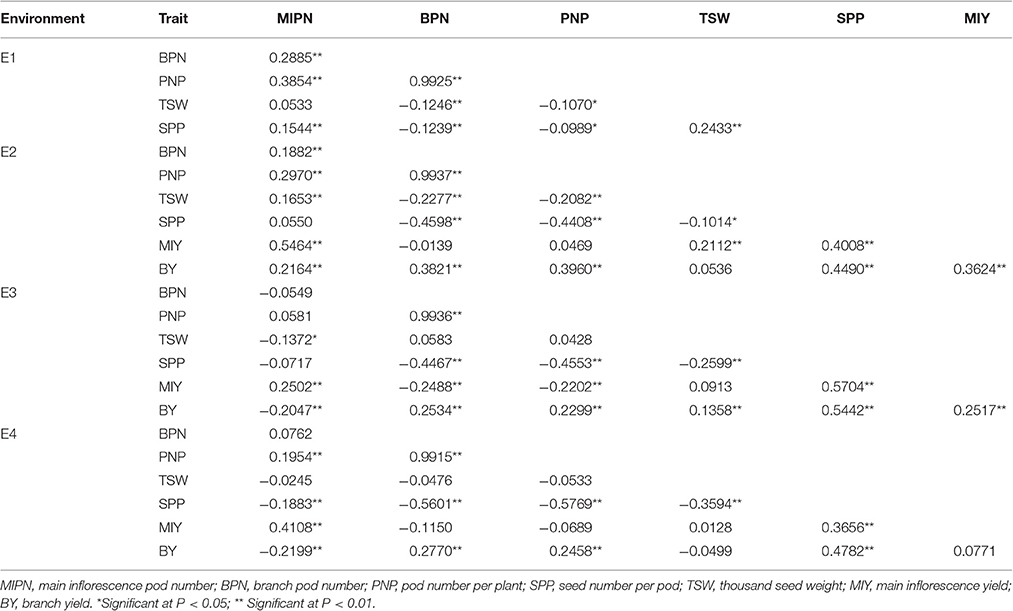
Table 2. Phenotypic correlations among YDTs in four environments.
GWAS of YDTs
In GWAS with the MLM model, 128 SNP–YDT associations were identified at a suggestive threshold (Figure 2, Supplementary Figures 1–4, and Supplementary Table 6), and 53 of these were detected at a significant threshold in the GLM model analysis. These SNPs were unevenly distributed across all chromosomes, except for chromosomes C02 and C07. Eighty significant SNPs were distributed across the A subgenome, while the remaining 48 SNPs were distributed across the C subgenome. Among the 128 SNPs, 51, 14, and 9 SNPs were significantly associated with three typical YCTs SPP, PNP, and TSW, respectively. The significant SNP–trait associations on the main inflorescence (both four SNPs for MIPN and MIY) were much less than those on the branches (16 SNPs for BPN and 30 SNPs for BY), implying the complexity of genetic architecture of traits on the branches. These significant associations individually explained 3.48–18.07% of the phenotypic variance. For YDTs in individual natural environments, between 1 and 25 SNPs were significantly associated with a single YDT. No SNP–trait associations were detected for E1-MIPN, E3-MIPN, or E3-MIY. In the virtual environment E4, 29 SNPs were significantly associated with YDTs, which individually explained 7.94–14.31% of the phenotypic variance (Supplementary Table 6). Estimating the total phenotypic variance for each YDT in the association panel using stepwise regression, we found that significant SNPs collectively accounted for 4.00–40.18% of the total phenotypic variance.
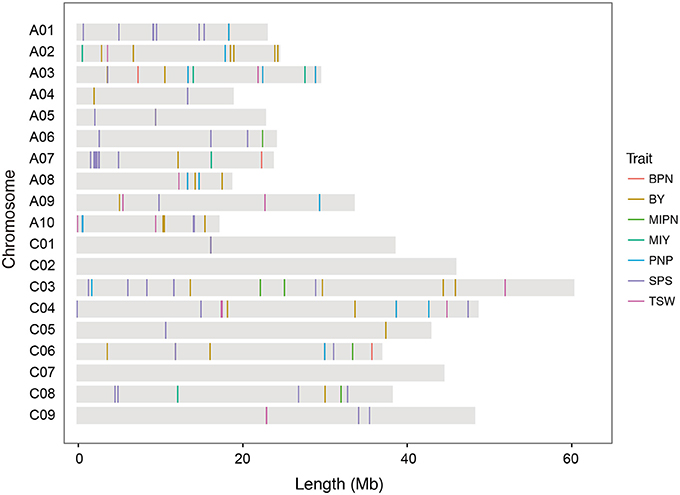
Figure 2. Distribution of single nucleotide polymorphisms (SNPs) significantly associated with YDTs on the B. napus reference genome. MIPN, main inflorescence pod number; BPN, branch pod number; PNP, pod number per plant; SPP, seed number per pod; TSW, thousand seed weight; MIY, main inflorescence yield; BY, branch yield.
In the LD analyses, 15 HBs were associated with multiple traits (such as BPN and PNP), and six HBs contained multiple SNPs associated with an individual trait (Table 3). These HBs were used for the following candidate gene mining.
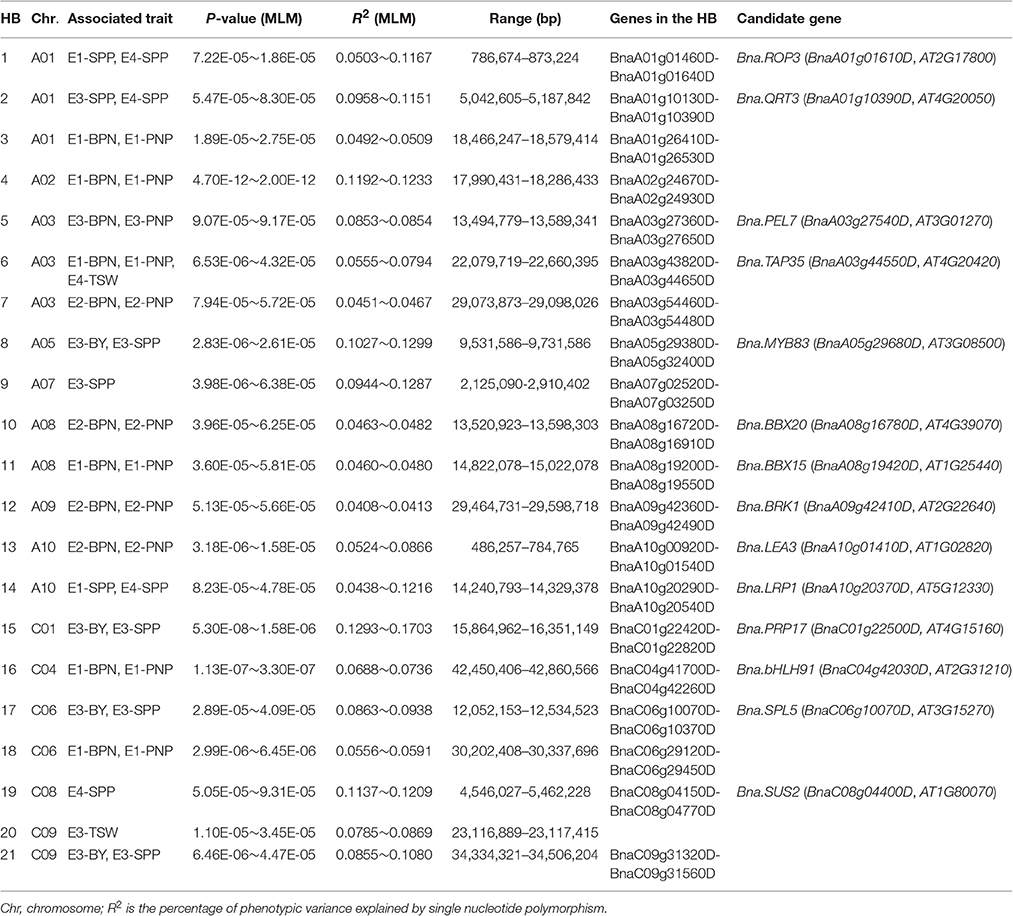
Table 3. Summary of haplotype blocks consistently detected as associated with multiple traits, or as containing multiple single nucleotide polymorphisms associated with a single trait.
Transcriptome Analysis for Identifying DEGs
In the transcriptome analyses, four extremely high- and low-SY accessions at CQ and YN were separatively chosen based on their SY and kinship coefficients (Supplementary Table 4). Calculation of kinship coefficients between plant materials used for transcriptome sequencing revealed that only B400 showed high kinship (higher than 0.5) with B206 and B376 among the 10 uniquely selected sequencing samples. Most of kinship coefficients between the rest B. napus accessions ranged from 0 to 0.2, suggesting that these materials have no kinship or a relatively weak kinship, which offers guarantee for the accuracy of DEG identification.
After filtering out low quality sequencing reads and trimming of the first 5 bp error-enriched nucleotides at the 5′ end, approximate 256 gigabases (Gb) of 120-bp paired-end reads were remained, with an average of 16.72 million reads per sample, as per our previous description. Mapping results showed that about 84% of the input reads uniquely mapped to the B. napus reference genome. Then, these mapped reads were used for estimation of FPKM-based transcript abundance values for all RNA-seq samples.
The Pearson correlation coefficients (PCCs) between all RNA-seq samples were calculated from log2-transformed (FPKM+1) values (Figure 3). Comparing results revealed that the PCCs between samples harvested from the same tissues were higher than those between samples collected from different tissues. Results from PCA and cluster analysis were consistent with the abovementioned correlation analysis (Supplementary Figure 5), suggesting that our RNA-seq results met the requirement of following DEG identification.
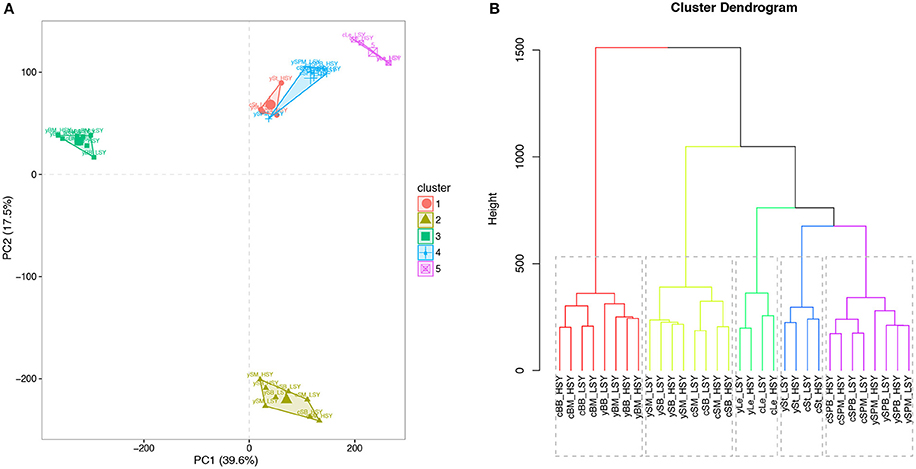
Figure 3. Principal component analysis (PCA) plot and cluster analysis of all RNA-seq samples. (A) PCA plot of all RNA-seq samples. (B) Cluster dendrogram of all RNA-seq samples. First letters (c and y) represent cultivation regions Chongqing (CQ) and Yunnan (YN), respectively. St, stems; Le, leaves; BM, buds on the main inflorescence; BB, buds on the primary branch; SPM, silique pericarps on the main inflorescence; SPB, silique pericarps on the primary branch; SM, seeds harvested 20 days after flowering on the main inflorescence; SB, seeds harvested 20 days after flowering on the primary branch; LSY, low seed yield accessions; HSY, high seed yield accessions. The log2-nomalized (FPMK+1) values of all the genes were used for PCA and cluster analyses.
Pair-wise comparisons between the same tissues from high-SY and low-SY accessions were conducted to call the DEGs using the aforementioned standards. Between 250 and 5,215 genes were differentially expressed in individual tissues (Figure 4). Of these DEGs, the average number in most tissues at CQ (2,844) was much higher than those at YN (908), except for SPM; this indicates that the transcriptomic variation between high-SY and low-SY accessions was greater at CQ. The number of DEGs was different among the eight tissues at the two locations: a relatively higher number of DEGs were found in SM, SB, St, and Le at CQ, but the number of DEGs in St, SPM, SB, and BB at YN was relatively higher than in other tissues at YN.
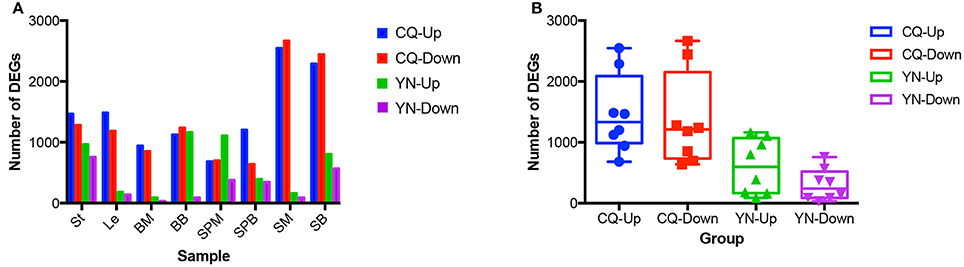
Figure 4. Comparison of differentially expressed genes (DEGs) between high-yield and low-yield accessions harvested from two different cultivation regions. (A) Number of up-regulated and down-regulated DEGs in eight different tissues from high-yield and low-yield accessions grown at Yunnan (YN) and Chongqing (CQ). (B) Average number of up-regulated and down-regulated DEGs in all tissues between high-yield and low-yield accessions grown at YN and CQ. “Up” and “down” indicate up-regulated and down-regulated genes, respectively.
Functional Enrichment Analysis
Based on the GO enrichment analysis, between 41 and 995 significantly overrepresented GO terms were identified in DEGs in individual tissues between the high-SY and low-SY accessions; of these, the average number of overrepresented GO terms in up-regulated genes was higher than those in down-regulated genes at YN, while the reverse trend was observed for DEGs at CQ. There were fewer overrepresented GO terms in DEGs from buds than those in other tissues. DEGs in the stem at both locations were enriched into 1,203 GO terms; the highest among the eight tissues investigated.
The most prevalent GO terms in up-regulated and down-regulated genes in BM and BB of high-SY accessions at CQ were pollen wall assembly (GO:0010208) and cell wall modification (GO:0042545), respectively. Up-regulated genes in BM and BB at YN were enriched in nutrient reservoir activity (GO:0045735), while no significantly enriched GO term was identified for down-regulated genes in BB. In leaves from plants at both locations, up-regulated genes were significantly enriched for GO terms including photosynthesis (GO:0015979) and photosynthesis and light harvesting (GO:0009765), but defense response (GO:0006952) and galactolipid biosynthetic processes (GO:0019375) were the most significantly enriched GO terms in the down-regulated genes at CQ and YN, respectively. Overrepresented GO terms among DEGs in the stem were different between the two locations; glycosinolate biosynthetic process (GO:0019758) was the most significantly enriched GO term both for up-regulated genes at YN and down-regulated genes at CQ. GO terms significantly enriched in the silique pericarps were different between the main inflorescence and the primary branch. Secondary metabolic processes such as anthocyanin biosynthesis (GO:0009718) and phenylpropanoid biosynthesis (GO:0009699) were the most significantly enriched GO terms for up-regulated genes in SPM, whereas stress response-related GO terms, such as response to organic substances (GO:0010033) and response to ultraviolet light (UV, GO:0009411) were the most significantly enriched terms for up-regulated genes in SPB. For up-regulated genes, pollen exine formation (GO:0010584) and lipid localization (GO:0010876) were highly enriched in the SM and SB at YN, while RNA methylation (GO:0001510) and seed dormancy (GO:0010162) were mostly significant enriched within the SM and SB at CQ, respectively. More significantly enriched GO terms are shown in Supplementary Table 6.
Discovery Candidate Genes for YDTs by Integrating GWAS and RNA-Seq Datasets
Among the 21 HBs with particular interest, a total of 1,107 genes were retrieved, according to the B. napus reference genome annotation (Supplementary Table 7). There were 635 DEGs in at least one tissue from plants grown at YN or CQ. Subsequently, we combined GWAS and RNA-seq results to mine candidate genes in each HB (Supplementary Table 8). Finally, 14 candidate genes were selected from 21 HBs; no candidate genes were found in the other 7 HBs. As an example, we found 30 genes within HB5 on chromosome A03. Since HB5 significantly associated with E3-BPN and E3-PNP, only eight DEGs in seeds or silique pericarps on branches at YN were chosen for further functional annotation. Then, the up-regulated pectate lyase gene Bna.PEL7 (BnaA03g27540D) was identified as a key candidate within HB5, because of its putative function in the growth of pollen tubes in female floral tissues. Candidate genes within other HBs were screened out using this combination method (Table 3).
Functional annotation of these 14 candidates revealed that five genes were involved in transcription factor activity, and six in developmental processes. For example, Bna.MYB83 (BnaA05g29680D), located within HB8 of SNP rs10508, associated with BY and SPP in E3 (Table 3) and encoded an ortholog of a putative R2R3-type MYB transcription factor MYB83 (AT3G08500), a master transcriptional regulator responsible for secondary wall biosynthesis and biomass production in Arabidopsis (Zhong et al., 2015). Bna.SPL5 (BnaC06g10070D) was a candidate gene found in HB17 of SNP rs36347, which associated with BY and SPP in E3 and encoded SQUAMOSA PROMOTER BINDING PROTEIN-LIKE 5 (AtSPL5, AT3G15270) in Arabidopsis, which is involved in the regulation of flowering and vegetative phase change (Xu et al., 2016). All candidate genes within HBs are listed in Table 3, including orthologs of QUARTET3 (Bna.QTR3, BnaA01g10390D), BRICK1 (Bna.BRK1, BnaA09g42410D) and LATE EMBRYOGENESIS ABUNDANT3 (Bna.LEA3, BnaA10g01410D) in Arabidopsis.
Validation of DEGs
To validate the accuracy of identified DEGs, we determined the expression patterns of the 14 candidate genes by qRT-PCR. To avoid non-specific amplification, amplified PCR products were recovered and confirmed by sequencing. All amplified qRT-PCR products investigated revealed only a single target product with the desired length for each candidate gene. The PCC was estimated to evaluate the consistency between RNA-seq and qRT-PCR results (Supplementary Figure 6, 7). As expected, PCC was high (r2 = 0.8846), suggesting the reliability and accuracy of RNA-seq data.
Discussion
Seed (or grain) yield is one of the most economically important and complex crop traits (Richards, 2000; Lobell et al., 2009; Cai et al., 2014; Shi et al., 2015). SY manifests via a complex relationship between the YCTs PNP, SPP, and TSW in oilseed crops, or thousand grain weight (TGW), grains per spike (GPS), and grain weight per spike (GWS) in cereal crops. The three YCTs vary among accessions of B. napus, and different combinations of YCTs can lead to similar yield production (Cai et al., 2016); thus, it is difficult to realize high-yield breeding through the selection of high-yield genotypes.
In the present study, we investigated the genetic basis for variation in seven YDTs in natural populations of 520 B. napus accessions. Significant phenotypic variation and correlations between YDTs were observed. BY significantly positively correlated with other YDTs under natural environments, except with TSW at CQ, as reported previously (Cai et al., 2014; Wang X. et al., 2016). We also calculated the correlation coefficients between YDT trait values in the virtual environment (representing the environmental response for each trait) and found no significant correlations between TSW and MIY, or between TSW and BY (Table 3). Hence, we speculate that TSW is more stable than other YDTs because the correlation between SY (the sum of BY and MIY) and TSW was less sensitive to environmental change. TSW might be a prime breeding target for the development of high-yielding B. napus cultivars with a strong ability to adapt, especially those that will be cultivated in different cultivation environments.
Numerous QTLs for YDTs in B. napus have been identified by QTL mapping and GWAS (Quijada et al., 2006; Chen et al., 2011; Zhang et al., 2011; Zhou et al., 2014; Fu et al., 2015; Shi et al., 2015; Zhao et al., 2016). Using the B. napus genome sequence as a reference, we compared the physical location of significant SNPs identified in this study with QTLs from previous studies. Among our 128 significant SNP–trait associations, 35 SNPs for YDTs identified in this study were located in, or overlapped with, confidence intervals of QTLs reported previously, whereas the 93 remaining SNPs are novel loci (Supplementary Table 6). Based on previous reports, there is a major QTL simultaneously associated with SL and TSW on chromosome A9 in B. napus (Yang et al., 2012; Fu et al., 2015; Liu et al., 2015). Fan et al. (2010) identified two stable major QTLs, TSWA7a and TSWA7b, which collectively explained 27.6–37.9% of the trait variation in another DH population, but didn't detected the major QTL on chromosome A9. In this study, we failed to confirm the effects from the QTLs cqSWA9, TSWA7a, and TSWA7b, though nine significant SNPs for TSW were identified. The reason why their effects may not have been confirmed is because they were highly influenced by the genetic background. So far, there were three research groups reported the major QTL cqSWA9 at the same QTL region on chromosome A9. We found that the parental lines (zy72360, SWU07, and S1) used for mapping population construction may share the similar genetic background, since all the three lines were semi-winter type, long SL and large SW. More importantly, the major QTL cqSWA9 was found to be associated with the SL and SW simultaneously in the three studies. The failure to confirm cqSWA9 QTL in this study and Fan et al.'s findings was probably due to the difference of genetic background, as the SJ-DH population in Fan et al.'s study was produced from a cross between SW Hickory (a spring-type B. napus variety) and JA177 (a winter-type B. napus pure line), and a natural population was adopted for GWAS in this study.
We noticed that there were 35 common QTLs associated with different traits to those previously identified, implying that some are likely to be pleiotropic QTLs that simultaneously regulate at least two different YDTs. For example, the significant association between SNP rs45027 and MIPN was observed in the current study, and the HB harboring rs45027 overlapped with QTL confidence intervals for seed number (qSN.C06-2), seed weight (cqSW-C6-3), and SY (cqSY-C6-3) (Shi et al., 2015; Zhao et al., 2016). Pleiotropic QTLs identified across different studies will be important targets of yield-related gene cloning for elucidating the molecular mechanism of YDTs in B. napus. These results indicate that YDTs are complex traits controlled by an array of yield-related genes that are unevenly distributed on the subgenomes of B. napus.
In addition to common QTLs, 93 novel loci were detected in this study (Supplementary Table 6). To maximize the detection power, researchers generally prefer the permissive model, GLM, which potentially introduces more false positives than the stringent mixed model, MLM. To reduce the risk of type 1 error, the 93 novel association loci were all identified based on the MLM, implying that these association signals are fairly reliable, and deserving further validation in other population and environments.
Chromosome distribution analysis showed that 128 significant SNPs identified in this study were unevenly distributed on the A and C subgenomes of B. napus; 80 significant SNPs were distributed on the A subgenome, and the remaining 48 SNPs were distributed on the C subgenome (Supplementary Table 6). In QTL or association mapping studies, other researchers have also identified more QTL or SNP–trait associations in the A-subgenome than C-subgenome of B. napus (Cai et al., 2014, 2016; Shi et al., 2015; Wang X. et al., 2016). For example, Shi et al. identified eight and 16 QTLs for PNP and SPP, respectively, but only two and three QTLs on the C subgenome, respectively (Shi et al., 2015). An uneven distribution of significant signals for other traits was also observed. GWAS identified 26 SNPs significantly associated with Sclerotinia sclerotiorum resistance in B. napus, which corresponded to three loci on the C subgenome (Wu et al., 2016). Using GWAS with MLM, Liu et al. identified 11 B. napus SNPs significantly associated with seed oil content, corresponding to five loci located on chromosomes A3, A5, A9, A10, and C7, exhibiting an A-subgenome preference (Liu S. et al., 2016). The fact that different traits seem to be unevenly distributed in different ways at the subgenome level suggests that expansion of our existing genetic resources might be warranted to target traits for breeding. Indeed, the resynthesis of B. napus has already led to the successful transfer of resistance to S. sclerotiorum from wild-type B. oleracea (Ding et al., 2013). Further exploration of the A subgenome (or the A subgenome donor B. rapa) will be crucial for further improving YDTs in B. napus.
As a powerful means to identify genomic regions (loci) associated with complex traits, GWAS has been successfully employed to understand the genetic basis of several agronomically important traits in crops (Huang and Han, 2014), and has become a standard tool for candidate gene discovery. Though numerous key loci associated with complex traits have been identified by GWAS in crops, it remains arduous to fine-map and clone the target genes responsible for the phenotypic variation of those traits, and difficult to achieve a comprehensive understanding of the genetic mechanisms. To overcome these challenges, several “omics” profiling approaches (transcriptome, proteome, metabolome, epigenome, and microbiome) were recently integrated with GWAS to functionally characterize the associations (van der Sijde et al., 2014). Although hurdles remain, these combined methods have shown promise in investigating the molecular mechanisms underlying complex traits.
Transcriptome sequencing (RNA-seq) has been widely used to estimate gene expression changes, and enables the detection of novel transcripts (both coding genes and several kinds of non-coding RNA), alternative spliced transcripts, gene fusions, and post-transcriptional modifications. To increase the efficiency and accuracy of candidate gene discovery in GWAS, resolution has been increased by combining GWAS (or QTL mapping) with and RNA-seq (Hua et al., 2016; Li L. et al., 2016; Lu et al., 2016; Wei et al., 2016; Wu et al., 2016). For example, Hua et al. revealed a NODULIN 26-LIKE INTRINSIC PROTEIN (NIP) gene underlying the major boron uptake efficiency QTL qBEC-A3a in B. napus by integrating QTL fine mapping with digital gene expression profiling (Hua et al., 2016). Integrated RNA-seq data from B. rapa and GWAS by Li et al. indicated that the Toll Interleukin1 Receptor–Nucleotide Binding Site (TIR-NBS) gene family might be important in clubroot (Plasmodiophora brassicae Woronin) resistance (Li L. et al., 2016). In this work, we retrieved 1,107 genes from 21 HBs based on GWAS and LD analysis. Of these genes, 635 were differentially expressed at least in one tissue from plants grown at YN or CQ. Subsequently, we combined GWAS and RNA-seq results to mine candidate genes in each HB, and identified 14 candidate genes based on their expression patterns and biological function. It is obviously that the combination of GWAS and RNA-seq (or other “omics” technologies) provides higher resolution in illuminating the genetic basis of complex traits, and is likely to become a widely used standard approach.
To rapidly identify candidate genes controlling YDTs, 21 HBs associated with multiple traits, or containing multiple SNPs associated with the same trait, were chosen for candidate gene identification using the combination of strategies described above. Among these 21 HBs, 14 DEG candidates were obtained, including five transcription factors (TFs) and six genes involved in developmental processes (Table 3). MYB and bHLH (basic helix–loop–helix) TFs may be crucial regulators of YDTs. Within HB8, BnaA05g29680D was identified as the most plausible candidate gene, which encodes an ortholog of the MYB TF AtMYB83 in Arabidopsis. Overexpression of MYB83 activates several genes involved in cellulose, xylan, and lignin biosynthesis, and concomitantly induces ectopic secondary wall deposition (McCarthy et al., 2009), providing a valuable approach to increase crop biomass production. In this study, up-regulation of Bna.MYB83 expression was detected in SPM, SPB, and SB, implying that yield increase might be caused by higher biomass accumulation at SP, an important photosynthesis organ for seed filling during the reproductive stage. Within HB16 on chromosome C04, BnaC04g42030D encodes an ortholog of AtbHLH91 in Arabidopsis. This gene is important for Arabidopsis another development, possibly by forming a feed-forward loop with DYSFUNCTIONAL TAPETUM1 (DYT1) (Zhu et al., 2015). Expression of Bna.bHLH91 was significantly up-regulated in seeds from CQ, suggesting that this gene may regulate yield increase.
Several genes involved in developmental processes were also considered as important candidates for YDT variation. In HB1 on chromosome A01, we identified BnaA01g01610D, which encodes an ortholog of AtROP3, an important gene underlying embryo development and auxin-dependent plant growth (Huang et al., 2014). Significant up-regulation of Bna.ROP3 expression in the SM at YN and CQ suggests a crucial role for regulating seed and silique development. Within HB2, BnaA01g10390D was significantly up-regulated in silique pericarps of high-yielding B. napus accessions grown at YN; this gene encodes an ortholog of QUARTET3 in Arabidopsis. AtQRT3 mutations cause failure of microspore separation during pollen development because of a defect in degradation of the pollen mother cell wall during the late stages of pollen development (Rhee et al., 2003). Hence, we propose that Bna.QRT3 is also a key regulator of high yield in B. napus. Key candidate genes within other HBs are summarized in Table 3. These candidate genes are valuable resources for further experimental verification, and may be important in high-yield B. napus breeding.
Author Contributions
KL, JLi, and YL designed the work; KL, LP, CZ, JLu, BY, ZX, QZ, MF, and XY performed the experiments; KL, YL, XX, KZ, LL, and CQ contributed to data analysis and interpretation; KL, LP, and JLi drafted the paper. All authors reviewed the manuscript.
Funding
This work was supported by grants from the National Natural Science Foundation of China (U1302266, 31571701 and 31360346), the National Key Research and Development Plan (2016YFD0101007), the 973 Project (2015CB150201), the National High Technology Research and Development Programs of China (2013AA102602), the National Key Technology Support Program (2013BAD01B03-12) and the 111 Project (B12006).
Conflict of Interest Statement
The authors declare that the research was conducted in the absence of any commercial or financial relationships that could be construed as a potential conflict of interest.
Acknowledgments
The authors are very grateful to Dr. Kathleen Farquharson, the Science Editor for The Plant Cell, for her critical reading of the manuscript.
Supplementary Material
The Supplementary Material for this article can be found online at: http://journal.frontiersin.org/article/10.3389/fpls.2017.00206/full#supplementary-material
References
Altschul, S. F., Madden, T. L., Schäffer, A. A., Zhang, J., Zhang, Z., Miller, W., et al. (1997). Gapped BLAST and PSI-BLAST: a new generation of protein database search programs. Nucleic Acids Res. 25, 3389–3402. doi: 10.1093/nar/25.17.3389
Barrett, J. C., Fry, B., Maller, J., and Daly, M. J. (2005). Haploview: analysis and visualization of LD and haplotype maps. Bioinformatics 21, 263–265. doi: 10.1093/bioinformatics/bth457
Benjamini, Y., and Hochberg, Y. (1995). Controlling the false discovery rate: a practical and powerful approach to multiple testing. J. R. Stat. Soc. B 57, 289–300.
Bolger, A. M., Lohse, M., and Usadel, B. (2014). Trimmomatic: a flexible trimmer for Illumina sequence data. Bioinformatics 30, 2114–2120. doi: 10.1093/bioinformatics/btu170
Bradbury, P. J., Zhang, Z., Kroon, D. E., Casstevens, T. M., Ramdoss, Y., and Buckler, E. S. (2007). TASSEL: software for association mapping of complex traits in diverse samples. Bioinformatics 23, 2633–2635. doi: 10.1093/bioinformatics/btm308
Cai, D., Xiao, Y., Yang, W., Ye, W., Wang, B., Younas, M., et al. (2014). Association mapping of six yield-related traits in rapeseed (Brassica napus L.). Theor. Appl. Genet. 127, 85–96. doi: 10.1007/s00122-013-2203-9
Cai, G., Yang, Q., Chen, H., Yang, Q., Zhang, C., Fan, C., et al. (2016). Genetic dissection of plant architecture and yield-related traits in Brassica napus. Sci. Rep. 6:21625. doi: 10.1038/srep21625
Chalhoub, B., Denoeud, F., Liu, S., Parkin, I. A. P., Tang, H., Wang, X., et al. (2014). Early allopolyploid evolution in the post-Neolithic Brassica napus oilseed genome. Science 345, 950–953. doi: 10.1126/science.1253435
Chen, W., Zhang, Y., Liu, X., Chen, B., Tu, J., and Tingdong, F. (2007). Detection of QTL for six yield-related traits in oilseed rape (Brassica napus) using DH and immortalized F2 populations. Theor. Appl. Genet. 115, 849–858. doi: 10.1007/s00122-007-0613-2
Chen, W., Zhang, Y., Yao, J., Ma, C., Tu, J., and Tingdong, F. (2011). Quantitative trait loci mapping for two seed yield component traits in an oilseed rape (Brassica napus) cross. Plant Breed. 130, 640–646. doi: 10.1111/j.1439-0523.2011.01886.x
Clark, R. M. (2010). Genome-wide association studies coming of age in rice. Nat. Genet. 42, 926–927. doi: 10.1038/ng1110-926
Ding, G., Zhao, Z., Liao, Y., Hu, Y., Shi, L., Long, Y., et al. (2012). Quantitative trait loci for seed yield and yield-related traits, and their responses to reduced phosphorus supply in Brassica napus. Ann. Bot. 109, 747–759. doi: 10.1093/aob/mcr323
Ding, Y., Mei, J., Li, Q., Liu, Y., Wan, H., Wang, L., et al. (2013). Improvement of Sclerotinia sclerotiorum resistance in Brassica napus by using B. oleracea. Genet. Resour. Crop Evol. 60, 1615–1619. doi: 10.1007/s10722-013-9978-z
Dobin, A., Davis, C. A., Schlesinger, F., Drenkow, J., Zaleski, C., Jha, S., et al. (2013). STAR: ultrafast universal RNA-seq aligner. Bioinformatics 29, 15–21. doi: 10.1093/bioinformatics/bts635
Donnelly, P. (2008). Progress and challenges in genome-wide association studies in humans. Nature 456, 728–731. doi: 10.1038/nature07631
Duggal, P., Gillanders, E. M., Holmes, T. N., and Bailey-Wilson, J. E. (2008). Establishing an adjusted p-value threshold to control the family-wide type 1 error in genome wide association studies. BMC Genomics 9:516. doi: 10.1186/1471-2164-9-516
Evanno, G., Regnaut, S., and Goudet, J. (2005). Detecting the number of clusters of individuals using the software STRUCTURE: a simulation study. Mol. Ecol. 14, 2611–2620. doi: 10.1111/j.1365-294X.2005.02553.x
Fan, C., Cai, G., Qin, J., Li, Q., Yang, M., Wu, J., et al. (2010). Mapping of quantitative trait loci and development of allele-specific markers for seed weight in Brassica napus. Theor. Appl. Genet. 121, 1289–1301. doi: 10.1007/s00122-010-1388-4
Freund, R. J., and Littell, R. C. (1981). SAS for Linear Models: A Guide to the ANOVA and GLM Procedures, Vol. 1. Cary, NC: Sas Institute.
Fu, Y., Wei, D., Dong, H., He, Y., Cui, Y., Mei, J., et al. (2015). Comparative quantitative trait loci for silique length and seed weight in Brassica napus. Sci. Rep. 5:14407. doi: 10.1038/srep14407
Ginestet, C. (2011). ggplot2: elegant graphics for data analysis. J. R. Stat. Soc. A 174, 245–246. doi: 10.1111/j.1467-985X.2010.00676_9.x
Hua, Y., Zhang, D., Zhou, T., He, M., Ding, G., Shi, L., et al. (2016). Transcriptomics-assisted QTL fine mapping for the rapid identification of a NODULIN 26-LIKE INTRINSIC PROTEIN gene regulating boron efficiency in allotetraploid rapeseed. Plant Cell Environ. 39, 1601–1618. doi: 10.1111/pce.12731
Huang, J. J., Liu, H., Chen, M., Li, X., Wang, M., Yang, Y., et al. (2014). ROP3 GTPase contributes to polar auxin transport and auxin responses and is important for embryogenesis and seedling growth in Arabidopsis. Plant Cell 26, 3501–3518. doi: 10.1105/tpc.114.127902
Huang, X., and Han, B. (2014). Natural variations and genome-wide association studies in crop plants. Annu. Rev. Plant Biol. 65, 531–551. doi: 10.1146/annurev-arplant-050213-035715
Huang, X., Wei, X., Sang, T., Zhao, Q., Feng, Q., Zhao, Y., et al. (2010). Genome-wide association studies of 14 agronomic traits in rice landraces. Nat. Genet. 42, 961–967. doi: 10.1038/ng.695
Kearse, M., Moir, R., Wilson, A., Stones-Havas, S., Cheung, M., Sturrock, S., et al. (2012). Geneious Basic: an integrated and extendable desktop software platform for the organization and analysis of sequence data. Bioinformatics 28, 1647–1649. doi: 10.1093/bioinformatics/bts199
Körber, N., Bus, A., Li, J., Parkin, I. A. P., Wittkop, B., Snowdon, R. J., et al. (2016). Agronomic and seed quality traits dissected by genome-wide association mapping in Brassica napus. Front. Plant Sci. 7:386. doi: 10.3389/fpls.2016.00386
Lancashire, P. D., Bleiholder, H., Van Den Boom, T., LangelÜDdeke, P., Stauss, R., Weber, E., et al. (1991). A uniform decimal code for growth stages of crops and weeds. Ann. Appl. Biol. 119, 561–601. doi: 10.1111/j.1744-7348.1991.tb04895.x
Li, F., Chen, B., Xu, K., Gao, G., Yan, G., Qiao, J., et al. (2016). A genome-wide association study of plant height and primary branch number in rapeseed (Brassica napus). Plant Sci. 242, 169–177. doi: 10.1016/j.plantsci.2015.05.012
Li, F., Chen, B., Xu, K., Wu, J., Song, W., Bancroft, I., et al. (2014). Genome-wide association study dissects the genetic architecture of seed weight and seed quality in rapeseed (Brassica napus L.). DNA Res. 21, 355–367. doi: 10.1093/dnares/dsu002
Li, L., Luo, Y., Chen, B., Xu, K., Zhang, F., Li, H., et al. (2016). A genome-wide association study reveals new loci for resistance to clubroot disease in Brassica napus. Front. Plant Sci. 7:1483. doi: 10.3389/fpls.2016.01483
Li, M. X., Yeung, J. M. Y., Cherny, S. S., and Sham, P. C. (2012). Evaluating the effective numbers of independent tests and significant p-value thresholds in commercial genotyping arrays and public imputation reference datasets. Hum. Genet. 131, 747–756. doi: 10.1007/s00439-011-1118-2
Li, Y., Shen, J., Wang, T., Chen, Q., Zhang, X., Fu, T., et al. (2007). QTL analysis of yield-related traits and their association with functional markers in Brassica napus L. Aust. J. Agric. Res. 58, 759–766. doi: 10.1071/AR06350
Liu, G. F., Yang, J., Xu, H. M., Hayat, Y., and Zhu, J. (2008). Genetic analysis of grain yield conditioned on its component traits in rice (Oryza sativa L.). Aust. J. Agric. Res. 59, 189–195. doi: 10.1071/AR07163
Liu, J., Hua, W., Hu, Z., Yang, H., Zhang, L., Li, R., et al. (2015). Natural variation in ARF18 gene simultaneously affects seed weight and silique length in polyploid rapeseed. Proc. Natl. Acad. Sci U.S.A. 112, E5123–E5132. doi: 10.1073/pnas.1502160112
Liu, J., Wang, W., Mei, D., Wang, H., Fu, L., Liu, D., et al. (2016). Characterizing variation of branch angle and genome-Wide association mapping in rapeseed (Brassica napus L.). Front. Plant Sci. 7:21. doi: 10.3389/fpls.2016.00021
Liu, S., Fan, C., Li, J., Cai, G., Yang, Q., Wu, J., et al. (2016). A genome-wide association study reveals novel elite allelic variations in seed oil content of Brassica napus. Theor. Appl. Genet. 129, 1–13. doi: 10.1007/s00122-016-2697-z
Liu, S., Liu, Y., Yang, X., Tong, C., Edwards, D., Parkin, I. A. P., et al. (2014). The Brassica oleracea genome reveals the asymmetrical evolution of polyploid genomes. Nat. Commun. 5, 1–11. doi: 10.1038/ncomms4930
Lobell, D. B., Cassman, K. G., and Field, C. B. (2009). Crop yield gaps: their importance, magnitudes, and causes. Annu. Rev. Environ. Resour. 34, 179–204. doi: 10.1146/annurev.environ.041008.093740
Lu, K., Guo, W., Lu, J., Yu, H., Qu, C., Tang, Z., et al. (2015). Genome-wide survey and expression profile analysis of the mitogen-activated protein kinase (MAPK) gene family in brassica rapa. PLoS ONE 10:e0132051. doi: 10.1371/journal.pone.0132051
Lu, K., Xiao, Z., Jian, H., Peng, L., Qu, C., Fu, M., et al. (2016). A combination of genome-wide association and transcriptome analysis reveals candidate genes controlling harvest index-related traits in Brassica napus. Sci. Rep. 6:36452. doi: 10.1038/srep36452
Luo, X., Ma, C., Yue, Y., Hu, K., Li, Y., Duan, Z., et al. (2015). Unravelling the complex trait of harvest index in rapeseed (Brassica napus L.) with association mapping. BMC Genomics 16:379. doi: 10.1186/s12864-015-1607-0
Maere, S., Heymans, K., and Kuiper, M. (2005). BiNGO: a cytoscape plugin to assess overrepresentation of gene ontology categories in biological networks. Bioinformatics 21, 3448–3449. doi: 10.1093/bioinformatics/bti551
McCarthy, R. L., Zhong, R., and Ye, Z. H. (2009). MYB83 is a direct target of SND1 and acts redundantly with MYB46 in the regulation of secondary cell wall biosynthesis in Arabidopsis. Plant Cell Physiol. 50, 1950–1964. doi: 10.1093/pcp/pcp139
Özer, H., Oral, E., and Doǧru, Ü. (1999). Relationships between yield and yield components on currently improved spring rapeseed cultivars. Tr. J. Agric. For. 23, 603–607.
Parkin, I. A., Koh, C., Tang, H., Robinson, S. J., Kagale, S., Clarke, W. E., et al. (2014). Transcriptome and methylome profiling reveals relics of genome dominance in the mesopolyploid Brassica oleracea. Genome Biol. 15, R77. doi: 10.1186/gb-2014-15-6-r77
Pritchard, J. K., Stephens, M., and Donnelly, P. (2000). Inference of population structure using multilocus genotype data. Genetics 155, 945–959.
Qu, C., Fu, F., Liu, M., Zhao, H., Liu, C., Li, J., et al. (2015). Comparative transcriptome analysis of recessive male sterility (RGMS) in sterile and fertile Brassica napus lines. PLoS ONE 10, 1–18. doi: 10.1371/journal.pone.0144118
Quijada, P. A., Udall, J. A., Lambert, B., and Osborn, T. C. (2006). Quantitative trait analysis of seed yield and other complex traits in hybrid spring rapeseed (Brassica napus L.): 1. Identification of genomic regions from winter germplasm. Theor. Appl. Genet. 113, 549–561. doi: 10.1007/s00122-006-0323-1
Radoev, M., Becker, H. C., and Ecke, W. (2008). Genetic analysis of heterosis for yield and yield components in rapeseed (Brassica napus L.) by quantitative trait locus mapping. Genetics 179, 1547–1558. doi: 10.1534/genetics.108.089680
Rhee, S. Y., Osborne, E., Poindexter, P. D., and Somerville, C. R. (2003). Microspore separation in the quartet 3 mutants of Arabidopsis is impaired by a defect in a developmentally regulated polygalacturonase required for pollen mother cell wall degradation. Plant Physiol. 133, 1170–1180. doi: 10.1104/pp.103.028266
Richards, R. A. (2000). Selectable traits to increase crop photosynthesis and yield of grain crops. J. Exp. Bot. 51, 447–458. doi: 10.1093/jexbot/51.suppl_1.447
Schiessl, S., Iniguez-Luy, F., Qian, W., Snowdon, R. J., Mendez-Vigo, B., Pico, F., et al. (2015). Diverse regulatory factors associate with flowering time and yield responses in winter-type Brassica napus. BMC Genomics 16:737. doi: 10.1186/s12864-015-1950-1
Shi, J., Li, R., Dan, Q., Jiang, C., Long, Y., Morgan, C., et al. (2009). Unraveling the complex trait of crop yield with quantitative trait loci mapping in Brassica napus. Genetics 182, 851–861. doi: 10.1534/genetics.109.101642
Shi, J., Zhan, J., Yang, Y., Ye, J., Huang, S., and Li, R. (2015). Linkage and regional association analysis reveal two new tightly- linked major-QTLs for pod number and seed number per pod in rapeseed (Brassica napus L.). Sci. Rep. 5:14481. doi: 10.1038/srep14481
Sun, C., Wang, B., Wang, X., Hu, K., Li, K., Li, Z., et al. (2016). Genome-wide association study dissecting the genetic architecture underlying the branch angle trait in rapeseed (Brassica napus L.). Sci. Rep. 6:33673. doi: 10.1038/srep33673
Tian, F., Bradbury, P. J., Brown, P. J., Hung, H., Sun, Q., Flint-Garcia, S., et al. (2010). Genome-wide association study of leaf architecture in the maize nested association mapping population. Nat. Genet. 43, 159–164. doi: 10.1038/ng.746
Turner, S. D. (2014). Qqman: an R Package for Visualizing GWAS Results using Q-Q and Manhattan Plots. BioRxiv Preprint.
Udall, J. A., Quijada, P. A., Lambert, B., and Osborn, T. C. (2006). Quantitative trait analysis of seed yield and other complex traits in hybrid spring rapeseed (Brassica napus L.): 2. Identification of alleles from unadapted germplasm. Theor. Appl. Genet. 113, 597–609. doi: 10.1007/s00122-006-0324-0
van der Sijde, M. R., Ng, A., and Fu, J. (2014). Systems genetics: from GWAS to disease pathways. Biochim. Biophys. Acta 1842, 1903–1909. doi: 10.1016/j.bbadis.2014.04.025
Venables, W. N., and Ripley, B. D. (2002). Modern Applied Statistics with S. Issues of Accuracy and Scale, Vol. 868. New York, NY: Springer-Verlag.
Wang, N., Chen, B., Xu, K., Gao, G., Li, F., Qiao, J., et al. (2016). Association mapping of flowering time QTLs and insight into their contributions to rapeseed growth habits. Front. Plant Sci. 7:338. doi: 10.3389/fpls.2016.00338
Wang, X., Chen, L., Wang, A., Wang, H., Tian, J., Zhao, X., et al. (2016). Quantitative trait loci analysis and genome-wide comparison for silique related traits in Brassica napus. BMC Plant Biol. 16:71. doi: 10.1186/s12870-016-0759-7
Wang, X., Wang, H., Wang, J., Sun, R., Wu, J., Liu, S., et al. (2011). The genome of the mesopolyploid crop species Brassica rapa. Nat. Genet. 43, 1035–1039. doi: 10.1038/ng.919
Wei, L., Jian, H., Lu, K., Filardo, F., Yin, N., Liu, L., et al. (2016). Genome-wide association analysis and differential expression analysis of resistance to Sclerotinia stem rot in Brassica napus. Plant Biotechnol. J. 14, 1368–1380. doi: 10.1111/pbi.12501
Wu, J., Zhao, Q., Liu, S., Shahid, M., Lan, L., Cai, G., et al. (2016). Genome-wide association study identifies new loci for resistance to Sclerotinia stem rot in Brassica napus. Front. Plant Sci. 7:1418. doi: 10.3389/fpls.2016.01418
Xu, L., Hu, K., Zhang, Z., Guan, C., Chen, S., Hua, W., et al. (2015). Genome-wide association study reveals the genetic architecture of flowering time in rapeseed (Brassica napus L.). DNA Res. 23, 43–52. doi: 10.1093/dnares/dsv035
Xu, M., Hu, T., Zhao, J., Park, M.-Y., Earley, K. W., Wu, G., et al. (2016). Developmental functions of miR156-regulated SQUAMOSA PROMOTER BINDING PROTEIN-LIKE (SPL) genes in Arabidopsis thaliana. PLoS Genet. 12:e1006263. doi: 10.1371/journal.pgen.1006263
Yan, X. Y., Li, J. N., Fu, F. Y., Jin, M. Y., Chen, L., and Liu, L. Z. (2009). Co-location of seed oil content, seed hull content and seed coat color QTL in three different environments in Brassica napus L. Euphytica 170, 355–364. doi: 10.1007/s10681-009-0006-5
Yang, M., Ding, G., Shi, L., Xu, F., and Meng, J. (2011). Detection of QTL for phosphorus efficiency at vegetative stage in Brassica napus. Plant Soil 339, 97–111. doi: 10.1007/s11104-010-0516-x
Yang, P., Shu, C., Chen, L., Xu, J., Wu, J., and Liu, K. (2012). Identification of a major QTL for silique length and seed weight in oilseed rape (Brassica napus L.). Theor. Appl. Genet. 125, 285–296. doi: 10.1007/s00122-012-1833-7
Yin, X., Chasalow, S. D., Stam, P., Kropff, M. J., Dourleijn, C. J., Bos, I., et al. (2002). Use of component analysis in QTL mapping of complex crop traits: a case study on yield in barley. Plant Breed. 121, 314–319. doi: 10.1046/j.1439-0523.2002.729117.x
Zhang, F., Zhao, Y. G., Gu, T. C., Zhang, D. X., Liu, F. L., Guo, R. X., et al. (2012). Yield and agronomic traits of winter rapeseed cultivars registered in China from 2001 to 2010. Chin. J. Oil Crop Sci. 34, 239–244.
Zhang, L., Yang, G., Liu, P., Hong, D., Li, S., and He, Q. (2011). Genetic and correlation analysis of silique-traits in Brassica napus L. by quantitative trait locus mapping. Theor. Appl. Genet. 122, 21–31. doi: 10.1007/s00122-010-1419-1
Zhao, W., Wang, X., Wang, H., Tian, J., Li, B., Chen, L., et al. (2016). Genome-wide identification of QTL for seed yield and yield-related traits and construction of a high-density consensus map for QTL comparison in Brassica napus. Front. Plant Sci. 7:17. doi: 10.3389/fpls.2016.00017
Zhong, R., Yuan, Y., Spiekerman, J. J., Guley, J. T., Egbosiuba, J. C., and Ye, Z. H. (2015). Functional characterization of NAC and MYB transcription factors involved in regulation of biomass production in switchgrass (Panicum virgatum). PLoS ONE 10:e0134611. doi: 10.1371/journal.pone.0134611
Zhou, Q. H., Fu, D. H., Mason, A. S., Zeng, Y. J., Zhao, C. X., and Huang, Y. J. (2014). In silico integration of quantitative trait loci for seed yield and yield-related traits in Brassica napus. Mol. Breed. 33, 881–894. doi: 10.1007/s11032-013-0002-2
Zhou, Z., Jiang, Y., Wang, Z., Gou, Z., Lyu, J., Li, W., et al. (2015). Resequencing 302 wild and cultivated accessions identifies genes related to domestication and improvement in soybean. Nat. Biotechnol. 33, 408–414. doi: 10.1038/nbt.3096
Keywords: Brassica napus, yield-determining traits, genome-wide association study, transcriptome sequencing, candidate genes
Citation: Lu K, Peng L, Zhang C, Lu J, Yang B, Xiao Z, Liang Y, Xu X, Qu C, Zhang K, Liu L, Zhu Q, Fu M, Yuan X and Li J (2017) Genome-Wide Association and Transcriptome Analyses Reveal Candidate Genes Underlying Yield-determining Traits in Brassica napus. Front. Plant Sci. 8:206. doi: 10.3389/fpls.2017.00206
Received: 21 November 2016; Accepted: 03 February 2017;
Published: 15 February 2017.
Edited by:
Xiaowu Wang, Biotechnology Research Institute (CAAS), ChinaReviewed by:
Zhongyun Piao, Shenyang Agricultural University, ChinaJianjun Zhao, Agricultural University of Hebei, China
Copyright © 2017 Lu, Peng, Zhang, Lu, Yang, Xiao, Liang, Xu, Qu, Zhang, Liu, Zhu, Fu, Yuan and Li. This is an open-access article distributed under the terms of the Creative Commons Attribution License (CC BY). The use, distribution or reproduction in other forums is permitted, provided the original author(s) or licensor are credited and that the original publication in this journal is cited, in accordance with accepted academic practice. No use, distribution or reproduction is permitted which does not comply with these terms.
*Correspondence: Kun Lu, ZHJsdWt1bkBzd3UuZWR1LmNu
Jiana Li, bGpuMTk1MEBzd3UuZWR1LmNu
†These authors have contributed equally to this work.