 Qiaojun Jia
 Junmei Wang3
- 1College of Life Sciences, Zhejiang Sci-Tech University, Hangzhou, China
- 2Key Laboratory of Plant Secondary Metabolism and Regulation of Zhejiang Province, Hangzhou, China
- 3Zhejiang Academy of Agricultural Sciences, Hangzhou, China
Black barley is caused by phytomelanin synthesized in lemma and/or pericarp and the trait is controlled by one dominant gene Blp1. The gene is mapped on chromosome 1H by molecular markers, but it is yet to be isolated. Specific-locus amplified fragment sequencing (SLAF-seq) is an effective method for large-scale de novo single nucleotide polymorphism (SNP) discovery and genotyping. In the present study, SLAF-seq with bulked segregant analysis (BSA) was employed to obtain sufficient markers to fine mapping Blp1 gene in an F2 population derived from Hatiexi No.1 × Zhe5819. Based on SNP screening criteria, a total of 77,542 polymorphic SNPs met the requirements for association analysis. Combining two association analysis methods, the overlapped region with a size of 32.41 Mb on chromosome 1H was obtained as the candidate region of Blp1 gene. According to SLAF-seq data, markers were developed in the target region and were used for mapping the Blp1 gene. Linkage analysis showed that Blp1 co-segregated with HZSNP34 and HZSNP36, and was delimited by two markers (HZSNP35 and HZSNP39) spanning 8.1 cM in 172 homozygous yellow grain F2 plants of Hatiexi No.1 × Zhe5819. More polymorphic markers were screened in the reduced target region and were used to genotype the population. As a result, Blp1 was delimited within a 1.66 Mb on chromosome 1H by the upstream marker HZSNP63 and the downstream marker HZSNP59. Our results demonstrated the utility of SLAF-seq-BSA approach to identify the candidate region and discover polymorphic markers at the specific targeted genomic region.
Introduction
Most barley (Hordeum vulgare. L) varieties that are now planted and consumed for malting, brewing and feed purposes are yellow or white, but some showed purple (red), blue and black grains are used as functional food. Purple barley is due to anthocyanins accumulated in the pericarp and glumes; blue color results from anthocyanins synthesized in aleurone layer of the grain; black pigments is caused by phytomelanin synthesized in lemma and/or pericarp (Harlan, 1914). Colored cereals/plants begin receiving a growing interest due to their antioxidant properties (Satué-Gracia et al., 1997; Nam et al., 2006; Philpott et al., 2006) and protective functions under severe environments (Carletti et al., 2014). It has been reported that colored barley are rich in a large number of valuable nutrients, including phenolic compounds, anthocyanins and antioxidants, and exhibit a relatively strong oxygen radical scavenging capacity (Kim et al., 2007; Bellido and Beta, 2009). Plants with highly pigments such as phytomelanins and flavonoids are more resistant to biotic and abiotic stresses (Pandey and Dhakal, 2001; Carletti et al., 2014). In rice and sorghum, flavonoids contribute to the resistance against Magnaporthe grisea and Colletotrichum spp. (Ibraheem et al., 2010). The presence of phytomelanin layer in the sunflower pericarp serves as a deterrent to insect predation, affording mechanical protection against larval damage (Carletti et al., 2014). Dihydroquercetin, one of the flavonoids in barley is proved to be a strong inhibitor of Fusarium growth and macrospore formation (Skadhauge et al., 1997). In addition, black barley has a lower Fusarium head blight (FHB) incidence and less deoxynivalenol (DON) concentration than yellow barley after comparison of black and yellow recombinant inbred lines (RILs) from two different crosses (Choo et al., 2015).
Grain color genes have been reported in barley. Both Pre1 and Pre2, located on chromosome 1H and 2H, respectively, control purple or red lemma and pericarp trait development in barley (Franckowiak et al., 1997). Recently, Pre2 gene was mapped between InDel marker PQJ1056 and HvOs04g47170 with genetic distance of 0.3 and 0.1 cM, respectively (Jia et al., 2016). Moreover, barley flavonoid biosynthesis regulatory genes also affect lemma colors, such as Ant2 encoding one of the basic Helix-Loop-Helix (bHLH) proteins in the anthocyanin pigmentation pathways (Cockram et al., 2010). Barley varieties with Ant2 gene showed red auricle, awns and lemma because of the accumulation of anthocyanin pigments in these tissues (Cockram et al., 2010). Finch and Simpson (1978) reported that five complementary dominant genes symbolized as Blx1, Blx2, Blx3, Blx4, and Blx5, controlled barley blue aleurone color. They assigned Blx1, Blx3, and Blx4 to chromosome 4HL, and Blx2 and Blx5 to chromosome 7HL. It has been reported that black grain is dominant over yellow grain and is controlled by Blp1 located on chromosome 1HL (Franckowiak et al., 1997). Molecular markers have been identified to associate with the black color gene Blp1, which is mapped at the position 129.5 cM on chromosome 1H in the Oregon Wolfe Barley (OWB) double haploid (DH) population (Costa et al., 2001). The OWB DH population was derived from the F1 of a cross between OWB-D (black grain) and OWB-R (yellow grain) using H. bulbosum technique (Wolfe, 1972). Genetic mapping with CAPS markers derived from high-throughput single nucleotide polymorphisms (SNPs) reveals that Blp1 is associated with CAPS markers CAPS026 to CAPS030 in 1HL and is closely linked with CAPS029 at the position 116.3 cM in an F2 population of Cheri (yellow grain) × ICB181160 (black grain) (Bungartz et al., 2016). Presently, the Blp1 gene is yet to be isolated.
Bulked segregant analysis (BSA) is a traditional method to rapidly map a target gene or major QTL affecting a trait of interest by genotyping only two bulked DNA samples with distinct or opposing extreme phenotypes (Michelmore et al., 1991). Specific-locus amplified fragment sequencing (SLAF-seq) is a newly efficient strategy for large-scale de novo SNP discovery and high-resolution genotyping (Sun et al., 2013). Combining BSA and SLAF-seq technologies have been successfully proven to be a powerful method for identifying major QTLs or candidate gene isolation in maize (Xia et al., 2015), rice (Xu F. et al., 2015), cucumber (Xu X. et al., 2015), barley (Qin et al., 2015), wheat (Hu et al., 2016), tomato (Zhao et al., 2016), and pepper (Xu et al., 2016).
Hatiexi No.1 with black lemma and pericarp, is one of the landraces from Heilongjiang Province, China. Zhang (1997) reported that the inheritance of black grain of Hatiexi No.1 was governed by Blp1 gene due to their genetic studies involving F1 and F2 generations from the cross Hatiexi No.1 (black grain) × 93-597 (yellow grain). In this study, Hatiexi No.1 with black grain was crossed to barley variety Zhe5819 with yellow grain to construct F2 population, and we aimed to (1) find black lemma and pericarp gene-containing regions by integrating BSA with SLAF-seq technology, (2) develop SNP markers and genotype segregating populations to map the Blp1 gene, (3) narrow down the size of the candidate gene regions, laying foundation for cloning the grain color gene.
Materials and Methods
Plant Materials
The black grain barley Hatiexi No.1 was crossed with the yellow grain variety Zhe5819. The resulting F1 plants were self-crossed to obtain F2. Grain color of F1 and F2 were examined in the field before harvested. The F2 population of Hatiexi No.1 × Zhe5819 consists of 551 black grain lines and 172 yellow grain lines. For mapping the gene controlling grain color, homologous yellow individuals were selected from F2 population of Hatiexi No.1 × Zhe5819.
DNA Isolation
Young leaves of the two parents (Hatiexi No.1 and Zhe5819) and F2 individuals were collected for DNA extraction. Total genomic DNA was prepared from leaf tissues using CTAB method (Murray and Thompson, 1980). DNA concentration and quality were estimated using a Nanodrop 2000 UV-vis spectrophotometer machine and by electrophoresis through 0.8% agrose gels.
Construction of SLAF Library for Sequencing and Analysis of SLAF-seq Data
Fifty plants with black grain and fifty plants with yellow grain were selected randomly from the F2 generation as two pools for SLAF-seq-BSA. The black pool and yellow pool were constructed by mixing an equal amount of DNA from 50 black individuals and 50 yellow individuals, respectively. The parents and two pools were used for SLAF library construction and sequencing as described previously (Sun et al., 2013; Hu et al., 2016). A pre-design SLAF experiment was designed to determine conditions and appropriate restriction enzymes for digestion that optimize SLAF yield and maximize SLAF-seq efficiency. The SLAF library was conducted in accordance using the pre-designed scheme. Genomic DNA was digested with RsaI (New England Biolabs, NEB). After that, a single-nucleotide A overhang were added to the digested fragments with Klenow Fragment (3′→ 5′ exo–) (NEB) and dATP at 37°C, and then the Duplex Tag-labeled Sequencing adapters (PAGE purified, Life Technologies) were ligated to the A-tailed fragments with T4 DNA ligase. PCR reaction was performed using diluted restriction-ligation DNA samples, dNTP, Q5 High-Fidelity DNA Polymerase and PCR primers: AATGATACGGCGACCACCGA and CAAGCAGAAGACGGCATACG (PAGE purified, Life Technologies). The PCR productions were purified using Agencourt AMPure XP beads (Beckman Coulter, High Wycombe, United Kingdom) and then pooled. The pooled sample was separated by electrophoresis using 2% agarose gel. Fragments with 364–394 bp (with indexes and adaptors) in size were excised, and then purified using QIAquick Gel Extraction Kit (QIAGEN). The gel-purified product was sequenced on the Illumina HiSeq 2500 system (Illumina, Inc; San Diego, CA, United States) according to the manufacturer’s recommendations.
After sequencing, all reads were aligned to barley reference genome released by The International Barley Sequencing Consortium in 2012 (IBSC 20121) using BWA software (Li and Durbin, 2009). Sequences with over 90% identity were grouped in one SLAF locus. Specific fragments were considered as SLAF tags and polymorphic SLAFs were selected due to their polymorphism between two parents. Based on physical position of SLAF tags, SNP calling was performed by local realignment and mutation detection using GATK software2. We excluded SNPs which supported less than four reads in the two pools and showed no polymorphism between the parents because they may be false positives due to genomic repeat sequence, sequencing or alignment errors. Then SNPs showed multiple allele loci and monomorphism between the black and yellow pools were removed. Finally, SNPs with one genotype derived from Hatiexi No.1 and the other from Zhe5819 were identified as polymorphic markers, and were selected for association analysis.
Association Analysis
Association mapping was conducted to identify candidate regions for black lemma and pericarp using both SNP_index (Abe et al., 2012; Takagi et al., 2013) and Euclidean distance (ED) methods (Hill et al., 2013).
SNP_index association analysis, a recently published method, is used to calculate genotype frequency differences between two bulks that were satisfied by Δ(SNP_index). The closer marker is associated with phenotype while the closer Δ(SNP_index) is associated with 1. M stands for Hatiexi No.1, P stands for Zhe5819, aa denotes the genotype from Hatiexi No.1 in the black pool, and ab denotes the genotype from the yellow pool. The Δ(SNP_index) was calculated as follows:
Mab and Pab were the depth of yellow pool from black and yellow grain parents, respectively; and Maa and Paa indicated the depth of black pool from black and yellow grain parents, respectively.
The allelic frequency was calculated by Euclidean distance followed by Loess regression analysis which identifies regions in which QTL lies and generates a list of putative regions in the linked genomic segment.
Euclidean distance association analysis is a type of method that calculates Euclidean distance and is satisfied by ED according to Hill et al. (2013) and Geng et al. (2016). In principle, the higher the ED value is, the closer the object site. The raw ED was calculated at each SNP location using the equation:
Aaa, Caa, Taa, and Gaa represent the depth of bases A, C, T, and G on a site in the black grain bulk, respectively. Aab, Cab, Tab, and Gab represent the depth of bases A, C, T, and G on a site in the yellow grain bulk, respectively.
In order to increase the effect of large ED measurements and decrease the effects of background noise, the allele frequency of raw ED raised to the fifth power. Then the fitting result of ED5 calculated using local linear regression of the EDs with a span automatically chosen by minimizing the corrected Aikaike Information Criterion (AICc) (Hill et al., 2013), was used to associate analysis.
Markers Development by SLAF-seq Strategy and Hatiexi No.1 × Zhe5819 F2 Population Genotyping
To minimize the genetic interval for fine-mapping and to verify the accuracy of SLAF-seq, We chose at about 1 Mb one to three potential SNPs located in the candidate region (Chr 1H 427,749,941 to 460,155,270 bp, IBSC 2012) to design their flanking primers using Oligo Primer Analysis Software v.7 which ranged from 100 to 300 bp in length. PCR reaction conditions were as follows: denaturation at 94°C for 5 min, 35 amplification cycles of 94°C for 30 s, annealing at 55°C for 30 s, and extension at 72°C for 30 s, with a final extension at 72°C for 5 min. PCR products were separated on 6% polyacrylamide gel (acrylamide/bisacrylamide ratio of 37.5:1) in 0.5 × Tris-Borate-EDTA (TBE) buffer and ran at room temperature for 2–4 h, stained with silver nitrate, and observed on white illumination. Size differences in polymorphisms were identified between Hatiexi No.1 and Zhe5819. PCR products showed no size polymorphisms on the polyacrylamide gel were sequenced in one direction using the specific PCR primers distal to the potential SNP position by biosune (Shanghai) Biotechnology Co., Ltd. The Megalign program (DNAStars) was used for sequence alignment and to confirm SNP sites.
The confirmed SNP markers were genotyped in 172 homozygous yellow individuals from F2 of Hatiexi No.1 × Zhe5819 following SNP marker detection with direct DNA sequencing or KASPar platform. Kompetitive Allele-Specific PCR (KASP) is a SNP genotyping system from LGC Genomics (United Kingdom) that tags different fluorescent dye to each SNP allele during the PCR reaction. Twenty two SNP markers were detected employing KASPar platform in segregating population by Beijing Vegetable Research Center (China). The KASP genotyping procedures were followed according Wen et al. (2015). The size differences markers were identified by polyacrylamide gel electrophoresis (PAGE). Other polymorphic markers were analyzed by Sanger DNA sequencing.
Genetic Mapping
Linkage analysis of the molecular markers and black grain trait was performed using MAPMAKER version 3.0 software (Lander et al., 1987). Map distances were estimated using the Kosambi equation (Kosambi, 1944). For fine mapping, closer markers linked to the candidate gene were further developed and tested for their polymorphisms between the parents using Sanger DNA sequencing. Polymorphic markers were used for analysis of yellow grain plants from F2 generation. The alleles with the same genotype as that of black grain landrace Hatiexi No.1 was marked as ‘1,’ and alleles with the same genotype as that of yellow grain variety Zhe5819 was labeled as ‘0.’ For F2 plants with yellow grain, there are three possible genotypes for these markers, namely non-recombinants with ‘0/0,’ single recombinants with ‘0/1,’ and double recombinants with ‘1/1.’
Results
Analysis of Slaf-seq-Bsa Data and Slaf Tags
After SLAF library construction and high-throughput sequencing, a total of 180,828,494 valid single-end reads were obtained, with each read length of ∼100 bp (Table 1). The GC content was 43.10% and the Q30 ratio was 92.92%. The SLAF numbers were 160,977 for Hatiexi No.1 and 181,313 for Zhe5819. The average sequence depths of SLAFs were ∼16.44- and ∼27.12-fold in black parent (Hatiexi No.1) and yellow parent (Zhe5819), respectively; and ∼45.41- and ∼41.27-fold in the black pool and yellow pool, respectively, (Table 1). SLAF tags were mapped on barley assembly (IBSC 2012) and 233,701 SLAFs markers distributed throughout the genomes. The SLAF numbers and chromosome positions are shown in Table 2.

TABLE 1. Summary of the sequencing data for each sample.
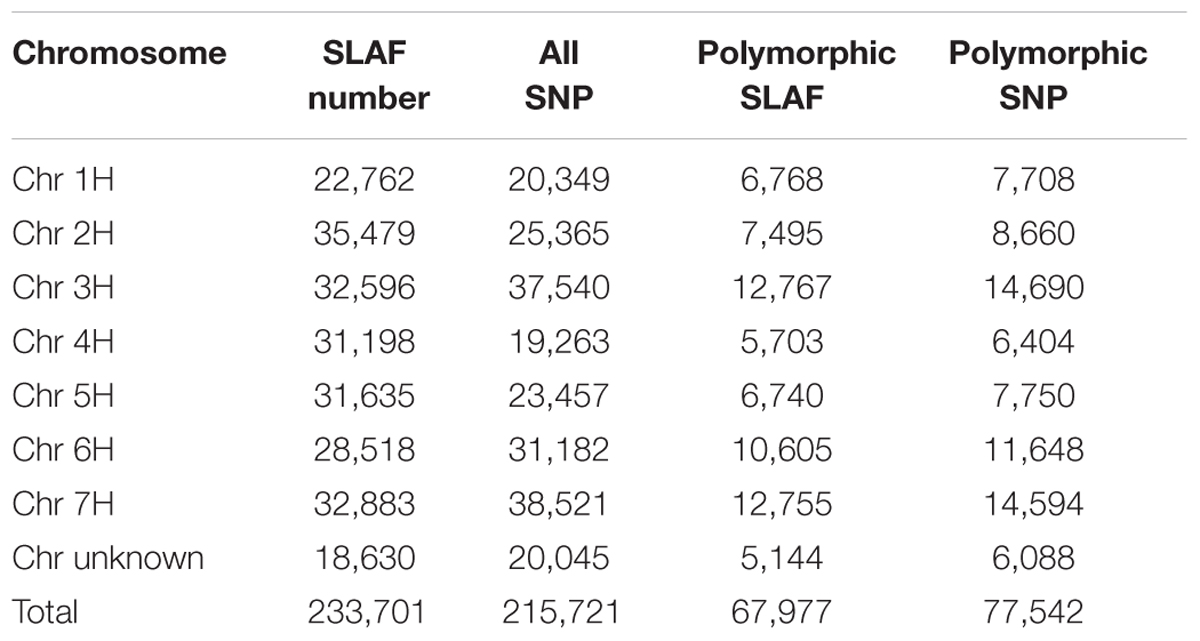
TABLE 2. Number distribution of specific-locus amplified fragment (SLAF) tags, single nucleotide polymorphism (SNP) markers, polymorphic SLAF and SNP on each chromosome.
Polymorphic SNP Markers Screening
From the 233,701 SLAF tags, 215,721 SNPs were obtained after aligning the sequence data to the barley reference. At the stage of SNP calling, SNPs with multiple allele loci and a depth less than 5× were filtered out. Polymorphic SNPs refer to SNPs that show polymorphic not only between the parents but also between the two bulked DNA samples. Finally, 77,542 polymorphic SNPs were ultimately selected for further analysis and the statistics of marker numbers on each chromosome according to the positioning result are shown in Table 2.
Association Analysis with SNP_index and Euclidean Distance
Both SNP_index and Euclidean distance association analysis were used to identify the candidate regions for barley black lemma and pericarp trait. For the SNP_index method, SNP_index was calculated for each identified SNP according to Abe et al. (2012) and Takagi et al. (2013). An average SNP_index of SNPs was calculated with 200 SNP_indexes located in a given genomic interval. SNP_index graphs were generated for the yellow (Figure 1A) and black (Figure 1B) pools by plotting the average SNP_index against the position of each sliding window in the barley genome assembly (IBSC 2012). After combining the SNP_index information into the yellow and black pools, the Δ(SNP_index) was calculated and plotted against the genome positions (Figure 1C). Peak regions above the threshold value were defined as those where Loess fitted values were greater than standard deviations above the genome-wide median in the Δ(SNP_index) plot. One candidate region associated with barley black grain spanned 49.28 Mb on chromosome 1H (from 414,847,463 to 464,122,721 bp, barley genome assembly, IBSC 2012), was identified with Δ(SNP_index) value above the threshold value of 0.26 (Figure 1C).
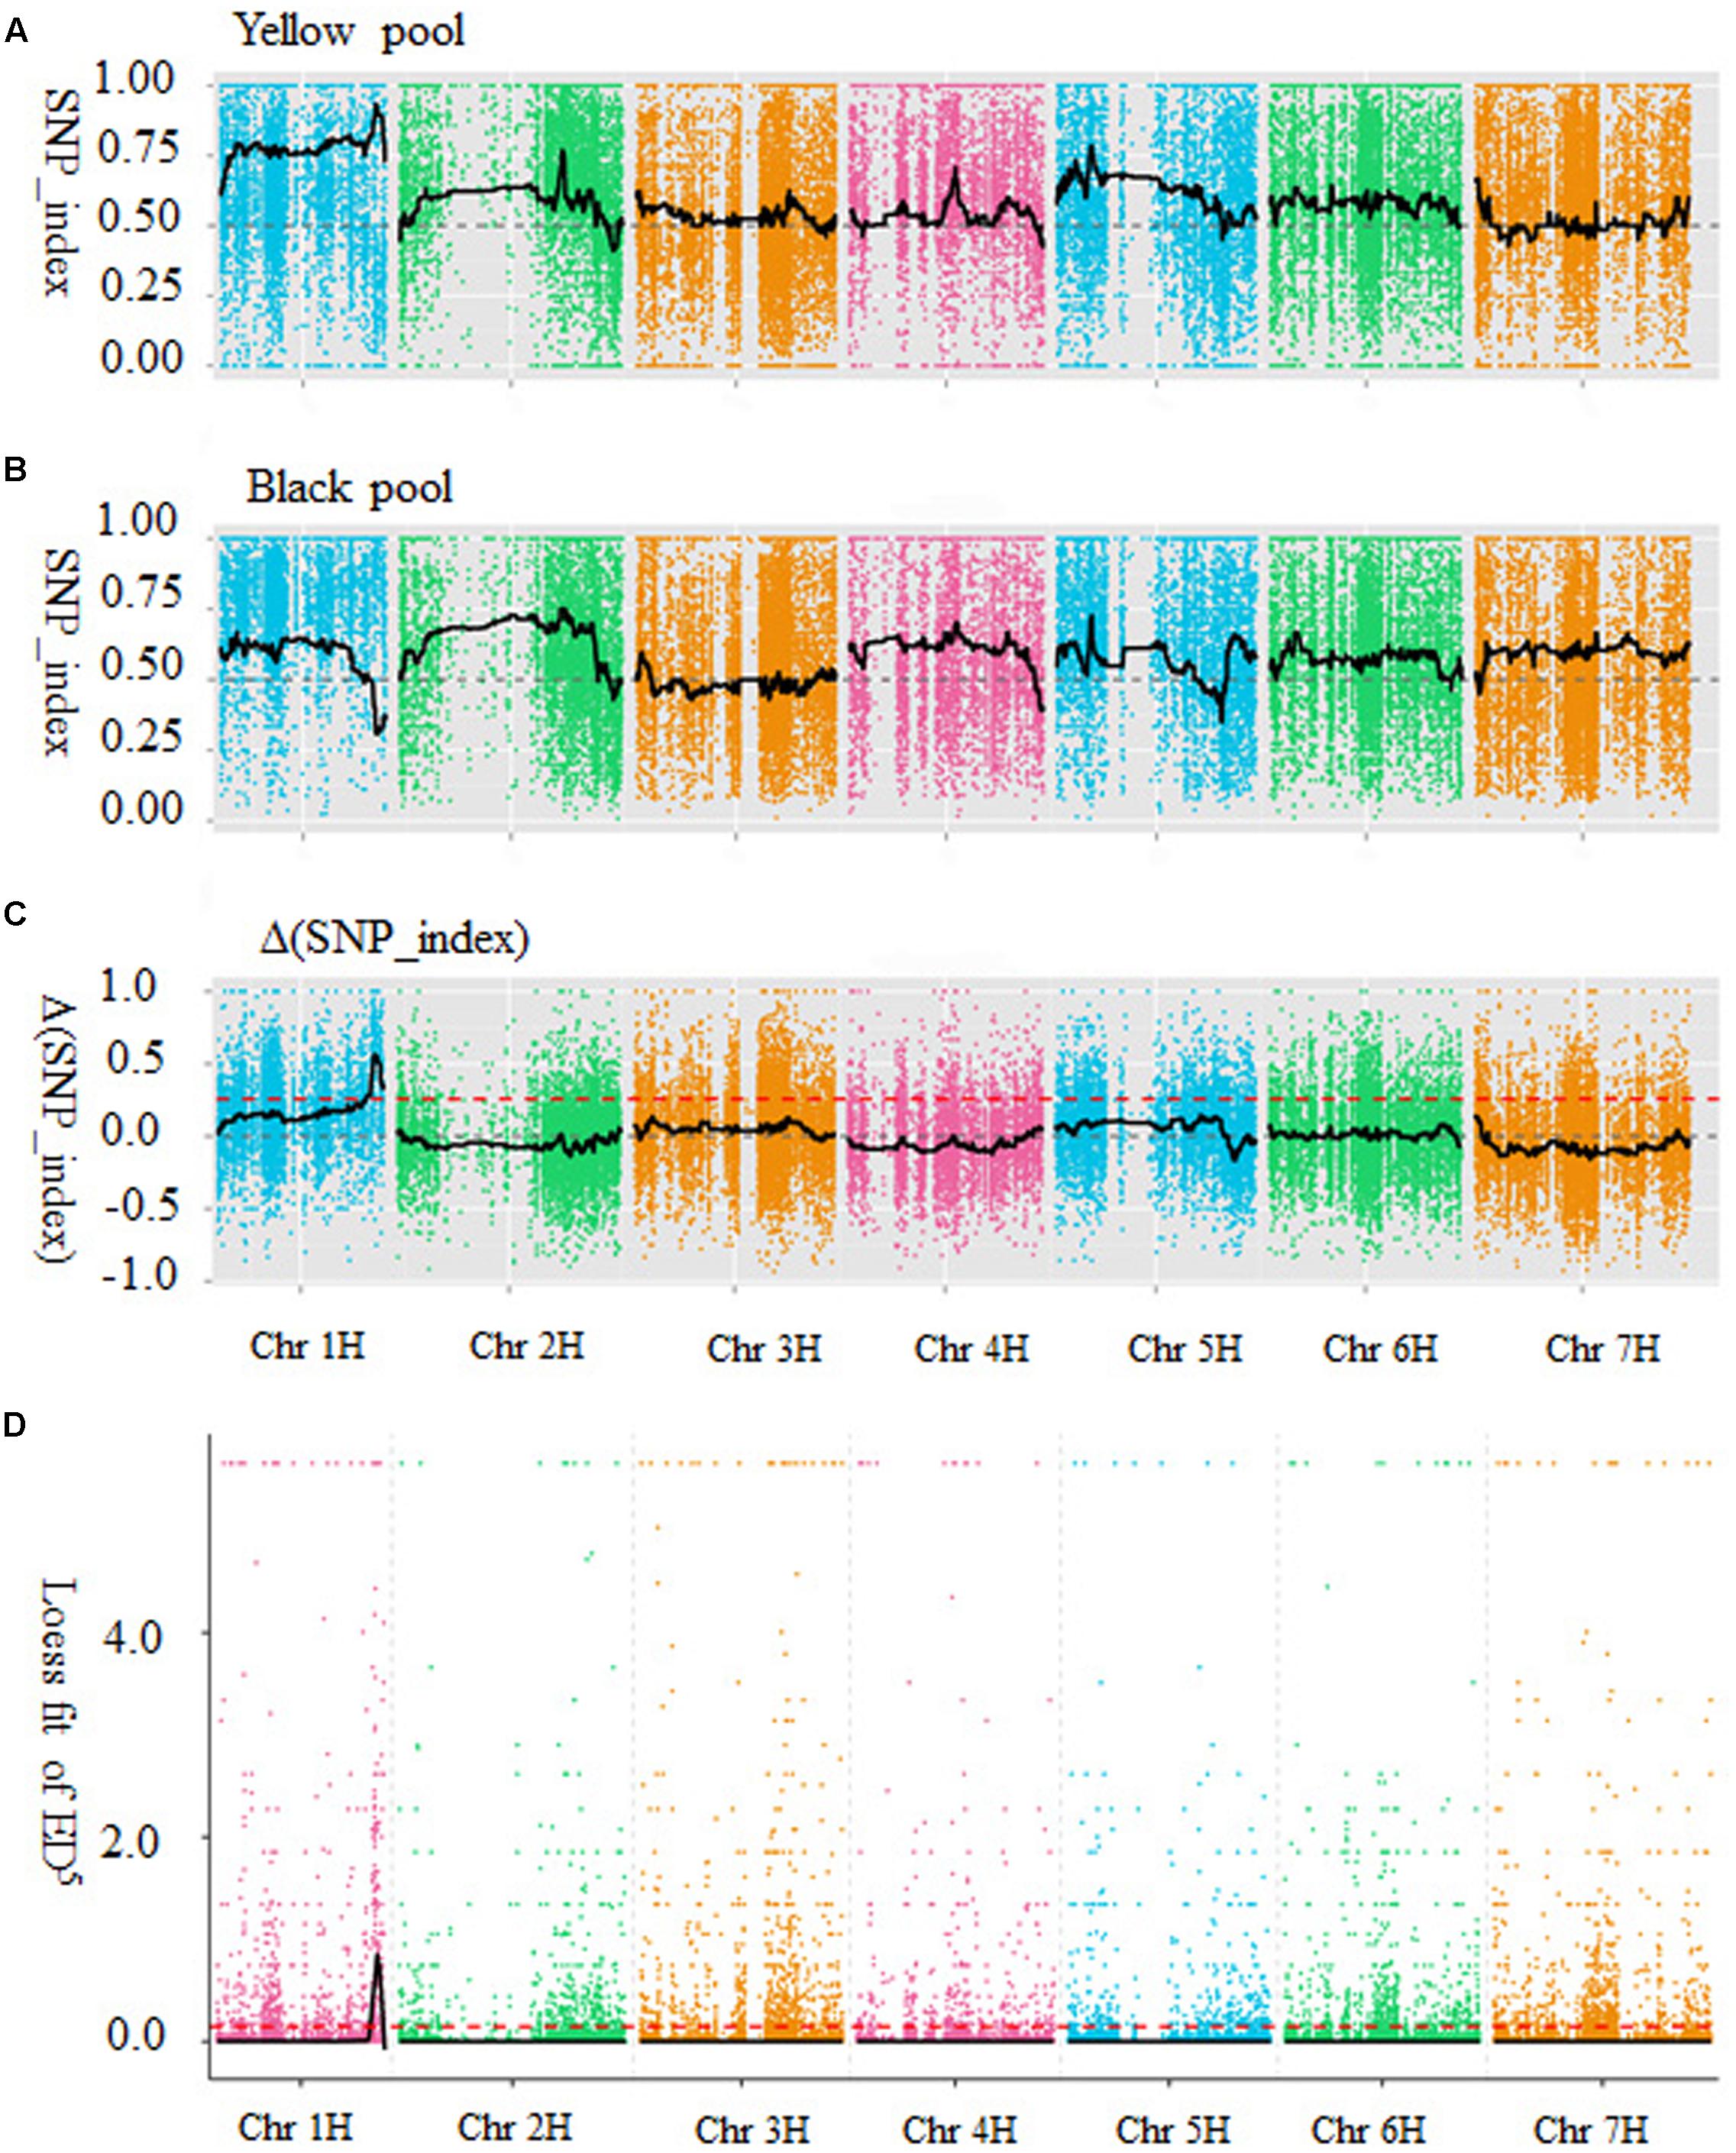
FIGURE 1. Identification of the candidate region for black lemma and pericarp through two types of association methods. (A) SNP_index graph of yellow pool. (B) SNP_index graph of black pool. (C) SNP_index graph of Δ(SNP_index). The red dot line is the threshold value (0.26). (D) The results of Euclidean distance association analysis. The black lines show all fitting results of ED5, red dot lines show the threshold of ED. X-axis represents the position of seven chromosomes and Y-axis represents the SNP_index or Loess fit of ED5.
Euclidean distance (ED) was calculated for each SNP according Hill et al. (2013). To increase the effect of large ED measurements and decrease the effects of low ED measurements/noise, the 5th power of ED was calculated as the correlation value. The association threshold was 0.15 and one region on chromosome 1H was significantly correlated with the black lemma and pericarp trait. The result of the Euclidean distance association analysis was shown in Figure 1D. According to barley physical map (IBSC 2012), the candidate region was physically located on chromosome 1H between 427,749,941 and 460,155,270 bp, with a size of 32.41 Mb.
Combining the results of SNP_index and Euclidean distance association analysis suggested that the overlapped region (427,749,941–460,155,270 bp on chromosome 1H, IBSC 2012) was the candidate region of the barley black lemma and pericarp gene.
Validation of the SNP Markers and Mapping the Candidate Gene
A total of 524 potential polymorphic SNPs were obtained in the 32.41 Mb candidate regions (Supplementary Table S1). To evaluate the accuracy of SLAF genotyping data, one to three SNPs per Mb were selected across the entire candidate region. Fifty four pairs of primers were designed due to their potential polymorphisms and physical position on barley genome assembly (IBSC 2012). Markers polymorphisms between Hatiexi No.1 and Zhe5819 were verified by electrophoresis and independent traditional Sanger sequencing. Thirteen of fifty four primer pairs showed no PCR products in one parent or both parents and were removed from analysis. HZSNP34 makers showed InDel polymorphism on polyacrylamide gels. The rest of the PCR products of the two parents showed no size polymorphisms on the polyacrylamide gels were sequenced directly. Sequences alignment between the parents identified twenty nine polymorphic markers (Supplementary Table S2). Among the twenty nine polymorphic markers, 24 markers showed SNP and five of them showed multi-nucleotide polymorphisms (Supplementary Table S2).
KASPar platform was used to conduct SNP genotyping in the F2 population consisting of 172 homozygous yellow grain individuals. Twenty two KASPar type SNP markers, including 19 SNP markers and 3 multi-nucleotide polymorphism markers (HZSNP15, HZSNP28, and HZSNP36), were designed (Supplementary Table S3). For three multi-nucleotide polymorphism markers, KASPar assays just screened one SNP, which is more than 50 bp away from the other variant sites. Except HZSNP28, all the KASPar type SNP markers genotyped the population successfully. InDel marker HZSNP34 was distinguished easily on 6% polyacrylamide gel in the population.
Linkage analysis showed that all markers were assigned to the target regions and the gene controlling black lemma and pericarp was delimited by markers HZSNP35 (1.9 cM) and HZSNP39 (6.2 cM) (Figure 2A). Moreover, the gene was co-segregated with HZSNP34 and HZSNP36. These results suggested that the markers mined from SLAF-seq-BSA data are reliable. According to the barley genome assembly (IBSC 2012), the markers order in the genetic map was not consistent with its physical map (Figure 2A and Supplementary Table S2). Thus, all marker sequences were blast against the current barley assembly released by the International Barley Sequencing Consortium in 2017 (IBSC 20173). Blast alignment analysis showed that the genetic map was incompliance with the current physical map (IBSC 2017) and the physical distance between markers HZSNP35 (536444825–536445008 bp) and HZSNP39 (542121828–542122039 bp) to be approximately 5.68 Mb on IBSC 2017 assembly (Supplementary Table S2). The chromosomal location of this locus corresponded with black lemma and pericarp1 (Blp1) described by Costa et al. (2001) and Bungartz et al. (2016). Hence, we also named the gene as Blp1 following previously.
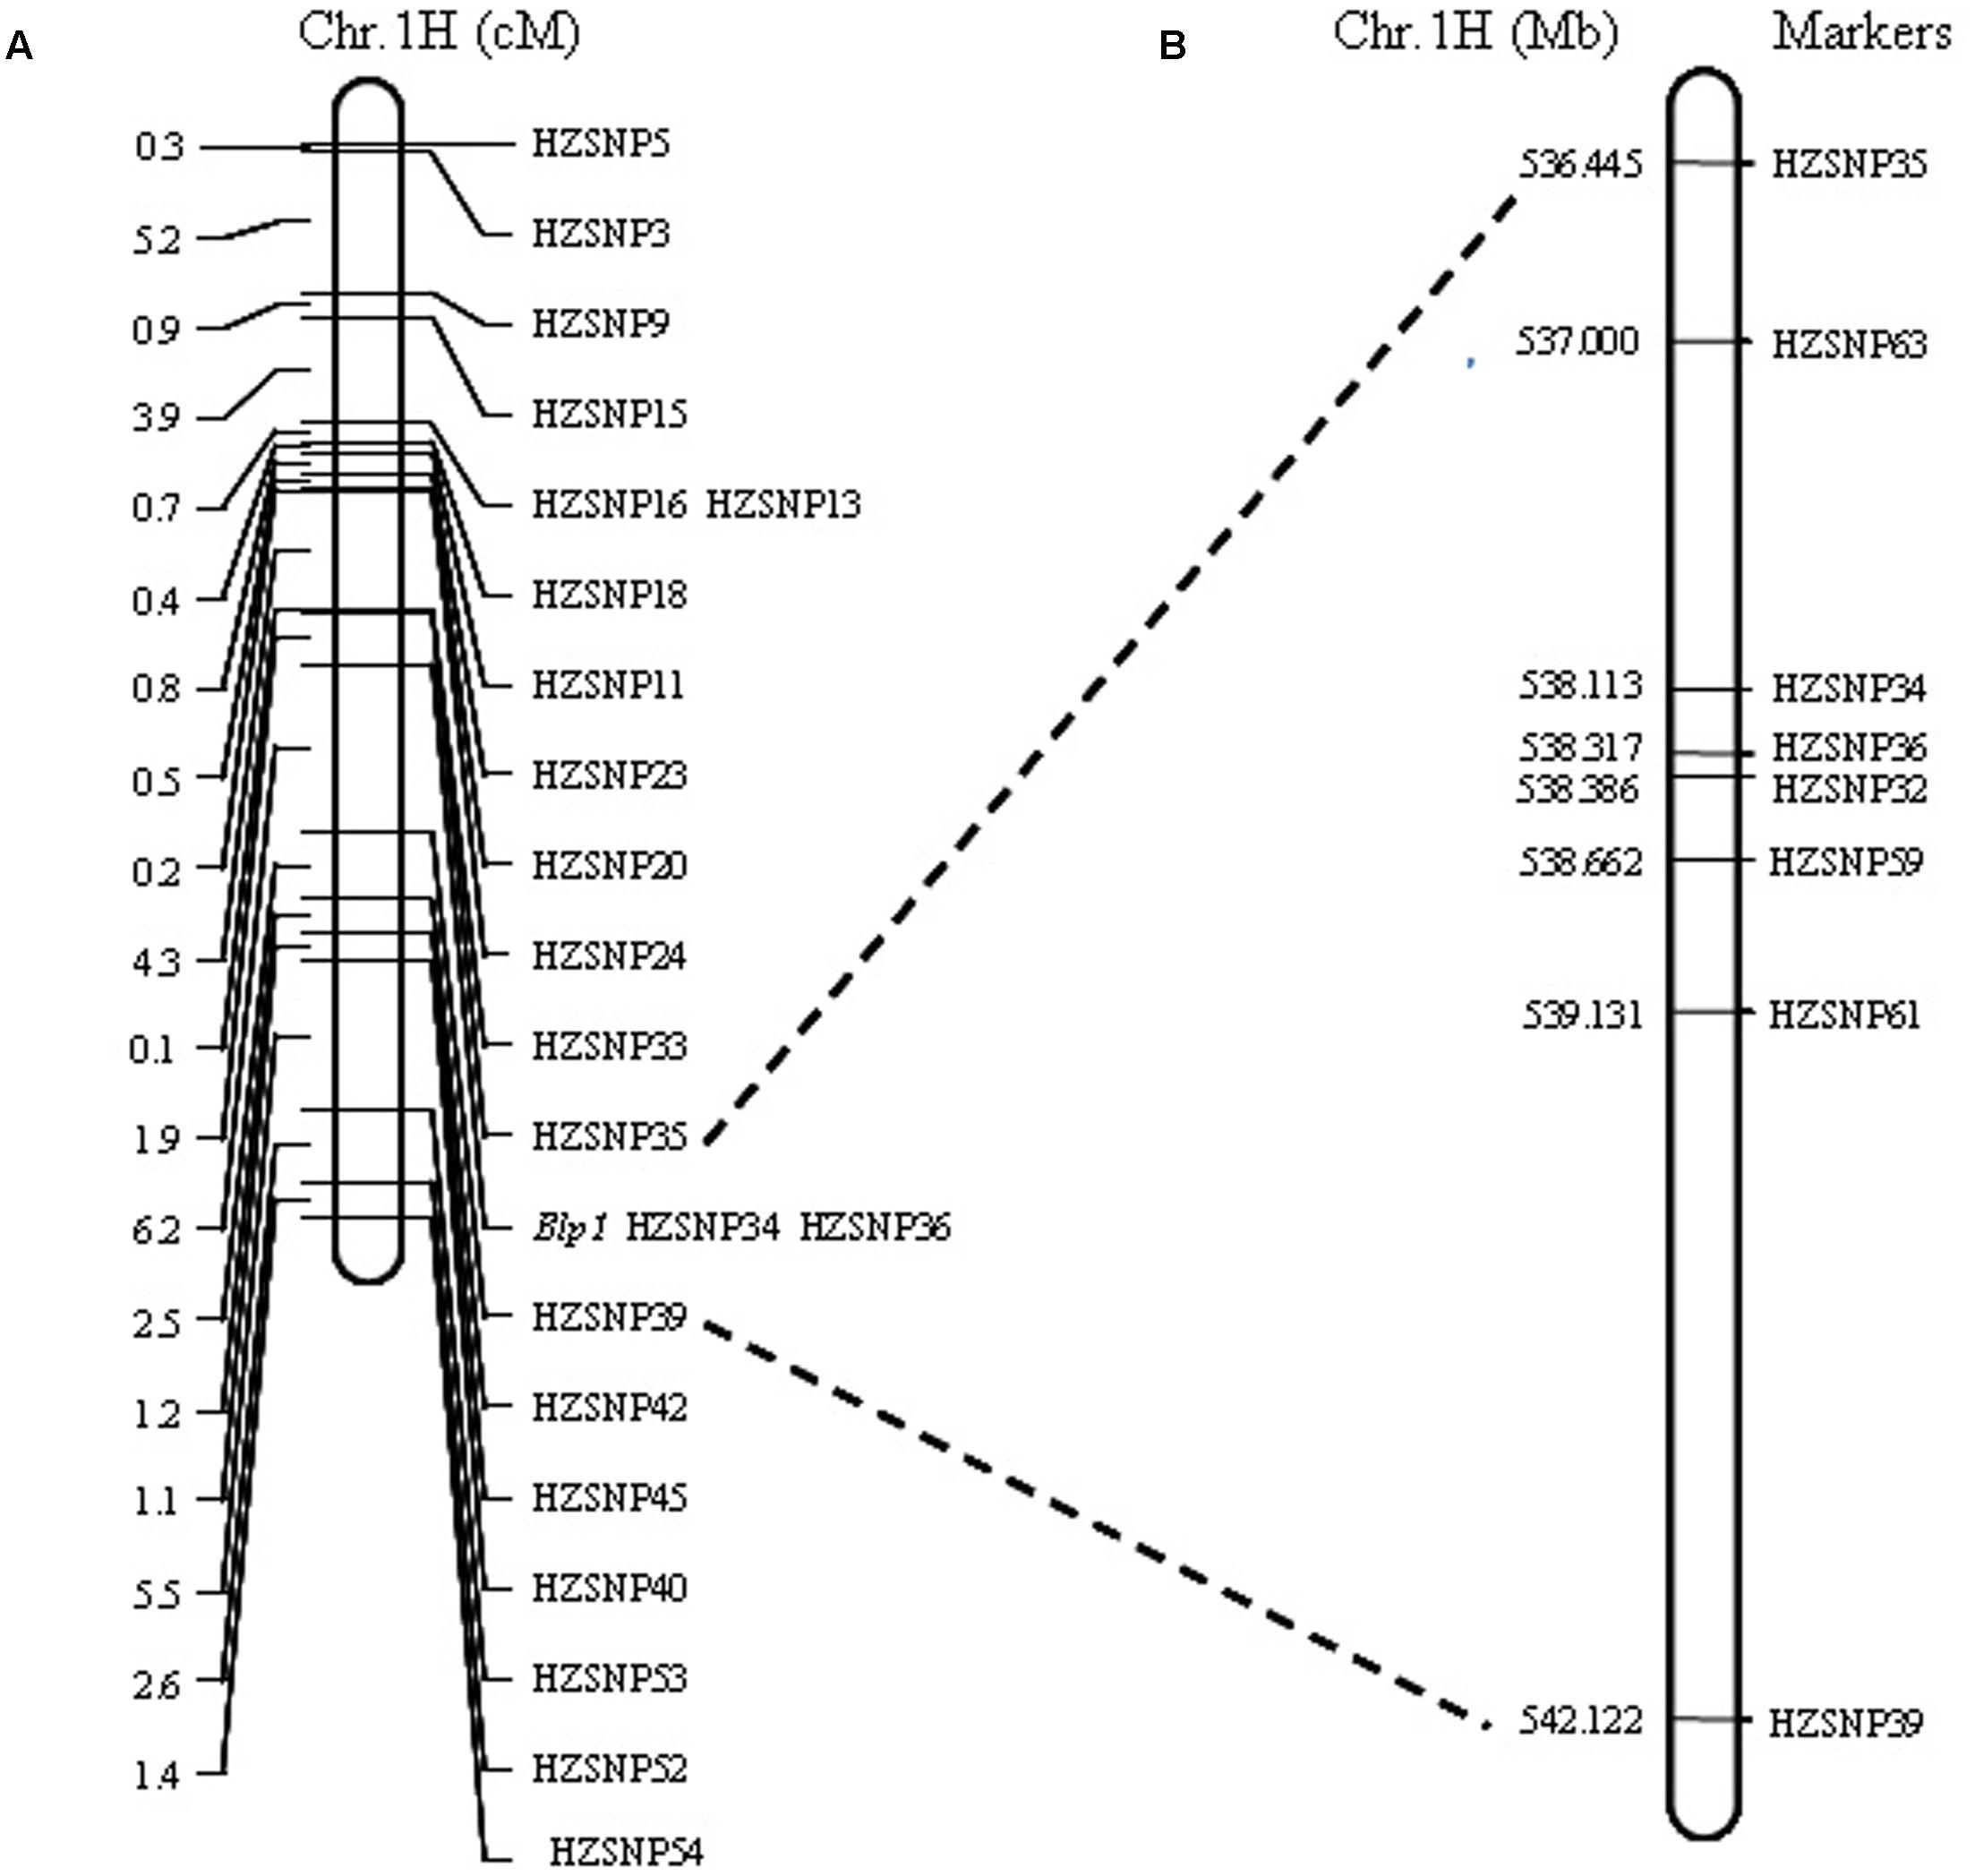
FIGURE 2. Mapping of the Blp1 gene. (A) The Blp1 gene was restricted to the region between markers HZSNP35 and HZSNP39; (B) the Blp1 gene was further narrowed down to the region between markers HZSNP63 and HZSNP59.
Fine Mapping the Blp1 Gene
Markers developed by SLAF-seq in the 5.68 Mb (HZSNP35–HZSNP39) intervals were further screened to obtain polymorphic markers between the parents with direct DNA sequencing. Four polymorphic markers, including three co-dominant markers (HZSNP59, HZSNP61 and HZSNP63) and one dominant marker (HZSNP62) were identified (Supplementary Table S2). Then the co-dominant markers and HZSNP32 located in the reduced target region, were used to analyze the genotypes of yellow pericarp F2 plants. Among the 172 homozygous yellow F2 plants of Hatiexi No.1 × Zhe5819, six plants (Y225, Y314, Y333, Y372, Y401, and Y406) were recombinants on the HZSNP63 locus and nine plants (Y316, Y415, Y328, Y330, Y331, Y332, Y379, Y422, and Y444) on the HZSNP61 locus (Table 3). Two plants (Y316 and Y415) appeared to be recombinants on locus HZSNP59 in the downstream (Table 3). Because of the limited markers, no recombinant loci were found to be closer than HZSNP63. Eventually, the Blp1 gene was delimited within a 1.66 Mb (IBSC 2017 assembly, Chr 1H: 536,999,583-538,661,822) by the upstream marker HZSNP63 and the downstream marker HZSNP59 (Figure 2B and Table 3).
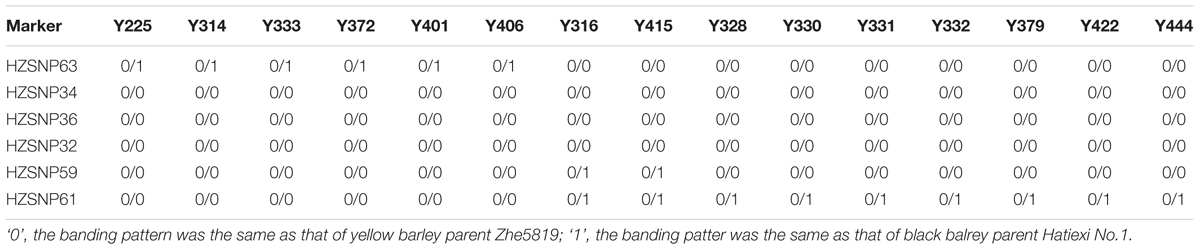
TABLE 3. The InDel and SNP genotype of yellow F2 plants of Hatiexi No.1 × Zhe5819 used for fine mapping of the Blp1 gene.
Discussion
Bulked segregant analysis coupled with SLAF-seq has facilitated the rapid identification genomic regions associated with genes or QTLs in plants. Genes controlling qualitative traits, such as barley Stage Green-Revertibel Albino (Qin et al., 2015), cucumber fruit flesh thickness (Xu X. et al., 2015), maize inflorescence meristem size (Xia et al., 2015) and tomato Cladosporium fulvum-resistant (Zhao et al., 2016), were finely mapped in association analysis by SLAF-seq-BSA method. Using the same approach, major QTLs for grain weight were detected in rice and wheat, respectively (Xu F. et al., 2015; Hu et al., 2016). In the present study, polymorphic SNPs were obtained between two barley parents based on BSA combined with SLAF-seq. Both SNP_index and Euclidean distance association analysis identified Blp1 candidate region with a size of 32.41 Mb on chromosome 1H, which correspond to the locus identified by Costa et al. (2001) and Bungartz et al. (2016). This result confirms that SLAF-seq combined with BSA is a high-efficient strategy for mapping the candidate gene using an F2 population.
With the development of next-generation sequencing (NGS) technologies, NGS-derived SNPs have been reported in Arabidopsis (Jander et al., 2002), rice (Feltus et al., 2004), barley (Close et al., 2009), maize (Jones et al., 2009), soybean (Hyten et al., 2010), wheat (Trebbi et al., 2011), eggplant (Barchi et al., 2011), sorghum (Nelson et al., 2011), Aegilops tauschii (You et al., 2011), oat (Oliver et al., 2011), and cotton (Byers et al., 2012) to name a few. Besides the ongoing revolution in sequencing techniques, high-throughput genotyping platforms of SNPs, including GoldenGate, high-resolution melting (HRM), SNaPshot multiplex SNP genotyping, TaqMan SNP genotyping, KASPar assay and MassARRAY, were developed rapidly in recent years. As a result, in most species, SNPs have become the first choice for marker development, genome-wide association studies, gene/QTL mapping, phylogenetic analyses, marker-assisted selection, BSA, and genomic selection (Xu X. et al., 2015). In the present study, we used SLAF-seq-BSA to discover SNPs by comparing SLAF-seq reads derived from two barley parents. Potential polymorphic SNPs covered the target regions were selected and their polymorphisms between the parents were tested by electrophoresis and Sanger DNA sequencing. Twenty two SNPs and one InDel markers were genotyped in the population by KASPar platform and electrophoresis, respectively. All genotyped markers were associated with Blp1, which verified the accuracy of the candidate region detected by associated analysis. Linkage analysis showed that the candidate region was defined into 5.68 Mb in barley physical map (IBSC 2017). Moreover, SNPs in the narrowed down regions were further screened and four additional polymorphic SNPs were used to analyze the F2 population. Markers HZSNP63 and HZSNP59 were delimited the candidate region which was declined to an interval of 1.66 Mb. This result demonstrates that markers discovered within the mapping interval by SLAF-seq-BSA strategy, are available for fine mapping in barley.
Colored grains are ubiquitous in cereals and are determined by the pigmentation of certain phytochemicals, such as anthocyanin. In plants, the anthocyanin biosynthesis pathway has been elucidated (Shih et al., 2008) and transcriptional regulation related to anthocyanin biosynthesis has also been extensively studies in Arabidopsis, maize, petunia, and other species (Yuan et al., 2009). Such regulatory proteins including basic helix-loop-helix (bHLH) transcription factors, R2R3 Myb transcription factors and WD40 proteins act in a ternary complex, as MBW (MYB-bHLH-WD40) complex transcription factors (Hichri et al., 2011; Petroni and Tonelli, 2011). In cereals, some of the genes controlling grain colors were isolated successfully. Red rice is controlled by two loci Rc and Rd, which encodes a bHLH transcription factor and dihydroflavonol-4-reductase (DFR), respectively (Sweeney et al., 2006; Furukawa et al., 2007). One of the complementary genes controlling purple rice is Ra, which is a member of Myc family genes and known to be involved in the biosynthesis of anthocyanin in rice (Hu et al., 1996). Black rice is the results of three complementary genes, symbolized as Kala1, Kala3, and Kala4. It has been speculated that the Kala1 and Kala3 genes encode a DFR and an R2R3-Myb transcriptional factor, respectively, and play subsidiary roles in the black rice trait (Maeda et al., 2014). Kala4 acted as a main contributor, encodes a bHLH transcription factor and regulates anthocyanin biosynthesis (Oikawa et al., 2015). The genetic basis of wheat purple grain pigmentation resides in the action of Pp-1 homoealleles and Pp3 (Dobrovolskaya et al., 2006). The former was deduced as a MYB-like transcription factors responsible for the activation of structural genes encoding various enzymes participating in anthocyanin synthesis based on comparative mapping (Khlestkina, 2013). The latter was orthologous to maize Lc (Ludwig et al., 1989) and rice Ra (Hu et al., 1996), and TaMyc1 was identified as a candidate gene for Pp3 (Shoeva et al., 2014), which encoded MYC-like transcriptional factor underlying the regulations of anthocyanin synthesis.
It has been reported that purple (red) and blue barley are rich in anthocyanins, while black barley is caused by phytomelanin (Harlan, 1914). Barley Ant2 gene affects red color in auricle, awns and lemma, and encodes for a transcription factor with a bHLH domain (Cockram et al., 2010). Shoeva et al. (2016) reported that Ant2 was up-regulated with coordinately co-expressed flavonoid biosynthesis structural genes (Chs, Chi, F3h, Dfr, and Ans), which led to total anthocyanin content increase in the purple-grained ‘Bowman’ near-isogenic lines (NILs) with Ant2. However, in the black-grained ‘Bowman’ NILs, no differentially expressed flavonoid biosynthesis structural genes (with the exception of Chi) in comparison with Bowman were detected (Shoeva et al., 2016). As a result, anthocyanin content shows similar low amounts between Bowman and black-grained ‘Bowman’ NILs (Shoeva et al., 2016). To sum up, it seems that the grain color genes isolated so far were involved in anthocyanin synthesis or acted as transcriptional regulators. Shoeva et al. (2016) suggested that anthocyanins and the other flavonoids unlikely participated in black pigmentation of barley lemma and pericarp. Moreover, chemical nature of the black pigments and its biosynthesis pathway is still not clear (Pandey and Dhakal, 2001; Jana and Mukherjee, 2014). Therefore, the isolation of the Blp1 gene will help to understand the mechanism of black pigmentation accumulation in barley as well as to extend it further to other plants. In this study, we mapped the Blp1 gene into a 1.66 Mb intervals (Figure 2 and Table 3). There are 40 genes and some of them are annotated in this interval based on the assembly of IBSC 2017 (Supplementary Table S4). Plant cytochrome P450 monooxygenases play critical roles in the metabolism of secondary metabolites, such as pigment. For example, the color of flowers can be modified through hydroxylation pattern determined by two P450 enzymes (CYP75B and CYP75A) (Tanaka and Brugliera, 2013). Rasika et al. (2016) reported that Cytochrome P450 (CYP450) enzymes performed the initial step in yellow and red-violet betalains pigment biosynthesis in beets. As transcription regulators participate in anthocyanin biosynthesis (Hichri et al., 2011; Petroni and Tonelli, 2011), both sequence-specific DNA binding transcription factor and TATA element modulatory factor may be involved in transcription regulation during phytomelanin accumulation. Therefore, the genes encoding Cytochrome P450 superfamily protein, sequence-specific DNA binding transcription factors and TATA element modulatory factor may be reasonable candidates for the Blp1. Further research is required to identify the functional gene for the Blp1. We are expanding the F2 population of Hatiexi No.1 × Zhe 5819 and more homologous yellow individuals will be selected to identify recombinants. Furthermore, additional markers based on the candidate gene sequences are in the process of generating new polymorphic molecular markers to refine the region for the positional cloning of underlying gene.
Conclusion
We demonstrated the utility of SLAF-seq-BSA approach to identify the candidate region associated with barley black grain trait and discover polymorphic markers at the specific targeted genomic region. The Blp1 gene controlling black lemma and/or pericarp was fine mapped in a size of 1.66 Mb with 40 candidate genes.
Author Contributions
QJ, JY, and ZL designed the experiments. QJ and JW performed marker development and mapping analysis. JZ and YS contributed to phenotype Hatiexi No.1 × Zhe5819 population. WH conducted bioinformatic analysis of SNP data. QJ and ZL wrote the paper. All authors have read, edited and approved the current version of the manuscript.
Funding
This work was financially supported by National Natural Science Foundation of China (31471495), Public Benefit Technology Applied Research Project of Zhejiang Province (2017C32071) and Science Foundation of Zhejiang Sci-Tech University (16042063-Y).
Conflict of Interest Statement
The authors declare that the research was conducted in the absence of any commercial or financial relationships that could be construed as a potential conflict of interest.
The reviewer AT and handling Editor declared their shared affiliation, and the handling Editor states that the process met the standards of a fair and objective review.
Supplementary Material
The Supplementary Material for this article can be found online at: http://journal.frontiersin.org/article/10.3389/fpls.2017.01414/full#supplementary-material
Footnotes
- ^http://ensembl.gramene.org/Hordeum_vulgare/Info/Index
- ^https://software.broadinstitute.org/gatk/documentation/
- ^https://www.ncbi.nlm.nih.gov/assembly/GCA_900002345.1
References
Abe, A., Kosugi, S., Yoshida, K., Natsume, S., Takagi, H., Kanzaki, H., et al. (2012). Genome sequencing reveals agronomically important loci in rice using MutMap. Nat. Biotechnol. 30, 174–178. doi: 10.1038/nbt.2095
Barchi, L., Lanteri, S., Portis, E., Acquadro, A., Valè, G., Toppino, L., et al. (2011). Identification of SNP and SSR markers in eggplant using RAD tag sequencing. BMC Genomics 12:304. doi: 10.1186/1471-2164-12-304
Bellido, G. G., and Beta, T. (2009). Anthocyanin composition and oxygen radical scavenging capacity (ORAC) of milled and pearled purple, black, and common barley. J. Agric. Food. Chem. 57, 1022–1028. doi: 10.1021/jf802846x
Bungartz, A., Klaus, M., Mathew, B., Léon, J., and Naz, A. A. (2016). Development of new SNP derived cleaved amplified polymorphic sequence marker set and its successful utilization in the genetic analysis of seed color variation in barley. Genomics 107, 100–107. doi: 10.1016/j.ygeno.2015.12.007
Byers, R. L., Harker, D. B., Yourstone, S. M., Maughan, P. J., and Udall, J. A. (2012). Development and mapping of SNP assays in allotetraploid cotton. Theor. Appl. Genet. 124, 1201–1214. doi: 10.1007/s00122-011-1780-8
Carletti, G., Nervo, G., and Cattivelli, L. (2014). Flavonoids and melanins: a common strategy across two kingdoms. Int. J. Biol. Sci. 10, 1159–1170. doi: 10.7150/ijbs.9672
Choo, T. M., Vigier, B., Savard, M., and Abdel-Aal, E. M. (2015). Black barley as a means of mitigating deoxynivalenol contamination. Crop Sci. 55, 1096–1103. doi: 10.2135/cropsci2014.05.0405
Close, T. J., Bhat, P. R., Lonardi, S., Wu, Y., Rostoks, N., Ramsay, L., et al. (2009). Development and implementation of high-throughput SNP genotyping in barley. BMC Genomics 10:582. doi: 10.1186/1471-2164-10-582
Cockram, J., White, J., Zuluaga, D. L., Smith, D., Comadran, J., Macaulay, M., et al. (2010). Genome-wide association mapping to candidate polymorphism resolution in the unsequenced barley genome. Proc. Natl. Acad. Sci. U.S.A. 107, 21611–21616. doi: 10.1073/pnas.1010179107
Costa, J. M., Corey, A., Hayes, P. M., Jobet, C., Kleinhofs, A., Kopisch-Obusch, A., et al. (2001). Molecular mapping of the Oregon Wolfe Barleys: a phenotypically polymorphic doubled-haploid population. Theor. Appl. Genet. 103, 415–424. doi: 10.1007/s001220100622
Dobrovolskaya, O. B., Arbuzova, V. S., Lohwasser, U., Röder, M. S., and Börner, A. (2006). Microsatellite mapping of complementary genes for purple grain colour in bread wheat (Triticum aestivum L.). Euphytica 150, 355–364. doi: 10.1007/s10681-006-9122-7
Feltus, F. A., Wan, J., Schulze, S. R., Estill, J. C., Jiang, N., and Paterson, A. H. (2004). An SNP resource for rice genetics and breeding based on subspecies Indica and Japonica genome alignments. Genome Res. 14, 1812–1819. doi: 10.1101/gr.2479404
Finch, R. A., and Simpson, E. (1978). New colours and complementary colour genes in barley. Z. Pflanzenzüch. 81, 40–53.
Franckowiak, J. D., Lundqvist, U., and Konishi, T. (1997). New and revised descriptions of barley genes. Barley Genet. Newsl. 26, 22–516.
Furukawa, T., Maekawa, M., Oki, T., Suda, I., Iida, S., Shimada, H., et al. (2007). The Rc and Rd genes are involved in proanthocyanidin synthesis in rice pericarp. Plant J. 49, 91–102. doi: 10.1111/j.1365-313X.2006.02958.x
Geng, X. X., Jiang, C., Yang, J., Wang, L., Wu, X., and Wei, W. (2016). Rapid identification of candidate genes for seed weight using the SLAF-seq method in Brassica napus. PLoS ONE 11:e0147580. doi: 10.1371/journal.pone.0147580
Harlan, H. V. (1914). Some Distinctions in our Cultivated Barleys with Reference to their Use in Plant Breeding. Washington, DC: Department of Agriculture Press. doi: 10.5962/bhl.title.109258
Hichri, I., Barrieu, F., Bogs, J., Kappel, C., Delrot, S., and Lauvergeat, V. (2011). Recent advances in the transcriptional regulation of the flavonoid biosynthetic pathway. J. Exp. Bot. 62, 2465–2483. doi: 10.1093/jxb/erq442
Hill, J. T., Demarest, B. L., Bisgrove, B. W., Gorsi, B., Su, Y. C., and Yost, H. J. (2013). MMAPPR: mutation mapping analysis pipeline for pooled RNA-seq. Genome Res. 23, 687–697. doi: 10.1101/gr.146936.112
Hu, J., Anderson, B., and Wessler, R. (1996). Isolation and characterization of rice R genes: evidence for distinct evolutionary paths in rice and maize. Genetics 142, 1021–1031.
Hu, M. J., Zhang, H. P., Liu, K., Cao, J. J., Wang, S. X., Jiang, H., et al. (2016). Cloning and characterization of TaTGW-7A gene associated with grain weight in wheat via SLAF-seq-BSA. Front. Plant Sci. 7:1902. doi: 10.3389/fpls.2016.01902
Hyten, D. L., Cannon, S. B., Song, Q., Weeks, N., Fickus, E. W., Shoemaker, R. C., et al. (2010). High-throughput SNP discovery through deep resequencing of a reduced representation library to anchor and orient scaffolds in the soybean whole genome sequence. BMC Genomics 15:38. doi: 10.1186/1471-2164-11-38
Ibraheem, F., Gaffoor, I., and Chopra, S. (2010). Flavonoid phytoalexin-dependent resistance to anthracnose leaf blight requires a functional yellow seed1 in Sorghum bicolor. Genetics 184, 915–926. doi: 10.1534/genetics.109.111831
Jana, B. K., and Mukherjee, S. K. (2014). Notes on the distribution of phytomelanin layer in higher plants-a short communication. J. Pharm. Biol. 4, 131–132.
Jander, G., Norris, S. R., Rounsley, S. D., Bush, D. F., Levin, I. M., and Last, R. L. (2002). Arabidopsis map-based cloning in the post-genome era. Plant Physiol. 129, 440–450. doi: 10.1104/pp.003533
Jia, Q. J., Zhu, J. H., Wang, J. M., Yang, J. M., and Zhang, G. P. (2016). Genetic mapping and molecular marker development for the gene Pre2 controlling purple grains in barley. Euphytica 208, 215–223. doi: 10.1007/s10681-015-1593-y
Jones, E., Chu, W. C., Ayele, M., Ho, J., Bruggeman, E., Yourstone, K., et al. (2009). Development of single nucleotide polymorphism (SNP) markers for use in commercial maize (Zea mays L.) germplasm. Mol. Breed. 24, 165–176. doi: 10.1007/s11032-009-9281-z
Khlestkina, E. (2013). The adaptive role of flavonoids: emphasis on cereals. Cereal Res. Commun. 41, 185–198. doi: 10.1556/CRC.2013.0004
Kim, M. J., Hyun, J. N., Kim, J. A., Park, J. C., Kim, M. Y., Kim, J. G., et al. (2007). Relationship between phenolic compounds, anthocyanins content and antioxidant activity in colored barley germplasm. J. Agric. Food. Chem. 55, 4802–4809. doi: 10.1021/jf0701943
Kosambi, D. D. (1944). The estimation of map distances from recombination values. Ann. Eugen. 12, 172–175. doi: 10.1111/j.1469-1809.1943.tb02321.x
Lander, E. S., Green, P., Abrahamson, J., Barlow, A., Daly, M. J., Lincoln, S. E., et al. (1987). MAPMAKER: an interactive computer package for construction primary genetic linkage maps of experimental and natural populations. Genomics 1, 174–181. doi: 10.1016/0888-7543(87)90010-3
Li, H., and Durbin, R. (2009). Fast and accurate short read alignment with Burrows-Wheeler transform. Bioinformatics 25, 1754–1760. doi: 10.1093/bioinformatics/btp324
Ludwig, S. R., Habera, L. F., Dellaporta, S. L., and Wessler, S. R. (1989). Lc, a member of the maize R gene family responsible for tissue-specific anthocyanin production, encodes a protein similar to transcription activators and contains the myc-homology region. Proc. Natl. Acad. Sci. U.S.A. 86, 7092–7096. doi: 10.1073/pnas.86.18.7092
Maeda, H., Yamaguchi, T., Omoteno, M., Takarada, T., Fujita, K., Murata, K., et al. (2014). Genetic dissection of black grain rice by the development of a near isogenic line. Breed. Sci. 64, 134–141. doi: 10.1270/jsbbs.64.134
Michelmore, R. W., Paran, I., and Kesseli, R. V. (1991). Identification of markers linked to disease resistance genes by bulked segregant analysis: a rapid method to detect markers in specific genomic regions by using segregation populations. Proc. Natl. Acad. Sci. U.S.A. 88, 9828–9832. doi: 10.1073/pnas.88.21.9828
Murray, M. G., and Thompson, W. F. (1980). Rapid isolation of high molecular weight plant DNA. Nucl. Acids. Res. 8, 4321–4325. doi: 10.1093/nar/8.19.4321
Nam, S. H., Choi, S. P., Kang, M. Y., Koh, H. J., Kozukue, N., and Friedman, M. (2006). Antioxidative activities of bran from twenty one pigmented rice cultivars. Food Chem. 94, 613–620. doi: 10.1016/j.foodchem.2004.12.010
Nelson, J. C., Wang, S., Wu, Y., Li, X., Antony, G., White, F. F., et al. (2011). Single-nucleotide polymorphism discovery by high-throughput sequencing in sorghum. BMC Genomics 12:352. doi: 10.1186/1471-2164-12-352
Oikawa, T., Maeda, H., Oguchi, T., Yamaguchi, T., Tanabe, N., Ebana, K., et al. (2015). The birth of a black rice gene and its local spread by introgression. Plant Cell 27, 2401–2414. doi: 10.1105/tpc.15.00310
Oliver, R. E., Lazo, G. R., Lutz, J. D., Rubenfield, M. J., Tinker, N. A., Anderson, J. M., et al. (2011). Model SNP development for complex genomes based on hexaploid oat using high-throughput 454 sequencing technology. BMC Genomics 12:77. doi: 10.1186/1471-2164-12-77
Petroni, K., and Tonelli, C. (2011). Recent advances on the regulation of anthocyanin synthesis in reproductive organs. Plant Sci. 181, 219–229. doi: 10.1016/j.plantsci.2011.05.009
Philpott, M., Could, K. S., Lim, C., and Ferguson, L. R. (2006). In situ and in vitro antioxidant activity of sweet potato anthocyanins. J. Agric. Food. Chem. 54, 1710–1715.
Qin, D., Dong, J., Xu, F., Guo, G., Ge, S., Xu, Q., et al. (2015). Characterization and fine mapping of a novel barley stage green-revertible albino gene (HvSGRA) by bulked segregant analysis based on SSR assay and specific length amplified fragment sequencing. BMC Genomics 16:838. doi: 10.1186/s12864-015-2015-1
Rasika, S., Bean, A., Brown, M., Akhavan, N., Hatlestad, G., Gonzalez, A., et al. (2016). Tyrosine hydroxylation in betalain pigment biosynthesis is performed by cytochrome P450 enzymes in beets (Beta vulgaris). PLoS ONE 11:e0149417. doi: 10.1371/journal.pone.0149417
Satué-Gracia, M. T., Heinonen, M., and Frankel, E. N. (1997). Anthocyanins as antioxidants on human low-density lipoprotein and lecithin-liposome systems. J. Agric. Food Chem. 5, 3362–3367. doi: 10.1021/jf970234a
Shih, C. H., Chu, H., Tang, L. K., Sakamoto, W., Maekawa, M., Chu, I. K., et al. (2008). Functional characterization of key structural genes in rice flavonoid biosynthesis. Planta 228, 1043–1054. doi: 10.1007/s00425-008-0806-1
Shoeva, O. Y., Gordeeva, E. I., and Khlestkina, E. K. (2014). The regulation of anthocyanin synthesis in the wheat pericarp. Molecules 19, 20266–20279. doi: 10.3390/molecules191220266
Shoeva, O. Y., Mock, H. P., Kukoeva, T. V., Börner, A., and Khlestkina, E. K. (2016). Regulation of the flavonoid biosynthesis pathway gene in purple and black grains of Hordem vulgare. PLoS ONE 11:e0163782. doi: 10.1371/journal.pone.0163782
Skadhauge, B., Thomsen, K. K., and Wettstein, D. V. (1997). The role of the barley testa layer and its flavonoid content in resistance to Fusarium infections. Hereditas 126, 147–160. doi: 10.1111/j.1601-5223.1997.00147.x
Sun, X., Liu, D., Zhang, X., Li, W., Liu, H., Hong, W., et al. (2013). SLAF-seq: an efficient method of large-scale De Novo SNP discovery and genotyping using high throughput sequencing. PLoS ONE 8:e5870. doi: 10.1371/journal.pone.0058700
Sweeney, M. T., Thomson, M. J., Pfeil, B. E., and McCouch, S. (2006). Caught red-handed: Rc encodes a basic helix-loop-helix protein conditioning red pericarp in rice. Plant Cell 18, 283–294. doi: 10.1105/tpc.105.038430
Takagi, H., Abe, A., Yoshida, K., Kosugi, S., Natsume, S., Mitsuoka, C., et al. (2013). QTL-seq: rapid mapping of quantitative trait loci in rice by whole genome resequencing of DNA from two bulked populations. Plant J. 74, 174–183. doi: 10.1111/tpj.12105
Tanaka, Y., and Brugliera, F. (2013). Flower colour and cytochromes P450. Philos. Trans. R. Soc. Lond. B Biol. Sci. 368, 20120432. doi: 10.1098/rstb.2012.0432
Trebbi, D., Maccaferri, M., de Heer, P., Sørensen, A., Giuliani, S., Salvi, S., et al. (2011). High-throughput SNP discovery and genotyping in durum wheat (Triticum durum Desf.). Theor. Appl. Genet. 123, 555–569. doi: 10.1007/s00122-011-1607-7
Wen, C., Mao, A., Dong, C., Liu, H., Yu, S., Guo, Y. D., et al. (2015). Fine genetic mapping of target leaf spot resistance gene cca-3 in cucumber, Cucumis sativus L. Theor. Appl. Genet. 128, 2495–2506. doi: 10.1007/s00122-015-2604-z
Xia, C., Chen, L., Rong, T., Li, R., Xiang, Y., Wang, P., et al. (2015). Identification of a new maize inflorescence meristem mutant and association analysis using SLAF-seq method. Euphytica 202, 35–44. doi: 10.1007/s10681-014-1202-5
Xu, F., Sun, X., Chen, Y., Huang, Y., Tong, C., and Bao, J. (2015). Rapid identification of major QTLs associated with rice grain weight and their utilization. PLoS ONE 10:e0122206. doi: 10.1371/journal.pone.0122206
Xu, X., Chao, J., Cheng, X., Wang, R., Sun, B., Wang, H., et al. (2016). Mapping of a novel race wpecific resistance gene to phytophthora root rot of pepper (Capsicum annuum) using bulked segregant analysis combined with specific length amplified fragment sequencing strategy. PLoS ONE 11:e0151401. doi: 10.1371/journal.pone.0151401
Xu, X., Lu, L., Zhu, B., Xu, Q., Qi, X., and Chen, X. (2015). QTL mapping of cucumber fruit fleshthickness by SLAF-seq. Sci. Rep. 5:15829. doi: 10.1038/srep15829
You, F. M., Huo, N., Deal, K. R., Gu, Y. Q., Luo, M. C., McGuire, P. E., et al. (2011). Annotation-based genome-wide SNP discovery in the large and complex Aegilops tauschii genome using next-generation sequencing without a reference genome sequence. BMC Genomics 12:59. doi: 10.1186/1471-2164-12-59
Yuan, Y., Chiu, L. W., and Li, L. (2009). Transcriptional regulation of anthocyanin biosynthesis in red cabbage. Planta 230, 1141–1153. doi: 10.1007/s00425-009-1013-4
Zhang, J. (1997). Chromosome location of the gene for Multinode, branched and dwarf syndrome mutation in barley. Hereditas 19, k17–20.
Keywords: barley, black grain color, SLAF-seq, SNP, fine-mapping
Citation: Jia Q, Wang J, Zhu J, Hua W, Shang Y, Yang J and Liang Z (2017) Toward Identification of Black Lemma and Pericarp Gene Blp1 in Barley Combining Bulked Segregant Analysis and Specific-Locus Amplified Fragment Sequencing. Front. Plant Sci. 8:1414. doi: 10.3389/fpls.2017.01414
Received: 09 May 2017; Accepted: 31 July 2017;
Published: 14 August 2017.
Edited by:
Giampiero Valè, Research Centre for Cereal and Industrial Crops, CREA-CER, ItalyReviewed by:
Alessandro Tondelli, Consiglio per la Ricerca in Agricoltura e l’Analisi dell’Economia Agraria (CREA), ItalyEnrico Francia, University of Modena and Reggio Emilia, Italy
Meixue Zhou, University of Tasmania, Australia
Copyright © 2017 Jia, Wang, Zhu, Hua, Shang, Yang and Liang. This is an open-access article distributed under the terms of the Creative Commons Attribution License (CC BY). The use, distribution or reproduction in other forums is permitted, provided the original author(s) or licensor are credited and that the original publication in this journal is cited, in accordance with accepted academic practice. No use, distribution or reproduction is permitted which does not comply with these terms.
*Correspondence: Qiaojun Jia, amlhcWpAenN0dS5lZHUuY24= Zongsuo Liang, bGlhbmd6c0Btcy5pc3djLmFjLmNu