 Jingjin Yu
 Ran Li
 Ningli Fan1
 Bingru Huang
- 1College of Agro-grassland Science, Nanjing Agricultural University, Nanjing, China
- 2Department of Plant Biology and Pathology, Rutgers, The State University of New Jersey, New Brunswick, NJ, United States
Global climate changes involve elevated temperature and CO2 concentration, imposing significant impact on plant growth of various plant species. Elevated temperature exacerbates heat damages, but elevated CO2 has positive effects on promoting plant growth and heat tolerance. The objective of this study was to identify metabolic pathways affected by elevated CO2 conferring the improvement of heat tolerance in a C4 perennial grass species, bermudagrass (Cynodon dactylon Pers.). Plants were planted under either ambient CO2 concentration (400 μmol⋅mol-1) or elevated CO2 concentration (800 μmol⋅mol-1) and subjected to ambient temperature (30/25°C, day/night) or heat stress (45/40°C, day/night). Elevated CO2 concentration suppressed heat-induced damages and improved heat tolerance in bermudagrass. The enhanced heat tolerance under elevated CO2 was attributed to some important metabolic pathways during which proteins and metabolites were up-regulated, including light reaction (ATP synthase subunit and photosystem I reaction center subunit) and carbon fixation [(glyceraldehyde-3-phosphate dehydrogenase, GAPDH), fructose-bisphosphate aldolase, phosphoglycerate kinase, sedoheptulose-1,7-bisphosphatase and sugars) of photosynthesis, glycolysis (GAPDH, glucose, fructose, and galactose) and TCA cycle (pyruvic acid, malic acid and malate dehydrogenase) of respiration, amino acid metabolism (aspartic acid, methionine, threonine, isoleucine, lysine, valine, alanine, and isoleucine) as well as the GABA shunt (GABA, glutamic acid, alanine, proline and 5-oxoproline). The up-regulation of those metabolic processes by elevated CO2 could at least partially contribute to the improvement of heat tolerance in perennial grass species.
Introduction
Global climate changes involve elevated temperature and CO2 concentration, imposing significant impact on plant growth (Kirkham, 2011). During this century, global temperatures are predicted to rise by 2–5°C; atmospheric CO2 concentration has increased by 100 μmol mol-1 since the beginning of the industrialized era and the concentration is predicted to continue rising at a rate of approximately 2 μmol mol-1 per year (Intergovernmental Panel on Climate Change [IPCC], 2007). Previous research has shown that elevated CO2 promotes plant growth under optimal growing temperatures in various plant species (Hamerlynck et al., 2000; Prasad et al., 2002; Qaderi et al., 2006). Recent research also found that elevated CO2 has positive effects on promoting heat tolerance in terms of vegetative growth in C3 species, such as rice (Oryza sativa) (Sujatha et al., 2008; Figueiredo et al., 2015; Lai et al., 2015), wheat (Triticum aestivum) (Bencze et al., 2005; Alonso et al., 2009), and cool-season perennial grass species (Yu et al., 2012a, 2014) and C4 plant species, such as Bouteloua gracilis (Read and Morgan, 1996), peanut (Arachis hypogaea) (Prasad et al., 2010), grain sorghum (Sorghum bicolor) (Prasad et al., 2006) and maize (Zea mays) (Abebe et al., 2016). The mechanisms regulating elevated CO2 effects on C3 plant species have been reported, which have been associated with enhanced cellular expansion and cell division resulted from increased carbohydrate availability and changes in proteins and gene transcript levels (Pritchard et al., 1999; Kirkham, 2011; Morgan et al., 2011; Huang and Xu, 2015). However, metabolic factors underlying elevated CO2 improvement of heat tolerance in C4 perennial grass species are not well understood.
Metabolic and proteomic analysis mostly in C3 plant species demonstrated that elevated CO2 causes changes in various metabolic processes or pathways such as photosynthetic carbon fixation, respiratory metabolism, cellular growth, and stress defense (Fukayama et al., 2009; Yu et al., 2012a, 2014; Burgess and Huang, 2014, 2016). The improved heat tolerance by doubling ambient CO2 concentration in C3 grass species, such as tall fescue (Festuca arundinacea), has been attributed to increases in the accumulation of metabolites, such as organic acids (shikimic acid, malonic acid, glyceric acid, threonic acid, galactaric acid, and citric acid), sugars (sucrose and maltose) and amino acids (valine, serine, and 5-oxoproline) involved in photosynthesis, respiration and amino acid metabolism (Yu et al., 2012a). In addition, doubling ambient CO2 concentration significantly increased the accumulation of soluble leaf carbohydrates and activity of adenosine-5′-diphosphoglucose pyrophosphorylase under high temperature in kidney bean (Phaseolus vulgaris) (Prasad et al., 2004). Proteomic profiling of tall fescue exposed to elevated CO2 concentration under heat stress found increased abundance of proteins associated with functions of photosynthetic light reaction, electron transport carrier molecule, ATP generation enzyme and antioxidant system (Yu et al., 2014). It has been reported that C4 plant species are generally less responsive to elevated CO2 than C3 species when they are exposed to their respective optimal temperature conditions (Kirkham, 2011; Huang and Xu, 2015). Mechanisms of elevated CO2-induced stimulation of photosynthesis in C3 plants were mainly associated with changes in electron transport during in light reaction as well as capacity for carbon fixation and assimilation during dark respiration (Yu et al., 2012b, 2014; Huang and Xu, 2015). However, the key changes in metabolites and proteins induced by elevated CO2 in C4 plants under heat stress have not yet to be determined.
The objective of the current study was to identify metabolic pathways affected by elevated CO2 conferring the improvement of heat tolerance in a C4 perennial grass species, bermudagrass (Cynodon dactylon) widely used as forage and turfgrass species. Understanding changes of metabolites and proteins in C4 species in response to elevated CO2 concentration will provide new insights to mechanisms about elevated CO2-mitigated effects on heat stress.
Materials and Methods
Plant Materials and Growth Conditions
Stolons of bermudagrass (cv. ‘Tifway’) plants were collected from the research farm at Nanjing Agricultural University in Nanjing, China, and transplanted into pots (20 cm in diameter and 20 cm in depth) filled with a mixture of soil and sand (soil: sand = 1:1, v/v). Plants were grown in a greenhouse with average temperature of 30/22°C (day/night), natural sunlight and irrigated once a week with half-strength Hoagland’s nutrient solution (Hoagland and Arnon, 1950) to establish canopy and roots for 2 months. During this period, plants were trimmed once a week to keep a canopy height of 4–5 cm. After establishment, plants were transferred to growth chambers (Xubang, Jinan, Shandong province, China) with the temperature of 30/25°C (day/night), 70% relative humidity, photosynthetically active radiation of 650 μmol⋅m-2⋅s-1 and a 12-h photoperiod.
Experimental Design and Treatments
The CO2 concentrations set-up and control in growth chambers followed the same designed as described in Yu et al. (2012a,b). Each CO2 treatment was imposed in four growth chambers on September 1, 2015. In order to evaluate the long-term effects of elevated CO2, plants were grown under the two CO2 concentrations for 70 days prior to the exposure to heat stress. Plants grown under either CO2 treatment was then exposed to (45/40°C) (heat stress) or 30/25°C (non-stress control) in two growth chambers on November 9, 2015 until December 8, 2015. Plants were randomly relocated in each chamber twice per week to avoid confounding effects of environmental variation between different chambers. The CO2 concentration inside each growth chamber was controlled by an automated, open-chamber CO2 control system connected to a gas tank containing 100% CO2 (Yu et al., 2015).
The experiment was arranged as factorial design with two CO2 concentrations (ambient CO2 concentration at 400 ± 10 μmol⋅mol-1 and elevated CO2 concentration at 800 ± 10 μmol⋅mol-1) and two temperature treatments [30/25°C (day/night, optimal temperature control) and 45/40°C (day/night, heat stress)]. Each treatment was repeated in four pots of plants (four replicates).
Measurements of Physiological Indexes
Leaf net photosynthetic rate (Pn) was determined by inserting 4–5 individual leaves (second full-expanded from the top) collected from each pot to a 6 cm2 cuvette with a portable infrared gas analyzer (Li-6400, LI-COR, Inc., Lincoln, NB, United States). Leaves were placed in a leaf chamber with a built-in red and blue light source of the Li-6400 with the light intensity of 800 μmol photon⋅m-2⋅s-1.
For leaf chlorophyll content (Chl), 0.2 g of fresh leaves were detached from plants and then immersed in dimethyl sulfoxide (DMSO) in dark for at least 72 h for a complete extraction of total chlorophyll. The absorbance of the Chl extract was measured at wavelengths of 663 and 645 nm, respectively, by a spectrophotometer (Ultrospec 2100 pro, Biochrom Ltd., Cambridge, England) to calculate Chla and Chlb content. Chl was determined as described by Arnon (1949). For photochemical efficiency (Fv/Fm), chlorophyll fluorescence (the ratio of variable to maximum fluorescence as Fv/Fm) was measured by a fluorescence induction monitor (Bioscientific Ltd., Herts, United Kingdom) following 30 min dark acclimation through leaf tips.
Metabolites Extraction and Quantification
The extraction procedure was conducted following the method of Roessner et al. (2000) and Rizhsky et al. (2004). Leaf samples collected at 28 days of treatment were collected and immediately frozen in liquid nitrogen, then stored at -80°C for metabolic profiling analysis. For each sample, frozen dry leaves were ground to a fine powder with liquid nitrogen, and then 25 mg of powder was transferred into a 10 mL microcentrifuge tubes, and extracted in 1.4 mL of 80% (v/v) aqueous methanol at 23°C for 2 h. Ribitol solution of 10 μL (2 mg⋅mL-1 water) as an internal standard was added prior to incubation. Then, extraction was performed in a water bath at 70°C for 15 min. Tubes were centrifuged for 30 min at 9660 gn and the supernatant was decanted into new tubes, 1.4 mL of water and 0.75 mL of chloroform were added. The mixture was vortexed thoroughly and centrifuged for 15 min at 5025 gn and then 1 mL of the polar phase (methanol/water) was pipetted into HPLC vials and dried in a centrifugal concentrator (Centrivap, Labconco Corporation, Kansas City, MO, United States). The dried polar phase was methoximated with 80 μL of 20 mg⋅mL-1 methoxyamine hydrochloride at 30°C for 90 min and then was trimethylsilylated with 80 μL N-methyl-N-(trimethylsilyl) trifluoroacetamide (MSTFA) (with 1% TMCS) for 60 min at 70°C.
The Gas Chromatography-Mass Spectrometer (GC-MS) analysis was modified from Qiu et al. (2007). The derivatized extracts were analyzed with a GC coupled with a TurboMass-Autosystem XL MS (Perkin Elmer Inc., Waltham, MA, United States). A 1 μL extracts was injected into a DB-5MS capillary column (30 m × 0.25 mm × 0.25 μm, Agilent J & W Scientific, Folsom, CA, United States). The inlet temperature was held at 260°C. After a 6.5 min solvent delay, initial GC oven temperature was maintained at 60°C; 1 min after injection, the GC oven temperature was raised to 280°C at a rate of 5°C⋅in-1, and finally maintained at 280°C for 15 min. The injection temperature was set at 280°C and the ion source temperature was adjusted to 200°C. Helium was used as the carrier gas with a constant flow rate of 1 mL⋅min-1. The measurements were performed through electron impact ionization (70 eV) in the full scan mode (m/z 30–550). The detected metabolites were identified with Turbomass 4.1.1 software (PerkinElmer Inc., Waltham, MA, United States). For GC/MS results, compounds were identified based on retention time (RT) and comparison with reference spectra in mass spectral libraries.
Protein Extraction and Quantification
Leaf samples were collected from each tube at 28 days, immediately frozen in liquid nitrogen, then ground into fine powder and stored at -80°C until analysis. Proteins were extracted using the trichloroacetic acid (TCA)/Acetone method described from Xu and Huang (2008). Leaf powder samples (0.5 g) were homogenized on ice in precipitation solution (10% TCA and 0.07% 2-mercaptoethanol in acetone) for 10 min and then incubated at -20°C for 2 h. The protein pellet was collected and washed with cold acetone containing 0.07% 2-mercaptoethanol until the supernatant was colorless. The pellet was then vacuum-dried and suspended in resolubilization solution [8 M urea, 2 M thiourea, 2% CHAPS, 1% dithiothreitol (DTT), and 1% pharmalyte]. The suspension was centrifuged at 21000 g for 20 min and the supernatant was collected for further protein quantification. Protein content was determined using the method of Bradford (1976). A 10 μL aliquot of protein extract was mixed with 0.5 mL of a commercial color reagent (Bio-Rad Laboratories, Hercules, CA, United States) by a bovine serum albumin (BSA) standard. The absorbance was measured spectrophotometrically at 595 nm between 5 and 30 min after reaction.
Two-Dimensional PAGE and Protein Analysis
An IPGPhor apparatus (GE Healthcare, Waukesha, WI, United States) was used for the first isoelectric focusing (IEF) described by Xu and Huang (2008). The extracts containing 300 μg of sample protein were used for IEF in immobilized pH gradient (IPG) strips (pH 3.0–10.0, linear gradient, 13 cm), formed by rehydrating strips for 12 h at room temperature in 250 μL of rehydration buffer (8 M urea, 2 M thiourea, 2% CHAPS, 1% DTT, 1% v/v IPG buffer, and 0.002% bromophenol blue). Following IEF, the IPG strips were equilibrated for 15 min twice at room temperature in equilibration buffer (50 mM Tris–HCl pH 8.8, 6 M urea, 30% glycerol, 2% SDS, and 1% DTT), then transferred to the same equilibration buffer containing 2.5% iodoacetamide instead of 1% DTT. The second dimension electrophoresis was run on a 12.5% SDS–polyacrylamide gel with a Hoefer SE 600 Ruby electrophoresis apparatus (GE Healthcare, Waukesha, WI, United States). The running conditions were 5 mA per strip for 30 min followed by 20 mA per strip for about 5 h. Gels were stained with Coomassie brilliant blue G-250 and scanned using a Personal Densitometer SI (63-0016-46, GE Healthcare, Waukesha, WI, United States).
Gel images analysis was performed by Progenesis software (Nonlinear Dynamics, Durham, NC, United States). Automatic default spot analysis settings were coupled with manual correction and editing of spot features. The spot volumes were normalized as a percentage of the total volume of all spots on the gel to correct the variability due to staining. Variance analysis of data was used to test the treatment effects on each transgenic line.
Selected protein spots were manually excised from gels and subjected to a trypsin digestion. The peptides were identified by MALDI-TOF-MS as described by Xu and Huang (2008). Data were searched against the National Center for Biotechnology Information (NCBI) database. Proteins containing at least two peptides with a confidence interval value >95% were considered to be successfully identified (Ma et al., 2016).
Protein functional classification was performed by Mapman software (Thimm et al., 2004) in combination with the criteria proposed by Bevan et al. (1998). The identified proteins were distributed to different subcellular location by SUBA (Tanz et al., 2013). Gene ontology (GO) for biological process, molecular function and cellular component was conducted by the agrigo database1; threshold was -log10 > 4 (Ma et al., 2016).
Statistical Analysis
Data were analyzed using statistics software (SPSS 13.0; SPSS Inc., Chicago, IL, United States). Analysis of variance (ANOVA) was used to determine differences among treatment effects at a given treatment time. The means ± SE were calculated for each parameter. When a particular F-test was significant, means were tested with least significant difference (LSD) at a confidence level of 0.05.
Results
Physiological Effects of Elevated CO2
Under normal temperature, elevated CO2 significantly increased Pn and Chl (Figures 1A,B) while it had no significant effects on Fv/Fm (Figure 1C). Under heat stress, plants grown at elevated CO2 had significantly higher Pn (Figure 1A), Chl (Figure 1B), and Fv/Fm (Figure 1C) than that at ambient CO2 concentration.
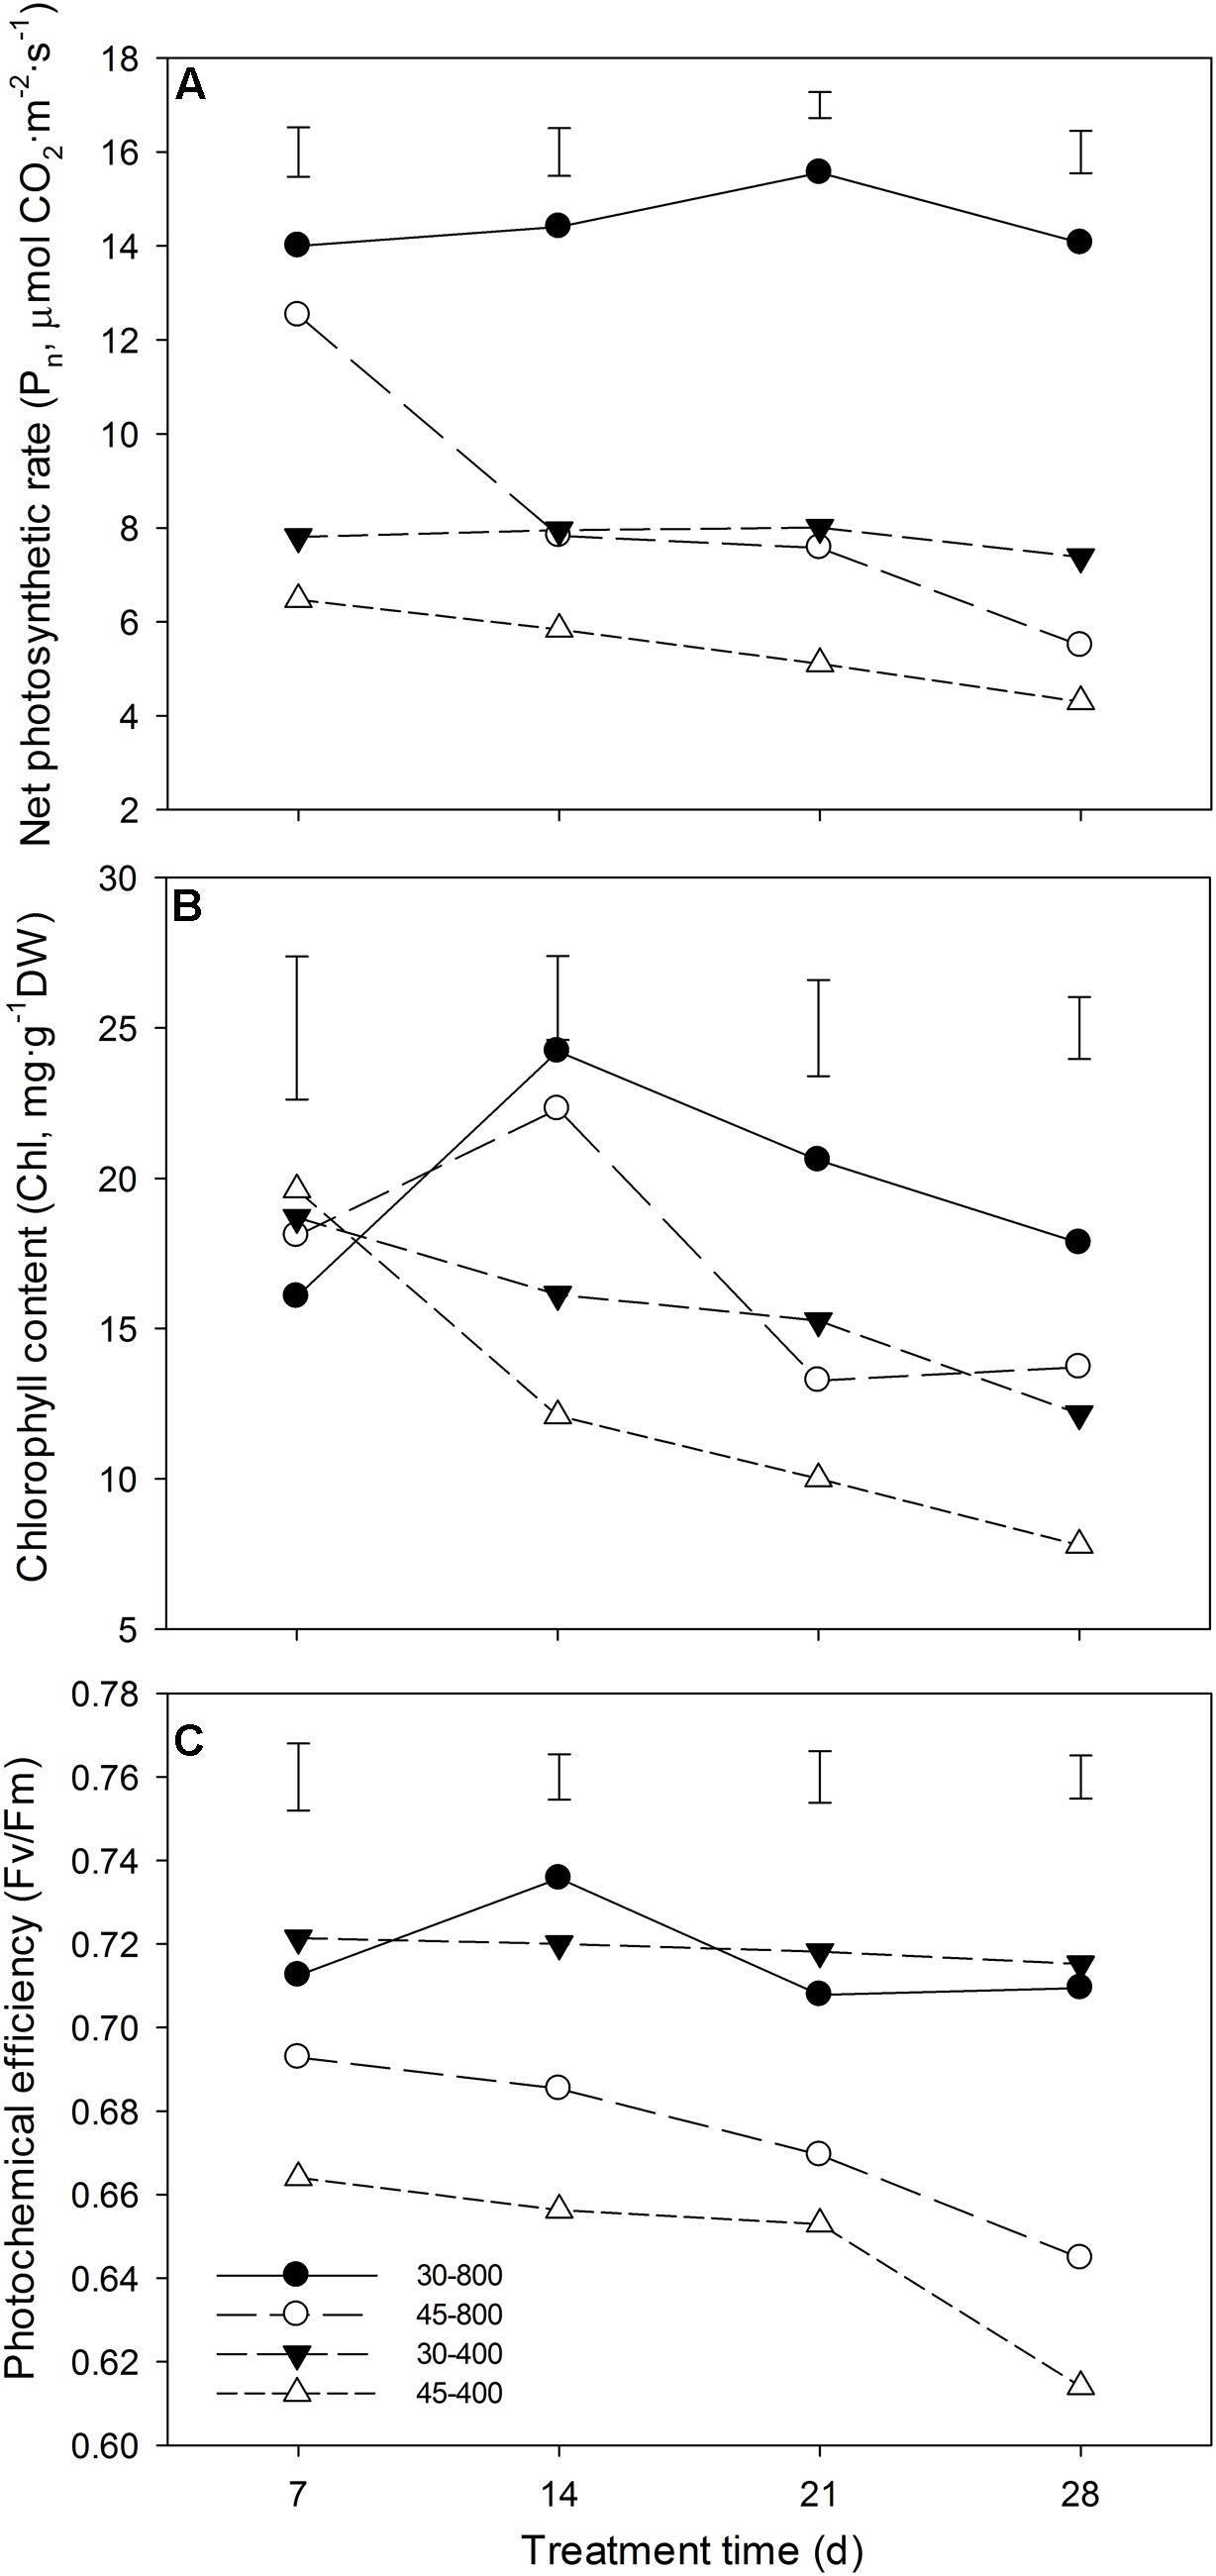
FIGURE 1. Effects of elevated CO2 concentration (800 μmol⋅mol-1 vs. 400 μmol⋅mol-1) on net photosynthetic rate (Pn) (A), chlorophyll content (Chl) (B) and (C) photochemical efficiency (Fv/Fm) in response to heat stress in bermudagrass. The treatments symbols are 30 and 45 for normal temperature control and heat stress and 400 and 800 for ambient CO2 and elevated CO2 concentrations, respectively. Vertical bars indicate significant difference based on LSD values (P ≤ 0.05) for the comparison among treatments.
Effects of Elevated CO2 on Metabolic Profiles
A total of 53 metabolites, including 18 organic acids and phosphoric acid, 12 amino acids, 18 sugars and 4 sugar alcohols, in responsive to elevated CO2 and heat stress were identified and quantified by GC-MS. The name, RT, derivative and mass to charge (m/z) as well as the relative expression of each metabolite was presented in Figure 2 and Table 1.
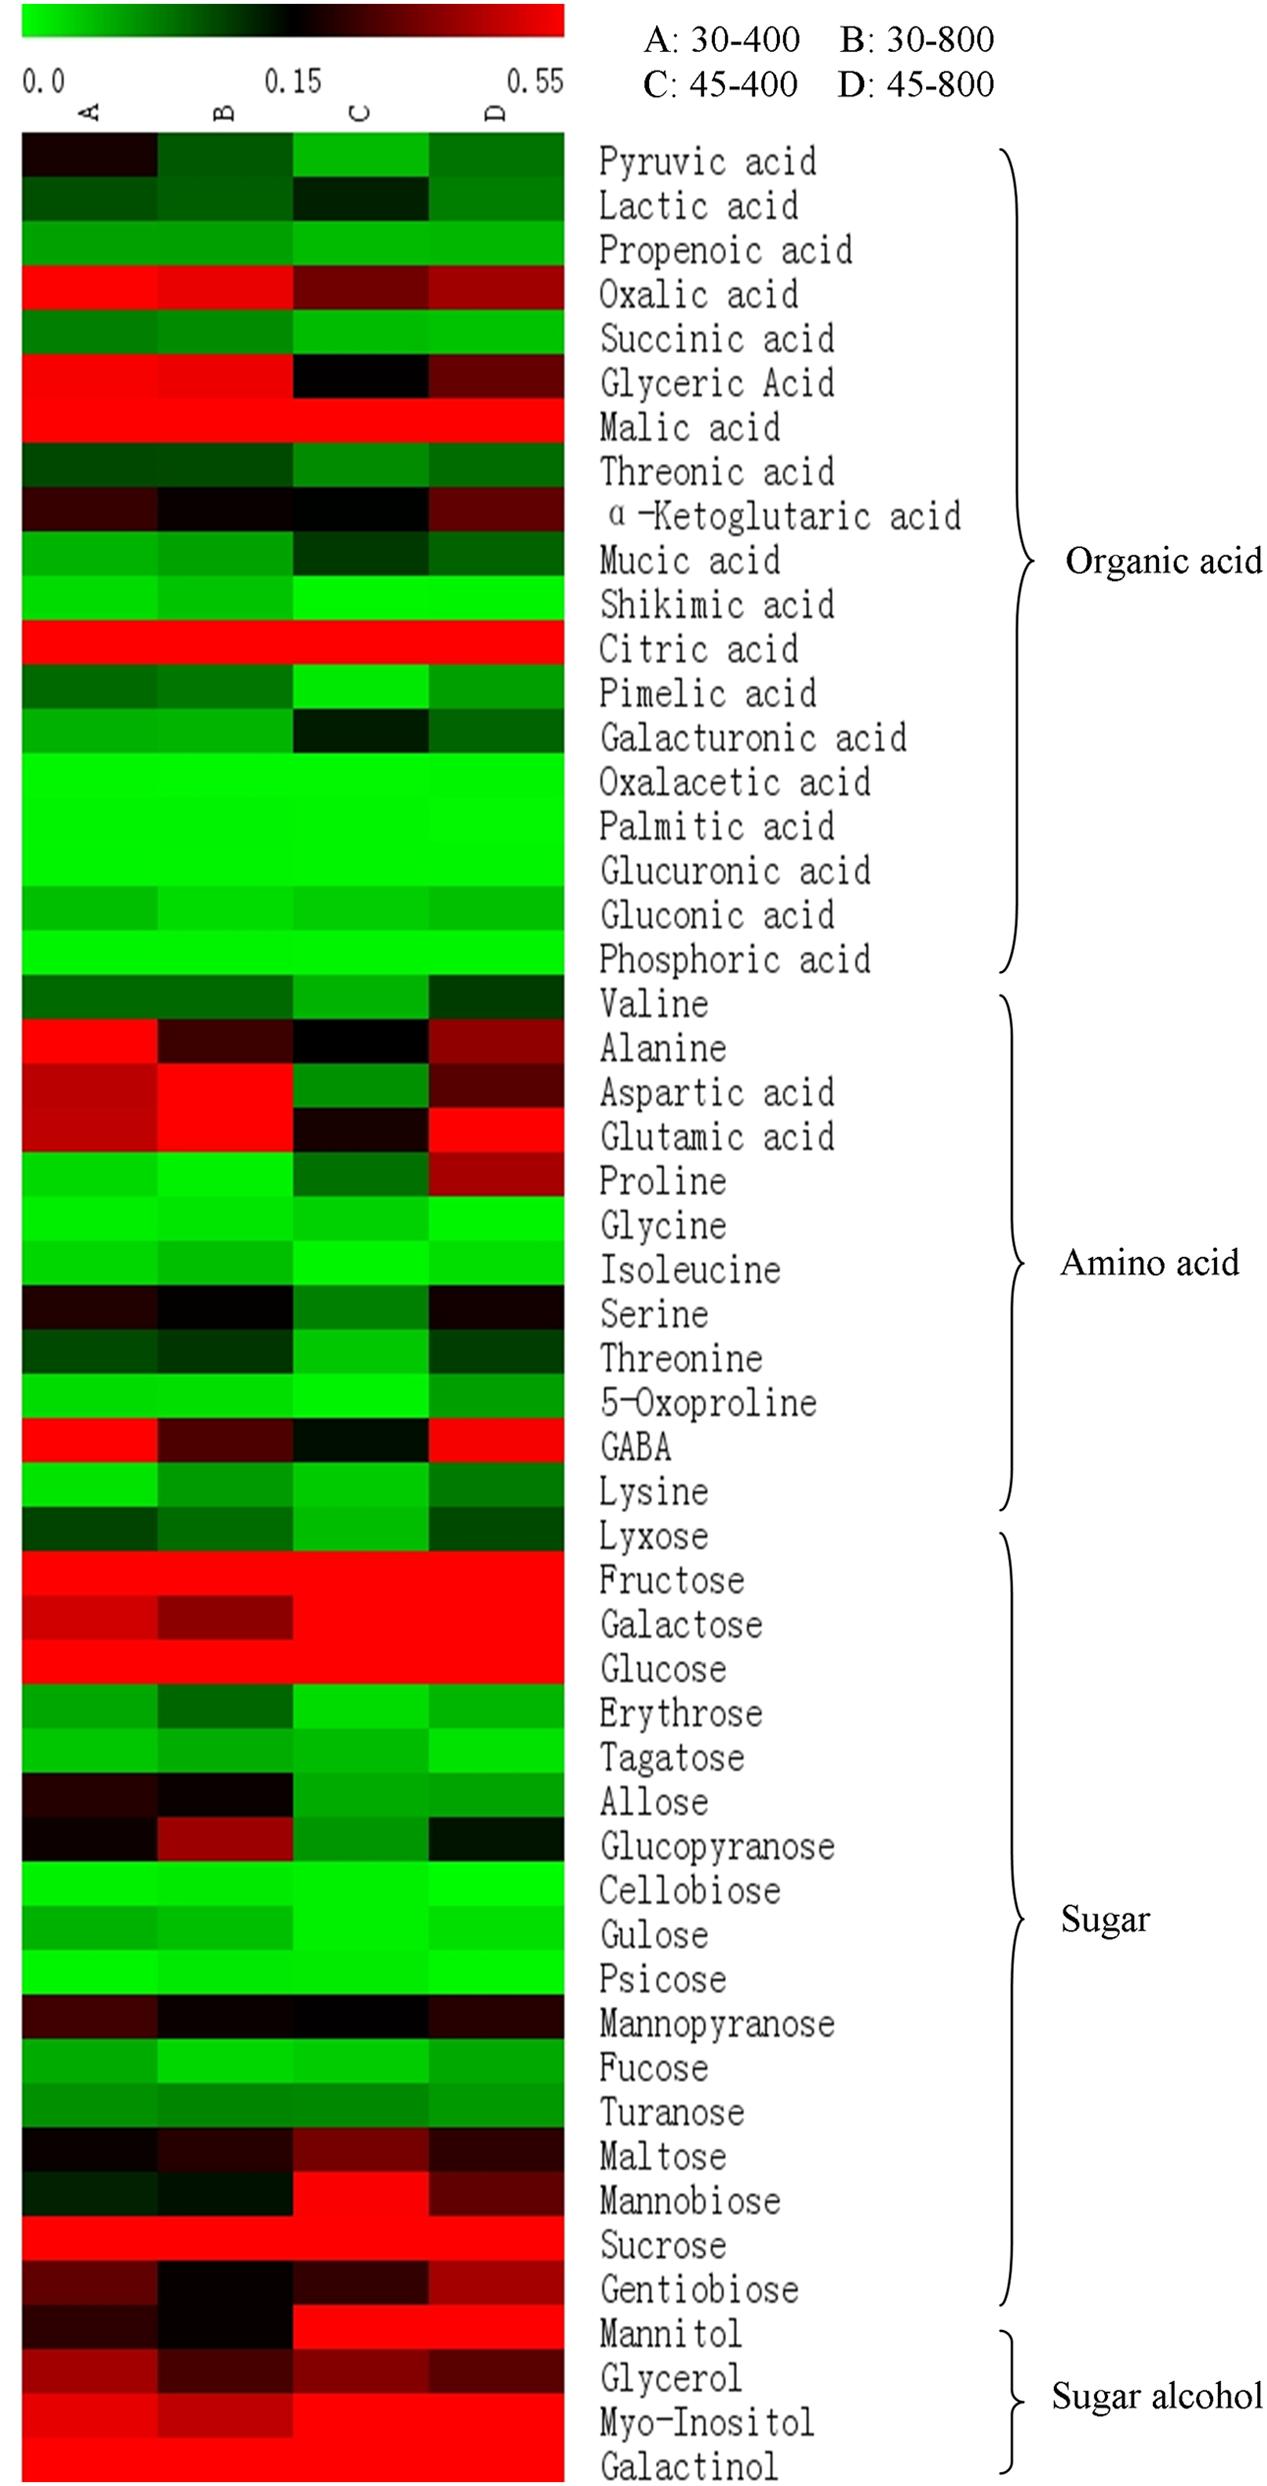
FIGURE 2. Heat map analysis of total 53 differentially expressed metabolites in response to different temperatures and CO2 concentrations. The treatments symbols are 30 and 45 for normal temperature control and heat stress and 400 and 800 for ambient CO2 and elevated CO2 concentrations, respectively.
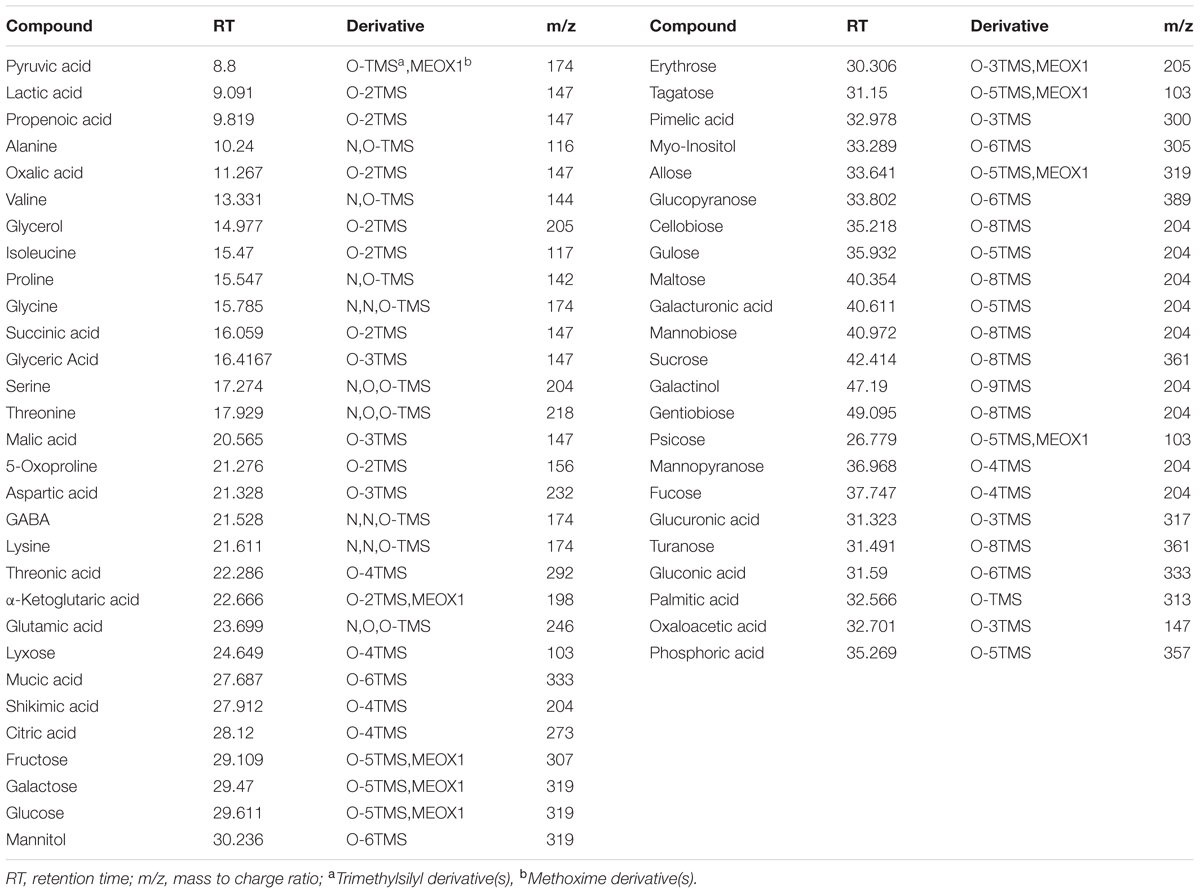
TABLE 1. Metabolites identified by GC-MS in response to different CO2 concentrations and temperatures in leaves of bermudagrass at 28 days of treatments.
Total content of organic acids, amino acids, sugars, and sugar alcohols were presented in Figure 3. Under normal temperature, no effects of elevated CO2 were detected on total content of organic acids, amino acids, sugars and sugar alcohols compared with ambient CO2. Under heat stress, elevated CO2 resulted in significant increases in the content of organic acids, amino acids, sugars, and sugar alcohols by 52%, 2.79-fold, 29% and 30%, respectively (Figure 3).
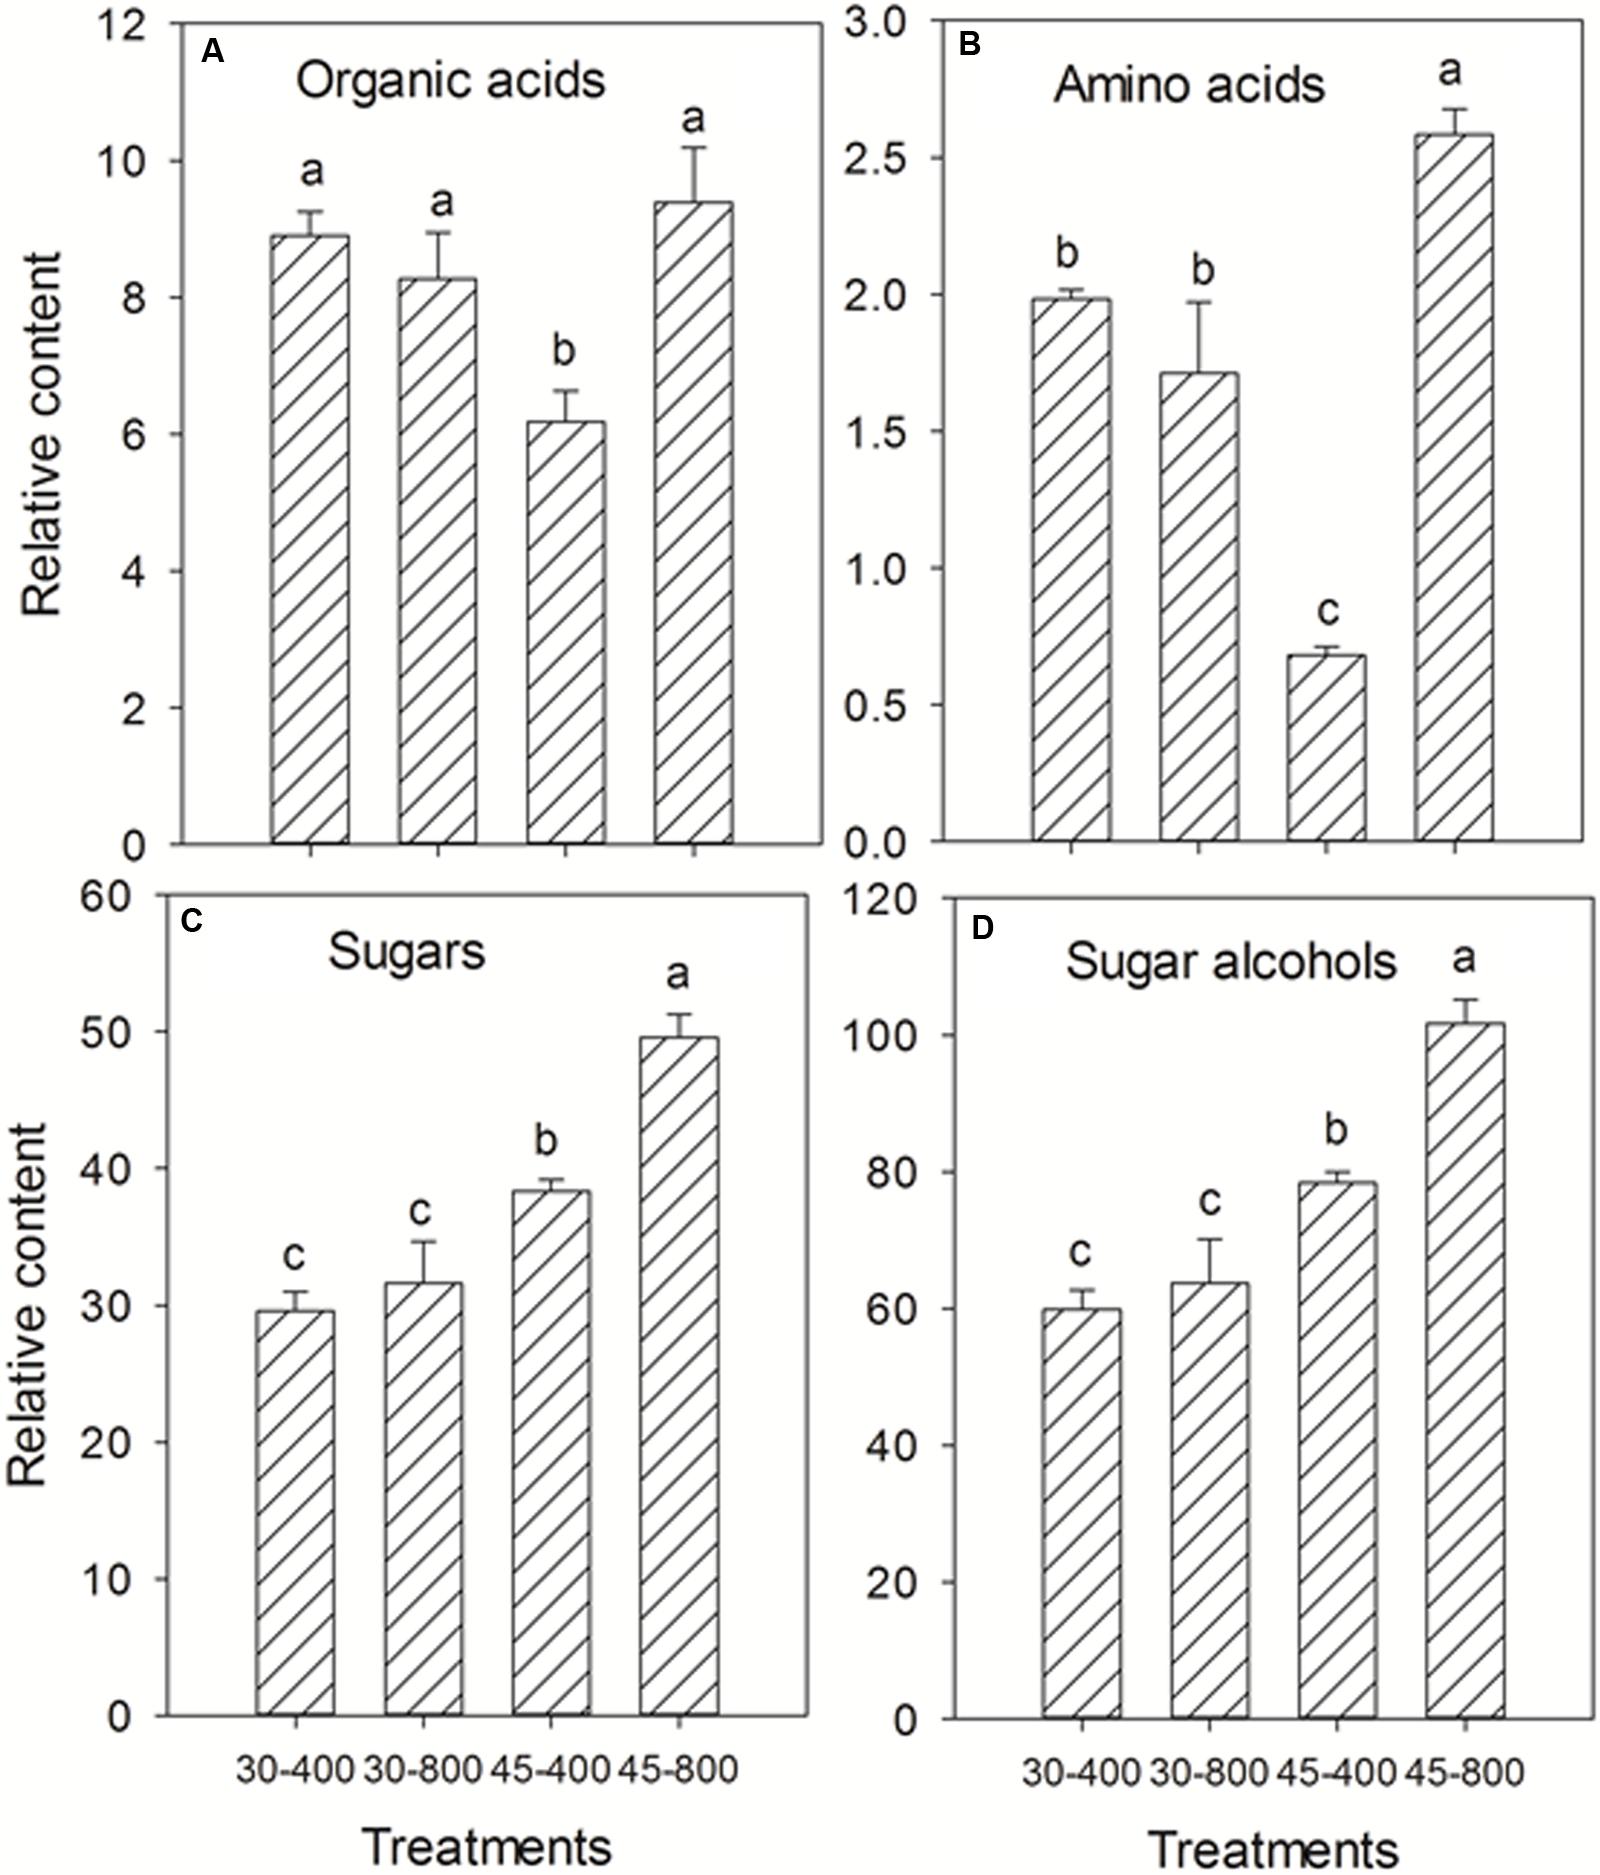
FIGURE 3. Effects of elevated CO2 concentration on total content of organic acids (A), amino acids (B), sugars (C), and sugar alcohols (D) in response to heat stress in bermudagrass. The treatments symbols are 30 and 45 for normal temperature control and heat stress and 400 and 800 for ambient CO2 and elevated CO2 concentrations, respectively.
For organic acids, under heat stress, plants grown at elevated CO2 exhibited significantly lower content of mucic acid, galacturonic acid, lactic acid, but higher content of pyruvic acid, α-ketoglutaric acid, citric acid, glyceric acid, pimelic acid, malic acid and threonic acid compared to those with ambient CO2 (Figures 4A–C). Plants exposed to elevated CO2 had significantly lower content of pyruvic acid and α-ketoglutaric acid than those with ambient CO2 under normal temperature (Figure 4B).
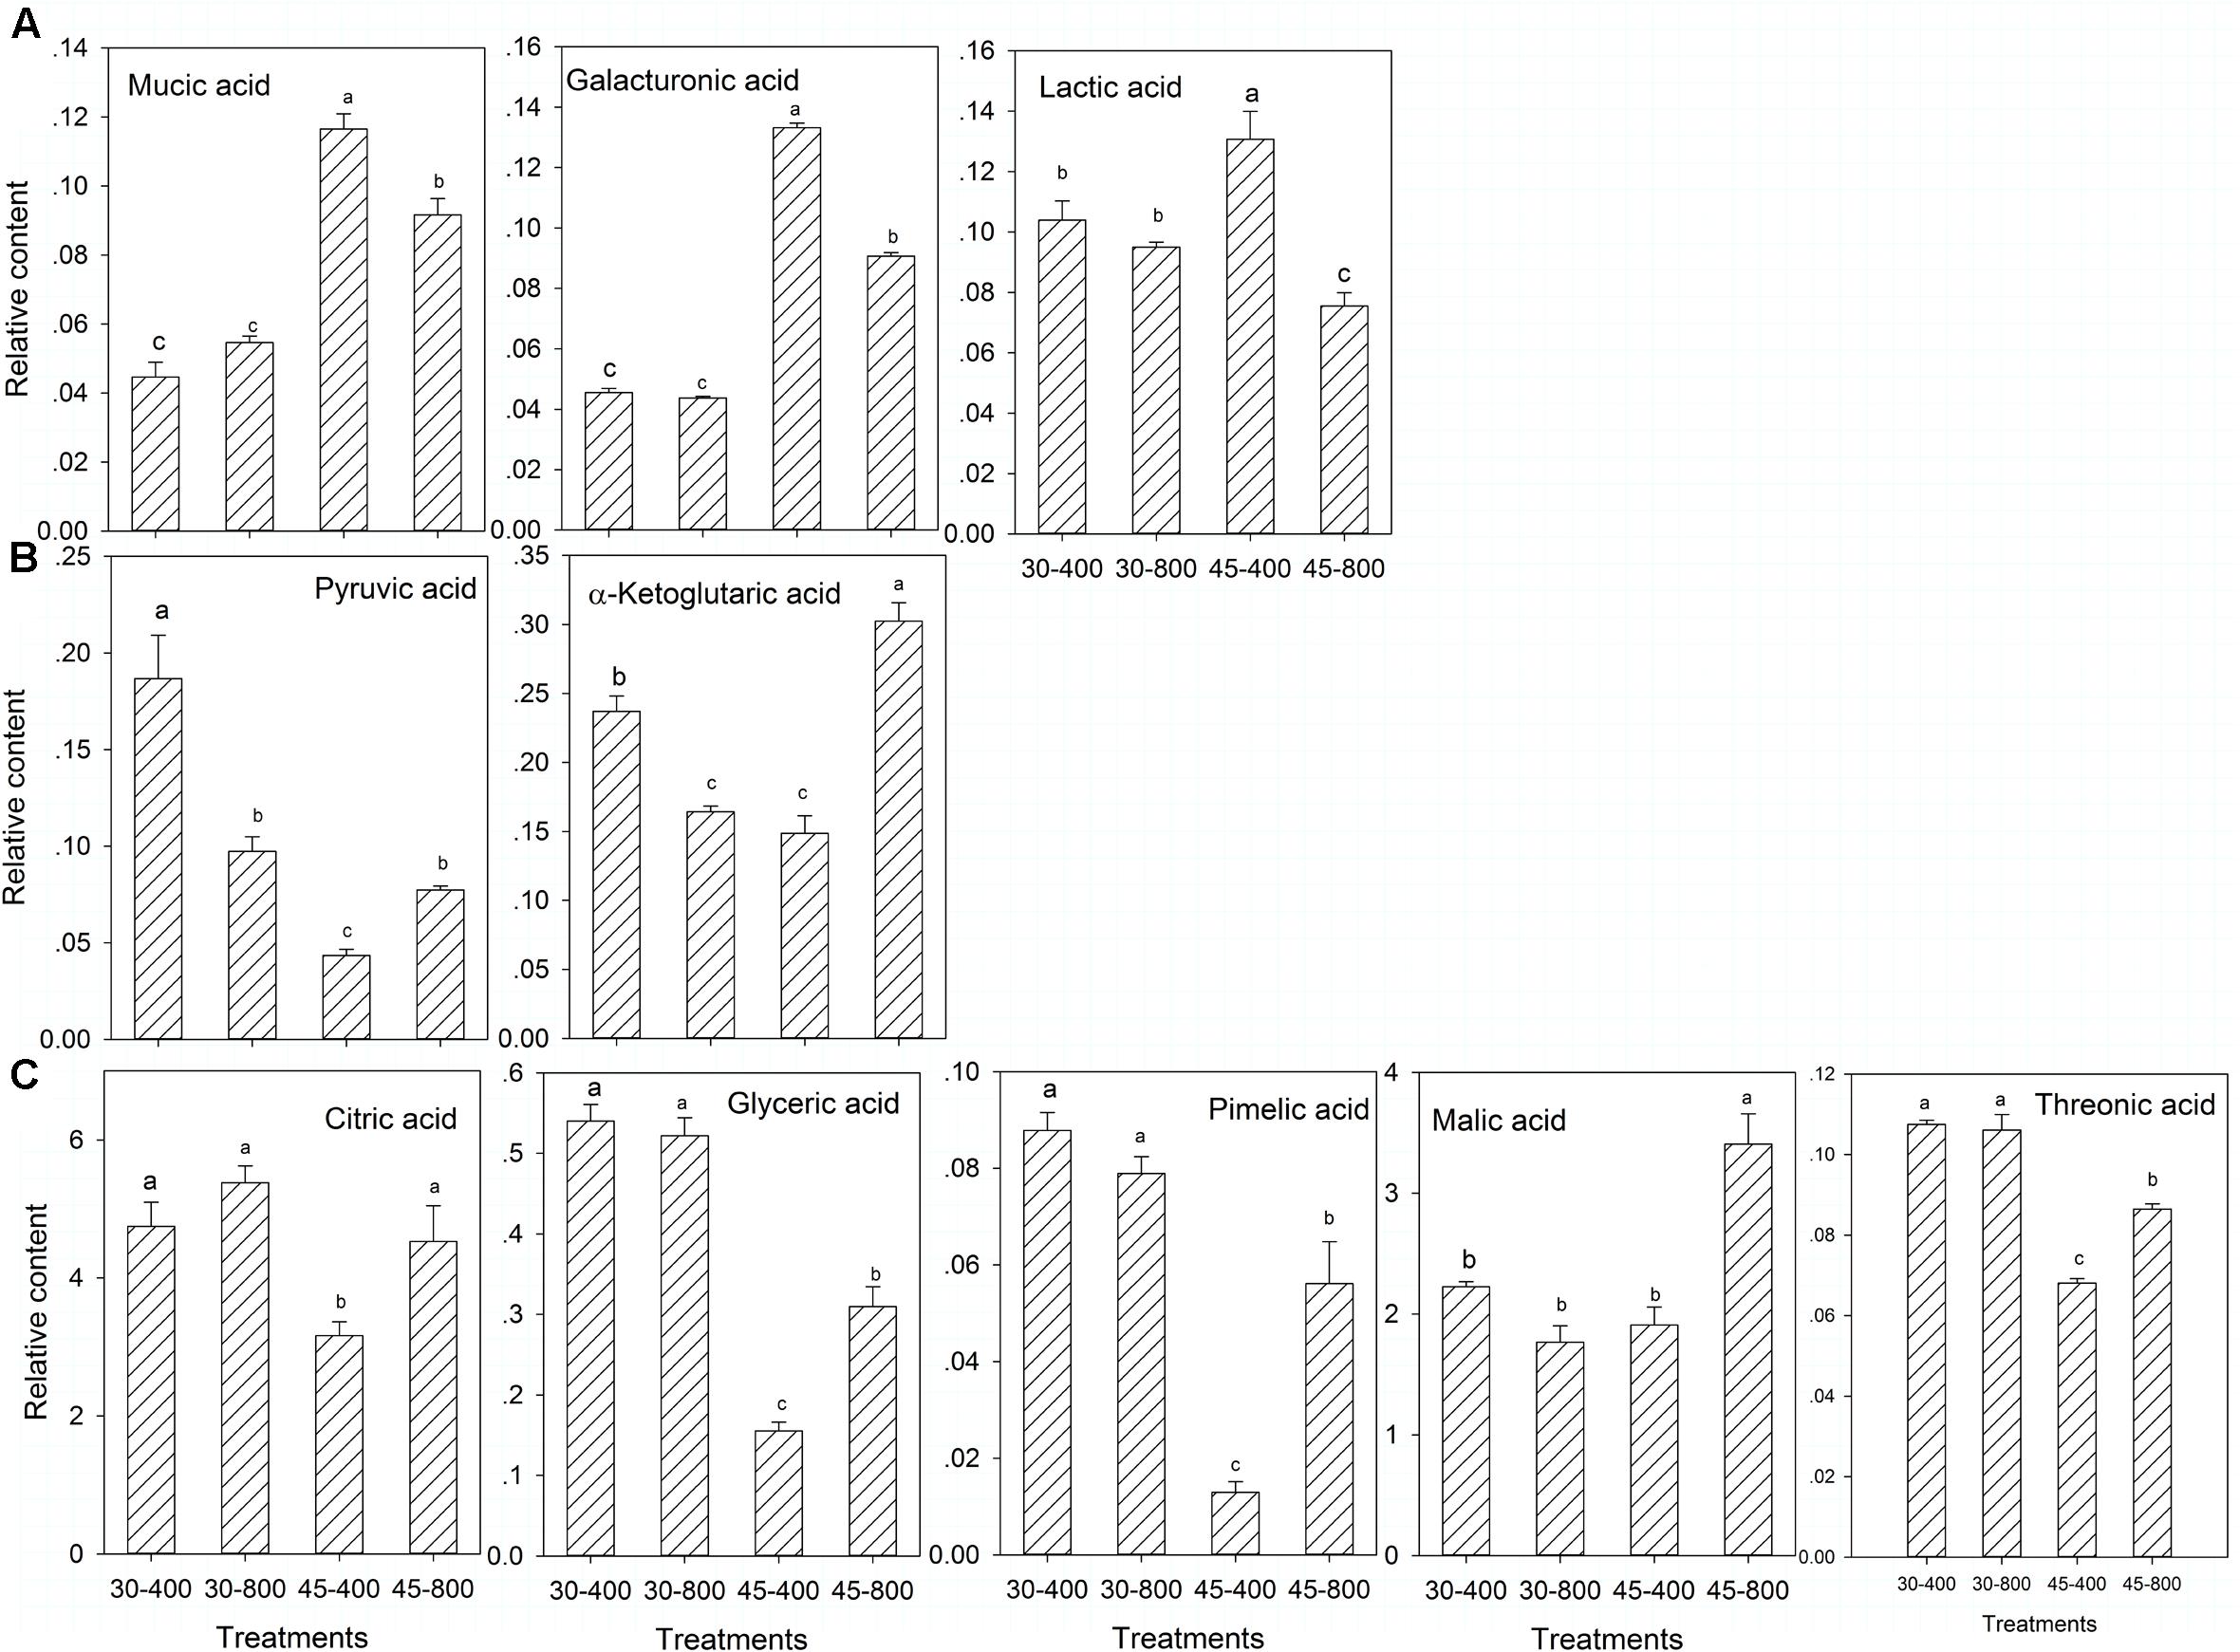
FIGURE 4. Effects of elevated CO2 concentration on organic acids in response to heat stress in bermudagrass. The treatments symbols are 30 and 45 for normal temperature control and heat stress and 400 and 800 for ambient CO2 and elevated CO2 concentrations, respectively. (A) No changes under 30–800 and down-regulation under 45–800; (B) No changes under 30–800 and up-regulation under 45–800; (C) Down-regulation under 30–800 and up-regulation under 45–800. Columns marked with different letters presented the significant differences based on LSD values (P ≤ 0.05) among treatments.
For amino acids, under heat stress, the content of all amino acids were increased by elevated CO2 except glycine compared with ambient CO2 (Figure 5). The content of alanine, GABA, and serine (Figure 5C) was significantly lower and the content of aspartic acid, isoleucine, lysine and glutamic acid (Figure 5D) was significantly higher in plants exposed to elevated CO2 compared with ambient CO2 treatments under normal temperature.
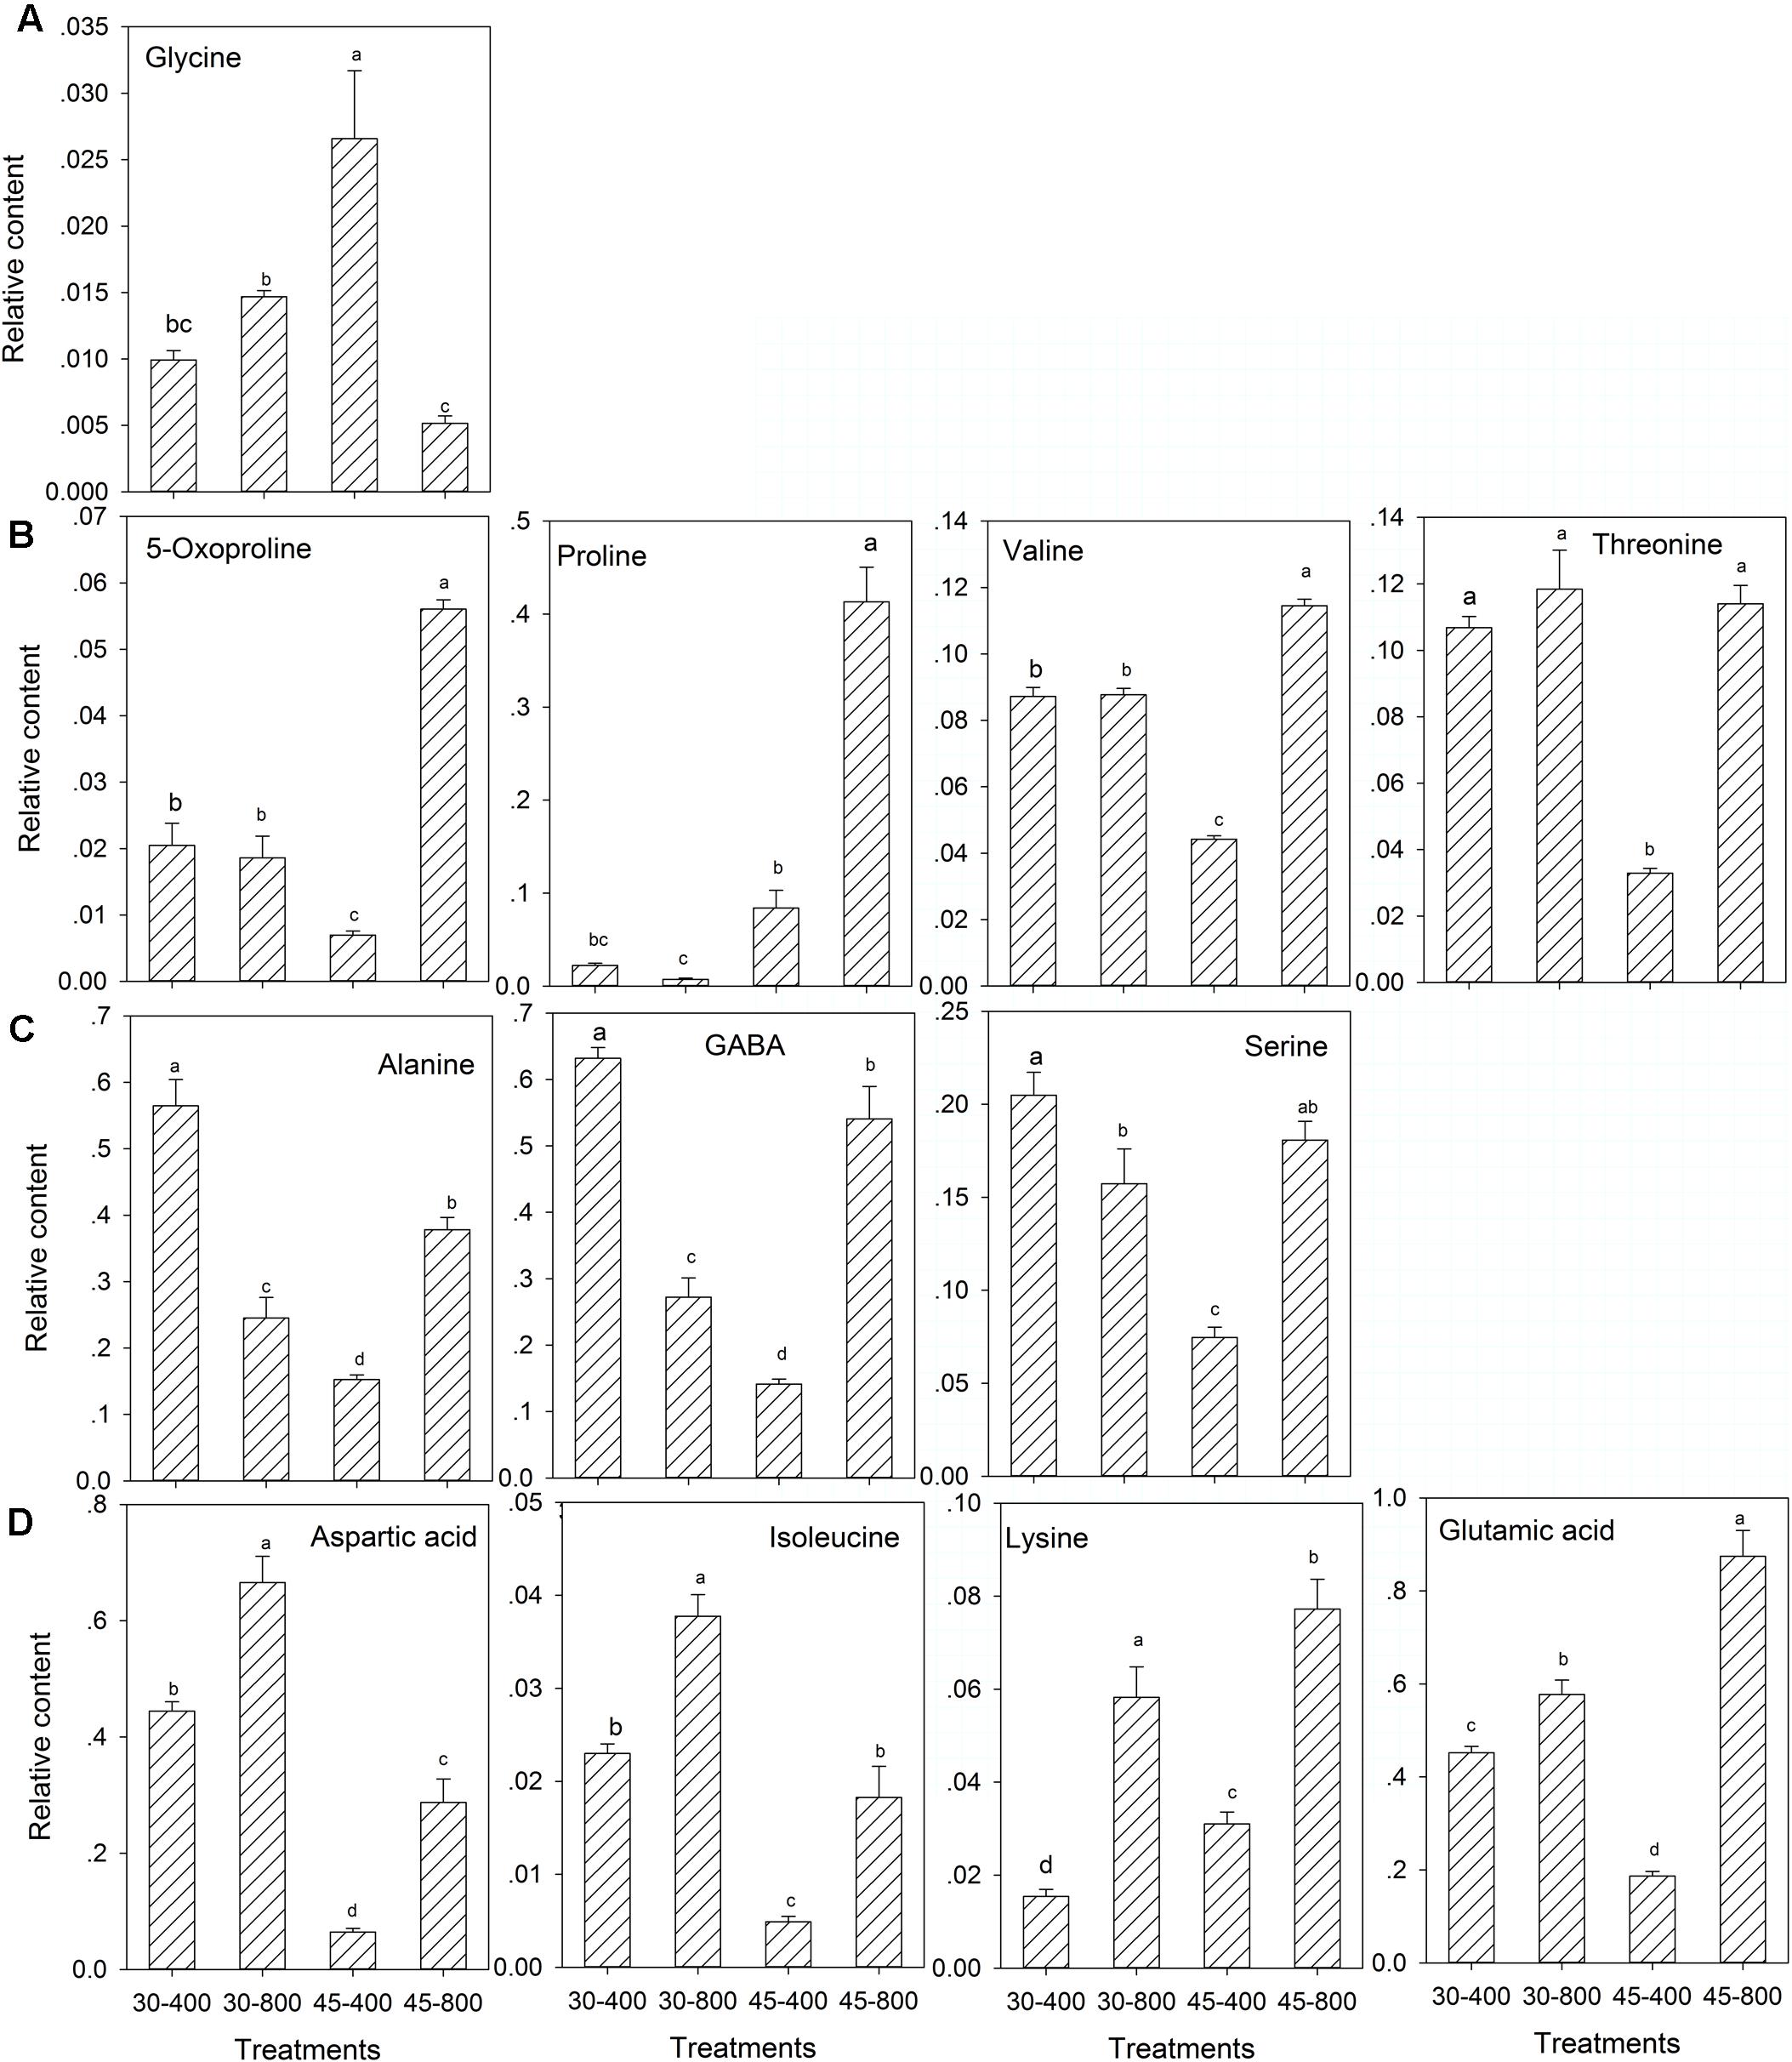
FIGURE 5. Effects of elevated CO2 concentration on amino acids in response to heat stress in bermudagrass. The treatments symbols are 30 and 45 for normal temperature control and heat stress and 400 and 800 for ambient CO2 and elevated CO2 concentrations, respectively. (A) No changes under 30–800 and down-regulation under 45–800; (B) No changes under 30–800 and up-regulation under 45–800; (C) Down-regulation under 30–800 and up-regulation under 45–800; (D) Up-regulation under both 30–800 and 45–800. Columns marked with different letters presented the significant differences based on LSD values (P ≤ 0.05) among treatments.
For sugars and sugar alcohols, the content of gentiobiose, gulose, lyxose (Figure 6A), and myo-inositol (Figure 7) was decreased while that of erythrose and glucopyranose (Figure 6B) was increased by elevated CO2 compared to plants grown at ambient CO2 concentration under normal temperature. Under heat stress, 8 out of 18 sugars, and two sugar alcohols (mannitol and galactinol) exhibited increases in the content in plants exposed to elevated CO2 compared with ambient CO2 (Figures 6, 7).
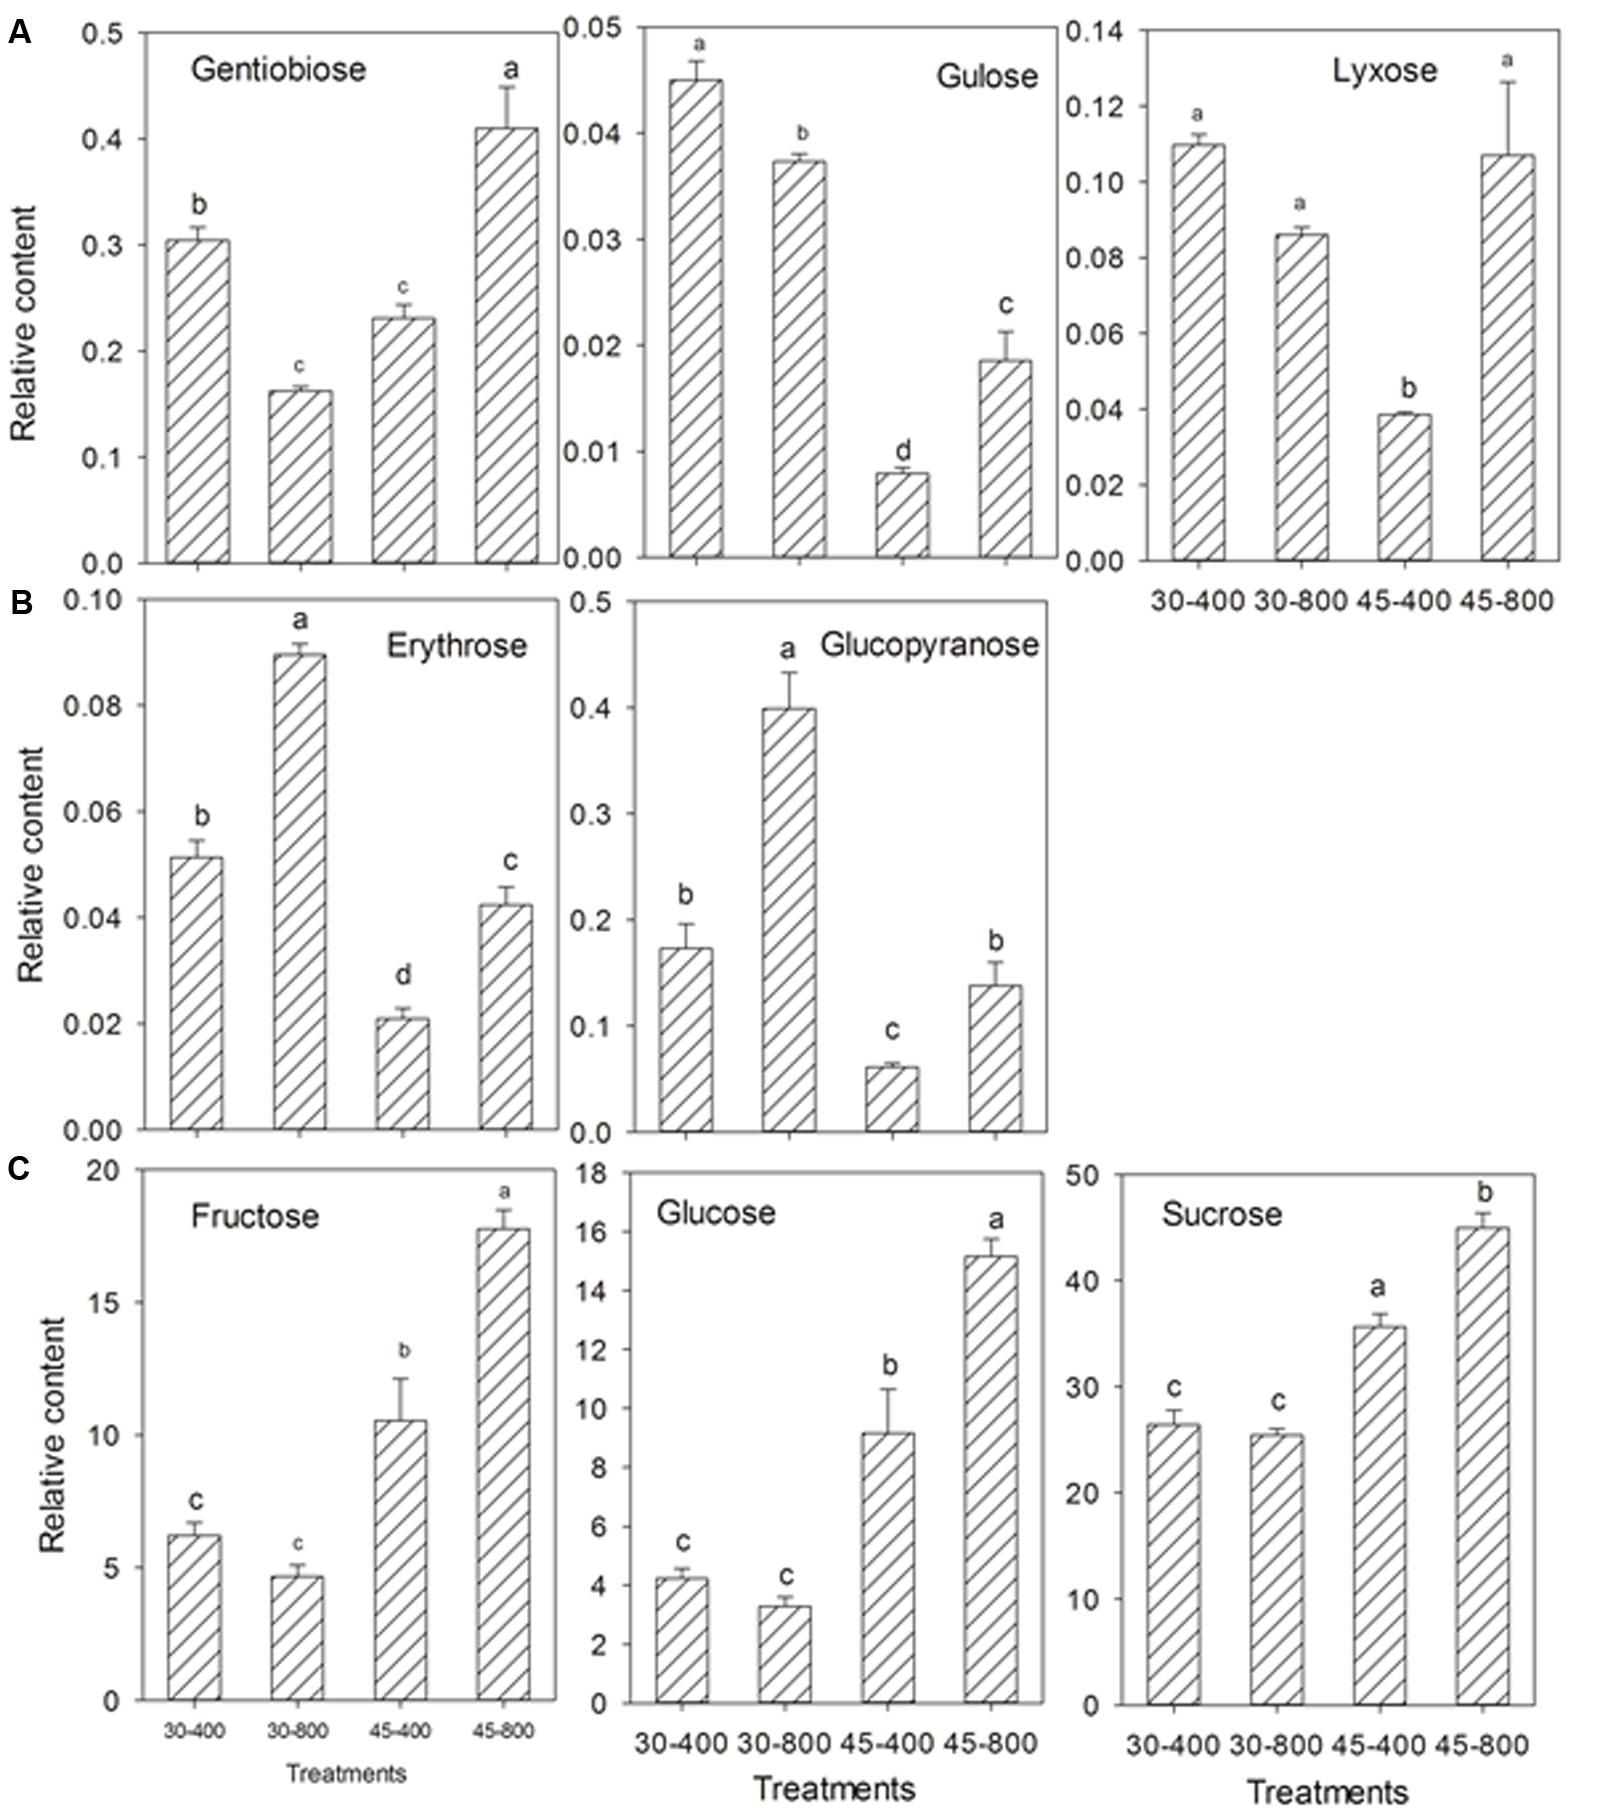
FIGURE 6. Effects of elevated CO2 concentration on sugars in response to heat stress in bermudagrass. The treatments symbols are 30 and 45 for normal temperature control and heat stress and 400 and 800 for ambient CO2 and elevated CO2 concentrations, respectively. (A) Down-regulation or no changes under 30–800 and down-regulation under 45–800; (B) Up-regulation under both 30–800 and 45–800; (C) No changes under 30–800 and up-regulation under 45–800. Columns marked with different letters presented the significant differences based on LSD values (P ≤ 0.05) among treatments.
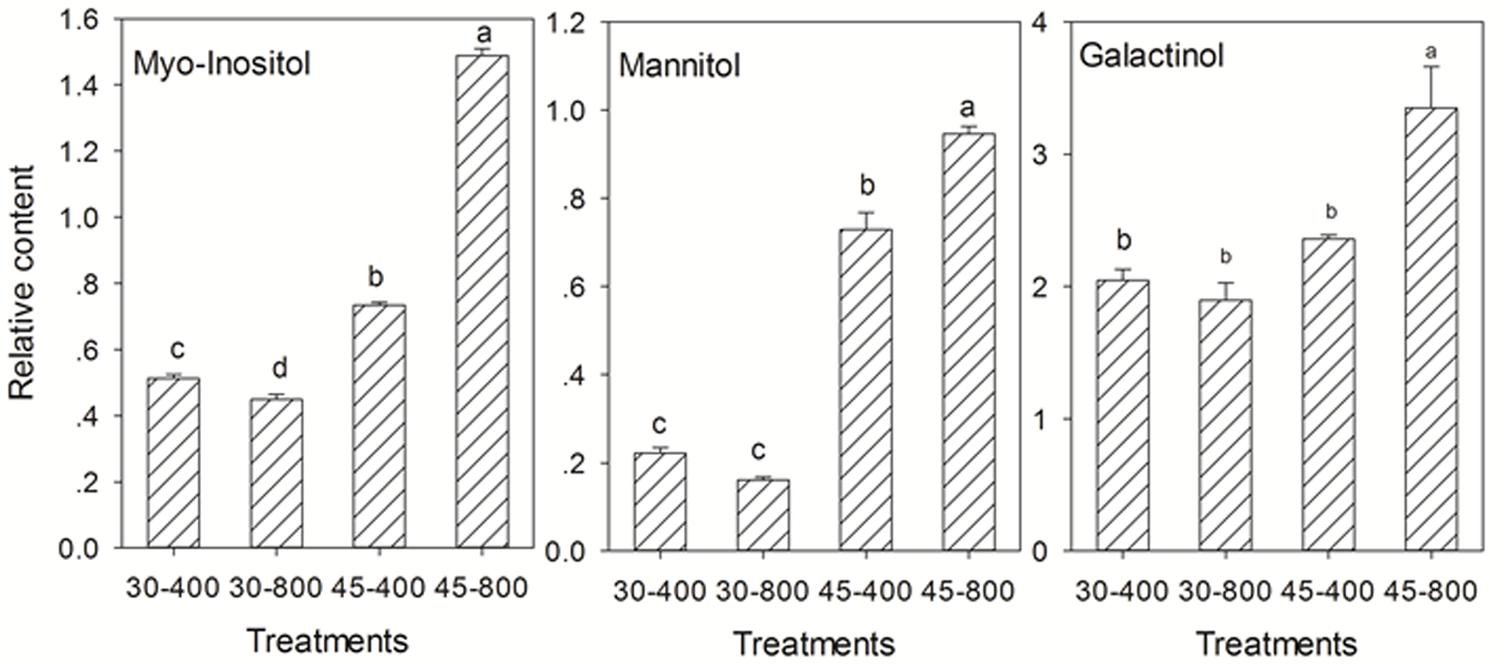
FIGURE 7. Effects of elevated CO2 concentration on sugar alcohols in response to heat stress in bermudagrass. The treatments symbols are 30 and 45 for normal temperature control and heat stress and 400 and 800 for ambient CO2 and elevated CO2 concentrations, respectively. Columns marked with different letters presented the significant differences based on LSD values (P ≤ 0.05) among treatments.
Out of 53 identified metabolites, 43 were placed into the metabolic pathways associated with GABA shunt, TCA cycle, sugar and amino acid metabolism (Figure 8). These 43 metabolites included 16 organic acids, 12 amino acids, 11 sugars and 4 sugar alcohols. Under heat stressed conditions, elevated CO2 enhanced the accumulation of metabolites associated with GABA shunt, sugar and amino metabolisms.
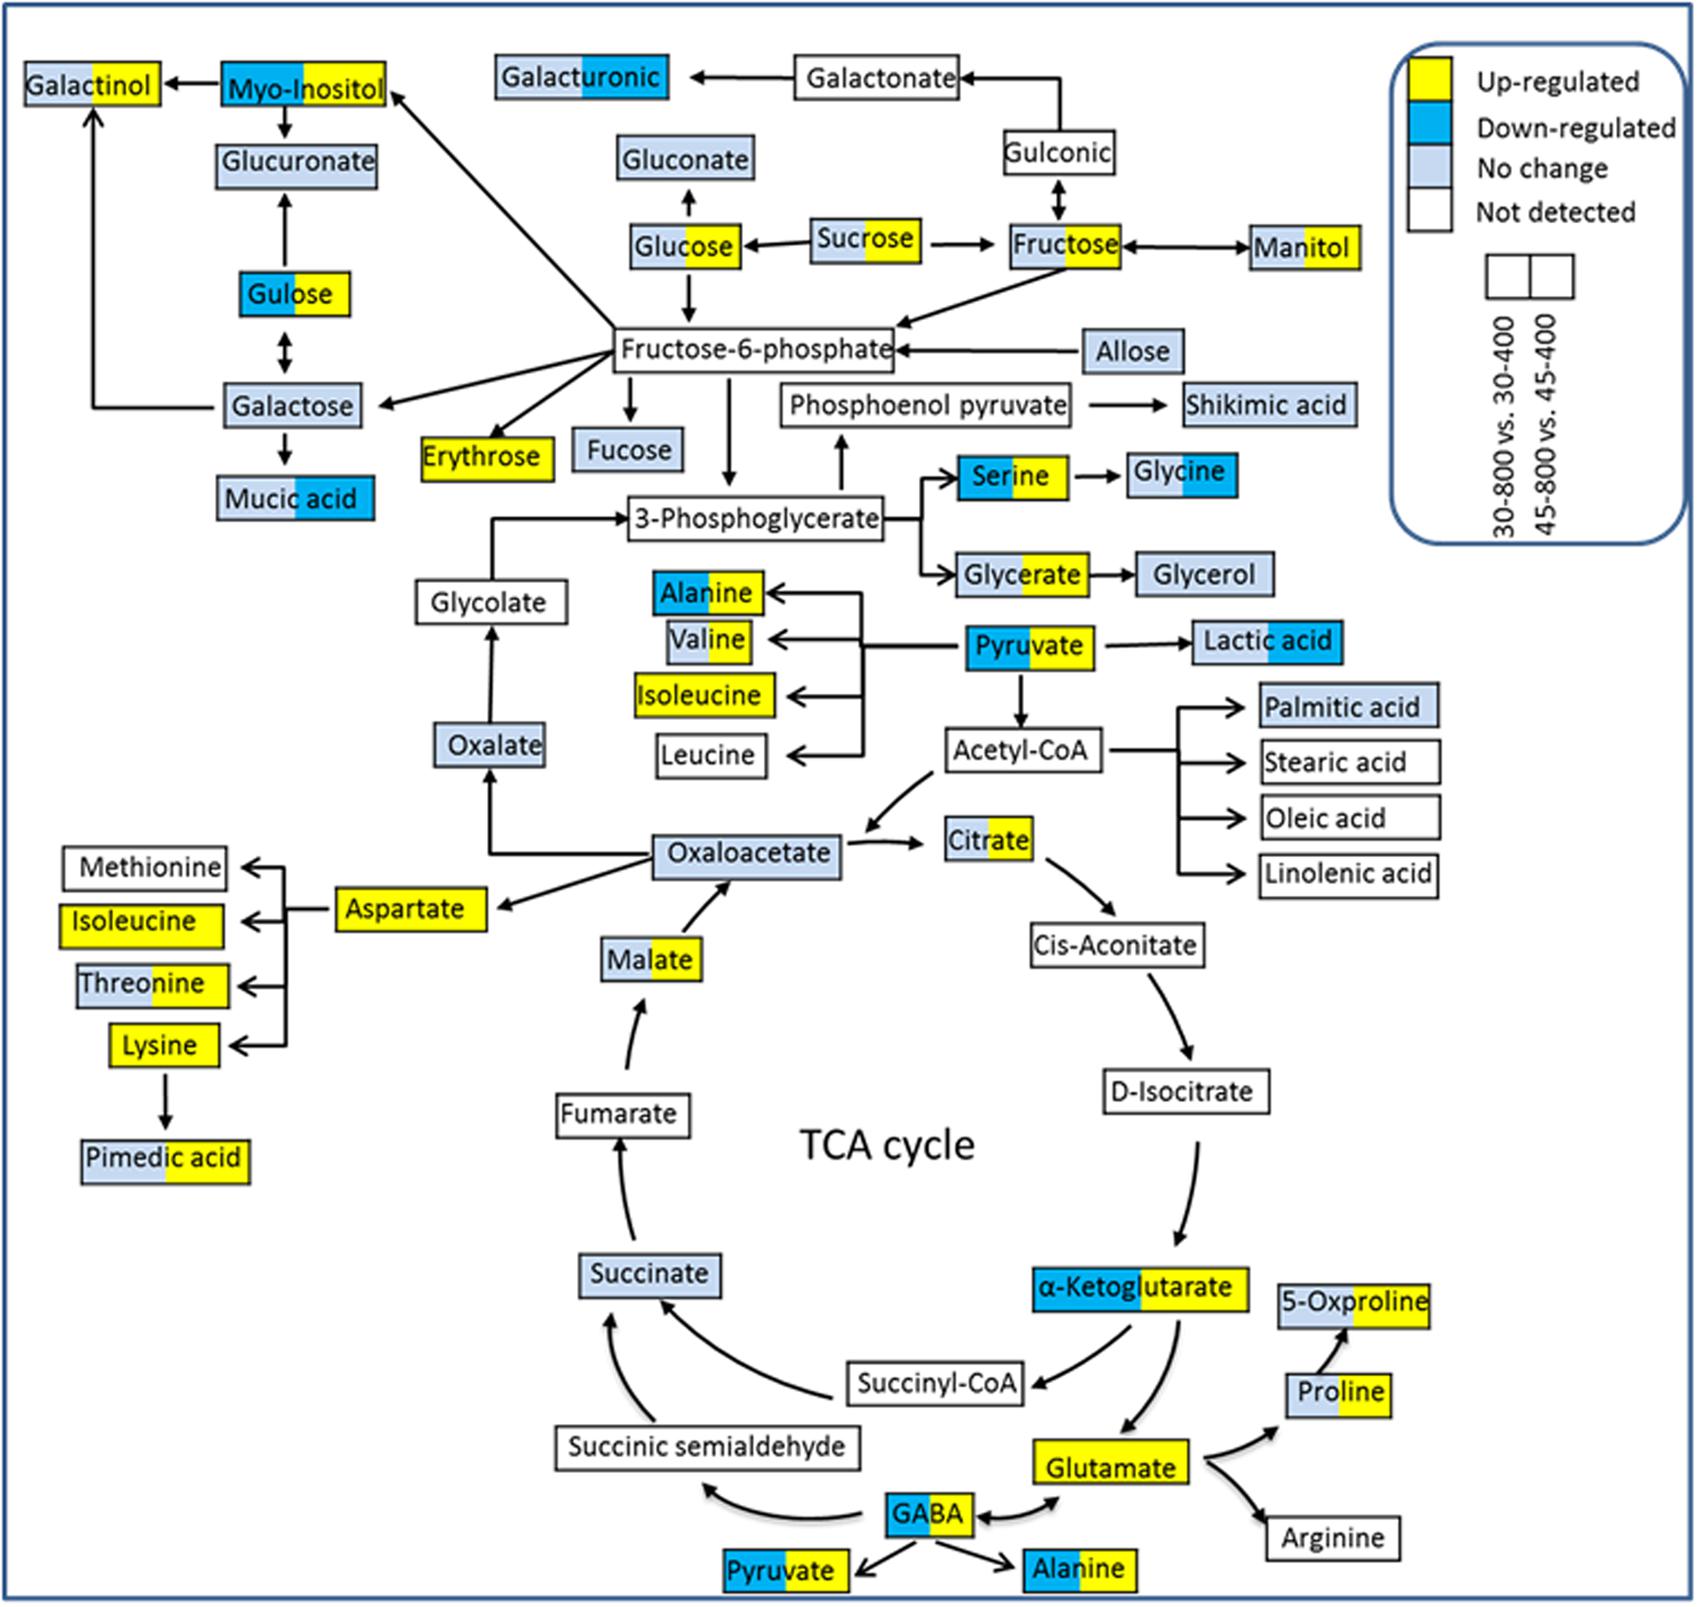
FIGURE 8. The metabolic pathways associated with differentially expressed metabolites. The treatments symbols are 30 and 45 for normal temperature control and heat stress and 400 and 800 for ambient CO2 and elevated CO2 concentrations, respectively.
Proteomic Responses to Elevated CO2
A total of 70 and 53 protein spots were differentially expressed in leaves of bermudagrass due to elevated CO2 compared to those at ambient CO2 under normal and high temperature, respectively (Figure 9 and Table 2).
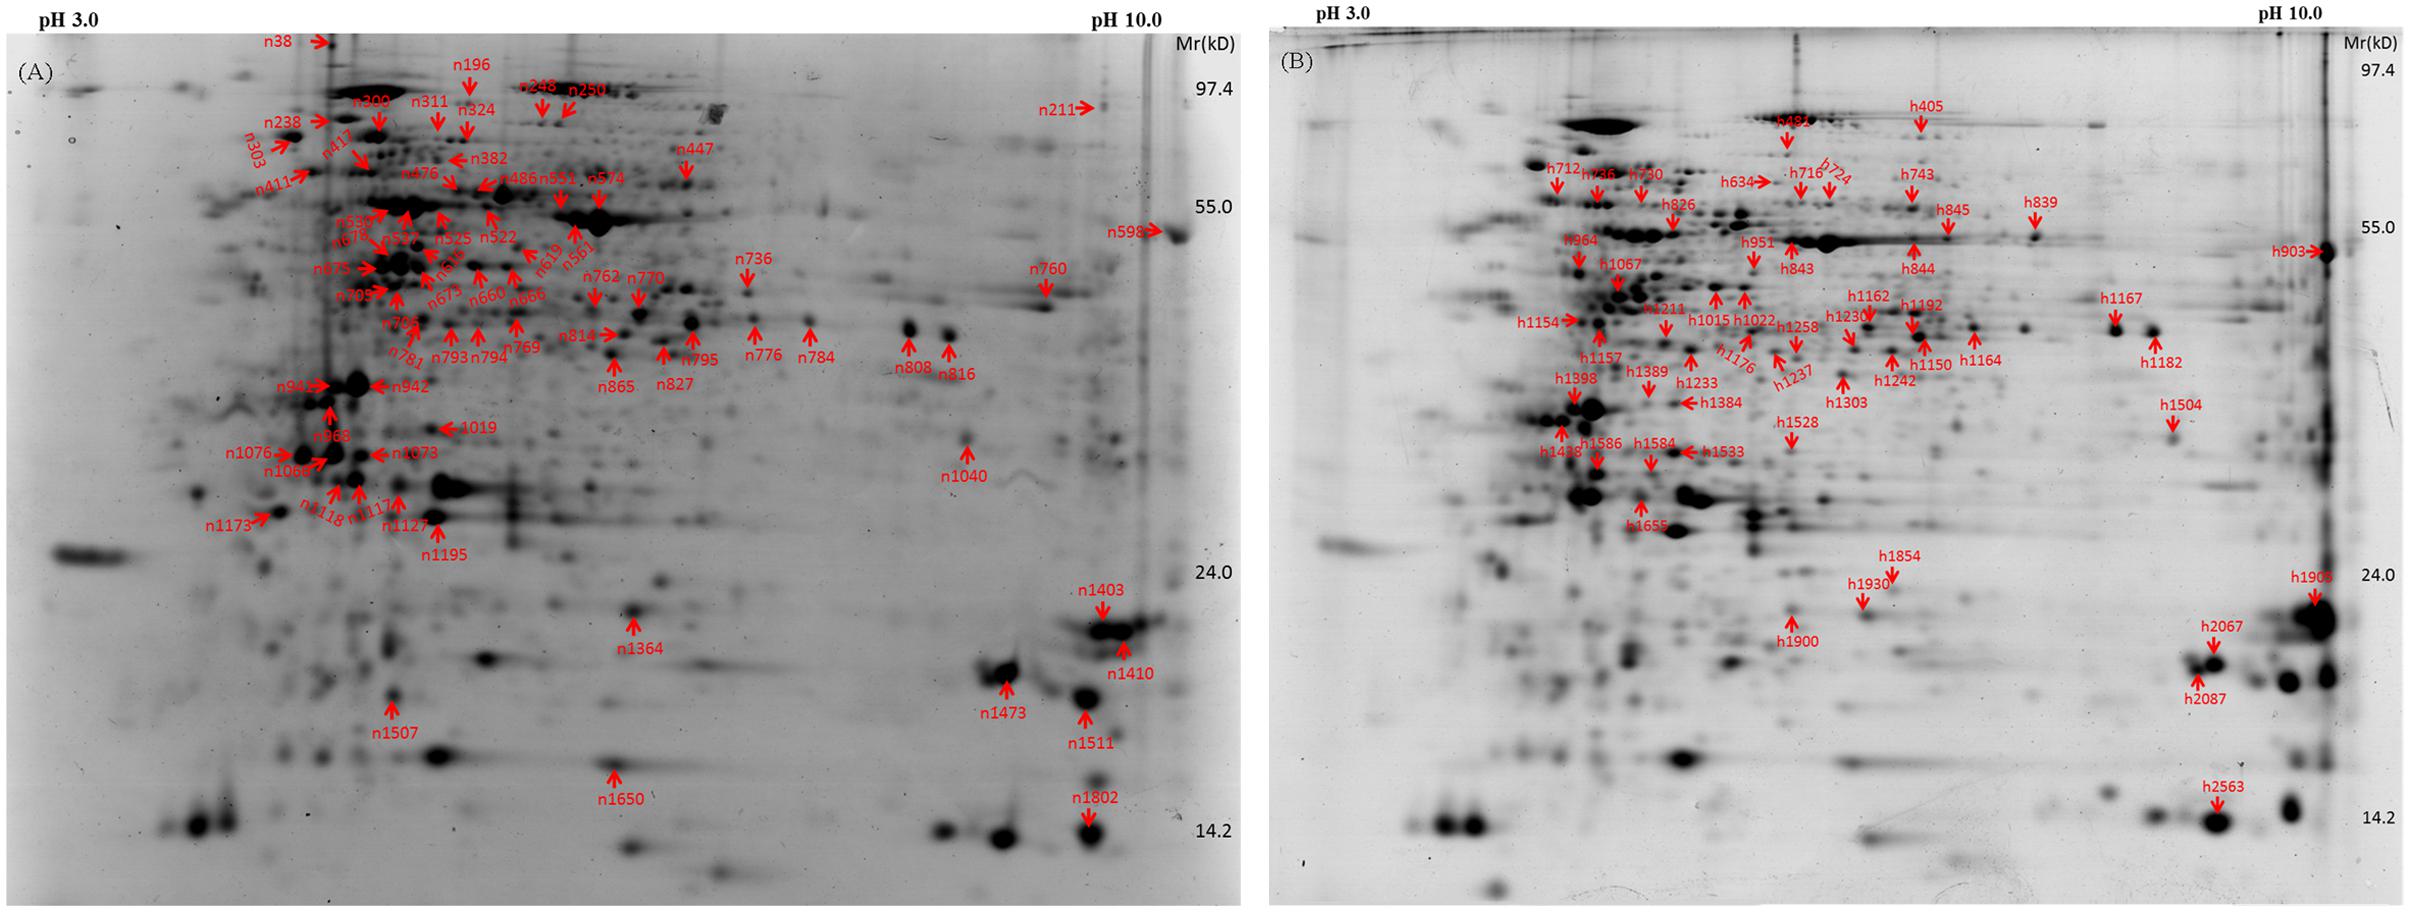
FIGURE 9. Representative gels of 2-D with differentially expressed proteins identified in bermudagrass grown under normal temperature (A) and heat stress (B) at 28 days of treatments. Labels of spots in each gel were consistent with Table 2.
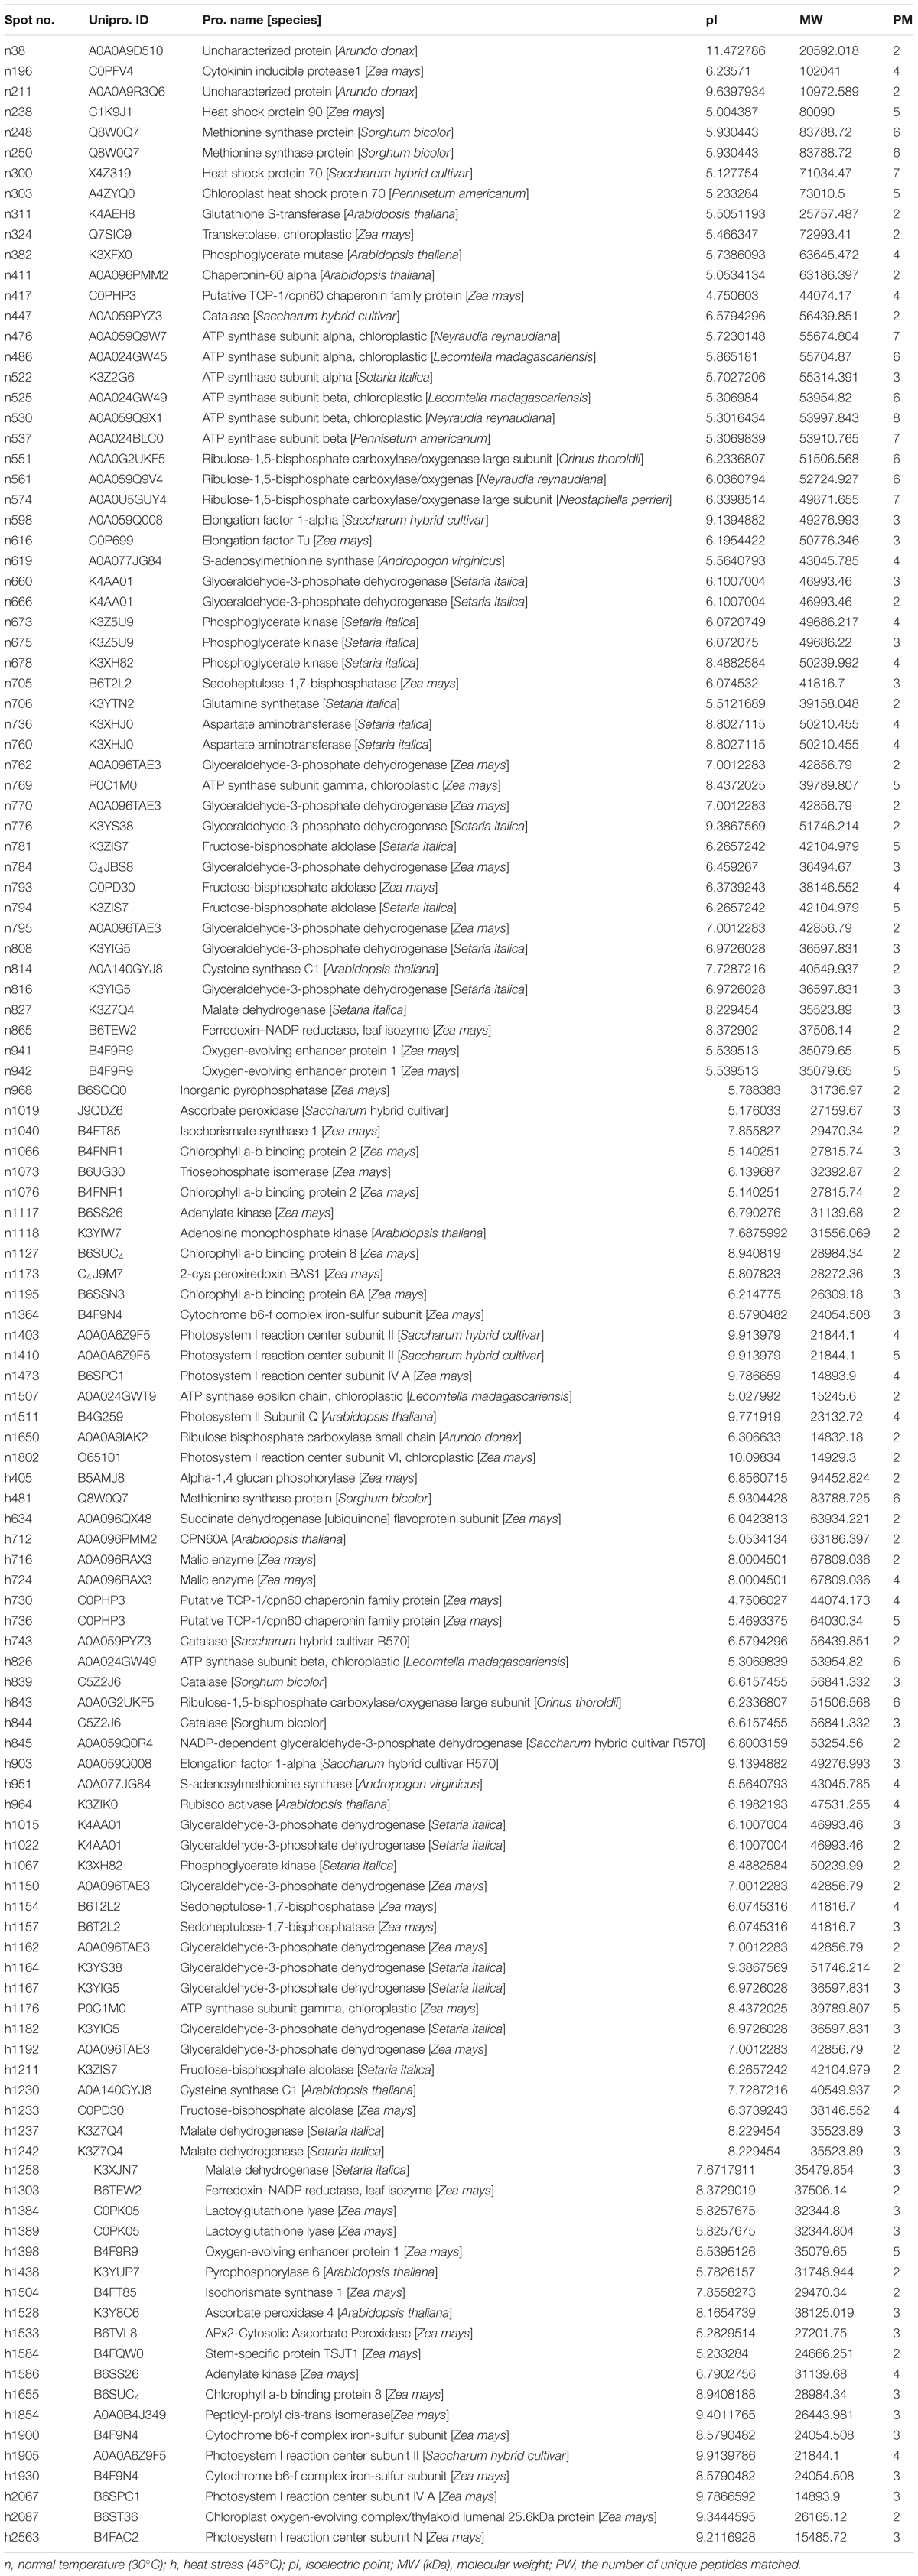
TABLE 2. Differentially expressed proteins in response to different CO2 concentrations and temperatures by comparison between elevated CO2 and ambient CO2 in leaves of bermudagrass at 28 days of treatments.
Those 70 proteins up- or down-regulated by elevated CO2 under normal temperature were found in plastid (67.1%), cytosol (18.6%), mitochondrion (5.7%), peroxisome (4.3%), cytosol and plasma membrane (1.4%) and unknown locations (2.9%) (Figure 10). GO category enrichment showed that 70 proteins participated in various biological processes (metabolic process, response to stress, generation of precursor metabolites and energy, photosynthesis, carbohydrate metabolic process, glycolysis, protein folding, and carbohydrate biosynthetic process), molecular functions (catalytic activity and oxidoreductase activity) and cellular components (intracellular, cell, cytoplasm, organelle, plastid, chloroplast, membrane, protein complex, thylakoid, mitochondrion, envelope, plastoglobule, cytosol, stromule, and photosystem) (Figure 11A).
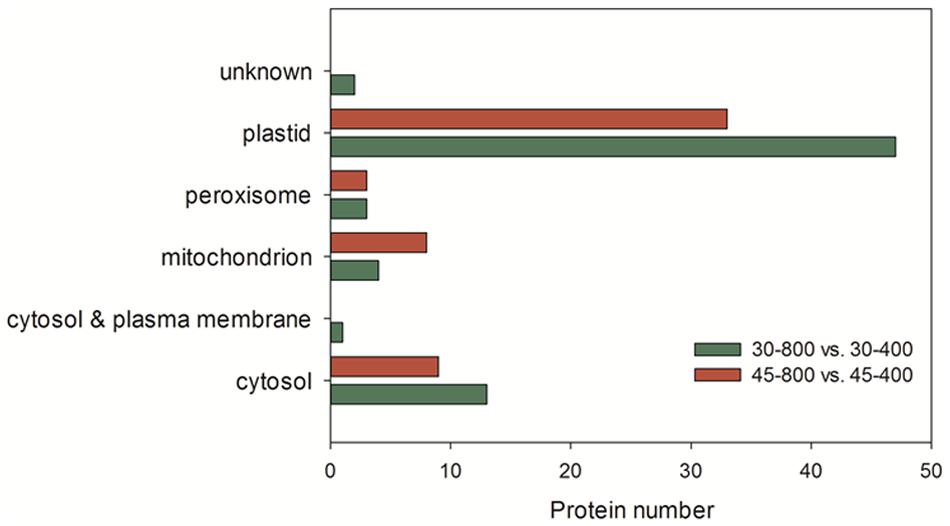
FIGURE 10. Subcellular location of identified proteins in response to different CO2 concentrations and temperatures. The treatments symbols are 30 and 45 for normal temperature control and heat stress and 400 and 800 for ambient CO2 and elevated CO2 concentrations, respectively.
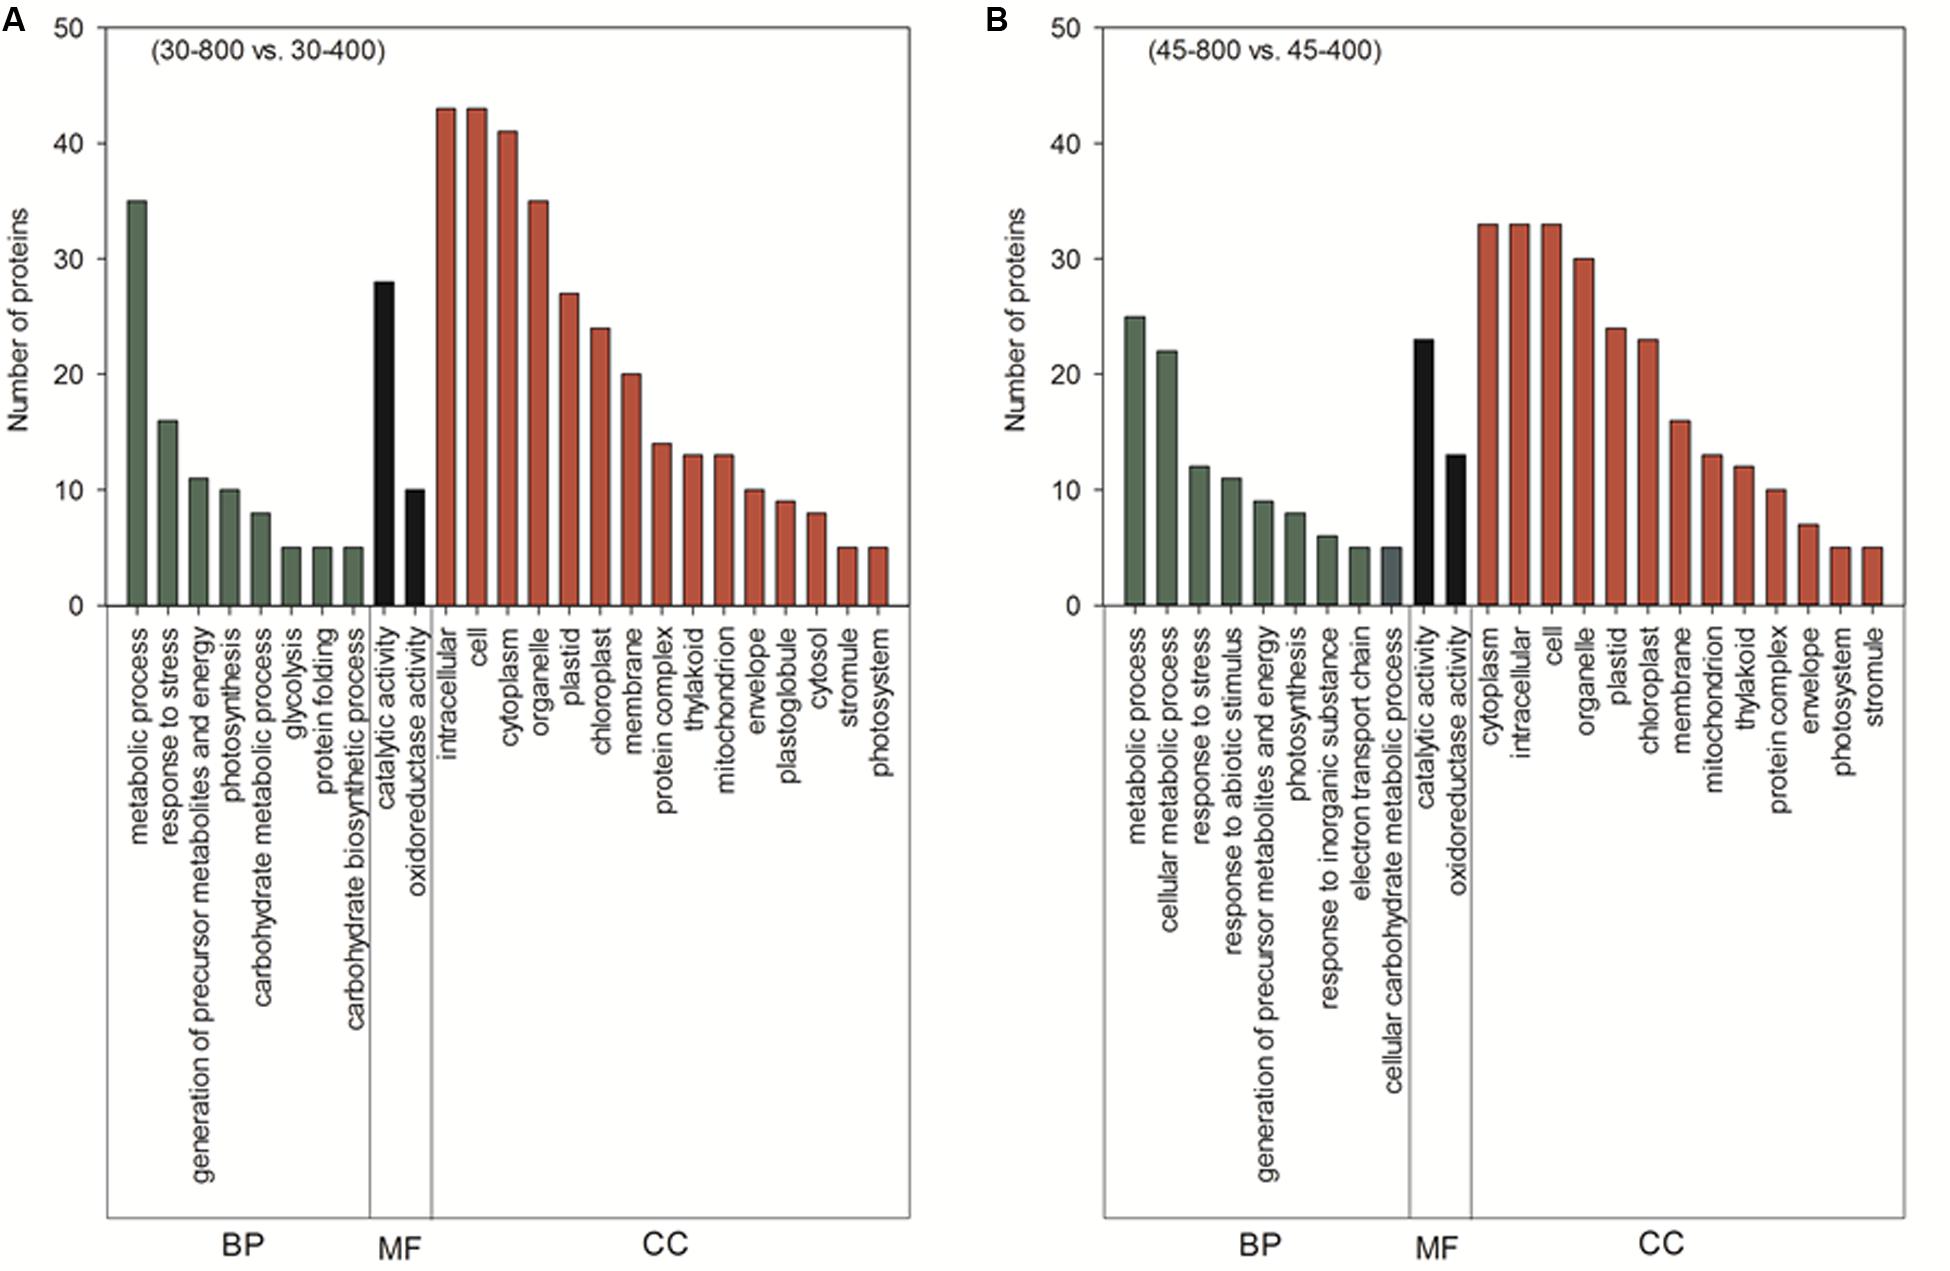
FIGURE 11. Cluster analysis from gene ontology (GO) analysis of differentially expressed proteins in response to different CO2 concentrations under normal temperature (A) and heat stress (B) in leaves of bermudagrass. The treatments symbols are 30 and 45 for normal temperature control and heat stress and 400 and 800 for ambient CO2 and elevated CO2 concentrations, respectively. BP, biological process; MF, molecular function; CC, cellular component.
The majority of these 53 proteins up- or down-regulated by elevated CO2 under heat stress mainly distributed in plastid (62.3%) followed by cytosol (17%) (Figure 10). GO category enrichment indicated that the biological processes regulated by CO2 included cellular metabolic process, responses to stress, response to abiotic stimulus, generation of precursor metabolites and energy, photosynthesis, response to inorganic substance, electron transport chain, carbohydrate metabolism, molecular functions (catalytic activity and oxidoreductase activity) and cellular components (cytoplasm, intracellular, cell, organelle, plastid, chloroplast, membrane, mitochondrion, thylakoid, protein complex, envelope, photosystem, and stromule) (Figure 11B).
Based on the Venn analysis, 18 and 19 differential proteins were up-regulated by elevated CO2 only under either normal temperature or heat stress, respectively (Figure 12A). Elevated CO2 caused 12 proteins to be up-regulated regardless of temperature (Figure 12A). A total of 40 proteins were down-regulated by elevated CO2 under normal and high temperature (Figure 12B). There were 27 proteins down-regulated under normal temperature and 7 proteins down-regulated under heat stress alone due to elevated CO2 treatment. The differentially expressed proteins in responses to elevated CO2 and heat stress were classified into different functional categories (Figure 13).
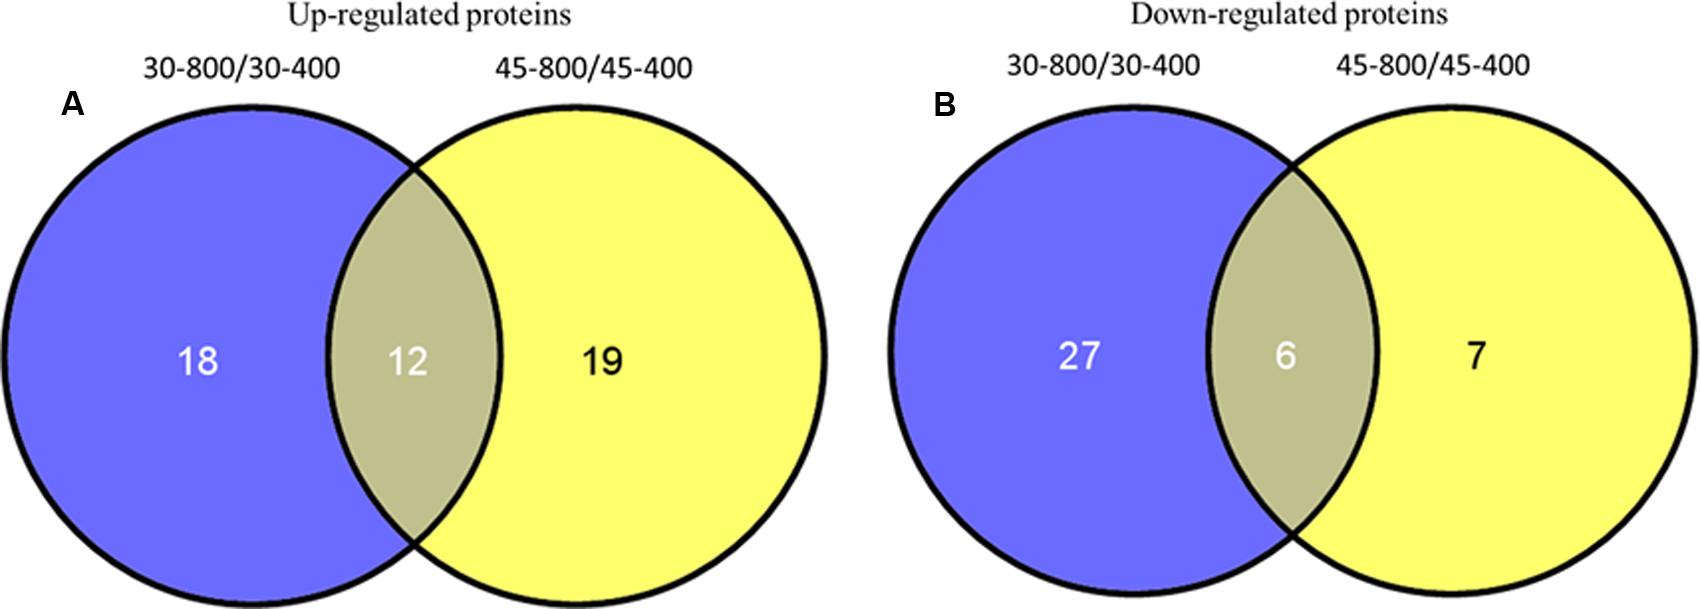
FIGURE 12. Venn analysis of up-regulated proteins (A) and down-regulated proteins (B) identified in bermudagrass at 28 days of treatments. The treatments symbols are 30 and 45 for normal temperature control and heat stress and 400 and 800 for ambient CO2 and elevated CO2 concentrations, respectively.
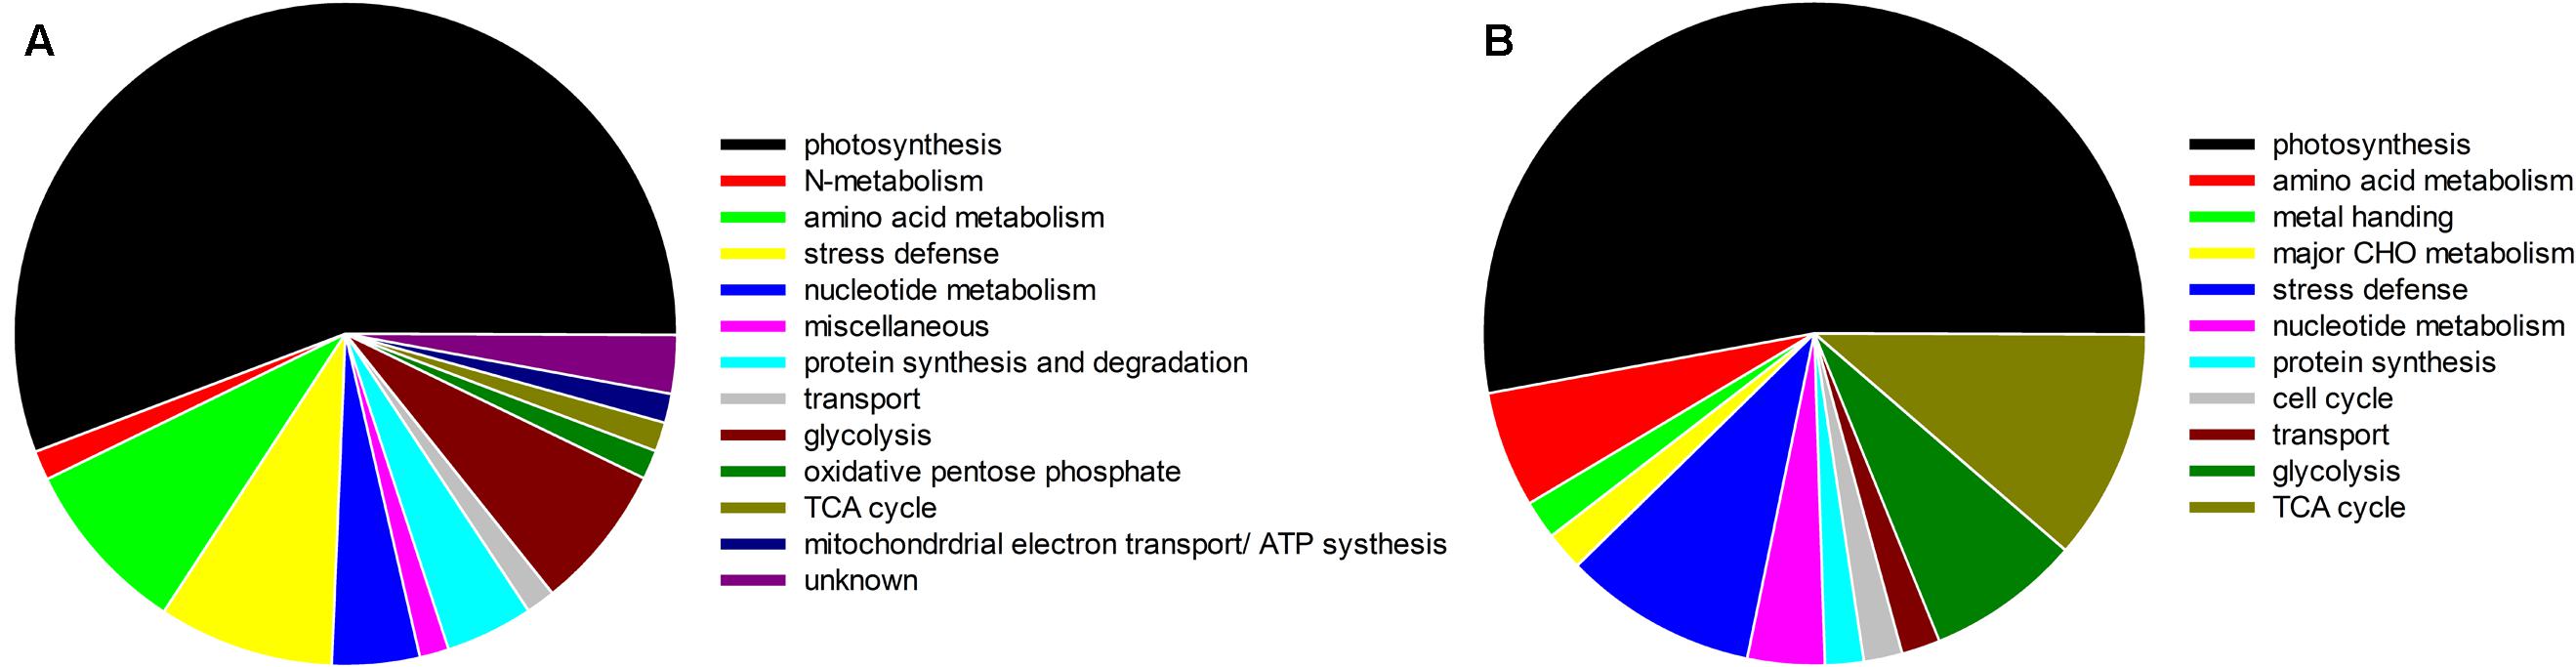
FIGURE 13. Functional classification of CO2 responsive proteins identified in bermudagrass grown under normal temperature (A) and heat stress (B) at 28 days of treatments.
Under normal temperature condition, the differential proteins caused by elevated CO2 compared with ambient CO2 were involved in photosynthesis (55.7%), followed by amino acid metabolism (8.6%), glycolysis (7.1%), protein synthesis and degradation (4.3%), stress defense (8.6%), nucleotide metabolism (4.3%), and the remaining (11.4%) including those unknown functions (Figure 13A). For proteins related to photosynthesis, significant increases in the relative fold change were found in ATP synthase subunit (ATPA, n476) by 1.5-fold, rubisco large subunit (RBCL, n551, n561, n574) by 1.1- to 2.6-fold, glyceraldehyde-3-phosphate dehydrogenase (GAPDH, n660, n762, n770, n795) by 1.1- to 1.4-fold, ATP synthase subunit gamma (ATPC, n769) by 1.6-fold, fructose-bisphosphate aldolase (FBA, n781) by 1.4-fold, ferredoxin-NADP reductase (FNR, n865) by 1.3-fold, oxygen-evolving enhancer protein (OEE, n941) by 1.6-fold, chlorophyll a-b binding protein (LHC, n1066, n1076, n1127, n1195) by 1.3- to 2.4-fold, cytochrome b6-f complex iron-sulfur subunit (PGR, n1364) by 2.0-fold, rubisco small chain (RBCS, n1650) by 1.5-fold (Figure 14A). Other 21 proteins involved in photosynthesis [(chaperonin-60 alpha, CPN60A), n411 by 1.14-fold; (cpn60 chaperonin family protein, CPN60B), n417 by 1.52-fold; n486, ATPA by 1.53-fold; n525, n530 and n537, ATPB by 1.17- to 1.23-fold; n666, GAPDH by 1.23-fold; (Phosphoglycerate kinase, PGK), n673, n675 and n678 by 1.17- to 1.21-fold; (Sedoheptulose-1,7-bisphosphatase, SBPase), n705 by 1.18-fold; n793 and n794, FBA by 1.22 – 1.35; n942, OEE by 1.37-fold; n1073, TIM by 1.36-fold; (Photosystem I reaction center subunit, Psa), PsaD, n1403 and n1410 by 1.47- to 2.11-fold; n1473, PsaE by 1.23-fold; n 1507, ATPE by 1.3-fold; n1511, PsbQ by 2.02-fold; n1802, PsaH by 1.89-fold] were significantly down-regulated by elevated CO2 under normal temperature compared with ambient CO2 (Figure 14A).
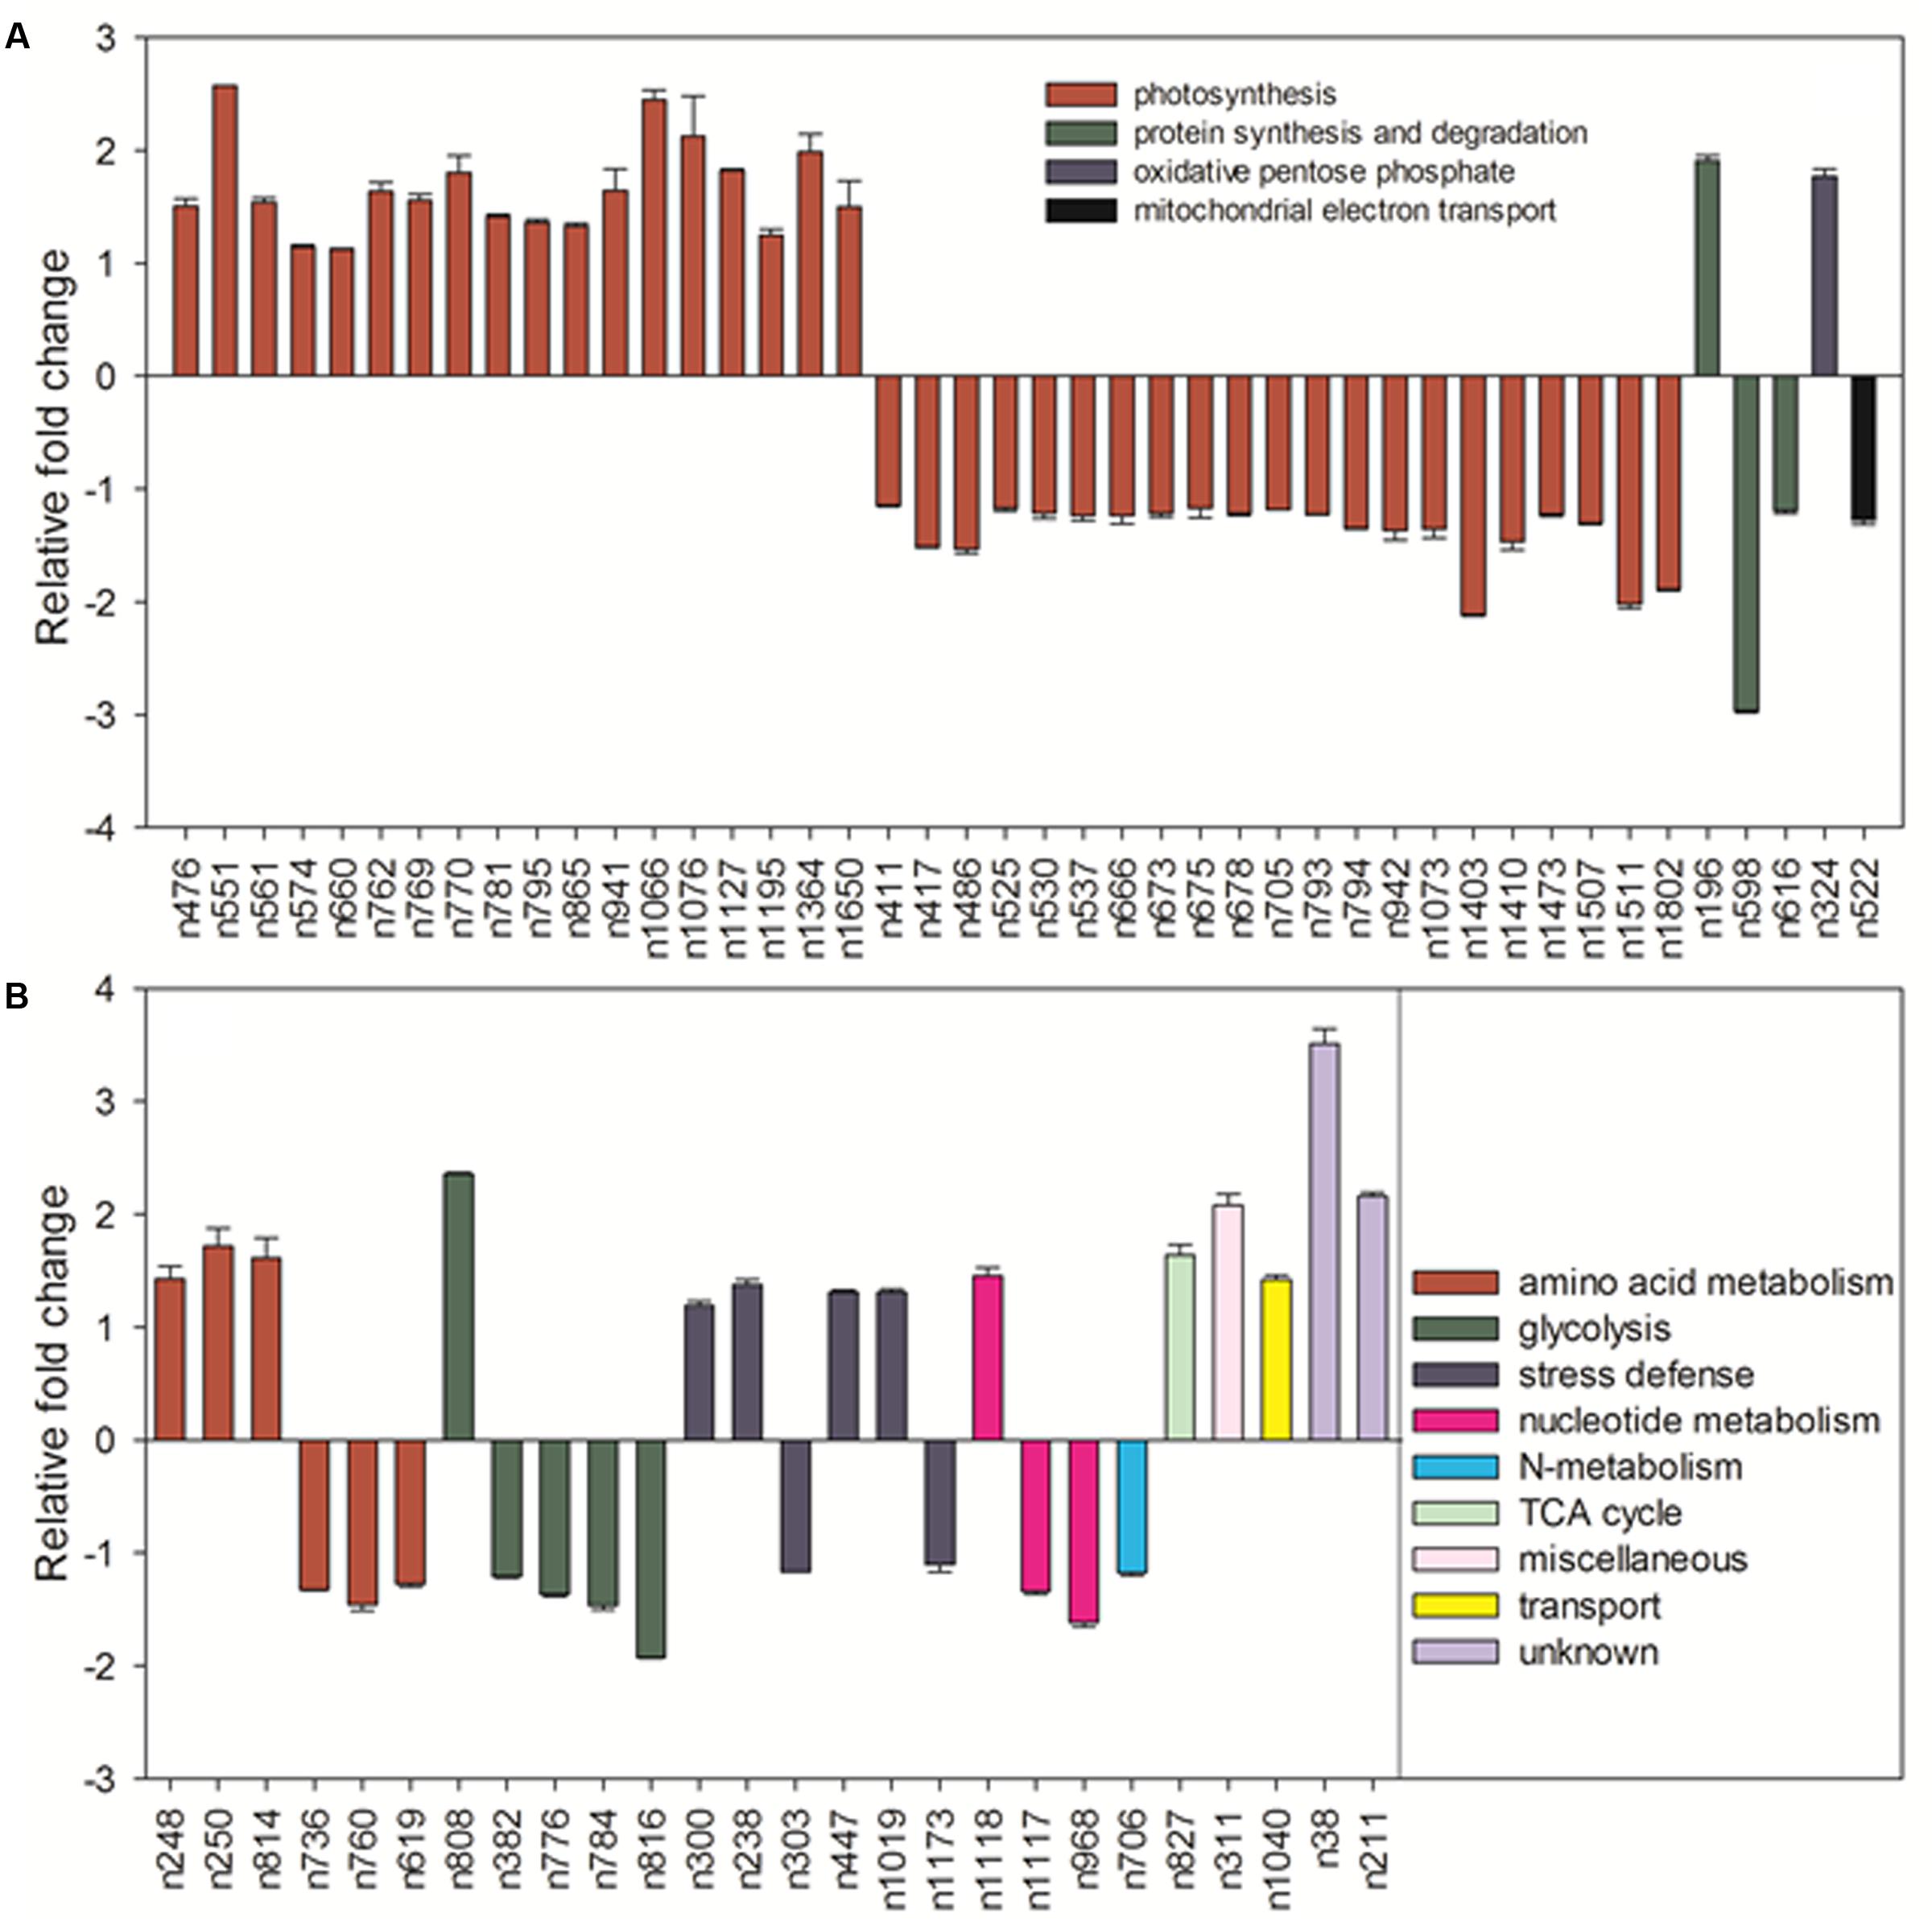
FIGURE 14. Comparison of protein abundance caused by elevated CO2 (800 μmol⋅mol-1) with ambient CO2 (400 μmol⋅mol-1) under normal temperature control (30°C). Charts are organized by the functional category of proteins involved in photosynthesis, protein synthesis and degradation, oxidative pentose phosphate and mitochondrial electron transport as shown in (A) as well as amino acid metabolism, glycolysis, stress defense, nucleotide metabolism, N-metabolism, TCA cycle, miscellaneous, transport and unknown proteins as shown in (B). The values of the mean ± SE represent the relative expression fold change of proteins in response to elevated CO2 under normal temperature. Labels with ‘n’ in X-axle were same as Table 2.
Among proteins associated with the function of protein synthesis and degradation, cytokinin inducible protease (CLPC, n196) had a 1.9-fold up-regulation and the other two [(elongation factor, EF), n598 and n616] with 1.2- to 3.0-fold down-regulation compared with ambient CO2 under normal temperature. Transketolase (n324) involved in oxidative pentose phosphate showed a 1.8-fold increase in response to elevated CO2 (Figure 14A). Proteins involved in amino acid metabolism exhibited increases in methionine synthase protein (MS, n248, n250) by 1.4- to 1.7-fold and cysteine synthase C1 (CSase, n814) by 1.6-fold as well as decreases in aspartate aminotransferase (ASP, n736, n760) by 1.3- to 1.5-fold and S-adenosylmethionine synthase (SAMS, n619) by 1.3-fold in plants grown at elevated CO2 compared with ambient CO2. GAPDH associated with glycolysis were all down-regulated by 1.4- to 1.9-fold (n382, n776, n784) under elevated CO2 except n808, which was increased by 2.4-fold under elevated CO2 concentration. There were six proteins associating with stress defense of which four proteins [Heat shock protein (Hsp) 90, n238; Hsp 70, n300; Catalase, n447; Ascorbate peroxidase, n1019] were up-regulated by 1.2- to 1.4-fold and tow proteins (Hsp 70, n303; 2-cys peroxiredoxin BAS1, n1173) were down-regulated by 1.1- to 1.2-fold under elevated CO2 concentration (Figure 14B).
Under heat stress, elevated CO2-regulated proteins were classified the into following functional categories: photosynthesis (52.8%), TCA cycle (11.3%), stress defense (9.4%), glycolysis (7.5%), amino acid metabolism (5.7%), nucleotide metabolism (3.8%), metal handling (1.9%), major CHO metabolism (1.9%), protein synthesis (1.9%), cell cycle (1.9%) and transport (1.9%) (Figure 13B). Proteins associated with photosynthesis were mainly up-regulated by elevated CO2 under heat stress, including CPN60A (h712) by 1.2-fold, CPN60B (h730, h736) by 1.2- to 1.3-fold, ATP synthase subunit beta (ATPB, n826) by 1.4-fold, RBCL (h843) by 1.5-fold, PGK, (h1067) by 1.3-fold, GAPDH (h1150, h1162, h1162, h1192) by 1.3-fold, SBPase (h1154, h1157) by 1.3-fold, ATPC (h1176) by 1.3-fold, FBA (h1211, h1233) by 1.3- to 1.5-fold, OEE (h1398) by 2.1-fold, LHC (h1655) by 1.6-fold, PGR (h1900, h1930) by 1.2- to 1.7-fold, PsaD (h1905) by 2.5-fold, photosystem I reaction center subunit N (PsaN, h2563) by 1.5-fold (Figure 15A). One protein associated with protein synthesis was upregulated by elevated CO2 under heat stress (Figure 15A). All proteins involved in amino acid metabolism and nucleotide metabolism were up-regulated by elevated CO2 under heat stress, including MS (1.6-fold), SAMS (1.5-fold), CSase (1.4-fold), pyrophosphorylase 6 (PPa6, 1.7-fold), adenylate kinase (ADK, 1.5-fold). Most TCA cycle related proteins [(Malic enzyme, ME), h716 and h724] by 1.4- to 1.5-fold; [(Malate dehydrogenase, MDH), h1237, h1242 and h1258] by 1.2- to 1.5-fold)] were up-regulated by elevated CO2 compared with ambient CO2 during heat stress (Figure 15B).
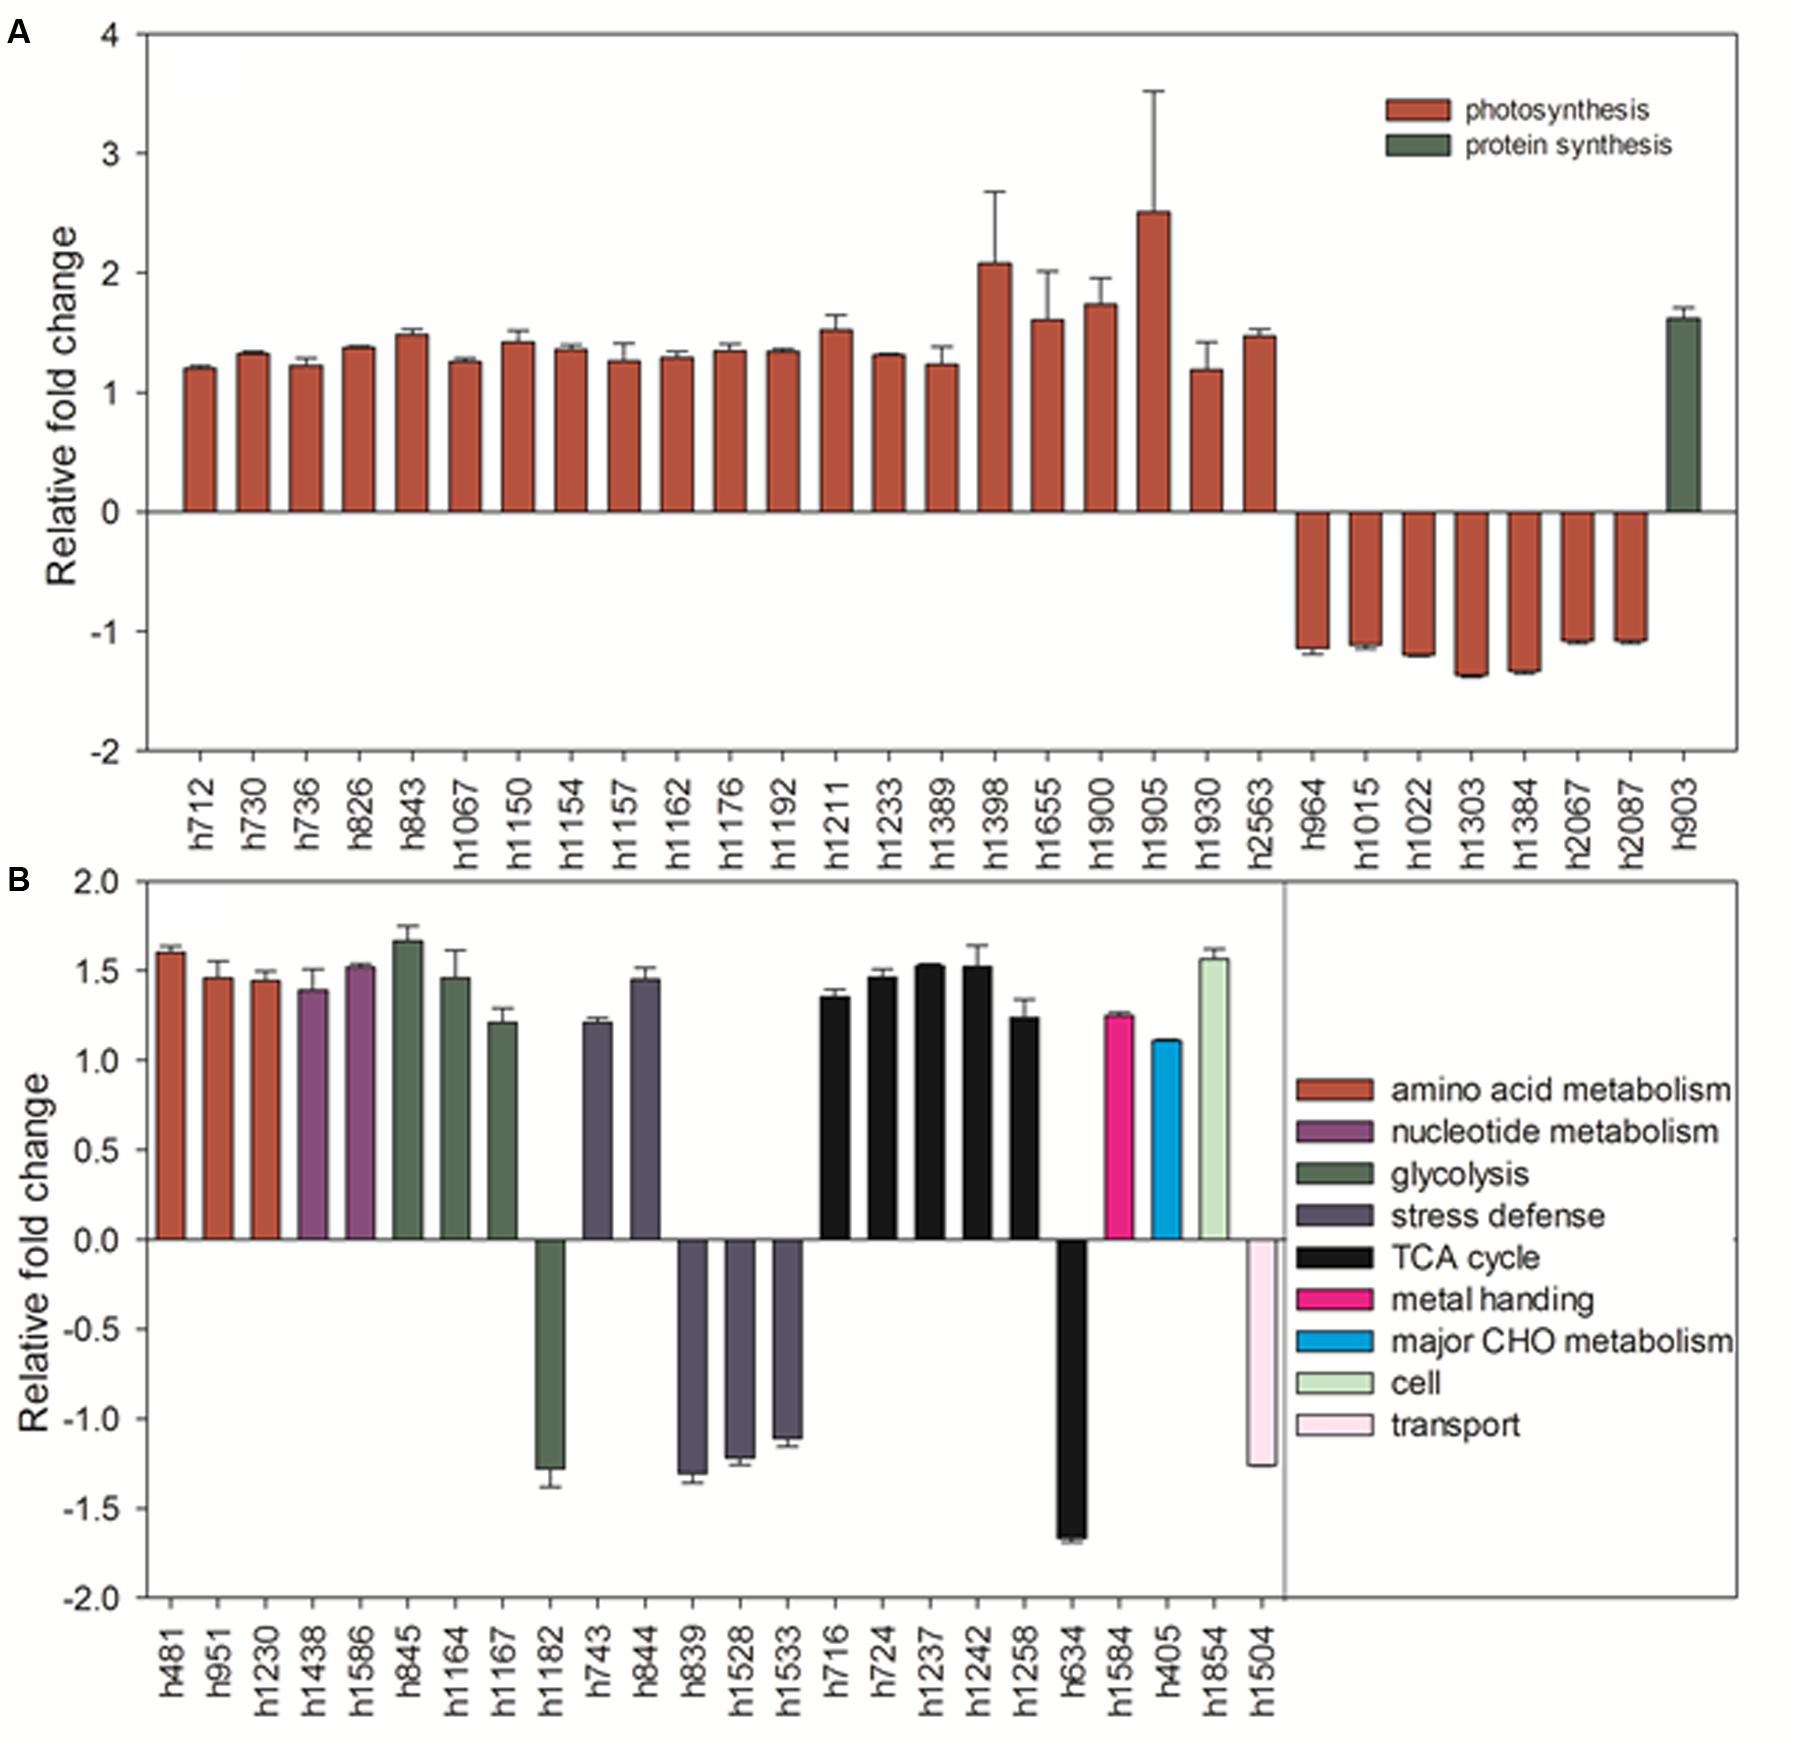
FIGURE 15. Comparison of protein abundance caused by elevated CO2 (800 μmol⋅mol-1) with ambient CO2 (400 μmol⋅mol-1) under heat stress (45°C). Charts are organized by the functional category of proteins involved in photosynthesis and protein synthesis as shown in (A) as well as amino acid metabolism, glycolysis, stress defense, TCA cycle, metal handing, major CHO metabolism, cell and transport as shown in (B). The values of the mean ± SE represent the relative expression fold change of proteins in response to elevated CO2 under heat stress. Labels with ‘h’ in X-axle were same as Table 2.
Discussion
Previous studies have shown positive effects of elevated CO2 on plant growth of C4 species under optimal temperature conditions (Huang and Xu, 2015). In this study, elevated CO2 significantly improved physiological activities of C4 bermudagrass under heat stress or mitigated heat stress damages, as manifested by physiological indexes, including higher leaf Pn, Fv/Fm and Chl. The positive physiological effects were associated with changes in various metabolic pathways regulated by elevated CO2. Metabolic and proteomic analysis in this study indicated that the underlying mechanisms of elevated CO2-mitigation of heat stress were mainly related to photosynthesis, respiration (glycolysis and TCA cycle), amino acid metabolism, and GABA shunt, and some of the metabolic factors regulated by elevated CO2 in the C4 grass species, bermudagrass, in this study are in common and some are different from those previously found in C3 grass species (Yu et al., 2014; Burgess and Huang, 2016). Due to the large number of metabolites and the complexity of metabolic pathways involved in CO2 effects, the following sections focused on the discussion of unique or different metabolic pathways found in bermudagrass in our study from those findings previously reported in other C3 plant species.
Proteins and Metabolites in Photosynthesis Regulated by Elevated CO2 under Heat Stress
In our present study, 67 out of 123 proteins (54.5%) associated with photosynthetic pathways, including proteins involved in electron transport chain and Calvin cycle, were responsive to elevated CO2 concentration under normal and high temperatures, as shown by the decrease or increase in their abundance (Figure 16). Under heat stress, the majority of proteins involved in photosynthesis exhibited accumulation in response to elevated CO2 concentration, such as ATP synthase subunit (h826, h1176), photosystem I reaction center subunit [(PsaD, h1905) and (PsaN, h2563)] in light reactions of photosynthesis, and fructose-bisphosphate aldolase (FBA, h781, h1211, h1233), phosphoglycerate kinase (PGK, h1067) and sedoheptulose-1,7-bisphosphatase (SBPase, h1154, h1157) in Calvin cycle (Figure 15). FBA is a primary enzyme involved in the sixth reaction of Calvin cycle to convert fructose 1,6-bisphosphate into glyceraldehyde-3-phosphate (G3P) and dihydroxyacetone phosphate as well as ATP (Abbasi and Komatsu, 2004). FBA content at the level of protein significantly increased under elevated CO2 in C3 tall fescue under heat stress (Yu et al., 2014) and creeping bentgrass (Agrostis stolonifera) under both well-water and drought stress (Burgess and Huang, 2016). SBPase functions as a bisphosphatase enzyme catalyzing sedoheptulose 1,7-bisphosphate dephosphorylation to sedoheptulose-7-phosphate during the regeneration phase of Calvin cycle (Raines et al., 1999). Overexpression of SBPase in C3 tobacco (Nicotiana tabacum) had higher photosynthesis at elevated CO2 compared with that at ambient CO2 under field conditions (Rosenthal et al., 2011). The benefits of SBPase on the stimulation of photosynthesis depended on light intensity (Lefebvre et al., 2005; Rosenthal et al., 2011). Therefore, our study and another case in creeping bentgrass, conducted in light saturated growth chambers, the abundance of SBPase was enhanced by elevated CO2 under abiotic stresses (Burgess and Huang, 2016). FBA is a primary enzyme involved in the sixth reaction of Calvin cycle to convert fructose 1,6-bisphosphate into glyceraldehyde-3-phosphate (G3P), dihydroxyacetone phosphate and ATP (Abbasi and Komatsu, 2004). In addition, FBA could directly affect ribulose-1,5-bisphosphate (RuBP) regeneration which actions as substrate of carbon fixation (Taiz and Zeiger, 2010). FBA content at the level of protein showed the grater accumulation in elevated CO2 in C3 tall fescue under heat stress (Yu et al., 2014) and creeping bentgrass (Agrostis stolonifera) under both well-water and drought stress (Burgess and Huang, 2016). PGK is a major enzyme catalyzing the phosphorylation of 3-phosphoglycerate to produce 1, 3-bisphosphoglycerate and ADP which is one of vital steps regenerating RuBP during Calvin cycle (Bernstein et al., 1997). The regulation of FBA and PGK induced by elevated CO2 indicated that elevated CO2 availability in atmosphere could be helpful for sustaining ATP supply and RuBP regeneration for plant growth under heat stress. ATP synthase is a critical enzyme for creating energy storage molecule ATP. Under high CO2 availability, ATP synthase was found to decline in wheat grain (Högy et al., 2009). To our knowledge, our case is the first report on the abundance of ATP synthase and PGK in response to elevated CO2 were found in C4 plant species grown under heat stress. Our previous study in C3 plant species found differential responses of photosynthesis-related proteins to elevated CO2 different from found in bermudagrass in our study. In tall fescue, the abundance of ATP synthase subunit and PGK did not change in response to elevated CO2 under heat stress (Yu et al., 2014). The increase in abundance and activity of a single or some enzyme(s) during photosynthesis could enhance carbon assimilation (Rosenthal et al., 2011). Taken together, the enhanced accumulation of proteins involved in photosynthesis by elevated CO2 under heat stress in bermudagrass suggested that elevated CO2 could help to maintain photosynthesis to withstand the adverse environments as various proteins are involved in the light harvesting, electron transport, and carbohydrate assimilation processes of photosynthesis.
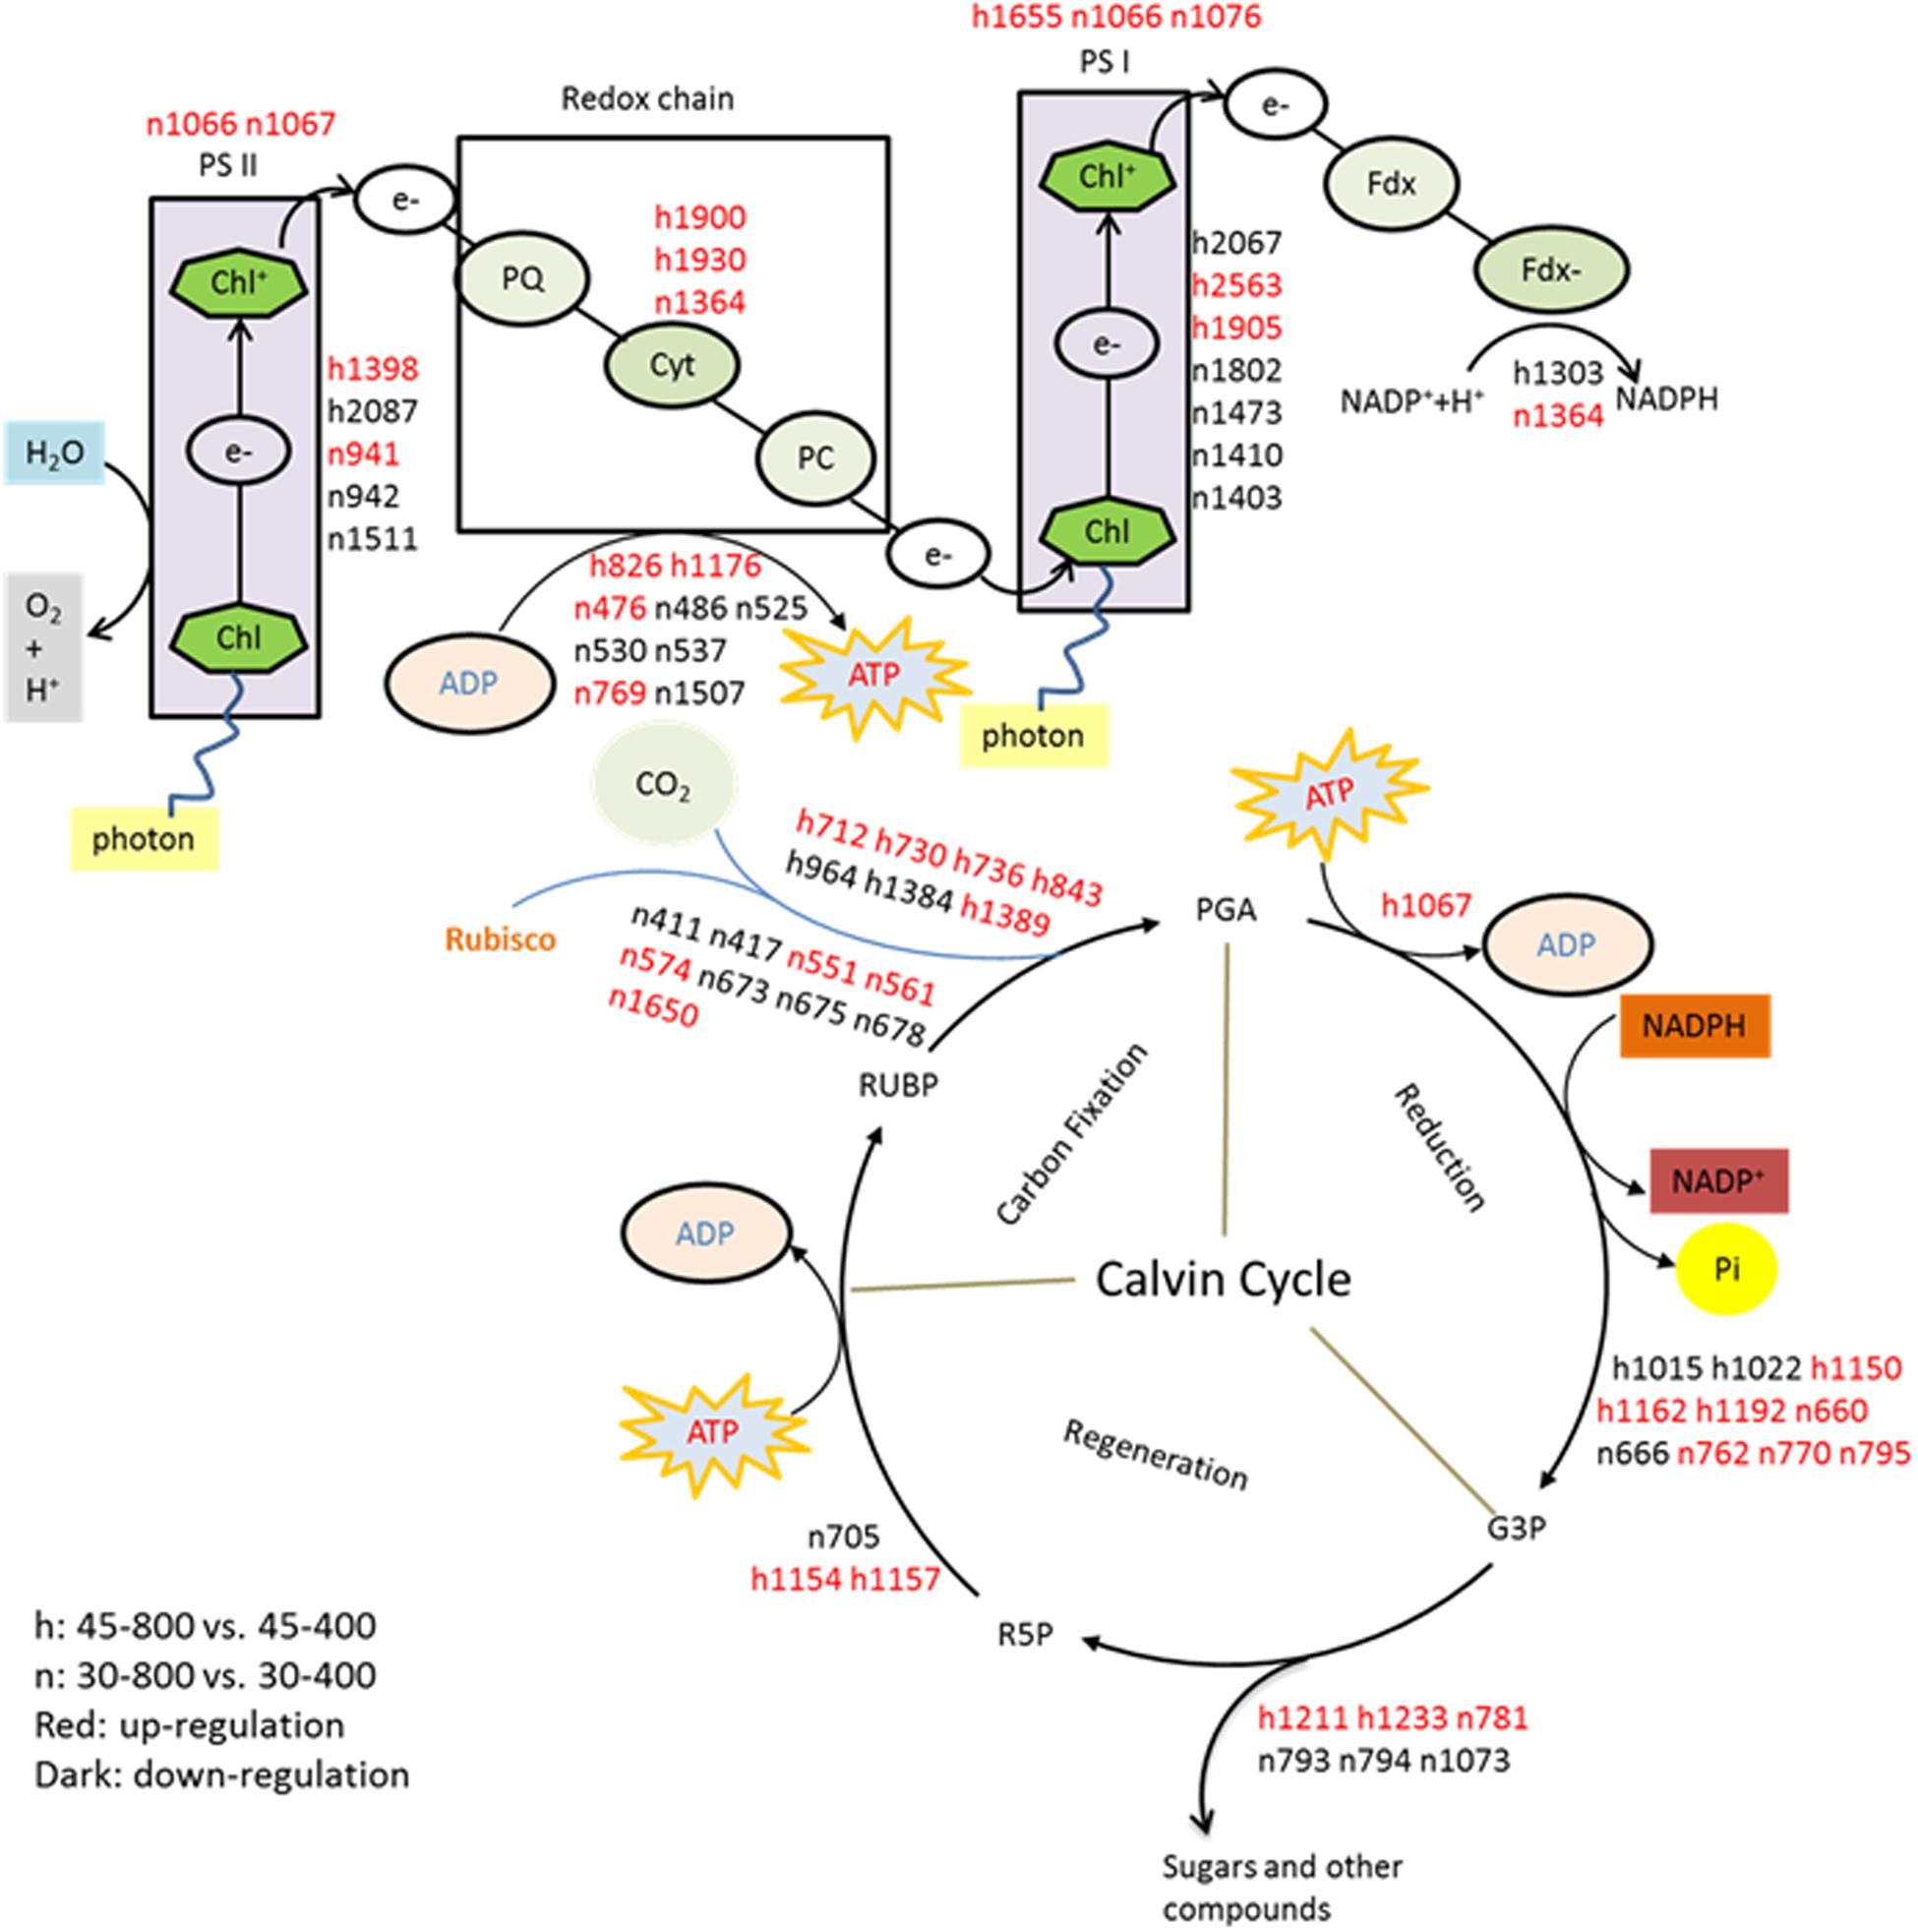
FIGURE 16. The metabolic pathways associated with differentially expressed proteins. The treatments symbols are 30 and 45 for normal temperature control and heat stress and 400 and 800 for ambient CO2 and elevated CO2 concentrations, respectively. Labels with ‘n’ or ‘h’ were same as Table 2. RuBP, Ribulose 1, 5-bisphosphate; R5P, Ribulose 5-phosphate; Rubisco, Ribulose 1, 5-bisphosphate carboxylase/oxygenase; PGA, 3-phosphoglyceric acid; G3P, Glyceraldehyde 3-phosphate; PC, Plastocyanin; PQ, Plastoquinone; Fd, Ferredoxin; Cyt, Cytochrome complex.
Other proteins related to photosynthesis such as GAPDH, OEE, PGR exhibited the enhanced expression in plants grown at elevated CO2 concentration under both temperatures in our study. GAPDH could convert G3P to D-glycerate 1,3-bisphosphate as well as mediating the formation of NADH and ATP (Tristan et al., 2011). It has multiple functions, such as two chloroplastic forms playing photosynthetic function locating in chloroplast and one cytosolic form participating in glycolysis in higher plants (Sparla et al., 2005; Tarze et al., 2007). In chloroplasts, GAPDH catalyzes a reaction of NADPH-consuming which is regulated by light utilizing thioredoxins and metabolites during Calvin cycle (Sparla et al., 2005). Various stresses caused the decline in chloroplastic GAPDH whereas stress-tolerant species exhibited higher GAPDH abundance than stress-sensitive plants, such as creeping bentgrass under heat stress (Xu and Huang, 2010a; Merewitz et al., 2011), salinity stress (Xu and Huang, 2010b) and drought stress (Burgess and Huang, 2016). Plants with lower GAPDH abundance were generally associated with decreased photosynthetic capacity resulted from reduced RuBP regeneration rate, followed with the decline in accumulation of photosynthetic products (Price et al., 1995; Burgess and Huang, 2016). However, elevated CO2 had no effects on chloroplastic GAPDH abundance under heat stressed condition but caused significant decrease under non-stressed control plants (Yu et al., 2014). Overall, our study suggested that enhanced abundance of photosynthesis-related proteins could contribute to the improved photosynthetic activities by elevated CO2, particularly under heat stress, which could be reflected with improved Pn and increased content of sugars, such as fructose, glucose, sucrose, erythrose, and glucopyranose.
Proteins and Metabolites in Respiration Regulated by Elevated CO2 under Heat Stress
It has been widely known that glycolysis and TCA cycle are vital pathways for energy supply, amino acid synthesis and various other biological processes in plants (Fernie et al., 2004; Ma et al., 2016). As substrate of photosynthesis for carboxylation, plants grown at elevated CO2 tended to accumulate the larger amount of non-structural carbohydrates (Yu et al., 2012a; Song et al., 2014). Most monosaccharides (glucose, fructose, galactose, etc.) as substrate or intermediates play vital roles during glycolysis. Glycolysis pathway could convert glucose into pyruvate via a series of intermediate metabolites and cytosolic GAPDH is one of essential enzymes catalyzing the sixth step of respiratory glycolysis to convert G3P to 1, 3-bisphosphateglycerate (1, 3-BPG) which is one of the most important reactions during the glycolytic pathway (Mijeong et al., 2000). The increase of pyruvic acid (pyruvate) as the product of glycolysis, followed by the enhanced content of valine, isoleucine and alanine, was partly due to elevated CO2-caused accumulation of glucose under heat stress in our study, since those metabolites are all derived from glucose. In C3 tall fescue, we also observed the significant increases in valine and alanine but not for isoleucine resulted from elevated CO2 under heat stress (Yu et al., 2012a). During the pathway of glycolysis, the abundance of GAPDH in cytosol (n776, n784, n816 except n808) and phosphoglycerate mutase (PGAM, n382) exhibited the down-regulation in response to elevated CO2 rather than ambient CO2 under normal temperature, while under heat stressed conditions elevated CO2 caused up-regulation in GAPDH (h845, h1164, h1167 except h1182) in bermudagrass (Figure 16). GAPDH might serve as a provider of additional energy for plant growth and development under stressed conditions and stress tolerance could be enhanced by improved abundance of GAPDH to cope with environmental stresses (Mijeong et al., 2000; Bertrand et al., 2007). In C3 plants, no consistent changes were found due to variations in plant species. For example, in tall fescue and creeping bentgrass, the abundance of cytosolic GAPDH exhibited either no changes or decrease under elevated CO2 and heat stressed condition (Yu et al., 2014; Burgess and Huang, 2016). Kappachery et al. (2015) found that GAPDH gene-silenced lines showed more sensitive traits to drought stress than non-silenced lines in potato (Solanum tuberosum). By contrast, the higher shoot length and weight were detected in GAPDH overexpression transgenic plants compared with wild-type plants (Kappachery et al., 2015). In the level of transcription in potato, cytosolic GAPDH RNA accumulation was also increased under biological stress (Laxalt et al., 1996). Therefore, in our study, the higher abundance of GAPDH caused by elevated CO2 was beneficial for energy supply to support plant growth under heat stress.
Malate dehydrogenase (MDH) acts as an enzyme to catalyze the oxidation of malate to oxaloacetate via the reduction of NAD+ to NADH in mitochondrial matrix during TCA cycle (Musrati et al., 1998). Environmental stresses including drought (Burgess and Huang, 2016), heat (Xu and Huang, 2010a), salinity (Xu et al., 2010) and Al-stress (Ramírez-Benítez et al., 2008) have been shown to decrease the level of MDH in various plant species. However, limited studies about MDH were found in plants grown at elevated CO2 concentrations, especially under stressed conditions (Burgess and Huang, 2016). In this study, elevated CO2-responsive MDH (n827, h1237, h1242, h1258) involved in TCA cycle exhibited up-regulated expression regardless of temperatures, suggesting that CO2 inhibited the heat-induced reduction in MDH to catalyze the enhanced malate (malic acid) to oxaloacetate (oxaloacetic acid) during malate metabolism.
Amino Acid Metabolism and GABA Shunt Regulated by Elevated CO2 under Heat Stress
In addition to function in TCA cycle, MDH also participates in the process of amino acid synthesis due to the relations among malate, oxaloacetate and aspartate (Musrati et al., 1998; Wen et al., 2015). Several amino acids including aspartate (aspartic acid), methionine, threonine, isoleucine, lysine derived from oxaloacetate and aspartate is the precursor of methionine, threonine, isoleucine and lysine (Muehlbauer et al., 1994). Along with the significant increase in malic acid and aspartic acid, the content of threonine, isoleucine and lysine were stimulated by elevated CO2 during heat stress. Furthermore, the content of alanine, valine and serine were also enhanced by elevated CO2 compared with ambient CO2 under heat stress. Alanine, valine and serine are used for synthesis of several proteins and associated with many metabolic processes (Bourguignon et al., 1999). The stimulation of elevated CO2 concentration on the content of alanine, valine and serine was found in other species under abiotic stresses, as previously reported in C3 grass species under heat stress (Yu et al., 2012a) and tree seedlings under drought stress (Tschaplinski et al., 1995). The increase in synthesis of both alanine and valine in present study is directly associated with the higher content of pyruvate (pyruvate acid) which is the final product of glycolysis (Schulzesiebert et al., 1984). Superior stress tolerance has been reported with the higher content of alanine, valine and serine as well as other amino acids such as GABA, glutamic acid, proline and 5-oxoproline involved in the GABA shunt pathway in plant species, including perennial grasses (Merewitz et al., 2012; Xu et al., 2013; Shi et al., 2014; Li et al., 2016a,b). The GABA shunt was considered to be a part of the TCA cycle during respiration besides its central role in primary carbon and nitrogen metabolism (Fait et al., 2008). In tall fescue, the content of GABA was significantly decreased by elevated CO2 under high temperature (Yu et al., 2014). While, in bermudagrass of this case, GABA and glutamic acid exhibited the opposite response to elevated CO2 under heat stress. Increased GABA caused the enhanced content of alanine and pyruvate which was turned into TCA cycle and proline metabolism. The content of all amino acids except arginine during GABA shunt was increased by elevated CO2 under heat stress suggesting a predominant role of elevated CO2 in carbon and nitrogen metabolism in C4 bermudagrass.
Proteins including methionine synthase (MS), cysteine synthase (CSase) and S-adenosylmethionine synthase (SAMS) associated with amino acid metabolism were up-regulated by 1.4- to 1.6-fold by elevated CO2 under heat stress. MS and SAMS serve as regulators in the synthesis and degradative pathways of various amino acids (Bohnert and Jensen, 1996). It was detected by the same proteomic analysis that many proteins involved in amino acid metabolism accumulated more or degraded less in stress-tolerant plants, such as MS and SAMS (Merewitz et al., 2011). CSase functions in the final strep in cysteine synthesis in plants. Plants with overexpressing CSase gene displayed high tolerance to toxic environmental pollutants, such as sulfur dioxide and sulfite (Noji et al., 2001), cadmium toxicity (Harada et al., 2001) in tobacco and aluminum toxicity in rice (Yang et al., 2007). The accumulation of many amino acids as well as proteins involved in amino acid metabolism in this study could contribute to elevated CO2-improved heat tolerance.
In summary, elevated CO2 concentration suppressed heat-induced damages in bermudagrass, as shown by the increased Pn, Chl and Fv/Fm. The improvement of heat tolerance under elevated CO2 could be associated with some important metabolic pathways during which proteins and metabolites were up-regulated, including proteins, sugars and/or amino acids involved in light reaction (ATP synthase subunit and photosystem I reaction center subunit) and carbon fixation of photosynthesis (GAPDH, FBA, PGK, SBPase and sugars), glycolysis (GAPDH, glucose, fructose and galactose) and TCA cycle (pyruvic acid, malic acid and MDH) of respiration, amino acid metabolism (aspartic acid, methionine, threonine, isoleucine, lysine, valine, alanine and isoleucine) as well as the GABA shunt (GABA, glutamic acid, alanine, proline and 5-oxoproline). The molecular factors and mechanisms underlying the metabolic changes caused by elevated CO2 during plant responses to heat stress require further investigation.
Author Contributions
JY and BH designed the experiments and wrote the manuscript. JY and RL conducted the experiments. NF helped with the sample analysis. ZY arranged the experiments and did the data analysis.
Conflict of Interest Statement
The authors declare that the research was conducted in the absence of any commercial or financial relationships that could be construed as a potential conflict of interest.
Acknowledgments
This research was supported by the National Natural Science Foundation of China (31301799) and the Fundamental Research Funds for the Central Universities (KYZ201673).
Footnotes
References
Abbasi, F. M., and Komatsu, S. (2004). A proteomic approach to analyze salt-responsive proteins in rice leaf sheath. Proteomics 4, 2072–2081. doi: 10.1002/pmic.200300741
Abebe, A., Pathak, H., Singh, S. D., Bhatia, A., Harit, R. C., and Kumar, V. (2016). Growth, yield and quality of maize with elevated atmospheric carbon dioxide and temperature in north-west India. Agric. Ecosyst. Environ. 218, 66–72. doi: 10.1016/j.agee.2015.11.014
Alonso, A., Pérez, P. A., and Martinez-Carrasco, R. (2009). Growth in elevated CO2 enhances temperature response of photosynthesis in wheat. Physiol. Plant. 135, 109–120. doi: 10.1111/j.1399-3054.2008.01177.x
Arnon, D. I. (1949). Copper enzymes in isolated chloroplasts. Polyphenoloxidase in Beta vulgaris. Plant Physiol. 24, 1–15. doi: 10.1104/pp.24.1.1
Bencze, S., Veisz, O., and Bedo, Z. (2005). Effect of elevated CO2 and high temperature on the photosynthesis and yield of wheat. Cereal Res. Commun. 33, 385–388. doi: 10.1556/CRC.33.2005.1.95
Bernstein, B. E., Michels, P. A., and Hol, W. G. (1997). Synergistic effects of substrate-induced conformational changes in phosphoglycerate kinase activation. Nature 385, 275–278. doi: 10.1038/385275a0
Bertrand, A., Prévost, D., Bigras, F. J., and Castonguay, Y. (2007). Elevated atmospheric CO2 and strain of rhizobium alter freezing tolerance and cold-induced molecular changes in alfalfa (Medicago sativa). Ann. Bot. 99, 275–284. doi: 10.1093/aob/mcl254
Bevan, M., Bancroft, I., Bent, E., Love, K., Goodman, H., Dean, C., et al. (1998). Analysis of 1.9 Mb of contiguous sequence from chromosome 4 of Arabidopsis thaliana. Nature 391, 485–488. doi: 10.1038/35140
Bohnert, H. J., and Jensen, R. G. (1996). Strategies for engineering water-stress tolerance in plants. Trends Biotechnol. 14, 89–97. doi: 10.1016/0167-7799(96)80929-2
Bourguignon, J., Rebeille, F., and Douce, R. (1999). “Serine and glycine metabolism in higher plants,” in Plant Amino Acids, ed. B. K. Singh (New York, NY: Marcel Dekker), 111–146.
Bradford, M. M. (1976). A rapid and sensitive method for the quantitation of microgram quantities of protein utilizing the principle of protein-dye binding. Anal. Biochem. 72, 248–254. doi: 10.1016/0003-2697(76)90527-3
Burgess, P., and Huang, B. (2014). Root protein metabolism in association with improved root growth and drought tolerance by elevated carbon dioxide in creeping bentgrass. Field Crops Res. 165, 80–91. doi: 10.1016/j.fcr.2014.05.003
Burgess, P., and Huang, B. (2016). Leaf protein abundance associated with improved drought tolerance by elevated carbon dioxide in creeping bentgrass. J. Am. Soc. Hortic. Sci. 141, 85–96.
Fait, A., Fromm, H., Walter, D., Galili, G., and Fernie, A. R. (2008). Highway or byway: the metabolic role of the GABA shunt in plants. Trends Plant Sci. 13, 14–19. doi: 10.1016/j.tplants.2007.10.005
Fernie, A. R., Carrari, F., and Sweetlove, L. J. (2004). Respiratory metabolism: glycolysis, the TCA cycle and mitochondrial electron transport. Curr. Opin. Plant Biol. 7, 254–261. doi: 10.1016/j.pbi.2004.03.007
Figueiredo, N., Carranca, C., Trindade, H., Pereira, J., Goufo, P., Coutinho, J., et al. (2015). Elevated carbon dioxide and temperature effects on rice yield, leaf greenness, and phenological stages duration. Paddy Water Environ. 13, 313–324. doi: 10.1007/s10333-014-0447-x
Fukayama, H., Fukuda, T., Masumoto, C., Taniguchi, Y., Sakai, H., Cheng, W., et al. (2009). Rice plant response to long term CO2 enrichment: gene expression profiling. Plant Sci. 177, 203–210. doi: 10.1016/j.plantsci.2009.05.014
Hamerlynck, E. P., Huxman, T. E., Loik, M. E., and Smith, S. D. (2000). Effects of extreme high temperature, drought and elevated CO2 on photosynthesis of the Mojave Desert evergreen shrub, Larrea tridentata. Plant Ecol. 148, 183–193. doi: 10.1023/A:1009896111405
Harada, E., Choi, Y. E., Tsuchisaka, A., Obata, H., and Sano, H. (2001). Transgenic tobacco plants expressing a rice cysteine synthase gene are tolerant to toxic levels of cadmium. J. Plant Physiol. 158, 655–661. doi: 10.1078/0176-1617-00314
Hoagland, D. R., and Arnon, D. I. (1950). The water-culture method for growing plans without soil. Calif. Agric. Exp. Stn. Circ. 347, 1–32.
Högy, P., Zörb, C., Langenkämper, G., Betsche, T., and Fangmeier, A. (2009). Atmospheric CO2 enrichment changes the wheat grain proteome. J. Cereal Sci. 50, 248–254. doi: 10.1016/j.jcs.2009.06.002
Huang, B., and Xu, Y. (2015). Cellular and molecular mechanisms for elevated CO2-regulation of plant growth and stress adaptation. Crop Sci. 55, 1405. doi: 10.2135/cropsci2014.07.0508
Intergovernmental Panel on Climate Change [IPCC] (2007). Climate Change: Fourth Assessment Report. London: Cambridge University Press.
Kappachery, S., Baniekal-Hiremath, G., Yu, J. W., and Park, S. W. (2015). Effect of over-and under-expression of glyceraldehyde 3-phosphate dehydrogenase on tolerance of plants to water-deficit stress. Plant Cell Tissue Organ Cult. 121, 97–107. doi: 10.1007/s11240-014-0684-0
Kirkham, M. B. (2011). Elevated Carbon Dioxide: Impacts on Soil and Plant Water Relations. Boca Raton, FL: CRC Press. doi: 10.1201/b10812
Lai, S. K., Zhuang, S. T., Wu, Y. Z., Wang, Y. X., Zhu, J. G., Yang, L. X., et al. (2015). Impact of elevated atmospheric CO2 concentration and temperature on growth and development of super rice. Am. J. Roentgenol. 34, 1253–1262.
Laxalt, A. M., Cassia, R. O., Sanllorenti, P. M., Madrid, E. A., Andreu, A. B., Daleo, G. R., et al. (1996). Accumulation of cytosolic glyceraldehyde-3-phosphate dehydrogenase RNA under biological stress conditions and elicitor treatments in potato. Plant Mol. Biol. 30, 961–972. doi: 10.1007/BF00020807
Lefebvre, S., Lawson, T., Zakhleniuk, O. V., Lloyd, J. C., Raines, C. A., and Fryer, M. (2005). Increased sedoheptulose-1,7-bisphosphatase activity in transgenic tobacco plants stimulates photosynthesis and growth from an early stage in development. Plant Physiol. 138, 451–460. doi: 10.1104/pp.104.055046
Li, Z., Yu, J., Peng, Y., and Huang, B. (2016a). Metabolic pathways regulated by γ-aminobutyric acid (GABA) contributing to heat tolerance in creeping bentgrass (Agrostis stolonifera). Sci. Rep. 6:30338. doi: 10.1038/srep30338
Li, Z., Yu, J., Peng, Y., and Huang, B. (2016b). Metabolic pathways regulated by abscisic acid, salicylic acid, and γ-aminobutyric acid in association with improved drought tolerance in creeping bentgrass (Agrostis stolonifera). Physiol. Plant. 159, 42–58. doi: 10.1111/ppl.12483
Ma, X., Xu, Q., Meyer, W. A., and Huang, B. (2016). Hormone regulation of rhizome development in tall fescue (Festuca arundinacea) associated with proteomic changes controlling respiratory and amino acid metabolism. Ann. Bot. 118, 481–494. doi: 10.1093/aob/mcw120
Merewitz, E. B., Du, H., Yu, W., Liu, Y., Gianfagna, T., and Huang, B. (2012). Elevated cytokinin content in ipt transgenic creeping bentgrass promotes drought tolerance through regulating metabolite accumulation. J. Exp. Bot. 63, 1315–1328. doi: 10.1093/jxb/err372
Merewitz, E. B., Gianfagna, T., and Huang, B. (2011). Protein accumulation in leaves and roots associated with improved drought tolerance in creeping bentgrass expressing an ipt gene for cytokinin synthesis. J. Exp. Bot. 62, 5311–5333. doi: 10.1093/jxb/err166
Mijeong, J., Soochul, P., Hawkbin, K., and Myungok, B. (2000). Isolation and characterization of the gene encoding glyceraldehyde-3-phosphate dehydrogenase. Biochem. Biophys. Res. Commun. 278, 192–196. doi: 10.1006/bbrc.2000.3732
Morgan, J. A., Lecain, D. R., Pendall, E., Blumenthal, D. M., Kimball, B. A., Carrillo, Y., et al. (2011). C4 grasses prosper as carbon dioxide eliminates desiccation in warmed semi-arid grassland. Nature 476, 202–205. doi: 10.1038/nature10274
Muehlbauer, G. J., Gengenbach, B. G., and Somers, D. A. (1994). Genetic and amino-acid analysis of two maize threonine-overproducing, lysine-insensitive aspartate kinase mutants. Theor. Appl. Gen. 89, 767–774. doi: 10.1007/BF00223717
Musrati, R. A., Kollárová, M., Mernik, N., and Mikulásová, D. (1998). Malate dehydrogenase: distribution, function and properties. Gen. Physiol. Biophys. 17, 193–210.
Noji, M., Aono, M., and Saito, K. (2001). Cysteine synthase overexpression in tobacco confers tolerance to sulfur-containing environmental pollutants. Plant Physiol. 126, 973. doi: 10.1104/pp.126.3.973
Prasad, P. V. V., Boote, K. J., and Allen, L. H. Jr. (2006). Adverse high temperature effects on pollen viability, seed-set, seed yield and harvest index of grain-sorghum [Sorghum bicolor (L.) Moench] are more severe at elevated carbon dioxide due to higher tissue temperatures. Agric. For. Meteorol. 139, 237–251. doi: 10.1016/j.agrformet.2006.07.003
Prasad, P. V. V., Boote, K. J., Allen, L. H. Jr., and Thomas, J. M. G. (2002). Effects of elevated temperature and carbon dioxide on seed-set and yield of kidney bean (Phaseolus vulgaris L.). Glob. Change Biol. 8, 710–721. doi: 10.1046/j.1365-2486.2002.00508.x
Prasad, P. V. V., Boote, K. J., Allen, L. H., and Thomas, J. M. G. (2010). Super-optimal temperatures are detrimental to peanut (Arachis hypogaea L.) reproductive processes and yield at both ambient and elevated carbon dioxide. Glob. Change Biol. 9, 1775–1787. doi: 10.1046/j.1365-2486.2003.00708.x
Prasad, P. V. V., Boote, K. J., Jcv, V., and Lhjr, A. (2004). The carbohydrate metabolism enzymes sucrose-P synthase and ADG-pyrophosphorylase in phaseolus bean leaves are up-regulated at elevated growth carbon dioxide and temperature. Plant Sci. 166, 1565–1573. doi: 10.1016/j.plantsci.2004.02.009
Price, G. D., Evans, J. R., Von, C. S., Yu, J. W., and Badger, M. R. (1995). Specific reduction of chloroplast glyceraldehyde-3-phosphate dehydrogenase activity by antisense RNA reduces CO2 assimilation via a reduction in ribulose bisphosphate regeneration in transgenic tobacco plants. Planta 195, 369–378. doi: 10.1007/BF00202594
Pritchard, S. H. G., Rogers, H. O. H., Prior, S. A., and Peterson, C. T. M. (1999). Elevated CO2 and plant structure: a review. Glob. Change Biol. 5, 807–837. doi: 10.1046/j.1365-2486.1999.00268.x
Qaderi, M. M., Kurepin, L. V., and Reid, D. M. (2006). Growth and physiological responses of canola (Brassica napus) to three components of global climate change: temperature, carbon dioxide and drought. Physiol. Plant. 128, 710–721. doi: 10.1111/j.1399-3054.2006.00804.x
Qiu, Y., Su, M., Liu, Y., Chen, M., Gu, J., Zhang, J., et al. (2007). Application of ethyl chloroformate derivatization for gas chromatography-mass spectrometry based metabonomic profiling. Anal. Chim. Acta 583, 277–283. doi: 10.1016/j.aca.2006.10.025
Raines, C. A., Lloyd, J. C., and Dyer, T. A. (1999). New insights into the structure and function of sedoheptulose-1,7-bisphosphatase; an important but neglected Calvin cycle enzyme. J. Exp. Bot. 50, 1–8.
Ramírez-Benítez, J. E., Chee-González, L., and Hernandez-Sotomayor, S. M. T. (2008). Aluminium induces changes in organic acids metabolism in Coffea arabica suspension cells with differential Al-tolerance. J. Inorg. Biochem. 102, 1631–1637. doi: 10.1016/j.jinorgbio.2008.03.002
Read, J. J., and Morgan, J. A. (1996). Growth and partitioning in Pascopyrum smithii (C3) and Bouteloua gracilis (C4) as influenced by carbon dioxide and temperature. Ann. Bot. 77, 487–496. doi: 10.1006/anbo.1996.0059
Rizhsky, L., Liang, H., Shuman, J., Shulaev, V., Davletova, S., and Mittler, R. (2004). When defense pathways collide. The response of Arabidopsis to a combination of drought and heat stress. Plant Physiol. 134, 1683–1696. doi: 10.1104/pp.103.033431
Roessner, U., Wagner, C., Kopka, J., Trethewey, R. N., and Willmitzer, L. (2000). Simultaneous analysis of metabolites in potato tuber by gas chromatography-mass spectrometry. Plant J. 23, 131–142. doi: 10.1046/j.1365-313x.2000.00774.x
Rosenthal, D. M., Locke, A. M., Khozaei, M., Raines, C. A., Long, S. P., and Ort, D. R. (2011). Over-expressing the C3 photosynthesis cycle enzyme Sedoheptulose-1-7 Bisphosphatase improves photosynthetic carbon gain and yield under fully open air CO2 fumigation (FACE). BMC Plant Biol. 11:123. doi: 10.1186/1471-2229-11-123
Schulzesiebert, D., Heineke, D., Scharf, H., and Schultz, G. (1984). Pyruvate-derived amino acids in spinach chloroplasts 1. Plant Physiol. 76, 465–471. doi: 10.1104/pp.76.2.465
Shi, H., Jiang, C., Ye, T., Tan, D. X., Reiter, R. J., Zhang, H., et al. (2014). Comparative physiological, metabolomic, and transcriptomic analyses reveal mechanisms of improved abiotic stress resistance in bermudagrass [Cynodon dactylon (L). Pers.] by exogenous melatonin. J. Integr. Plant Biol. 66, 681–694. doi: 10.1093/jxb/eru373
Song, Y. L., Yu, J. J., and Huang, B. (2014). Elevated CO2-mitigation of high temperature stress associated with maintenance of positive carbon balance and carbohydrate accumulation in Kentucky bluegrass. PLOS ONE 9:e89725. doi: 10.1371/journal.pone.0089725
Sparla, F., Zaffagnini, M., Wedel, N., Scheibe, R., Pupillo, P., and Trost, P. (2005). Regulation of photosynthetic GAPDH dissected by mutants. Plant Physiol. 138, 2210–2219. doi: 10.1104/pp.105.062117
Sujatha, K. B., Uprety, D. C., Rao, D. N., Rao, P. R., and Dwivedi, N. (2008). Up-regulation of photosynthesis and sucrose-P synthase in rice under elevated carbon dioxide and temperature conditions. Plant Soil Environ. 54, 155–162.
Tanz, S. K., Castleden, I., Hooper, C. M., Vacher, M., Small, I., and Millar, H. A. (2013). SUBA3: a database for integrating experimentation and prediction to define the SUBcellular location of proteins in Arabidopsis. Nucleic Acids Res. 41, 1185–1191. doi: 10.1093/nar/gks1151
Tarze, A., Deniaud, A., Bras, M. L., Maillier, E., Molle, D., Larochette, N., et al. (2007). GAPDH, a novel regulator of the pro-apoptotic mitochondrial membrane permeabilization. Oncogene 26, 2606–2620. doi: 10.1038/sj.onc.1210074
Thimm, O., Bläsing, O., Gibon, Y., Nagel, A., Meyer, S., Krüger, P., et al. (2004). Mapman: a user-driven tool to display genomics data sets onto diagrams of metabolic pathways and other biological processes. Plant J. 37, 914–939. doi: 10.1111/j.1365-313X.2004.02016.x
Tristan, C., Shahani, N., Sedlak, T. W., and Sawa, A. (2011). The diverse functions of GAPDH: views from different subcellular compartments. Cell. Signal. 23, 317–323. doi: 10.1016/j.cellsig.2010.08.003
Tschaplinski, T. J., Stewart, D. B., and Norby, R. J. (1995). Interactions between drought and elevated CO2 on osmotic adjustment and solute concentrations of tree seedlings. New Phytol. 131, 169–177. doi: 10.1111/j.1469-8137.1995.tb05718.x
Wen, W., Li, K., Alseekh, S., Omranian, N., Zhao, L., Zhou, Y., et al. (2015). Genetic determinants of the network of primary metabolism and their relationships to plant performance in a maize recombinant inbred line population. Plant Cell 27, 1839–1856. doi: 10.1105/tpc.15.00208
Xu, C., and Huang, B. (2008). Root proteomic responses to heat stress in two Agrostis grass species contrasting in heat tolerance. J. Exp. Bot. 59, 4183–4194. doi: 10.1093/jxb/ern258
Xu, C., and Huang, B. (2010a). Differential proteomic response to heat stress in thermal Agrostis scabra and heat-sensitive Agrostis stolonifera. Physiol. Plant. 139, 192–204. doi: 10.1111/j.1399-3054.2010.01357.x
Xu, C., and Huang, B. (2010b). Comparative analysis of drought responsive proteins in Kentucky bluegrass cultivars contrasting in drought tolerance. Crop Sci. 50, 2543–2552. doi: 10.2135/cropsci2010.03.0152
Xu, C., Sibicky, T., and Huang, B. (2010). Protein profile analysis of salt-responsive proteins in leaves and roots in two cultivars of creeping bentgrass differing in salinity tolerance. Plant Cell Rep. 29, 595–615. doi: 10.1007/s00299-010-0847-3
Xu, Y., Du, H., and Huang, B. (2013). Identification of metabolites associated with superior heat tolerance in thermal bentgrass through metabolic profiling. Crop Sci. 53, 1626–1635. doi: 10.2135/cropsci2013.01.0045
Yang, Q., Wang, Y., Zhang, J., Shi, W., Qian, C., and Peng, X. (2007). Identification of aluminum-responsive proteins in rice roots by a proteomic approach: cysteine synthase as a key player in Al response. Proteomics 7, 737–749. doi: 10.1002/pmic.200600703
Yu, J., Sun, L., Fan, N., Yang, Z., and Huang, B. (2015). Physiological factors involved in positive effects of elevated carbon dioxide concentration on bermudagrass tolerance to salinity stress. Environ. Exp. Bot. 115, 20–27. doi: 10.1016/j.envexpbot.2015.02.003
Yu, J. J., Du, H. M., Xu, M., and Huang, B. R. (2012a). Metabolic responses to heat stress under elevated atmospheric CO2 concentration in a cool-season grass species. J. Am. Soc. Hortic. Sci. 137, 221–228.
Yu, J. J., Chen, L. H., Xu, M., and Huang, B. R. (2012b). Effects of elevated CO2 on physiological responses of tall fescue to elevated temperature, drought stress, and the combined stresses. Crop Sci. 52, 1848–1858. doi: 10.2135/cropsci2012.01.0030
Keywords: bermudagrass, elevated CO2, heat stress, metabolites, protein
Citation: Yu J, Li R, Fan N, Yang Z and Huang B (2017) Metabolic Pathways Involved in Carbon Dioxide Enhanced Heat Tolerance in Bermudagrass. Front. Plant Sci. 8:1506. doi: 10.3389/fpls.2017.01506
Received: 31 March 2017; Accepted: 15 August 2017;
Published: 19 September 2017.
Edited by:
Luis A. J. Mur, Aberystwyth University, United KingdomReviewed by:
Lucia Guidi, University of Pisa, ItalyM. B. Kirkham, Kansas State University, United States
Copyright © 2017 Yu, Li, Fan, Yang and Huang. This is an open-access article distributed under the terms of the Creative Commons Attribution License (CC BY). The use, distribution or reproduction in other forums is permitted, provided the original author(s) or licensor are credited and that the original publication in this journal is cited, in accordance with accepted academic practice. No use, distribution or reproduction is permitted which does not comply with these terms.
*Correspondence: Zhimin Yang, bmF1eXptQG5qYXUuZWR1LmNu Bingru Huang, aHVhbmdAYWVzb3AucnV0Z2Vycy5lZHU=
†These authors have contributed equally to this work.