 Khurram Shahzad
 Yun Jia†
 Umar Zeb
 Zhong-Hu Li
- Key Laboratory of Resource Biology and Biotechnology in Western China, Ministry of Education, College of Life Sciences, Northwest University, Xi’an, China
Mountain uplift and climatic fluctuations are important driving forces that have affected the geographic distribution and population dynamics history of organisms. However, it is unclear how geological and climatic events might have affected the phylogeographic history and species divergence in high-alpine herbal plants. In this study, we analyzed the population demographic history and species differentiation of four endangered Notopterygium herbs on the high-altitude Qinghai–Tibetan Plateau (QTP) and adjacent areas. We combined phylogeographic analysis with species distribution modeling to detect the genetic variations in four Notopterygium species (N. incisum, N. franchetii, N. oviforme, and N. forrestii). In total, 559 individuals from 74 populations of the four species were analyzed based on three maternally inherited chloroplast fragments (matK, rbcL, and trnS-trnG) and one nuclear DNA region (internal transcribed spacer, ITS). Fifty-five chloroplast DNA (cpDNA) and 48 ITS haplotypes were identified in the four species. All of the cpDNA and ITS haplotypes were species-specific, except N. franchetii and N. oviforme shared one cpDNA haplotype, H32. Phylogenetic analysis suggested that all four species formed a monophyletic clade with high bootstrap support, where N. franchetii and N. oviforme were sisters. In addition, each Notopterygium species generated an individual clade that corresponded to their respective species in the ITS tree. Population dynamics analyses and species distribution modeling showed that the two widely distributed herbs N. incisum and N. franchetii exhibited obvious demographic expansions during the Pleistocene ice ages. Molecular dating suggested that the divergence of the four Notopterygium species occurred approximately between 3.6 and 1.2 Mya, and it was significantly associated with recent extensive uplifts of the QTP. Our results support the hypothesis that mountain uplift and Quaternary climatic oscillations profoundly shaped the population genetic divergence and demographic dynamics of Notopterygium species. The findings of this and previous studies provide important insights into the effects of QTP uplifts and climatic changes on phylogeography and species differentiation in high altitude mountainous areas. Our results may also facilitate the conservation of endangered herbaceous medicinal plants in the genus Notopterygium.
Introduction
Geological events and climatic fluctuations are considered to have profoundly shaped the distribution and population dynamics history of species in mountain areas (Hewitt, 2004; Hickerson et al., 2010). Thus, during glacial periods, most species experienced adverse weather conditions in high altitude mountains, where they contracted into refugia in low latitudes and then their ranges expanded again after the ice ages, thereby leading to species divergence or secondary contact evolution (Hewitt, 2004; Nybom, 2004; Ohsawa and Ide, 2008). In addition, the distribution patterns and population genetic structures of some species were reshaped due to geographic barriers and climatic oscillations. Moreover, the population size, mating system, and bio-characteristics of species had important effects on the divergence and evolutionary history of populations of species (Stewart et al., 2010; Zhang et al., 2015). For example, some studies have suggested that the locations of ice age refugia for plants were determined mainly by the adaptability of species to the external environment (Stewart et al., 2010; Liao et al., 2015; Wang et al., 2015).
During the Quaternary ice periods, many species experienced extinction events due to repeated bottlenecks and genetic drift, which led to further divergent evolution and genetic isolation within species (Soltis et al., 2006; Hickerson et al., 2010; Stewart et al., 2010; Keppel et al., 2012). Repeated environmental changes may also have promoted the fragmentation of habitats, as well as causing exotic distributions of different species or intraspecific genetic changes (Hickerson et al., 2010; Jia et al., 2012). Studies of alpine trees have shown that populations were crossed during mountain uplift processes, whereas the exchange of genes among populations was restricted due to climatic and geographic barriers (McLachlan et al., 2005; Soltis et al., 2006; Birks and Willis, 2008; Avise, 2009; Gao et al., 2012). Some alpine species experienced deep lineage divergence due to climatic changes and environmental isolations (Qiu et al., 2011; Liu et al., 2012; Xu et al., 2015).
In the high latitudes of Europe and North America, studies suggested that plant species could have survived in high elevation areas (“invisible refugia”) during the ice age periods (Anderson et al., 2006; Provan and Bennett, 2008; Parducci et al., 2012; Stewart and Stringer, 2012; Ortego et al., 2012, 2015; Guichoux et al., 2013; Allen et al., 2015; Cavender-Bares et al., 2015). The presence of Juniperus species in the Qinghai-Tibetan Plateau (QTP) region also supports the existence of invisible refugia (Opgenoorth et al., 2010). The QTP is the largest and highest plateau in the world, with a mean altitude of more than 4000 m. Various endangered species and high levels of global diversity are present on this plateau (Mittermeier et al., 2005). Studies suggest that extensive uplifts of the QTP occurred in the Miocene–Pliocene era between 3.6 and 1.7 Mya (Li and Fang, 1999; Zhang et al., 2000; Zhou et al., 2006). The lifting of mountains triggered species divergence and changed the genetic structure to affect the evolution of high-alpine plants (Liu et al., 2012; Wen et al., 2014; Ickert-Bond and Renner, 2016). In particular, the geological effects of the QTP on the genetic structure, geographic distribution, and species differentiation of plants have been clearly defined in this area (Wang et al., 2010; Xu et al., 2010; Li et al., 2013; Liu et al., 2013; Sun et al., 2014; Favre et al., 2015; Hughes and Atchison, 2015). However, most of these previous studies focused on the response patterns of tree or shrub species to mountain uplifts and climatic oscillations on the QTP (Liu et al., 2006; Wang et al., 2009; Mao et al., 2010; Xu et al., 2010; Tian et al., 2011; Qiu et al., 2011; Wen et al., 2014; Favre et al., 2015; Hughes and Atchison, 2015), whereas little is known about the effects of mountain uplifts and climate events on cold-tolerant herbal species in the high altitude QTP and adjacent regions.
The genus Notopterygium H. de Boissieu (Apiaceae) comprises perennial and endangered herbaceous medicinal plants, which are mainly distributed in the QTP and its surrounding high-altitude areas. According to records in the Flora of China, this genus comprises six species: N. incisum C. C. Ting ex H. T. Chang, N. oviforme R. H. Shan, N. franchetii H. de Boissieu, N. forrestii H. Wolff, N. tenuifolium M. L. Sheh and F. T. Pu, and N. pinnatiinvolucellum F. T. Pu and Y. P. Wang. N. incisum and N. franchetii have wide distribution ranges at altitudes of 3200–5100 m and 1700–4500 m, respectively. N. oviforme occurs in the eastern part of the QTP at altitudes of 1700–3200 m. The other three species, i.e., N. forrestii (4000–4300 m), N. tenuifolium (4300 m), and N. pinnatiinvolucellum (3400 m), have very limited distributions among the high-alpine shrubs and meadows in the west region of China. These herb species provide an excellent model for detecting the effects of the QTP uplifts and Quaternary climatic oscillations on the genetic structure and species divergence of plants. However, in recent years, due to high market demand, the wild resources of these Notopterygium species have decreased rapidly because of human over-exploitation (Zhou et al., 2010). The Notopterygium species are now listed as endangered herb species in the IUCN Red List, and their management and conservation are urgently required (Wu et al., 2005). Information regarding geographic distributions and genetic diversity is vital for formulating effective conservation strategies for wild plant resources. However, most of the previous studies of the Notopterygium species have focused mainly on their phylogenetic evolutionary relationships (Pu et al., 2000; Yang et al., 2017), morphological and physiological characteristics (She and Pu, 1996; Wang et al., 1996; Jiang et al., 2005), and comparative transcriptome analysis (Jia et al., 2017), whereas little is known about their genetic divergence and population demographic history.
In the current study, we sampled four species, i.e., N. incisum, N. oviforme, N. franchetii, and N. forrestii, across their entire geographic distributions in the high-altitude QTP and adjacent areas. We detected the genetic variations in three chloroplast DNA (cpDNA) markers and a nuclear DNA fragment in order to characterize the population histories and species divergence of these endangered herb plants. Our aims were: (1) to determine the genetic structure and population evolutionary history of four Notopterygium species; (2) to identify the phylogenetic relationships among these species and their phylogeographic history; (3) to explore the effects of QTP uplifts and climatic changes in the Quaternary on the divergence and phylogeography of these species; and (4) to propose reasonable conservation and management strategies for the endangered Notopterygium species.
Materials and Methods
Sample Collection
In this study, in order to obtain information about genetic variation over a wide area, 559 individuals from 74 populations were collected for the four Notopterygium species in Sichuan, Shaanxi, Gansu, Qinghai, and Shanxi provinces in the high-altitude QTP and adjacent areas. These samples covered the complete geographic distribution ranges of the four species in the QTP and surrounding areas. From 2 to 17 individuals were sampled from each population, where all of the samples collected were separated from each other by at least 100 m. Detailed information about the latitude, longitude, and altitude for all of the populations is provided in Figure 1 and Table 1. All of the materials and documents have been deposited in the College of Life Sciences, Northwest University. In addition, two species from the genus Pleurospermum, i.e., P. prattii and P. franchetianum, as well as Heracleum moellendorffii were used as outgroups.
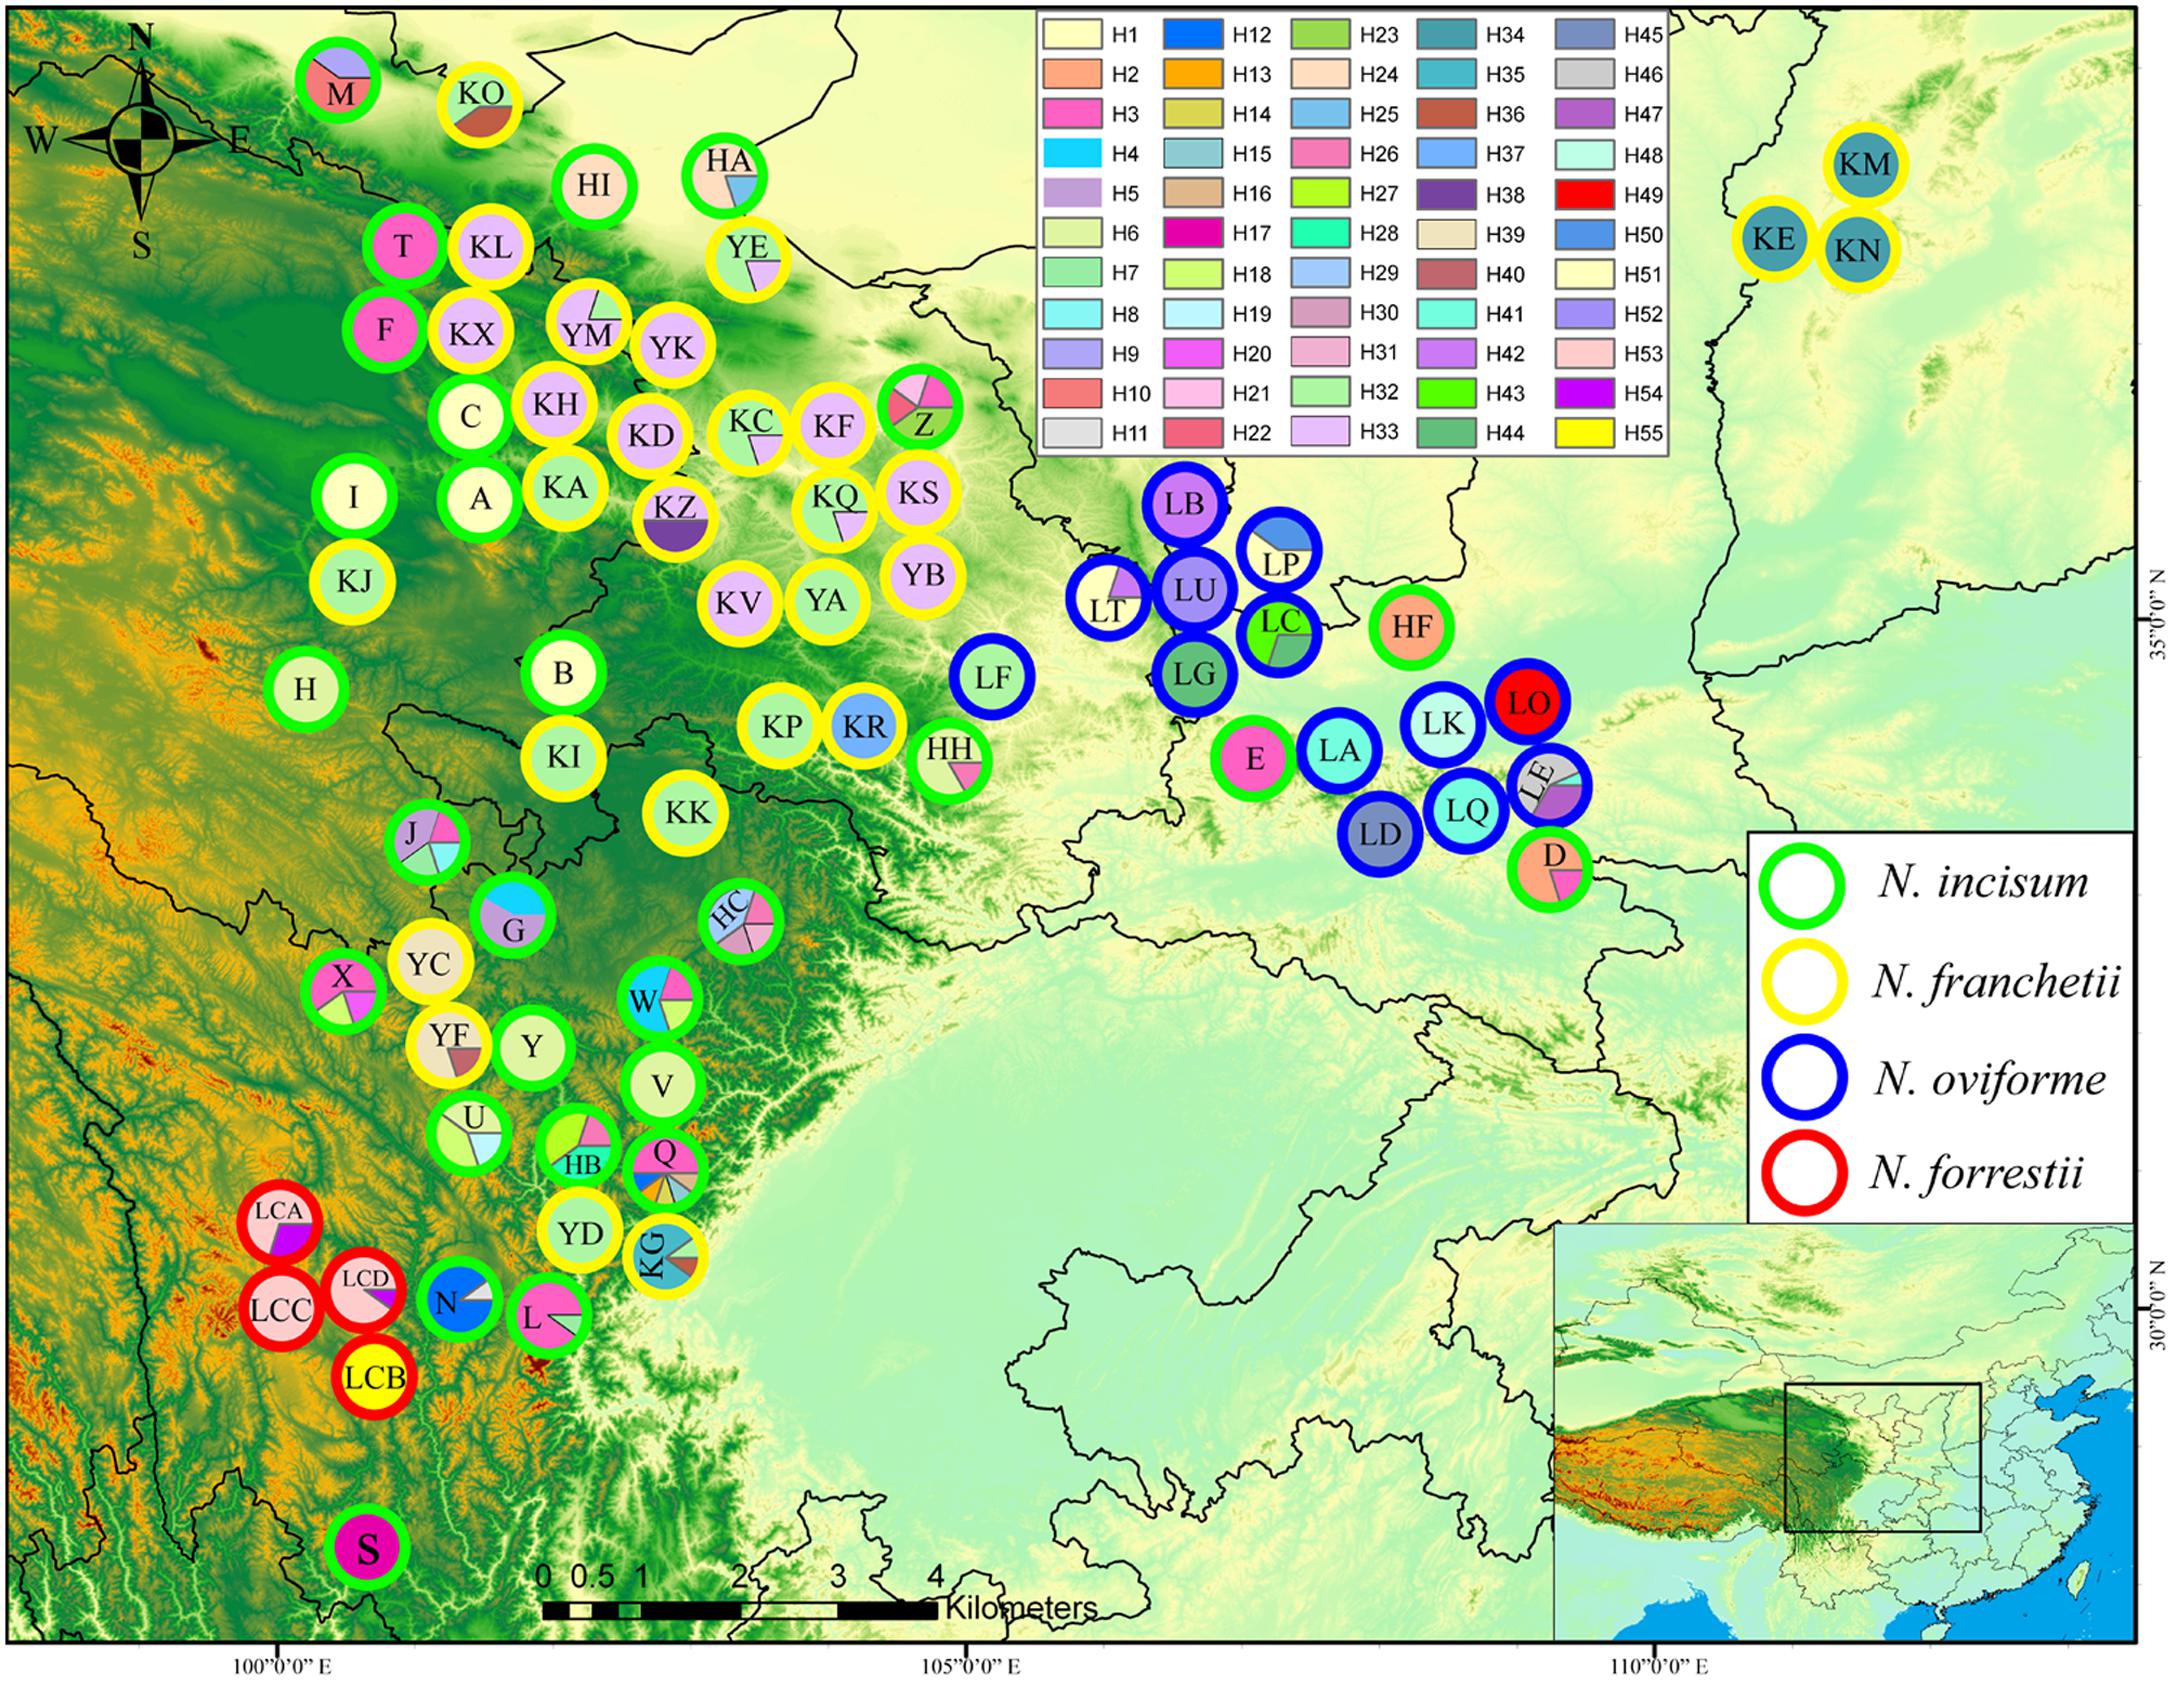
FIGURE 1. Geographic distribution of cpDNA haplotypes for the four Notopterygium species. Each circle represents a population and each color represents each haplotype. The colored outlines of the circles distinguish the four species, where green indicates N. incisum, yellow indicates N. franchetii, blue indicates N. oviforme, and red indicates N. forrestii.
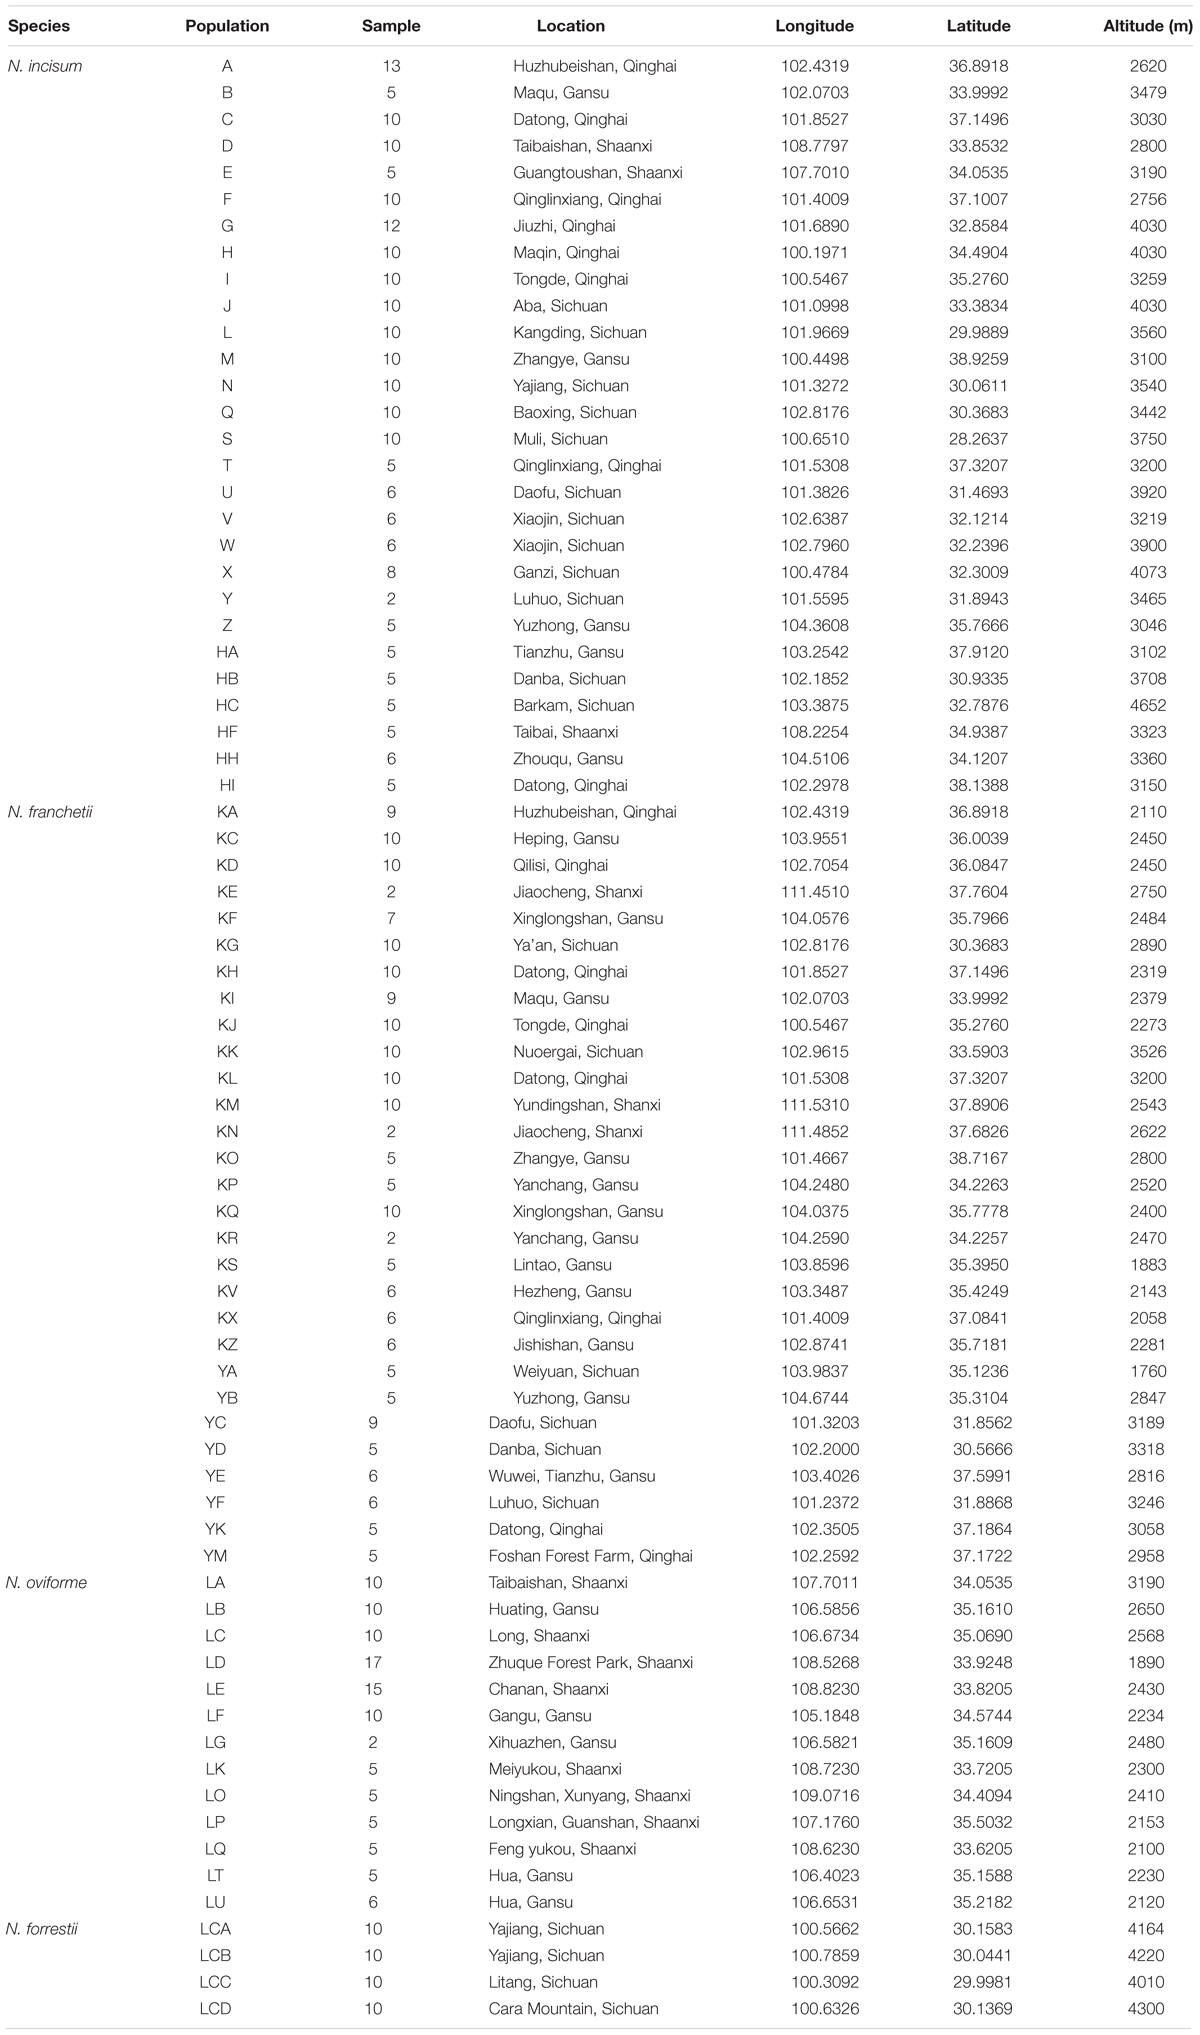
TABLE 1. Geographic distributions of the four Notopterygium species sampled in this study.
DNA Extraction and Sequencing
Total DNA was extracted using the modified CTAB method (Doyle and Doyle, 1987) or with a plant DNA extraction kit (Tiangen, Beijing, China). We used 1% agarose gels to check the quality of the DNA extracted from the Notopterygium species. To screen for suitable primers, we first randomly selected 50 individuals (one individual from each population) to amplify the universal cpDNA primers and nDNA primers recommended by the Consortium for the Barcode of Life (CBOL) (CBOL Plant Working Group, 2009). Finally, three highly variable cpDNA primers, i.e., trnS-trnG, matK, and rbcL, and one nDNA internal transcribed spacer (ITS) primer were selected to determine the genetic variations in the genus Notopterygium after initial tests with six loci (Supplementary Table S1). Thus, two monomorphic cpDNA loci (trnL-trnF and rpl36-infA; Bai et al., 2010; Soumaya et al., 2014) were excluded from all of the subsequent analyses.
PCR amplification was performed in a volume of 25 μL containing 2 μL DNA template (10–50 ng/μL), 12.5 μL PCR MIX (Xi’an Runde, China), 0.75 μL of each primer (20 ng/μL), and 9 μL double-distilled H2O. The PCR reaction conditions were as described in Supplementary Table S2. All of the high quality PCR products were sequenced using the amplified forward and reverse primers with an ABI 3730 XL genetic analyzer (Applied Biosystems, Foster City, CA, United States). All of the sequences were deposited in GenBank under accession numbers MF787385–MF787579.
Proofreading and Alignment of DNA, and Data Analysis
BioEdit v 7.0.9.0 (Hall, 1999) software was used for manual proofreading and checking the variable sites. MEGA v 7.0 (Sudhir et al., 2008) was used to remove low quality sequences and only high quality sequences were analyzed. For the ITS sequences, we visualized the possible color spectrum of the overlapping peaks at any one variable site. If a strong signal peak was more than half of a weak signal peak, then we used the strong peak for phrasing. If both the peaks overlapped, we used the following phrases for each variable site instead of both peaks as phrases: R: A+G, Y: C+T, M: A+C, K: G+T, S: G+C, W: A+T. DnaSP v 5.0 software was used for dividing the heterozygous loci into double sequence series (Librado and Rozas, 2009).
Genetic Variation and Genetic Structure Analysis
The genetic diversity of the cpDNA and ITS sequences were analyzed in all four Notopterygium species using PERMUT v 1.0 software, where we calculated the genetic diversity within the population of each species (hS), total genetic diversity (hT), and population genetic differentiation coefficients GST and NST (Grivet and Petit, 2002).
In addition, ARLEQUIN v 3.5 (Excoffier and Lischer, 2010) software was used to perform analysis of molecular variance (AMOVA) for the cpDNA and ITS sequences. AMOVA partitioned the genetic differentiation among the populations FST, within a population FSC, and among species FCT.
Phylogenetic Analysis
Phylogenetic analyses of the cpDNA and ITS sequences were performed with MEGA v 7.0. JModeltest v 3.06 (Posada and Crandall, 1998) was used to filter the best evolutionary model (GTR+G). One-thousand bootstrap replicates were performed for the maximum likelihood (ML) and maximum parsimony (MP) models to obtain the phylogenetic tree. MrBayes v 3.2.3 was also used to conduct phylogenetic analyses of the cpDNA and ITS sequences based on the Bayesian criterion (Huelsenbeck and Ronquist, 2001). We set the random tree rotation as 10,000,000 generation, where each 1000 generations were kept to construct a phylogenetic tree, with a burn-in of 2500.
NETWORK v 5.0.0 (Polzin and Daneshmand, 2003) was used to construct median-joining networks of the cpDNA and ITS sequences. ArcGIS v 10.2 (Bader, 2005) was employed to draw the haplotype distribution map. BEAST v 1.7.5 (Drummond and Rambaut, 2007) was used to estimate the divergence times of the cpDNA haplotypes where we used the cpDNA evolutionary rates (1.0–3.0 × 10⁻⁹ s/s/y) recorded for other angiosperms to calibrate our datasets due to the lack of fossil evidence for Notopterygium plants (Wolfe et al., 1987). We employed the loose molecular clock method with an uncorrected log-normal distribution for the branch lengths. After a burn-in of 5,000,000 steps, all of the parameters were collected once every 1000 steps up to 50,000,000 Markov chain Monte Carlo (MCMC) algorithm steps. The convergence of the MCMC results was verified by using the Tracer v 1.5 program to check that the chain was balanced, where we then used the Tree Annotator v 1.7.5 program to obtain the best tree merging and Figtree v 1.3.1 (Rambaut, 2009) was employed to view the resulting tree.
Population Dynamics Analysis
DnaSP v 5.0 was used to analyze the genetic diversity parameters, including the haplotype diversity (Hd) (Nei and Tajima, 1981), nucleotide diversity (π) (Nei and Li, 1979), and number of haplotypes (H). We also used DnaSP v 5.0 to detect the mismatched distributions (Schneider and Excoffier, 1999) of cpDNA sequences in the four Notopterygium species. Population demographic expansions were tested using Arlequin v 3.5 (Excoffier and Lischer, 2010) and Tajima’s D (Tajima, 1989), Fu’s FS (Fu, 1997), and Fu and Li’s F∗ (Fu and Li, 1993) tests. We used the sum of the squared deviations between the observed and expected mismatches as well as Harpending’s raggedness index values (Rag) (Harpending, 1994) to determine the validity and significance level of the expansion model. According to the formula: τ =2ut (τ is the mismatch equilibrium expansion variable) (Rogers and Harpending, 1992), we calculated the expansion time t, where u is the mutation rate per generation calculated using the formula u = 2μkg, where μ is the mutation rate per nucleotide per year, k is the total length of a cpDNA sequence, and g is the generation time. According to our field investigations, the generation time for Notopterygium species was 3 years.
In order to further determine the signs of demographic growth in the four Notopterygium species, we used LAMARC v 2.1.8 (Kuhner, 2006) to calculate the population growth parameter g. The MCMC algorithm was run for 100,000 generations and sampled every 200,000 steps, where the first 25% of the sampled trees were discarded as the burn-in.
Species Distribution Modeling
We used MaxEnt v 3.3.3k (Phillips et al., 2006; Phillips and Dudík, 2008) to predict the current, last glacial maximum (LGM), last interglacial (LIG), and future distributions of two widespread Notopterygium species: N. incisum (148 distribution sites) and N. franchetii (80 distribution sites). The distribution sites of Notopterygium species were collected from previous studies as well as websites containing climate data and plant distributions. We also obtained some distribution sites based on field investigations. Bio-climatic environment data were downloaded from the WorldClim website1 at a resolution of 2.5 arc-minutes. Six bioclimatic environmental variables (Supplementary Table S7) with significant effects on N. incisum and N. franchetii were used to detect changes in the distribution ranges of plants. We set the number of replicates to 10 and the maximum number of iterations to 500 for MaxEnt modeling. The accuracy of the model’s performance was assessed based on the area under the receiver operating characteristic curve (AUC) (Fawcett, 2006).
Results
cpDNA Variations and Haplotype Distributions
Three chloroplast fragments (matK, rbcL, and trnS-trnG) were used to analyze 559 individuals from 74 populations of the four Notopterygium species. The total length of the fragments was 1605 bp, and the lengths of the matK, rbcL, and trnS-trnG regions were 669, 668, and 268 bp, respectively, which included 21, seven, and eight nucleotide mutation sites (Supplementary Table S3). The cpDNA regions were uniparental inherited markers so we combined the three chloroplast fragments in the subsequent population genetics analysis.
In total, 55 cpDNA haplotypes were detected in the four Notopterygium species (Figures 1, 2). Most of the haplotypes were species-specific, except the H32 haplotype was shared by N. franchetii and N. oviforme. N. incisum contained 31 haplotypes, where haplotypes H1–H7, H12, H18, and H26 were shared among populations, and the remainder were unique to each population. Populations from the southeast part of the QTP (G, J, Q, U, Z, HB, and HC; see Table 1 for the site codes) had the highest haplotype diversity. N. franchetii had nine haplotypes with nine mutation sites. Populations from the west part of China (KG, KO, KZ, and YF) also had the highest haplotype diversity. N. oviforme had 12 haplotypes with 16 mutation sites, where the LE population had the highest haplotype diversity for this species. N. forrestii had three haplotypes with two mutation sites, where H55 was unique to the LCB population, and haplotypes H53 and H54 were shared by the other populations.
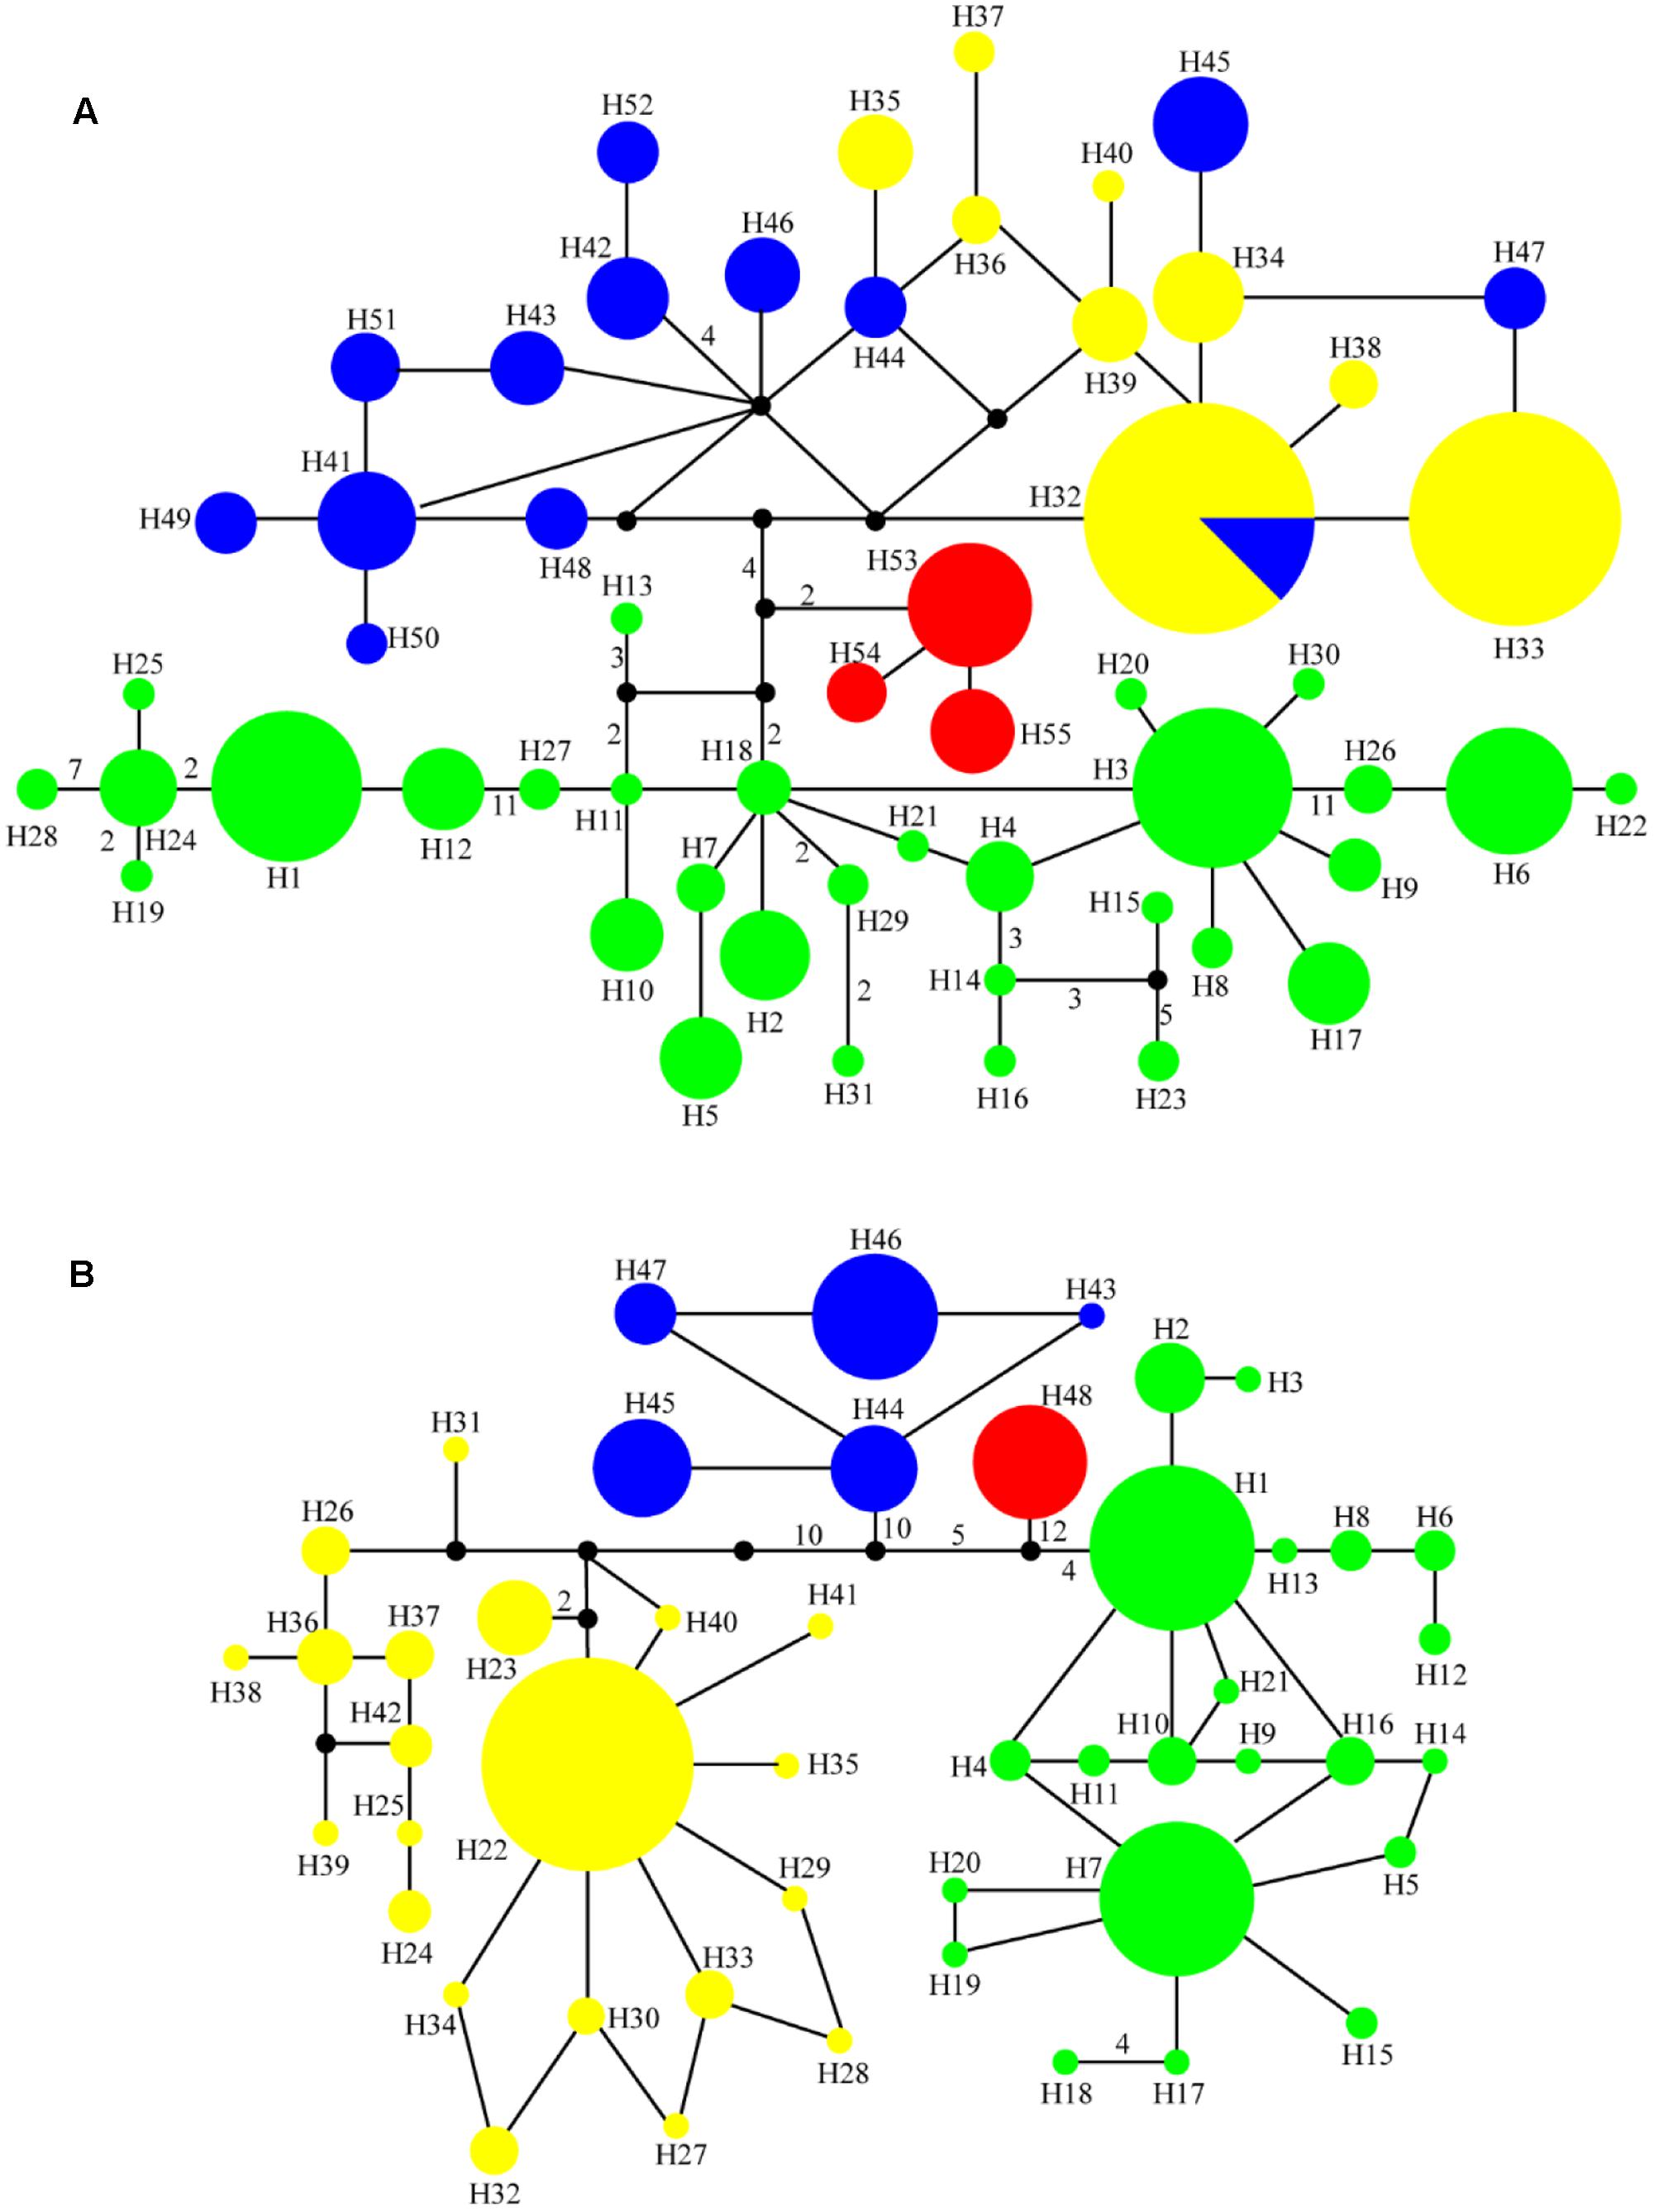
FIGURE 2. Median-joining networks for (A) 55 cpDNA haplotypes and (B) 48 ITS haplotypes in the genus Notopterygium. Each color denotes the four species in Notopterygium Boissieu, where green indicates N. incisum, yellow indicates N. franchetii, blue indicates N. oviforme, and red indicates N. forrestii. The numbers on the branches indicate the number of steps separating adjacent haplotypes.
Notopterygium oviforme had the highest levels of genetic diversity and nucleotide diversity (Hd = 0.81, π = 0.0013), followed by N. incisum (Hd = 0.75, π = 0.00086) and N. forrestii (Hd = 0.39, π = 0.0002), whereas N. franchetii had the lowest level of diversity (Hd = 0.29, π = 0.00031) (Table 2).
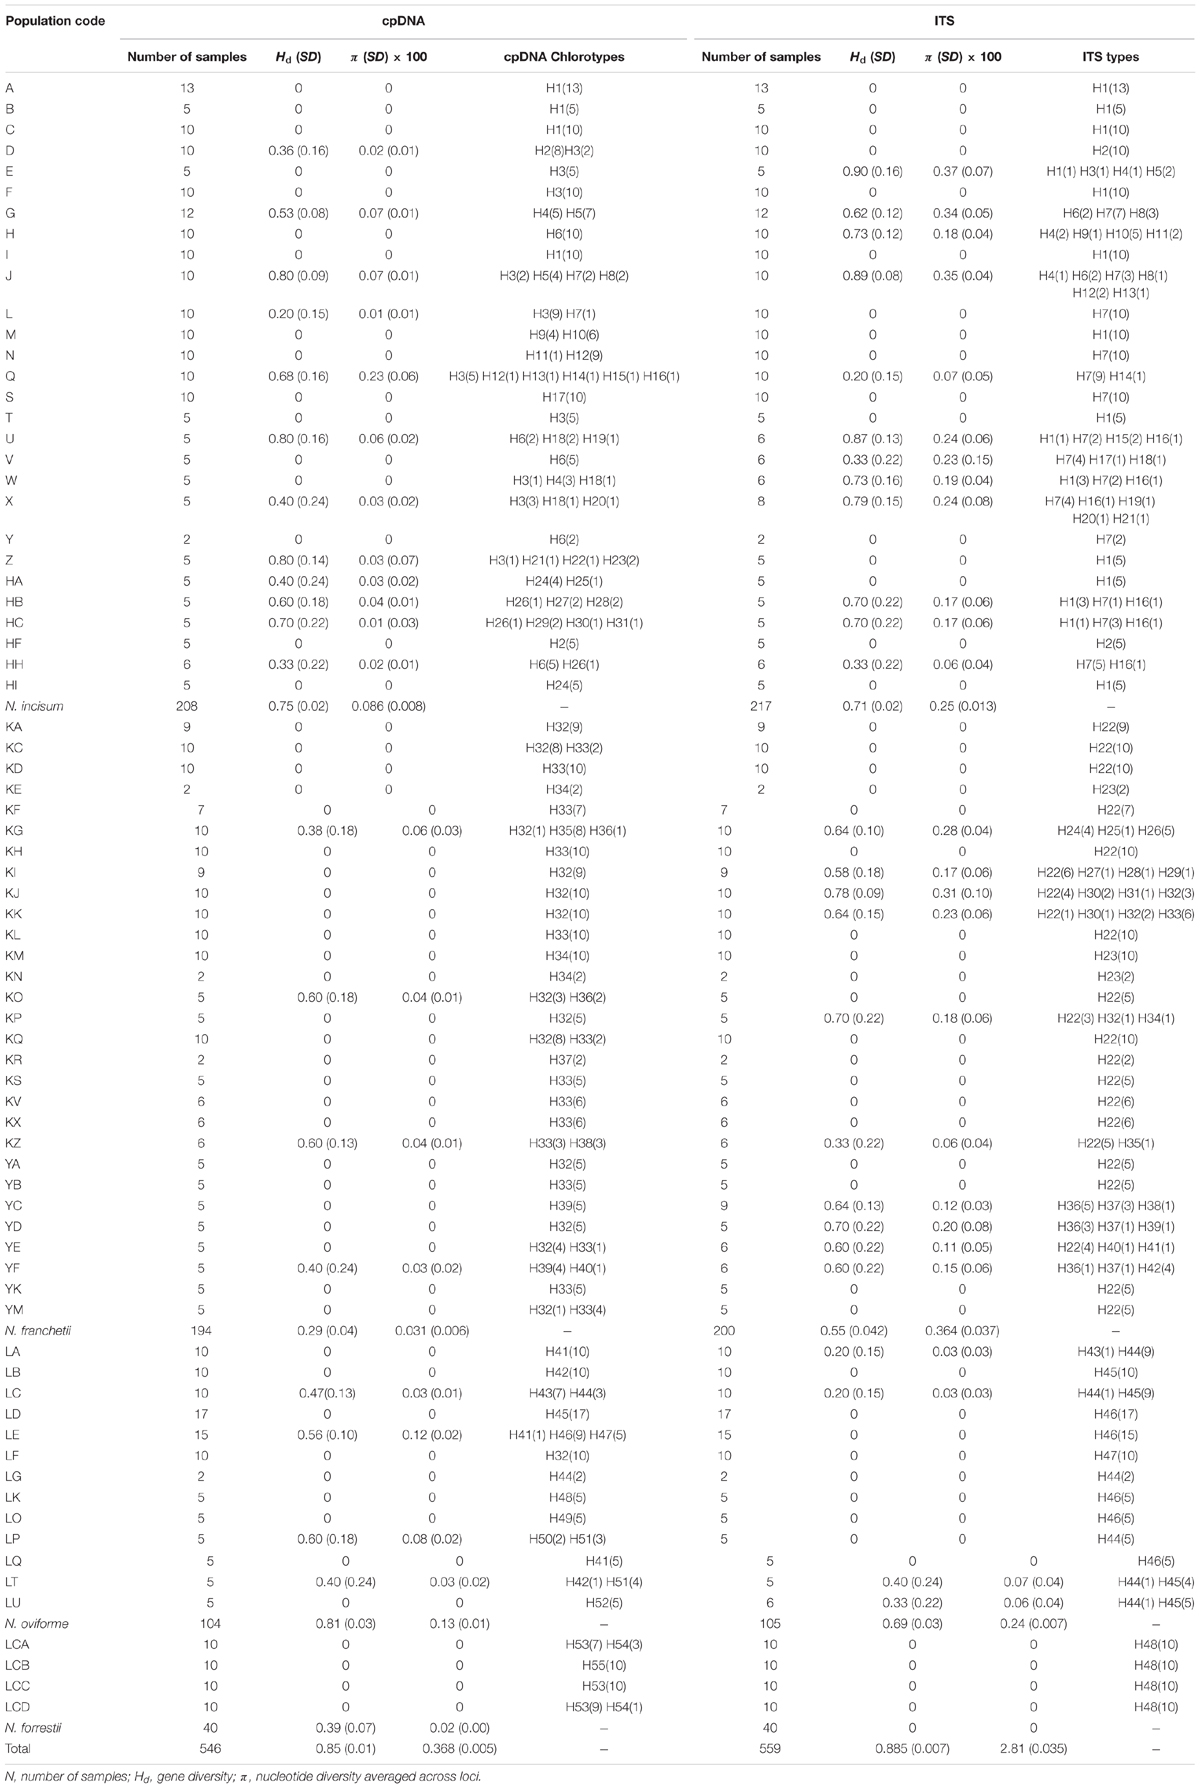
TABLE 2. Gene diversity, nucleotide diversity, and haplotype frequencies of the ITS and cpDNA sequences for the four Notopterygium species.
ITS Sequence Variation
The total length of the sequenced ITS region was 593 bp and 48 haplotypes were identified with 66 nucleotide mutation sites (Figure 2 and Supplementary Table S4). All of the ITS haplotypes were species-specific in the four Notopterygium species. The total haplotype diversity (Hd) and π values for N. incisum, N. franchetii, and N. oviforme were 0.71 and 0.0025, 0.55 and 0.00364, and 0.69 and 0.0024, respectively. N. incisum populations from the southeast part of the QTP (E, G, H, J, U, W, X, HB and HC) had the highest haplotype diversity in this species, and haplotypes H1 and H7 had the highest distribution frequencies. N. franchetii populations from KG, KI, KJ, KK, KP, YC, YD, YE, and YF had the highest haplotype diversity in this species, and haplotype H22 had the highest frequency. In addition, N. oviforme and N. forrestii exhibited low haplotype diversity in terms of their ITS sequences (Table 2 and Supplementary Figure S1).
Genetic Diversity and Structure
The total genetic diversity (hT) values based on the cpDNA datasets for N. incisum, N. franchetii, N. oviforme, and N. forrestii were 0.939, 0.766, 0.961, and 0.623, respectively, where N. incisum had the highest levels for hS (0.404) and hT, whereas N. forrestii had the lowest level of diversity (hS = 0.167; hT = 0.623) (Table 3). In addition, we calculated the genetic differentiation coefficients GST and NST for the four species. The U statistic (Gaussian test 1000 times) showed that NST was significantly larger than GST for N. incisum and N. oviforme (P < 0.05), thereby indicating that these two species exhibited significant phylogeographic structuring (Table 3).
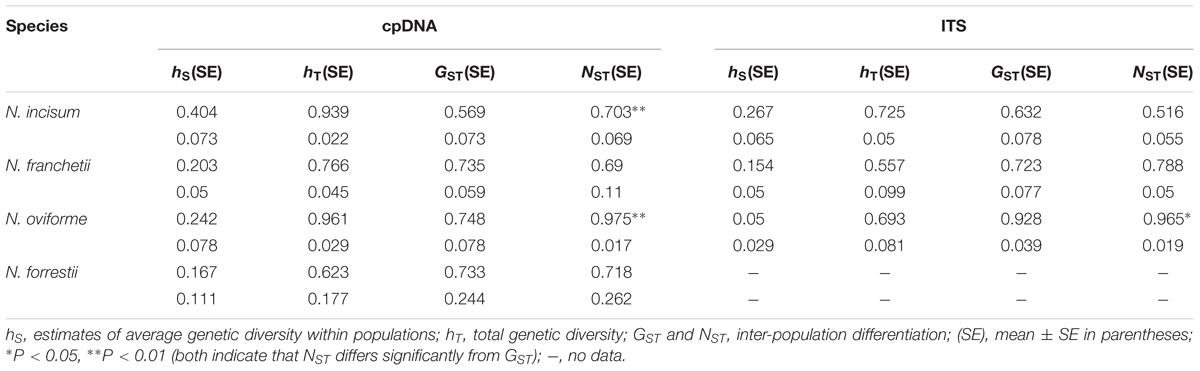
TABLE 3. Genetic diversity and differentiation analyses for cpDNA and ITS variations in Notopterygium species.
AMOVA analysis of the cpDNA datasets detected genetic variations among the four species (FCT = 0.5804) (Supplementary Table S5). In the four individual species, the genetic variations among populations (N. incisum, FST = 0.8196; N. franchetii, FST = 0.8391; N. oviforme, FST = 0.8474; and N. forrestii, FST = 0.7585) were significantly higher than those within populations (Supplementary Table S5). In addition, the AMOVA results obtained for the ITS sequences indicated similar genetic differentiation patterns to those based on the cpDNAs, where the differences among species in terms of the variation in the ITS were as high as 92% (FCT = 0.9287) (Supplementary Table S6).
Phylogenetic Relationships
Phylogenetic trees of the cpDNA haplotypes were constructed based on the ML, MP, and Bayesian inference methods, which showed that the topological structures obtained were basically the same using the three methods (Figure 3). The four species of Notopterygium formed a larger monophyletic clade with high bootstrap support, where N. franchetii and N. oviforme were sisters. The median-joining network diagram produced using the cpDNA datasets was consistent with the phylogenetic analysis (Figure 2). The major haplotypes with the highest distribution frequencies (H1, H11, H32, H33, H41, and H53) were located in the central positions of the network. However, the phylogenetic relationships of the ITS sequences differed from those of the cpDNA sequences. No haplotypes were shared among the four Notopterygium species and each species formed its own individual branch (Figure 3) in the ITS tree. In addition, in order to confirm the phylogenetic positions of all four species considered in this study, we analyzed the other two species in the genus Notopterygium, i.e., N. tenuifolium and N. pinnatiinvolucellatum. Phylogenetic analyses based on variations in the chloroplast rbcL sequence showed that the four species considered in this study, i.e., N. incisum, N. franchetii, N. oviforme, and N. forrestii, were more closely related than N. tenuifolium and N. pinnatiinvolucellatum (Supplementary Figure S2).
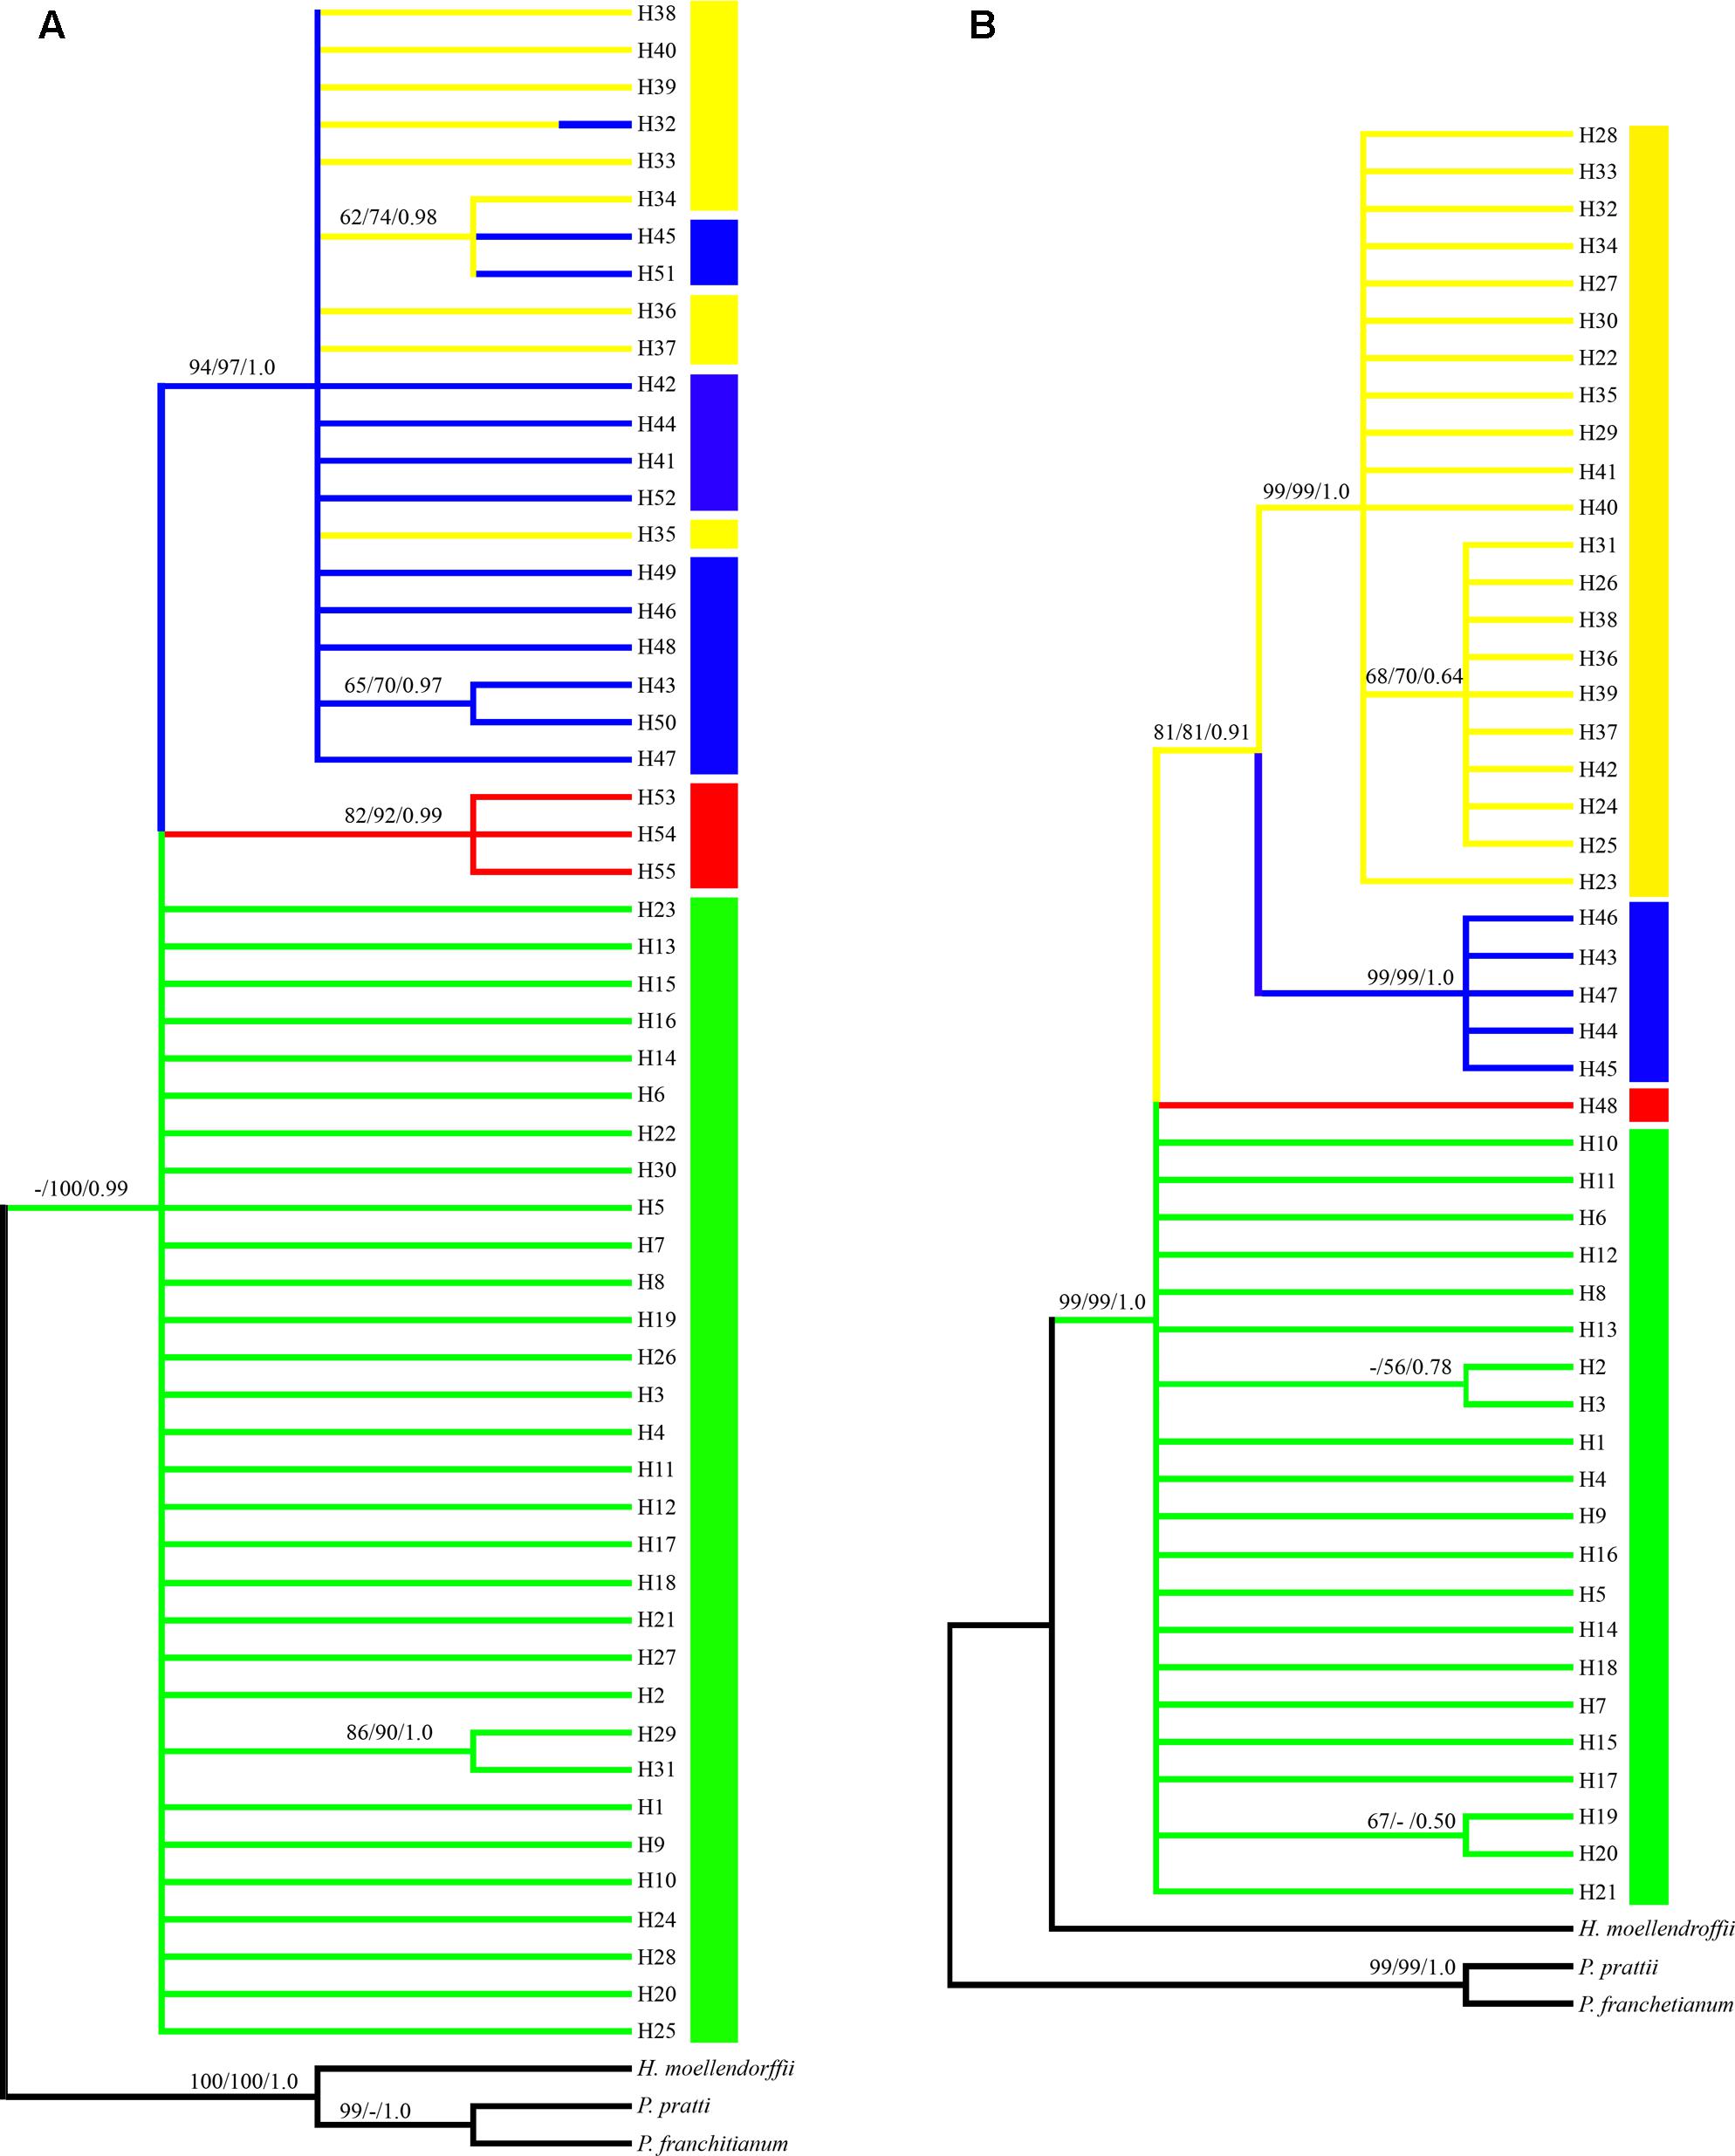
FIGURE 3. Phylogenetic tree for the (A) 55 cpDNA haplotypes and (B) 48 ITS haplotypes. Each color denotes the four species in the genus Notopterygium Boissieu, where green indicates N. incisum, yellow indicates N. franchetii, blue indicates N. oviforme, and red indicates N. forrestii. Posterior probabilities are shown above the branches and bootstrap support below the branches (when > 50% for each case).
Population Dynamics History and Divergence Time
Based on the cpDNA sequences, we performed various mathematical analyses to determine the population histories of the four Notopterygium species (Table 4 and Supplementary Figure S3). The mismatch distribution model had a single peak, with negative Tajima’s D and Fu’s FS values for N. incisum and N. franchetii, which suggested that these two species had experienced rapid range expansions. The larger population growth indexes for N. incisum (g = 809) and N. franchetii (g = 2810.736) were also consistent with rapid population expansions. By contrast, N. oviforme and N. forrestii had bimodal mismatch distributions with positive Tajima’s D and Fu’s FS values, where these results indicated that they did not experience expansion events. Therefore, we estimated the expansion times for N. incisum and N. franchetii as about 128–43 Kya and 51–17 Kya in the Pleistocene, respectively (Table 5).
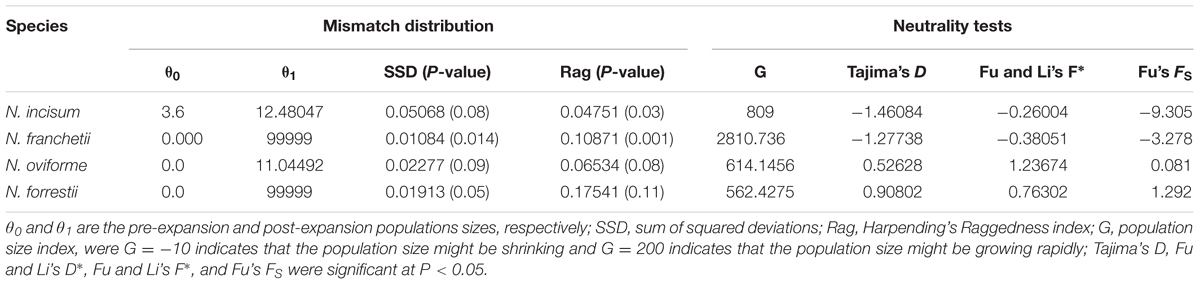
TABLE 4. Results of cpDNA mismatch distribution and neutrality tests for the four Notopterygium species.
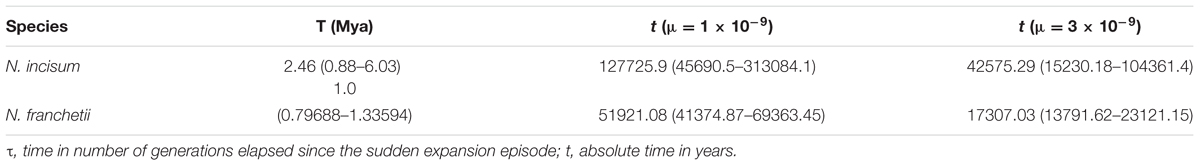
TABLE 5. Ages (years ago) of putative expansion events estimated by mismatch analyses.
We estimated the divergence times between the four species of Notopterygium based on a range of mutation rates (1.0–3.0 × 10⁻⁹ s/s/y). The first divergence among the four species occurred between approximately 3.6 Mya (95% highest posterior density (HPD), 2.1–5.3 Mya) and 1.2 Mya (95% HPD, 0.67–1.8 Mya), whereas the estimated divergence between N. forrestii and N. incisum occurred between 2.24 Mya (95% HPD, 1.14–3.4 Mya) and 0.75 Mya (95% HPD, 0.4–1.14 Mya). In addition, the divergence between the major lineages of N. franchetii and N. oviforme occurred between 1.3 Mya (95% HPD, 0.54–2.2 Mya) and 0.42 Mya (95% HPD, 0.18–0.73 Mya) (Figure 4).
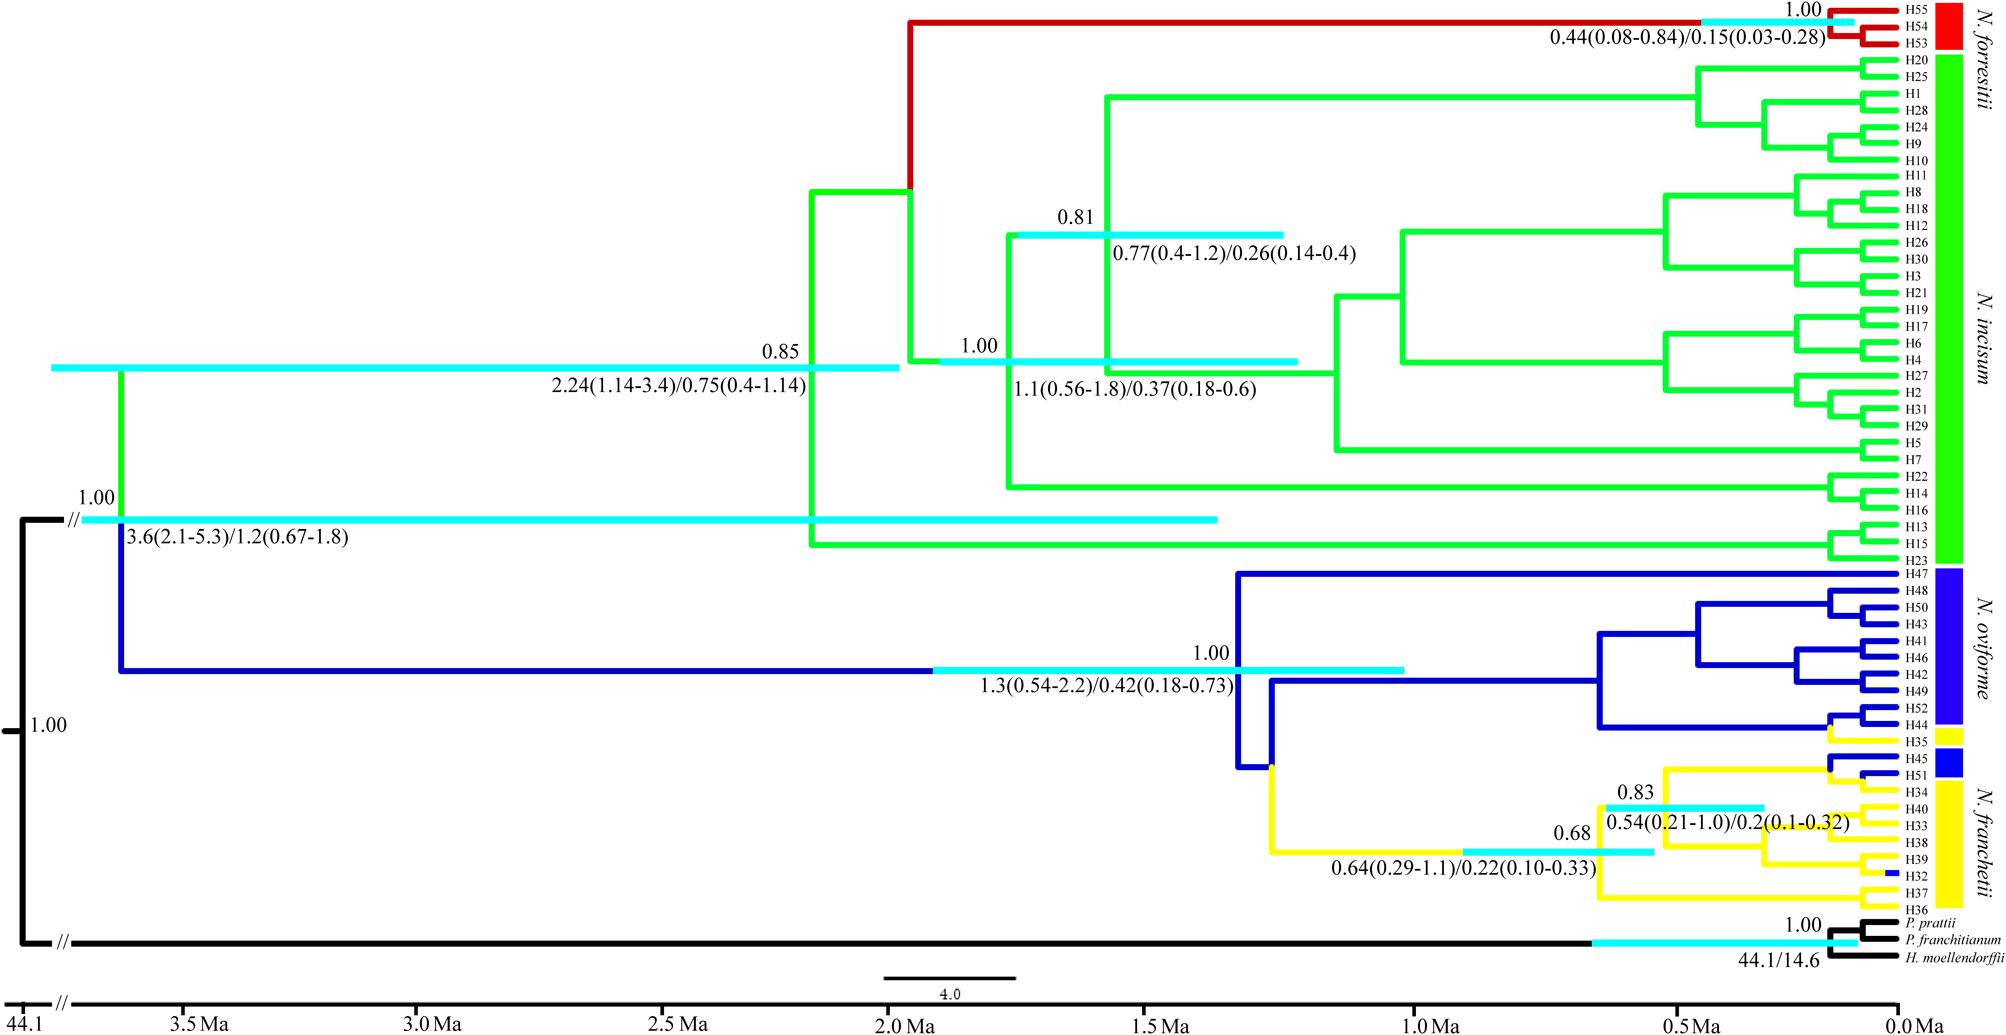
FIGURE 4. Chronogram for the four Notopterygium species obtained using BEAST based on the plastid sequences. The turquoise color bar indicates the 95% highest posterior density (HPD) credibility intervals for node ages (million years ago, Mya). Posterior probabilities are labeled above the line, and the mean divergence dates and 95% HPDs are labeled below the line.
Species Distribution Modeling
In this study, MaxEnt modeling had the highest predictive capacity (AUC > 0.9) for the two widely distributed Notopterygium species (N. franchetii and N. incisum). The distribution ranges predicted for these two species were consistent with the current geographic distributions in the QTP and adjacent areas (Figures 5, 6 and Supplementary Table S7). Species distribution modeling also showed that the range of N. incisum was limited in the LIG period whereas it expanded very rapidly in the LGM period. However, there were no significant changes in the distribution range from the LGM until the current period for this species. For N. franchetii, MaxEnt modeling suggested that the distribution range of this species increased very rapidly from the LIG until the LGM period. However, it was interesting that the distribution range of N. franchetii did not change greatly from the LGM until the current period.
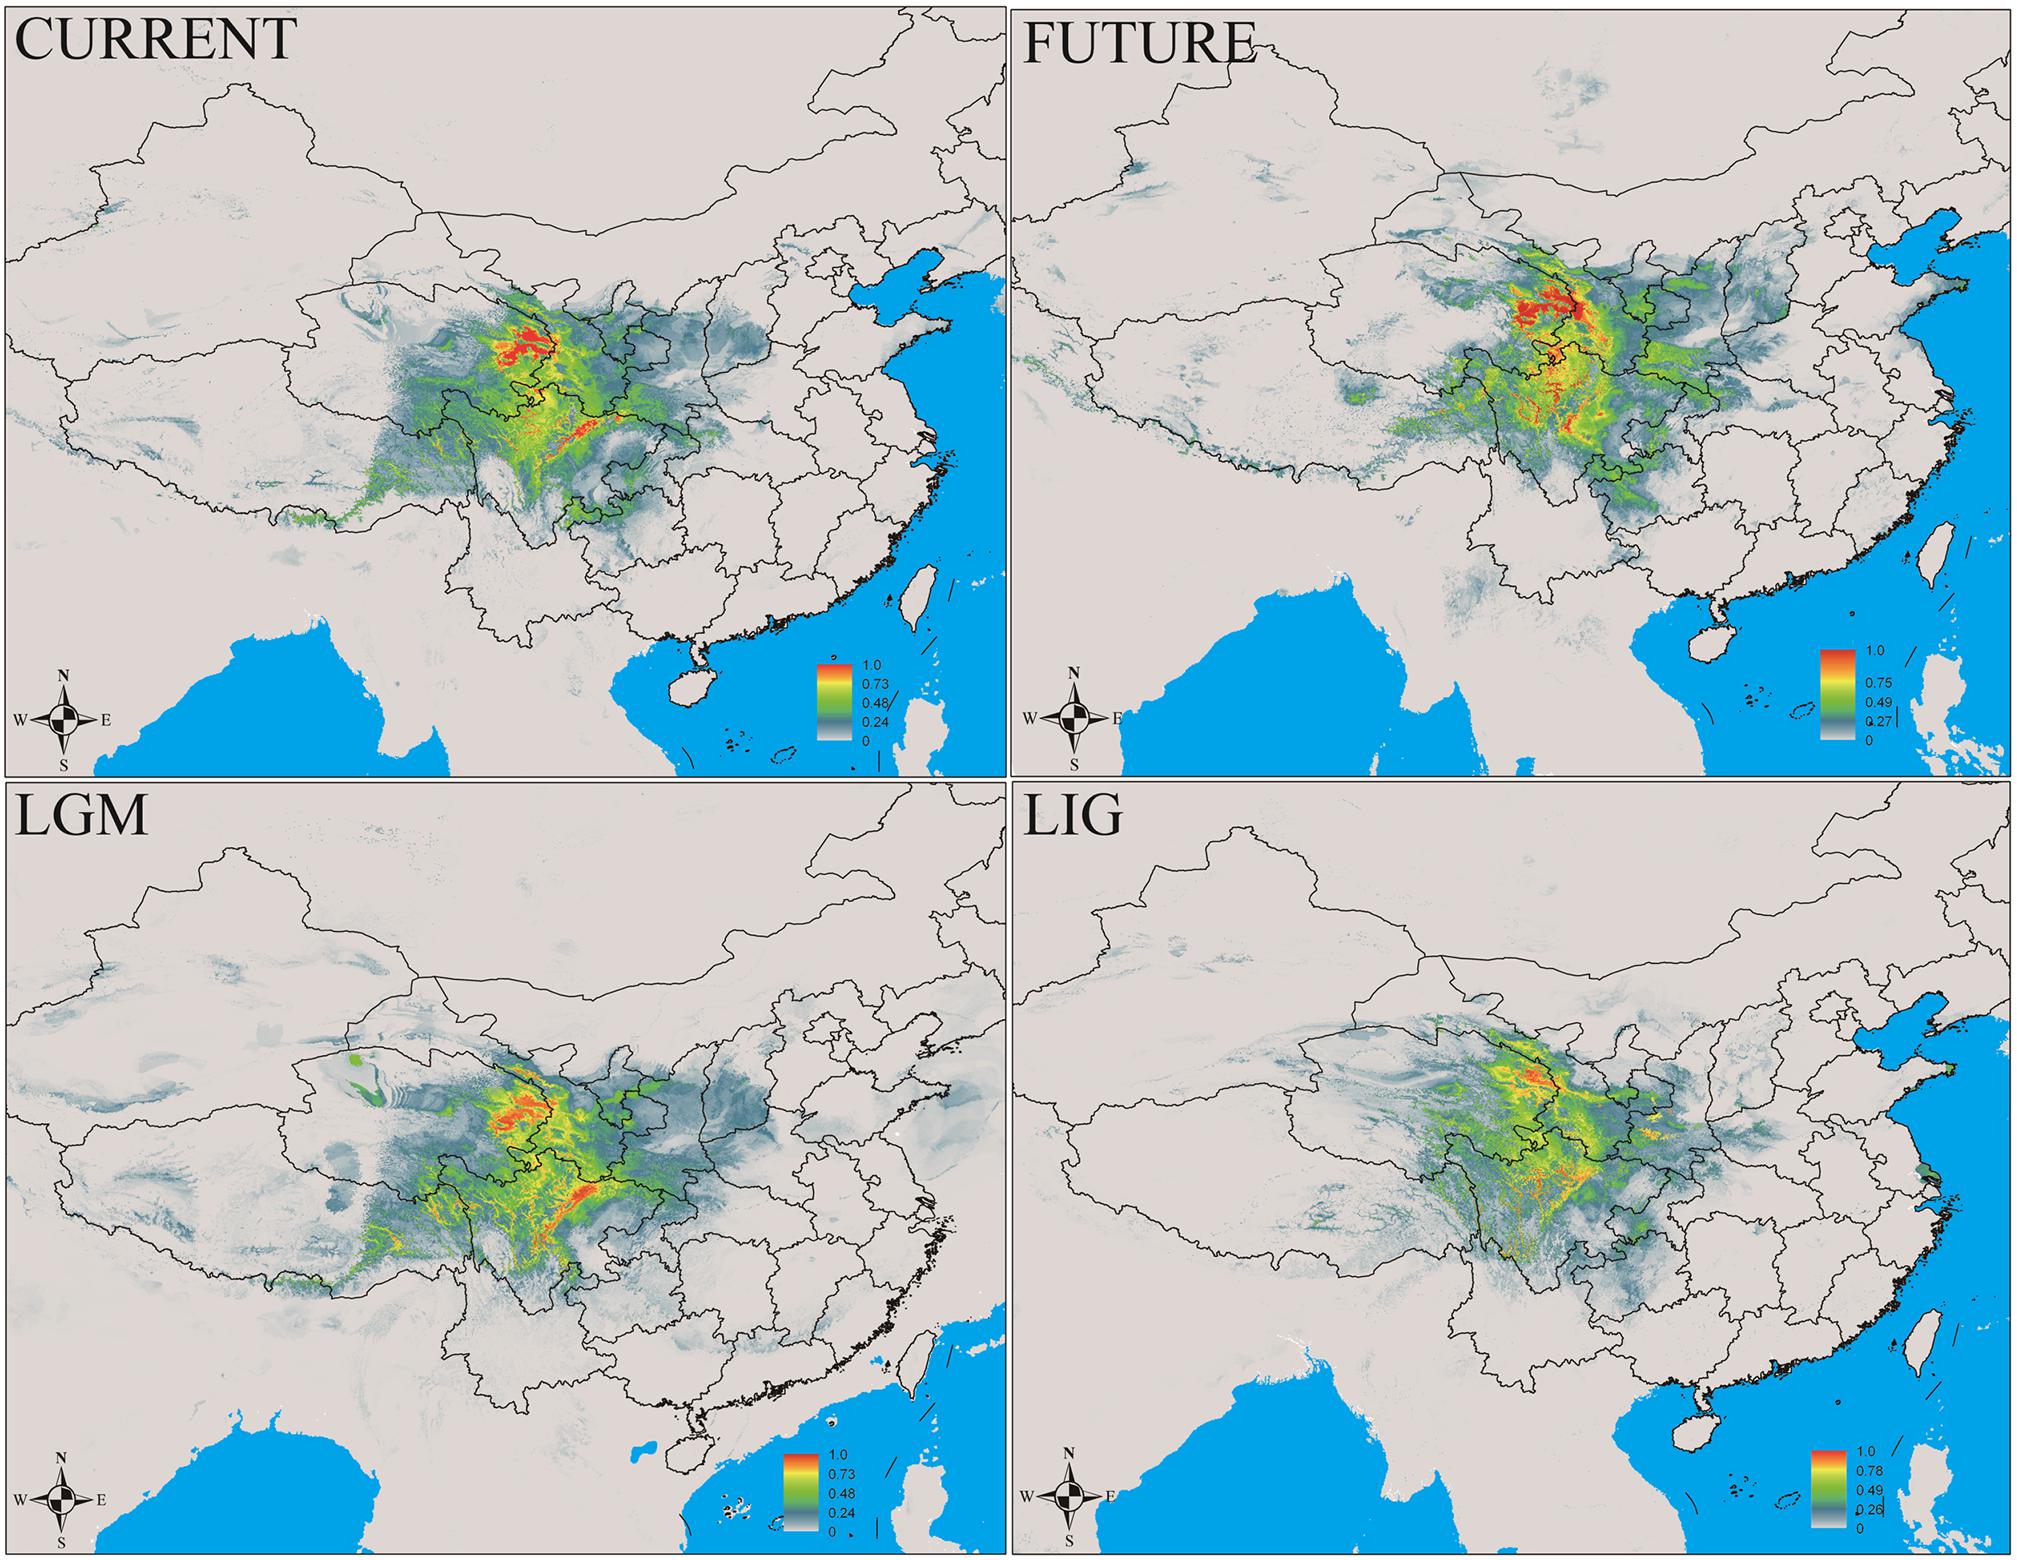
FIGURE 5. Geographic distribution pattern obtained for N. incisum using MaxEnt. LIG, last interglacial period; LGM, last glacial maximum.
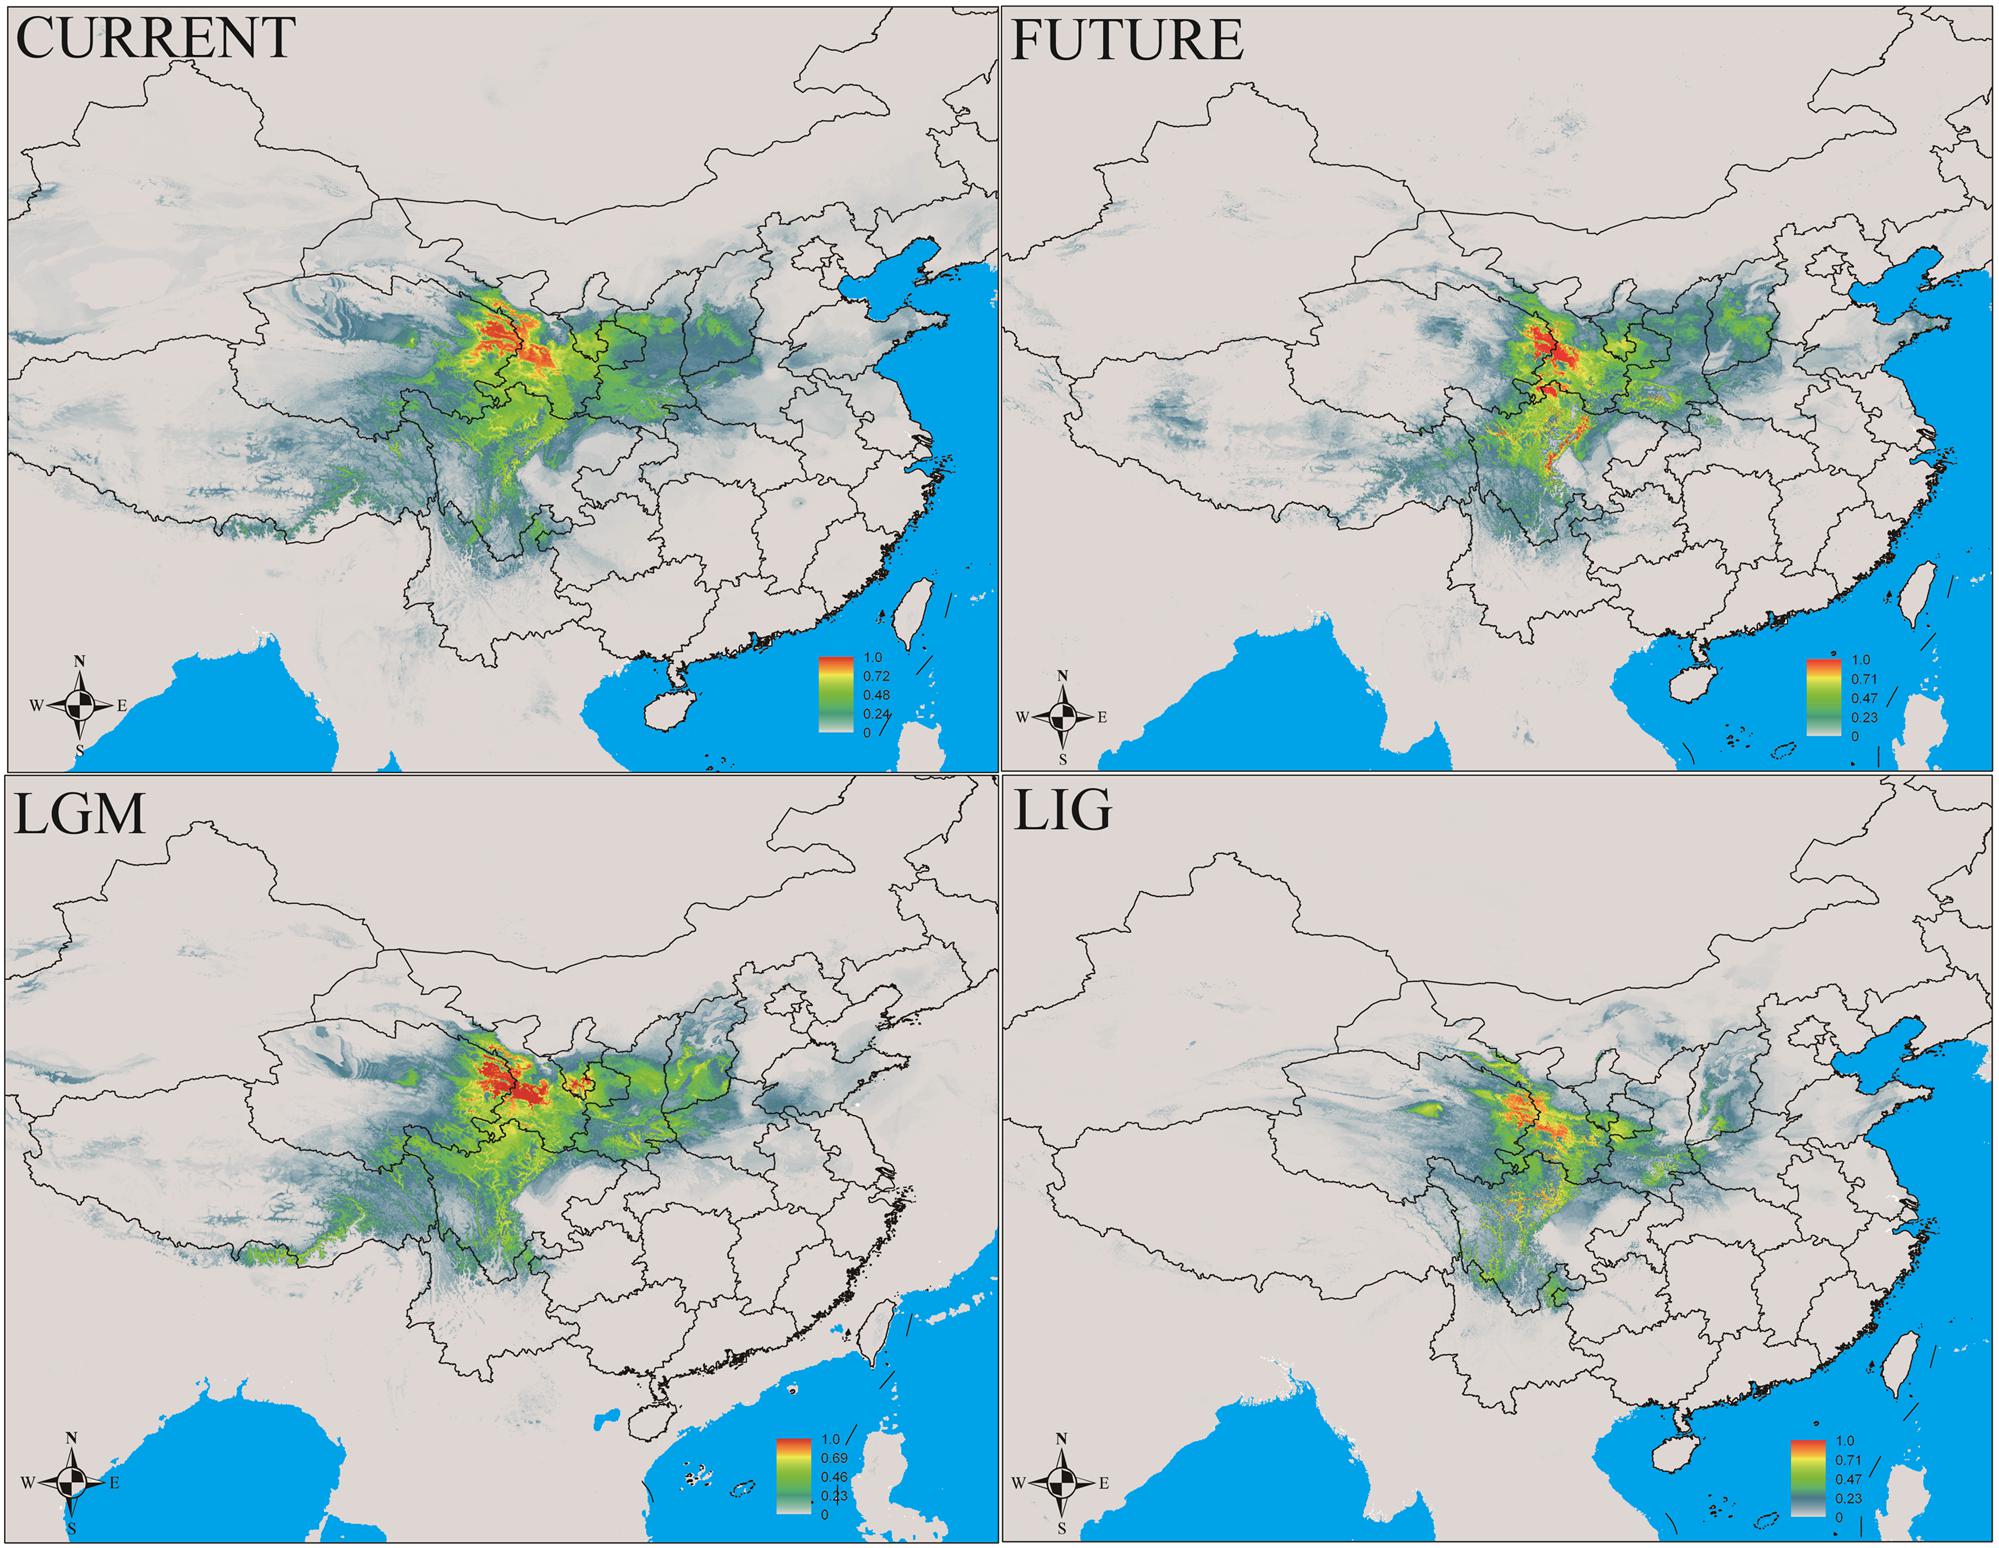
FIGURE 6. Geographic distribution pattern obtained for N. franchetii using MaxEnt. LIG, last interglacial period; LGM, last glacial maximum.
Discussion
Genetic Diversity and Structure
In the current study, our analysis of the cpDNA sequences showed that N. oviforme had the highest level of genetic diversity (Hd = 0.81, π = 0.0013), followed by N. incisum (Hd = 0.75, π = 0.00086) and N. forrestii (Hd = 0.39, π = 0.0002), whereas N. franchetii had the lowest level of diversity (Hd = 0.29, π = 0.00031) (Table 2). However, the results were different according to the ITS sequence analysis, where N. incisum had the highest diversity (Hd = 0.71, π = 0.0025), followed by N. oviforme (Hd = 0.69, π = 0.0024) and N. franchetii (Hd = 0.55, π = 0.0036), whereas N. forrestii exhibited no variation (Table 2). In addition, all four Notopterygium species had high levels of genetic differentiation, where the genetic variations in the cpDNA and ITS sequences mainly occurred among the populations within each species (Table 3 and Supplementary Tables S5, S6).
In general, N. franchetii has the most extensive natural geographic distribution range, but we found that its cpDNA and ITS sequences had low diversity. We consider that this low diversity may be due to harvesting and climatic changes, where many of the natural populations of N. franchetii have become extinct because of habitat destruction, thereby causing low diversity and high genetic differentiation (Lowe et al., 2005). N. incisum is another widely distributed species but we found that it had a high level of genetic diversity compared with other three species, which may be explained by the less extensive destruction of the wild populations of this species. According to the field investigations, we found that this species generally occurs in higher altitude areas (≥3000 m) compared with other Notopterygium species, and thus its less frequent harvesting might explain the high genetic variation (Wang G.N. et al., 2014). In addition, the high level of genetic diversity in N. oviforme according to this study might be explained by the lower altitude range of this species (1700–3200 m), which is consistent with a previous report of high species diversity at low altitudes (Lu et al., 2012). The lower genetic diversity of N. forrestii may be due to its narrow geographical distribution, where the smaller localized populations can interbreed and the gene flow is greater, thereby leading to a low level of diversity.
These Notopterygium species may also have been affected by adverse environmental changes in the high altitude QTP and adjacent areas. Thus, repeated climatic oscillations and geological events may have led to genetic drift and the fragmentation of habitats, thereby reducing their diversity (N. oviforme had slightly higher diversity compared with the other three species) and causing a high level of genetic differentiation among the populations of Notopterygium species (Hamrick and Loveless, 1989).
Relationships among Species
Phylogenetic analysis based on the cpDNA and ITS haplotypes showed that all four Notopterygium species formed a monophyletic clade with high bootstrap support (Figure 3 and Supplementary Figure S2). N. franchetii and N. oviforme shared a common branch in the phylogenetic tree based on the cpDNA sequences, and they also shared cpDNA haplotype H32. However, there were no shared ITS haplotypes among the four Notopterygium species, where each species formed an individual clade in the ITS tree. Thus, the ITS marker could identify the species at greater resolution than the cpDNA fragments. In general, cpDNA is a uniparentally inherited region whereas nuclear ITS fragments are biparentally inherited markers in most angiosperms, so ITS markers are superior for discriminating lineages and species than cpDNA fragments (Fan et al., 2011; Wang et al., 2012).
In addition, the shared cpDNA H32 haplotype was found in the parapatric populations (LF and YA) of N. franchetii and N. oviforme. These parapatric geographic distributions may have provided the opportunity for interspecific gene flow and hybridization among the two species. According to the field observations, we found that these two species have overlapping flowering times, which may have facilitated genetic introgression among these species. Previous studies have also suggested the occurrence of hybridization among species distributed in the same geographic regions and subsequent backcrosses with one of the parental species, where these processes resulted in high levels of shared plastid genotypes (Hamzeh et al., 2006; Li et al., 2013; Wang Z. et al., 2014). However, it is also possible that incomplete lineage sorting could have lead to the sharing of cpDNA haplotypes among species. The perennial herb Notopterygium species have large population sizes and long generation times, which may have led to the sharing of ancestral polymorphisms among species.
Species Divergence and Population Dynamics History
Mountain barriers may play a key role in speciation and diversification because their topographic complexity can lead to ecological stratification and environmental heterogeneity (Fjeldså et al., 2012). In the present study, we estimated the divergence time of the four Notopterygium species based on three cpDNA fragments, which showed that their divergence occurred between about 3.6 Mya (95% HPD, 2.1–5.3 Mya) and 1.2 Mya (95% HPD, 0.67–1.8 Mya) in the Pliocene and Pleistocene periods. The divergence of N. forrestii and N. incisum was estimated as occurring between 2.24 Mya (95% HPD, 1.14–3.4 Mya) and 0.75 Mya (95% HPD, 0.4–1.14 Mya) in the early to middle Pleistocene period (Figure 4). We suggest that the divergence of the four Notopterygium species was significantly related to the uplift of the QTP. Previous studies and geological data indicated that the uplift of the QTP started in the Oligocene to Miocene (25–17 Mya), middle of the Miocene (15–13 Mya), late Miocene (8–7 Mya), or in the Pliocene to early Pleistocene period (3.6–1.8 Mya) (Harrison et al., 1992; Coleman and Hodges, 1995; Shi et al., 1998; Spicer et al., 2003). During the uplift of the QTP and adjacent Himalayan mountains, long-term geological events generated great environmental differences, which might have triggered the diversification of species in the genus Notopterygium. Other studies have also shown that the recent extensive uplift of the QTP and adjacent mountains triggered the lineage divergence and evolution of many herb species due to geographical isolation and climatic changes (Lei et al., 2007, 2015).
In addition, dramatic variations in the environment and climate might have affected the genetic structure and geographic distributions of the Notopterygium species. MaxEnt modeling showed that the two cold-tolerant species comprising N. incisum and N. franchetii exhibited significant range expansions from the LIG to the LGM period (Figures 5, 6). The mismatch analysis, neutrality test, and population growth index results also supported similar expansions by these two species. Therefore, we estimated the expansion times for N. incisum and N. franchetii as about 128–43 and 51–17 Kya, respectively, during the late Pleistocene (Table 5). We showed that the geographic ranges of these two species increased significantly during the ice ages in the Pleistocene. Demographic expansions of cold-tolerant tree species during the glacial periods have also been reported in high altitude areas of the QTP (Qiu et al., 2011; Wen et al., 2014). Moreover, repeated founder and bottleneck effects during the expansion processes may explain the low genetic variation in the two species. By contrast, we found that the populations of N. incisum and N. franchetii had high levels of genetic diversity in the southeast part of the QTP. For example, some N. incisum populations in Qinghai (population G), Sichuan (populations J, Q, U, and X), and Gansu (population Z) had high diversity and many more unique haplotypes. The N. franchetii populations in Sichuan (populations KG and YF) and Gansu (populations KO and KZ) also had high genetic diversity and a rich abundance of haplotypes (Table 2). In addition, the LE population of N. oviforme and the LCA population of N. forrestii had high levels of haplotype diversity. These areas may have provided important glacial refugia for these endemic perennial herb species. Mountain areas at low latitudes can also provide relatively stable environmental conditions according to the “ecological stability hypothesis” (Qu et al., 2014; Lei et al., 2015), which implies that these populations should have high genetic diversity and a rich diversity of haplotypes (Tzedakis et al., 2002; Abbott and Brochmann, 2003; Petit et al., 2003; Schonswetter et al., 2005). Similar results have been obtained for other organisms, such as birds (Lei et al., 2007), mammals (Wu et al., 2005), spiders (Meng et al., 2008), and aphids (Huang et al., 2010).
Conservation Strategies for Endangered Notopterygium Species
The genus Notopterygium comprises unique perennial herbaceous plants with medicinal applications in China (Zhou et al., 2010). These species have high economic value so the market demand is great, especially for N. incisum and N. franchetii. However, in recent years, due to their continuous harvesting, slow growth rate, and low reproductive capacity, the natural populations of these Notopterygium species have been greatly depleted (Zhou et al., 2010). According to field investigations, we found that many of the previously recorded natural populations of species in the genus Notopterygium were extinct, and thus these important resources require urgent conservation and management.
According to the results of our population genetics analysis, we propose that the natural populations of wild Notopterygium species should be protected in situ, especially in the natural refugia areas (i.e., populations J, Q, U, and X of N. incisum; populations KO and KZ of N. franchetii; population LE of N. oviforme; and population LCA of N. forrestii). In addition, it is necessary to control all activities that deplete the sizes of the populations (e.g., illegal harvesting) and genetic fragmentations (e.g., habitat loss) (Hamilton et al., 2012).
In order to conserve the populations of a species, it is necessary to understand the genetic diversity and population structure of the natural populations (Schmitt, 2007). In this study, we found that the genetic variability and haplotype diversity were low for the widely distributed species, thereby indicating that the habitats have been destroyed or fragmented for these species, where interbreeding has occurred with nearby populations of individuals, thereby reducing the haplotype diversity. It is also necessary to protect the populations in different regions in order to increase the genetic links among populations. Finally, the mature seeds from each population should be collected and artificially planted with other populations in order to improve the habitats and to strengthen the gene exchange among populations (Cabrera-Toledo et al., 2012).
Author Contributions
Z-HL designed and conceived the study. KS and YJ performed the experiments. Z-HL, KS, YJ, F-LC, and UZ contributed materials/analysis tools. KS and Z-HL wrote the manuscript. KS, YJ, and Z-HL revised the manuscript. All of the authors finally approved the manuscript.
Conflict of Interest Statement
The authors declare that the research was conducted in the absence of any commercial or financial relationships that could be construed as a potential conflict of interest.
Acknowledgments
This study was supported by the National Natural Science Foundation of China (31470400) and by the Program for Changjiang Scholars and Innovative Research Team in University (PCSIRT, No. IRT_15R55).
Supplementary Material
The Supplementary Material for this article can be found online at: https://www.frontiersin.org/articles/10.3389/fpls.2017.01929/full#supplementary-material
Footnotes
References
Abbott, R. J., and Brochmann, C. (2003). History and evolution of the arctic flora: in the footsteps of Eric Hultén. Mol. Ecol. 12, 299–313. doi: 10.1046/j.1365-294X.2003.01731.x
Allen, G. A., Marr, K. L., McCormick, L. J., and Hebda, R. J. (2015). Geographical origins, migration patterns and refugia of Sibbaldia procumbens, an arctic-alpine plant with a fragmented range. J. Biogeogr. 42, 1665–1676. doi: 10.1111/jbi.12543
Anderson, L. L., Hu, F. S., Nelson, D. M., Petit, R. J., and Paige, K. N. (2006). Ice-age endurance: DNA evidence of a white spruce refugium in Alaska. Proc. Natl. Acad. Sci. U.S.A. 103, 12447–12450. doi: 10.1073/pnas.0605310103
Avise, J. C. (2009). Phylogeography: retrospect and prospect. J. Biogeogr. 36, 3–15. doi: 10.1111/j.1365-2699.2008.02032.x
Bader, E. (2005). ArcGIS 9: ArcGIS Server Administrator and Developer Guide. Redlands, CA: Esri Press.
Bai, W. N., Liao, W. J., and Zhang, D. Y. (2010). Nuclear and chloroplast DNA phylogeography reveal two refuge areas with asymmetrical gene flow in a temperate walnut tree from East Asia. New Phytol. 188, 892–901. doi: 10.1111/j.1469-8137.2010.03407.x
Birks, H. J. B., and Willis, K. J. (2008). Alpines, trees, and refugia in Europe. Plant Ecol. Divers. 1, 147–160. doi: 10.1080/17550870802349146
Cabrera-Toledo, D., González-Astorga, J., and Flores-Vázquez, J. C. (2012). Fine-scale spatial genetic structure in two Mexican Cycads species Dioon caputoi and Dioon merolae (Zamiaceae, Cycadales): implications for conservation. Biochem. Syst. Ecol. 40, 43–48. doi: 10.1016/j.bse.2011.09.004
Cavender-Bares, J., González-Rodríguez, A., Eaton, D. A., Hipp, A. A., Beulke, A., and Manos, P. S. (2015). Phylogeny and biogeography of the American live oaks (Quercus subsection Virentes): a genomic and population genetics approach. Mol. Ecol. 24, 3668–3687. doi: 10.1111/mec.13269
CBOL Plant Working Group (2009). A DNA barcode for land plants. Proc. Natl. Acad. Sci. U.S.A. 106, 12794–12797. doi: 10.1073/pnas.0905845106
Coleman, M., and Hodges, K. (1995). Evidence for Tibetan plateau uplift before 14 Myr ago from a new minimum age for east-west extension. Nature 374, 49–52. doi: 10.1073/pnas.0605310103
Doyle, J. J., and Doyle, J. L. (1987). A rapid DNA isolation procedure for small quantities of fresh leaf material. Phytochem. Bull. 19, 11–15.
Drummond, A. J., and Rambaut, A. (2007). BEAST: Bayesian evolutionary analysis by sampling Trees. BMC Evol. Biol. 7:214. doi: 10.1186/1471-2148-7-214
Excoffier, L., and Lischer, H. E. (2010). Arlequin suite v 3.5: a new series of programs to perform population genetics analyses under Linux and Windows. Mol. Ecol. Resour. 10, 564–567. doi: 10.1111/j.1755-0998.2010.02847.x
Fan, W. Y., Zhou, C. J., and Wang, Y. C. (2011). Confirmation of natural hybrids between two species of Nitraria in Inner Mongolia based on molecular evidence. Acta Bot. Boreali Occident. Sin. 5, 913–919.
Favre, A., Päckert, M., Pauls, S. U., Jähnig, S. C., Uhl, D., Michalak, I., et al. (2015). The role of the uplift of the Qinghai-Tibetan plateau for the evolution of Tibetan biotas. Biol. Rev. 90, 236–253. doi: 10.1111/brv.12107
Fawcett, T. (2006). An introduction to ROC analysis. Pattern Recogn. Lett. 27, 861–874. doi: 10.1016/j.patrec.2005.10.010
Fjeldså, J., Bowie, R. C. K., and Rahbek, C. (2012). The role of mountain ranges in the diversification of birds. Annu. Rev. Ecol. Evol. Syst. 43, 249–256. doi: 10.1146/annurev-ecolsys-102710-145113
Fu, Y. X. (1997). Statistical tests of neutrality of mutations against population growth, hitchhiking and background selection. Genetics 147, 915–925.
Fu, Y. X., and Li, W. H. (1993). Statistical tests of neutrality of mutations. Genetics 133, 693–709.
Gao, J., Wang, B., Mao, J. F., Ingvarsson, P., Zeng, Q. Y., and Wang, X. R. (2012). Demography and speciation history of the homoploid hybrid pine Pinus densata on the Tibetan Plateau. Mol. Ecol. 21, 4811–4827. doi: 10.1111/j.1365-294X.2012.05712.x
Grivet, D., and Petit, R. J. (2002). Phylogeography of the common ivy (Hedera sp.) in Europe: genetic differentiation through space and time. Mol. Ecol. 11, 1351–1362. doi: 10.1046/j.1365-294X.2002.01522.x
Guichoux, E., Garnier-Géré, P., Lagache, L., Lang, T., Boury, C., and Petit, R. J. (2013). Outlier loci highlight the direction of introgression in Oaks. Mol. Ecol. 22, 450–462. doi: 10.1111/mec.12125
Hall, T. A. (1999). BioEdit: a user-friendly biological sequence alignment editor and analysis program for Windows 95/98/NT. Nucleic Acids Symp. Ser. 41, 95–98.
Hamilton, A., Pei, S., Huai, H., and Anderson, S. (2012). Why and how to make plant conservation ecosystem-based. Sustain. Agric. Res. 1, 48–54. doi: 10.5539/sar.v1n1p48
Hamrick, J. L., and Loveless, M. D. (1989). “The genetic structure of tropical tree populations: associations with reproductive biology,” in The Evolutionary Ecology of Plants, eds J. Bock and Y. B. Linhart (Boulder, CO: Westview Press), 129–146.
Hamzeh, M., Périnet, P., and Dayanandan, S. (2006). Genetic relationships among species of Populus (Salicaceae) based on nuclear genomic data 1. J. Torrey Bot. Soc. 133, 519–527. doi: 10.3159/1095-5674(2006)133[519:GRASOP]2.0.CO;2
Harpending, H. C. (1994). Signature of ancient population growth in a low-resolution mitochondrial DNA mismatch distribution. Hum. Biol. 66, 591–600.
Harrison, T. M., Copeland, P., Kidd, W. S. F., and Yin, A. (1992). Raising Tibet. Science 255, 1663–1670. doi: 10.1126/science.255.5052.1663
Hewitt, G. (2004). Genetic consequences of climatic oscillations in the Quaternary. Philos. Trans. R. Soc. Lond. Biol. Sci. 359, 183–195. doi: 10.1098/rstb.2003.1388
Hickerson, M. J., Carstens, B. C., Cavender-Bares, J., Crandall, K. A., Graham, C. H., Johnson, J. B., et al. (2010). Phylogeography’s past, present, and future: 10 years after. Mol. Phylogenet. Evol. 54, 291–301. doi: 10.1016/j.ympev.2009.09.016
Huang, X. L., Qiao, G. X., and Lei, F. M. (2010). Use of parsimony analysis to identify areas of endemism of Chinese birds: implications for conservation and biogeography. Int. J. Mol. Sci. 11, 2097–2108. doi: 10.3390/ijms11052097
Huelsenbeck, J. P., and Ronquist, F. (2001). MRBAYES: Bayesian inference of phylogenetic tree. Bioinformatics 17, 754–755. doi: 10.1093/bioinformatics/17.8.754
Hughes, C. E., and Atchison, G. W. (2015). The ubiquity of alpine plant radiations: from the Andes to the Hengduan Mountains. New Phytol. 207, 275–282. doi: 10.1111/nph.13230
Ickert-Bond, S. M., and Renner, S. S. (2016). The Gnetales: recent insights on their morphology, reproductive biology, chromosome numbers, biogeography, and divergence times. J. Syst. Evol. 54, 1–16. doi: 10.1111/jse.12190
Jia, D. R., Abbott, R. J., Liu, T. L., Mao, K. S., Bartish, I. V., and Liu, J. Q. (2012). Out of the Qinghai-Tibet Plateau: evidence for the origin and dispersal of Eurasian temperate plants from a phylogeographic study of Hippophaë rhamnoides (Elaeagnaceae). New Phytol. 194, 1123–1133. doi: 10.1111/j.1469-8137.2012.04115.x
Jia, Y., Liu, M. L., Yue, M., Zhao, Z., Zhao, G. F., and Li, Z. H. (2017). Comparative transcriptome analysis reveals adaptive evolution of Notopterygium incisum and Notopterygium franchetii, two high-alpine herbal species endemic to China. Molecules 22:1158. doi: 10.3390/molecules22071158
Jiang, S. Y., Sun, H., Huang, X. J., Zhou, Y., Ma, X. J., and Yang, Z. R. (2005). Environmental pedology of Notopterygium incisum and N. forbesii. Chin. Tradit. Herb. Drugs 36, 918–921.
Keppel, G., Van Niel, K. P., Wardell-Johnson, G. W., Yates, C. J., Byrne, M., Mucina, L., et al. (2012). Refugia: identifying and understanding safe havens for biodiversity under climate change. Glob. Ecol. Biogeogr. 21, 393–404. doi: 10.1111/j.1466-8238.2011.00686.x
Kuhner, M. K. (2006). LAMARC 2.0: maximum likelihood and Bayesian estimation of population parameters. Bioinformatics 22, 768–770. doi: 10.1093/bioinformatics/btk051
Lei, F. M., Qu, Y. H., Song, G., Alström, P., and Fjeldså, J. (2015). The potential drivers in forming avian biodiversity hotpots in the east Himalaya-Mountains of southwest China. Integr. Zool. 10, 171–181. doi: 10.1111/1749-4877.12121
Lei, F. M., Wei, G. A., Zhao, H. F., Yin, Z. H., and Lu, J. L. (2007). China subregional avian endemism and biodiversity conservation. Biodivers. Conserv. 16, 1119–1130. doi: 10.1007/s10531-006-9080-3
Li, J. J., and Fang, X. M. (1999). Uplift of the Tibetan Plateau and environmental changes. China Sci. Bull. 44, 2117–2124. doi: 10.1007/BF03182692
Li, L., Abbott, R. J., Liu, B., Sun, Y., Li, L., Zou, J. B., et al. (2013). Pliocene intraspecific divergence and Plio-Pleistocene range expansions within Picea likiangensis (Lijiang spruce), a dominant forest tree of the Qinghai-Tibet Plateau. Mol. Ecol. 22, 5237–5255. doi: 10.1111/mec.12466
Liao, Y. Y., Gichira, A. W., Wang, Q. F., and Chen, J. M. (2015). Molecular phylogeography of four endemic Sagittaria species (Alismataceae) in the Sino Japanese Floristic Region of East Asia. Bot. J. Linn. Soc. 180, 6–20. doi: 10.1111/boj.12351
Librado, P., and Rozas, J. (2009). DnaSPv5: a software for comprehensive analysis of DNA polymorphism data. Bioinformatics 25, 1451–1452. doi: 10.1093/bioinformatics/btp187
Liu, J., M€oller, M., Provan, J., Gao, L. M., Poudel, R. C., and Li, D. Z. (2013). Geological and ecological factors drive cryptic speciation of yews in a biodiversity hotspot. New Phytol. 199, 1093–1108. doi: 10.1111/nph.12336
Liu, J. Q., Sun, Y. S., Ge, X. J., Gao, L. M., and Qiu, Y. X. (2012). Phylogeographic studies of plants in China: advances in the past and directions in the future. J. Syst. Evol. 50, 267–275. doi: 10.1111/j.1759-6831.2012.00214.x
Liu, J. Q., Wang, Y. J., Wang, A. L., Hideaki, O., and Abbott, R. J. (2006). Radiation and diversification within the Ligularia-Cremanthodium-Parasenecio complex (Asteraceae) triggered by uplift of the Qinghai-Tibetan Plateau. Mol. Phylogenet. Evol. 38, 31–49. doi: 10.1016/j.ympev.2005.09.010
Lowe, A. J., Boshier, D., Ward, M., Bacles, C. F., and Navarro, C. (2005). Genetic resource impacts of habitat loss and degradation; reconciling empirical evidence and predicted theory for neotropical trees. Heredity 95, 255–273. doi: 10.1038/sj.hdy.6800725
Lu, B., Zheng, Y., Murphy, R. W., and Zeng, X. (2012). Coalescence patterns of endemic Tibetan species of stream salamanders (Hynobiidae: Batrachuperus). Mol. Ecol. 21, 3308–3324. doi: 10.1111/j.1365-294X.2012.05606.x
Mao, K. S., Hao, G., Liu, J. Q., Adams, R. P., and Milne, R. I. (2010). Diversification and biogeography of Juniperus (Cupressaceae): variable diversification rates and multiple intercontinental dispersals. New Phytol. 188, 254–272. doi: 10.1111/j.1469-8137.2010.03351.x
McLachlan, J. S., Clark, J. S., and Manos, P. S. (2005). Molecular indicators of tree migration capacity under rapid climate change. Ecology 86, 2088–2098. doi: 10.1890/04-1036
Meng, K., Li, S. Q., and Murphy, R. W. (2008). Biogeographical patterns of Chinese spiders (Arachnida: Araneae) based on a parsimony analysis of endemicity. J. Biogeogr. 35, 1241–1249. doi: 10.1111/j.1365-2699.2007.01843.x
Mittermeier, R. A., Gil, P. R., Hoffman, M., Pilgrim, J., Brooks, T., Mittermeier, C. G., et al. (2005). Hotspots Revisited: Earth’s Biologically Richest and Most Endangered Terrestrial Ecoregions. Chicago, IL: University of Chicago Press.
Nei, M., and Li, W. H. (1979). Mathematical model for studying genetic variation in terms of restriction endonucleases. Proc. Natl. Acad. Sci. U.S.A. 76, 5269–5273. doi: 10.1073/pnas.76.10.5269
Nei, M., and Tajima, F. (1981). DNA polymorphism detectable by restriction endonucleases. Genetics 97, 145–163.
Nybom, H. (2004). Comparison of different nuclear DNA markers for estimating intraspecific genetic diversity in plants. Mol. Ecol. 13, 1143–1155. doi: 10.1111/j.1365-294X.2004.02141.x
Ohsawa, T., and Ide, Y. (2008). Global patterns of genetic variation in plant species along vertical and horizontal gradients on mountains. Glob. Ecol. Biogeogr. 17, 152–163. doi: 10.1111/j.1466-8238.2007.00357.x
Opgenoorth, L., Vendramin, G. G., Mao, K., Miehe, G., Miehe, S., Liepelt, S., et al. (2010). Tree endurance on the Tibetan Plateau marks the world’s highest known tree line of the Last Glacial Maximum. New Phytol. 185, 332–342. doi: 10.1111/j.1469-8137.2009.03007.x
Ortego, J., Noguerales, V., Gugger, P. F., and Sork, V. L. (2015). Evolutionary and demographic history of the Californian scrub white Oak species complex: an integrative approach. Mol. Ecol. 24, 6188–6208. doi: 10.1111/mec.13457
Ortego, J., Riordan, E. C., Gugger, P. F., and Sork, V. L. (2012). Influence of environmental heterogeneity on genetic diversity and structure in an endemic southern Californian Oak. Mol. Ecol. 21, 3210–3223. doi: 10.1111/j.1365-294X.2012.05591.x
Parducci, L., Jørgensen, T., Tollefsrud, M. M., Elverland, E., Alm, T., Fontana, S. L., et al. (2012). Glacial survival of boreal trees in northern Scandinavia. Science 335, 1083–1086. doi: 10.1126/science.1216043
Petit, R. J., Aguinagalde, I., de Beaulieu, J. L., Bittkau, C., Brewer, S., Cheddadi, R., et al. (2003). Glacial refugia: hotspots but not melting pots of genetic diversity. Science 300, 1563–1565. doi: 10.1126/science.1083264
Phillips, S. J., Anderson, R. P., and Schapire, R. E. (2006). Maximum entropy modeling of species geographic distributions. Ecol. Model. 190, 231–259. doi: 10.1016/j.ecolmodel.2005.03.026
Phillips, S. J., and Dudík, M. (2008). Modeling of species distributions with Maxent: new extensions and a comprehensive evaluation. Ecography 31, 161–175. doi: 10.1111/j.0906-7590.2008.5203.x
Polzin, T., and Daneshmand, S. V. (2003). On Steiner trees and minimum spanning trees in hypergraphs. Oper. Res. Lett. 31, 12–20. doi: 10.1016/S0167-6377(02)00185-2
Posada, D., and Crandall, K. A. (1998). Modeltest: testing the model of DNA substitution. Bioinformatics 14, 817–818. doi: 10.1093/bioinformatics/14.9.817
Provan, J., and Bennett, K. D. (2008). Phylogeographic insights into cryptic glacial refugia. Trends Ecol. Evol. 23, 564–571. doi: 10.1016/j.tree.2008.06.010
Pu, F., Wang, P., Zheng, Z., and Wang, Y. P. (2000). A reclassification of Notopterygium boissieu (Umbelliferae). Acta Phytotaxon. Sin. 38, 430–436.
Qiu, Y. X., Fu, C. X., and Comes, H. P. (2011). Plant molecular phylogeography in China and adjacent regions: tracing the genetic imprints of Quaternary climate and environmental change in the world’s most diverse temperate flora. Mol. Phylogenet. Evol. 59, 225–244. doi: 10.1016/j.ympev.2011.01.012
Qu, Y. H., Ericson, P. G., Quan, Q., Song, G., Zhang, R. Y., Gao, B., et al. (2014). Long-term isolation and stability explain high genetic diversity in the Eastern Himalaya. Mol. Ecol. 23, 705–720. doi: 10.1111/mec.12619
Rambaut, A. (2009). FigTree v.1.3.1. Available at: http://tree.bio.ed.ac.uk/software/figtree/
Rogers, A. R., and Harpending, H. (1992). Population growth makes waves in the distribution of pairwise genetic differences. Mol. Biol. Evol. 9, 552–569.
Schmitt, T. (2007). Molecular biogeography of Europe: Pleistocene cycles and postglacial trends. Front. Zool. 4:11. doi: 10.1186/1742-9994-4-11
Schneider, S., and Excoffier, L. (1999). Estimation of past demographic parameters from the distribution of pairwise differences when the mutation rates vary among sites: application to human mitochondrial DNA. Genetics 152, 1079–1089.
Schonswetter, P., Stehlik, I., Holderegger, R., and Tribsch, A. (2005). Molecular evidence for glacial refugia of mountain plants in the European Alps. Mol. Ecol. 14, 3547–3555. doi: 10.1111/j.1365-294X.2005.02683.x
She, M., and Pu, F. (1996). A new species of Notopterygium de Boiss. from China. J. Plant Resour. Environ. 6, 41–42.
Shi, Y. F., Li, J. J., and Li, B. Y. (1998). Uplift and Environmental Changes on Qinghai-Xizang (Tibetan) Plateau in the Late Cenozoic. Guangzhou: Guangdong Science and Technology Press, 1–289.
Soltis, D. E., Morris, A. B., McLachlan, J. S., Manos, P. S., and Soltis, P. S. (2006). Comparative phylogeography of unglaciated eastern North America. Mol. Ecol. 15, 4261–4293. doi: 10.1111/j.1365-294X.2006.03061.x
Soumaya, R. C., Sarra, C., Salwa, Z. A., Khaled, C., and Khaled, S. (2014). Molecular polymorphism and phylogenetic relationships within Tunisian date palm (Phoenix dactylifera L.): evidence of non-coding trnL-trnF regions of chloroplast DNAs. Sci. Hortic. 170, 32–38. doi: 10.1016/j.scienta.2014.02.027
Spicer, R. A., Harris, N. B. W., Widdowson, M., Herman, A. B., Guo, S., Valdes, P. J., et al. (2003). Constant elevation of southern Tibet over the past 15 million years. Nature 421, 622–624. doi: 10.1038/nature01356
Stewart, J. R., Lister, A. M., Barnes, I., and Dalén, L. (2010). Refugia revisited: individualistic responses of species in space and time. Proc. Biol. Sci. 277, 661–671. doi: 10.1098/rspb.2009.1272
Stewart, J. R., and Stringer, C. B. (2012). Human evolution out of Africa: the role of refugia and climate change. Science 335, 1317–1321. doi: 10.1126/science.1215627
Sudhir, K., Masatoshi, N., Joel, D., and Tamura, K. (2008). MEGA: a biologist-centric software for evolutionary analysis of DNA and protein sequence. Brief. Bioinform. 9, 299–306. doi: 10.1093/bib/bbn017
Sun, Y., Abbott, R. J., Li, L., Li, L., Zhou, J. B., and Liu, J. Q. (2014). Evolutionary history of Purple cone spruce (Picea purpurea) in the Qinghai-Tibet Plateau: homoploid hybrid origin and Pleistocene expansion. Mol. Ecol. 23, 343–359. doi: 10.1111/mec.12599
Tajima, F. (1989). Statistical method for testing the neutral mutation hypothesis by DNA polymorphism. Genetics 123, 585–595.
Tian, X. M., Luo, J., Wang, A. L., Mao, K. S., and Liu, J. Q. (2011). On the origin of the woody buckwheat Fagopyrum tibeticum (Parapteropyrum tibeticum) in the Qinghai-Tibetan Plateau. Mol. Phylogenet. Evol. 61, 515–520. doi: 10.1016/j.ympev.2011.07.001
Tzedakis, P. C., Frogley, M. R., and Heaton, T. H. E. (2002). Duration of last interglacial conditions in northwestern Greece. Quat. Res. 58, 53–55. doi: 10.1006/qres.2002.2328
Wang, G. N., He, X. Y., Miehe, G., and Mao, K. S. (2014). Phylogeography of the Qinghai-Tibet Plateau endemic alpine herb Pomatosace filicula (Primulaceae). J. Syst. Evol. 52, 289–302. doi: 10.1111/jse.12089
Wang, H., Qiong, L. A., Sun, K., Lu, F., Wang, Y., Song, Z. P., et al. (2010). Phylogeographic structure of Hippophae tibetana (Elaeagnaceae) highlights the highest microrefugia and the rapid uplift of the Qinghai-Tibetan Plateau. Mol. Ecol. 19, 2964–2979. doi: 10.1111/j.1365-294X.2010.04729.x
Wang, S. X., Li, Q. H., Xu, J., Gao, T. T., and Xin, Z. M. (2012). Experimental research on the pollination characteristics of 4 plant species of genus Nitraria L. J. Biol. 29, 49–51.
Wang, Y. J., Susanna, A., Von Raab-Straube, E., Milne, R., and Liu, J. Q. (2009). Island-like radiation of Saussurea (Asteraceae: Cardueae) triggered by uplifts of the Qinghai-Tibetan Plateau. Biol. J. Linn. Soc. 97, 893–903. doi: 10.1111/j.1095-8312.2009.01225.x
Wang, Y. P., Pu, F., Wang, P., and He, X. J. (1996). Studies on the systematics of the Chinese endemic genus Notopterygium. Acta Bot. Yunnanica 18, 424–430.
Wang, Z., Du, S., Dayanandan, S., Wang, D., Zeng, Y., and Zhang, J. (2014). Phylogeny reconstruction and hybrid analysis of Populus (Salicaceae) based on nucleotide sequences of multiple single-copy nuclear genes and plastid fragments. PLOS ONE 9:e103645. doi: 10.1371/journal.pone.0103645
Wang, Z. W., Chen, S. T., Nie, Z. L., Zhang, J. W., Zhou, Z., Deng, T., et al. (2015). Climatic factors drive population divergence and demography: insights based on the phylogeography of a riparian plant species endemic to the Hengduan Mountains and adjacent regions. PLOS ONE 10:e0145014. doi: 10.1371/journal.pone.0145014
Wen, J., Zhang, J. Q., Nie, Z. L., Zhong, Y., and Sun, H. (2014). Evolutionary diversifications of plants on the Qinghai-Tibetan Plateau. Front. Genet. 5:4. doi: 10.3389/fgene.2014.00004
Wolfe, K. H., Li, W. H., and Sharp, P. M. (1987). Rates of nucleotide substitution vary greatly among plant mitochondrial, chloroplast, and nuclear DNAs. Proc. Natl. Acad. Sci. U.S.A. 84, 9054–9058. doi: 10.1073/pnas.84.24.9054
Wu, Z. Y., Raven, P. H., and Hong, D. Y. (eds). (2005). “Apiaceae through Ericaceae,” in Flora of China (Beijing: Science Press).
Xu, J., Deng, M., Jiang, X. L., Westwood, M., Song, Y. G., and Turkington, R. (2015). Phylogeography of Quercus glauca (Fagaceae), a dominant tree of East Asian subtropical evergreen forests, based on three chloroplast DNA interspace sequences. Tree Genet. Genomes 11:805. doi: 10.1007/s11295-014-0805-2
Xu, T. T., Abbott, R. J., Milne, R. I., Mao, K. S., Du, F. K., Wu, G. L., et al. (2010). Phylogeography and allopatric divergence of Cypress species (Cupressus L.) in the Qinghai-Tibetan Plateau and adjacent regions. BMC Evol. Biol. 10:194. doi: 10.1186/1471-2148-10-194
Yang, J., Yue, M., Niu, C., Ma, X. F., and Li, Z. H. (2017). Comparative analysis of the complete chloroplast genome of four endangered herbals of Notopterygium. Genes 8:E124. doi: 10.3390/genes8040124
Zhang, D. F., Fengquan, L., and Jianmin, B. (2000). Eco-environmental effects of the Qinghai-Tibet Plateau uplift during the Quaternary in China. Environ. Geol. 39, 1352–1358. doi: 10.1016/j.ympev.2015.10.002
Zhang, X. W., Li, Y., Liu, C. Y., Xia, T., Zhang, Q., and Fang, Y. M. (2015). Phylogeography of the temperate tree species Quercus acutissima in China: inferences from chloroplast DNA variations. Biochem. Syst. Ecol. 63, 190–197. doi: 10.1016/j.bse.2015.10.010
Zhou, G., Yang, L., Li, C., Xu, W., and Chen, G. (2010). Genetic diversity in endangered Notopterygium forbesii Boissieu based on intraspecies sequence variation of chloroplast DNA and implications for conservation. Biochem. Syst. Ecol. 38, 911–916. doi: 10.1016/j.bse.2010.09.012
Keywords: conservation, genetic structure, Notopterygium, phylogeography, Qinghai–Tibetan Plateau (QTP), species divergence
Citation: Shahzad K, Jia Y, Chen F-L, Zeb U and Li Z-H (2017) Effects of Mountain Uplift and Climatic Oscillations on Phylogeography and Species Divergence in Four Endangered Notopterygium Herbs. Front. Plant Sci. 8:1929. doi: 10.3389/fpls.2017.01929
Received: 04 August 2017; Accepted: 25 October 2017;
Published: 08 November 2017.
Edited by:
Renchao Zhou, Sun Yat-sen University, ChinaCopyright © 2017 Shahzad, Jia, Chen, Zeb and Li. This is an open-access article distributed under the terms of the Creative Commons Attribution License (CC BY). The use, distribution or reproduction in other forums is permitted, provided the original author(s) or licensor are credited and that the original publication in this journal is cited, in accordance with accepted academic practice. No use, distribution or reproduction is permitted which does not comply with these terms.
*Correspondence: Zhong-Hu Li, bGl6aG9uZ2h1QG53dS5lZHUuY24=
†These authors have contributed equally to this work.