 Hui Wei
 Chen Xu
 Ali Movahedi
 Weibo Sun1†
 Dawei Li
 Qiang Zhuge
- 1Co-Innovation Center for Sustainable Forestry in Southern China, Key Laboratory of Forest Genetics & Biotechnology, Ministry of Education, College of Biology and the Environment, Nanjing Forestry University, Nanjing, China
- 2Jiangsu Provincial Key Construction Laboratory of Special Biomass Resource Utilization, Nanjing Xiaozhuang University, Nanjing, China
In the mevalonic acid (MVA) pathway, 3-hydroxy-3-methylglutaryl-CoA reductase (HMGR) is considered the first rate-limiting enzyme in isoprenoid biosynthesis. In this study, we cloned a full-length cDNA from Populus trichocarpa with an open reading frame of 1,734 bp. The deduced PtHMGR sequence contained two HMG-CoA motifs and two NADPH motifs, which exhibited homology with HMGR proteins from other species. Subsequently, truncated PtHMGR was expressed in Escherichia coli BL21 (DE3) cells, and enzyme activity analysis revealed that the truncated PtHMGR protein could catalyze the reaction of HMG-CoA and NADPH to form MVA. Relative expression analysis suggests that PtHMGR expression varies among tissues and that PtHMGR responds significantly to abscisic acid (ABA), NaCl, PEG6000, hydrogen peroxide (H2O2), and cold stresses. We used polymerase chain reaction (PCR) analysis to select transgenic Nanlin 895 poplars (Populus× euramericana cv.) and quantitative reverse-transcription PCR (qRT-PCR) to show that PtHMGR expression levels were 3- to 10-fold higher in transgenic lines than in wild-type (WT) poplars. qRT-PCR was also used to determine transcript levels of methylerythritol phosphate (MEP)-, MVA-, and downstream-related genes, indicating that overexpression of PtHMGR not only affects expression levels of MVA-related genes, but also those of MEP-related genes. We also measured the content of terpenoids including ABA, gibberellic acid (GA), carotenes, and lycopene. PtHMGR overexpression significantly increased ABA, GA, carotene, and lycopene content, indicating that PtHMGR participates in the regulation of terpenoid compound synthesis.
Introduction
Isoprenoids (or terpenoids) represent a large and diverse group of primary and secondary metabolites present in all living organisms. For example, sterols are essential primary isoprenoids that are the main components of biomembranes. Chlorophylls and carotenoids are important photosynthetic pigments. Several isoprenoid-derived plant hormones regulate plant growth, development, and defense against biotic and abiotic stresses (Bouvier et al., 2005; Kirby and Keasling, 2009). As important biological compounds, isoprenoids participate in an array of specialized biological processes of fundamental adaptive or regulatory importance at the levels of individual cells, tissues, and whole organisms (Eisenreich et al., 2001; Grassmann et al., 2002). Isoprenoids originate from isopentenyl diphosphate (IPP) and dimethylallyl diphosphate (DMAPP), and include carotenoids, phytoalexins, phytosterols, specific terpenoids, growth hormones, and polyprenols such as dolichols (oxidized derivatives of polyprenols of a certain chain length), quinones, and isoprenoid conjugates of proteins (Hunter, 2007; Suzuki and Muranaka, 2007; Cao et al., 2010). Previous studies have identified two distinct isoprenoid biosynthesis pathways in plants. The methylerythritol phosphate (MEP) pathway in the chloroplast is primarily responsible for producing monoterpenoids, diterpenoids, essential photosynthesis pigments (carotenoids and chlorophylls), and plastidial quinones, whereas the mevalonic acid (MVA) pathway in the cytosol is responsible for synthesis of sesquiterpenoids, sterols, and secondary triterpenes. (Leivar et al., 2011; Yang et al., 2012). The synthesis of IPP and its allylic isomer DMAPP is the first step in both the MVA and MEP pathways. 3-Hydroxy-3-methylglutaryl-CoA reductase (HMGR) catalyzes the conversion of one molecule of 3-hydroxy-3-methylglutary-CoA (HMG-CoA) and two molecules of triphosphopyridine nucleotide (NADPH) into MVA (Maurey et al., 1986). Because HMGR activity is highly regulated, HMGR is considered the rate-limiting enzyme in the upstream biosynthetic pathway of hemiterpenes and triterpenes (Heuston et al., 2012). In the MEP pathway, 1-deoxy-D-xylulose5-phosphate synthase (DXS) catalyzes the conversion of pyruvate and D-glyceraldehyde3-phosphate (D-3-P) into 1-deoxy-D-xylulose5-phosphate (DXP), and 1-deoxy-D-xylulose5-phosphate reductoisomerase (DXR) converts DXP into 2-C-methyl-D-erythritol4-phosphate (MEP) (Rohmer et al., 1996; Lois et al., 2010). DXS and DXR, which control irreversible processes, are also considered vital enzymes in the upstream biosynthetic pathway of isoprenoids.
In recent years, a large number of cDNAs for HMGR genes have been studied in plants including Catharanthus roseus, Ginkgo biloba, Corylus avellana, Euphorbia pekinensis, Taxus media, Salvia miltiorrhiza, Arabidopsis thaliana, Aconitum heterophyllum, Panax ginseng, Hevea brasiliensis, and Cyanotis arachnoidea (Maldonado-Mendoza et al., 1992; Liao et al., 2004; Shen et al., 2006; Pan et al., 2009; Cao et al., 2010; Luo et al., 2013; Uthup et al., 2013; Li et al., 2014; Qiu et al., 2014). Plant HMGRs are encoded by a family of genes, and various HMGRs regulate the synthesis of diverse functional MVA metabolites (Suzuki and Muranaka, 2007). For example, HMGR1 in potato is responsible for sterol synthesis induced by mechanical damage and HMGR2 and HMGR3 are responsible for pathogen responses (Choi et al., 1992). In addition, the mutant hmgr1 of A. thaliana has been shown to exhibit plant dwarfing, premature senescence, and male sterility (Suzuki et al., 2005). Analysis of Arabidopsis mutant lines has shown that HMGR1 was involved in the biosynthesis of sterols and triterpenoids. Steroids and triterpenoids are involved in cell elongation, senescence, and reproduction in plants, indicating that HMGR1 plays a considerable role in plant development and cell division. HMGR2 is only expressed in Arabidopsis meristem and flower organs (Suzuki et al., 2005). Kim et al. (2014) found that the hmgr1-1 mutant phenotype of Arabidopsis could be complemented by overexpression of the PgHMGR1 gene, and that PgHMGR1 overexpression improved sterol and triterpene production in Arabidopsis and ginseng. PgHMGR1 complemented the phenotypic defect of hmgr1-1, whereas that of PgHMGR2 did not, indicating that PgHMGR1 is a functional ortholog of AtHMGR1. The overexpression of HMGR from rubber tree (Hevea brasiliensis) in tobacco led to a 4- to 8-fold increase in the apparent HMGR activity over the wild-type (WT) control, and phytosterol content was also significantly increased (Schaller et al., 1995). HMGR overexpression in C. roseus hairy roots (Ayora-Talavera et al., 2002) caused HMGR activity to increase significantly, and the contents of lycopene, phytosterol, and other terpene secondary metabolites in C. roseus were higher than those in the control. In a study on transgenic avocado it was shown that the fruits were much larger than those of the WT, indicating that HMGR plays a significant role in regulating fruit size (Cowan et al., 2001). The effect of SmHMGR2 overexpression on the synthesis of terpenoids in S. miltiorrhiza was studied, and both the squalene content in roots and tanshinone content in transgenic S. miltiorrhiza were significantly higher than in the control (Dai et al., 2011). Because many terpenoids are involved in the indirect defense of plants (Alborn et al., 2007), the HMGR gene family is a good system for studying plant defense responses. Terpenoids provide a strong defense against, and are eventually toxic to, some insect species (Wu et al., 1997). Statins are effective competitive inhibitors of HMGR and thus can inhibit HMGR activity. Mevinolin was used to study cell cycle progression in synchronized tobacco BY-2 cells; it clearly led to cell cycle arrest, and also induced cell death in a number of cells (Hemmerlin and Bach, 1998). Mevinolin has been shown to have negative effects on the growth, sterol formation, and pigment accumulation of radish seedlings (Bach and Lichtenthaler, 1983). Ginsenoside content was lower in adventitious roots from 4-week-old P. ginseng treated with mevinolin for 1 day than in controls, indicating the regulatory role of HMGR in the metabolic fluctuation of ginsenoside (Kim et al., 2014). Previous studies have shown that overexpression of plant HMGR can promote an increase of isoprenoids in the metabolic pathway; moreover, inhibition of HMGR activity by enzyme inhibitors significantly reduces isoprenoids and causes plant phenotype changes, indicating that HMGR plays a critical role in isoprenoid synthesis and plant growth and development. Poplar is an adaptable tree species that is widely cultivated in temperate and cold temperate regions throughout the Northern Hemisphere (latitude, 22–70°N), including China, Russia, Canada, the United States, and Europe. Poplar has been used in studies of perennial plant genomes due to the availability of its genome sequence (Tuskan et al., 2006), and genetic engineering has often been used to modify poplars for adaptation to a variety of environments. Transformed, rapidly growing poplar trees overproducing glutathione, a precursor of phytochelatins, have been suggested for the remediation of heavy metal-contaminated soils (Eapen and D’Souza, 2005; Marmiroli et al., 2011). However, in-depth analysis of a HMGR gene of P. trichocarpa, which codes for the rate-limiting enzyme in cytosolic terpenoid synthesis, has not yet been conducted. Furthermore, its putative effects on terpenoids through differential regulation of the HMGR gene of P. trichocarpa remain unclear.
In this study, we cloned a full-length cDNA encoding HMGR (XP_002300544.1) from P. trichocarpa. Additionally, PtHMGR was expressed in E. coli BL21 (DE3) for purification of the target protein. Functional analyses of the purified target protein were carried out using an in vitro enzymatic reaction. Moreover, we investigated the expression pattern of the PtHMGR gene in different tissues under abiotic stresses. Furthermore, PtHMGR was overexpressed in Nanlin895 (Populus× euramericana cv. ‘Nanlin895’) poplar. The levels of MEP-, MVA-, downstream-, abscisic acid (ABA)-, gibberellic acid (GA)-, and auxin (IAA)-related transcripts were compared between transgenic and WT poplars. In addition, the measured contents of ABA, GA, α-carotene, β-carotene, and lycopene were significantly higher than those in the control. In both poplars, PtHMGR overexpression led to the upregulation of DXS, DXR, HDS, HDR, IDI, GPS, GPPS, and GGPPS in the MEP pathway, and to α-carotene, β-carotene, and lycopene accumulation. There is literature on this so-called “cross-talk” between the compartmentalized isoprenoid pathways in plants and plant cells. Taken together, these results indicate that the manipulation of PtHMGR represents a promising strategy for simultaneous improvement of the levels in poplar of ABA, GA, α-carotene, β-carotene, and lycopene, which are involved in plant growth and responses to different stress factors.
Materials and Methods
Plant Cultures, Stresses, and Plasmid Construction
We cultured 3-month-old seedlings of P. trichocarpa and Nanlin 895 (Populus× euramericana cv. ‘Nanlin895’) plants in 1/2 Murashige and Skoog medium (pH 5.8) under 16-h light/8-h dark conditions at 23°C and 74% humidity. Well-grown plants were selected for re-culturing on 1/2 Murashige and Skoog medium containing 200 mM NaCl, 200 µM ABA, and 2 mM hydrogen peroxide (H2O2). We then collected P. trichocarpa seedlings treated with 200 mM NaCl, 200 µM ABA, and 2 mM H2O2 at 0, 2, 4, 6, 8, 12, 24, and 48 h, and subjected these to 4°C cold stress and 10% PEG6000 at 1, 2, 3, 4, 5, 6, and 7 days. Polymerase chain reaction (PCR) was used to amplify the PtHMGR gene, and the resulting product was ligated into the PEASY-T3 vector (TransGen Biotech, China) based on TA clone technology. Positive clones were isolated and sequenced (Invitrogen, United States) based on blue-white selection and identified by PCR. The PET-28a, PET-32a, and pSUMO vectors were chosen for cloning and analysis of prokaryotic expression in E. coli strains Top10, DH5α, and BL21 (DE3). Total RNA was isolated using the Miniprep kit (Biomiga, United States) according to the manufacturer’s instructions. Agrobacterium tumefaciens strain EHA105 was used for infection of leaf discs.
Gene Isolation and Sequence Analysis
A cDNA library was prepared using poly(A)-enriched mRNA from leaves with the SMART cDNA synthesis kit (TaKaRa Biotechnology Co., Ltd., Japan). The poplar genome database (http://genome.jpi-psf.org/cgi-bin/runAlignment?Db=Poptr1) was used to identify the sequence of the PtHMGR gene, and Open Reading Frame (ORF) finder software (http://www.ncbi.nlm.nih.gov/gorf/gorf.html) was used to find ORFs of the PtHMGR gene. The conserved sequence of the HMGR gene was amplified from the cDNA library through PCR using a set of degenerate primers (Table S1: HMGRFor1 and HMGRRev1); the PCR system included 2 µl forward and reverse primers, 2.0 µl cDNA as a template, 5.0 µl 10 × PCR buffer (Mg2+), 1 µl 10 mM dNTPs, 0.5 µl rTaq DNA polymerase (TaKaRa), and ddH2O added to a constant volume of 50 µl. The PCR reaction was performed as follows: 95°C for 10 min, 35 cycles of 95°C for 1 min, 56°C for 1 min, 72°C for 1.5 min, and 72°C for 10 min. The amplified segment was purified (AXYGEN, United States), ligated to the PEASY-T3 vector (TransGen Biotech), and sequenced. Subsequently, the sequences of the 5’ and 3’ fragments were obtained using gene-specific primers for 5’- and 3’-RACE (Table S1: HMGR5’R1, HMGR5’R2 for 5’-RACE and HMGR 3’ F1, HMGR3’F2 for 3’-RACE). The fragments amplified through 5’- and 3’-RACE were inserted into the vector PEASY-T3 and sequenced. The full-length sequence of PtHMGR was obtained by aligning these sequences. Finally, the ORF of PtHMGR was amplified with gene-specific primers (Table S1: ORF-HMGR-F and ORF-HMGR-R), cloned into the vector PEASY-T3, and sequenced.
The nucleotide and amino acid sequences of HMGR obtained from the NCBI database could be identified as conservative fragments based on the alignment generated using the DNAMAN software. MEGA software was used to build a phylogenetic tree using bootstraps of 1,000 replicates. The isoelectric point (pI) and molecular weight of the deduced PtHMGR protein were predicted with the online software pI/Mw (http://www.expasy.org/tools/pi_tool.html). The tertiary structures of PtHMGR and AtHMGR were predicted using the online software tools of the SWISS-MODEL server (http://www.expasy.org/swissmod/SWISS-MODEL.html). The use of the catalytic domain of HMGR only for expression and structure modeling was based on a previously reported X-ray analysis of truncated human HMGR (Istvan et al., 2000).
Plasmid Construction
Primers for prokaryotic expression were designed according to the sequences of the PtHMGR gene and the restriction enzyme sites of the PET-28a, PET-32a, and pSUMO vectors. The PtHMGR gene was cloned into these expression vectors between the EagI and SalI sites based on double enzyme digestion (EagI and SalI) and T4 ligation. We selected 306–1,599 base pairs (bp) of PtHMGR for heterologous expression of the truncated PtHMGR. The fusion vector PET-28a-truncated-PtHMGR was constructed based on double digestion and T4 ligation.
Recombinant E. coli strains BL21 (DE3; bacteria expressing different vectors) were cultivated in 3 ml Luria-Bertani (LB) medium containing 50 µg/ml kanamycin or 30 µg/ml ampicillin. When the optical density (OD600) of the bacterial culture reached 0.6–0.8, the remaining solution was induced using 1 mM IPTG and continuously cultivated at 220 rpm for 4 h at 37°C. To determine the effect of temperature on the expression of the target protein, low temperatures (4°C and 10°C) were selected to induce recombinant E. coli strains BL21 (DE3). The recombinant solution was cultivated at 37°C until it reached OD600 0.6–0.8. The recombinant solution was then induced using 1 mM IPTG and continuously cultivated at 110 rpm for 72 h at 4°C, or for 48 h at 10°C. Non-induced and induced solutions were analyzed using 12% sodium dodecyl sulfate–polyacrylamide gel electrophoresis (SDS–PAGE).
The target protein was present in the form of insoluble inclusion bodies when the recombinant solution was incubated at 37°C. Denaturation and renaturation processes were carried out. First, the collected inclusion bodies were resuspended three times in resuspension solution 1 (20 mM Tris, 1 mM EDTA, 2 M urea, 1 M NaCl, and 1% Triton X-100, pH 8.0), followed by two resuspensions in resuspension solution 2 (20 mM Tris, 1 mM EDTA, 4 M urea, 1 M NaCl, and 1% Triton X-100, pH 8.0). Then, the inclusion bodies were resuspended once in resuspension solution 3 (20 mM Tris, 1 mM EDTA, 6 M urea, 1 M NaCl, and 1% Triton X-100, pH 8.0). Subsequently, the inclusion bodies were collected and dissolved in resuspension solution 4 (20 mM Tris, 1 mM EDTA, 6 M urea, 1 M NaCl, and 1% Triton X-100, pH 8.0). Finally, the collected denaturation solution was held for 24 h at 4°C and the inclusion bodies were dissolved thoroughly in 8 M urea. In addition, the renaturation process was carried out as follows: the solution described above was added dropwise into renaturation solution (20 mM Tris-HCl, 0.15 M NaCl, and 2-8 M urea, pH 8.0), and then slowly stirred with double gradient dilution. The protein solution was packed into a dialysis bag and dialyzed overnight in dialysis solution (20 mM Tris-HCl and 0.15 NaCl, pH 8.0). The target protein was analyzed using 12% SDS–PAGE.
Purification of the Target Protein and Western Blotting
Based on the His tag, the fusion protein was applied to a Ni+-NTA-chelating column, then flushed with washing solution (20 mM Tris-HCl, 20 mM imidazole, and 0.15 M NaCl, pH 8.0) until the baseline absorbance was reached. The target protein was flushed with elution solution (20 mM Tris-HCl, 250 mM imidazole, and 0.15 M NaCl, pH 8.0), followed by overnight dialysis at 4°C with dialysis solution (20 mM Tris-HCl and 0.15 M NaCl, pH 8.0). Finally, the protein was lyophilized and fractions were collected and analyzed with 12% SDS–PAGE.
Western blotting was performed with rabbit anti-His polyclonal antibody as the primary antibody and peroxidase-conjugated goat anti-rabbit IgG (Zhongshan Biotechnique) as the secondary antibody.
In Vitro Enzymatic Reaction for Detection of PtHMGR Protein
To assess the activity of the PtHMGR protein, 1 ml of reaction mixture (2.5 mM K2HPO4, 5 mM KCl, 1 mM EDTA, 5 mM DTT, 1 mg/ml PtHMGR, 3 mM NADPH as a coenzyme and 0.3 mM of HMG-CoA as a substrate, pH 7.2) was incubated at 37°C for 60 min (Bischoff and Rodwell, 1996). The control group was treated similarly, except that the target PtHMGR protein was added to the reaction mixture for identification.
Mass spectrometry (MS) was used to detect the activity of the PtHMGR protein. High-performance liquid chromatography (HPLC; LC20A; Shimadzu, Japan) was adapted using a solvent (0.1% formic acid in methanol) with a column temperature of 30°C, a 0.3 ml/min flow rate, and a 2.1*150 mm XBridge C18 3.5-µm column (Waters, United States). In addition, MS (TSQ 8000 EVO; Thermo, United States) was adapted using a TripleTOF 5600+ m/z (50–1200) instrument (SCIEX, United States) and an information-dependent acquisition (IDA) pattern to collect ions.
Analysis of Expression Patterns
Various poplar tissues (young and mature leaves, upper and lower stems, petioles, and roots) were treated under different stress conditions (200 mM NaCl, 200 µM ABA, 2 mM H2O2, 4°C cold stress, and 10% PEG6000) to analyze the expression of PtHMGR using quantitative reverse-transcription PCR (qRT-PCR). Three plants were used for each replicate. The primers for the PtActin gene (accession number: XM-006370951.1), used as an internal reference (Zhang et al., 2013), and the PtHMGR gene in qRT-PCR are shown in Table S1. The qRT-PCR reactions were performed using PCR SYBR Green Mix (Roche) under the following conditions: initial incubation at 95°C for 5 min, followed by 40 cycles of 30 s at 95°C, 30 s at the annealing temperature at 60°C, and 30 s at 72°C.
Agrobacterium-Mediated Transformation
The ORF the PtHMGR gene was cloned into the Gateway entry vector pENTR/D-TOPO (Invitrogen), and then transferred to the destination vector pGWB9 through the LR reaction using LR Clonase II (Invitrogen) according to the manufacturer’s instructions. PtHMGR was expressed under the control of the cauliflower mosaic virus (CaMV) 35S promoter. The plasmid was transformed into A. tumefaciens strain EHA105. A simplified version of the leaf infection method was used for transformation of Nanlin895 poplar (Populus× euramericana cv.), following the specific transformation process described by Movahedi et al. (2015).
After rooting on 1/2 Murashige and Skoog medium, eight lines of putative transformants were selected for confirmation. Genomic DNA was extracted from leaves according to the kit manufacturer’s instructions (Biomiga Miniprep). PCR was used to detect whether the PtHMGR gene was inserted into the poplar genome with CaMV35S-F as the forward primer, and the downstream primer of ORF-PtHMGR as the reverse primer (Table S1: CaMV35S-F and ORF-PtHMGR-R). The PCR reaction was carried out under the following conditions: 95°C for 10 min; 35 cycles of 95°C for 1 min, 58°C for 1 min, and 72°C for 1.5 min; and 72°C for 10 min. PCR products were visualized on a 1% agarose gel. Subsequently, qRT-PCR was carried out to reveal the transcript levels of PtHMGR in the transformants and WT poplars. The reaction conditions and reaction system for qRT-PCR used for the transformants and WT poplars were carried out as described above.
Transcript Levels of Genes Related to MVA, MEP, ABA, GA, and IAA
Transcript levels of several genes involved in the MVA and MEP pathways were evaluated in WT and transgenic poplars. In addition, the expression profiles of ABA-, GA-, and IAA-related genes were compared between WT and transgenic poplars. Total RNA was isolated from the leaves of WT and transgenic poplars and subjected to qRT-PCR under the conditions described above. The qRT-PCR primers designed to target MVA-, MEP-, ABA-, GA-, and IAA-related genes are shown in Table S1. Three plants were used for each replicate, with three technical repetitions performed for transcription analysis of MVA-, MEP-, ABA-, GA-, and IAA-related genes.
Quantitative Detection of ABA, GA3, and GA4 Contents
The AB Qtrap6500 mass spectrometer was used in triple four-stage rod-ion hydrazine mode. The ESI-HPLC-MS/MS method was used for the quantitative analysis of phytohormones. Samples were separated using a 1,290 high-performance liquid chromatograph (Agilent, United States) with electrospray ionization as the ion source and scanned in multi-channel detection mode. Three-month-old leaves were chosen for analysis of the contents of ABA, GA3, and GA4. The process of hormone extraction was as follows: 0.5-g fresh plant samples were ground and 10 ml isopropanol/hydrochloric acid mixture was used to dissolve the sample. Next, 20 ml dichloromethane was added to the solution, and the collected solution was centrifuged at 13,000 × g for 20 min at 4°C. Then, the organic phase was dried under nitrogen and dissolved in 400 µl methanol containing 0.1% formic acid. Finally, the collected solution was filtered through a 0.22-µm membrane and detected using HPLC-MS/MS. Three independent biological experiments were performed.
The standard solutions were formulated as follows: ABA, GA3, and GA4 at 0.1, 0.2, 0.5, 2, 5, 20, 50, and 200 ng/ml were dissolved in methanol/0.1% formic acid. During plotting of the standard curve, outliers can be excluded. The liquid phase conditions were as follows: a Poroshell 120 SB-C18 column (2.1 × 150, 2.7 m) was used in this study at a column temperature of 30°C. The mobile phase included A:B = (methanol/0.1% formic acid): (water/0.1% formic acid). Elution gradient: 0–1 min, A = 20%; 1–9 min, A = 80%; 9–10 min, A = 80%; 10–10.1 min, A = 20%; 10.1–15 min, A = 20%. The injection volume was 2 µl. MS conditions were as follows: air curtain gas, 15 psi; spray voltage, 4,500 v; atomization pressure, 65 psi; auxiliary pressure, 70 psi; atomization temperature, 400°C.
Quantitative Determination of α-Carotene, β-Carotene, and Lycopene Contents
First, α-carotene, β-carotene, and lycopene in poplar leaves were extracted according to the following steps: 1.0 g of poplar leaves were ground and 10 ml acetone-petroleum ether (1:1) was used to dissolve the sample, and the collected solution was transferred to a liquid separation funnel and layered statically. Subsequently, the collected solution was evaporated and filtered through a 0.45-µm membrane for HPLC analysis. The Symmetry Shield RP18 reversed-phase chromatographic column (Waters, United States) was used in this study with a column temperature of 30°C. The injection volume was 10 µl. Three independent biological experiments were performed. In addition, the standard curves of α-carotene, β-carotene, and lycopene were generated as described above.
Results
Molecular Cloning and Bioinformatics Analysis
In this study, a full-length cDNA of the HMGR gene was isolated from P. trichocarpa, referred to as PtHMGR (XP_002300544.1). The PtHMGR ORF is 1,734 bp in length and encodes a peptide of 577 amino acids (Figure S1). Its predicted theoretical pI is 6.64, and its predicted theoretical molecular weight is 61.64 kD. Multiple alignment of amino acid sequences revealed that the PtHMGR protein was highly homologous to HMGR in other plant species, with 76.46%, 73.68%, 77.11%, 74.88%, 77.07%, 76.75%, and 76.20% identity with those of Jatropha curcas (XP_012087580.1), Nicotiana tabacum (XP_016447095.1), Camellia sinensis (AHB64333.1), Nelumbo nucifera (XP_010270571.1), Hevea brasiliensis (XP_021686529.1), Ricinus communis (XP_002510732.1), and Euphorbia lathyris (AFZ93642.1), respectively (Figure S2). The relatively well-conserved domains of the PtHMGR protein were similar to those of other plants. The amino acid sequence of PtHMGR contains two HMG-CoA-binding motifs (EMPVGYIQIP’ and ‘TTEGCLVA) and two NADPH-binding motifs (DAMGMNMV’ and ‘VGTVGGGT) (Figure S2).
According to X-ray analysis of truncated human HMGR (Istvan et al., 2000), a protein segment (residues 102–533AA) was chosen. HMGR proteins of other plants were compared to that of P. trichocarpa through cluster analysis (Figure 1). The results clearly showed that PtHMGR had high homology with other amino acid sequences of HMGR proteins, and had the closest evolutionary relationships with other HMGR proteins, such as those from J. curcas (XP_012087580.1) and H. brasiliensis (XP_021686529.1) (Figure 1).
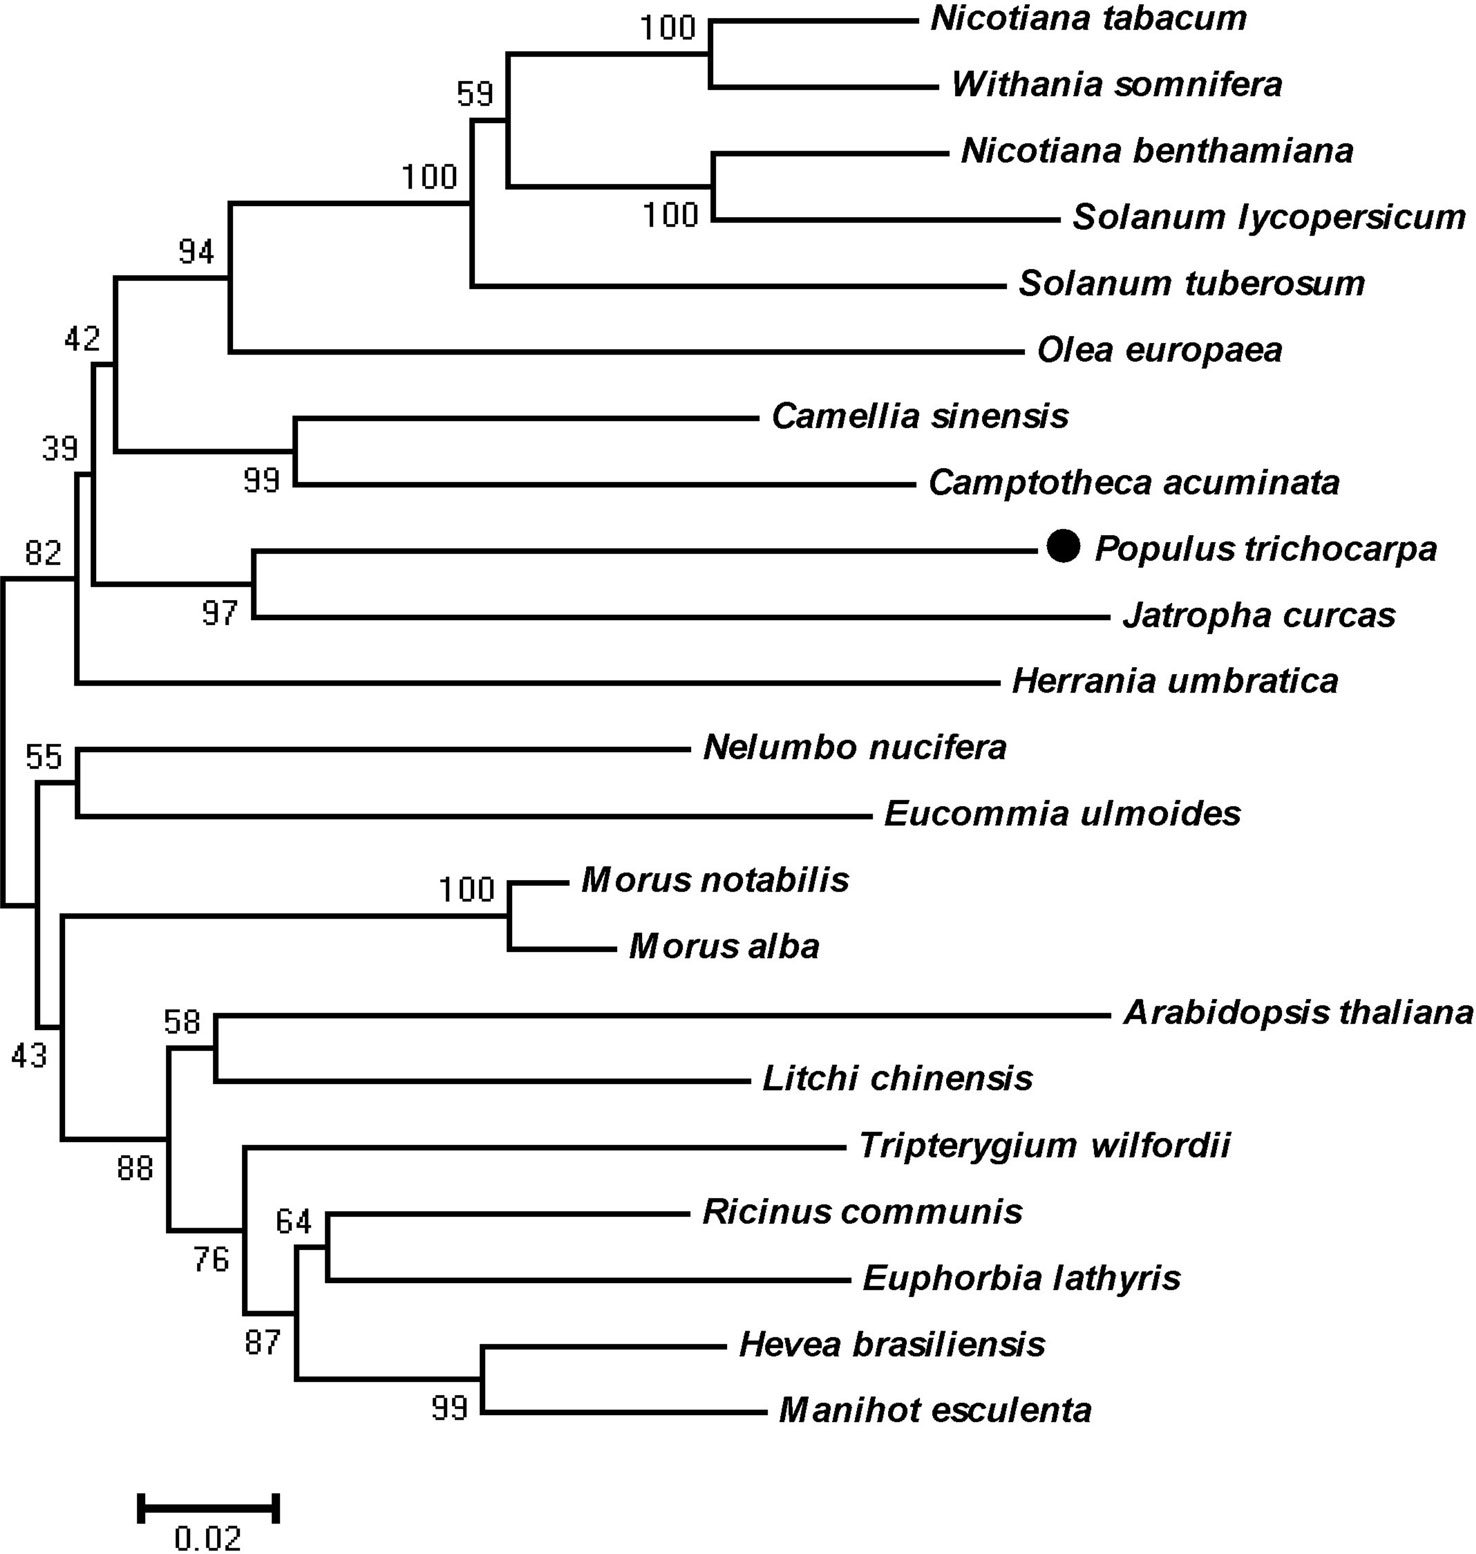
Figure 1 Phylogenetic tree showing relationships between the PtHMGR (XP_002300544.1) amino acid sequence and other identified HMGR amino acid sequences. The tree was constructed using the neighbor-joining (NJ) method in the MEGA 5.1 software and bootstrapped 1,000 times. Bootstrap percentages are indicated at branch points. In all cases, tree topologies obtained using the NJ, minimum evolution, and maximum parsimony methods were identical. Accession numbers of the 3-hydroxy-3-methylglutaryl-CoA reductase (HMGR) sequences obtained from GenBank are as follows: Arabidopsis thaliana (NP_177775.2), Camellia sinensis (XP_028116621.1), Camptotheca acuminata (AAB69727.1), Eucommia ulmoides (AAV54051.1), Euphorbia lathyris (AFZ93642.1), Herrania umbratica (XP_021282837.1), Hevea brasiliensis (XP_021686529.1), Jatropha curcas (XP_012087580.1), Litchi chinensis (ABF56518.2), Manihot esculenta (XP_021613442.1), Morus alba (AAD03789.1), Morus notabilis (XP_010094509.1), Nelumbo nucifera (XP_010270571.1), Nicotiana benthamiana (BAR94040.1), Nicotiana tabacum (XP_016447095.1), Olea europaea (AQX83308.1), Ricinus communis (XP_002510732.1), Solanum lycopersicum (NP_001296119.1), Solanum tuberosum (NP_001274940.1), Tripterygium wilfordii (AKQ98176.1), and Withania somnifera (AOX15271.1).
Prokaryotic Expression
The ORF of the PtHMGR gene was inserted into the prokaryotic expression vectors PET-28a, PET-32a, and pSUMO between the EagI and SalI sites according to analysis of restriction sites (Figures S3A–C). IPTG-induced E. coli BL21 (DE3) revealed no target band in 12% SDS–PAGE analysis (Figures 2A–C). The nucleic acid sequence (306–1,599 bp) was amplified by PCR and inserted into the PET-28a plasmid (Figure S3D). IPTG-induced bacteria were analyzed using 12% SDS–PAGE to reveal one specific band of the expected 47.33 kDa size (Figure 2D). In addition, the truncated PtHMGR protein was detected in the precipitate when the recombinant solution was induced using 1 mM IPTG and incubated at 37°C and considered an inclusion body according to analysis of the supernatant and precipitate (Figure 2D). His-tagged proteins were captured using Ni-IDA resin, washed repeatedly in buffer containing 20 mM imidazole, and eluted in buffer containing 250 mM imidazole (Figure 2E). Western blots showed that the expression of truncated PtHMGR could be specifically recognized by rabbit antiserum raised against His tag (Figure 2F), confirming that the protein expressed by E. coli BL21 (DE3) corresponded to PtHMGR.
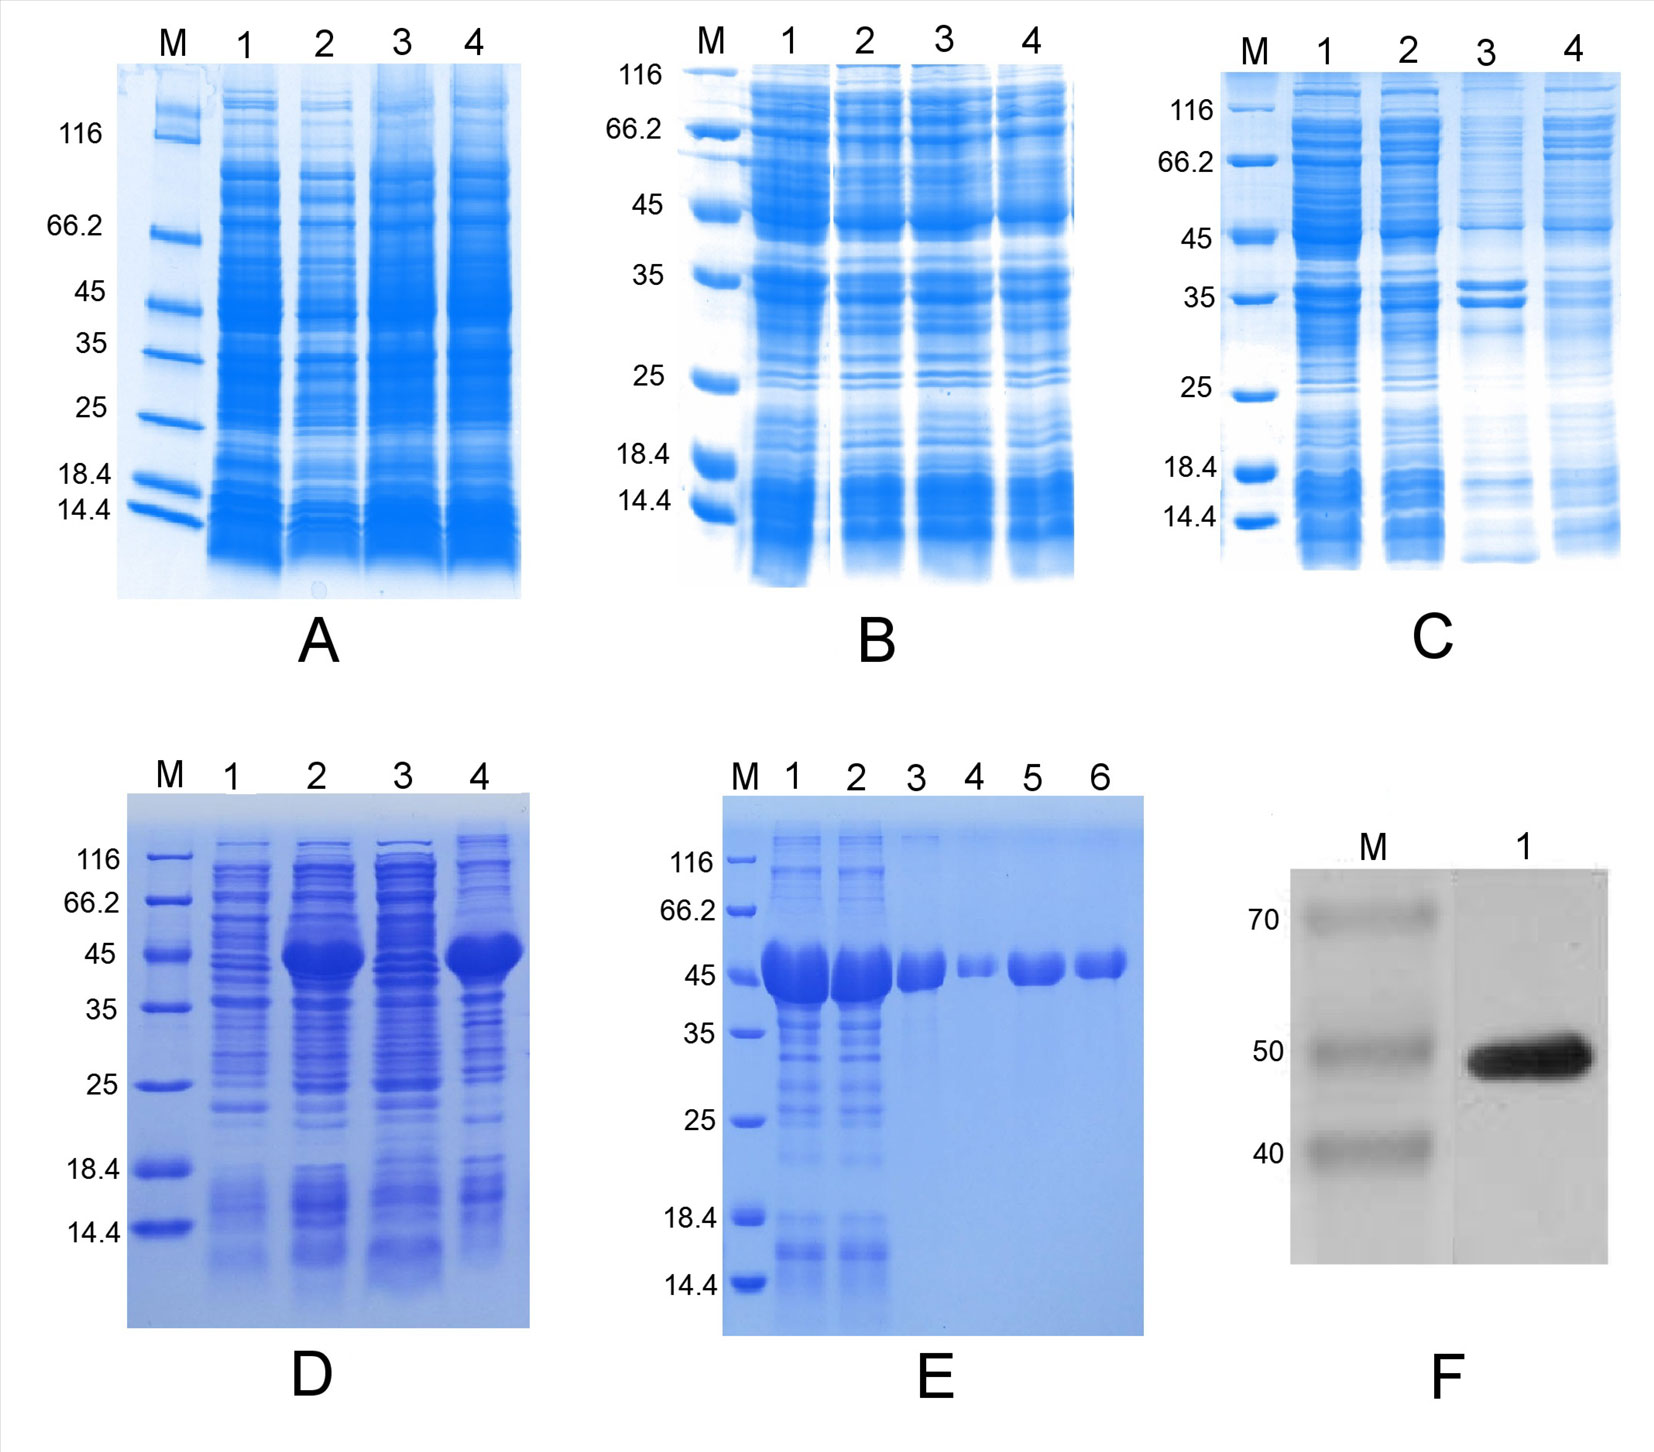
Figure 2 Prokaryotic expression analysis of various expression vectors and purification of the truncated PtHMGR protein. (A) Analysis of the expressed fusion protein based on the PET-28a-PtHMGR fusion vector. Lane M: molecular mass marker; lane 1: negative control; lanes 2–4: colonies 1–3, respectively, induced with 1 mM IPTG. (B) Analysis of the expressed fusion protein based on the pSUMO-PtHMGR fusion vector. Lane M: molecular mass marker; lane 1: negative control; lanes 2–4: colonies 1–3, respectively, induced with 1 mM IPTG. (C) Analysis of the expressed fusion protein based on the PET-32a-PtHMGR fusion vector. Lane M: molecular mass marker; lane 1: negative control; lanes 2–4: colonies 1–3, respectively, induced with 1 mM IPTG. (D) Analysis of the expressed truncated PtHMGR protein based on the PET-28a-truncated PtHMGR fusion vector. Lane M: molecular mass marker; lane 1: negative control; lane 2: colony induced with 1 mM IPTG; lane 3: supernatant; lane 4: precipitate. (E) Purification of the truncated PtHMGR protein. Lane M: molecular weight marker; lane 1: precipitate after renaturation; lane 2: flow-through; lanes 3–6: eluate. (F) Western blot analysis of purified truncated PtHMGR protein using a monoclonal antibody against the His tag. Lane M: molecular weight marker; lane 1: results of western blotting for purified truncated PtHMGR protein.
IPTG-induced E. coli BL21 (DE3) were cultivated at 110 rpm for 72 h at 4°C or for 48 h at 10°C. The results of 12% SDS–PAGE showed that the truncated PtHMGR protein was present in both the supernatant and precipitate (Figures S4A–D). We then successfully isolated and purified the truncated PtHMGR protein from the supernatant based on the Ni-IDA resin (Figure S4E).
Functional Identification of PtHMGR In Vitro
The activity of purified truncated PtHMGR protein was analyzed using HPLC/MS (Figures 3 and 4), and the special peak or mass fragmentation pattern of target production (MVA) was detected at 2.2 min, and the SCIEX TripleTOF 5600+ m/z value was 131.0710 (Figure 4). However, for controls, no special peak or MVA was detected at 2.2 min, and the SCIEX TripleTOF 5600+ m/z value differed from 131.0710 (Figure 3). Functional evidence was provided by the formation of MVA from HMG-CoA, catalyzed by truncated PtHMGR. The activity of truncated PtHMGR protein in the supernatant was also analyzed using HPLC/MS. The results showed that truncated PtHMGR catalyzed the conversion of HMG-CoA and NADPH into MVA (Figure S5); also, in the almost same retention time, we found a higher intensity from activity of PtHMGR in supernatant in comparing with that in inclusion bodies. We speculated that the activity of truncated PtHMGR in the supernatant was orders of magnitude higher than that of truncated PtHMGR in inclusion bodies (Figure 4 and Figure S5).
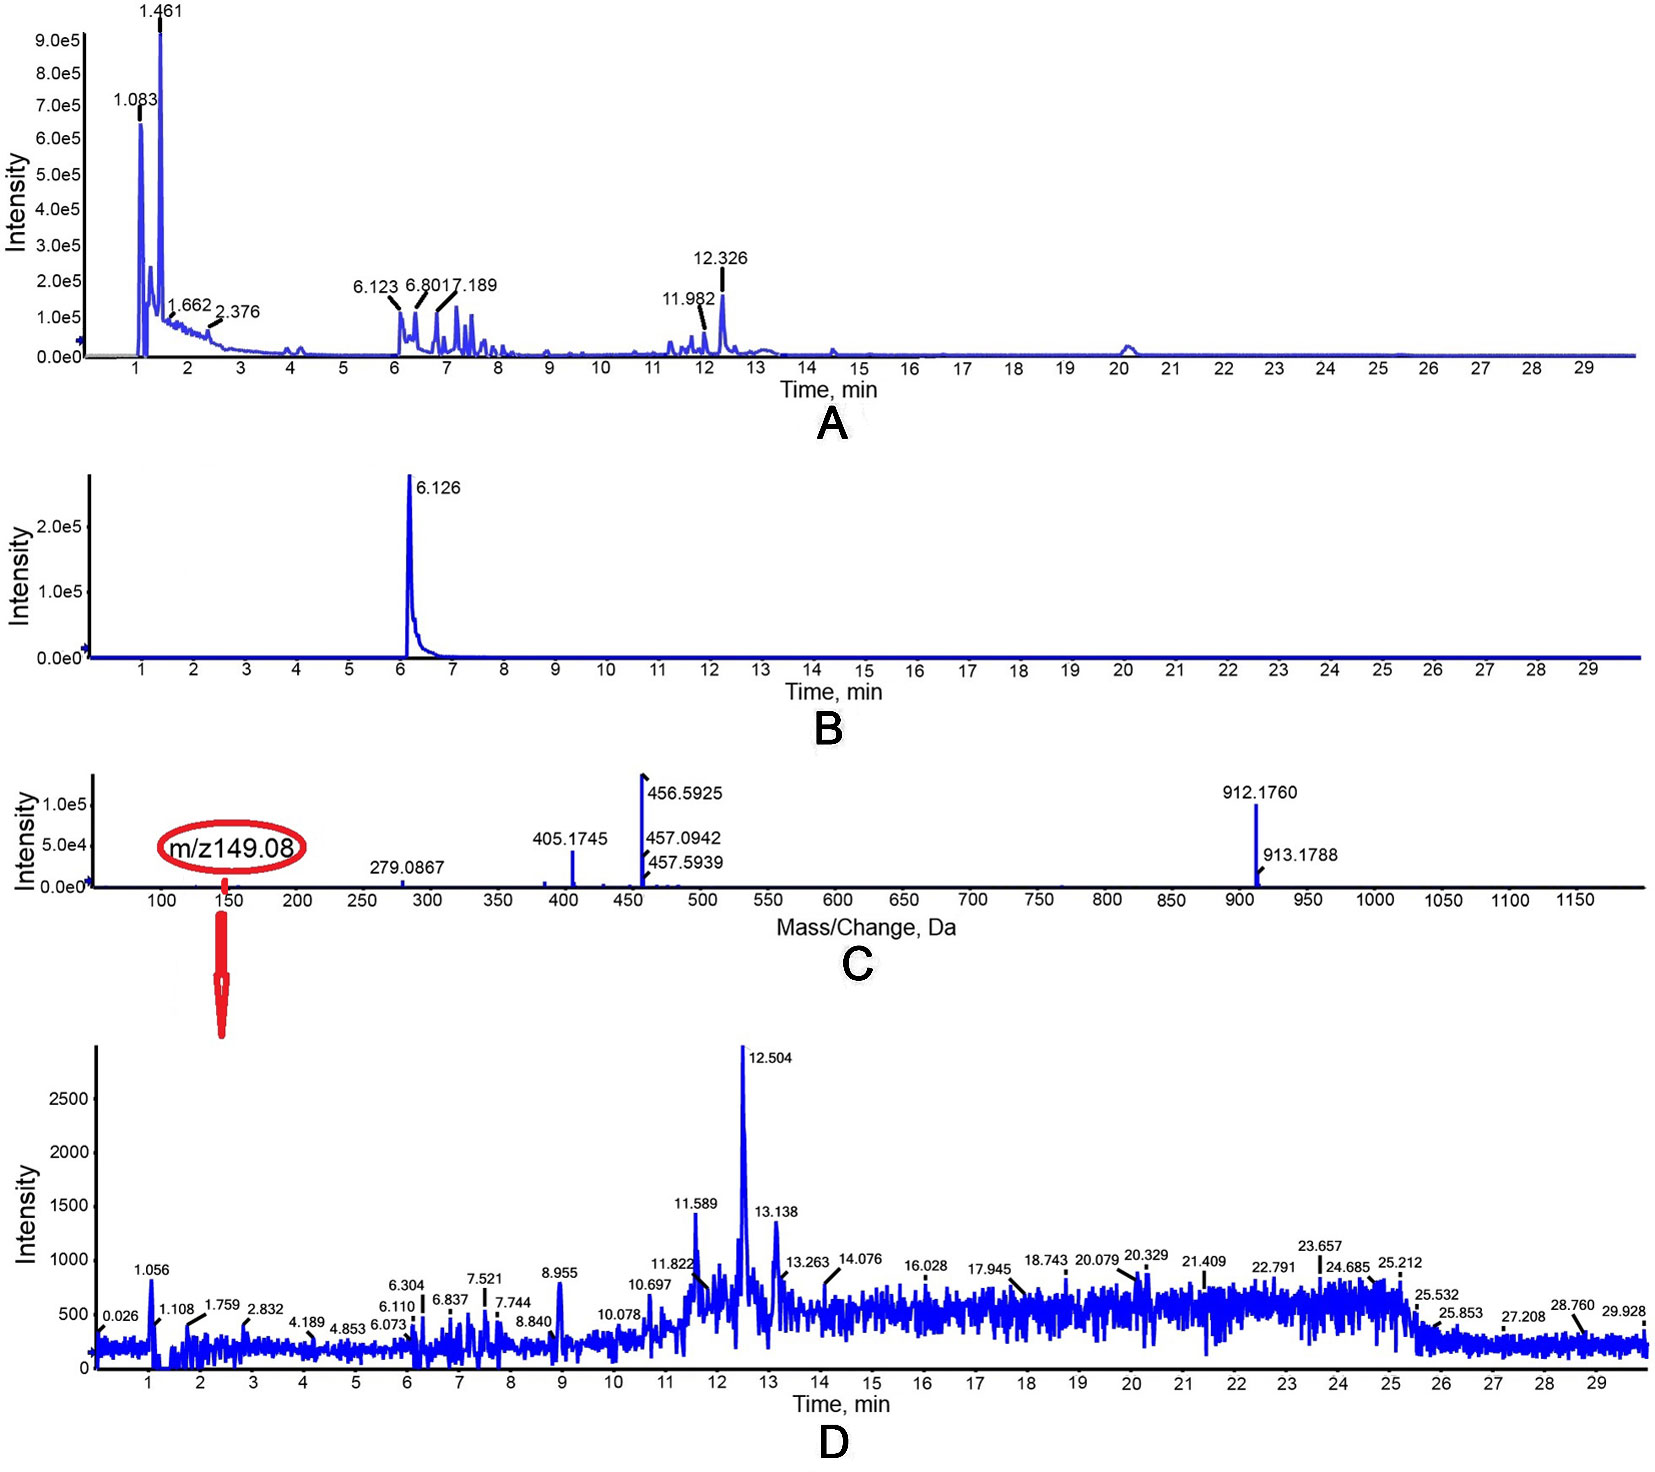
Figure 3 Detection of the negative control group in vitro with a 1 ml reaction mixture (2.5 mM K2HPO4, 5 mM KCl, 1 mM EDTA, 5 mM DTT, 3 mM NADPH as a coenzyme, and 0.3 mM of HMG-CoA as a substrate, pH 7.2). (A) Total ion chromatogram of reaction products of high-performance liquid chromatography (HPLC). (B) Extracted ion chromatography (XIC) analysis. (C) Time-of-flight mass spectrometry (TOFMS) analysis. (D) XIC analysis of m/z 149.08.
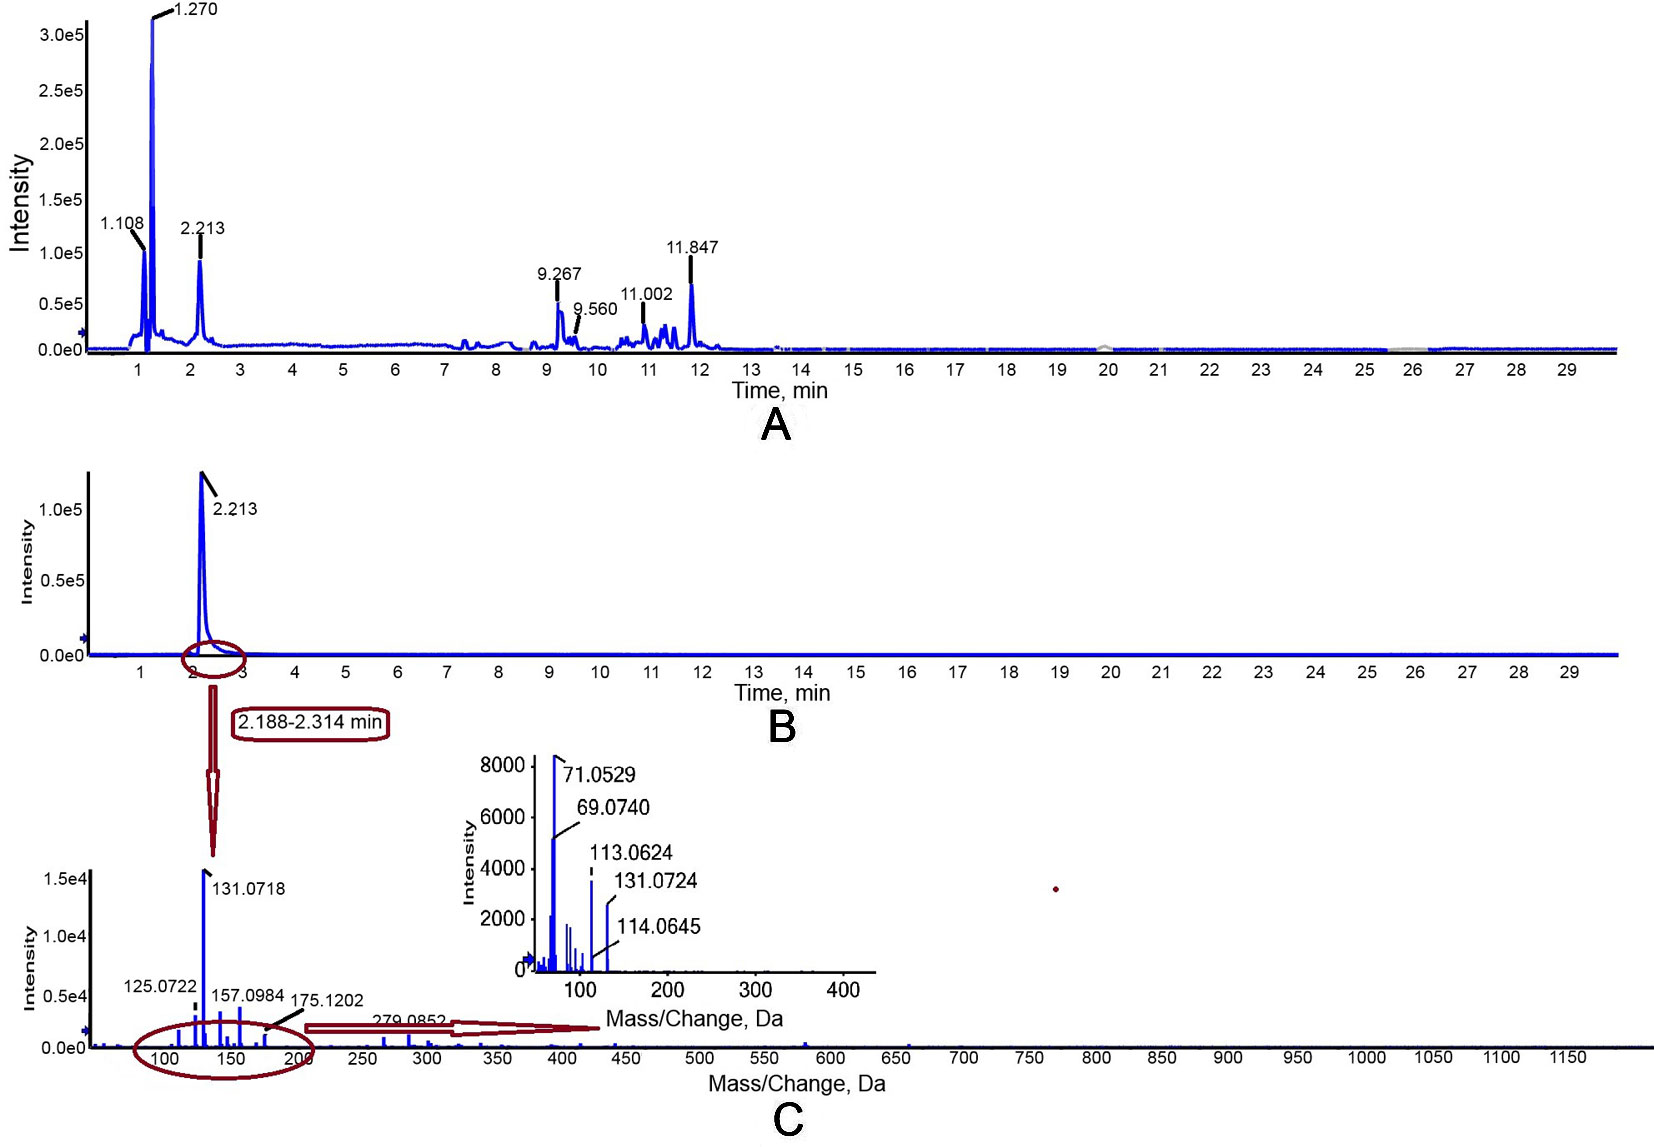
Figure 4 Detection of truncated PtHMGR protein activity in vitro with a 1 ml reaction mixture (2.5 mM K2HPO4, 5 mM KCl, 1 mM EDTA, 5 mM DTT, 1 mg/ml PtHMGR, 3 mM NADPH as a coenzyme, and 0.3 mM of HMG-CoA as a substrate, pH 7.2). (A) Total ion chromatogram of reaction products of high-performance liquid chromatography (HPLC). The peak at retention time 2.2 was attributed to target production (MVA). (B) Extracted ion chromatography (XIC) analysis. (C) Time-of-flight mass spectrometry (TOFMS) analysis. The SCIEX TripleTOF 5600+ m/z value was 131.0710, consistent with MVA.
Expression of PtHMGR in Different Tissues
We then consulted the “Phytozome 12” data bank; after summarizing a number of sequenced poplar genomes, we found six HMGR-like sequences localized to chromosomes 1, 2, 4, 5, 9, and 11. Multiple sequence alignment was performed to identify specific primers (Table S1) for PtHMGR (Potri.001G457000.1) (Figure S6). The qRT-PCR results suggested that PtHMGR is expressed in all tissues tested, including mature and young leaves, upper and lower stems, petioles, and roots, with the highest expression seen in leaves, especially young leaves (Figure 5).We studied the expression of PtHMGR in non-transformed plants treated by exogenous application of ABA, NaCl, PEG6000, and H2O2 as well as cold stress. qRT-PCR showed that the expression of PtHMGR in leaves was significantly upregulated under stress conditions. With ABA treatment, the expression of PtHMGR was significantly upregulated from 1 to 48 h, with a peak at 6 h post-treatment (Figure 6A). Treatment with 200 mM NaCl caused significant accumulation of PtHMGR mRNA from 3 to 12 h of salt stress (Figure 6B). The expression of PtHMGR was enhanced with 1 to 4 days of 10% PEG6000 treatment, then the transcript level of PtHMGR declined from 5 days (Figure 6C). In addition, treatment with 2 mM H2O2 caused significant accumulation of PtHMGR mRNA from 1 to 6 h (Figure 6D). Treatment with cold stress resulted in an increase in the transcript level of PtHMGR of nearly 60-fold at 7 days (Figure 6E). These data suggest that PtHMGR may play a specific role in the regulation of pathways induced by abiotic stress in poplar.
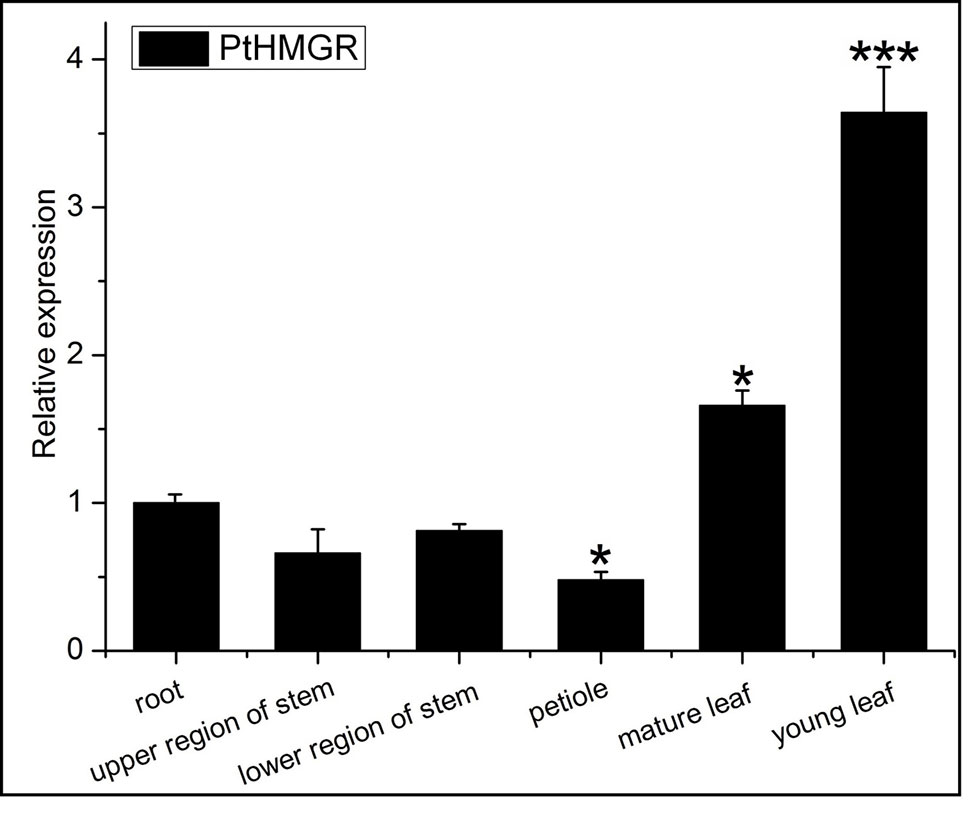
Figure 5 Expression analysis of the PtHMGR gene in various tissues. Mean levels (with standard deviation [SD]) in six tissues were analyzed using quantitative reverse-transcription polymerase chain reaction (qRT-PCR). Data presented are 2–ΔΔCt levels calculated relative to a selected tissue (root), which was set to 1, and normalized to the mRNA level of PtActin. Three independent biological replicates were analyzed with three technical repeats. Vertical bars represent means ± SD (n = 3). *: significant difference at P < 0.05. ***: significant difference at P < 0.001.
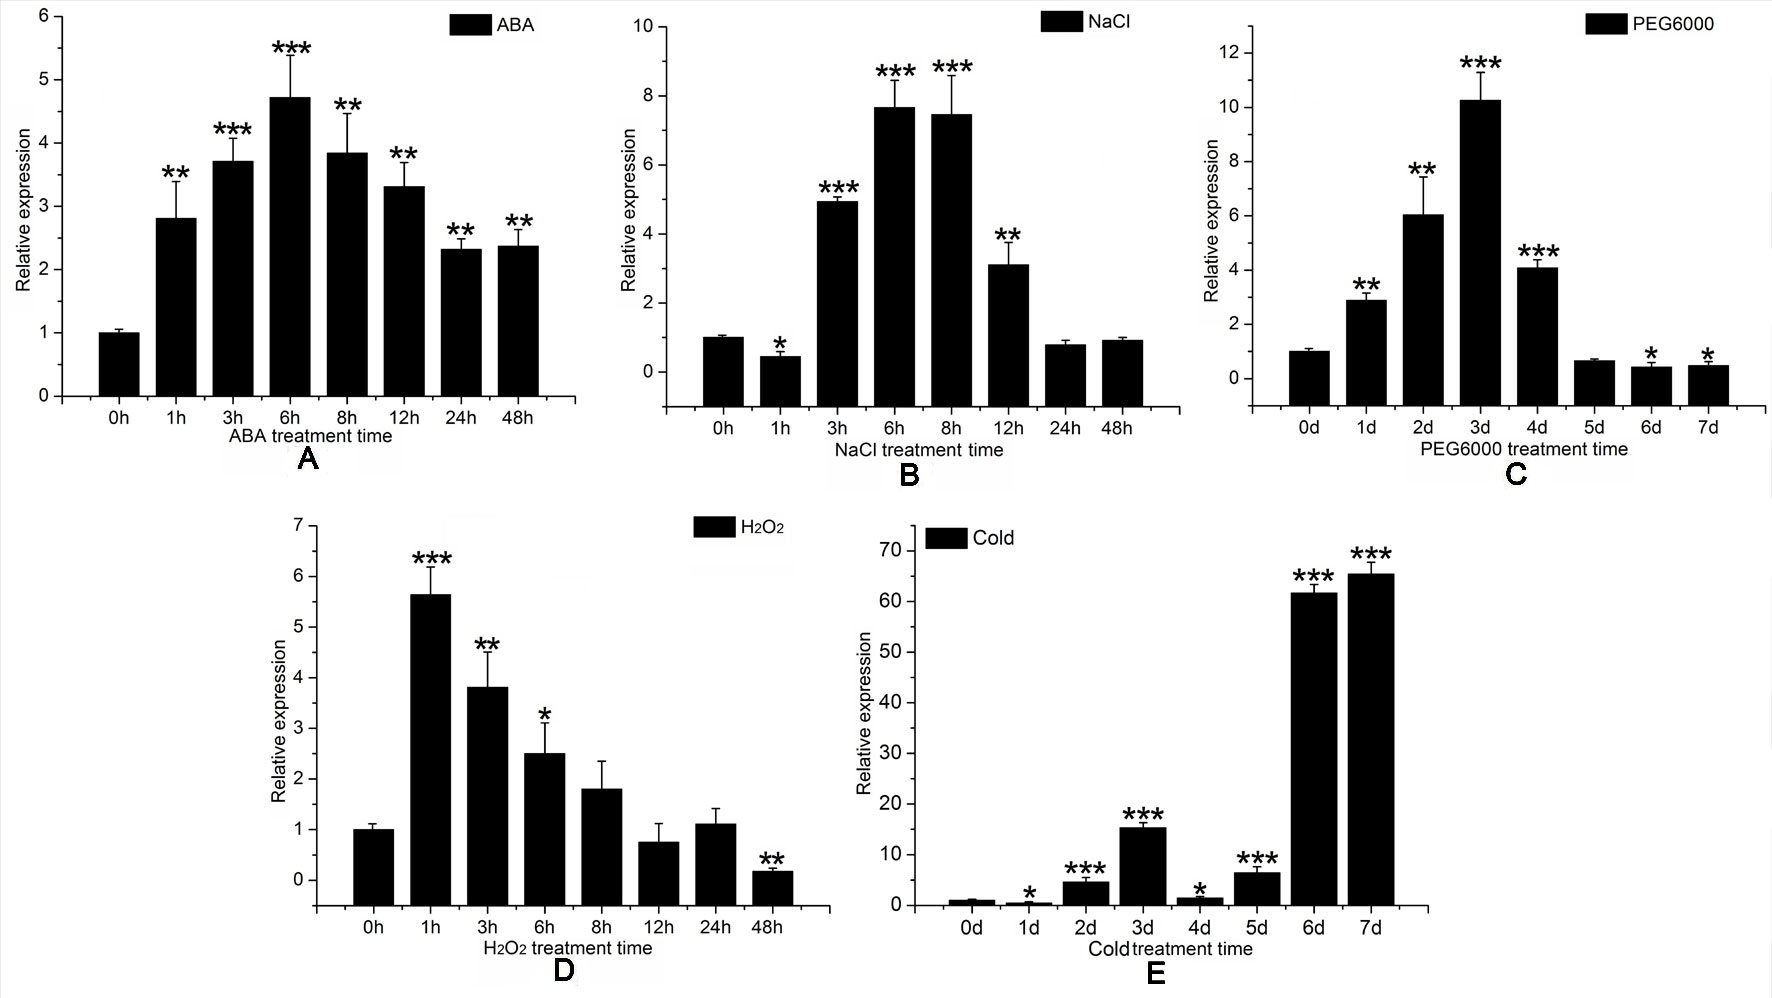
Figure 6 Expression time-course of the PtHMGR gene in response to different stress treatments, as determined through quantitative reverse-transcription polymerase chain reaction (qRT-PCR) performed using total RNA extracted from leaves at the indicated times following treatment with 200 μM abscisic acid (ABA) (A) 200 mM NaCl, (B) 10% PEG6000, (C) 4°C, and (D) 2 mM hydrogen peroxide (H2O2). (E) Relative expression was calculated using PtActin as an internal reference. Three independent biological replicates were analyzed with three technical repeats. Vertical bars represent means ± SD (n = 3). *: significant difference at P < 0.05. **: significant difference at P < 0.01. ***: significant difference at P < 0.001.
Characterization of Transgenic Nanlin895 Lines
To evaluate the functional role of the PtHMGR gene in transgenic poplars, the PGWB9-PtHMGR vector was introduced into WT poplars via Agrobacterium-mediated transformation (Figure S7). Eight independent T0 transgenic poplars were obtained through screening of regenerated kanamycin-resistant poplar plants. Then, T1 regeneration plants were obtained through subculturing. Genomic PCR analysis with specific primers (CaMV35S-F as the forward primer and ORF-PtHMGR-R as the reverse primer) showed that eight of the T1 plants had the expected band (Figure S8A). Subsequently, the expression levels of PtHMGR in various T2 transgenic poplar lines were examined. The relative expression levels of PtHMGR increased significantly (Figure S8B). Genomic PCR and analysis of PtHMGR expression levels in transgenic poplar lines revealed that the PtHMGR gene was integrated into the genome and stably expressed in plant cells.
Overexpression of PtHMGR in Transgenic Poplars Significantly Regulates Downstream Genes Involved in the MVA and MEP Pathways
As a rate-limiting enzyme in the MVA pathway, HMGR may influence the transcript levels of genes throughout the pathway. Transcript levels of MEP pathway-related genes, including DXS (Figure 7A), DXR (Figure 7B), HDS (1-hydroxy-2-methyl-2-(E)-butenyl4-diphosphate synthase) (Figure 7E), and HDR (1-hydroxy-2-methyl-2-(E)-butenyl4-diphosphate reductase) (Figure 7F) were significantly elevated in transgenic lines, while the transcript levels of MCT (MEP cytidylyltransferase) (Figure 7C) and CMK (4-diphosphocytidyl-2-C-methyl-D-erythritol kinase) (Figure 7D) showed no significant changes between transgenic poplar lines and WT poplars. Among MVA pathway-related genes, there was no significant difference in the expression patterns of AACT (acetoacetyl CoA thiolase) (Figure 8A) and HMGS (3-hydroxy-3-methylglutaryl-CoA synthase) (Figure 8B), which are HMGR upstream genes, between transgenic lines and WT plants. Transcript levels of MVK (mevalonate kinase) and MVD (mevalonate5-diphosphate decarboxylase), which are HMGR downstream genes, exhibited significant changes, with a greater change in MVD expression than that of MVK (Figures 8C, D). Among downstream-related genes, the transcript expression levels of IDI (IPP isomerase) (Figure 8E), GPS (geranyl diphosphate) (Figure 8F), and GPPS (geranyl diphosphate synthase) (Figure 8G) were strongly increased in transgenic lines. Different transgenic strains showed different changes in the expression level of GGPPS (geranyl geranyl diphosphate synthase); expression of GGPPS was enhanced significantly in the H3-1 line, while there was a slight increase in the H3-4, H3-5, and H3-6 lines when compared to WT plants (Figure 8H).
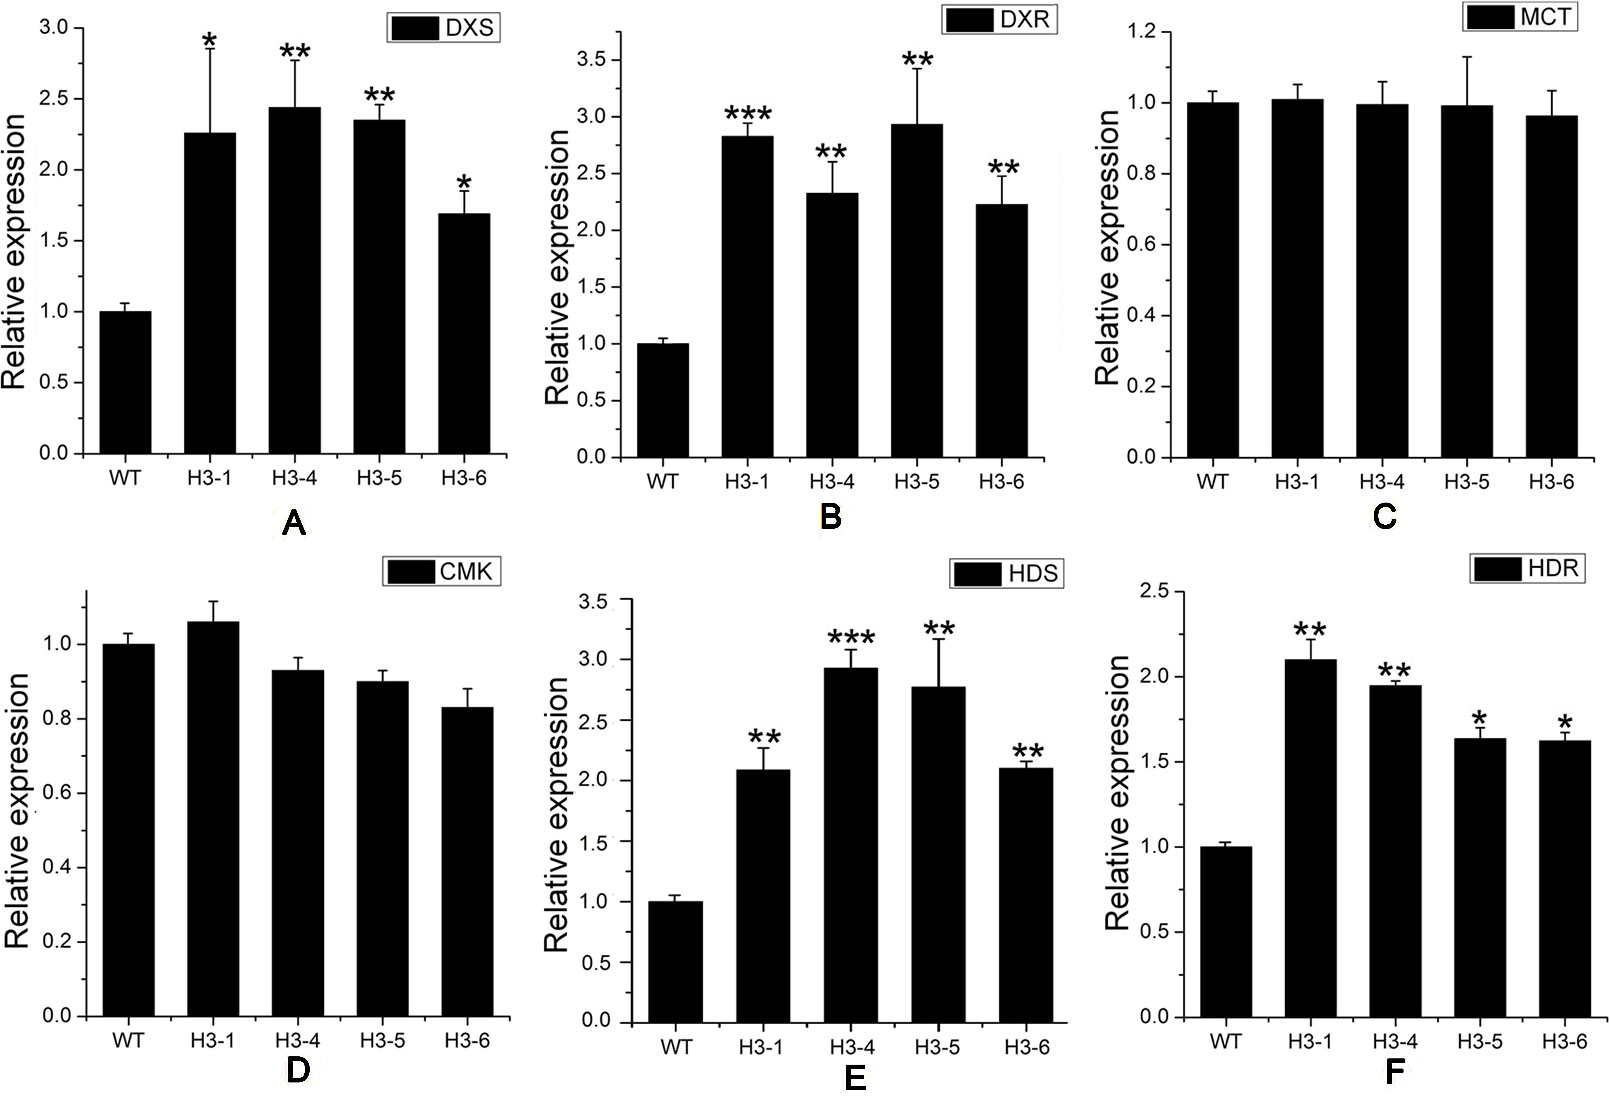
Figure 7 Transcript levels of methylerythritol phosphate (MEP)-related genes in transgenic and wild-type (WT) poplars. Transcript levels of MEP-related genes including (A) DXS (1-deoxy-D-xylulose5-phosphate synthase), (B) DXR (1-deoxy-D-xylulose5-phosphate reductoisomerase), (C) MCT (MEP cytidylyltransferase), (D) CMK (4-diphosphocytidyl-2-C-methyl-D-erythritol kinase), (E) HDS (1-hydroxy-2-methyl-2-(E)-butenyl4-diphosphate synthase), and (F) HDR (1-hydroxy-2-methyl-2-(E)-butenyl4-diphosphate reductase) in transgenic lines and WT. Relative expression was calculated using PtActin as an internal reference. Three independent biological replicates were analyzed with three technical repeats. Vertical bars represent means ± SD (n = 3). *: significant difference at P < 0.05. **: significant difference at P < 0.01. ***: significant difference at P < 0.001.
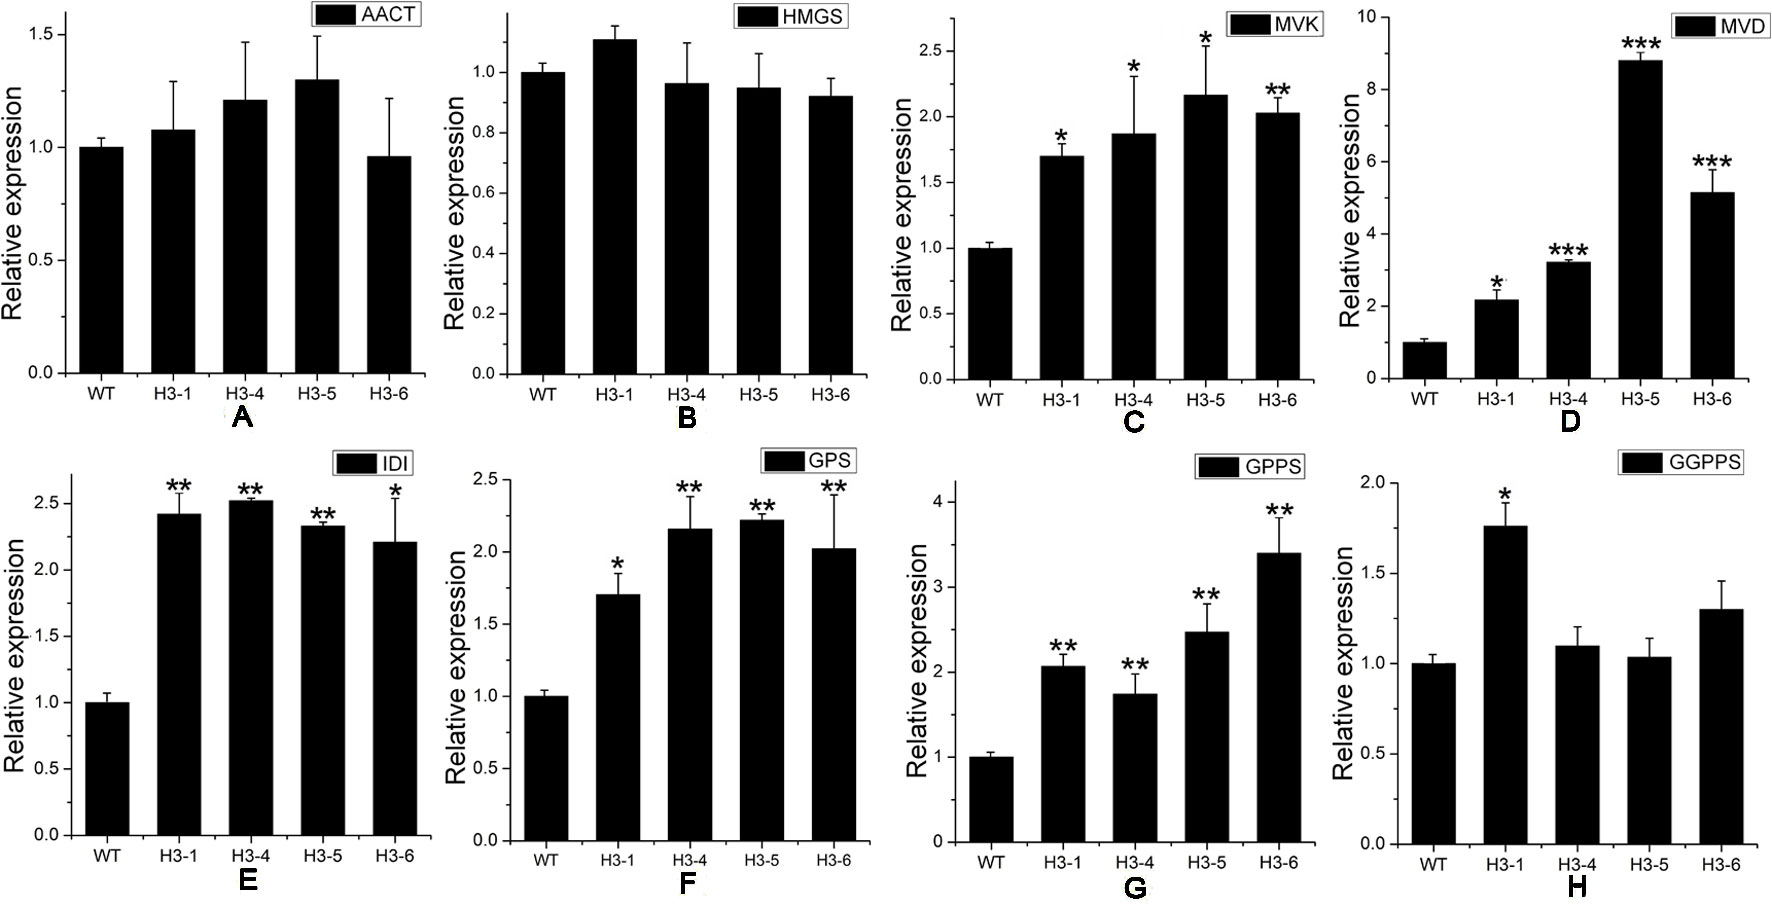
Figure 8 Transcript levels of mevalonic acid (MVA)-, and downstream-related genes in transgenic and wild-type (WT) poplars. Transcript levels of MVA-related genes including (A) AACT (acetoacetyl CoA thiolase), (B) HMGS (3-hydroxy-3-methylglutaryl-CoA synthase), (C) MVK (mevalonate kinase), and (D) MVD (mevalonate5-diphosphate decarboxylase) in transgenic lines and WT. Transcript levels of downstream-related genes including (E) IDI (isopentenyl diphosphate isomerase), (F) GPS (geranyl diphosphate), (G) GPPS (geranyl diphosphate synthase), and (H) GGPPS (geranyl geranyl diphosphate synthase) in transgenic lines and WT. Relative expression was calculated using PtActin as an internal reference. Three independent biological replicates were analyzed with three technical repeats. Vertical bars represent means ± SD (n = 3). *: significant difference at P < 0.05. **: significant difference at P < 0.01. ***: significant difference at P < 0.001.
Increased Expression of Genes Related to ABA and GA and Altered Expression of Genes Related to IAA Between WT and Transgenic Poplars
ABA, a sesquiterpene compound biosynthesized from a C40 carotenoid (Finkelstein, 2013) (Figure S9A), plays a variety of roles in plant growth, regeneration, and stress response processes. GA, a diterpene compound, is a widespread plant hormone (Ozga et al., 2009; Reinecke et al., 2013) (Figure S9B). ABA-related genes include the NCED (9-cis-epoxycarotenoid dioxygenase) and ZEP (zeaxanthin epoxidase) families. Our qRT-PCR results indicated that transcript levels of NCED1, NCED3, NCED5, NCED6, ZEP1, and ZEP2 were significantly enhanced in transgenic lines (Figures 9A–F), and the expression level of ZEP3 was enhanced significantly in the H3-1 line, while small increases were observed in the expression level of ZEP2 in the H3-4, H3-5, and H3-6 lines (Figure 9G). However, the expression levels of GA-related genes showed significant differences between the transgenic lines and WT poplars (Figures 10A–D).
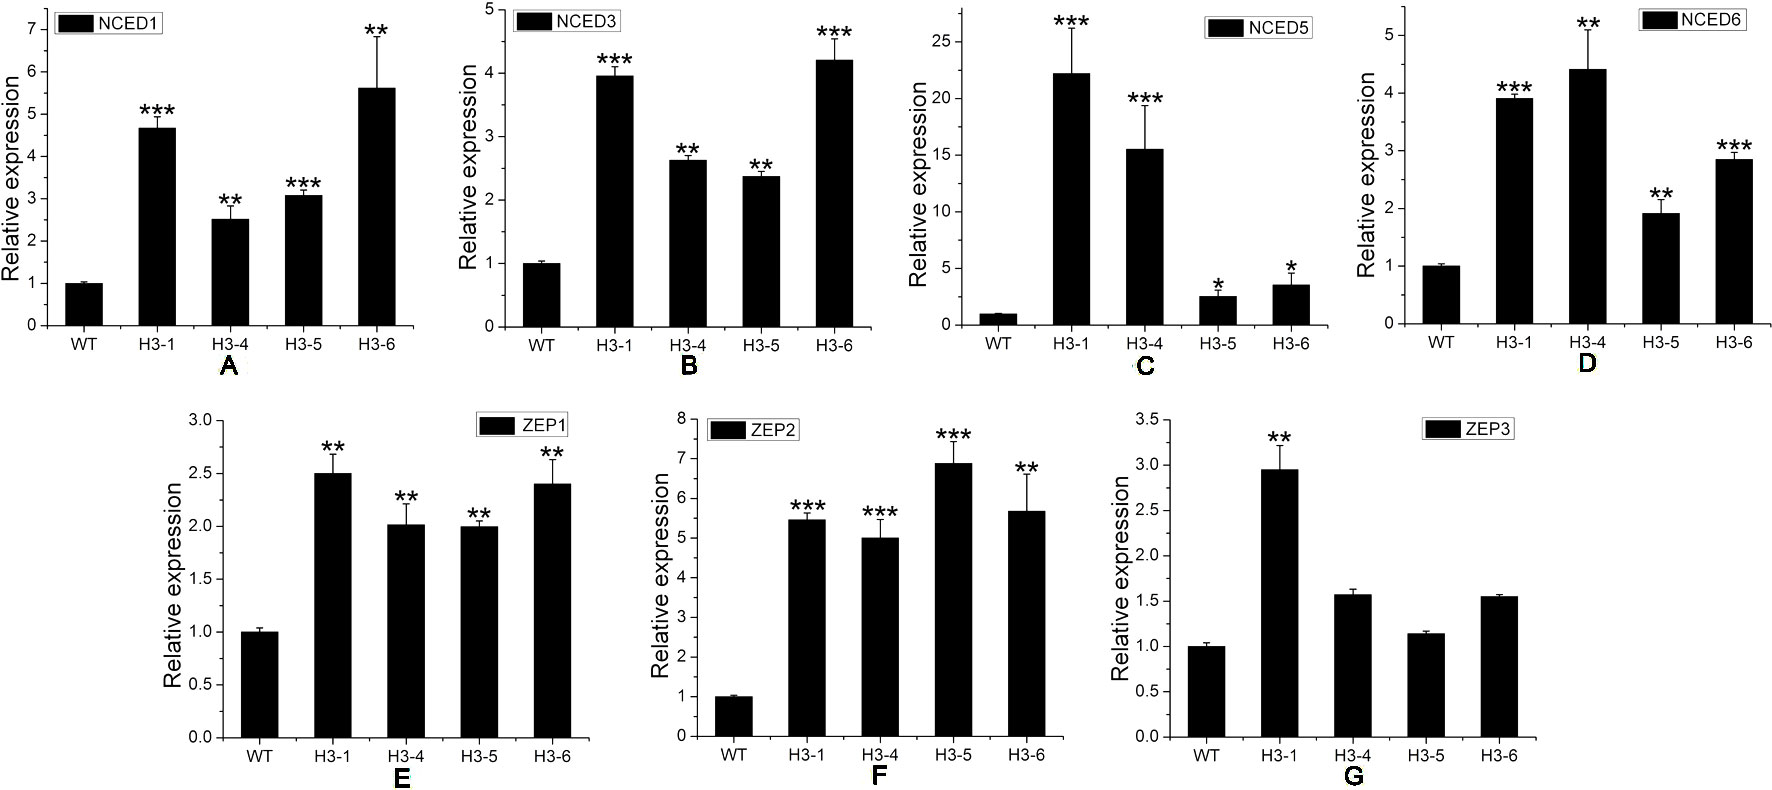
Figure 9 Transcript levels of abscisic acid (ABA)-related genes in transgenic and wild-type (WT) poplars. Transcript levels of ABA-related genes including (A) NCED1, (B) NCED3, (C) NCED5, (D) NCED6, (E) ZEP1, (F) ZEP2, and (G) ZEP3 in transgenic lines and WT poplars. Relative expression was calculated using PtActin as an internal reference. Three independent biological replicates were analyzed with three technical repeats. Vertical bars represent means ± SD (n = 3). *: significant difference at P < 0.05. **: significant difference at P < 0.01. ***: significant difference at P < 0.001.
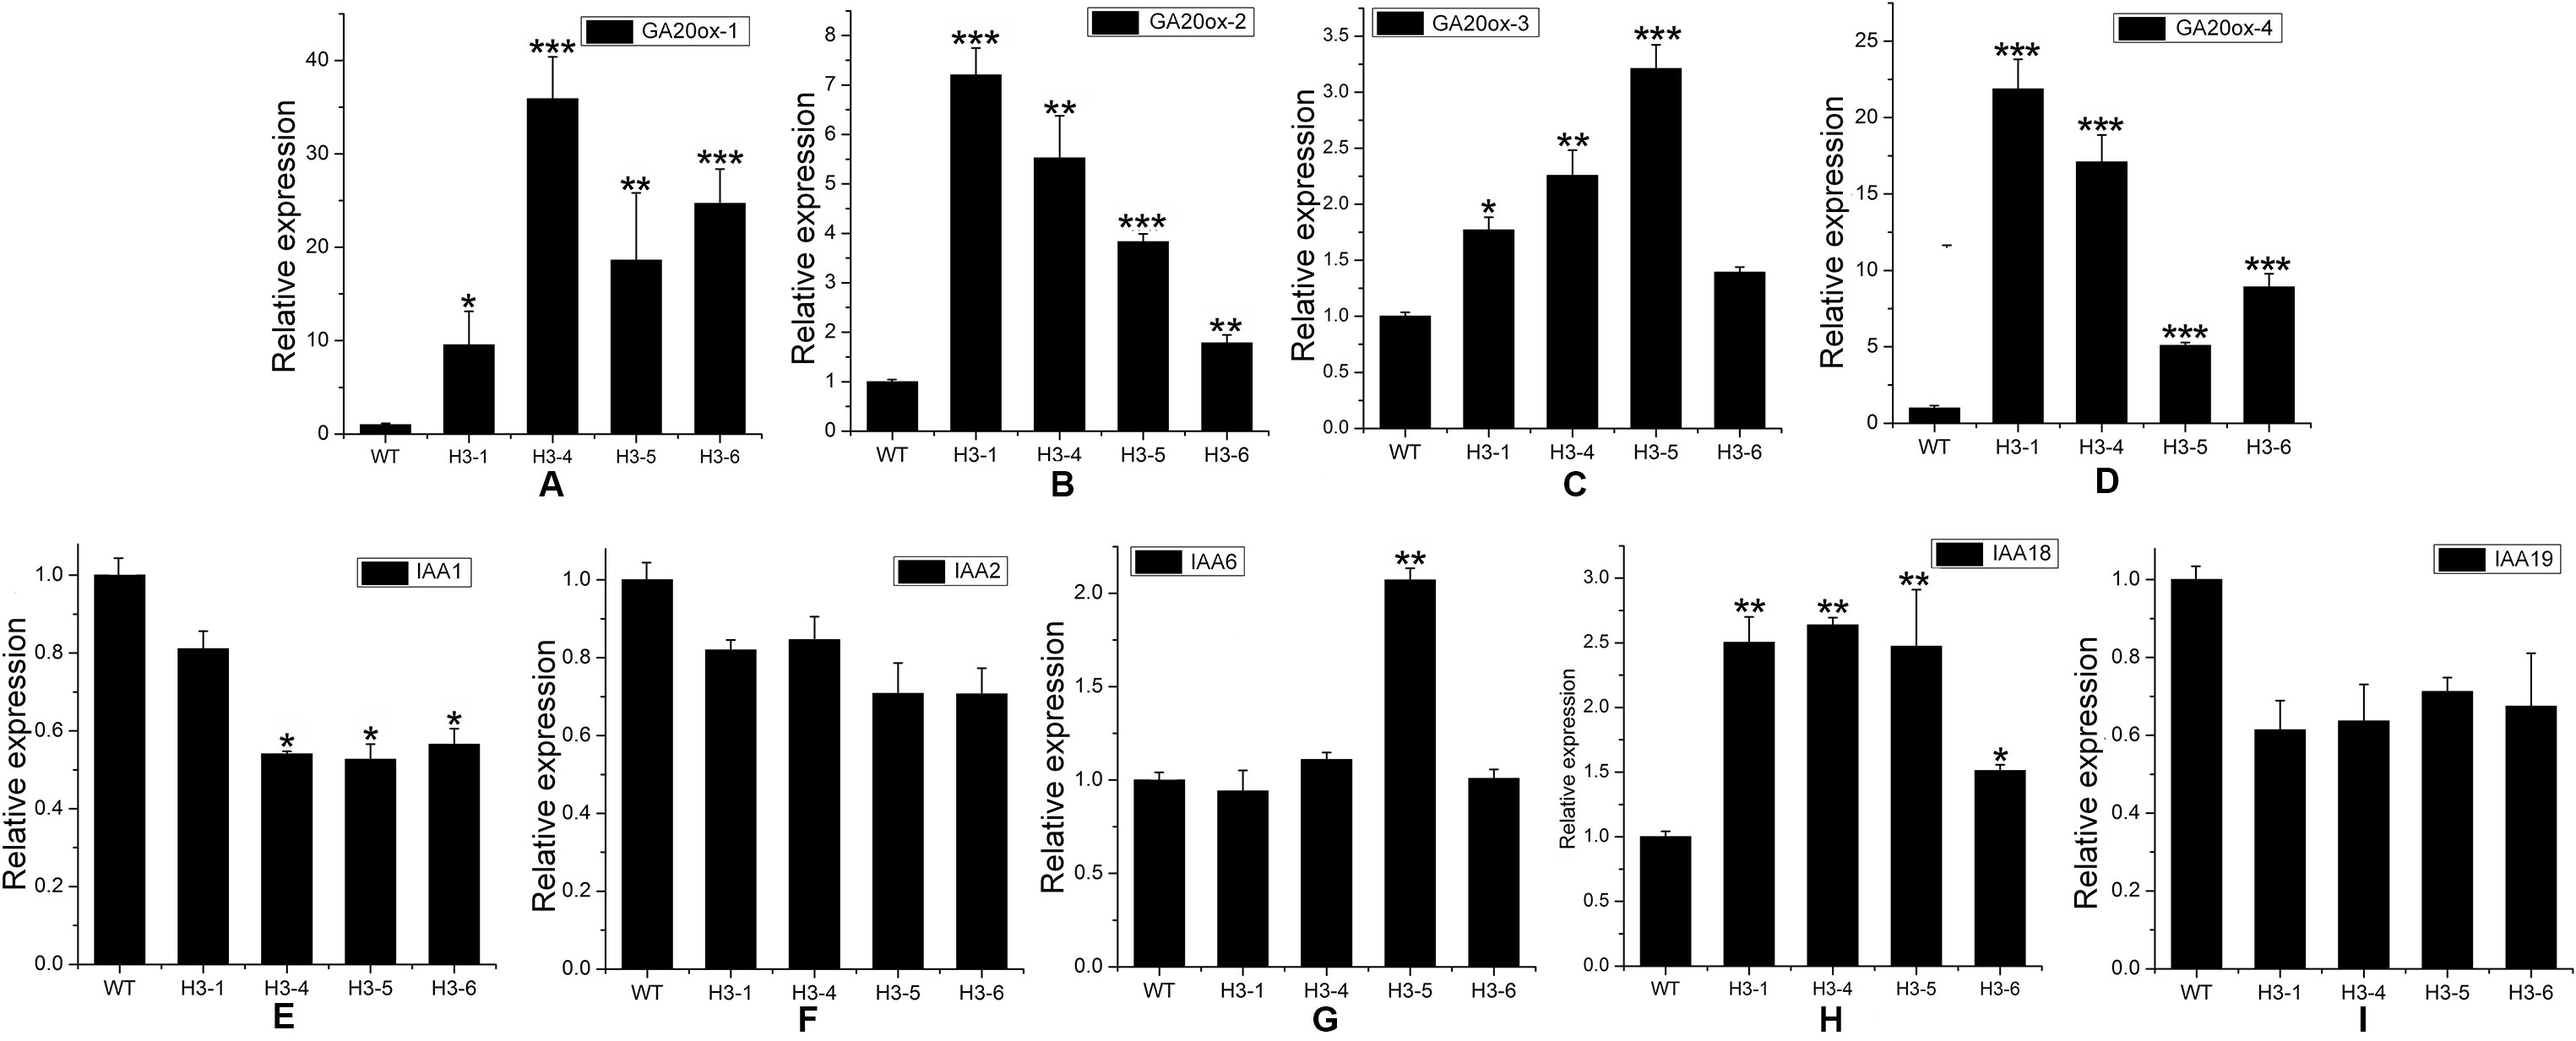
Figure 10 Transcript levels of gibberellic acid (GA)-, and auxin (IAA)-related genes in transgenic and wild-type (WT) poplars. Transcript levels of GA-related genes including (A) GA20OX-1, (B) GA20OX-2, (C) GA20OX-3, and (D) GA20OX-4 in transgenic lines and WT. Transcript levels of GA-related genes including (E) IAA1, (F) IAA2, (G) IAA6, (H) IAA18, and (I) IAA19 in transgenic lines and WT. Relative expression was calculated using PtActin as an internal reference. Three independent biological replicates were analyzed with three technical repeats. Vertical bars represent means ± SD (n = 3). *: significant difference at P < 0.05. **: significant difference at P < 0.01. ***: significant difference at P < 0.001.
Although IAA is not a terpenoid compound (Mashiguchi et al., 2011) (Figure S9C), the transcript levels of IAA-related genes exhibited changes, as shown by the qRT-PCR results. In this study, the genes IAA1 (auxin response factor 1), IAA2, IAA6, IAA18, and IAA19 were chosen for analysis of changes between transgenic lines and WT poplars. The expression level of IAA1 decreased significantly in the H3-4, H3-5, and H3-6 lines, but there was only a slight reduction in the transcript level of IAA1 in the H3-1 line (Figure 10E). For IAA2, the changes in all tested transgenic lines were similar, and IAA2 expression levels decreased slightly when comparing transgenic lines to WT poplars (Figure 10F). For IAA6, the results showed that there was no significant difference in expression levels between the H3-1, H3-4, and H3-6 transgenic lines and WT poplars, but the transcript levels of IAA6 exhibited significant differences (Figure 10G). The expression of IAA18 was significantly increased in the transgenic lines (Figure 10H), whereas IAA19 was significantly decreased (Figure 10I).
Overexpression of PtHMGR in Transgenic Poplar Increases the Contents of ABA and GA3
In the ABA standard, 263.1/153.0 and 263.1/204.2 fragments were detected. Of these, 263.1/153.0 fragments had the higher response value, stable and reproducible results, and less interference from impurities. The 263.1/204.2 fragment ions were used as qualitative ions (Figure S10). The same method was adapted to identify the GA3 and GA4 standards. For the GA3 standard, the 345.2/239.2 fragment was selected as the quantitative ion, and the 345.2/143.0 fragment was used as the qualitative ion (Figure S11). For the GA4 standard product, the 331.4/243.2 fragment ion was selected as the quantitative ion, and the 331.4/213.1 fragment ion was selected as the qualitative ion (Figure S12). Identification of ABA, GA3, and GA4 is shown in Figure 11. The ABA content in transgenic lines was elevated by 22–36% compared to the control, and the mass of ABA in transgenic lines was greater than 2 ng/g. There was a significant difference in ABA contents between the transgenic lines and WT poplars (Figures 11A–D). In addition, the selected transgenic lines produced total GA3 levels 1.25- to 1.5-fold higher than those of the controls. The highest total GA3 levels were detected in the H3-1 line, and the maximum GA3 content in transgenic poplar was 3.08 ng/g (Figures 11A–D). By contrast, the GA4 content in transgenic lines and WT poplars was apparently below the detection limit (Figures 11A–C).
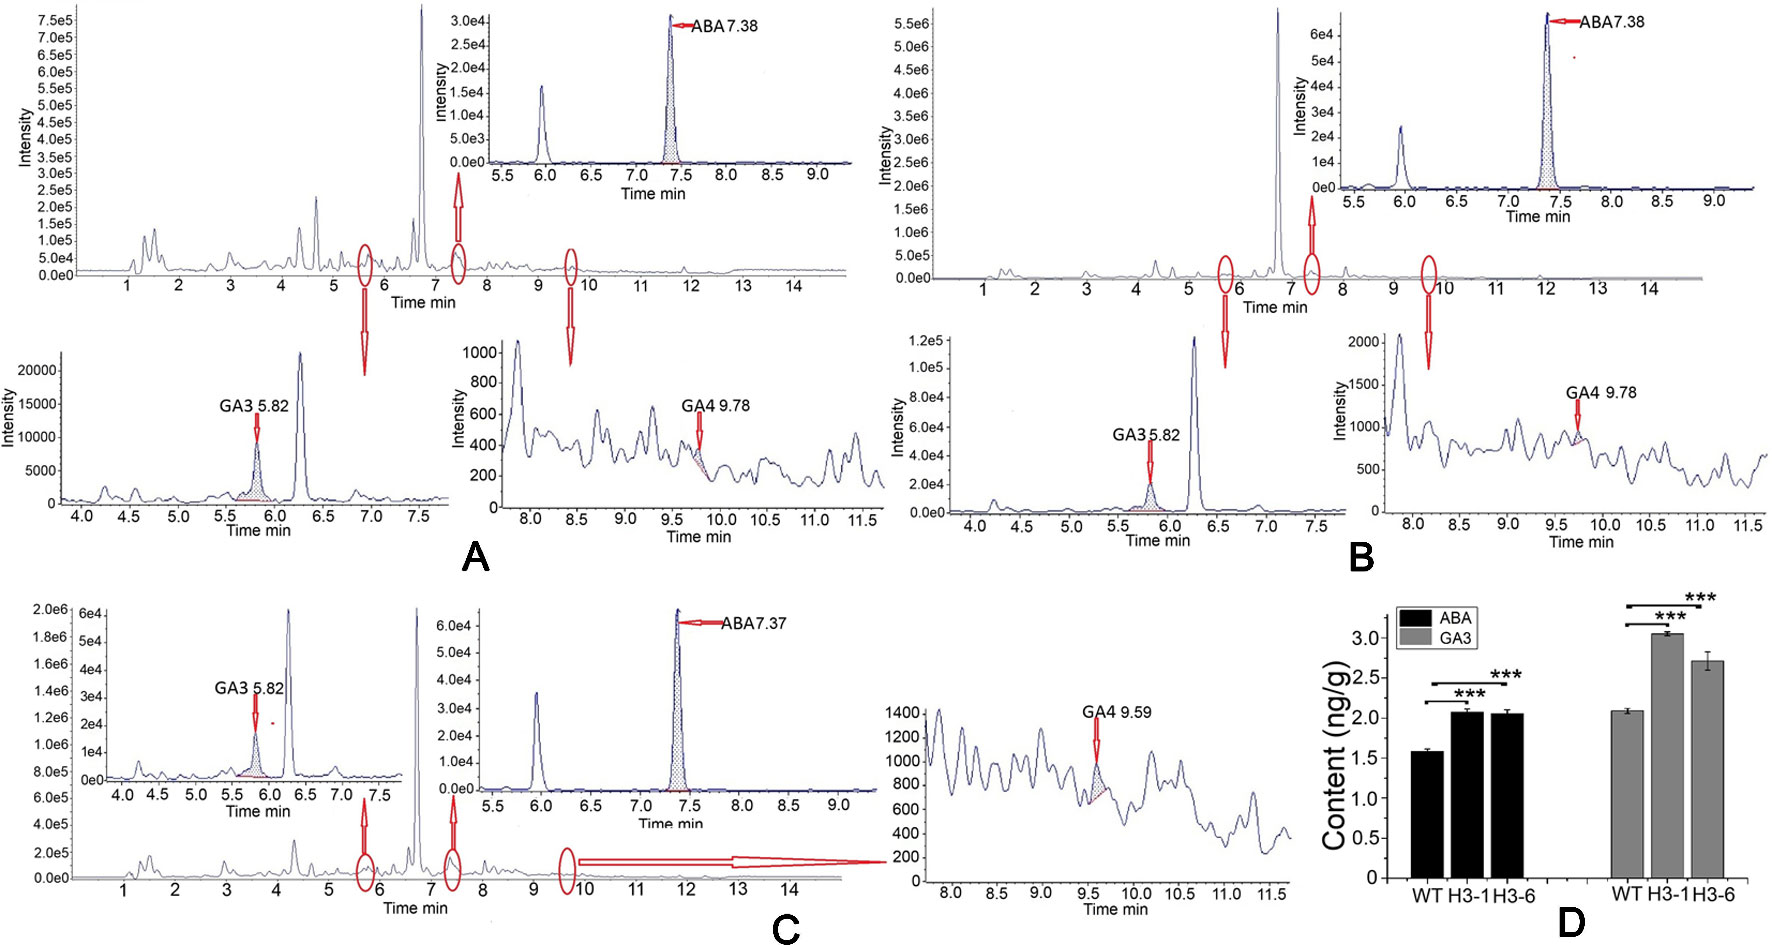
Figure 11 Analysis of abscisic acid (ABA), GA3, and GA4 contents in the transgenic lines and WT poplars using high-performance liquid chromatography (HPLC)–tandem mass spectrometry (MS/MS). (A) HPLC–MS/MS chromatogram of WT raw data and analysis of ABA, GA3, and GA4 contents in wild-type (WT). (B) HPLC–MS/MS chromatogram of transgenic H3-1 raw data and analysis of ABA, GA3, and GA4 content in the H3-1 line. (C) HPLC–MS/MS chromatogram of transgenic H3-6 raw data and analysis of ABA, GA3, and GA4 content in H3-6. (D) Analysis of the difference in ABA and GA3 content between transgenic lines and WT poplars. Three independent biological replicates were analyzed with three technical repeats. Vertical bars represent means ± SD (n = 3). ***: significant difference at P < 0.001.
Overexpression of PtHMGR in Transgenic Poplar Enhances the Contents of α-Carotene, β-Carotene, and Lycopene
The HPLC method was calibrated according to standard curves of α-carotene, β-carotene, and lycopene (Figure S13). To analyze the effect of overexpression of PtHMGR on α-carotene, β-carotene, and lycopene biosynthesis, extracts from 6-month-old cultured poplars were analyzed using HPLC (Figures 12A–D). The selected transgenic lines produced total α-carotene levels 3.5- to 4.8-fold higher than WT poplars, and the highest content of total α-carotene of ∼0.65 mg/g was detected in the H3-4 line (Figure 12E). Identification of β-carotene is shown in Figure 12F. β-carotene increased 6.4- to 11.8-fold compared to the control, and the highest β-carotene accumulation was in the H3-6 line when the selected transgenic lines were compared (Figure 12F). In addition, the lycopene content of these lines increased significantly by 20- to 40-fold compared to the control levels, and the greatest total lycopene content was detected in line H3-6 (Figure 12G).
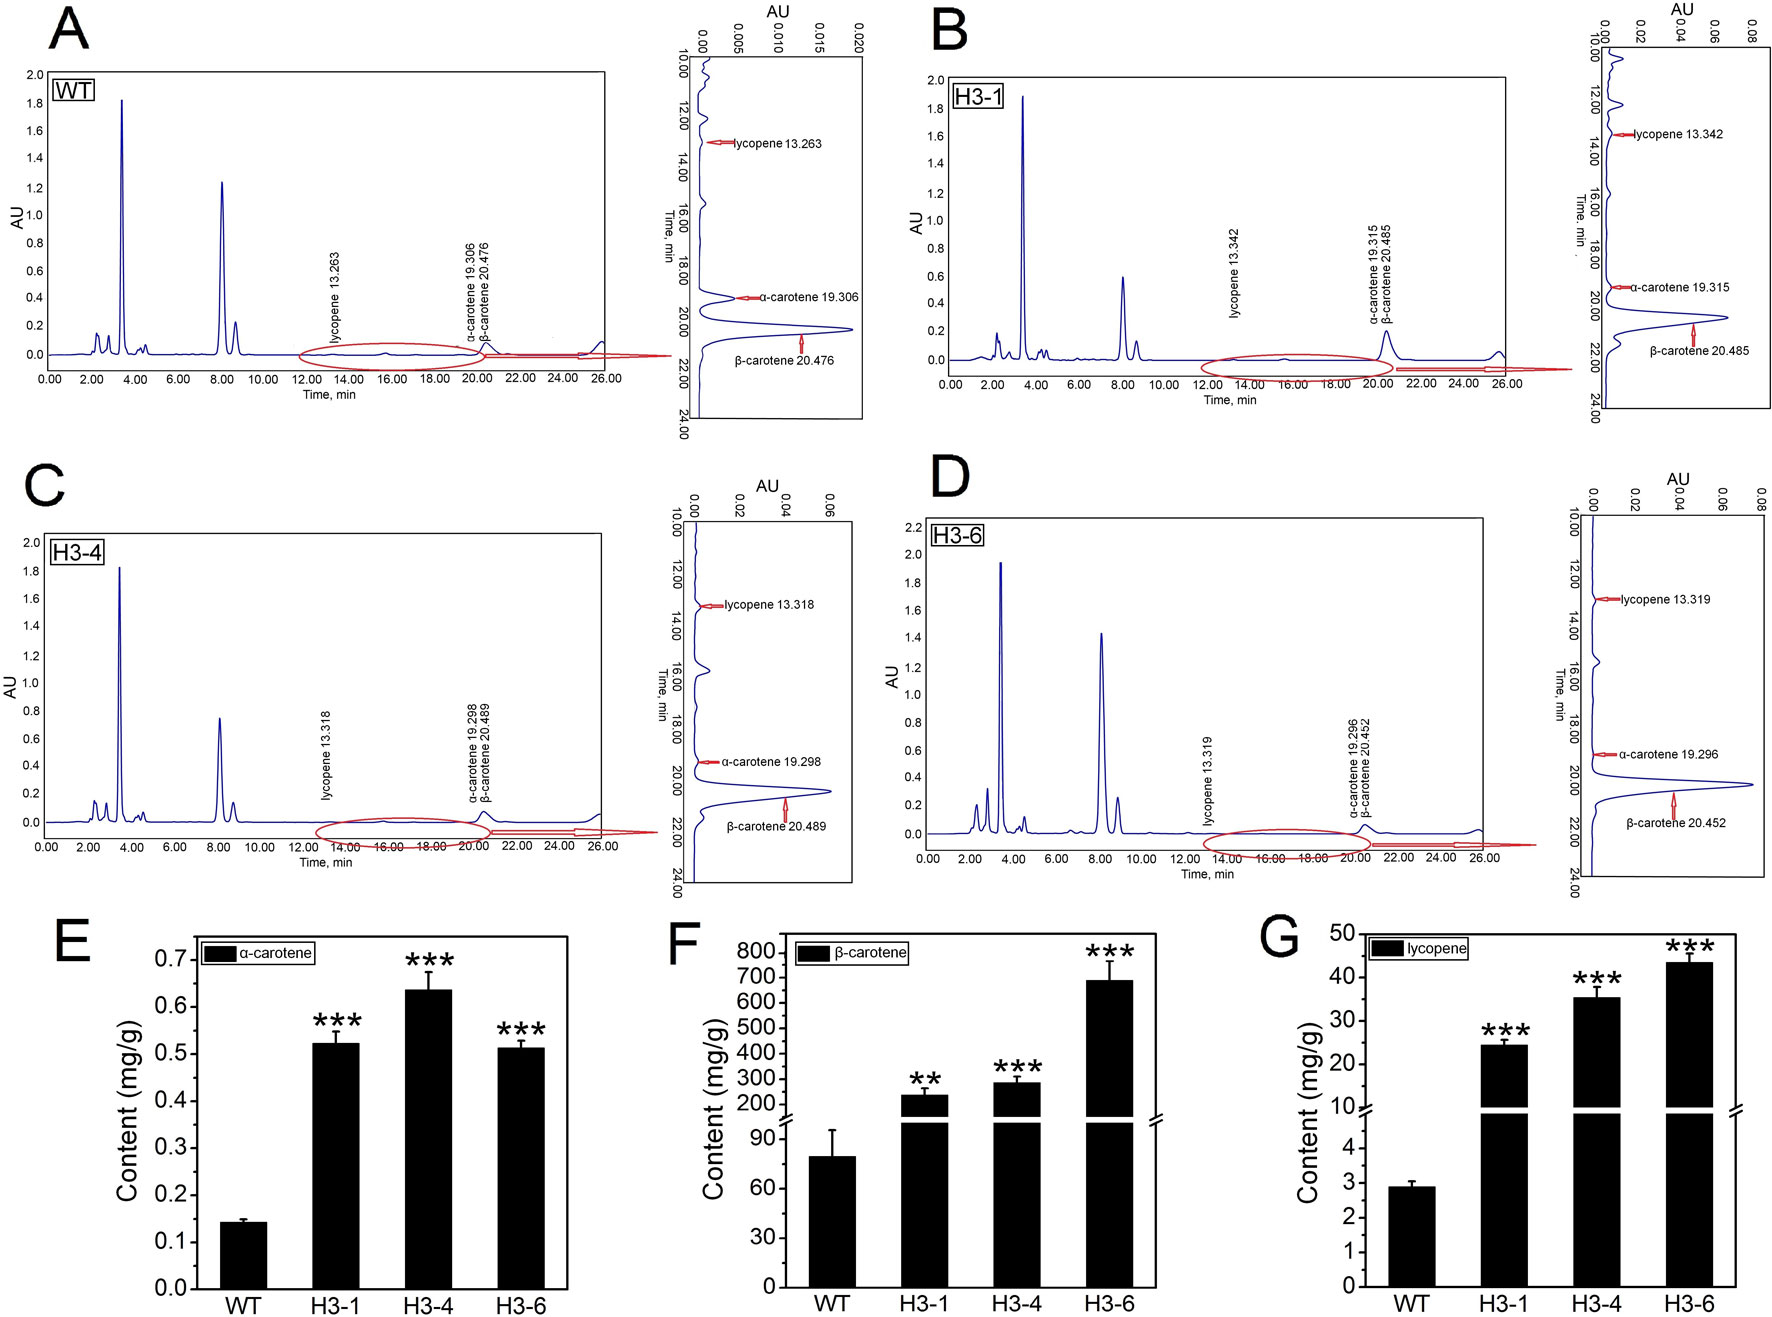
Figure 12 Analysis of α-carotene, β-carotene, and lycopene content in the transgenic lines and WT poplars using HPLC. (A) High-performance liquid chromatography (HPLC) chromatogram of α-carotene, β-carotene, and lycopene content in WT. (B) HPLC chromatogram of α-carotene, β-carotene, and lycopene content in transgenic H3-1. (C) HPLC chromatogram of α-carotene, β-carotene, and lycopene content in transgenic H3-4. (D) HPLC chromatogram of α-carotene, β-carotene, and lycopene content in transgenic H3-6. (E) Analysis of the difference in α-carotene content between the transgenic lines and WT poplars. (F) Analysis of the difference in β-carotene content between the transgenic lines and WT poplars. (G) Analysis of the difference in lycopene content between the transgenic lines and WT poplars. Three independent biological replicates were analyzed with three technical repeats. Vertical bars represent means ± SD (n = 3). **: significant difference at p<0.01. ***: significant difference at P < 0.001.
Discussion
In the MVA pathway, HMGR catalyzes the conversion of HMG-CoA and NADPH into MVA (Maurey et al., 1986). In previous studies of HMGR activity, color complementation assays have been commonly used to confirm the functions of HMGR enzymes, as E. coli with foreign carotenogenic gene clusters introduced can produce and accumulate carotenoid pigments (Matthews and Wurtzel, 2000; Akhtar et al., 2013). Our HPLC/MS analyses demonstrated that PtHMGR synthesizes MVA from HMG-CoA and NADPH, resulting in increased terpenoid content.
Some HMGR genes are constitutively expressed and may be involved in regulating basic physiological metabolism. For example, the expression level of the TmHMGR gene in Taxux media was generally consistent among leaves, roots, and stems (Liao et al., 2004). The transcript level of EuHMGR in Eucommia ulmoides was higher in stems and leaves, but lower in roots (Jiang et al., 2006). The expression pattern of SmHMGR2 in S. miltiorrhiza was highest in leaves, followed by stems and roots (Dai et al., 2011). In this study, transcript levels of PtHMGR in different tissues were analyzed by qRT-PCR; the results indicated that PtHMGR expression was highest in young leaves, followed by mature leaves and roots, and lowest in petioles. In addition, exogenous SA, MeJA, and other hormone treatments could induce upregulation of HMGR gene expression in plants, such as C. avellana CgHMGR (Wang et al., 2007) and SmHMGR (Dai et al., 2011), indicating that phytohormones play a significant role in terpenoid metabolism. In this study, we simulated different stress conditions, using 200 mM NaCl, 10% PEG6000, and 200 µM ABA as salt, drought, and hormone stress treatments, respectively. The results indicated that PtHMGR can be activated in response to stress conditions and may play significant roles in the regulation of terpenoid biosynthesis, growth, and development in poplars.
The HMGR protein determines the direction of carbon flow during the metabolism of terpenoids, so increasing the expression level of HMGR may enhance the biosynthesis of terpenoids in plants. HMGR is not only regulated at the gene level, but also by covalent modification (Goldstein and Brown, 1990; Hemmerlin, 2013). In recent years, interest has grown in the regulation of key enzymes involved in the biosynthesis of secondary metabolites. Many studies have shown that overexpressing HMGR genes in plants can increase terpenoid contents. For example, the AtHMGR gene of A. thaliana was overexpressed in tomato, and phytosterol content in tomato increased 2.4-fold (Enfissi et al., 2010). Artemisinin content in A. annua increased by 17.4% with co-transfection of HMGR and FPS genes (Lin et al., 2011). Overexpression of the HMGR gene in transgenic Ganoderma lucidum led to a 2-fold increase in ganoderic acid content (Xu et al., 2012). Overexpression of HMGR in Parthenium argentatum contributed to an increase in natural rubber content (Dong et al., 2013). Previous studies have demonstrated that the MEP pathway is mainly responsible for producing monoterpenoids, diterpenoids, and tetraterpenes, while the MVA pathway is responsible for synthesizing sesquiterpenoids and triterpenes (Morris et al., 2011; Yang et al., 2012; Liao et al., 2014). In this study, transgenic lines exhibited increased amounts of ABA synthesized from an indirect pathway through the cleavage of a C40 carotenoid precursor, whereas contents of GA, a diterpenoid, and α-carotene, β-carotene, and lycopene increased significantly in transgenic lines. These results show that overexpression of PtHMGR not only increased the content of sesquiterpenes in the MEP pathway but also those of diterpenoids and tetraterpenoids in the MVA pathway. In this study, we demonstrated that manipulation of PtHMGR from the MVA pathway in poplar led to significant increases in α-carotene, β-carotene, and lycopene, which are important pigments that participate widely in various plant physiological processes and have strong antioxidant function, which is of great importance for maintaining cell homeostasis in adverse environments. Thus, metabolic manipulation of HMGR may constitute an alternative strategy for poplar breeding.
A previous study reported that overexpression of BjHMGS and improvement of SlGPS and SlGGPPS resulted in significantly higher carotenoid and vitamin E content in tomato fruits, which is likely indicative of cross-talk between the MVA and MEP pathways (Liao et al., 2018). In the current study, we also investigated how PtHMGR overexpression increases terpenoid content. Transcription levels of MVA and MEP-related genes were measured. We found that the transcript levels of DXS, DXR, HDS, and HDR in the MEP pathway, and the expression levels of IDI, GPS, GPPS, and GGPPS, were significantly elevated when compared to transgenic and WT plants. Transcript levels of MVK and MVD in the MVA pathway also increased significantly in transgenic plants. Together, these results suggest that overexpression of HMGR in the cytosol affects not only the expression of MVA-related genes, but also the transcript levels of MEP-related genes. PtHMGR-overexpressing poplars exhibited significantly higher α-carotene, β-carotene, and lycopene content, perhaps due to cross-talk between the MVA and MEP pathways. When DXS is over- or underexpressed in Arabidopsis, its transcript levels change according to endogenous isoprenoid content, suggesting a possible function for DXS in the regulation of isoprenoids biosynthesis. Surprisingly, DXS expression influenced endogenous ABA levels, suggesting that the early stages of ABA synthesis may partly contribute to ABA regulation (Estévez et al., 2001). In this study, PtHMGR-overexpressing poplars exhibited significantly higher transcript levels of NCED and ZEP, as well as improved endogenous ABA levels. Treatment of poplar with exogenous ABA resulted in increased PtHMGR expression. Therefore, HMGR not only regulates ABA biosynthesis, but is also regulated by ABA feedback. ABA is also an endogenous messenger that responds to a wide range of biotic and abiotic stresses in plants (Ton et al., 2009). ABA content is associated with many physiological processes, and the regulation of its biosynthesis is a key factor therein. We also observed an interesting phenomenon regarding the transcription levels of IAA-related genes. Although IAA is not a terpenoid, significant changes in the IAA1, IAA18, and IAA19 transcript levels occurred, as did slight changes in the transcript levels of IAA2 and IAA6.
In conclusion, we cloned a full-length gene encoding PtHMGR, which is involved in the biosynthesis of terpenoids. PtHMGR was functionally characterized and demonstrated to be the key entry point enzyme. Moreover, overexpression of PtHMGR changed the transcript levels of MVA-, MEP-, and downstream-related genes. Furthermore, significant positive correlations between PtHMGR expression and terpenoid content were revealed. These correlations further confirmed that PtHMGR could be one of the most important enzymes involved in the biosynthesis of terpenoids. Further studies to identify genes related to terpenoids would be useful not only for understanding terpenoid biosynthesis, but could also provide guidance for molecular breeding efforts.
Data Availability Statement
All datasets for this study are included in the article/Supplementary Material.
Author Contributions
HW carried out the experimental work and prepared the first draft of the manuscript and figures. CX, AM, and WS provided critical inputs for the study as well as during the preparation of the manuscript. QZ, CX, and DL designed the research and analyzed the results.
Funding
This work was supported by the National Key Program on Transgenic Research (2018ZX08020002), the National Science Foundation of China (No. 31570650), and the Priority Academic Program Development of Jiangsu Higher Education Institutions.
Conflict of Interest
The authors declare that the research was conducted in the absence of any commercial or financial relationships that could be construed as a potential conflict of interest.
Supplementary Material
The Supplementary Material for this article can be found online at: https://www.frontiersin.org/articles/10.3389/fpls.2019.01476/full#supplementary-material
Figure S1 | Nucleotide and deduced amino acid sequences of PtHMGR (XP_002300544.1). The complete deduced amino acid sequence is depicted in single-letter code beneath the corresponding nucleotide sequence. The initiation codon is boxed, and the termination codon is indicated with an asterisk.
Figure S2 | Comparison of the deduced amino acid sequences of the conserved regions of PtHMGR and corresponding parts of other known HMGR proteins. The two conserved domains, the HMG-CoA binding domain and NADPH binding motif, are numbered and indicated with boxes.
Figure S3 | Construction of the prokaryotic expression vectors for PtHMGR using SalI and EagI as restriction sites. (A) PET-28a as the prokaryotic expression vector for construction of PET-28a-PtHMGR using kanamycin as a screening marker. (B) pSUMO as the prokaryotic expression vector for construction of pSUMO-PtHMGR using kanamycin as a screening marker. (C) PET-32a as the prokaryotic expression vector for construction of PET-32a-PtHMGR using amphomycin as a screening marker. (D) PET-28a as the prokaryotic expression vector for construction of PET-28a-truncated PtHMGR using kanamycin as a screening marker.
Figure S4 | Prokaryotic expression analysis of the truncated PtHMGR protein induced at 110 rpm at 10°C or 4°C. (A) Analysis of the truncated PtHMGR protein-induced at 110 rpm for 48 h at 10°C. Lane M: molecular mass marker; lane 1: negative control; lanes 2–4: colonies 1–3, respectively, induced with 1 mM IPTG. (B) Analysis of supernatant and precipitation induced at 110 rpm for 48 h at 10°C. Lane M: molecular mass marker; lane 1: negative control; lane 3: precipitation; lane 4: supernatant. (C) Analysis of the truncated PtHMGR protein-induced at 110 rpm for 72 h at 4°C. Lane M: molecular mass marker; lane 1: negative control; lanes 2–4: colonies 1–3, respectively, induced with 1 mM IPTG. (D) Analysis of the supernatant and precipitate induced at 110 rpm for 72 h at 4°C. Lane M: molecular mass marker; lane 1: negative control; lane 3: precipitate; lane 4: supernatant. (E) Purification of the truncated PtHMGR protein using the supernatant. Lane M: molecular weight marker; lane 1: supernatant of cell lysate; lane 2: flow-through; lanes 3–4: wash; lane 5: elution.
Figure S5 | Detection of the truncated PtHMGR protein in the supernatant in vitro with 1 ml reaction mixture (2.5 mM K2HPO4, 5 mM KCl, 1 mM EDTA, 5 mM DTT, 1 mg/ml PtHMGR, 3 mM NADPH as a coenzyme, and 0.3 mM of HMG-CoA as a substrate, pH 7.2). (A) Total ion chromatogram of HPLC reaction products. The peak at retention time 2.2 was attributed to target production (MVA). (B) Extracted ion chromatography (XIC) analysis. (C) TOFMS analysis. The SCIEX TripleTOF 5600+ m/z value was 131.0710, consistent with MVA.
Figure S6 | Analysis of the nucleotide sequences of PtHMGR-encoding genes in P. trichocarpa. Six PtHMGR genes were localized to chromosomes 1, 2, 4, 5, 9, and 11. The Potri. numbers of the PtHMGR genes obtained from the “Phytozome 12” data bank are as follows: (Potri.001G457000.1), (Potri.002G004000.1), (Potri.004G208500.1), (Potri.005G257000.1), (Potri.009G169900.1), and (Potri.011G145000.1).
Figure S7 | The transformation process of Nanlin895 poplars. (A) Poplar leaf pieces and petioles infected by Agrobacterium EHA105 containing pGWB9-PtHMGR were cultured on regeneration medium supplemented with 200 mg/ml cefotaxime, 30 mg/ml kanamycin, 0.002 mg/L thidiazuron (TDZ), 0.5 mg/L N-6-benzyladenine (6-BA), 30 g/L sucrose, and 8 g/L agar at pH 5.8. (B) Putative shoots were cultured on bud elongation medium supplemented with 200 mg/ml cefotaxime, 20 mg/ml kanamycin, 0.001 mg/L TDZ, 0.2 mg/L 6-BA, 30 g/L sucrose, and 8 g/L agar, at pH 5.8. (C) Putative roots were cultured on root medium supplemented with 200 mg/ml cefotaxime, 10 mg/ml kanamycin, 30 g/L sucrose, and 8 g/L agar, at pH 5.8. (D) and (E) Transgenic lines were grown in soil. Bars represent lengths of (A and (B) 0.5 cm, (C) 1 cm, (D) 2 cm, and (E) 3 cm.
Figure S8 | Molecular identification of poplar plants overexpressing PtHMGR. (A) Detection of the PtHMGR gene in transgenic lines and WT through PCR using the genome as a template, the primer of CaMV35S-F as the upstream primer, and the primer of ORF-PtHMGR-R as the downstream primer. Lane M: 2K molecular mass marker; lane 1: negative control; lanes 2–9: transgenic lines 1–8, respectively. (B) Detection of PtHMGR gene expression levels in transgenic lines and WT through qRT-PCR using cDNA as template. Three independent biological replicates were analyzed with three technical repeats. Vertical bars represent means ± SD (n = 3). *: significant difference at P < 0.05. **: significant difference at P < 0.01. ***: significant difference at P < 0.001.
Figure S9 | The (A) ABA, (B) GA, and (C) IAA biosynthesis pathways in plants.
Figure S10 | HPLC–MS/MS chromatogram of ABA standards and equations for ABA. HPLC–MS/MS chromatogram of standard ABA at (A) 0.1, (B) 0.2, (C) 0.5, (D) 2, (E) 5, (F) 20, (G) 50, and (H) 200 ng/mL concentrations, dissolved in methanol/0.1% formic acid. (I) Equations for the ABA standard curves.
Figure S11 | HPLC-MS/MS chromatogram of GA3 standards and equations for GA3. HPLC-MS/MS chromatogram of standard GA3 at 0.1 (A), 0.2 (B), 0.5 (C), 2 (D), 5 (E), 20 (F), 50 (G), and 200 (H) ng/ml concentrations, dissolved in methanol/0.1% formic acid. (I) Equations for the GA3 standard curves.
Figure S12 | HPLC–MS/MS chromatogram of GA4 standards and equations for ABA. HPLC–MS/MS chromatogram of standard GA4 at (A) 0.5, (B) 2, (C) 5, (D) 20, (E) 50, and (F) 200 ng/ml concentrations, dissolved in methanol/0.1% formic acid. (G) Equations for the GA4 standard curves.
Figure S13 | Plots of α-carotene, β-carotene, and lycopene standard curves based on values obtained from standards tested through HPLC. (A) α-carotene standard curve. (B) β-carotene standard curve. (C) Lycopene standard curve. (D) Equations of the α-carotene, β-carotene, and lycopene standard curves.
Table S1 | Primer sequences used in this study.
References
Alborn, H. T., Hansen, T. V., Jones, T. H., Bennett, D. C., Tumlinson, J. H., Schmelz, E. A., et al. (2007). Disulfooxy fatty acids from the American bird grasshopper Schistocerca americana, elicitors of plant volatiles. Proc. Natl. Acad. Sci. United States America 104 (32), 12976–12981. doi: 10.1073/pnas.0705947104
Akhtar, N., Gupta, P., Sangwan, N. S., Sangwan, R. S., Trivedi, P. K. (2013). Cloning and functional characterization of 3-hydroxy-3-methylglutaryl coenzyme A reductase gene from Withania somnifera: an important medicinal plant. Protoplasma 250 (2), 613–622. doi: 10.1007/s00709-012-0450-2
Ayora-Talavera, T., Chappell, J., Lozoya-Gloria, E., Loyola-Vargas, V. M. (2002). Overexpression in Catharanthus roseus, hairy roots of a truncated hamster 3-hydroxy-3-methylglutaryl-coA reductase gene. Appl. Biochem. Biotechnol. 97 (2), 135–145. doi: 10.1385/ABAB:97:2:135
Bach, T. J., Lichtenthaler, H. K. (1983). Inhibition by mevinolin of plant growth, sterol formation and pigment accumulation. Physiolog. Plantarum 59 (1), 50–60. doi: 10.1111/j.1399-3054.1983.tb06570.x
Bischoff, K. M., Rodwell, V. W. (1996). 3-Hydroxy-3-methylglutaryl-coenzyme A reductase from Haloferax volcanii: purification, characterization, and expression in Escherichia coli. J. Bacteriol. 178 (1), 19–23. doi: 10.1128/jb.178.1.19-23.1996
Bouvier, F., Rahier, A., Camara, B. (2005). Biogenesis, molecular regulation, and function of plant isoprenoids. Prog. In Lipid Res. 44 (6), 357–429. doi: 10.1016/j.plipres.2005.09.003
Cao, X., Zong, Z., Ju, X., Sun, Y., Dai, C., Liu, Q. (2010). Molecular cloning, characterization and function analysis of the gene encoding HMG-CoA reductase from Euphorbia pekinensis rupr. Mol. Biol. Rep. 37 (3), 1559–1567. doi: 10.1007/s11033-009-9558-7
Choi, D., Ward, B. L., Bostock, R. M. (1992). Differential induction and suppression of potato 3-hydroxy-3-methylglutaryl coenzyme A reductase genes in response to Phytophthora infestans and to its elicitor arachidonic acid. Plant Cell 4 (10), 1333–1344. doi: 10.1105/tpc.4.10.1333
Cowan, A. K., Cripps, R. F., Richings, E. W., Taylor, N. J. (2001). Fruit size: towards an understanding of the metabolic control of fruit growth using avocado as a model system. Physiolog. Plantarum 111 (2), 127–136. doi: 10.1034/j.1399-3054.2001.1110201.x
Dai, Z., Cui, G., Zhou, S. F., Zhang, X., Huang, L. (2011). Cloning and characterization of a novel 3-hydroxy-3-methylglutaryl coenzyme A reductase gene from Salvia miltiorrhiza, involved in diterpenoid tanshinone accumulation. J. Plant Physiol. 168 (2), 148–157. doi: 10.1016/j.jplph.2010.06.008
Dong, N., Ponciano, G., Mcmahan, C. M., Coffelt, T. A., Johnson, L., Creelman, R. (2013). Overexpression of 3-hydroxy-3-methylglutaryl coenzyme A reductase in Parthenium argentatum (guayule). Industrial Crops Prod. 46 (4), 15–24. doi: 10.1016/j.indcrop.2012.12.044
Eapen, S., D’Souza, S. F. (2005). Prospects of genetic engineering of plants for phytoremediation of toxic metals. Biotechnol. Adv. 23 (2), 97–114. doi: 10.1016/j.biotechadv.2004.10.001
Eisenreich, W., Rohdich, F., Bacher, A. (2001). Deoxyxylulose phosphate pathway to terpenoids. Trends In Plant Sci. 6 (2), 78–84. doi: 10.1016/S1360-1385(00)01812-4
Enfissi, E. M., Fraser, P. D., Lois, L. M., Boronat, A., Schuch, W., Bramley, P. M. (2010). Metabolic engineering of the mevalonate and non-mevalonate isopentenyl diphosphate-forming pathways for the production of health-promoting isoprenoids in tomato. Plant Biotechnol. J. 3 (1), 17–27. doi: 10.1111/j.1467-7652.2004.00091.x
Estévez, J. M., Cantero, A., Reindl, A., Reichler, S., León, P. (2001). 1-Deoxy-D-xylulose-5-phosphate synthase, a limiting enzyme for plastidic isoprenoid biosynthesis in plants. J. Biol. Chem. 276 (25), 22901–22909. doi: 10.1074/jbc.M100854200
Finkelstein, R. (2013). Abscisic acid synthesis and response. Arabidopsis Book/American Soc. Plant Biolog. 11, e0165. doi: 10.1199/tab.0166
Goldstein, J. L., Brown, M. S. (1990). Regulation of the mevalonate pathway. Nat. 343 (6257), 425. doi: 10.1038/343425a0
Grassmann, J., Hippeli, S., Elstner, E. F. (2002). Plant’s defense and its benefits for animals and medicine: the role of phenolics and terpenoids in avoiding oxygen stress. Plant Physiol. Biochem. 40 (6-8), 471–478. doi: 10.1016/S0981-9428(02)01395-5
Hemmerlin, A., Bach, T. J. (1998). Effects of mevinolin on cell cycle progression and viability of tobacco BY-2 cells. Plant J. 14 (1), 65–74. doi: 10.1046/j.1365-313X.1998.00095.x
Hemmerlin, A. (2013). Post-translational events and modifications regulating plant enzymes involved in isoprenoid precursor biosynthesis. Plant Sci. 203, 41–54. doi: 10.1016/j.plantsci.2012.12.008
Heuston, S., Begley, M., Davey, M. S., Eberl, M., Casey, P. G., Hill, C. (2012). HmgR, a key enzyme in the mevalonate pathway for isoprenoid biosynthesis, is essential for the growth of Listeria monocytogenes EDGe. Microbiol. 158 (Pt7), 1684–1693. doi: 10.1099/mic.0.056069-0
Hunter, W. N. (2007). The non-mevalonate pathway of isoprenoid precursor biosynthesis. J. Biol. Chem. 282, 21573–21577. doi: 10.1074/jbc.R700005200
Istvan, E. S., Palnitkar, M., Buchanan, S. K., Deisenhofer, J. (2000). Crystal structure of the catalytic portion of human HMG-CoA reductase: insights into the regulation of activity and catalysis. EMBO J. 19 (5), 819–830. doi: 10.1093/emboj/19.5.819
Jiang, J., Kai, G., Cao, X., Chen, F., He, D., Liu, Q. (2006). Molecular cloning of a HMG-CoA reductase gene from Eucommia ulmoides oliver. Biosci. Rep. 26 (2), 171–181. doi: 10.1007/s10540-006-9010-3
Kim, Y. J., Lee, O. R., Ji, Y. O., Jang, M. G., Yang, D. C. (2014). Functional analysis of HMGR encoding genes in triterpene saponin-producing Panax ginseng Meyer. Plant Physiol. 165 (1), 373–387. doi: 10.1104/pp.113.222596
Kirby, J., Keasling, J. D. (2009). Biosynthesis of plant isoprenoids: perspectives for microbial engineering. Annu. Rev. Plant Biol. 60, 335–355. doi: 10.1146/annurev.arplant.043008.091955
Leivar, P., Antolín-Llovera, M., Arró, M., Ferrer, A., Boronat, A., Campos, N. (2011). Modulation of plant HMG-CoA reductase by protein phosphatase 2a. Plant Signaling Behav. 6 (8), 1127–1131. doi: 10.4161/psb.6.8.16363
Li, W., Liu, W., Wei, H., He, Q., Chen, J., Zhang, B. (2014). Species-specific expansion and molecular evolution of the 3-hydroxy-3-methylglutaryl coenzyme A reductase (HMGR) gene family in plants. PloS One 9 (4), e94172. doi: 10.1371/journal.pone.0094172
Liao, P., Chen, X., Wang, M., Bach, T., Chye, M. L. (2018). Improved fruit α-tocopherol, carotenoid, squalene and phytosterol content through manipulation of Brassica juncea 3-hydroxy-3-methylglutaryl-CoA synthase1 in transgenic tomato. Plant Biotechnol. J. 16, 784–796. doi: 10.1111/pbi.12828
Liao, P., Wang, H., Hemmerlin, A., Nagegowda, D. A., Bach, T. J., Wang, M., et al. (2014). Past achievements, current status and future perspectives of studies on 3-hydroxy-3-methylglutaryl-CoA synthase (HMGS) in the mevalonate (MVA) pathway. Plant Cell Rep. 33 (7), 1005–1022. doi: 10.1007/s00299-014-1592-9
Liao, Z. H., Tan, Q. M., Chai, Y. R., Zuo, K. J., Chen, M., Gong, Y. F. (2004). Cloning and characterisation of the gene encoding HMG-CoA reductase from Taxus media and its functional identification in yeast. Funct. Plant Biol. 31 (1), 785–801. doi: 10.1071/FP03153
Lin, X., Zhou, Y., Zhang, J., Lu, X., Zhang, F., Shen, Q. (2011). Enhancement of artemisinin content in tetraploid Artemisia annua plants by modulating the expression of genes in the artemisinin biosynthetic pathway. Biotechnol. Appl. Biochem. 58 (1), 50–57. doi: 10.1002/bab.13
Lois, L. M., Rodríguez-Concepción, M., Gallego, F., Campos, N., Boronat, A. (2010). Carotenoid biosynthesis during tomato fruit development: regulatory role of 1-deoxy-d-xylulose 5-phosphate synthase. Plant J. 22 (6), 503–513. doi: 10.1046/j.1365-313x.2000.00764.x
Luo, H., Song, J., Li, X., Sun, C., Li, C., Luo, X., et al. (2013). Cloning and expression analysis of a key device of HMGR gene involved in ginsenoside biosynthesis of Panax ginseng via synthetic biology approach. Acta Pharm. Sin. 48 (2), 219–227.
Maldonado-Mendoza, I. E., Burnett, R. J., Nessler, C. L. (1992). Nucleotide sequence of a cDNA encoding 3-hydroxy-3-methylglutaryl coenzyme A reductase from Catharanthus roseus. Plant Physiol. 100 (3), 1613–1614. doi: 10.1104/pp.100.3.1613
Marmiroli, M., Pietrini, F., Maestri, E., Zacchini, M., Marmiroli, N., Massacci, A. (2011). Growth, physiological and molecular traits in Salicaceae trees investigated for phytoremediation of heavy metals and organics. Tree Physiol. 31 (12), 1319–1334. doi: 10.1093/treephys/tpr090
Mashiguchi, K., Tanaka, K., Sakai, T., Sugawara, S., Kawaide, H., Natsume, M., et al. (2011). The main auxin biosynthesis pathway in Arabidopsis. Proc. Natl. Acad. Sci. 108 (45), 18512–18517. doi: 10.1073/pnas.1108434108
Matthews, P. D., Wurtzel, E. T. (2000). Metabolic engineering of carotenoid accumulation in Escherichia coli by modulation of the isoprenoid precursor pool with expression of deoxyxylulose phosphate synthase. Appl. Microbiol. Biotechnol. 53 (4), 396–400. doi: 10.1007/s002530051632
Maurey, K., Wolf, F., Golbeck, J. (1986). 3-Hydroxy-3-methylglutaryl coenzyme A reductase activity in Ochromonas malhamensis: a system to study the relationship between enzyme activity and rate of steroid biosynthesis. Plant Physiol. 82 (2), 523–527. doi: 10.1104/pp.82.2.523
Morris, W. L., Ducreux, L. J. M., Shepherd, T., Lewinsohn, E., Davidovich-Rikanati, R., Sitrit, Y., et al. (2011). Utilisation of the MVA pathway to produce elevated levels of the sesquiterpene α-copaene in potato tubers. Phytochem. 72 (18), 2288–2293. doi: 10.1016/j.phytochem.2011.08.023
Movahedi, A., Zhang, J., Gao, P., Yang, Y., Wang, L., Yin, T. (2015). Expression of the chickpea CarNAC3, gene enhances salinity and drought tolerance in transgenic poplars. Plant Cell Tissue Organ Culture 120 (1), 141–154. doi: 10.1007/s11240-014-0588-z
Ozga, J. A., Reinecke, D. M., Ayele, B. T., Ngo, P., Nadeau, C., Wickramarathna, A. D. (2009). Developmental and hormonal regulation of gibberellin biosynthesis and catabolism in pea fruit. Plant Physiol. 150 (1), 448–462. doi: 10.1104/pp.108.132027
Pan, L., Zhou, W., Zhang, L., Wang, J., Yan, X., Zhang, Y. (2009). Molecular cloning, characterization and expression analysis of a new gene encoding 3-hydroxy-3-methylglutaryl coenzyme A reductase from Salvia miltiorrhiza. Acta Physiolog. Plantarum 31 (3), 565–572. doi: 10.1007/s11738-008-0266-z
Qiu, J. W., Li, P. Z., Pei, F. Z., Yi, L. Z., Jian, W. W. (2014). Cloning and characterization of an elicitor-responsive gene encoding 3-hydroxy-3-methylglutaryl coenzyme A reductase involved in 20-hydroxyecdysone production in cell cultures of Cyanotis arachnoidea. Plant Physiol. Biochem. 84, 1–9. doi: 10.1016/j.plaphy.2014.08.021
Reinecke, D. M., Wickramarathna, A. D., Ozga, J. A., Kurepin, L. V., Jin, A. L., Good, A. G., et al. (2013). Gibberellin 3-oxidase gene expression patterns influence gibberellin biosynthesis, growth, and development in pea. Plant Physiol. 163 (2), 929–945. doi: 10.1104/pp.113.225987
Rohmer, M., Seemann, M., Horbach, S., Bringer-Meyer, S., Sahm, H. (1996). Glyceraldehyde 3-phosphate and pyruvate as precursors of isoprenic units in an alternative non-mevalonate pathway for terpenoid biosynthesis. J. Am. Chem. Soc. 118 (11), 2564–2566. doi: 10.1021/ja9538344
Schaller, H., Grausem, B., Benveniste, P., Chye, M. L., Tan, C. T., Song, Y. H., et al. (1995). Expression of the Hevea brasiliensis (HBK) Mull. Arg. 3-hydroxy-3-methylglutaryl-coenzyme A reductase 1 in tobacco results in sterol overproduction. Plant Physiol. 109 (3), 761-770. doi: 10.1104/pp.109.3.761
Shen, G., Pang, Y., Wu, W., Liao, Z., Zhao, L., Sun, X. (2006). Cloning and characterization of a root-specific expressing gene encoding 3-hydroxy-3-methylglutaryl coenzyme A reductase from Gingko biloba. Mol. Biol. Rep. 33 (2), 117. doi: 10.1007/s11033-006-0014-7
Suzuki, M., Kamide, Y., Nagata, N., Seki, H., Ohyama, K., Kato, H. (2005). Loss of function of 3-hydroxy-3-methylglutaryl coenzyme A reductase 1 (HMGR1) in Arabidopsis leads to dwarfing, early senescence and male sterility, and reduced sterol levels. Plant J. 20 (3), 67–77. doi: 10.1111/j.1365-313X.2004.02003.x
Suzuki, M., Muranaka, T. (2007). Molecular genetics of plant sterol backbone synthesis. Lipids 42 (1), 47–54. doi: 10.1007/s11745-006-1000-5
Ton, J., Flors, V., Mauch-Mani, B. (2009). The multifaceted role of ABA in disease resistance. Trends In Plant Sci. 14 (6), 310–317. doi: 10.1016/j.tplants.2009.03.006
Tuskan, G. A., Difazio, S., Jansson, S., Bohlmann, J., Grigoriev, I., Hellsten, U., et al. (2006). The genome of black cottonwood, Populus trichocarpa (Torr. & Gray). Sci. 313 (5793), 1596–1604. doi: 10.1126/science.1128691
Uthup, T. K., Saha, T., Ravindran, M., Bini, K. (2013). Impact of an intragenic retrotransposon on the structural integrity and evolution of a major isoprenoid biosynthesis pathway gene in Hevea brasiliensis. Plant Physiol. Biochem. 73 (6), 176–188. doi: 10.1016/j.plaphy.2013.09.004
Wang, Y., Guo, B., Zhang, F., Yao, H., Miao, Z., Tang, K. (2007). Molecular cloning and functional analysis of the gene encoding 3-hydroxy-3-methylglutaryl coenzyme A reductase from hazel (Corylus avellana L. Gasaway). J. Biochem. Mol. Biol. 40 (6), 861–869. doi: 10.5483/BMBRep.2007.40.6.861
Wu, T. S., Leu, Y. L., Chan, Y. Y., Wu, P. L., Kuoh, C. S., Wu, S. J., et al. (1997). Tetranortriterpenoid insect antifeedants from Severinia buxifolia. Phytochem. 45 (7), 1393–1398. doi: 10.1016/S0031-9422(97)00176-3
Xu, J. W., Xu, Y. N., Zhong, J. J. (2012). Enhancement of ganoderic acid accumulation by overexpression of an n-terminally truncated 3-hydroxy-3-methylglutaryl coenzyme A reductase gene in the basidiomycete Ganoderma lucidum. Appl. Environ. Microbiol. 78 (22), 7968–7976. doi: 10.1128/AEM.01263-12
Yang, D., Ma, P., Liang, X., Wei, Z., Liang, Z., Liu, Y. (2012). PEG and ABA trigger methyl jasmonate accumulation to induce the MEP pathway and increase tanshinone production in Salvia miltiorrhiza hairy roots. Physiolog. Plantarum 146 (2), 173–183. doi: 10.1111/j.1399-3054.2012.01603.x
Keywords: carotene, lycopene, Populus trichocarpa, PtHMGR, terpenoid
Citation: Wei H, Xu C, Movahedi A, Sun W, Li D and Zhuge Q (2019) Characterization and Function of 3-Hydroxy-3-Methylglutaryl-CoA Reductase in Populus trichocarpa: Overexpression of PtHMGR Enhances Terpenoids in Transgenic Poplar. Front. Plant Sci. 10:1476. doi: 10.3389/fpls.2019.01476
Received: 28 April 2019; Accepted: 24 October 2019;
Published: 15 November 2019.
Edited by:
Wanchai De-Eknamkul, Chulalongkorn University, ThailandReviewed by:
Thomas J. Bach, Université de Strasbourg, FranceYan Xiang, Anhui Agricultural University, China
Copyright © 2019 Wei, Xu, Movahedi, Sun, Li and Zhuge. This is an open-access article distributed under the terms of the Creative Commons Attribution License (CC BY). The use, distribution or reproduction in other forums is permitted, provided the original author(s) and the copyright owner(s) are credited and that the original publication in this journal is cited, in accordance with accepted academic practice. No use, distribution or reproduction is permitted which does not comply with these terms.
*Correspondence: Qiang Zhuge, cXpodWdlQG5qZnUuZWR1LmNu
†These authors have contributed equally to this work