 Rui Shi
 Wei Jiao3,4
 Lan Yun
 Quanzhen Wang
 Ying Li
 Fugui Mi
- 1Key Laboratory of Grassland Resources, Ministry of Education P.R of China, College of Grassland, Resources and Environment, Inner Mongolia Agricultural University, Hohhot, China
- 2Baotou Medical College, Baotou, China
- 3College of Mechanical and Electrical Engineering, Inner Mongolia Agricultural University, Hohhot, China
- 4Institute of Grassland Research, Chinese Academy of Agricultural Sciences, Hohhot, China
- 5Inner Mongolia Key Laboratory of Molecular Biology on Featured Plants, Hohhot, China
- 6College of Grassland Agriculture, Northwest A&F University, Yangling, China
Drought is a major limiting factor in foraging grass yield and quality. Medicago ruthenica (M. ruthenica) is a high-quality forage legume with drought resistance, cold tolerance, and strong adaptability. In this study, we integrated transcriptome, small RNA, and degradome sequencing in identifying drought response genes, microRNAs (miRNAs), and key miRNA-target pairs in M. ruthenica under drought and rewatering treatment conditions. A total of 3,905 genes and 50 miRNAs (45 conserved and 5 novel miRNAs) were significantly differentially expressed in three test conditions (CK: control, DS: plants under drought stress, and RW: plants rewatering after drought stress). The degradome sequencing (AllenScore < 4) analysis revealed that 104 miRNAs (11 novel and 93 conserved miRNAs) were identified with 263 target transcripts, forming 296 miRNA-target pairs in three libraries. There were 38 differentially expressed targets from 16 miRNAs in DS vs. CK, 31 from 11 miRNAs in DS vs. RW, and 6 from 3 miRNAs in RW vs. CK; 21, 18, and 3 miRNA-target gene pairs showed reverse expression patterns in DS vs. CK, DS vs. RW, and RW vs. CK comparison groups, respectively. These findings provide valuable information for further functional characterization of genes and miRNAs in response to abiotic stress, in general, and drought stress in M. ruthenica, and potentially contribute to drought resistance breeding of forage in the future.
Introduction
Drought is the most widespread climatic extreme that has a negative impact on human and natural environments (Touma et al., 2015; Schwalm et al., 2017). It has received more attention with the increase of severe drought occurrences. The physiological acclimatization of individuals may buffer the effect of drought (Schwalm et al., 2017); thus, it is meaningful to improve adaptability in plants by increasing their drought stress tolerance.
Plants have specific adaptive responses that protect them from environmental stresses (Chinnusamy et al., 2004), which are generally controlled by many complex regulatory networks involving numerous genes. The regulation of gene expression can be carried out at the transcriptional, post-transcriptional, and epigenetic modification levels. In plants, several biological processes are regulated by small RNAs at the transcriptional and post-transcriptional levels, including plant growth and development processes, as well as biotic and abiotic stress responses (Trindade et al., 2010; Capitão et al., 2011; Liu et al., 2014; Gao et al., 2016; Shu et al., 2016; Garg et al., 2019). Small RNAs (21–26 nt) are ubiquitous, versatile repressors of gene expression in plants, animals, and many fungi, which include short interfering RNAs (siRNAs), small temporal RNAs (stRNAs), heterochromatic siRNAs, tiny non-coding RNAs, and microRNAs (miRNAs) (Finnegan and Matzke, 2003). In plants, miRNAs are endogenous non-coding small RNAs measuring 20–24 nt long (Jones-Rhoades et al., 2006). They negatively regulate gene expression at the post-transcriptional level via direct cleavage of the target mRNA or inhibition of target gene translation by recognizing and combining to their target mRNAs (Bartel, 2004; Voinnet, 2009). A single miRNA can have several target genes, and several miRNAs can regulate one gene. Therefore, the gene pool regulated by miRNAs can be very extensive.
Plant miRNAs are frequently complementary to their target mRNAs; this complementarity effectively triggers target mRNA degradation (Llave et al., 2002; Tang et al., 2003) and loss of protein-coding function (German et al., 2008; Iwakawa and Tomari, 2015). Most miRNAs regulate the expression of target genes in plants via splicing, and slicing often occurs at the tenth or eleventh nucleotide of the complementary region of the miRNA and mRNA. Thus, the identification of target genes is crucial for miRNA functional analysis. High-throughput sequencing is the most popular technique for identifying miRNAs in plants, because it allows for an easier and faster access to large numbers of miRNAs, especially those of low abundance (Allen et al., 2004). Afterwards, the functions of miRNAs may be identified through bioinformatic prediction or degradome sequencing. Degradome sequencing screens out the target genes for miRNAs by combining the advantages of high-throughput sequencing technology and bioinformatics analysis. The key point of the correlation analysis of the transcriptome and small RNA is the result of the degradome sequencing.
Medicago ruthenica L. is a cross-pollinated, diploid (2n = 16) perennial legume forage, with a remarkable ability to adapt to extreme environments. Thus, M. ruthenica is considered a valuable forage crop, which may be used as a potential source of genes to improve abiotic stress resistance in cultivated alfalfa (Campbell et al., 1997). There have been many reports on the molecular mechanisms induced by drought stress in leguminous forage (Li et al., 2017; Zhang et al., 2018, 2019), but few on M. ruthenica. Moreover, a number of miRNAs have been identified to be associated with responses to drought stress in several species, such as Arabidopsis thaliana (Liu et al., 2008), tomato (Liu et al., 2018), Oryza sativa (Chen and Li, 2018; Nadarajah and Kumar, 2019), and Gossypium hirsutum (Lu et al., 2019). Here, we integrated transcriptome, miRNAome, and degradome results to identify drought-response genes and miRNAs in M. ruthenica, and find potential regulatory patterns of miRNA-target pairs. These results may provide novel insights into the response to abiotic stresses of M. ruthenica, and contribute to drought resistance breeding of forage in the future.
Results
Transcriptome Sequencing in M. ruthenica Under Drought Stress
To profile the expression of genes in M. ruthenica in response to drought stress, nine libraries were constructed from three leaf samples (CK: control, DS: plants under drought stress, RW: plants rewatering after drought stress), each with three biological replicates. Then, 36,207,356 to 55,818,774 raw data were generated, accounting for 5.43–8.37 GB of sequencing data (Supplementary Table 1). A total of 147,957 transcripts were obtained from all cDNA libraries. After conducting quality control, the transcripts were assembled into 52,457 unigene clusters, with an N50 value of 1,451 bp. A summary of the transcriptome sequencing of M. ruthenica is shown in Table 1.
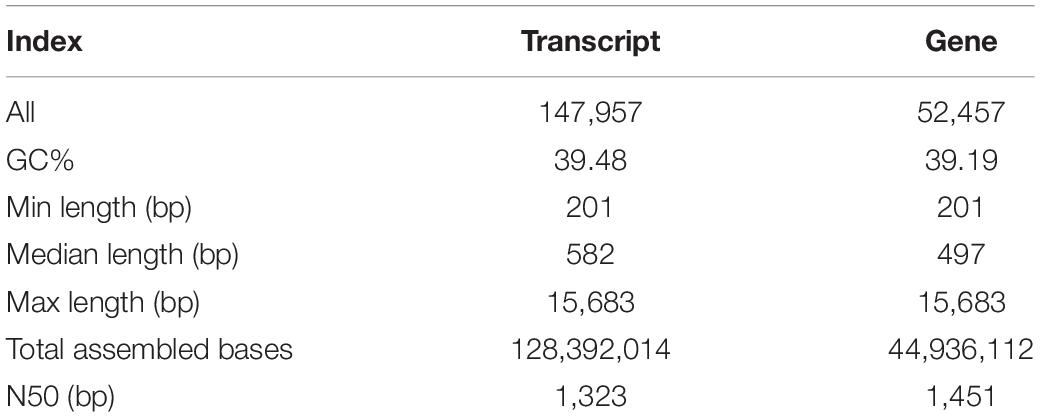
Table 1. Summary of M. ruthenica transcriptome sequencing.
All assembled unigene clusters were aligned against Gene Ontology (GO),1 Kyoto Encyclopedia of Genes and Genomes (KEGG),2 Pfam database,3 SwissProt database,4 evolutionary genealogy of genes: Non-supervised Orthologous Groups (eggNOG)5 databases, and NCBI non-redundant protein database (NCBI_NR)6 using DIAMOND 23 with a threshold E-value < 0.00001 (Buchfink et al., 2015). The statistical results from six authoritative databases are listed in Table 2.
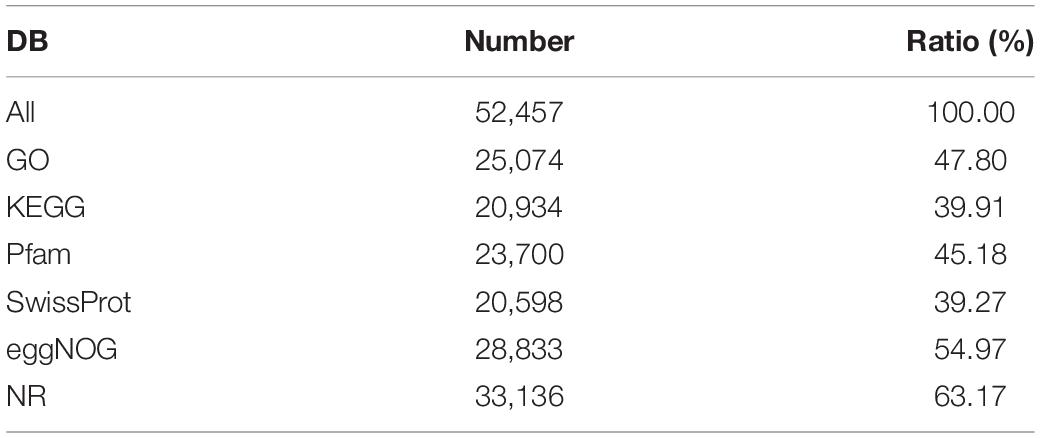
Table 2. Statistical results from the DIAMOND 23 annotation.
Differentially Expressed Genes in M. ruthenica Under Drought Stress
To identify the differentially regulated genes under drought stress in M. ruthenica, three comparisons of the three test conditions (CK, DS, and RW) were performed. In total, 3,905 genes were significantly differentially expressed among the three test groups. There were 3,065, 2,508, and 205 differentially expressed genes (DEGs) in the DS vs. CK, DS vs. RW, and RW vs. CK comparisons, respectively (Figure 1A). The overlapping DEGs among the three comparisons were shown in a Venn diagram in Figure 1B. The DEG overlap (1,737 overlapping DEGs) between DS vs. CK and DS vs. RW was much greater than the other two comparison groups (82 overlapping DEGs between DS vs. CK and RW vs. CK, 75 DEGs between DS vs. RW and RW vs. CK). Further analysis of the 1,737 overlapping DEGs showed that 1,219 upregulated genes and 517 downregulated genes were exactly the same in the DS vs. CK and DS vs. RW comparisons, except for one DEG (TRINITY_DN21640_c0_g2), which exhibited opposing trends (Figure 1C); this indicates that the 1,736 overlapping DEGs were involved in drought stress responses in M. ruthenica. Among all DEGs, 10 showed differential expression across all the treatments (Figure 1B). The information of all the DEGs in three comparisons is shown in Supplementary Table 2.
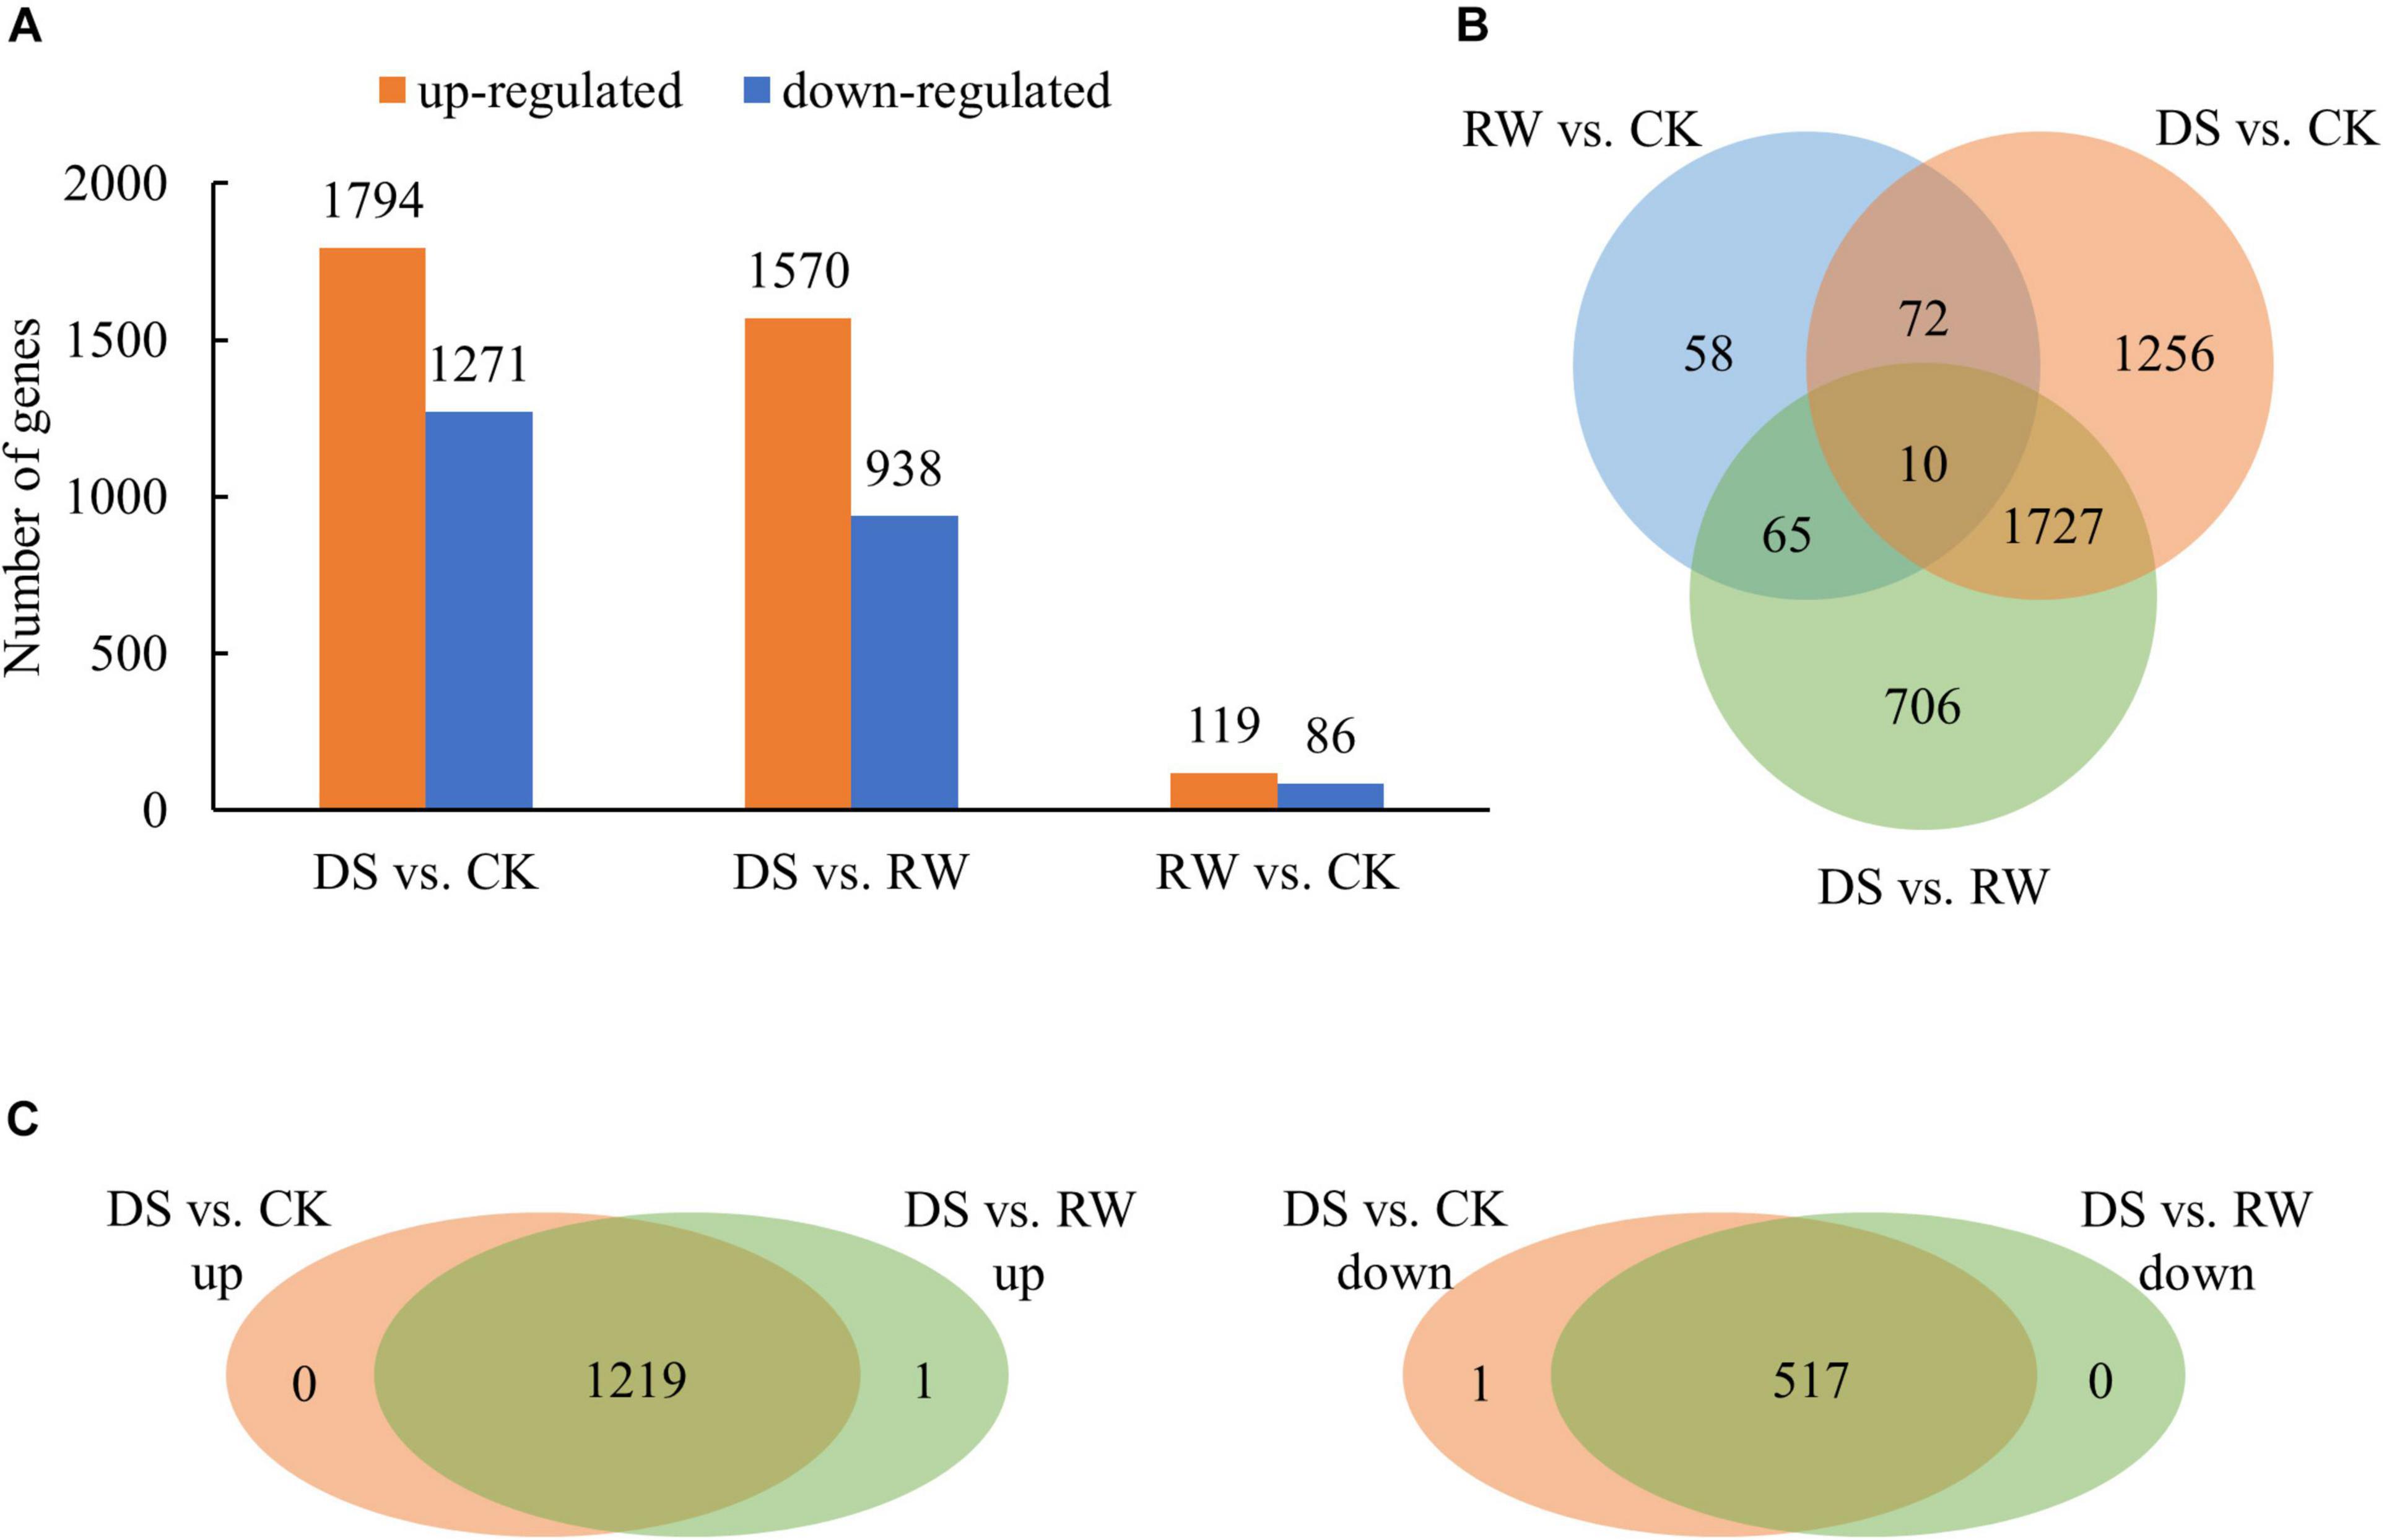
Figure 1. Differentially expressed gene analysis for control (CK), drought stress (DS), and rewatering (RW) treatment in M. ruthenica. (A) The number of DEGs for the DS vs. CK, DS vs. RW, and RW vs. CK comparisons (p < 0.05); orange, upregulated DEGs; blue, downregulated DEGs. (B) Venn diagram of overlapping DEGs among the three comparisons. (C) Venn diagrams to illustrate the overlapping DEGs with upregulated expression between the DS vs. CK comparison and the DS vs. RW comparison, and the overlapping DEGs with downregulated expression.
Functional Annotation and Enrichment Analysis of the DEGs
In total, 2,866 DEGs were annotated to 2,186 GO terms via GO analysis. We detected significant enrichments (p < 0.05) of 331 GO terms in M. ruthenica under drought stress (Supplementary Table 3). In the “biological processes” category, the main terms, including “regulation of transcription, DNA-templated” (GO:0006355), “transcription, DNA-templated” (GO:0006351), “protein phosphorylation” (GO:0006468), and “oxidation-reduction process” (GO:0055114), were highly enriched in the DEGs; In the “molecular function” category, DEGs were significantly enriched in the terms “molecular function” (GO:0003674), “DNA binding transcription factor activity” (GO:0003700), “DNA binding” (GO:0003677), “protein serine/threonine kinase activity” (GO:0004674), and “sequence-specific DNA binding” (GO:0043565); In the “cellular component” category, DEGs were significantly enriched in the terms “plasma membrane” (GO:0005886), “integral component of membrane” (GO:0016021), “chloroplast” (GO:0009507), “membrane” (GO:0016020), and “extracellular region” (GO:0005576).
Then, with KEGG analysis, 2,201 DEGs were annotated to 122 different pathways, of which, 29 were significantly enriched (p < 0.05) (Supplementary Table 3). The DEGs were mostly included in the KEGG pathways of “Plant hormone signal transduction,” “Plant–pathogen interaction,” and “MAPK signaling pathway – plant,” indicating their significant roles during drought stress.
Table 3 showed the DEGs that are involved in two key KEGG pathways. The DEGs that enriched both in ko04075 (plant hormone signal transduction) and ko04016 (MAPK signaling pathway – plant) pathways included genes like transcription factor bHLH, transcription factor MYC, serine/threonine-protein kinase, abscisic acid receptor PYL, and probable protein phosphatase 2C. The DEGs that enriched both in ko04626 (plant–pathogen interaction) and ko04016 (MAPK signaling pathway – plant) pathways included genes like WRKY transcription factor, hypothetical protein TSUD, LRR receptor-like kinase family protein, LRR receptor-like kinase resistance protein, and calmodulin.
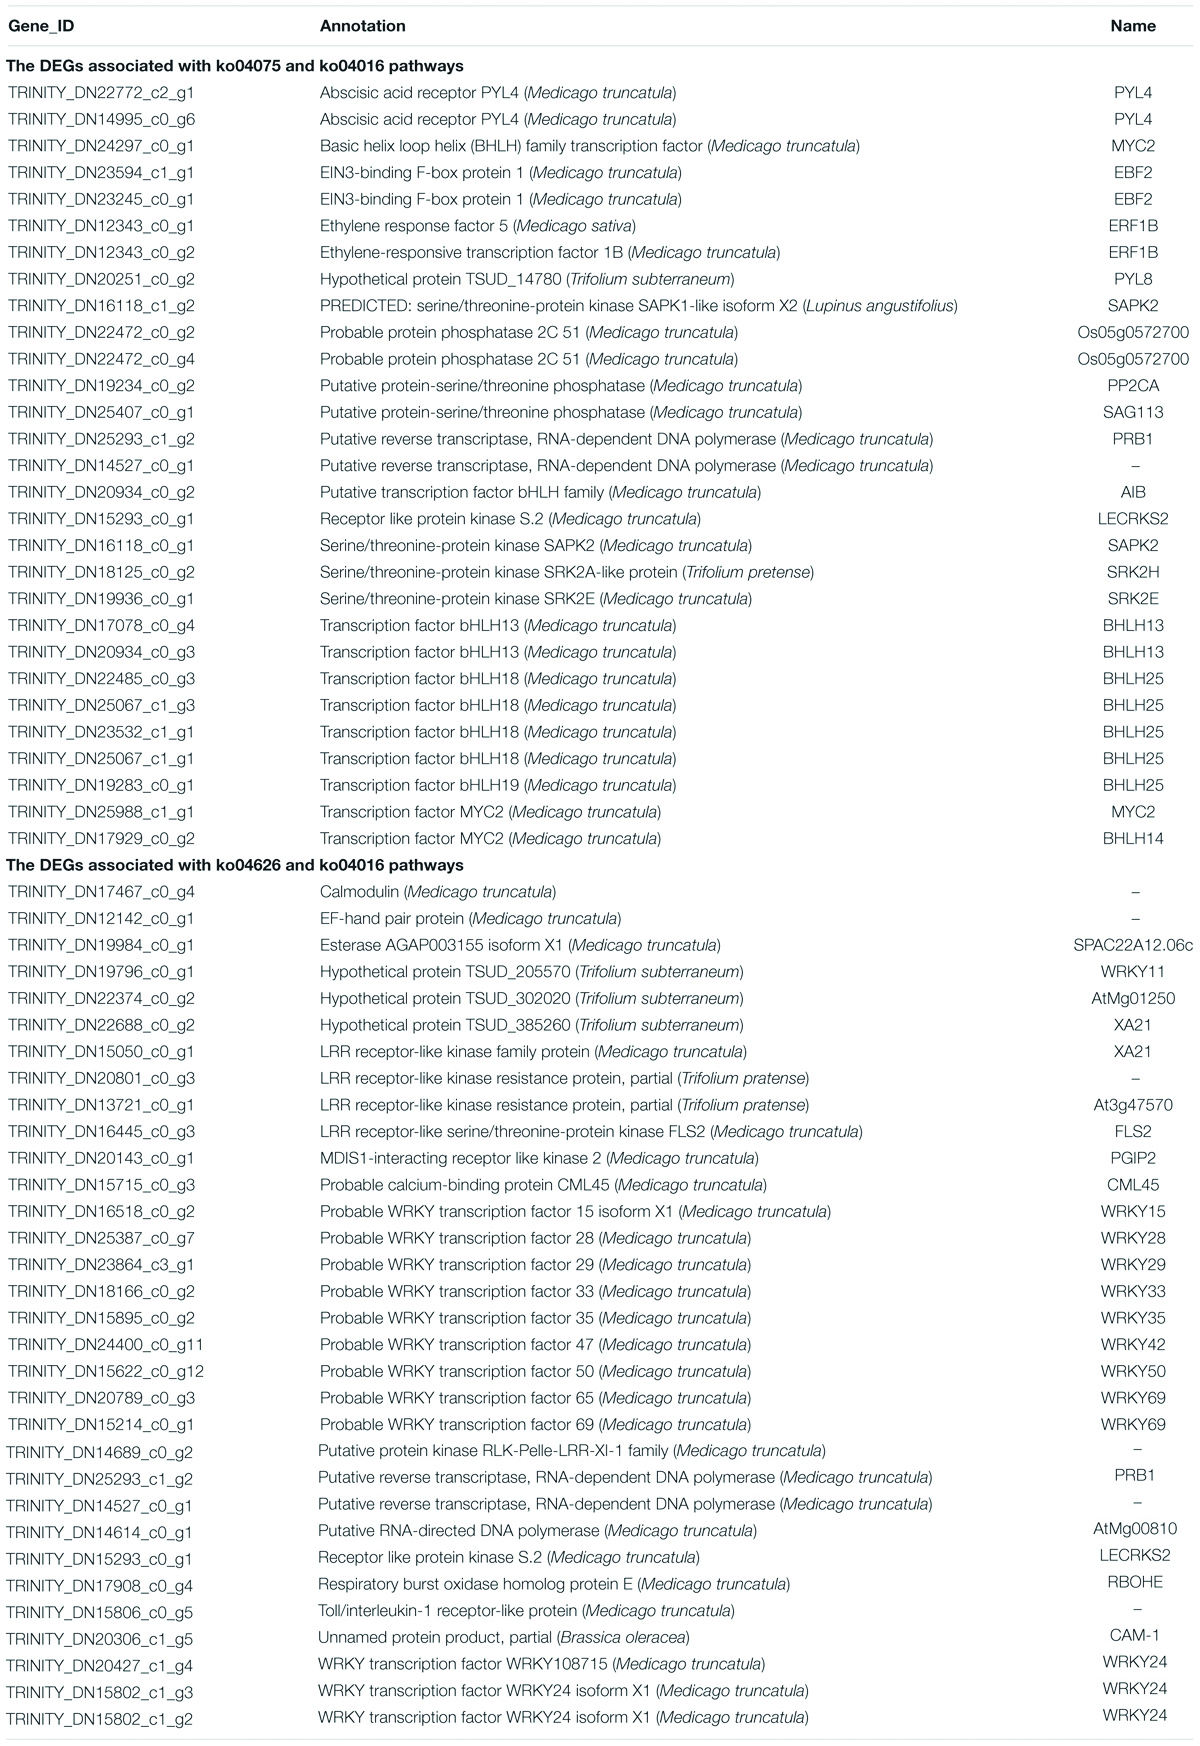
Table 3. The DEGs associated with ko04075 (plant hormone signal transduction), ko04626 (plant–pathogen interaction), and ko04016 (MAPK signaling pathway – plant) pathways.
qRT-PCR Verification of mRNA-Seq Analysis of Gene Expression
To validate the mRNA-Seq results, 10 genes were selected for quantitative real-time polymerase chain reaction (qRT-PCR) analysis. The information of these genes is shown in Supplementary Table 4. The qRT-PCR results (Figure 2) showed similar expression trends to their high-throughput sequencing analysis, which suggested that our RNA-seq data are credible.
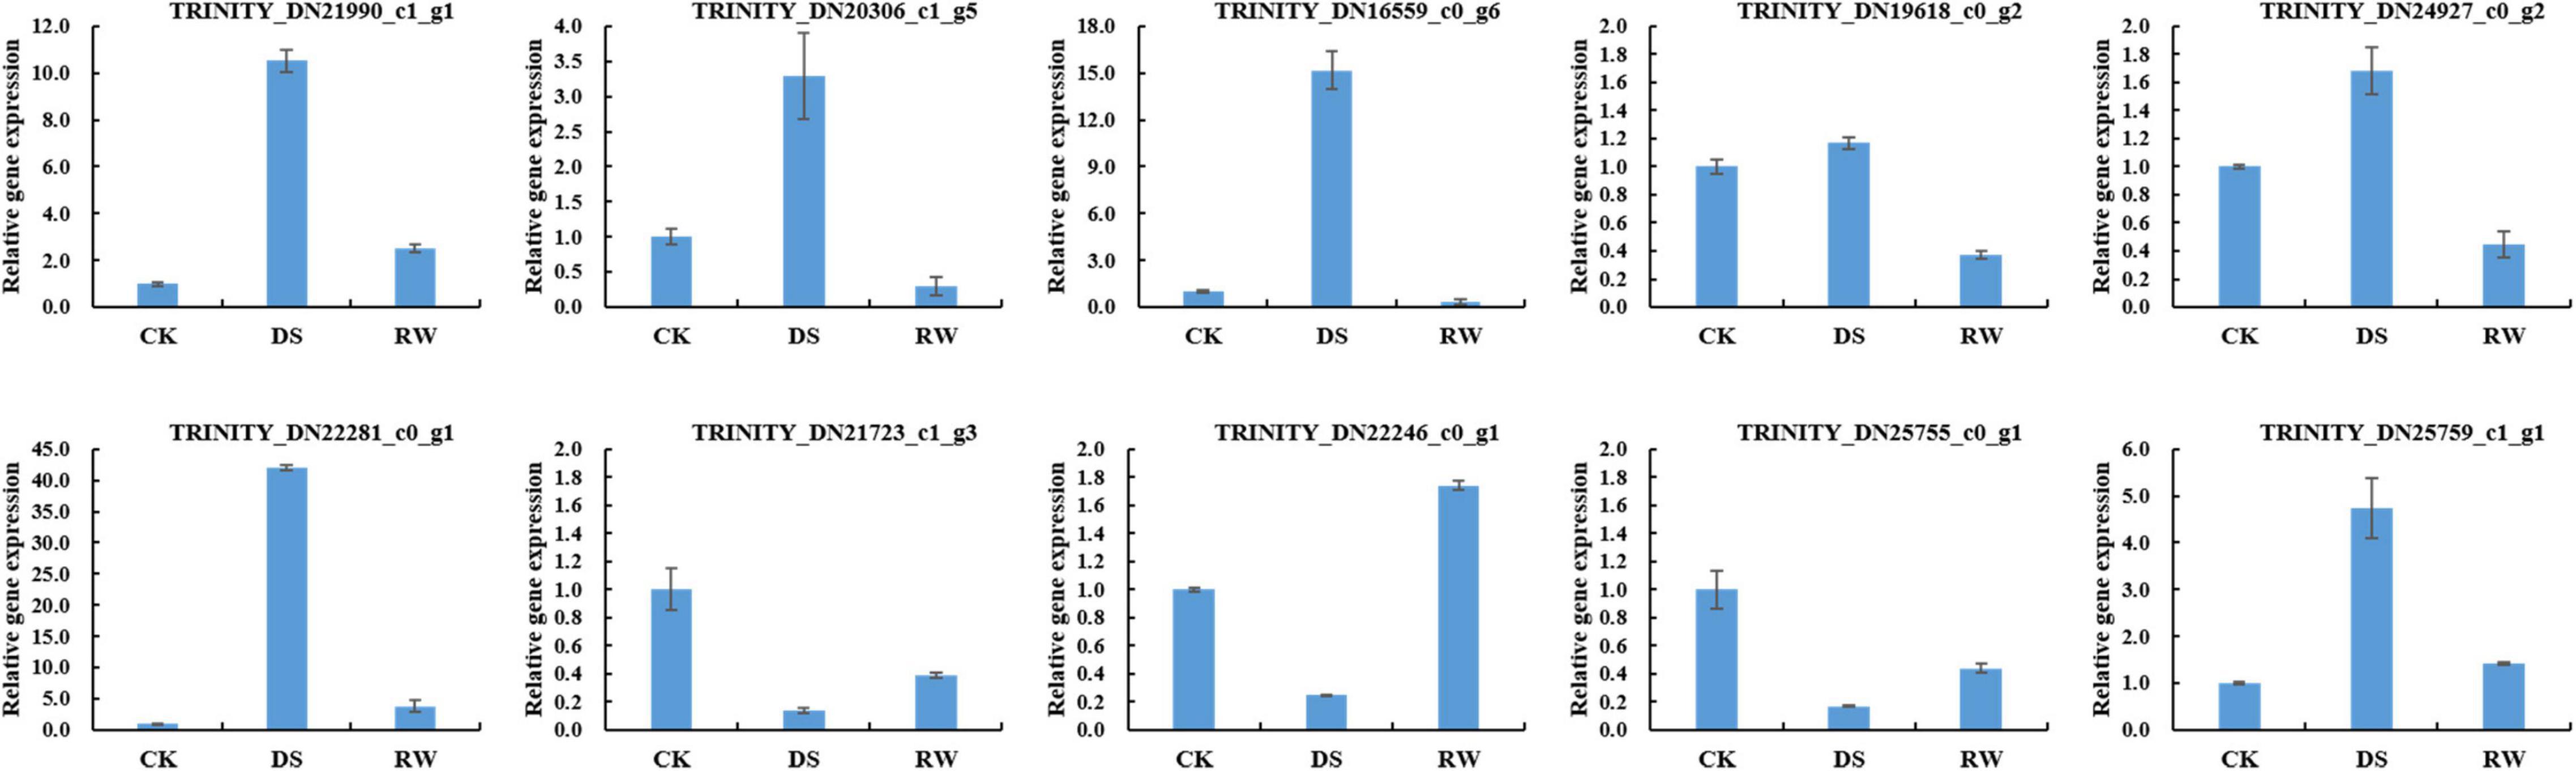
Figure 2. Relative gene expression for qRT-PCR verification of mRNA-Seq results. The data were the average of three qRT-PCR replicates for each sample from three biological replicates. GAPDH of alfalfa was used as an internal reference. Error bars indicate the standard deviation of three biological replicates.
Deep Sequencing of M. ruthenica Small RNAs
The small RNA deep sequencing of M. ruthenica was performed from three samples (CK, DS, and RW), each with three biological replicates. We counted the raw data sequencing outputs, and generated unique sequences and their corresponding copies. A total of 16,112,539, 13,520,602, and 17,459,447 reads, and 4,029,151, 2,602,204, and 3,314,079 unique sequences were generated from CK, DS, and RW, respectively (Supplementary Table 5). Meanwhile, by comparing the acquired sgRNA sequence with the mRNA, RFam (including rRNA, tRNA, snRNA, and snoRNA), and Repbase databases, we established 12,257,093, 6,163,546, and 10,663,527 valid reads, and 3,422,624, 1,675,939, and 2,468,514 valid unique sequences in the CK, DS, and RW groups. These valid data were subjected to further miRNA comparison identification and prediction analysis.
After removing the low-quality sequences, 18–25 nt long sequences were obtained. As shown in Table 4, 77.31% were 21- or 24-nt long unique miRNA sequences, which accounted for most classes of M. ruthenica sRNA. These results are consistent with those of other plant species, such as A. thaliana (Rajagopalan et al., 2006; Fahlgren et al., 2007), Medicago truncatula (Szittya et al., 2008; Eyles et al., 2013), and Arachis hypogaea (Chi et al., 2011).
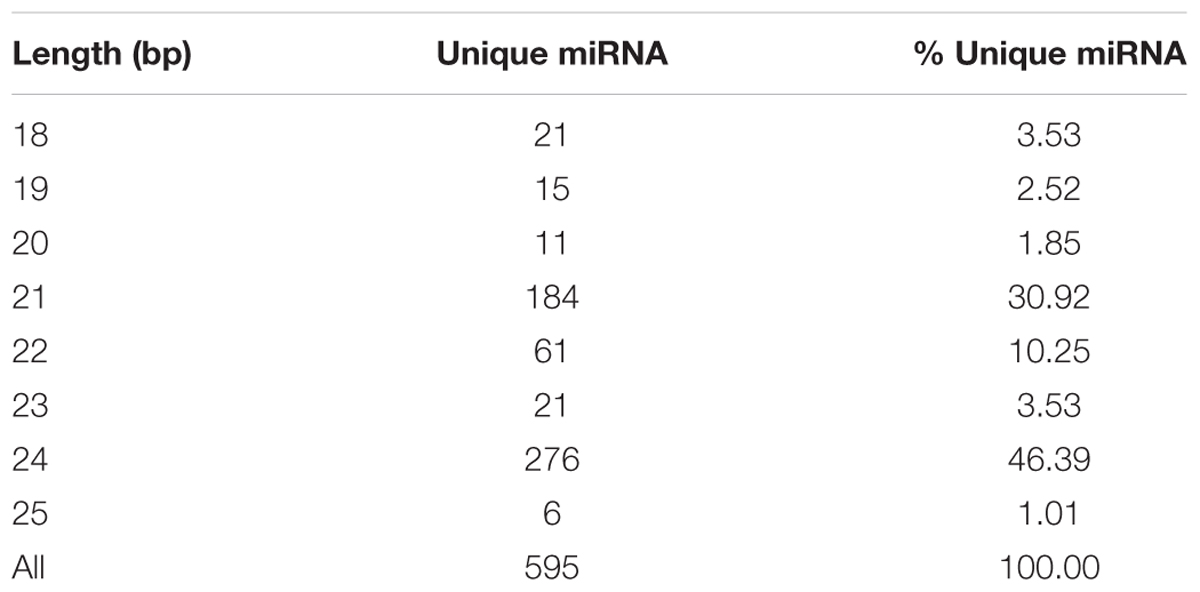
Table 4. Length distribution of unique miRNAs.
Identification of Conserved and Novel miRNAs in M. ruthenica
To identify conserved miRNAs in M. ruthenica, we compared the small RNA sequences with known plant miRNAs in the miRBase. Based on sequence homology, 532 conserved miRNAs belonging to 65 miRNA families, and 63 novel miRNAs were identified from the nine libraries (Table 5).
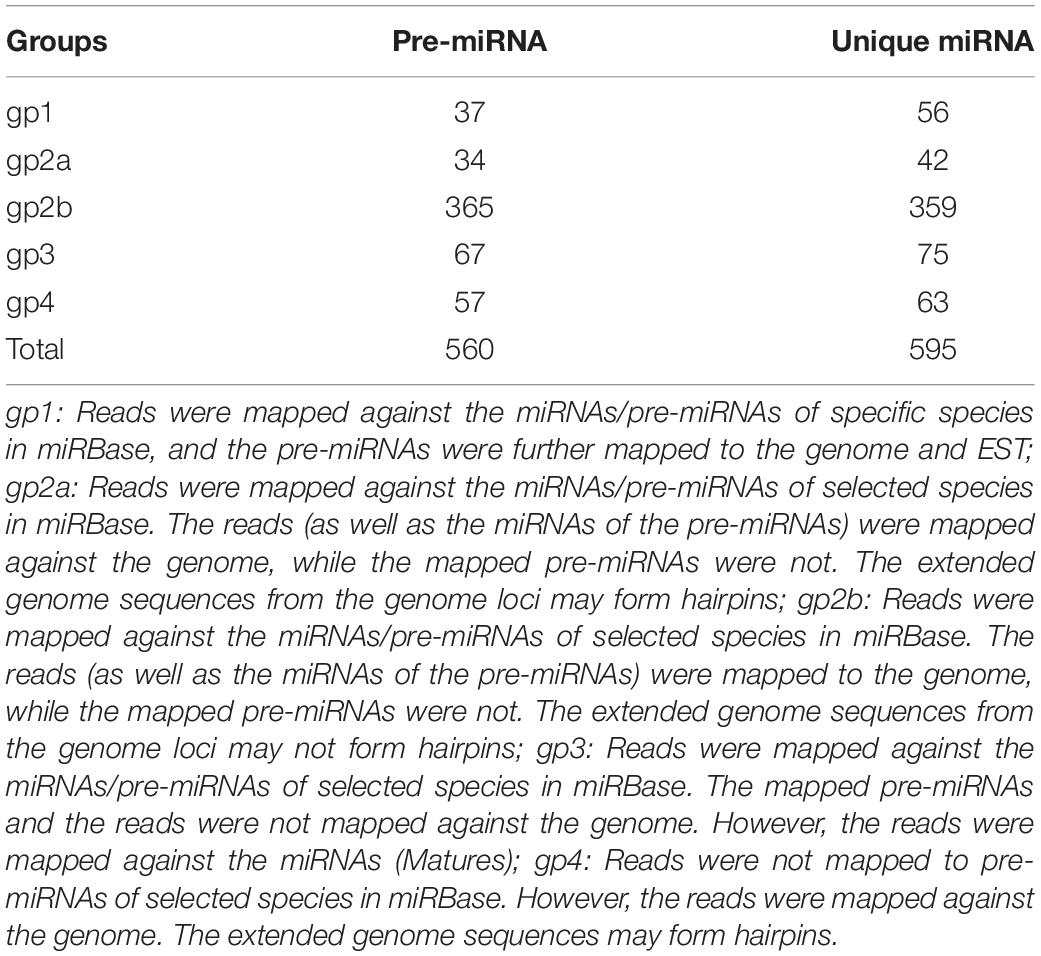
Table 5. Summary of identified conserved and novel miRNAs.
Drought-Responsive miRNAs in M. ruthenica
To identify miRNAs in response to drought in M. ruthenica, we analyzed and compared the read counts in nine libraries. miRNAs with a p-value < 0.05 were considered DEMs. In total, 33, 21, and 40 miRNAs were differentially expressed in the DS vs. CK, DS vs. RW, and RW vs. CK comparisons, respectively. Meanwhile, respective up- and downregulation profiles were found in each comparison: 3 and 30 miRNAs in DS vs. CK, 5 and 16 in DS vs. RW, and 21 and 19 in RW vs. CK (Figure 3). The details of these DEMs found in the three comparisons are shown in Supplementary Table 6.
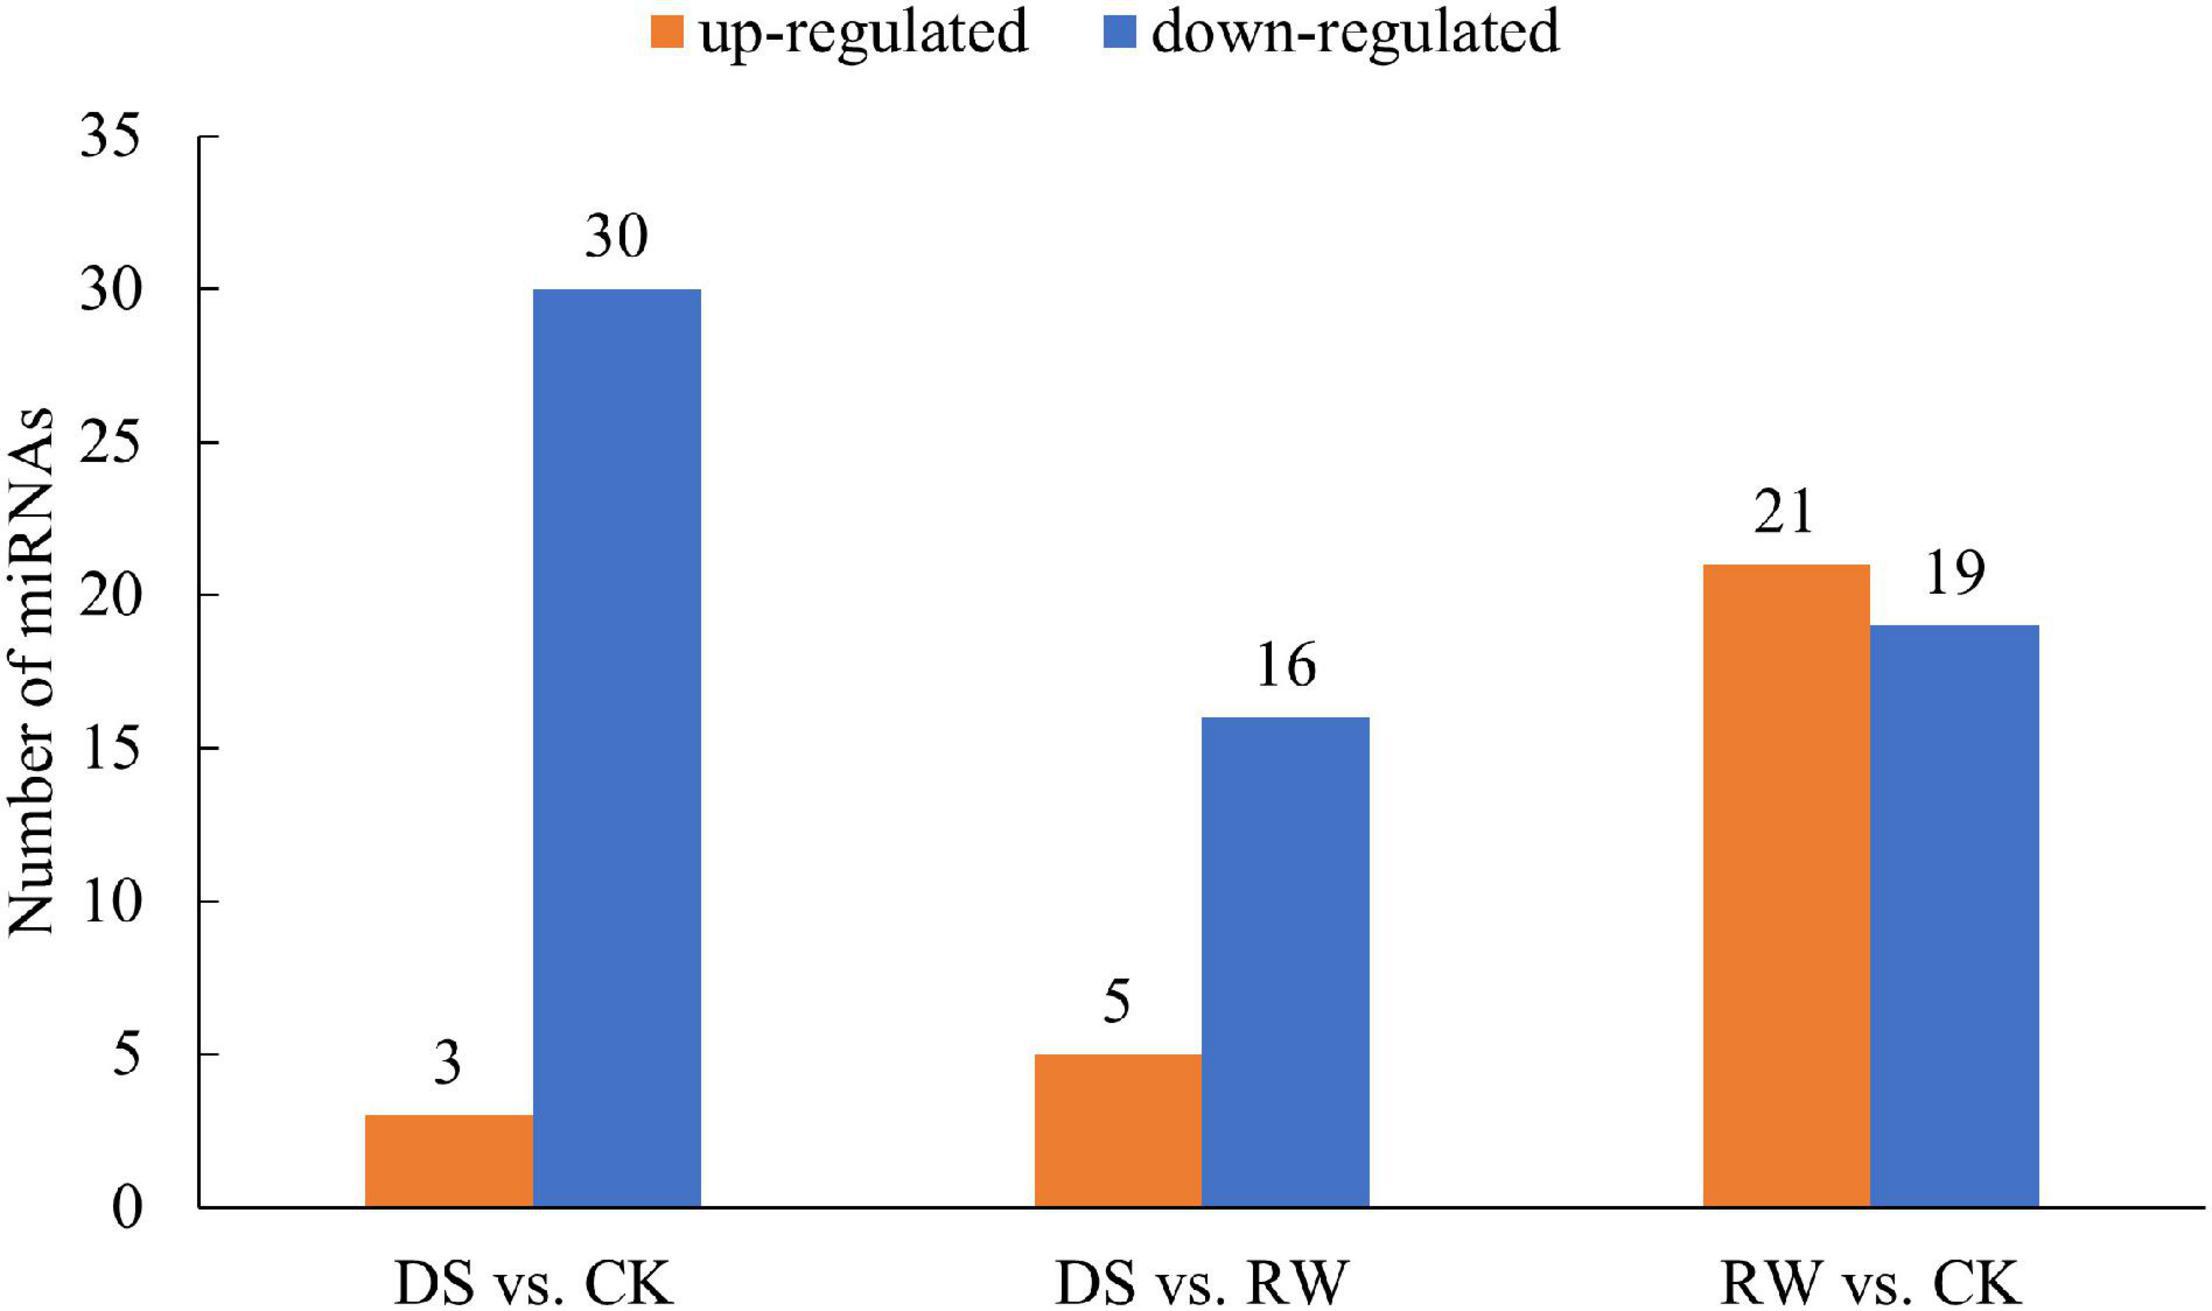
Figure 3. The number of differentially expressed miRNAs for the three comparisons (p < 0.05); orange, upregulated miRNA expression; blue, downregulated miRNA expression.
Our results also revealed that 50 miRNAs showed significant differentially expressed patterns among the RW vs. DS vs. CK comparison, including 45 conserved miRNAs and 5 novel miRNAs (Table 6). Among the 50 DEMs, the expression of 23 miRNAs, such as gma-miR171j-5p, lja-miR390a-3p, mtr-miR398a-5p, and bra-MIR408-p5, was downregulated, and then upregulated during drought stress and rehydration, respectively. On the other hand, the expression of 12 miRNAs, such as mtr-miR156b-5p, mtr-MIR156e-p3, gma-miR159a-3p, and lus-miR396b, exhibited the opposite expression profiles during the same respective conditions. Moreover, 12 miRNAs, such as mtr-miR396a-5p, mtr-miR398a-3p, mtr-miR398b, mtr-miR408-3p, were always downregulated, and three miRNAs (gma-miR6300, gma-MIR5368-p5, and peu-MIR2916-p3) were upregulated during the entire experiment.
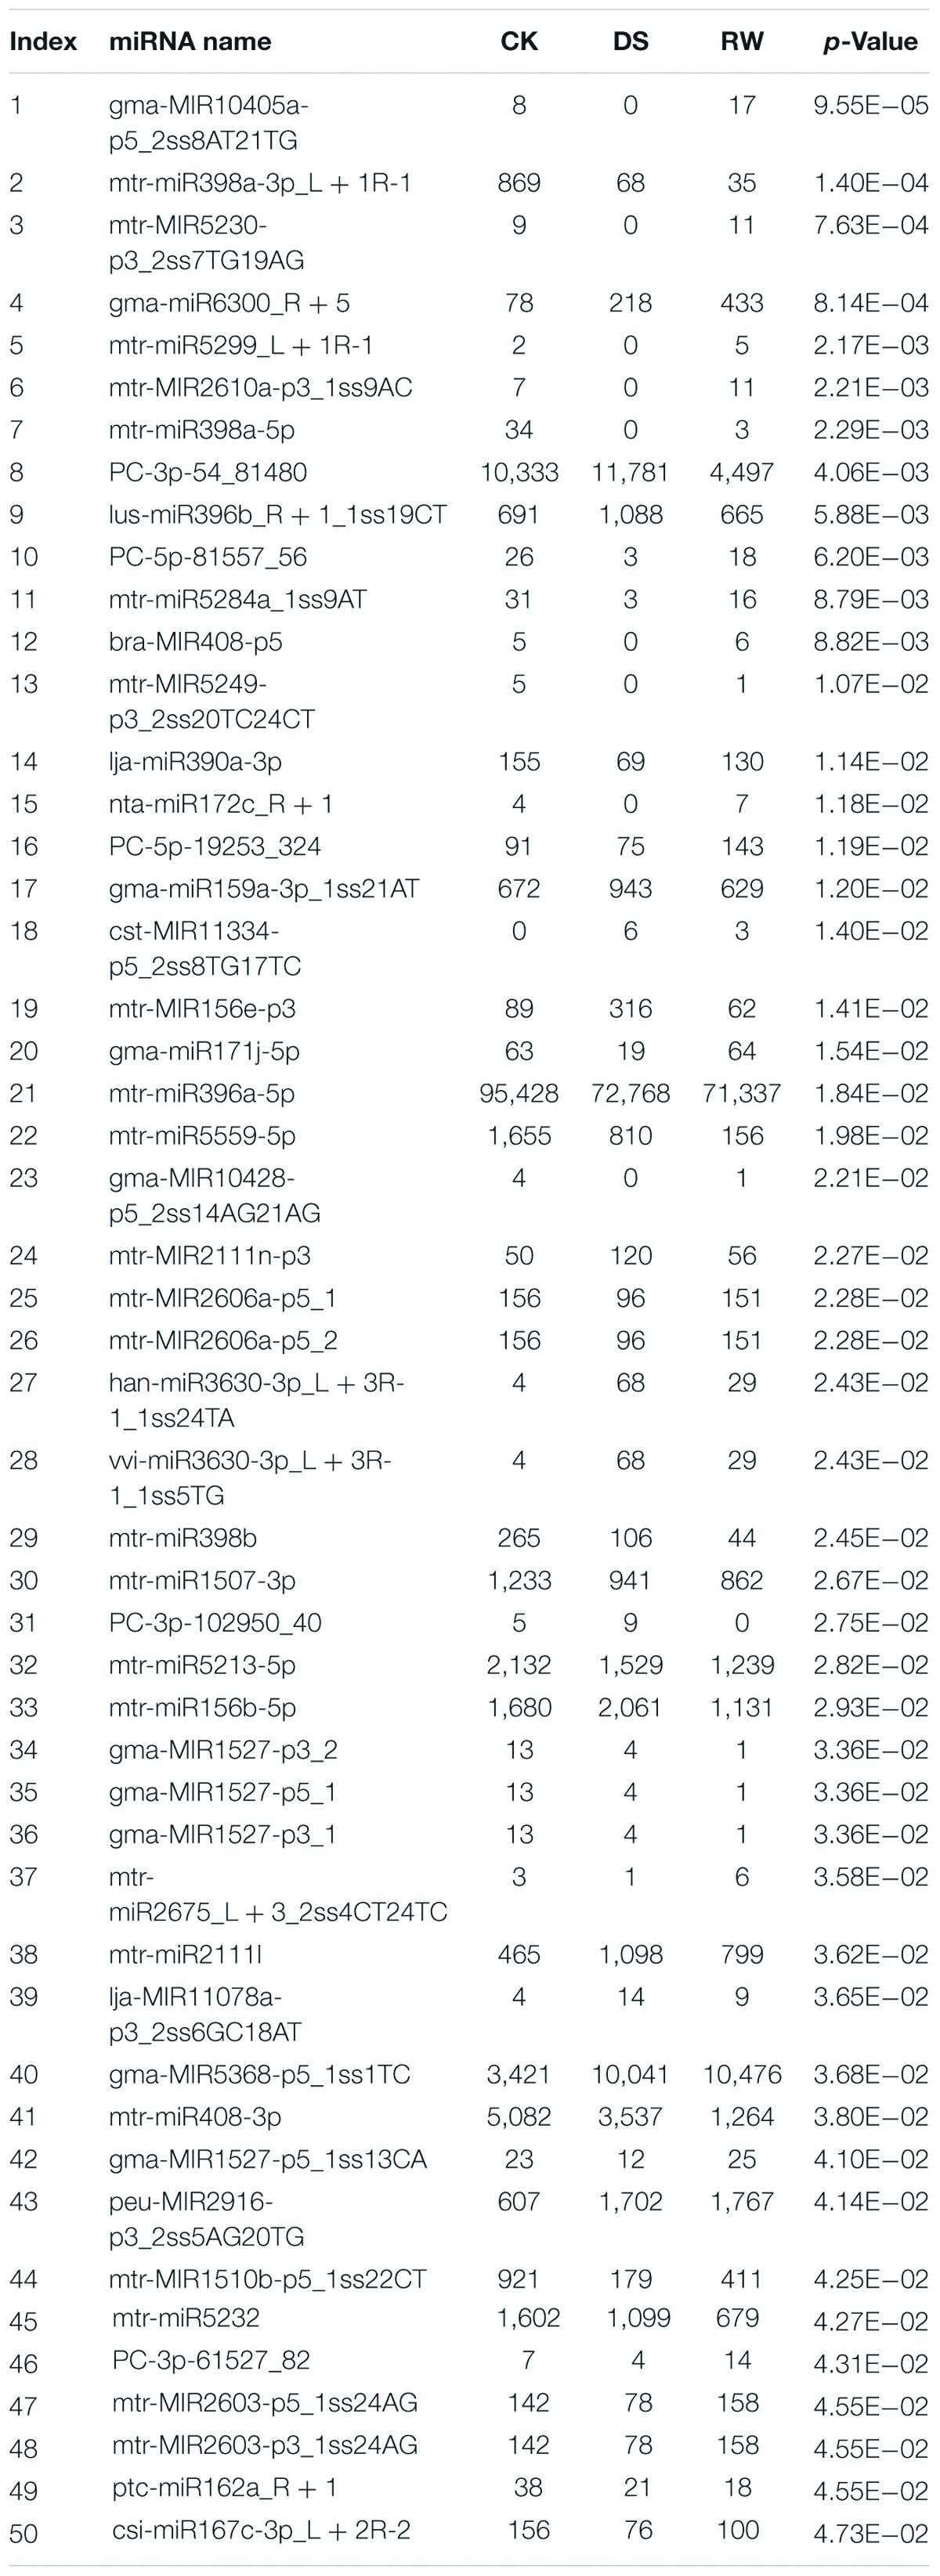
Table 6. The small RNA sequencing results of 50 DEMs in the CK, DS, and RW groups.
Degradome Sequencing Analysis
Generally, miRNAs inhibit protein synthesis either by translational repression and/or mRNA target degradation (Eulalio et al., 2008; Filipowicz et al., 2008; Chekulaeva and Filipowicz, 2009). To analyze the relationships between the expression of miRNAs and mRNAs, miRNA targets were identified through degradome sequencing. After removing reads without adaptor sequences, 4,532,755, 5,691,194, and 6,414,386 unique mappable reads were obtained after filtering 4,574,314, 5,745,686, and 6,473,097 unique raw reads from the three degradome libraries (CK, DS, and RW), respectively. Then, 3,352,045, 4,295,738, and 4,516,291 unique M. ruthenica transcriptome sequences were mapped to the assembled transcriptome sequences, respectively. Transcriptome sequencing for 52,457 transcripts was conducted to detect M. ruthenica miRNA cleavage sites. Of these transcripts, 33,971, 34,304, and 37,758 (64.76, 65.39, and 71.98% of the input transcripts) were mapped to 18,279,670, 16,620,613, and 14,184,792 degradome reads, resulting in 86.29, 82.63, and 77.01% mapping ratios, respectively (Supplementary Table 7).
For data analysis, CleaveLand4 was used to identify sliced miRNA targets detected in our study. The abundance of raw tags was plotted for each target transcript, and the cleaved target transcripts were classified into five categories (0, 1, 2, 3, and 4) according to the abundance of tags at the site position of target transcript. The numbers of cleaved target transcripts in categories 0–4 were 115, 33, 1,720, 958, and 2,260 in CK library, 97, 44, 2,178, 1,284, and 2,716 in DS library, and 108, 36, 2,234, 1,267, and 2,866 in RW library, respectively (Supplementary Table 8).
Identification of miRNA Targets via Degradome Sequencing in M. ruthenica
We obtained 11,390 miRNA-target pairs from the degradome sequencing of three libraries totally (Supplementary Table 8). AllenScore reflects the penalty of mismatched bases between the miRNA and its target, and is an important measure to evaluate the matching rate between the miRNA and its target (Addo-Quaye et al., 2009; Liu et al., 2016). In our study, analysis to degradome sequencing (AllenScore < 4) showed that 104 miRNAs (11 novel and 93 conserved miRNAs) and 263 target transcripts were identified, forming 296 miRNA-target pairs in three libraries (Supplementary Table 9). It was significantly seen that the maximum targets were obtained for ppe-MIR169i-p5_2ss17GT19TG, which had 90 target transcripts in three libraries. We inferred that ppe-MIR169i-p5_2ss17GT19TG may play important roles in M. ruthenica.
In total, 200 genes, targeted by the identified miRNAs, were annotated through GO analysis in the three libraries (Supplementary Table 10). Among the biological processes, “regulation of transcription, DNA-templated” and “transcription, DNA-templated” were the most abundant. For cellular components, the most frequent categories were “nucleus” and “cytoplasm,” and “nucleus” was also the most enriched group of all GO categories. Among the molecular function categories, “DNA binding,” “DNA-binding transcription factor activity,” and “protein binding” were the most abundant (Figure 4A).
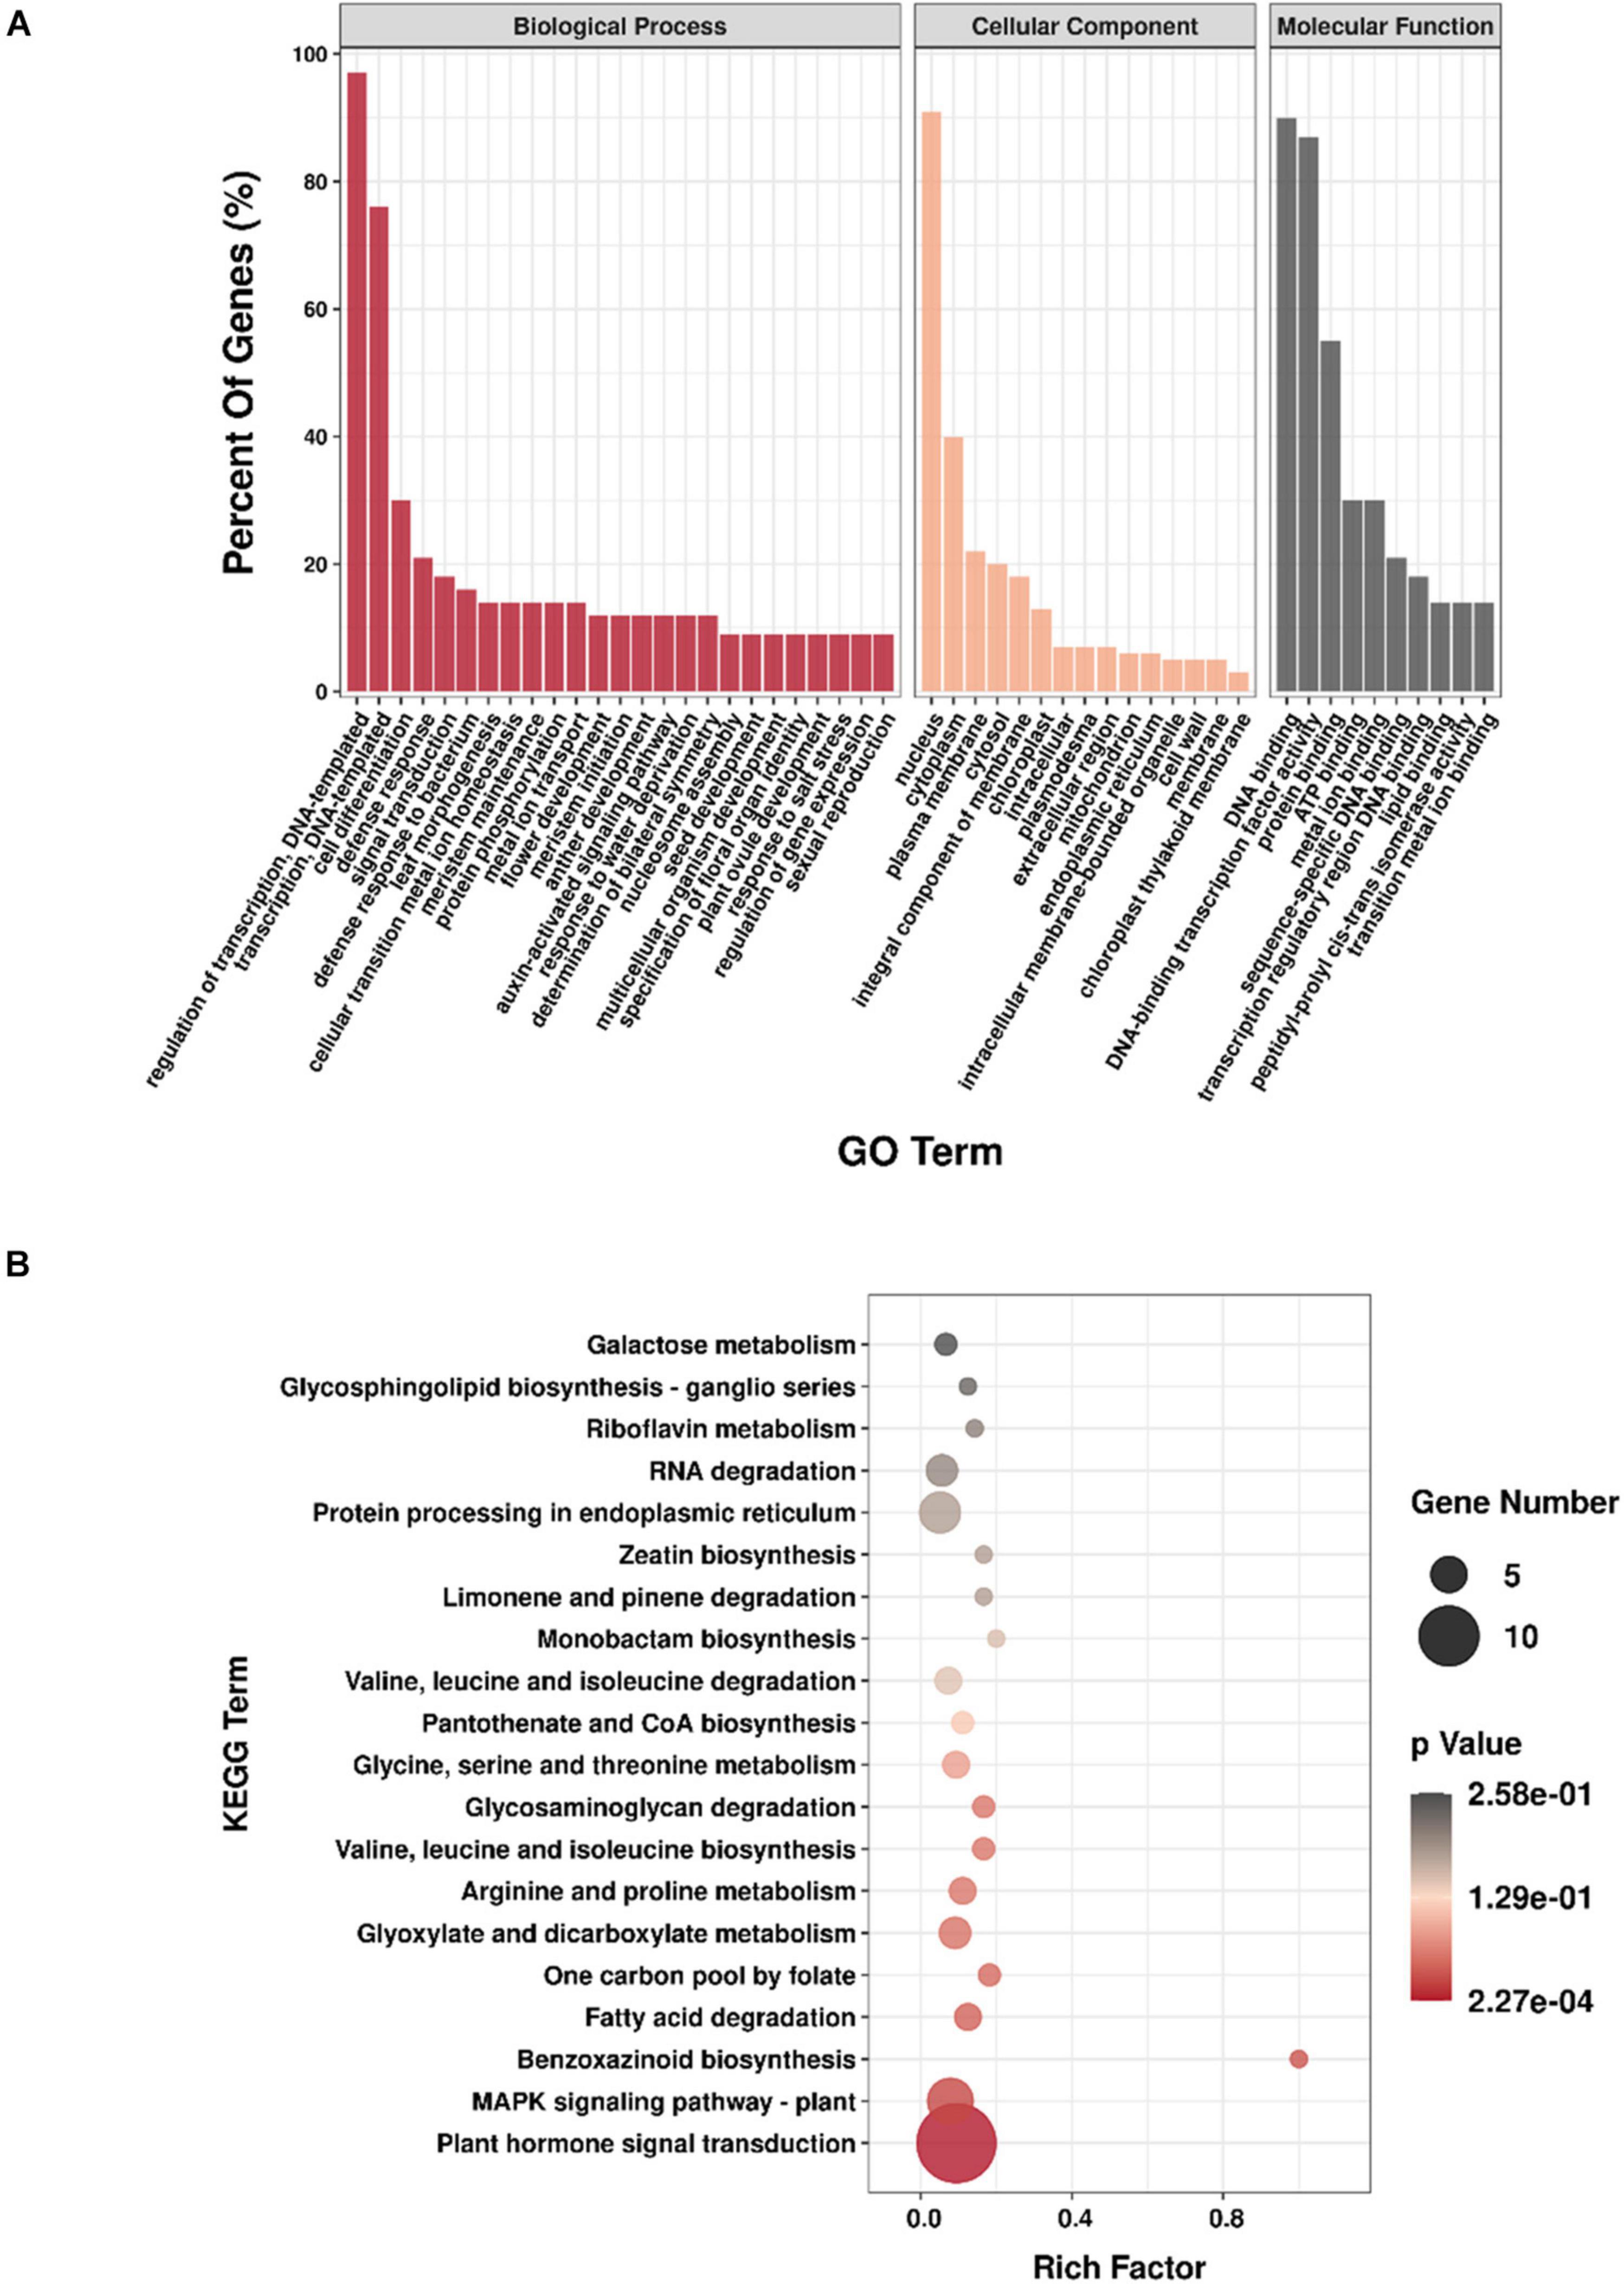
Figure 4. Enrichment analysis of target genes. (A) GO annotation of the genes targeted by miRNAs; (B) KEGG enrichment of genes targeted by miRNAs.
Then, through KEGG analysis, 78 targets were annotated to 67 different pathways (Supplementary Table 10). ko04075 (plant hormone signal transduction) and ko04016 (MAPK signaling pathway – plant) pathways, which were associated with 14 and 7 unigenes, respectively, were the most abundant pathways (Figure 4B), indicating their significant roles response to drought stress in M. ruthenica. Figure 5 is the network plot for the miRNAs and their targets associated with ko04016, ko04075, and ko04626 (plant–pathogen interaction) pathways. The squamosa promoter binding protein-likes (SPLs) targeted by miR156, and auxin response factors (ARFs) targeted by miR160 were mainly involved in plant hormone signal transduction. The PRB1 (putative reverse transcriptase, RNA-dependent DNA polymerase) targeted by the novel miRNA PC-3p-39042_145 was related to ko04016, ko04075, and ko04626 pathways. The PYL9 (putative polyketide cyclase/dehydrase, START-like domain-containing protein), which was the target gene of ppe-MIR169i-p5_2ss17GT19TG, was related to ko04016 and ko04075 pathways. Probable WRKY transcription factor 75 (WRKY75), which was the target gene of ppe-MIR169i-p5_2ss17GT19TG, was involved in ko04016 and ko04626 pathways. Several target plots (T-plots) for these miRNAs and their target genes validated by degradome sequencing were showed in Figure 6.
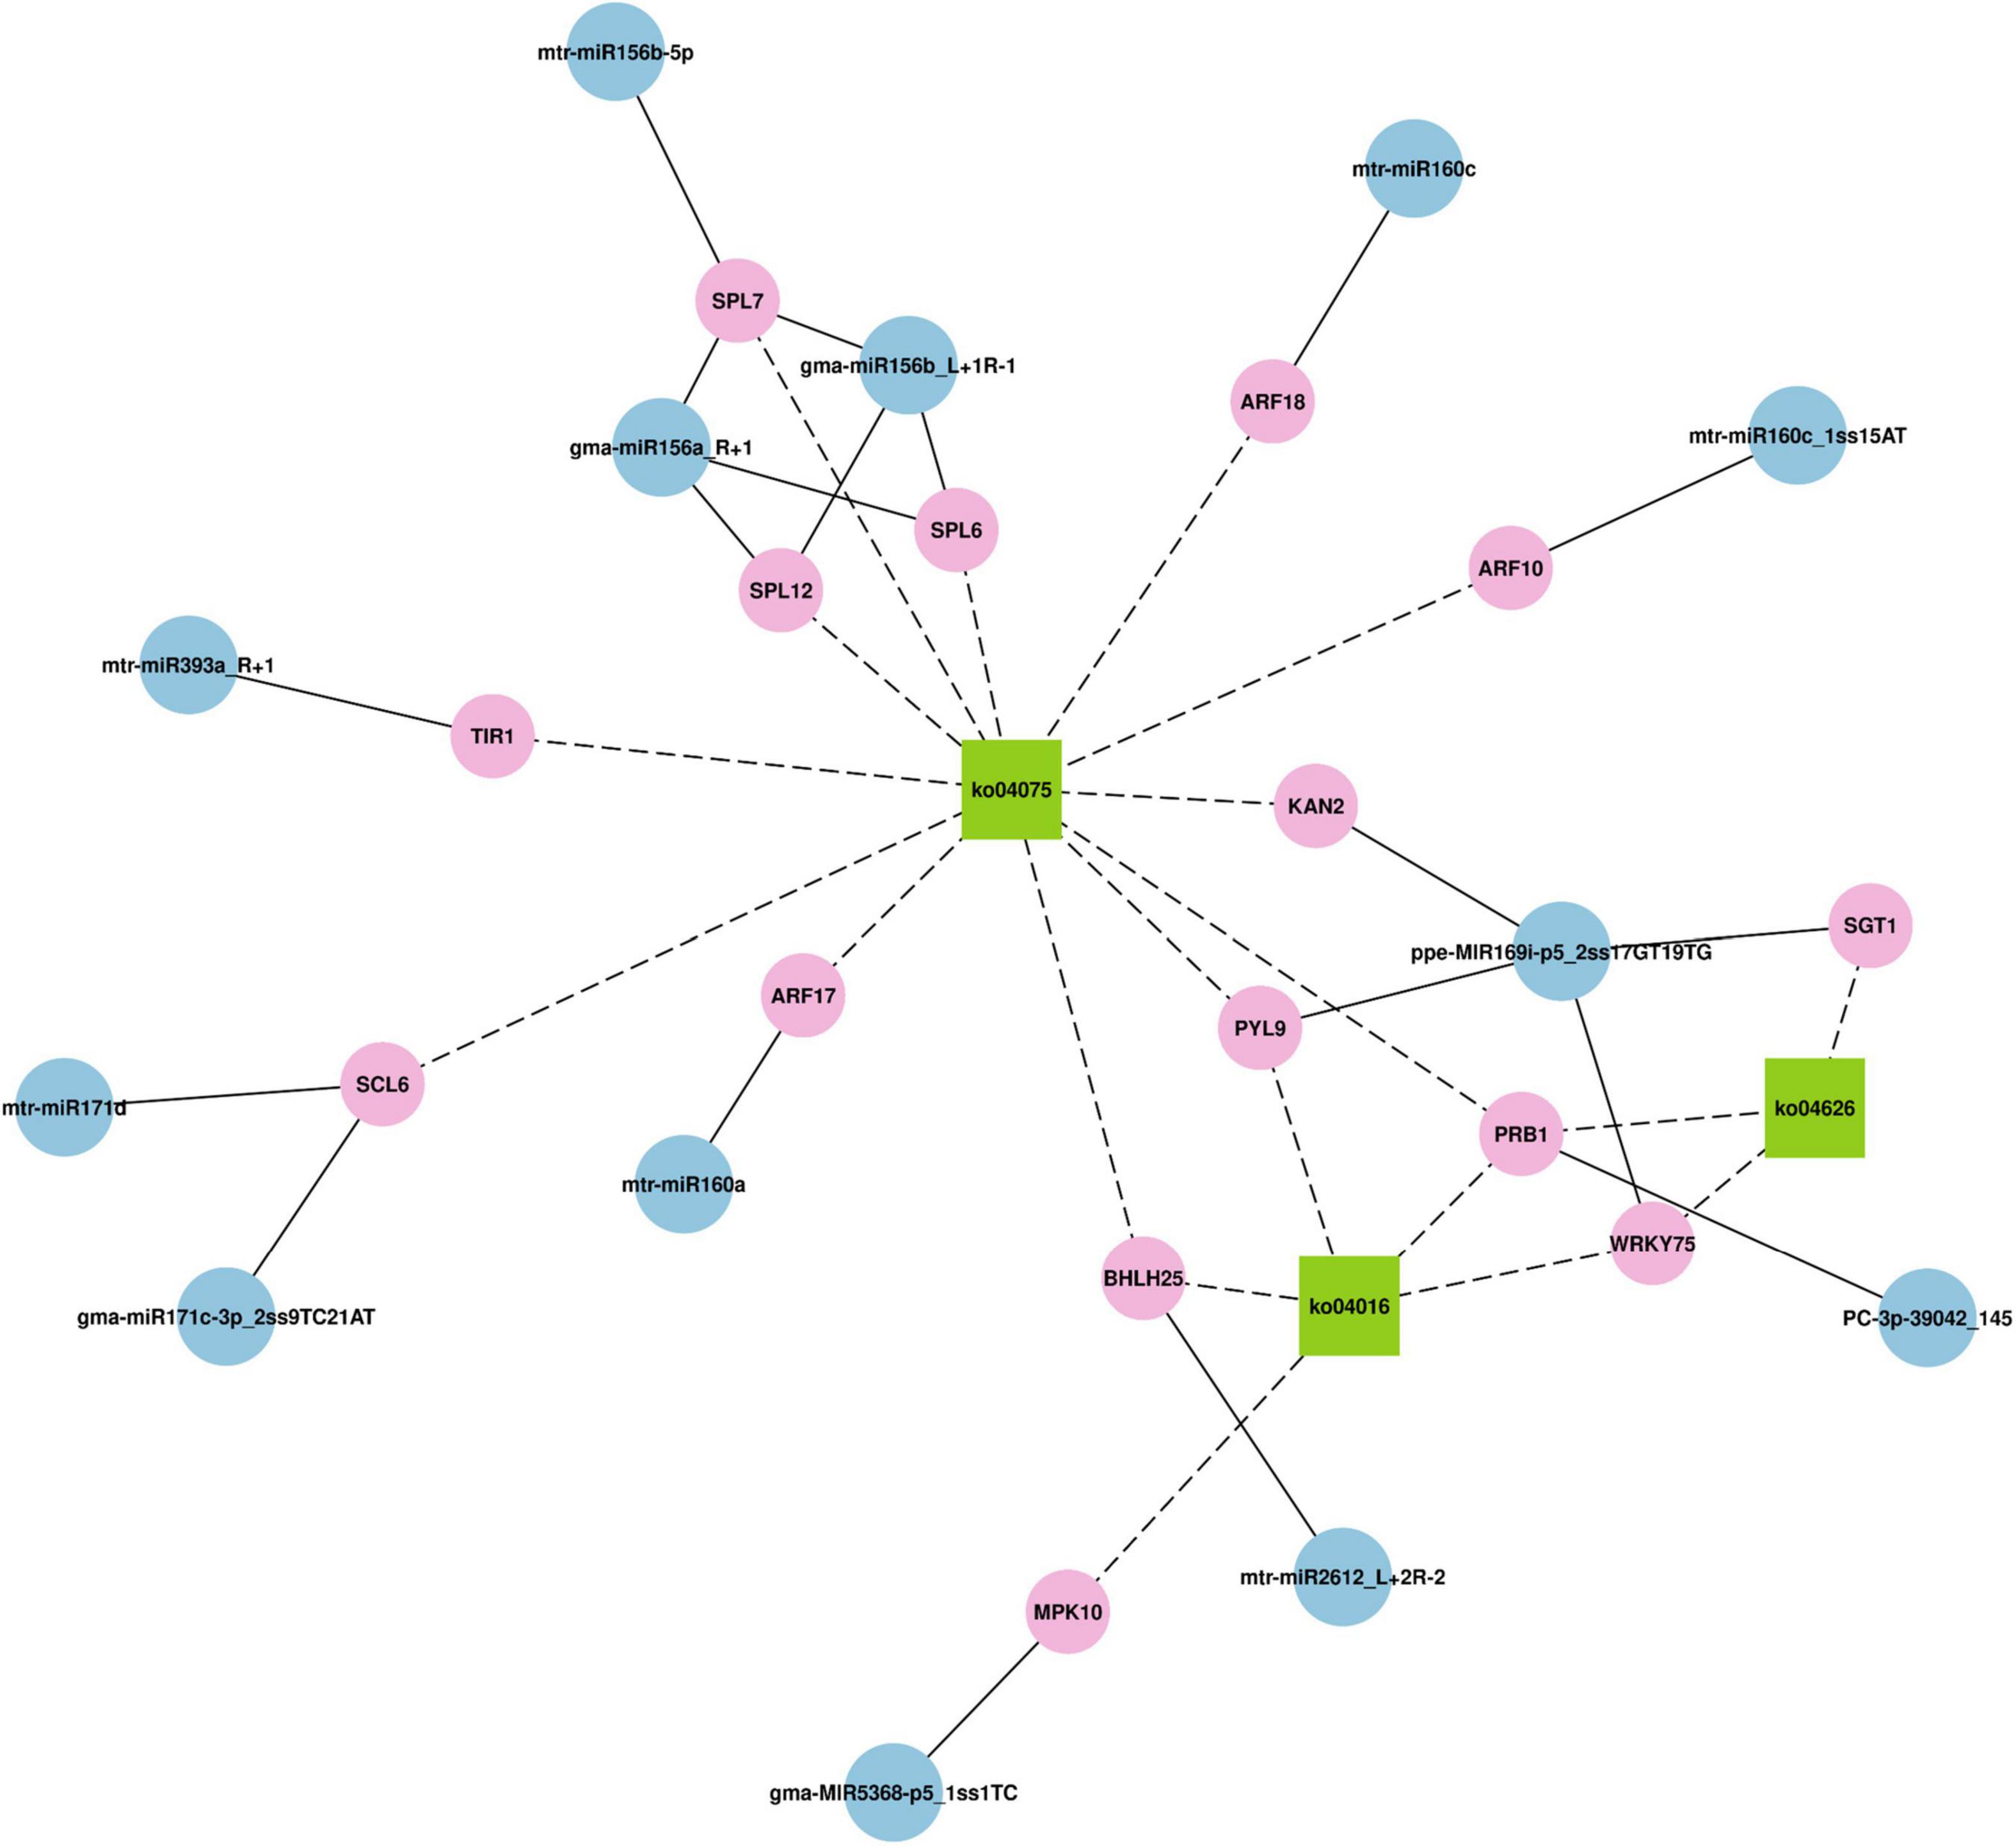
Figure 5. The network plot for the miRNAs and their targets associated with ko04016 (MAPK signaling pathway – plant) pathways, ko04075 (plant hormone signal transduction), and ko04626 (plant–pathogen interaction).
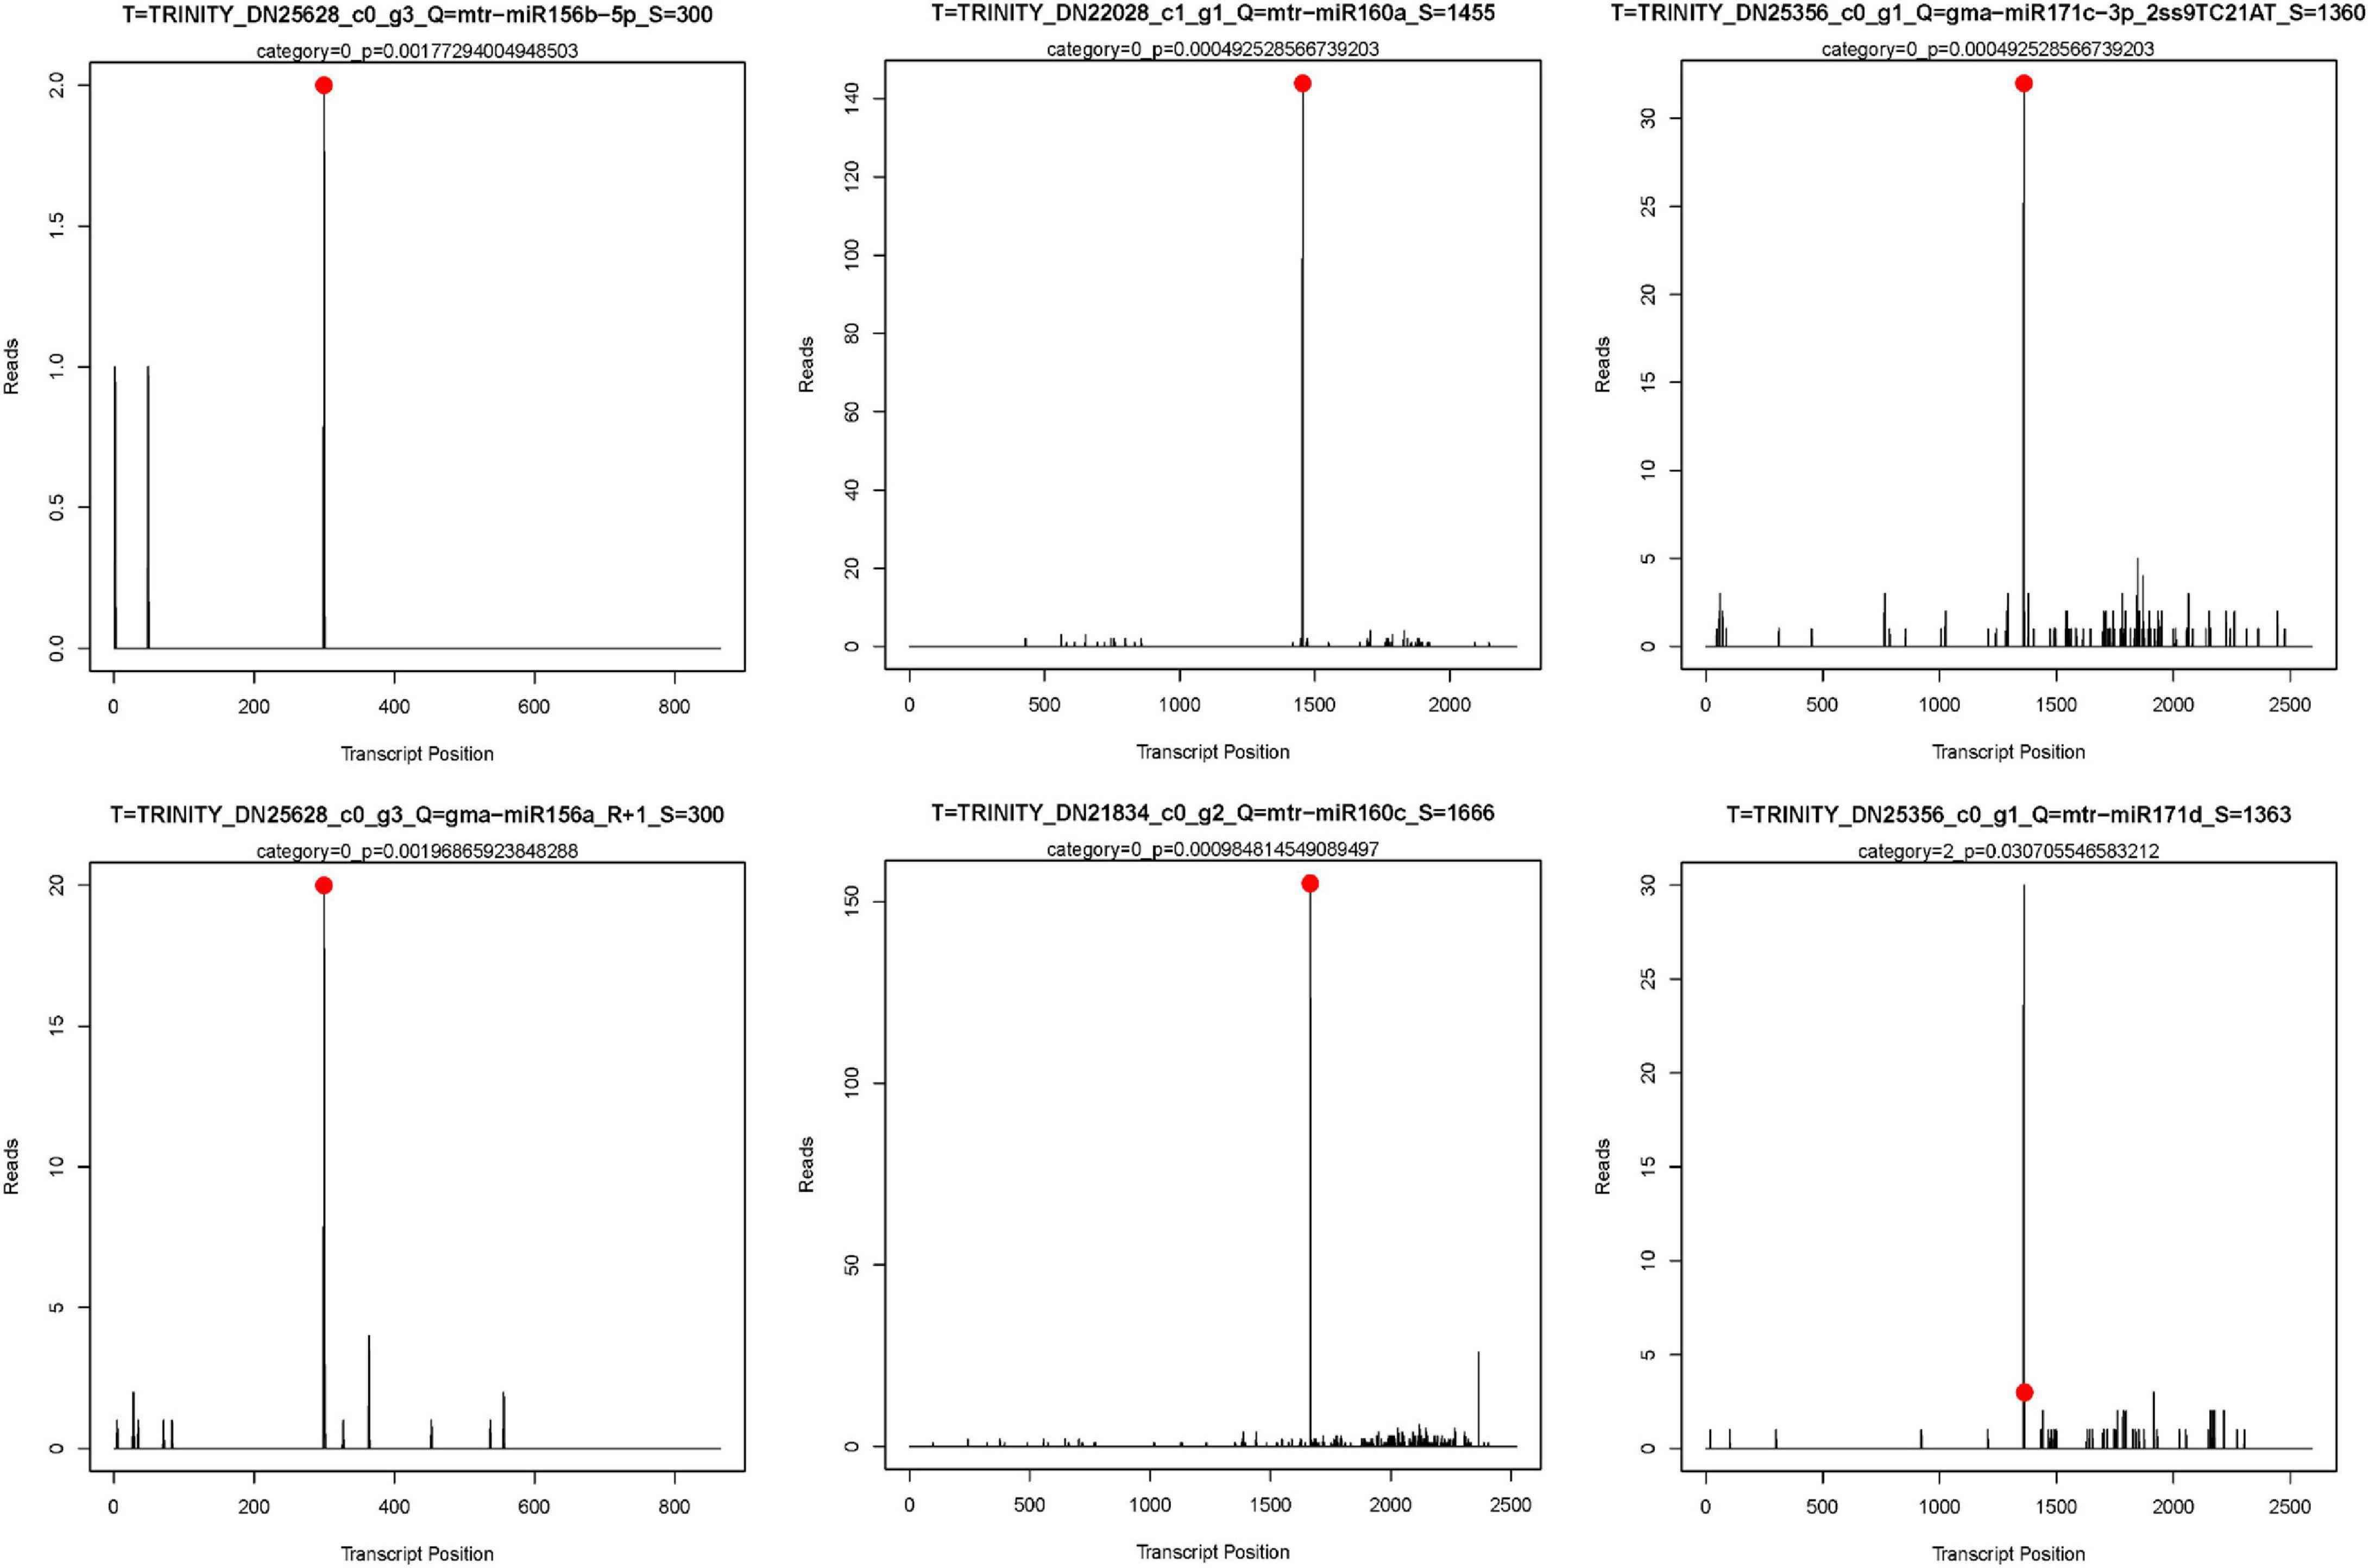
Figure 6. The target plots (T-plots) for target genes of miRNAs by degradome sequencing. X-axis, the site position of target transcript. Y-axis, the normal abundance of raw tags. Red circle, the cleavage site.
Three miRNA-target pairs with negative regulatory relationships were chosen for validation via qRT-PCR analysis. The qRT-PCR results were consistent with those of Illumina sequencing and confirmed that the three miRNA-target pairs all displayed reversed expression pattern in our study (Figure 7). This also suggests that our small RNAs and degradome sequencing data are reliable.
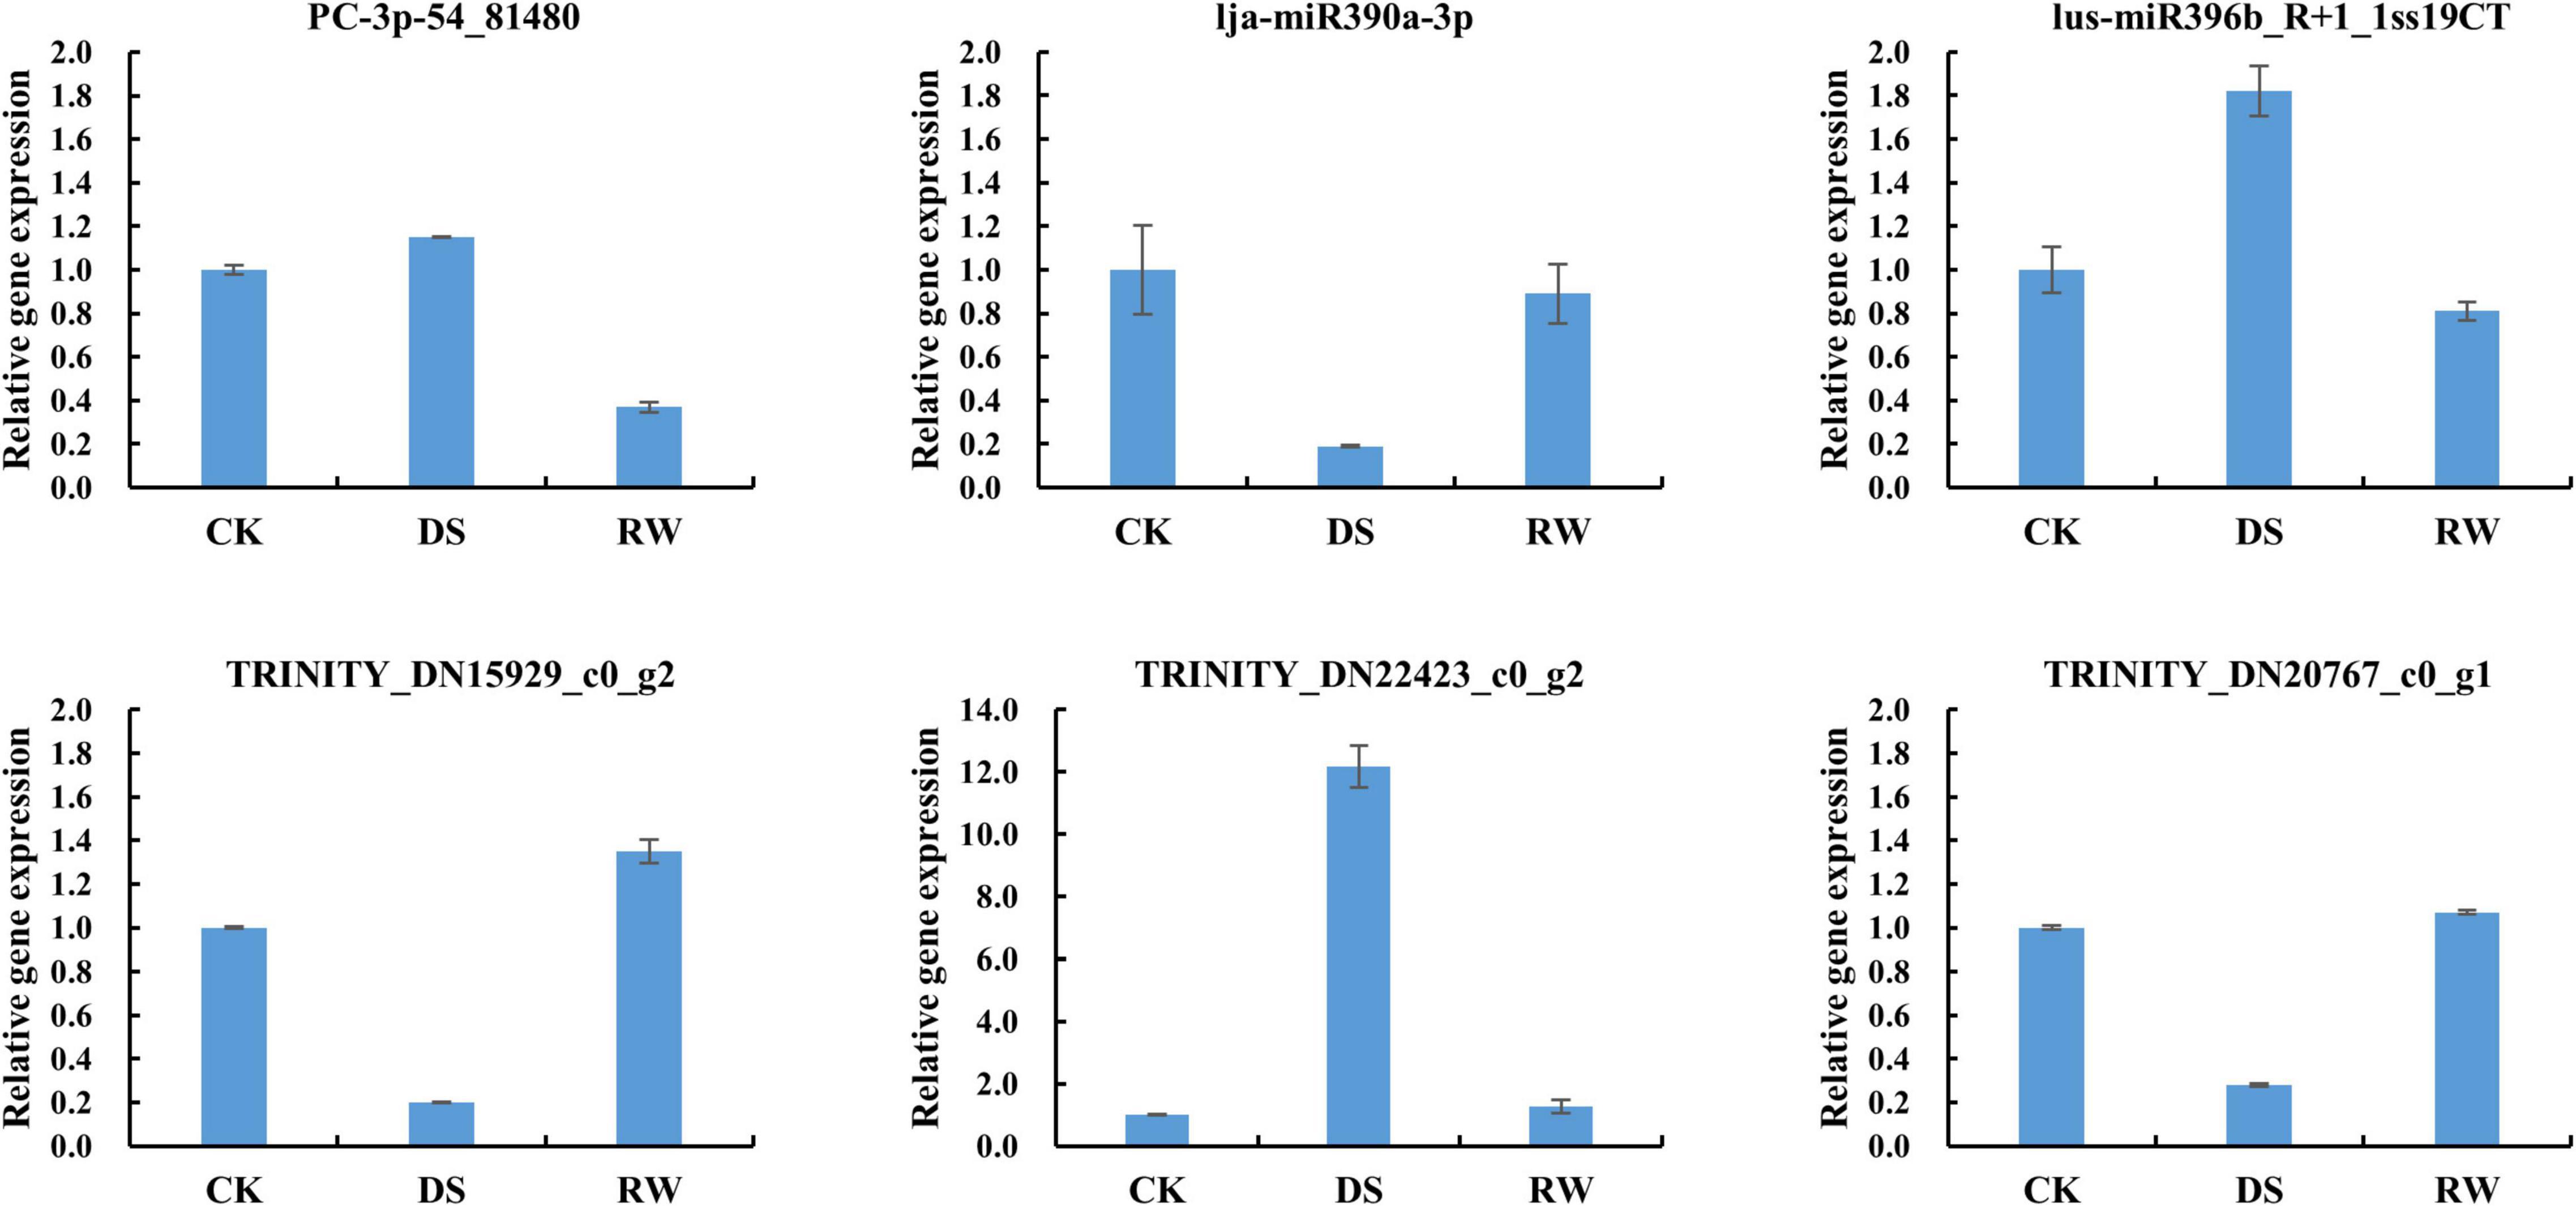
Figure 7. Relative expression results of miRNAs and their target via qRT-PCR in M. ruthenica. GAPDH of alfalfa and mtr-U6 were used as an internal reference for mRNA and miRNAs, respectively. All qRT-PCR reactions were repeated three times for each sample. Error bars indicate the standard deviation of three biological replicates.
Correlation Analysis of miRNA Expression Profiles and Their Targets
Based on the degradome sequencing, we integrated the expression profiles of the miRNA and target genes from the different comparison groups, and obtained a table that summarizes the miRNA-target gene association analysis. After extracting information from the general table, we formulated a differential miRNA-differential target gene association analysis table, from which we obtained miRNA-target gene pairs with negative regulatory relationships. Corresponding to the DEMs, there were 38 differentially expressed targets from 16 miRNAs in DS vs. CK, 31 from 11 miRNAs in DS vs. RW, and 6 from three miRNAs in RW vs. CK (Supplementary Table 11). Then, 21, 18, and 3 miRNA-target gene pairs showed a reverse expression pattern in the DS vs. CK, DS vs. RW, and RW vs. CK comparison groups, respectively (Table 7). We found that gma-miR171j-5p was significantly downregulated in DS vs. CK and DS vs. RW, while its target, TRINITY_DN16578_c0_g1, was significantly upregulated. This may imply that the miRNA-target gene pair were specifically triggered by water deficit.
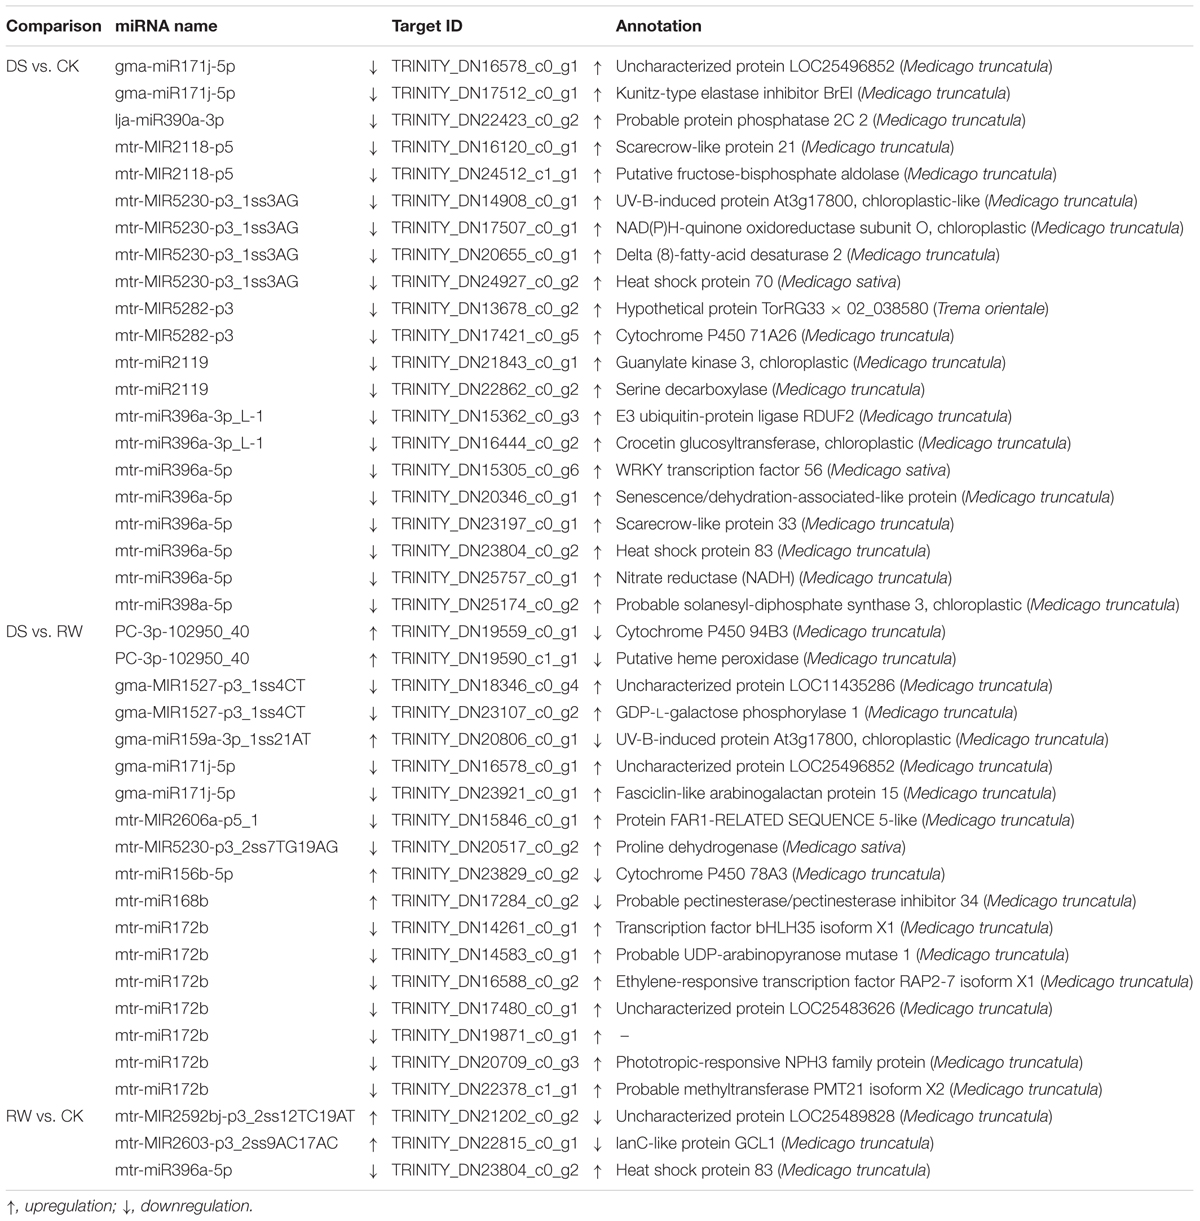
Table 7. The miRNA-target gene pairs showed reverse expression patterns in the three comparison groups.
Discussion
Compared with other leguminous plants, little research has been conducted on the role of miRNAs in M. ruthenica. Here, three important high-throughput methods were applied to investigate the mechanism of drought resistance in M. ruthenica. The transcriptome data set was used as a reference sequence for small RNA and degradome sequencing analyses to identify the miRNAs and their target genes that might be associated with drought stress.
Through transcriptome sequencing, a total of 147,957 transcripts, assembled into 52,457 unigenes, were obtained from nine cDNA libraries. Through small RNAomics analysis, 532 conserved genes belonging to 65 miRNA families and 63 novel miRNAs were identified from miRNA libraries, 50 of which showed significantly different expression patterns among the three groups. Some miRNAs that responded to drought in previous studies were also detected in our results, such as miR156, miR159, miR162, miR171, miR396, miR398, miR408, miR1507, miR1510, miR2111, and miR3630 (Wang et al., 2011; Chen et al., 2015; Ferdous et al., 2015; Arshad et al., 2017; Li et al., 2017; Ji et al., 2018; López-Galiano et al., 2019), indicating the important roles of these conserved miRNAs under drought stress. We also found five novel miRNAs in the 50 DEMs, among which, PC-3p-54_81480 and PC-3p-102950_40 were upregulated under drought stress, and were downregulated after rewatering treatment; whereas the expression of PC-5p-19253_324, PC-3p-61527_82, and PC-5p-81557_56 were downregulated, and then upregulated in the aforementioned respective conditions.
Among the 50 DEMs, three members (mtr-miR398a-3p/a-5p/b) of the miR398 family and two members (bra-MIR408-p5 and mtr-miR408-3p) of the miR408 family were all downregulated under drought, which was consistent with the results in pea (Jovanović et al., 2014). In contrast, another study indicated that miR398a/b and miR408 were increased due to water deficit in M. truncatula (Trindade et al., 2010). These differences may be caused by the difference in species, extent and duration of drought stress (Wang et al., 2011), and sensitivity of some miRNAs to subtle differences in plant growth conditions (Ferdous et al., 2015). This suggests that even conserved miRNAs might function in a species-specific manner (Kamthan et al., 2015). In our study, some miRNAs from the same family (such as miR398, miR408, and miR1527) showed differently expressed trends after rewatering. Similar results were observed in rice, wherein members of miR319 showed different degrees of up- or downregulation responses to drought (Zhou et al., 2010). It is possible that the miRNA gene regulators change their expression after rewatering, leading to changes in miRNA expression patterns (Ferdous et al., 2015).
Generally, a single miRNA can target several genes (Samad et al., 2017), and a single gene can be regulated by several miRNAs (Katiyar et al., 2015). We found that ppe-MIR169i-p5_2ss17GT19TG, which had the maximum number of targets among all miRNAs, targeted 90 transcripts in three libraries totally. miR169 is the largest miRNA family in A. thaliana and has 14 members, which can be divided into four groups according to their mature miRNA sequences: miRNA-169a, miRNA-169b/c, miRNA-169d/e/f/g, and miRNA-169h/i/j/k/l/m/n (Du et al., 2017). Asefpour Vakilian (2020) revealed the contribution of each miRNA to stress response in plants by implementing the feature selection algorithm on the constructed database. The algorithm showed that miRNA169 had the highest contribution to drought stress (Asefpour Vakilian, 2020). Li et al. (2008) also demonstrated that miR169a and miR169c were substantially downregulated due to drought stress, and that miR169a mainly regulates NFYA5 expression at the mRNA level (Li et al., 2008), while miR169i mainly affects NFYA5 expression at the translational level (Du et al., 2017). In our study, a total of 78 ppe-MIR169i-p5_2ss17GT19TG targets were annotated by GO terms in three libraries (Supplementary Table 12). The nucleus (GO:0005634) involving 24 genes was the most enriched group of all GO categories, followed by the cytoplasm (GO:0005737), protein binding (GO:0005515), and plasma membrane (GO:0005886). KEGG analysis of ppe-MIR169i-p5_2ss17GT19TG targets showed that 30 genes annotated to 33 different pathways (Supplementary Table 12). Figure 8 was the network plot for the target genes of ppe-MIR169i-p5_2ss17GT19TG and their KEGG pathways, for instance, CRWN (protein CROWDED NUCLEI) involved in ko00270 (Cysteine and methionine metabolism), ko00280 (Valine, leucine, and isoleucine degradation), ko00290 (Valine, leucine, and isoleucine biosynthesis), and ko00770 (Pantothenate and CoA biosynthesis) pathways simultaneously. JKD (zinc finger protein JACKDAW) related to ko00052 (Galactose metabolism), ko00600 (Sphingolipid metabolism), ko00531 (Glycosaminoglycan degradation), ko00604 (Glycosphingolipid biosynthesis – ganglio series), and ko00511 (Other glycan degradation) pathways, which revealed the extensive regulatory roles of ppe-MIR169i-p5_2ss17GT19TG in M. ruthenica.
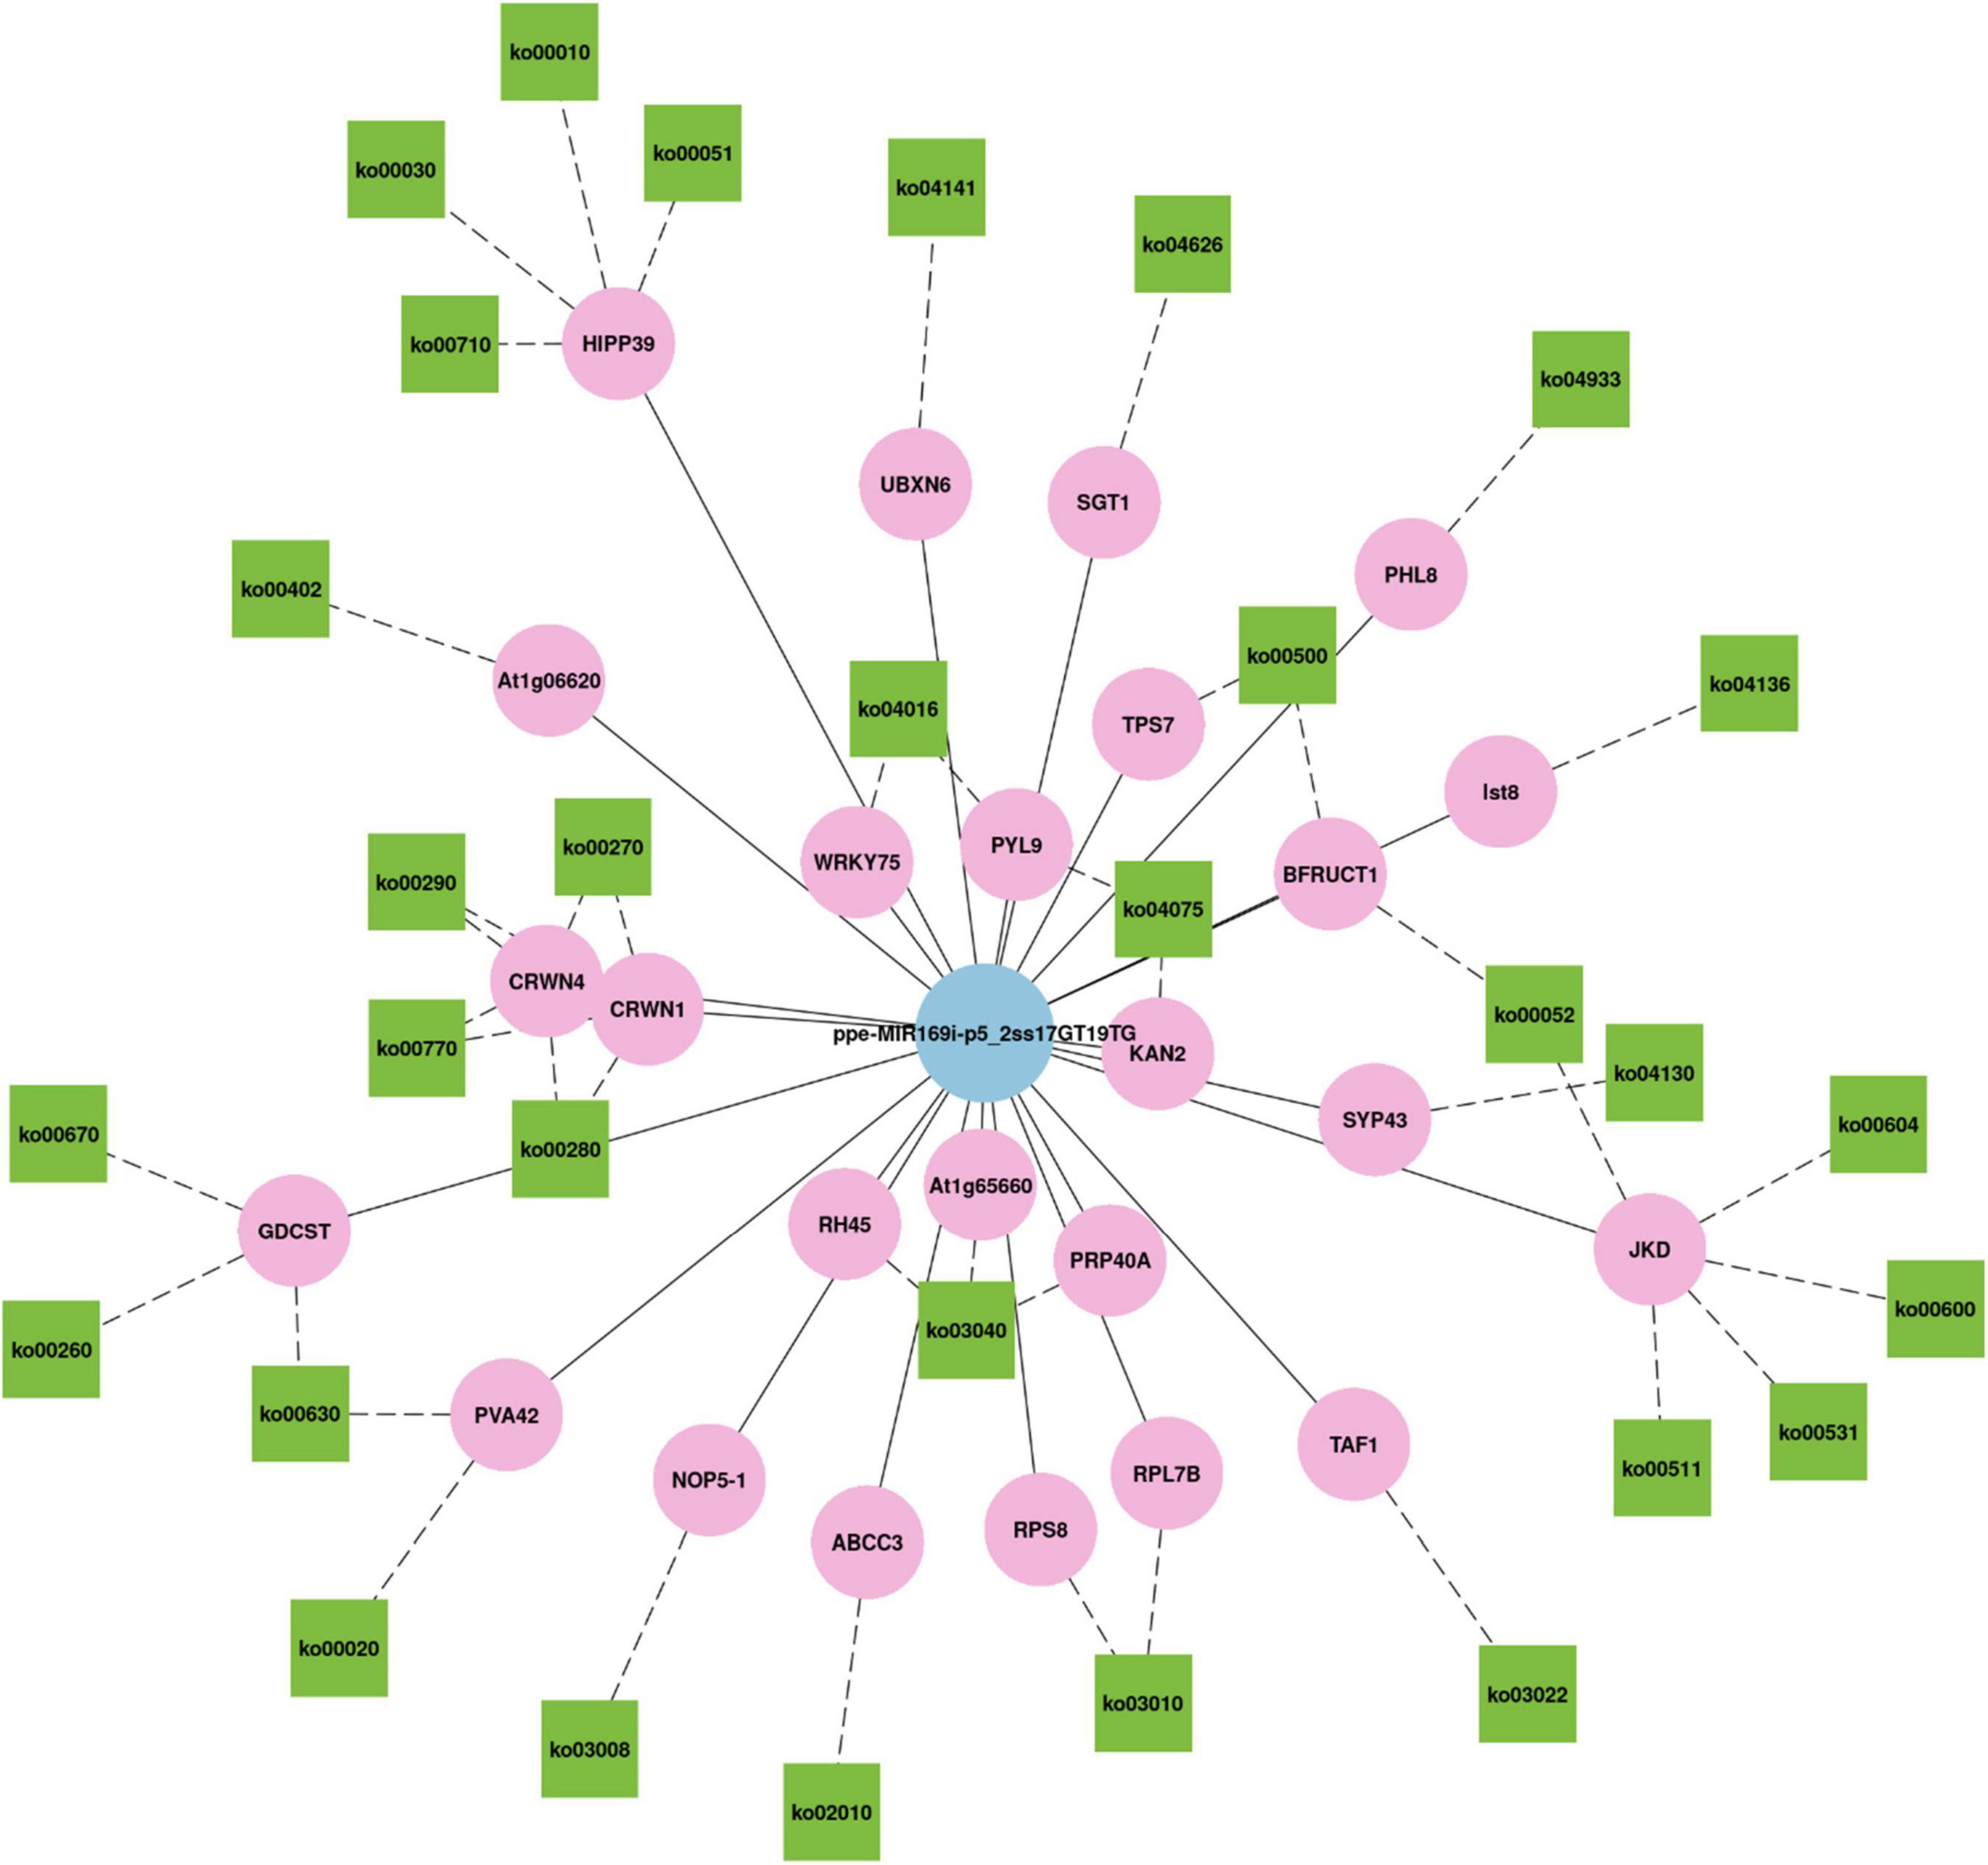
Figure 8. The network plot for the target genes of ppe-MIR169i-p5_2ss17GT19TG and their KEGG pathways.
Degradome sequencing is based on high-throughput sequencing technology and bioinformatics analysis and avoids false positive results effectively, which makes it more suitable for plant miRNA target gene identification (Sun et al., 2015). Through the correlation analysis of the transcriptome-small RNA-degradome, we obtained differential miRNA-differential target gene association results and miRNA-target pairs with negative regulatory relationships. Among them, two miRNA-target pairs appeared in two comparison groups. gma-miR171j-5p was significantly downregulated in DS vs. CK and DS vs. RW, while its target TRINITY_DN16578_c0_g1 was significantly upregulated. Similarly, mtr-miR396a-5p was significantly downregulated in DS vs. CK and RW vs. CK, while its target TRINITY_DN23804_c0_g2 was significantly up-regulated. SCL6-II and SCL6 are the target genes of miR171 in A. thaliana (Lee et al., 2008), which play roles in plant root and leaf development, photochrome signaling, lateral organ polarity, meristem formation, vascular development, and stress response (Wang et al., 2010; Zhu et al., 2015; Asefpour Vakilian, 2020). gma-miR171o and gma-miR171q regulate GmSCL-6 and GmNSP2, respectively, which in turn influence the spatial and temporal aspects of soybean nodulation (Hossain et al., 2019). miRNA-396 is an important contributor to the plant stress response which targets four classes of stress resistance proteins: pathogen-related, nucleotide binding site resistance protein-like, dirigent-like, and ribonuclease-like proteins (Zhang et al., 2007). miRNA-396 targets cell cycle regulators, as well as those that control plant growth and differentiation. miRNA-396 is increased under stress and represses cell multiplication (Patel et al., 2019).
Conclusion
In conclusion, we elucidated the small RNAs and their target genes in M. ruthenica when subjected under drought stress and rehydration treatment though transcriptome, small RNA, and degradome sequencing. Although the complex miRNA-mediated regulatory networks remain to be elucidated, these findings provide valuable information for further functional characterization of genes and miRNAs in response to abiotic stress, in general, and drought stress in M. ruthenica. More importantly, this study will serve as a foundation for future research on the functional roles of miRNAs and their target genes in legume forage.
Materials and Methods
Plant Material and Drought Treatments
Medicago ruthenica seeds were obtained from the Institute of Grassland Research, Chinese Academy of Agricultural Sciences at the Inner Mongolia Autonomous Region, China. This cultivar grows well in Inner Mongolia, with higher drought and cold resistance. The sanded M. ruthenica seeds were sterilized in concentrated sulfuric acid for 10 min, and then washed thoroughly with sterile water (Araújo et al., 2004). After incubating for 3 days at 4°C in dark conditions, the seeds were placed on soaked filter paper in Petri dishes, and incubated in an artificial climate chamber (temperature, 25 ± 2°C; photoperiod, 16 h light/8 h dark cycle; relative humidity, 50%). Two days later, the germinated seeds were transferred to pots (13 cm in diameter and 10 cm deep) with vermiculite and quartz sand. There were eight plants in each pot. Four-week-old seedlings were randomly divided into three groups: the control group (CK), the drought stress treatment group (DS), and the rewatering group (RW). The drought treatment period lasted for 15 days. During the experiment, CK plants were watered every 3 days, maintaining a relative soil moisture content of more than 80%, while DS and RW plants were subjected to water deprivation for 15 days, resulting in a relative soil moisture content of 20% on the 15th day. The RW plants were rehydrated to full soil saturation on the 15th day. To avoid any interference, no nutrients were added. Other growth conditions were maintained. Each treatment group had three biological replicates. Leaf samples of CK and DS were collected on the 15th day, and leaves of RW were collected 2 days after rewatering. Samples were immediately frozen in liquid nitrogen, and stored at −80°C for later use.
Transcriptome Libraries Construction, Sequencing, and Analysis
Total RNA was isolated from M. ruthenica leaves using TRIzol reagent (Invitrogen, CA, United States) according to the manufacturer’s protocol. Total RNA quantity and purity were analyzed using a Bioanalyzer 2100 (Agilent, CA, United States) and RNA 6000 Nano LabChip Kit (Agilent, CA, United States), respectively. Poly(A) RNA was obtained from total RNA (5 μg) using poly T oligo-attached magnetic beads after two rounds of purification. Following purification, the mRNA was fragmented into small pieces using divalent cations at elevated temperatures. Then, the cleaved RNA fragments were reverse-transcribed to create the final cDNA library by following the protocol for the mRNASeq sample preparation kit (Illumina, San Diego, CA, United States). The average insert size for the paired-end libraries was 300 bp (±50 bp). Paired-end sequencing was performed using an Illumina Hiseq4000 instrument (LC Sciences, United States) according to the manufacturer’s instructions.
The adaptor contamination, low quality bases, and undetermined bases from raw data were removed using Cutadapt (Martin, 2011) and perl scripts in house. Then sequence quality was verified by FastQC,7 including the Q20, Q30 and GC-content of the clean data. All downstream analyses were based on clean data of high quality. De novo assembly of the transcriptome was performed with Trinity 2.4.0 (Grabherr et al., 2011). Trinity groups transcripts into clusters based on shared sequence content. Such a transcript cluster is very loosely referred to as a “gene.” The longest transcript in the cluster was chosen as the “gene” sequence (aka Unigene).
Differentially Expressed Genes Analysis
Salmon (Patro et al., 2017) was used to perform expression levels for genes by calculating TPM (Mortazavi et al., 2008). Statistically significant (p-value < 0.05) DEGs with a log2 (fold change) > 1 or log2 (fold change) < −1 we selected using the R package edgeR (Robinson et al., 2010). Next, GO and KEGG enrichment analyses were performed on the differentially expressed genes using in-house Perl scripts. The GO project is a bioinformatics resource on gene products and descriptions of functions (Gene Ontology Consortium et al., 2013). It creates annotations to describe the biological roles of individual gene products (e.g., genes, proteins, ncRNAs, complexes) by classifying them (Gene Ontology Consortium, 2015). The relationships between a gene product/or gene-product group to biological process, molecular function, and cellular component are one-to-many. GO ontologies can also use for annotation of gene-expression data (Gene Ontology Consortium et al., 2000). KEGG is a knowledge base for systematic analysis of gene functions in terms of the networks of genes and molecules (Ogata et al., 1999). KEGG is widely used for analyzing genomics, transcriptomics, proteomics, glycomics, metabolomics, and other high-throughput data (Kanehisa et al., 2017). The online Blast algorithm8 can be used to analyze genes. If the significant similarities of Blast lead to the assignment of designated enzymes, these genes can be tagged in the corresponding KEGG pathways (Altermann and Klaenhammer, 2005).
Small RNAs Sequencing and Bioinformatics Analysis
Nine small RNA libraries were constructed from approximately 5 μg of total RNA using TruSeq Small RNA Sample Prep Kits (Illumina, San Diego, CA, United States). Then the libraries were sequenced by Illumina Hiseq 2500 (LC Sciences, United States) following the vendor’s recommended protocol.
The adapter dimers, junk, low complexity, repeats, and common RNA families (rRNA, tRNA, snRNA, and snoRNA) were removed from raw reads using an in-house program, ACGT101-miR (LC Sciences, Houston, TX, United States). Subsequently, unique sequences (18–25 nt) were mapped to specific species precursors in miRBase 22.0 through a BLAST search; conserved miRNAs and novel 3p- and 5p-derived miRNAs were then identified. Length variation at both 3′ and 5′ ends and one mismatch inside of the sequence were allowed in the alignment. The unique sequences mapping to specific species mature miRNAs in hairpin arms were identified as known miRNAs. The unique sequences mapping to the other arm of known specific species precursor hairpin opposite to the annotated mature miRNA-containing arm were considered to be novel 3p- and 5p-derived miRNA candidates. The remaining sequences were mapped to other selected species precursors (with the exclusion of specific species) in miRBase 22.0 by BLAST search, and the mapped pre-miRNAs were further BLASTed against the specific species genomes to determine their genomic locations. The above two we defined as known miRNAs. The unmapped sequences were BLASTed against the specific genomes, and the hairpin RNA structures containing sequences were predicated from the flank 120 nt sequences using RNAfold software.9
Detection of Differential Expressed miRNAs
The differential expression of miRNAs, based on normalized deep-sequencing counts, was analyzed by T-test. The criteria to classify DEMs between two-way pairing among the three experimental conditions (CK vs. DS; DS vs. RW; RW vs. CK) were as follows: the significance thresholds were set to be p < 0.05 in each test.
Construction and Analysis of Degradome Libraries
The degradome libraries construction was further optimized and simplified based on Ma et al. (2010). Total RNA from the three groups (CK, DS, and RW) was isolated and purified using TRIzol reagent (Invitrogen, CA, United States) according to the manufacturer’s protocol. The RNA amount and purity of each sample were quantified using a NanoDropND-1000 (NanoDrop, Wilmington, DE, United States). RNA integrity was assessed using Agilent 2100 with RIN number > 7.0. Poly(A) RNA was purified from the plant total RNA (20 μg) twice using poly T oligo-attached magnetic beads. Because the three RNA cleavage products contain a 5′-monophosphate, the 5′ adapters were ligated to their respective 5′ ends using RNA ligase. Then, the first strand of cDNA for each mRNA was reverse transcribed using a 3-adapter random primer. Size selection was then performed using AMPureXP beads. Afterwards, the cDNA was amplified via PCR under the following conditions: initial denaturation at 95°C for 3 min; 15 cycles of denaturation at 98°C for 15 s, annealing at 60°C for 15 s, and extension at 72°C for 30 s; then a final extension at 72°C for 5 min. The average insert size for the final cDNA library was 200–400 bp. Lastly, we performed 50 bp single-end sequencing using an Illumina Hiseq2500 (LC Bio, China) according to the manufacturer’s recommended protocol.
Raw reads were subjected to ACGT101-DEG (LC Sciences, Houston, TX, United States) for data processing. This program mainly depends on CleaveLand4, a public software package for analyzing “degradome” data. Degradome data are a variant type of RNA-seq data, where the reads derive from the 5′-ends of uncapped RNAs (German et al., 2008; Addo-Quaye et al., 2009). These data can be used to identify miRNA and siRNA targets that are actively “sliced.” CleaveLand4 handles several phases of degradome data analysis in a single command, including: Alignment of degradome data to the reference transcriptome, and parsing the output into a “degradome density file.” The degradome density file reflects the counts of 5′ positions across the transcriptome. Alignment of query miRNAs or siRNAs to the transcriptome to generate a list of potential target sites. This uses the program “GSTAr.pl” (Generic Small RNA Transcript Aligner), which ships with the CleaveLand4 program. GSTAr.pl uses RNA–RNA thermodynamic predictions instead of sequence similarity to identify potential target sites, making it much slower than generic aligners, but more sensitive in terms of finding all possible sites. Cross-referencing the degradome data with the alignments to identify slicing sites with evidence of slicing. This includes assessment of p-values.
All the identified target genes were annotated via GO (see text footnote 1) and classified using KEGG pathways (see text footnote 2).
Verification of mRNAs and miRNAs via Quantitative Real-Time PCR
The RNA-seq results for both mRNA and miRNA expression were verified via qRT-PCR. Total RNA was extracted from nine leaf samples using TRIzol reagent (Invitrogen, CA, United States). For the miRNA expression analysis, the U6 snRNA of M. truncatula was used as the reference gene. The alfalfa GAPDH gene was used as an internal reference for the mRNA expression analysis. All primers used for qRT-PCR are listed in Supplementary Table 13. qPCR was conducted using the ChamQ SYBR Color qPCR Master Mix (2X) on a LineGene9600plus Real Time PCR instrument. Three biological and three technical replicates were performed for each sample. Relative expression levels were calculated using the 2–ΔΔCo method (Livak and Schmittgen, 2001).
Data Availability Statement
The datasets presented in this study can be found in online repositories. The names of the repository/repositories and accession number(s) can be found below: NCBI GEO and GSE169056.
Author Contributions
FM and RS conceived and designed the study. RS, WJ, XZ, and YL conducted the experiments. All authors carried out the data analysis. RS wrote the manuscript. FM, WJ, LY, ZZ, XZ, and QW revised the manuscript. All authors contributed to the article and approved the submitted version.
Funding
This study was funded through an international cooperation between China and the EUC (2017YFE0111000).
Conflict of Interest
The authors declare that the research was conducted in the absence of any commercial or financial relationships that could be construed as a potential conflict of interest.
Publisher’s Note
All claims expressed in this article are solely those of the authors and do not necessarily represent those of their affiliated organizations, or those of the publisher, the editors and the reviewers. Any product that may be evaluated in this article, or claim that may be made by its manufacturer, is not guaranteed or endorsed by the publisher.
Acknowledgments
We would like to thank everyone who supported the international cooperation project (EUCLEG 727312) led by Bernadette Julier – INRA. We also would like to extend our appreciation to the referees and editors for their suggestions, comments, and critical reviews.
Supplementary Material
The Supplementary Material for this article can be found online at: https://www.frontiersin.org/articles/10.3389/fpls.2021.675903/full#supplementary-material
Footnotes
- ^ http://www.geneontology.org
- ^ http://www.genome.jp/kegg/
- ^ http://pfam.xfam.org/
- ^ http://www.expasy.ch/sprot/
- ^ http://eggnogdb.embl.de/
- ^ http://www.ncbi.nlm.nih.gov/
- ^ http://www.bioinformatics.babraham.ac.uk/projects/fastqc/
- ^ http://www.ncbi.nlm.nih.gov/BLAST/
- ^ http://rna.tbi.univie.ac.at/cgi-bin/RNAfold.cgi
References
Addo-Quaye, C., Miller, W., and Axtell, M. J. (2009). CleaveLand: a pipeline for using degradome data to find cleaved small RNA targets. Bioinformatics 25, 130–131. doi: 10.1093/bioinformatics/btn604
Allen, E., Xie, Z., Gustafson, A. M., Sung, G. H., Spatafora, J. W., and Carrington, J. C. (2004). Evolution of microRNA genes by inverted duplication of target gene sequences in Arabidopsis thaliana. Nat. Genet. 36, 1282–1290. doi: 10.1038/ng1478
Altermann, E., and Klaenhammer, T. R. (2005). PathwayVoyager: pathway mapping using the kyoto encyclopedia of genes and genomes (KEGG) database. BMC Genomics 6:60. doi: 10.1186/1471-2164-6-60
Araújo, S. S., Duque, A. S., Santos, D., and Fevereiro, P. (2004). An efficient transformation method to regenerate a high number of transgenic plants using a new embryogenic line of Medicago truncatula cv. Jemalong. Plant Cell Tissue Organ Cult. 78, 123–131. doi: 10.1023/B:TICU.0000022540.98231.f8
Arshad, M., Feyissa, B. A., Amyot, L., Aung, B., and Hannoufa, A. (2017). MicroRNA156 improves drought stress tolerance in alfalfa (Medicago sativa) by silencing SPL13. Plant Sci. 258, 122–136. doi: 10.1016/j.plantsci.2017.01.018
Asefpour Vakilian, K. (2020). Machine learning improves our knowledge about miRNA functions towards plant abiotic stresses. Sci. Rep. 10:3041. doi: 10.1038/s41598-020-59981-6
Bartel, D. P. (2004). MicroRNAs: genomics, biogenesis, mechanism, and function. Cell 116, 281–297. doi: 10.1016/s0092-8674(04)00045-5
Buchfink, B., Xie, C., and Huson, D. H. (2015). Fast and sensitive protein alignment using DIAMOND. Nat. Methods 12, 59–60. doi: 10.1038/nmeth.3176
Campbell, T. A., Bao, G., and Xia, Z. L. (1997). Agronomic evaluation of Medicago ruthenica collected in Inner Mongolia. Crop Sci. 37, 599–604. doi: 10.2135/cropsci1997.0011183X003700020048x
Capitão, C., Paiva, J. A., Santos, D. M., and Fevereiro, P. (2011). In Medicago truncatula, water deficit modulates the transcript accumulation of components of small RNA pathways. BMC Plant Biol. 11:79. doi: 10.1186/1471-2229-11-79
Chekulaeva, M., and Filipowicz, W. (2009). Mechanisms of miRNA-mediated post-transcriptional regulation in animal cells. Curr. Opin. Cell Biol. 21, 452–460. doi: 10.1016/j.ceb.2009.04.009
Chen, J., and Li, L. (2018). Multiple regression analysis reveals MicroRNA regulatory networks in Oryza sativa under drought stress. Int. J. Genomics 2018:9395261. doi: 10.1155/2018/9395261
Chen, L., Luan, Y., and Zhai, J. (2015). Sp-miR396a-5p acts as a stress-responsive genes regulator by conferring tolerance to abiotic stresses and susceptibility to Phytophthora nicotianae infection in transgenic tobacco. Plant Cell Rep. 34, 2013–2025. doi: 10.1007/s00299-015-1847-0
Chi, X., Yang, Q., Chen, X., Wang, J., Pan, L., Chen, M., et al. (2011). Identification and characterization of microRNAs from peanut (Arachis hypogaea L.) by high-throughput sequencing. PLoS One 6:e27530. doi: 10.1371/journal.pone.0027530
Chinnusamy, V., Schumaker, K., and Zhu, J. K. (2004). Molecular genetic perspectives on cross-talk and specificity in abiotic stress signalling in plants. J. Exp. Bot. 55, 225–236. doi: 10.1093/jxb/erh005
Du, Q., Zhao, M., Gao, W., Sun, S., and Li, W. X. (2017). microRNA/microRNA∗ complementarity is important for the regulation pattern of NFYA5 by miR169 under dehydration shock in Arabidopsis. Plant J. 91, 22–33. doi: 10.1111/tpj.13540
Eulalio, A., Huntzinger, E., and Izaurralde, E. (2008). Getting to the root of miRNA-mediated gene silencing. Cell 132, 9–14. doi: 10.1016/j.cell.2007.12.024
Eyles, R. P., Williams, P. H., Ohms, S. J., Weiller, G. F., Ogilvie, H. A., Djordjevic, M. A., et al. (2013). microRNA profiling of root tissues and root forming explant cultures in Medicago truncatula. Planta 238, 91–105.
Fahlgren, N., Howell, M. D., Kasschau, K. D., Chapman, E. J., Sullivan, C. M., Cumbie, J. S., et al. (2007). High-throughput sequencing of Arabidopsis microRNAs: evidence for frequent birth and death of MIRNA genes. PLoS One 2:e219. doi: 10.1371/journal.pone.0000219
Ferdous, J., Hussain, S. S., and Shi, B. J. (2015). Role of microRNAs in plant drought tolerance. Plant Biotechnol. J. 13, 293–305. doi: 10.1111/pbi.12318
Filipowicz, W., Bhattacharyya, S. N., and Sonenberg, N. (2008). Mechanisms of post-transcriptional regulation by microRNAs: are the answers in sight? Nat. Rev. Genet. 9, 102–114. doi: 10.1038/nrg2290
Finnegan, E. J., and Matzke, M. A. (2003). The small RNA world. J. Cell Sci. 116, 4689–4693. doi: 10.1242/jcs.00838
Gao, R., Austin, R. S., Amyot, L., and Hannoufa, A. (2016). Comparative transcriptome investigation of global gene expression changes caused by miR156 overexpression in Medicago sativa. BMC Genomics 17:658. doi: 10.1186/s12864-016-3014-6
Garg, V., Khan, A. W., Kudapa, H., Kale, S. M., Chitikineni, A., Qiwei, S., et al. (2019). Integrated transcriptome, small RNA and degradome sequencing approaches provide insights into ascochyta blight resistance in chickpea. Plant Biotechnol. J. 17, 914–931. doi: 10.1111/pbi.13026
Gene Ontology Consortium (2015). Gene ontology consortium: going forward. Nucleic Acids Res. 43, D1049–D1056. doi: 10.1093/nar/gku1179
Gene Ontology Consortium, Ashburner, M., Ball, C. A., Blake, J. A., Botstein, D., Butler, H., et al. (2000). Gene ontology: tool for the unification of biology. Nat. Genet. 25, 25–29. doi: 10.1038/75556
Gene Ontology Consortium, Blake, J. A., Dolan, M., Drabkin, H., Hill, D. P., Li, N., et al. (2013). Gene ontology annotations and resources. Nucleic Acids Res. 41, D530–D535. doi: 10.1093/nar/gks1050
German, M. A., Pillay, M., Jeong, D. H., Hetawal, A., Luo, S., Janardhanan, P., et al. (2008). Global identification of microRNA-target RNA pairs by parallel analysis of RNA ends. Nat. Biotechnol. 26, 941–946. doi: 10.1038/nbt1417
Grabherr, M. G., Haas, B. J., Yassour, M., Levin, J. Z., Thompson, D. A., Amit, I., et al. (2011). Full-length transcriptome assembly from RNA-Seq data without a reference genome. Nat. Biotechnol. 29, 644–652. doi: 10.1038/nbt.1883
Hossain, M. S., Hoang, N. T., Yan, Z., Tóth, K., Meyers, B. C., and Stacey, G. (2019). Characterization of the spatial and temporal expression of two soybean miRNAs identifies SCL6 as a novel regulator of soybean nodulation. Front. Plant Sci. 10:475. doi: 10.3389/fpls.2019.00475
Iwakawa, H. O., and Tomari, Y. (2015). The functions of microRNAs: mRNA decay and translational repression. Trends Cell Biol. 25, 651–665. doi: 10.1016/j.tcb.2015.07.011
Ji, Y., Chen, P., Chen, J., Pennerman, K. K., Liang, X., Yan, H., et al. (2018). Combinations of small RNA, RNA, and degradome sequencing uncovers the expression pattern of microRNA-mRNA Pairs adapting to drought stress in leaf and root of Dactylis glomerata L. Int. J. Mol. Sci. 19, 3114. doi: 10.3390/ijms19103114
Jones-Rhoades, M. W., Bartel, D. P., and Bartel, B. (2006). MicroRNAs and their regulatory roles in plants. Annu. Rev. Plant Biol. 57, 19–53. doi: 10.1146/annurev.arplant.57.032905.105218
Jovanović, Ž, Stanisavljević, N., Mikić, A., Radović, S., and Maksimović, V. (2014). Water deficit down-regulates miR398 and miR408 in pea (Pisum sativum L.). Plant Physiol. Biochem. 83, 26–31. doi: 10.1016/j.plaphy.2014.07.008
Kamthan, A., Chaudhuri, A., Kamthan, M., and Datta, A. (2015). Small RNAs in plants: recent development and application for crop improvement. Front. Plant Sci. 6:208. doi: 10.3389/fpls.2015.00208
Kanehisa, M., Furumichi, M., Tanabe, M., Sato, Y., and Morishima, K. (2017). KEGG: new perspectives on genomes, pathways, diseases and drugs. Nucleic Acids Res. 45, D353–D361. doi: 10.1093/nar/gkw1092
Katiyar, A., Smita, S., Muthusamy, S. K., Chinnusamy, V., Pandey, D. M., and Bansal, K. C. (2015). Identification of novel drought-responsive microRNAs and trans-acting siRNAs from Sorghum bicolor (L.) moench by high-throughput sequencing analysis. Front. Plant Sci. 6:506. doi: 10.3389/fpls.2015.00506
Lee, M. H., Kim, B., Song, S. K., Heo, J. O., Yu, N. I., Lee, S. A., et al. (2008). Large-scale analysis of the GRAS gene family in Arabidopsis thaliana. Plant Mol. Biol. 67, 659–670. doi: 10.1007/s11103-008-9345-1
Li, W. X., Oono, Y., Zhu, J., He, X. J., Wu, J. M., Iida, K., et al. (2008). The Arabidopsis NFYA5 transcription factor is regulated transcriptionally and post transcriptionally to promote drought resistance. Plant Cell 20, 2238–2251. doi: 10.1105/tpc.108.059444
Li, Y., Wan, L., Bi, S., Wan, X., Li, Z., Cao, J., et al. (2017). Identification of drought-responsive MicroRNAs from roots and leaves of alfalfa by high-throughput sequencing. Genes 8:119. doi: 10.3390/genes8040119
Liu, H. H., Tian, X., Li, Y. J., Wu, C. A., and Zheng, C. C. (2008). Microarray-based analysis of stress-regulated microRNAs in Arabidopsis thaliana. RNA 14, 836–843. doi: 10.1261/rna.895308
Liu, H., Qin, C., Chen, Z., Zuo, T., Yang, X., Zhou, H., et al. (2014). Identification of miRNAs and their target genes in developing maize ears by combined small RNA and degradome sequencing. BMC Genomics 15:25. doi: 10.1186/1471-2164-15-25
Liu, M., Yu, H., Zhao, G., Huang, Q., Lu, Y., and Ouyang, B. (2018). Identification of drought-responsive microRNAs in tomato using high-throughput sequencing. Funct. Integr. Genomics 18, 67–78. doi: 10.1007/s10142-017-0575-7
Liu, T., Fang, C., Ma, Y., Shen, Y., Li, C., Li, Q., et al. (2016). Global investigation of the co-evolution of MIRNA genes and microRNA targets during soybean domestication. Plant J. 85, 396–409. doi: 10.1111/tpj.13113
Livak, K. J., and Schmittgen, T. D. (2001). Analysis of relative gene expression data using real-time quantitative PCR and the 2(-Delta Delta C(T)) Method. Methods 25, 402–408. doi: 10.1006/meth.2001.1262
Llave, C., Xie, Z., Kasschau, K. D., and Carrington, J. C. (2002). Cleavage of scarecrow-like mRNA targets directed by a class of Arabidopsis miRNA. Science 297, 2053–2056. doi: 10.1126/science.1076311
López-Galiano, M. J., García-Robles, I., González-Hernández, A. I., Camañes, G., Vicedo, B., Real, M. D., et al. (2019). Expression of miR159 is altered in tomato plants undergoing drought stress. Plants (Basel) 8:201. doi: 10.3390/plants8070201
Lu, X., Yin, Z., Wang, J., Chen, X., Wang, D., Wang, S., et al. (2019). Identification and function analysis of drought-specific small RNAs in Gossypium hirsutum L. Plant Sci. 280, 187–196. doi: 10.1016/j.plantsci.2018.11.015
Ma, Z., Coruh, C., and Axtell, M. J. (2010). Arabidopsis lyrata small RNAs: transient MIRNA and small interfering RNA loci within the Arabidopsis genus. Plant cell 22, 1090–1103. doi: 10.1105/tpc.110.073882
Martin, M. (2011). Cutadapt removes adapter sequences from high-throughput sequencing reads. EMBnet J. 17, 10–12. doi: 10.14806/ej.17.1.200
Mortazavi, A., Williams, B. A., McCue, K., Schaeffer, L., and Wold, B. (2008). Mapping and quantifying mammalian transcriptomes by RNA-Seq. Nat. Methods 5, 621–628. doi: 10.1038/nmeth.1226
Nadarajah, K., and Kumar, I. S. (2019). Drought response in rice: the miRNA story. Int. J. Mol. Sci. 20:3766. doi: 10.3390/ijms20153766
Ogata, H., Goto, S., Sato, K., Fujibuchi, W., Bono, H., and Kanehisa, M. (1999). KEGG: kyoto encyclopedia of genes and genomes. Nucleic Acids Res. 27, 29–34. doi: 10.1093/nar/27.1.29
Patel, P., Yadav, K., Ganapathi, T. R., and Penna, S. (2019). “Plant miRNAome: cross talk in abiotic stressful times,” in Genetic Enhancement of Crops for Tolerance to Abiotic Stress: Mechanisms and Approaches, Vol. I, eds V. Rajpal, D. Sehgal, A. Kumar, and S. Raina (Cham: Springer), 25–52. doi: 10.1007/978-3-319-91956-0_2
Patro, R., Duggal, G., Love, M. I., Irizarry, R. A., and Kingsford, C. (2017). Salmon provides fast and bias-aware quantification of transcript expression. Nat. Methods 14, 417–419. doi: 10.1038/nmeth.4197
Rajagopalan, R., Vaucheret, H., Trejo, J., and Bartel, D. P. (2006). A diverse and evolutionarily fluid set of microRNAs in Arabidopsis thaliana. Genes Dev. 20, 3407–3425. doi: 10.1101/gad.1476406
Robinson, M. D., McCarthy, D. J., and Smyth, G. K. (2010). edgeR: a bioconductor package for differential expression analysis of digital gene expression data. Bioinformatics 26, 139–140. doi: 10.1093/bioinformatics/btp616
Samad, A., Sajad, M., Nazaruddin, N., Fauzi, I. A., Murad, A., Zainal, Z., et al. (2017). MicroRNA and transcription factor: key players in plant regulatory network. Front. Plant Sci. 8:565. doi: 10.3389/fpls.2017.00565
Schwalm, C. R., Anderegg, W. R. L., Michalak, A. M., Fisher, J. B., Biondi, F., Koch, G., et al. (2017). Global patterns of drought recovery. Nature 548, 202–205. doi: 10.1038/nature23021
Shu, Y., Liu, Y., Li, W., Song, L., Zhang, J., and Guo, C. (2016). Genome-wide investigation of microRNAs and their targets in response to freezing stress in Medicago sativa L., based on high-throughput sequencing. G3 (Bethesda) 6, 755–765. doi: 10.1534/g3.115.025981
Sun, W., Xu, X. H., Wu, X., Wang, Y., Lu, X., Sun, H., et al. (2015). Genome-wide identification of microRNAs and their targets in wild type and phyB mutant provides a key link between microRNAs and the phyB-mediated light signaling pathway in rice. Front. Plant Sci. 6:372. doi: 10.3389/fpls.2015.00372
Szittya, G., Moxon, S., Santos, D. M., Jing, R., Fevereiro, M. P., Moulton, V., et al. (2008). High-throughput sequencing of Medicago truncatula short RNAs identifies eight new miRNA families. BMC Genomics 9:593. doi: 10.1186/1471-2164-9-593
Tang, G., Reinhart, B. J., Bartel, D. P., and Zamore, P. D. (2003). A biochemical framework for RNA silencing in plants. Genes Dev. 17, 49–63. doi: 10.1101/gad.1048103
Touma, D., Ashfaq, M., Nayak, M. A., Kao, S. C., and Diffenbaugh, N. S. (2015). A multi-model and multi-index evaluation of drought characteristics in the 21st century. J. Hydrol. 526, 196–207. doi: 10.1016/j.jhydrol.2014.12.011
Trindade, I., Capitão, C., Dalmay, T., Fevereiro, M. P., and Santos, D. M. (2010). miR398 and miR408 are up-regulated in response to water deficit in Medicago truncatula. Planta 231, 705–716. doi: 10.1007/s00425-009-1078-0
Voinnet, O. (2009). Origin, biogenesis, and activity of plant microRNAs. Cell 136, 669–687. doi: 10.1016/j.cell.2009.01.046
Wang, L., Mai, Y. X., Zhang, Y. C., Luo, Q., and Yang, H. Q. (2010). MicroRNA171c-targeted SCL6-II, SCL6-III, and SCL6-IV genes regulate shoot branching in Arabidopsis. Mol. Plant. 3, 794–806. doi: 10.1093/mp/ssq042
Wang, T., Chen, L., Zhao, M., Tian, Q., and Zhang, W. H. (2011). Identification of drought-responsive microRNAs in Medicago truncatula by genome-wide high-throughput sequencing. BMC Genomics 12:367.
Zhang, B., Wang, Q., Wang, K., Pan, X., Liu, F., Guo, T., et al. (2007). Identification of cotton microRNAs and their targets. Gene 397, 26–37.
Zhang, C., Shi, S., Liu, Z., Yang, F., and Yin, G. (2019). Drought tolerance in alfalfa (Medicago sativa L.) varieties is associated with enhanced antioxidative protection and declined lipid peroxidation. J. Plant Physiol. 232, 226–240. doi: 10.1016/j.jplph.2018.10.023
Zhang, Y., Li, Z., Li, Y. P., Zhang, X. Q., Ma, X., Huang, L. K., et al. (2018). Chitosan and spermine enhance drought resistance in white clover, associated with changes in endogenous phytohormones and polyamines, and antioxidant metabolism. Funct. Plant Biol. 45, 1205–1222. doi: 10.1071/FP18012
Zhou, L., Liu, Y., Liu, Z., Kong, D., Duan, M., and Luo, L. (2010). Genome-wide identification and analysis of drought-responsive microRNAs in Oryza sativa. J. Exp. Bot. 61, 4157–4168. doi: 10.1093/jxb/erq237
Keywords: Medicago ruthenica, drought, differential expression, miRNA, degradome
Citation: Shi R, Jiao W, Yun L, Zhang Z, Zhang X, Wang Q, Li Y and Mi F (2021) Utilization of Transcriptome, Small RNA, and Degradome Sequencing to Provide Insights Into Drought Stress and Rewatering Treatment in Medicago ruthenica. Front. Plant Sci. 12:675903. doi: 10.3389/fpls.2021.675903
Received: 04 March 2021; Accepted: 14 July 2021;
Published: 03 August 2021.
Edited by:
Baohong Zhang, East Carolina University, United StatesReviewed by:
Raj Kumar Joshi, Rama Devi Women’s University, IndiaQingchuan Yang, Institute of Animal Sciences, Chinese Academy of Agricultural Sciences, China
Copyright © 2021 Shi, Jiao, Yun, Zhang, Zhang, Wang, Li and Mi. This is an open-access article distributed under the terms of the Creative Commons Attribution License (CC BY). The use, distribution or reproduction in other forums is permitted, provided the original author(s) and the copyright owner(s) are credited and that the original publication in this journal is cited, in accordance with accepted academic practice. No use, distribution or reproduction is permitted which does not comply with these terms.
*Correspondence: Fugui Mi, bWZndWlubUAxNjMuY29t