 Jessica Delfini1,2
 Vânia Moda-Cirino1
 José dos Santos Neto1,2
 Douglas Mariani Zeffa1,3Alison Fernando Nogueira1,2Luriam Aparecida Brandão Ribeiro1,2Paulo Maurício Ruas4
 Paul Gepts5
 Leandro Simões Azeredo Gonçalves2,3*
- 1Área de Genética e Melhoramento Vegetal, Instituto de Desenvolvimento Rural do Paraná, Londrina, Brazil
- 2Departamento de Agronomia, Universidade Estadual de Londrina, Londrina, Brazil
- 3Departamento de Agronomia, Universidade Estadual de Maringá, Maringá, Brazil
- 4Departamento de Biologia, Universidade Estadual de Londrina, Londrina, Brazil
- 5Section of Crop and Ecosystem Sciences, Department of Plant Sciences, University of California, Davis, Davis, CA, United States
The population growth trend in recent decades has resulted in continuing efforts to guarantee food security in which leguminous plants, such as the common bean (Phaseolus vulgaris L.), play a particularly important role as they are relatively cheap and have high nutritional value. To meet this demand for food, the main target for genetic improvement programs is to increase productivity, which is a complex quantitative trait influenced by many component traits. This research aims to identify Quantitative Trait Nucleotides (QTNs) associated with productivity and its components using multi-locus genome-wide association studies. Ten morpho-agronomic traits [plant height (PH), first pod insertion height (FPIH), number of nodules (NN), pod length (PL), total number of pods per plant (NPP), number of locules per pod (LP), number of seeds per pod (SP), total seed weight per plant (TSW), 100-seed weight (W100), and grain yield (YLD)] were evaluated in four environments for 178 Mesoamerican common bean domesticated accessions belonging to the Brazilian Diversity Panel. In order to identify stable QTNs, only those identified by multiple methods (mrMLM, FASTmrMLM, pLARmEB, and ISIS EM-BLASSO) or in multiple environments were selected. Among the identified QTNs, 64 were detected at least thrice by different methods or in different environments, and 39 showed significant phenotypic differences between their corresponding alleles. The alleles that positively increased the corresponding traits, except PH (for which lower values are desired), were considered favorable alleles. The most influenced trait by the accumulation of favorable alleles was PH, showing a 51.7% reduction, while NN, TSW, YLD, FPIH, and NPP increased between 18 and 34%. Identifying QTNs in several environments (four environments and overall adjusted mean) and by multiple methods reinforces the reliability of the associations obtained and the importance of conducting these studies in multiple environments. Using these QTNs through molecular techniques for genetic improvement, such as marker-assisted selection or genomic selection, can be a strategy to increase common bean production.
Introduction
More than 24 million tons of common beans (Phaseolus vulgaris L.) are produced per year worldwide, and the main producing countries are located in Asia and the Americas (Rawal and Navarro, 2019). This crop is mainly grown by small producers, often in low fertility areas with low-level technology, resulting in low mean productivity (Broughton et al., 2003).
Increasing productivity is one of the main objectives of breeding programs. In this context, understanding the genetic constitution related to the productivity and of the production components are the basis for improvement (Kamfwa et al., 2015). In the cultivation of common beans, productivity is related to several morphological, agronomic, and physiological characteristics. The number of pods per plant (NPP), number of seeds per pod (SP), and seed weight are the primary components related to productivity, but other characteristics are also influential, such as growth rate, the capacity of the seeds to absorb photosynthates and plant architecture (Beebe et al., 2013; Resende et al., 2018; Assefa et al., 2019). Physiological and morphological characteristics such as days to flowering and maturity and resistance to pod shattering also significantly impact adaptability, biomass, and productivity (Zhang et al., 2015; Parker et al., 2020a).
Productivity and its components are quantitative traits and are highly influenced by the environment. Thus, understanding the relationship between these traits is very important for directing strategies and efforts in genetic improvement programs (Singh et al., 1991; Assefa et al., 2019). Traditional selection methods in plant breeding require intensive phenotyping fieldwork, with evaluations in several environments and years, resulting in high cost and a time-consuming process (Ikram et al., 2020). The use of molecular markers can increase efficiency and reduce the costs of phenotyping in plant breeding programs. Using molecular tools makes it possible to identify genomic regions related to the productivity and its components, which can be used in marker-assisted selection (Kamfwa et al., 2015). Genome-Wide Association Studies (GWAS) represent a powerful option for the genetic characterization of quantitative traits and have been widely used to analyze agronomic characteristics in plants (Wang et al., 2012; Contreras-Soto et al., 2017; Zhang K. et al., 2017; Cui et al., 2018; Ward et al., 2019; Ikram et al., 2020).
GWAS is a powerful tool enabling the study of different regions of the genome simultaneously using high-resolution mapping. Multiple polymorphisms occurring naturally within a species are identified in germplasm collections with limited genetic structure; genotypes that have traits of interest for breeding programs can be used preferentially to accelerate the application of GWAS studies (Korte and Ashley, 2013). Important genetic factors are identified based on the presence of linkage disequilibrium (LD), while taking into account the potential confounding effect of the population’s structure (Kwak and Gepts, 2009) and kinship relations. Large and highly diverse association panels have unique recombination histories, allowing the detection of small and large genetic effects associated with a particular trait (Oladzad et al., 2019).
Although the statistical power in the detection of Quantitative Trait Nucleotides (QTNs) improves after controlling for the polygenic background of the experimental population under study, most of the small effects associated with complex traits are still not captured by the GWAS single-locus methods (Cui et al., 2018). Single-locus methods perform a one-dimensional scan of the genome; that is, they test one marker at a time, using several rigorous significance test corrections for multiple tests, such as the Bonferroni and False Discovery Rate (FDR) tests. However, these methods can be very conservative in eliminating true QTNs (He et al., 2019b). Multi-locus models are being developed to solve this problem. These models involve a multi-dimensional scanning of the genome, in which the effects of all markers are simultaneously estimated (Cui et al., 2018). The advantage of these models is that it is unnecessary to perform multiple test corrections; therefore, more markers associated with traits of interest are identified (Li et al., 2018).
Several studies seeking to identify allelic variations responsible for traits directly or indirectly related to productivity have already been conducted for common beans (Nemli et al., 2014; Kamfwa et al., 2015; Moghaddam et al., 2016; Soltani et al., 2016; Nascimento et al., 2018; Resende et al., 2018; Lei et al., 2020; Wu et al., 2020). Knowing that abiotic factors, like drought and high temperatures, directly influence production, studies on plant behavior under stress conditions were also conducted (Hoyos-Villegas et al., 2017; Berny Mier y Teran et al., 2018, 2020; Berny Mier Y Teran et al., 2019; Oladzad et al., 2019; Keller et al., 2020; Parker et al., 2020a,b).
Common beans of Mesoamerican origin are the most consumed in Brazil, with a preference for the Carioca and Black commercial classes (Gepts et al., 1988; Burle et al., 2010, 2011; Delfini et al., 2017). Few GWAS have been directed toward diversity panels of plants of Mesoamerican origin and plants adapted to the Brazilian climatic conditions. Studies of genetic variation in accessions adapted to the target habitats are a powerful and effective approach to investigate the genetic architecture of complex traits, and later these natural allelic variations can be directly employed in breeding programs (Nakano and Kobayashi, 2020). Moreover, multi-locus methods were little explored in the cultivation of common beans. In this context, the present study’s objective was to identify genomic regions related to morpho-agronomic traits in Mesoamerican common beans belonging to the Brazilian Diversity Panel (BDP) using the GWAS multi-locus methods.
Materials and Methods
Genetic Material, Field Experiments, and Phenotyping
In all, 178 Mesoamerican common bean accessions belonging to the BDP were evaluated (Delfini et al., 2021a). This panel consists of accessions that represent a large part of the variability present in Brazil and are adapted to tropical growing conditions. The phenotyping was conducted at the research stations of the Instituto de Desenvolvimento Rural do Paraná (IDR–Paraná), located in the state of Paraná, Brazil. The experiments were conducted in two seasons: the 2018 rainy season in the cities of Londrina (LDA_A18), Ponta Grossa (PG_A18), and Guarapuava (GUA_18); and the 2018/2019 dry season in Ponta Grossa (PG_S19), totaling four environments. The experiment used an incomplete block design with replications in sets. Five sets with two repetitions were used, and each set covered 50 entries, i.e., 46 accessions and four checks. Each plot consisted of four 2 m long rows, spaced 0.50 m between rows and with a density of 12 plants per linear meter. Management and treatments were conducted according to the technical recommendations for the plant’s cultivation.
Seven plants from the two lateral lines of the plot were used to evaluate traits such as plant height (PH, in cm), first pod insertion height (FPIH, in cm), number of nodules (NN, count variable), pod length (PL, in cm), total number of pods per plant (NPP, count variable), number of locules per pod (LP, count variable), number of seeds per pod (SP, count variable), total seed weight per plant (TSW, in g), and 100-seed weight (W100, in g). Grain yield (YLD, in kg ha–1 and 13% moisture) was estimated by harvesting the two central lines.
Statistical Analysis of Phenotypic Data
An analysis of variance (ANOVA) was conducted using the PROC GLM function in the SAS software (SAS Institute, 2000). The following mathematical model was used:
where is the general mean, Ai is the fixed effect of the i-th environment; Sj is the effect of the j-th set; ASij is the effect of the interaction between environments and sets; R/ASkij is the effect of the k-th repetition within the interaction between the i-th environment and the j-th set; G/Slj is the random effect of the l-th genotype within the j-th set; AG/Smlj is the effect of the interaction of environments and accessions within the j-th set, and eijklm is the experimental error (Hallauer and Miranda Filho, 1988).
The means adjusted for each accession in each of the environments as well as the overall mean of all environments were obtained through the LSmeans option of the GLM procedure. The heritability (h2) was estimated by the equation: , where genotypic (σ2G) and phenotypic (σ2P) variances were estimated by the following equations: and where QMG is the mean square of genotype within sets; QME is the mean square of error, r is the number of replications, and a is the number of environments. The descriptive analysis was determined by the means adjusted for the two replications of each traits in each environment using the PROC UNIVARIATE function in the SAS software. Pearson’s simple linear correlations were calculated and graphically presented using the R software1 using the “corrplot” package (Wei and Simko, 2017).
Genotyping and Genome Wide Association Study
The genotyping-by-sequencing (GBS) technique was used to obtain the SNPs. The methodology used, as well as the results of the population structure and linkage disequilibrium (LD) analyses, are detailed in a previous work (Delfini et al., 2021a). In summary, GBS was conducted using the restriction enzyme CviAII (Ariani et al., 2016, 2017) and the data were imputed using Beagle software version 5 (Browning and Browning, 2016). After quality control using VCFtools version 0.1.15 (Danecek et al., 2011), 25,011 SNPs (MAF > 0.05) were used to perform GWAS analyses.
For conducting GWAS, mixed multi-locus models were used with the mrMLM.GUI software version 4.0 0 (Ya-Wen et al., 2019). Four different methods were used: mrMLM (Wang et al., 2016), FASTmrMLM (Tamba and Zhang, 2018), pLARmEB (Zhang J. et al., 2017), and ISIS EM-BLASSO (Tamba et al., 2017). The critical values for significant associations were LOD ≥ 3 for all methods. Population structure and the kinship matrix were included in these models to minimize the identification of false positive associations and increase the statistical power of the analyses. The result of K = 2 was obtained by the Structure v2.3.4 software (Pritchard et al., 2000) [100,000 burn-in, 100,000 MCMC, and ten repetitions for hypothetical numbers of subpopulations (K) between 1 and 10], while the kinship matrix was obtained using the mrMLM.GUI software version 4.0.
The phenotypic values used were the adjusted means for each of the four environments and the overall adjusted mean (LDA_18, PG_18, GUA_18, PG_19, and LSmeans). In order to obtain more accurate results, only QTNs that presented repeatability, that is, detected at least three times by different methods or environments, were considered truly significant and used in the search for favorable alleles and candidate genes.
Favorable Alleles and Search for Candidate Genes
For each QTN, all accessions were divided into two groups based on the QTN genotype, that is, according to presence or absence of the favorable alleles. A t-test was then conducted to test if there was a significant difference in phenotypic mean between the two groups. Only the statistically stable QTNs between the environments, i.e., those that showed significant difference (P ≤ 0.05) in the phenotypes in at least three of the five environments (LDA_18, PG_18, GUA_18, PG_19, and LSmeans), were used as favorable alleles. The favorable genotype of each QTN was then selected, i.e., the genotype that causes the desired effect according to each trait, and these effects can be positive or negative in the case of PH. Then, the total number of favorable alleles for each trait was accounted for each accession, and, using a boxplot, visualized if the accumulation of these favorable alleles resulted in phenotypes with more desirable traits.
The identification of candidate genes was conducted at a physical distance of 296 kbp above and below the SNP associated with each of the assessed trait. This distance is the point at which the half decay of the LD, calculated with correction by population structure and relatedness (r2vs), occurred (Delfini et al., 2021b). The genes present in the association region with known putative functions according to the GeneOntology (GO)2 were identified based on the reference genome annotation of Phaseolus vulgaris v.2 published on the Phytozome v10.3 website.3
Results
Analysis of Variance, Heritability, and Environmental Effect
The analysis of variance showed a significant effect (P ≤ 0.01) of accessions and environments for all traits evaluated (Table 1). Significant effects were also observed (P ≤ 0.01) for the Genotype x Environment (GE) interactions involving the traits PH, LP, SP, W100, and YLD. The coefficients of variation (CV) varied between 5% (PL) and 26% (TSW). As for heritability estimates (h2), the TSW, NN, NPP, and FPIH traits presented moderate values, between 0.54 and 0.68, while high values were detected for the other traits, YLD, SP, and LP had h2-values between 0.71 and 0.77, and PH, PL, and W100 had the highest values, 0.88, 0.94, and 0.94, respectively.
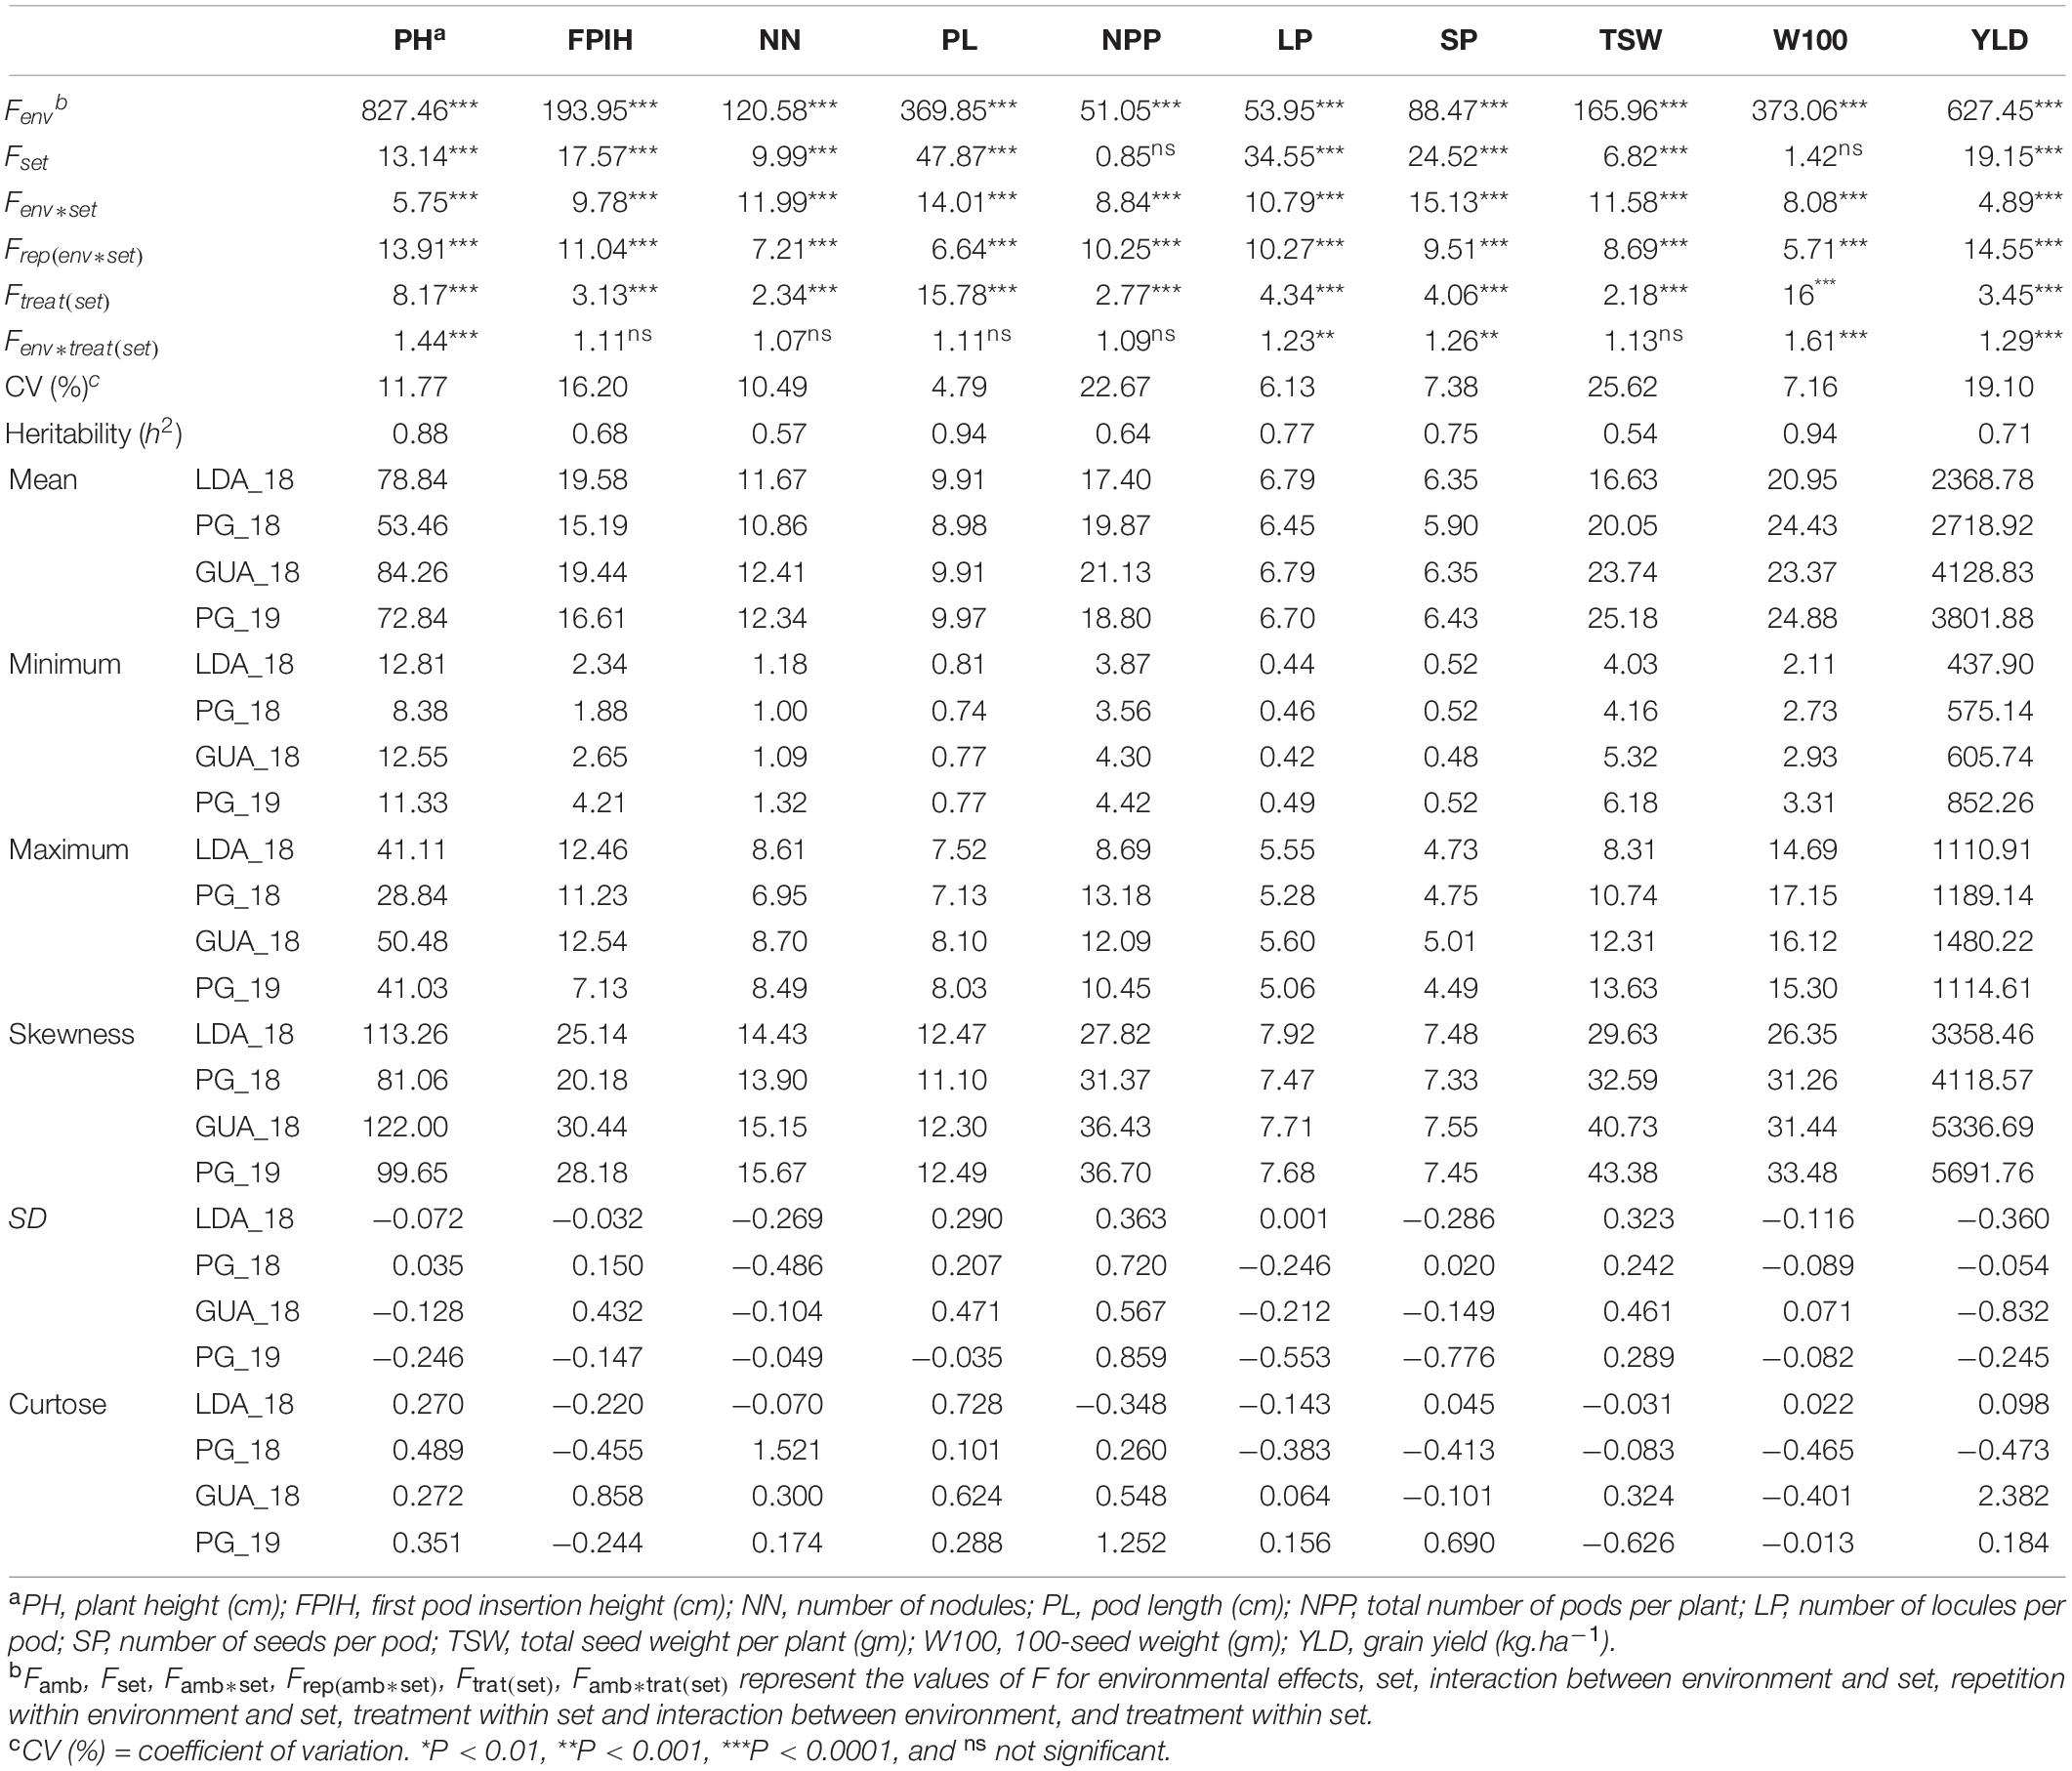
Table 1. Analysis of variance and descriptive statistics for morpho-agronomic traits evaluated in common bean accessions belonging to the Brazilian Diversity Panel (BDP) evaluated in four environments.
Comparing the mean performance of the accessions in each of the environments (Figure 1), the GUA_18 environment showed the highest general averages for NPP (21.13) and YLD (4,128.8 kg.ha–1), while PG_18 showed the lowest values for traits related to plant morphology: PH (53.46 cm), FPIH (15.19 cm), NN (10.86), and PL (8.98 cm). The LDA_18 environment showed the lowest values for the production components TSW (16.63 cm), W100 (20.95 g), and YLD (2368.78 kg ha–1). The traits PL (7.13–12.49 cm), LP (5.06–7.92), SP (4.49–7.55), and W100 (14.69–33.48) did not show significant variations in the minimum, maximum, and mean values for each environment.
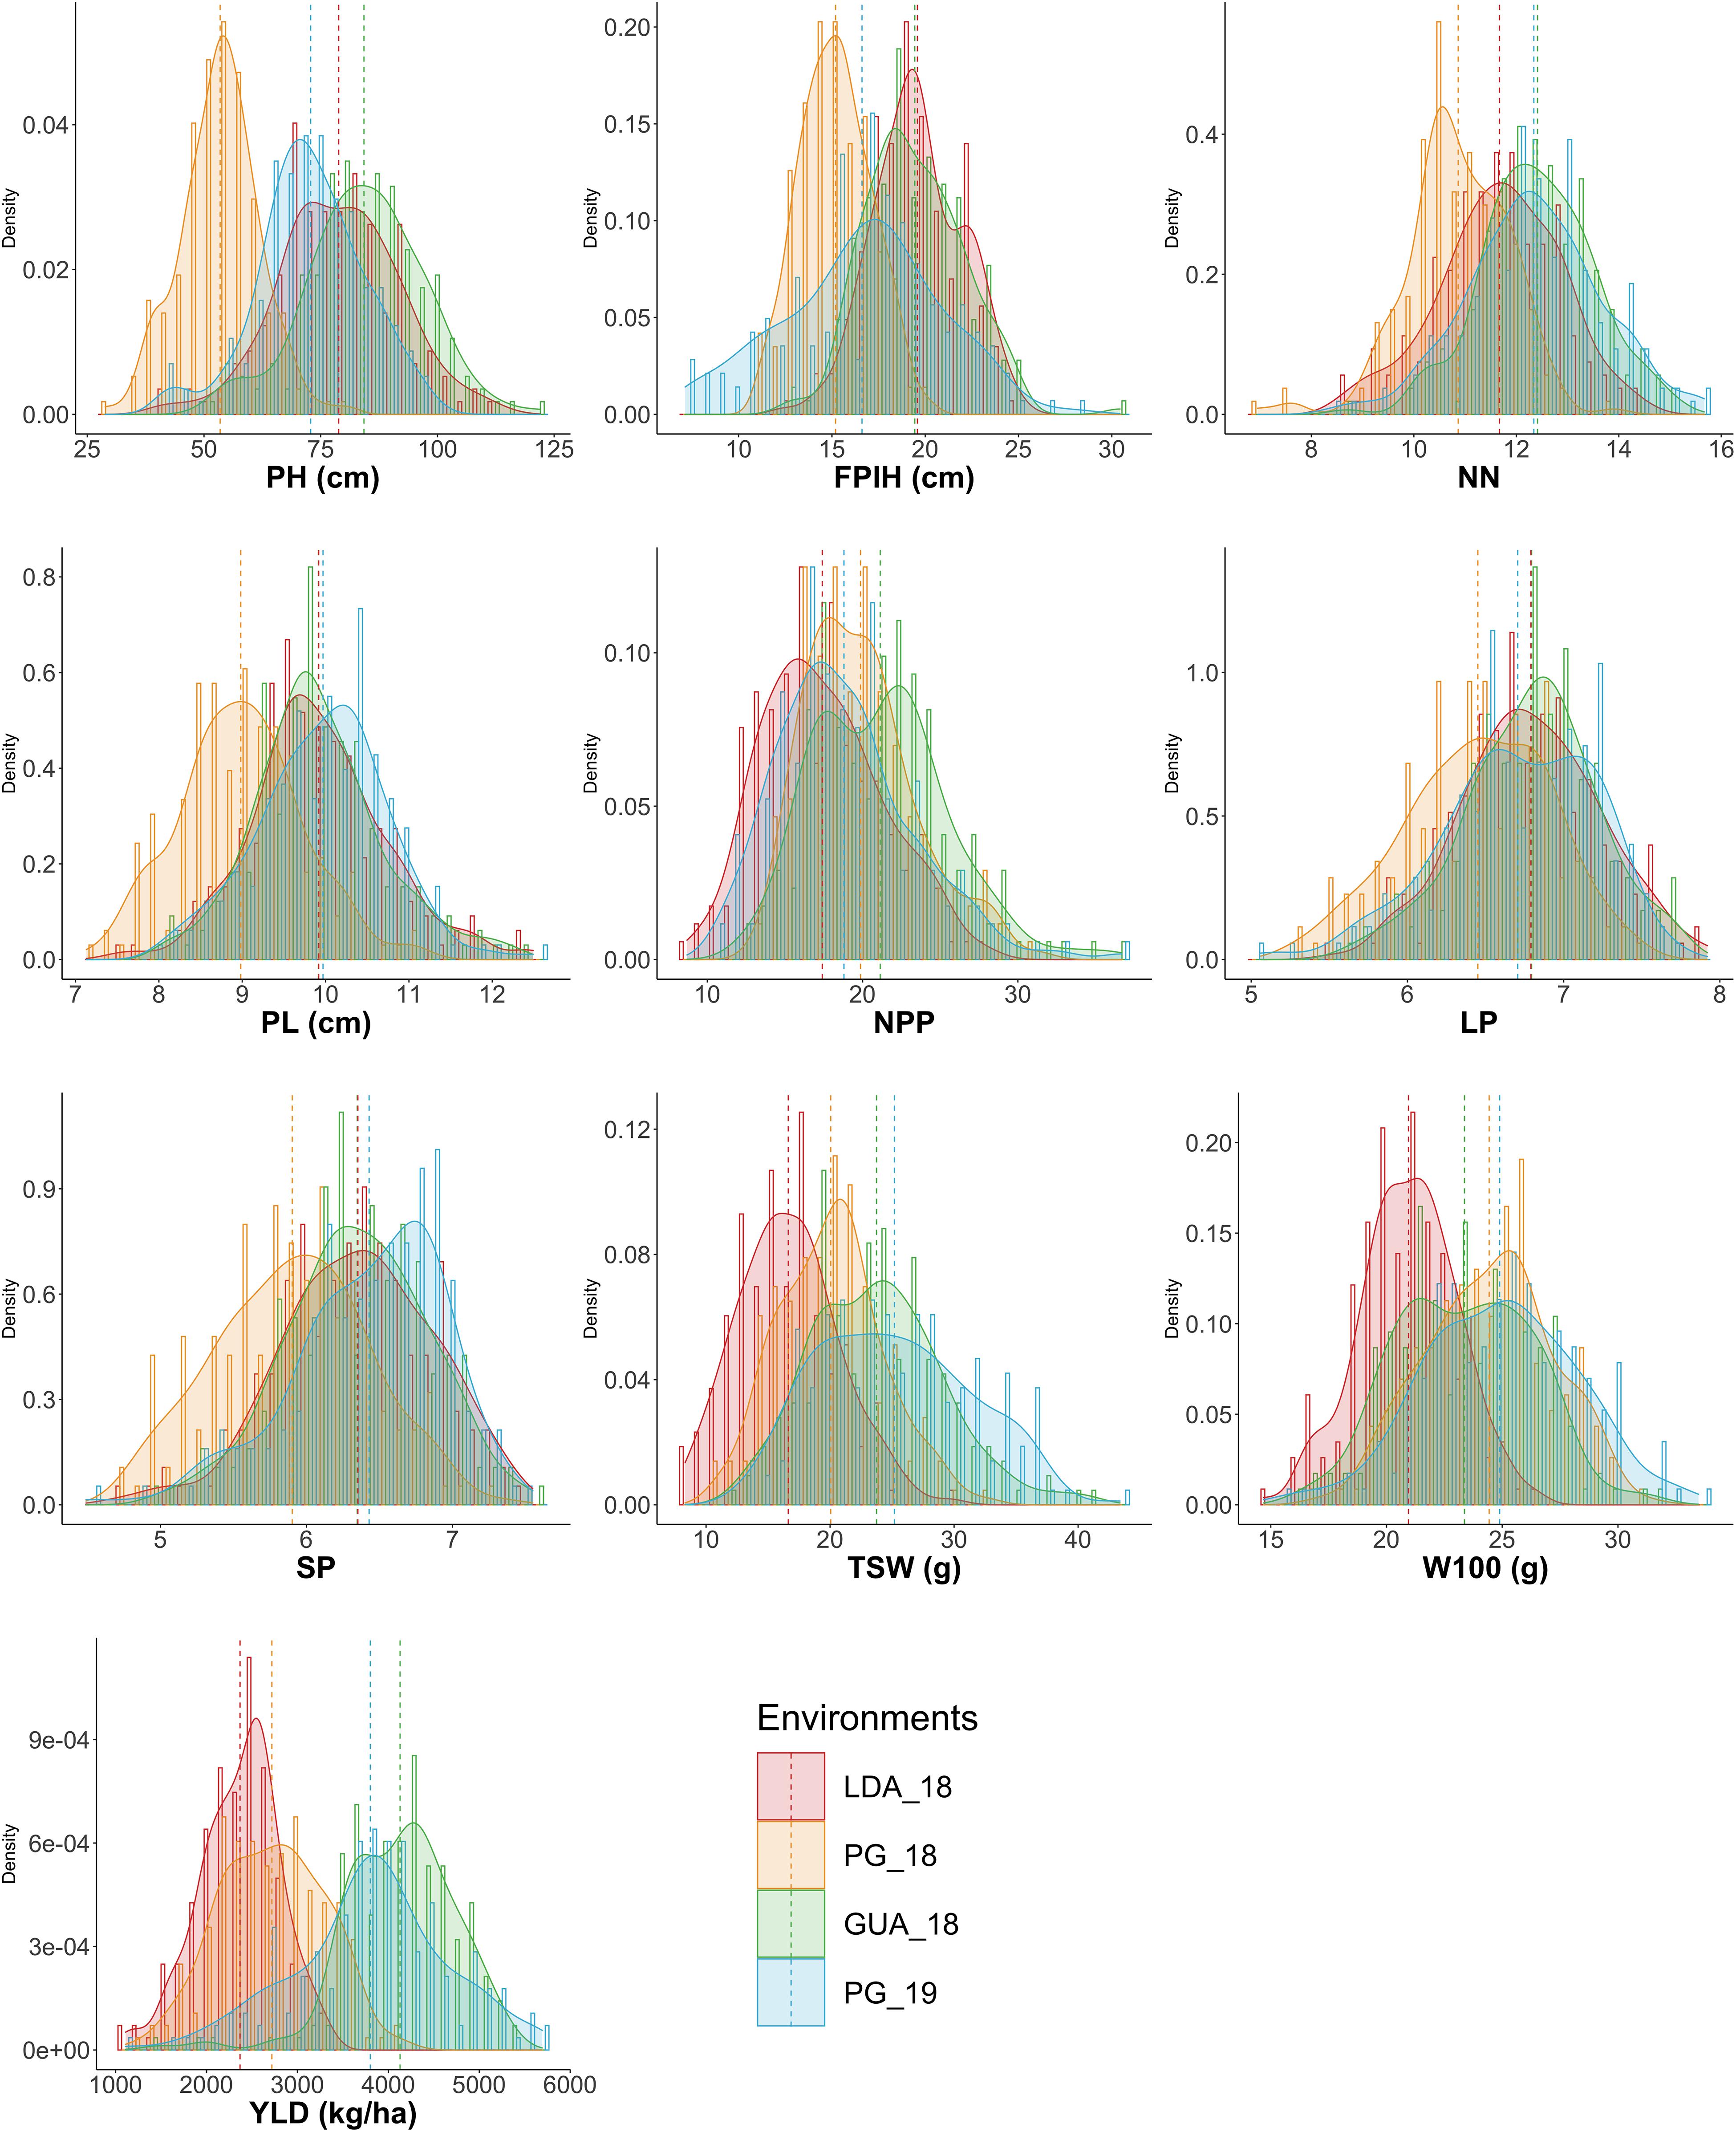
Figure 1. Histogram and density plot of the ten morpho-agronomic traits evaluated in different locations and seasons in common bean accessions belonging to the Brazilian Diversity Panel (BDP). PH, plant height (cm); FPIH, first pod insertion height (cm); NN, number of nodules; PL, pod length (cm); NPP, total number of pods per plant; LP, number of locules per pod; SP, number of seeds per pod; TSW, total seed weight per plant (g); W100, 100-seed weight (g); YLD, grain yield (kg.ha– 1). Environments, 2018 rainy season crops: LDA_A18 = Londrina, PG_A18 = Ponta Grossa and GUA_18 = Guarapuava; 2018/2019 dry season crop: PG_S19 = Ponta Grossa.
Correlation Between Traits
Significant and positive correlations (P ≤ 0.05) were observed between PH, FPIH, and NN traits. The PL, LP, and SP traits also correlated positively with each other (Figure 2). Positive correlations were also observed between YLD and the primary components TSW and W100 (r = 0.31 and 0.32, respectively). In addition, YLD also correlated positively with LP (r = 0.24) and SP (r = 0.27), while NPP correlated positively with TSW (r = 0.65). On the other hand, negative correlations were observed between PPN × FPIH (r = -0.33), PPN × PL (r = −0.30), PPN × W100 (r = −0.31), and SP × W100 (r = −0.15).
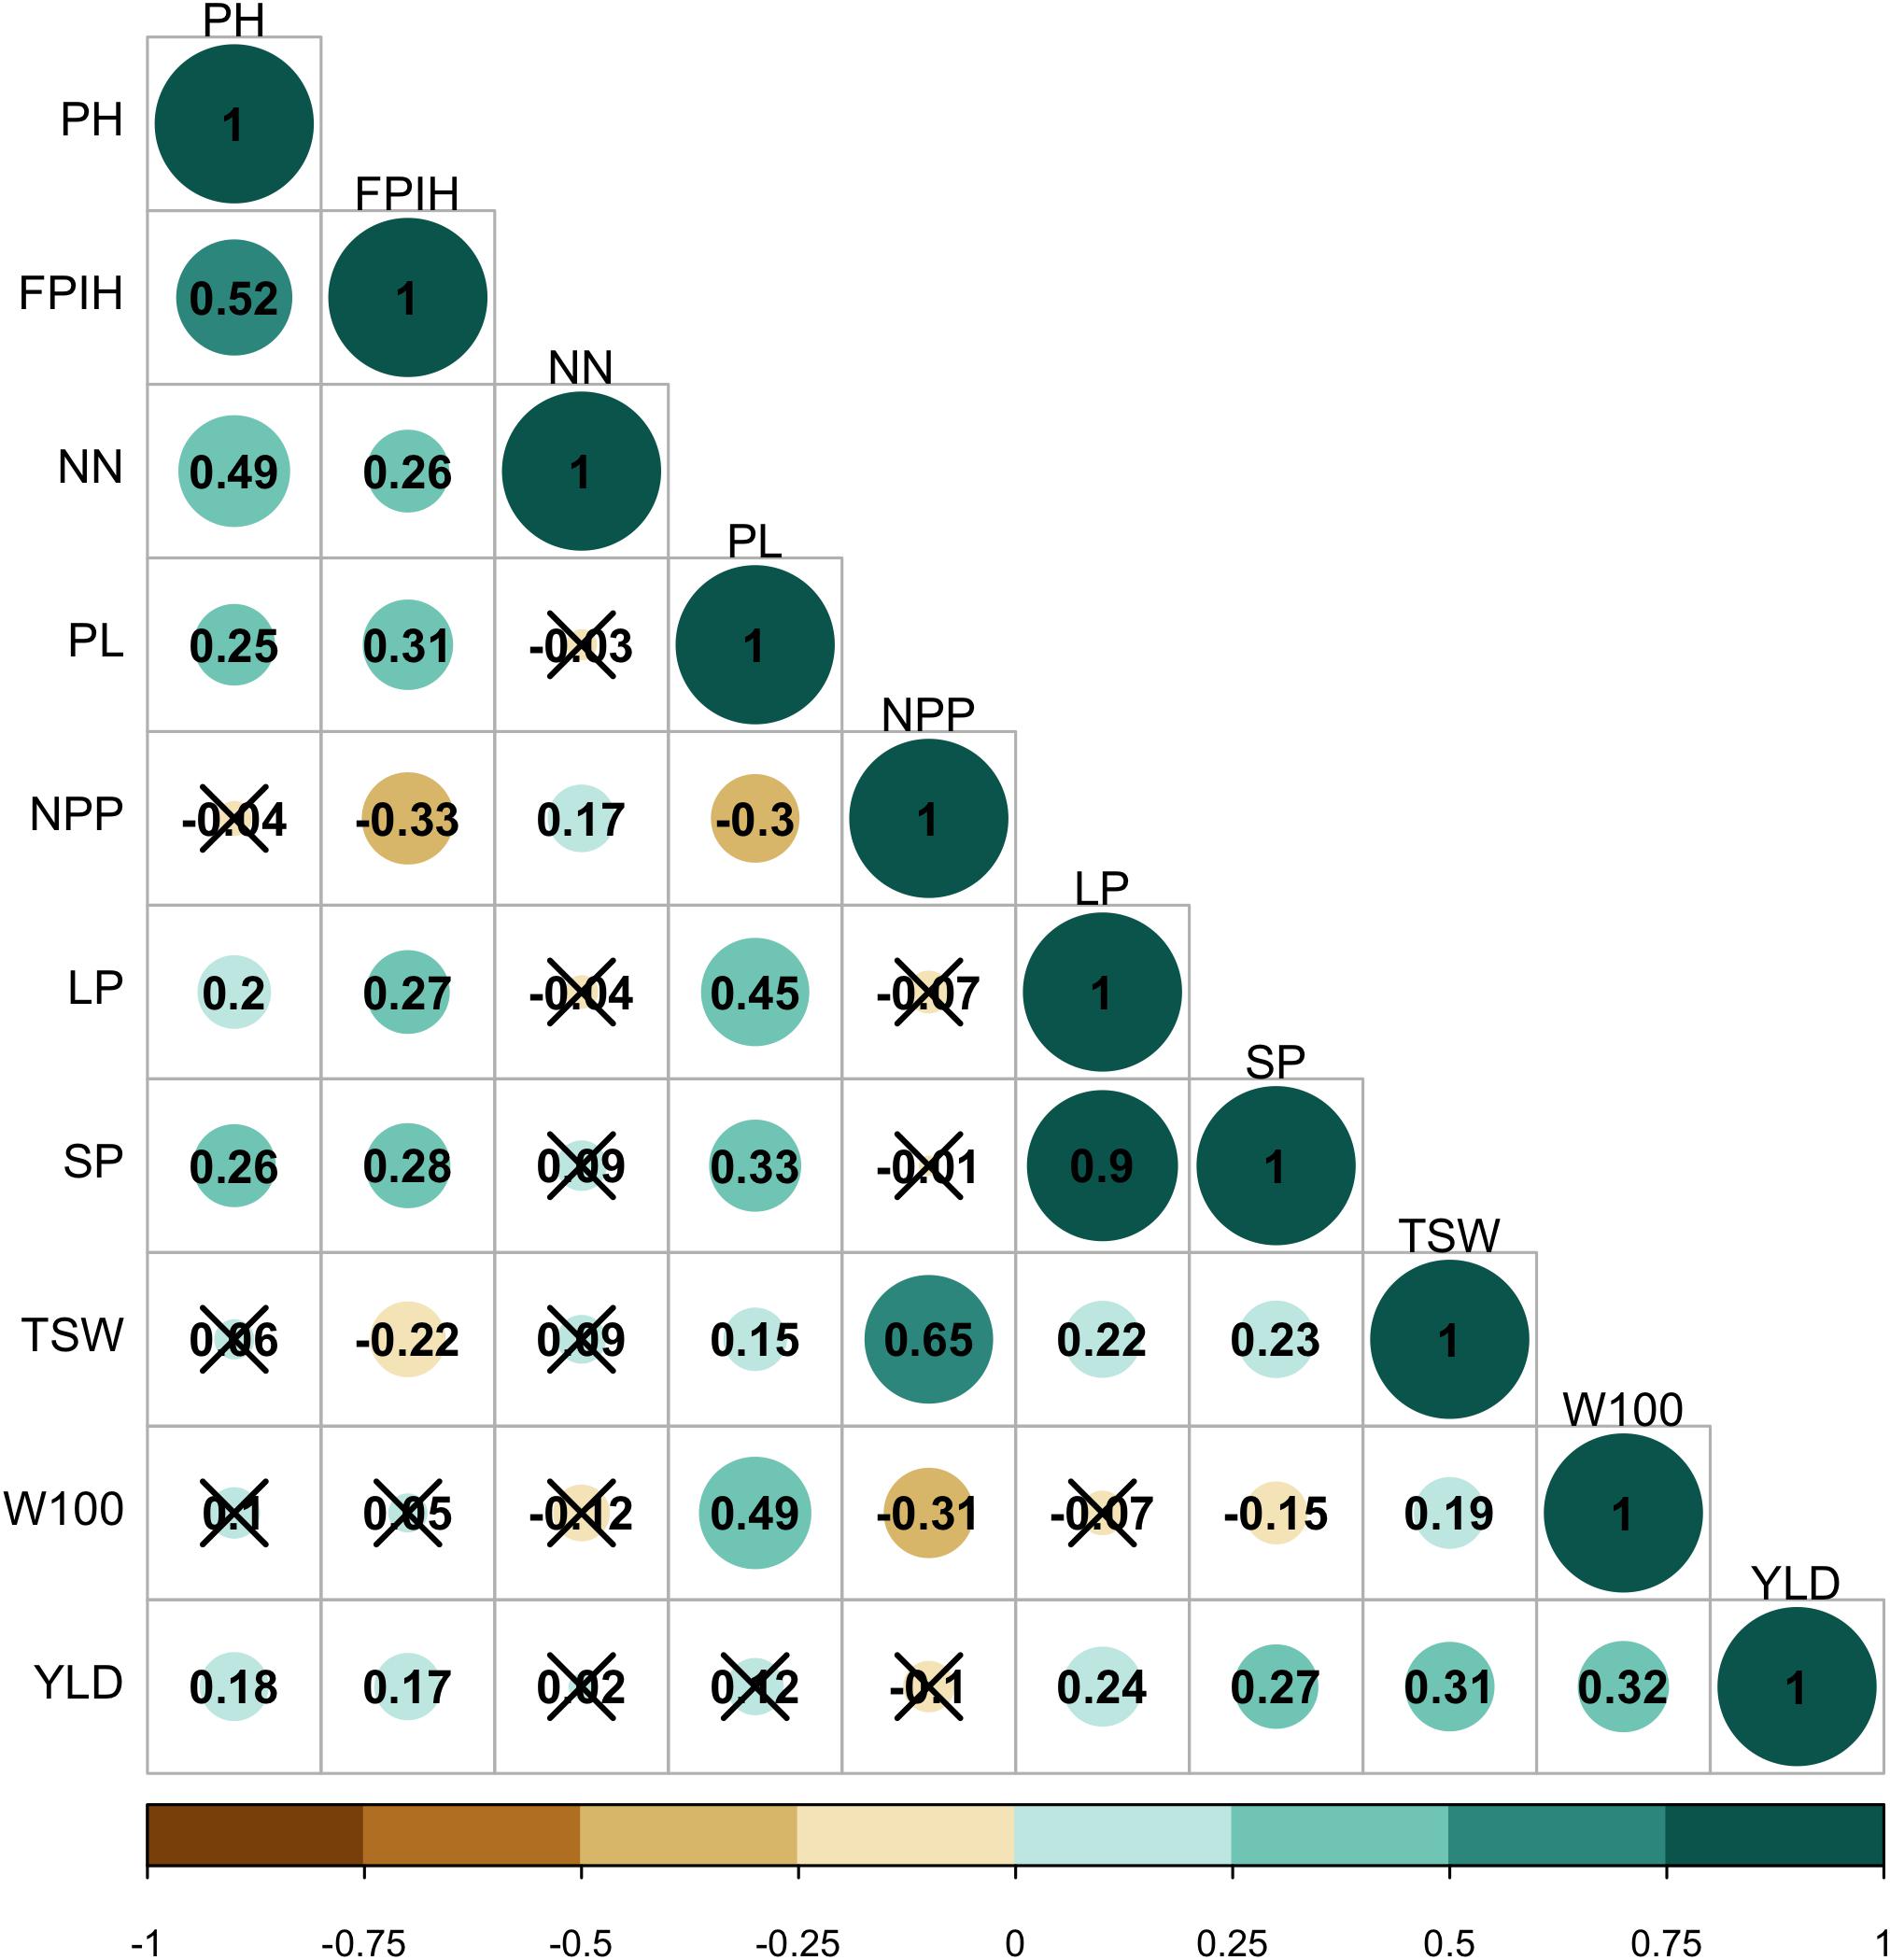
Figure 2. Pearson’s correlation analysis for morpho-agronomic traits of a common bean accession belonging to the Brazilian Diversity Panel (BDP). (X), not significant at 5% probability level. PH, plant height (cm); FPIH, first pod insertion height (cm); NN, number of nodules; PL, pod length (cm); NPP, total number of pods per plant; LP, number of locules per pod; SP, number of seeds per pod; TSW, total seed weight per plant (gm); W100, 100-seed weight (gm); YLD, grain yield (kg.ha–1).
Quantitative Trait Nucleotides Identified by ML-Genome-Wide Association Studies
The four ML-GWAS methods identified 297 QTNs associated with the 10 morpho-agronomic traits evaluated. Among these, 131 QTNs were detected at least twice by two methods and/or two different environments (Supplementary Table 1), while 64 QTNs were detected at least three times by multiple tests and/or multiple environments (Table 2). The highest number of QTNs was observed on the Pv01 and Pv08 chromosomes (nine significant QTNs each), followed by Pv02 and Pv11 (eight QTNs each). Only the 64 QTNs that presented repeatability at least three times were considered reliable and followed in this study.
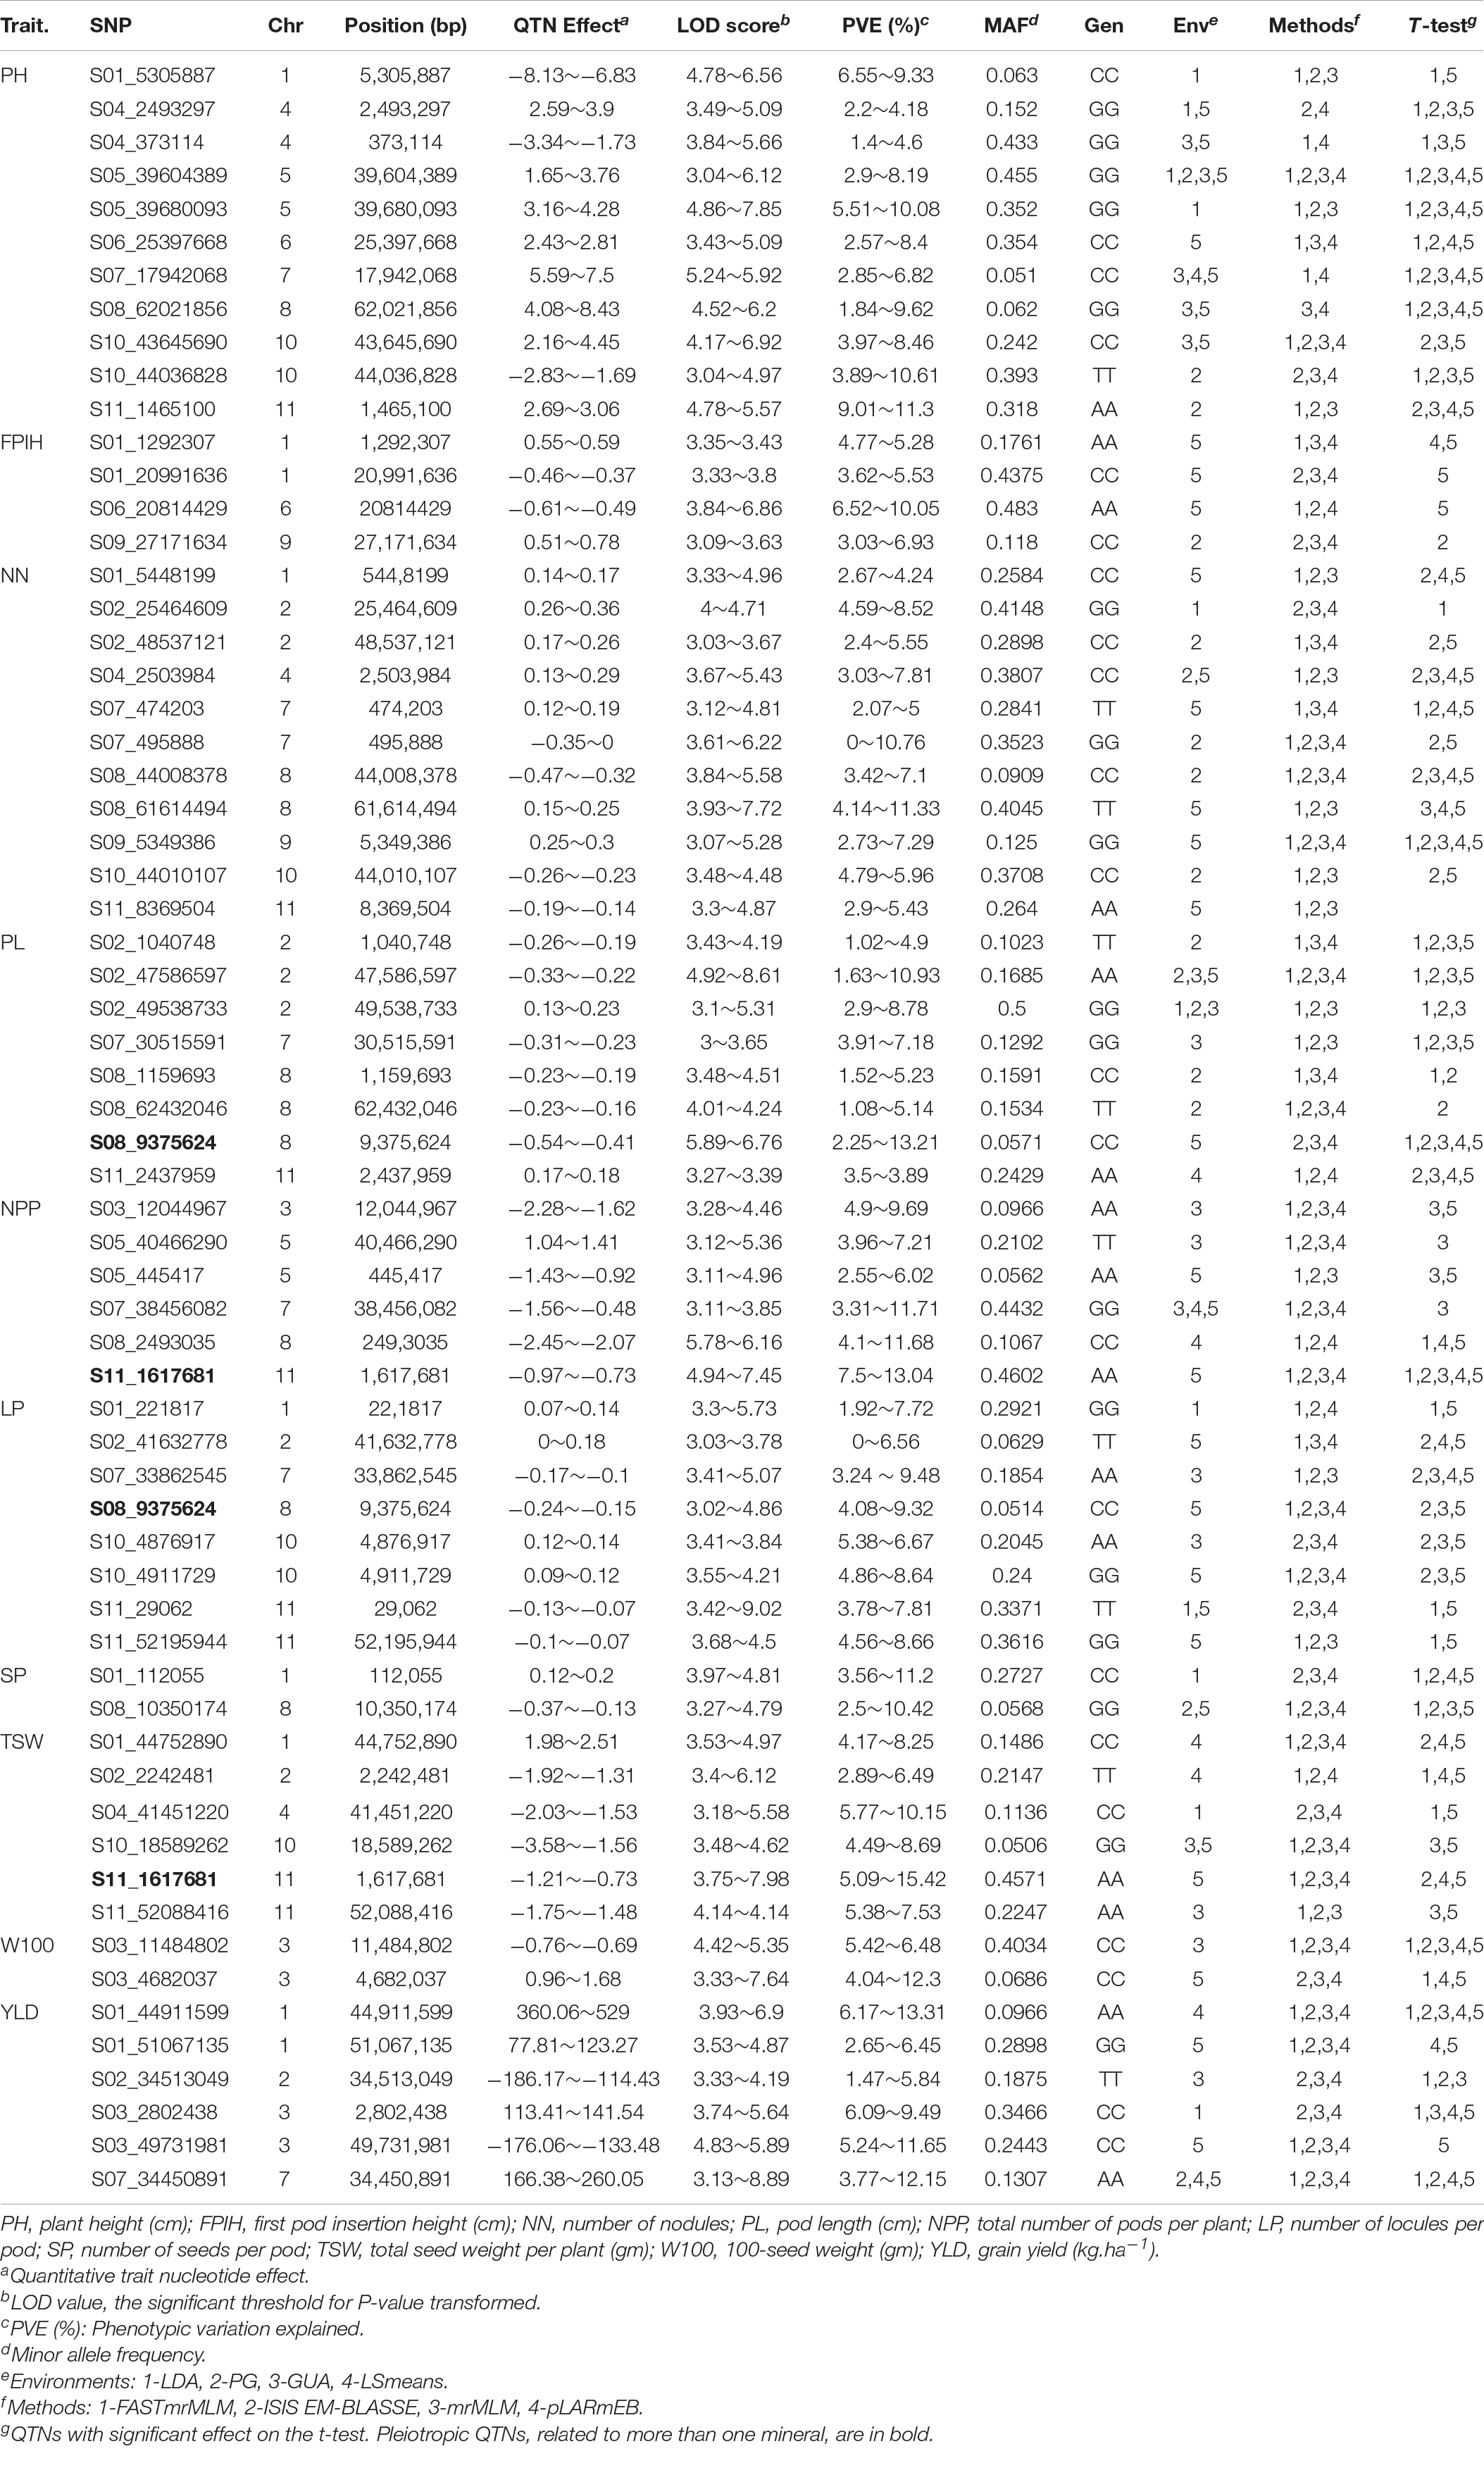
Table 2. QTNs associated with morpho-agronomic traits detected at least three times via different methods and in different environments in common bean accessions belonging to the Brazilian Diversity Panel (BDP).
The 64 QTNs identified each explained a low percentage of phenotypic variation (PVE): PH (n = 11; PVE = 1.4-11.3%), FPIH (n = 4; PVE = 3.03-10.05%), NN (n = 11; PVE = 3.33.10–8-11.33%), PL (n = 8; PVE = 1.08-13.21%), NPP (n = 6; PVE = 2.55-13.04%), LP (n = 8; PVE = 7.03.10–8-9.48%), SP (n = 2; PVE = 2.5-11.2%), TSW (n = 6; PVE = 2.89-15.42%), W100 (n = 2; PVE = 4.04-12.3%), and YLD (n = 6; PVE = 1.47-13.31%). Two QTNs were considered pleiotropic, since they were identified in more than one trait, i.e., PL-LP (S08_9375624) and NPP-TSW (S11_1617681) localized on the Pv08 and Pv11 chromosomes, respectively.
In addition to the identification of pleiotropic QTNs, 27 QTNs showed an overlap of their significant genomic regions. On the Pv05, Pv07, and Pv10 chromosomes, QTNs that overlapped for the same trait were observed for PH, NN, and LP, respectively. The PH and NN traits shared the genomic region around the QTNs on three chromosomes: Pv01, Pv04, and Pv10. Other overlaps were observed for SP-LP (Pv01), TSW-YLD (Pv01), W100-NPP (Pv03), LP-YLD (Pv07), PH-LP-PL (Pv08), TSW-LP (Pv11). In addition, the pleiotropic QTN identified for NPP-TSW (Pv11) shared the genomic region with a QTN identified for PH.
The highest number of QTNs was identified in the LSmeans dataset, followed by PG_18, GUA, 18, LDA_18, and PG_19. Among the GWAS multi-locus methods, the ISIS-EM-BLASSO method detected the highest number of SNPs, followed by pLARmEB, mrMLM, and FASTmrMLM. Considering only the 64 reliable QTNs, the environment ranking remained the same, being LSmeans the environment that detected the highest number of QTNs. For the methods, the number of stable QTNs detected was similar among the different methodologies, varying between 53 and 61. Looking at the efficiency of these methods, the number of QTNs considered reliable in relation to the initial number, the FASTmrMLM method stood out from the others (56%), followed by mrMLM (47%), pLARmEB (40%), and ISIS-EM-BLASO (34%).
Identification of Favorable Allelic Variations and Candidate Genes
Among the 64 QTNs considered to be reliable, 39 presented significant results for the t-test in at least three environments and were considered stable (Table 2). These stable QTNs were used to identify alleles that were considered to be favorable for the traits PH (n = 10), NN (n = 6), PL (n = 6), NPP (n = 2), LP (n = 4), SP (n = 2), TSW (n = 3), W100 (n = 2), and YLD (n = 4). For FPIH, stable QTNs following the established criteria were not observed, thus, only for this trait, three QTNs that presented significant results through the t-test for the overall mean (LSmeans) were used, resulting in a total of 42 stable QTNs (Figure 3).
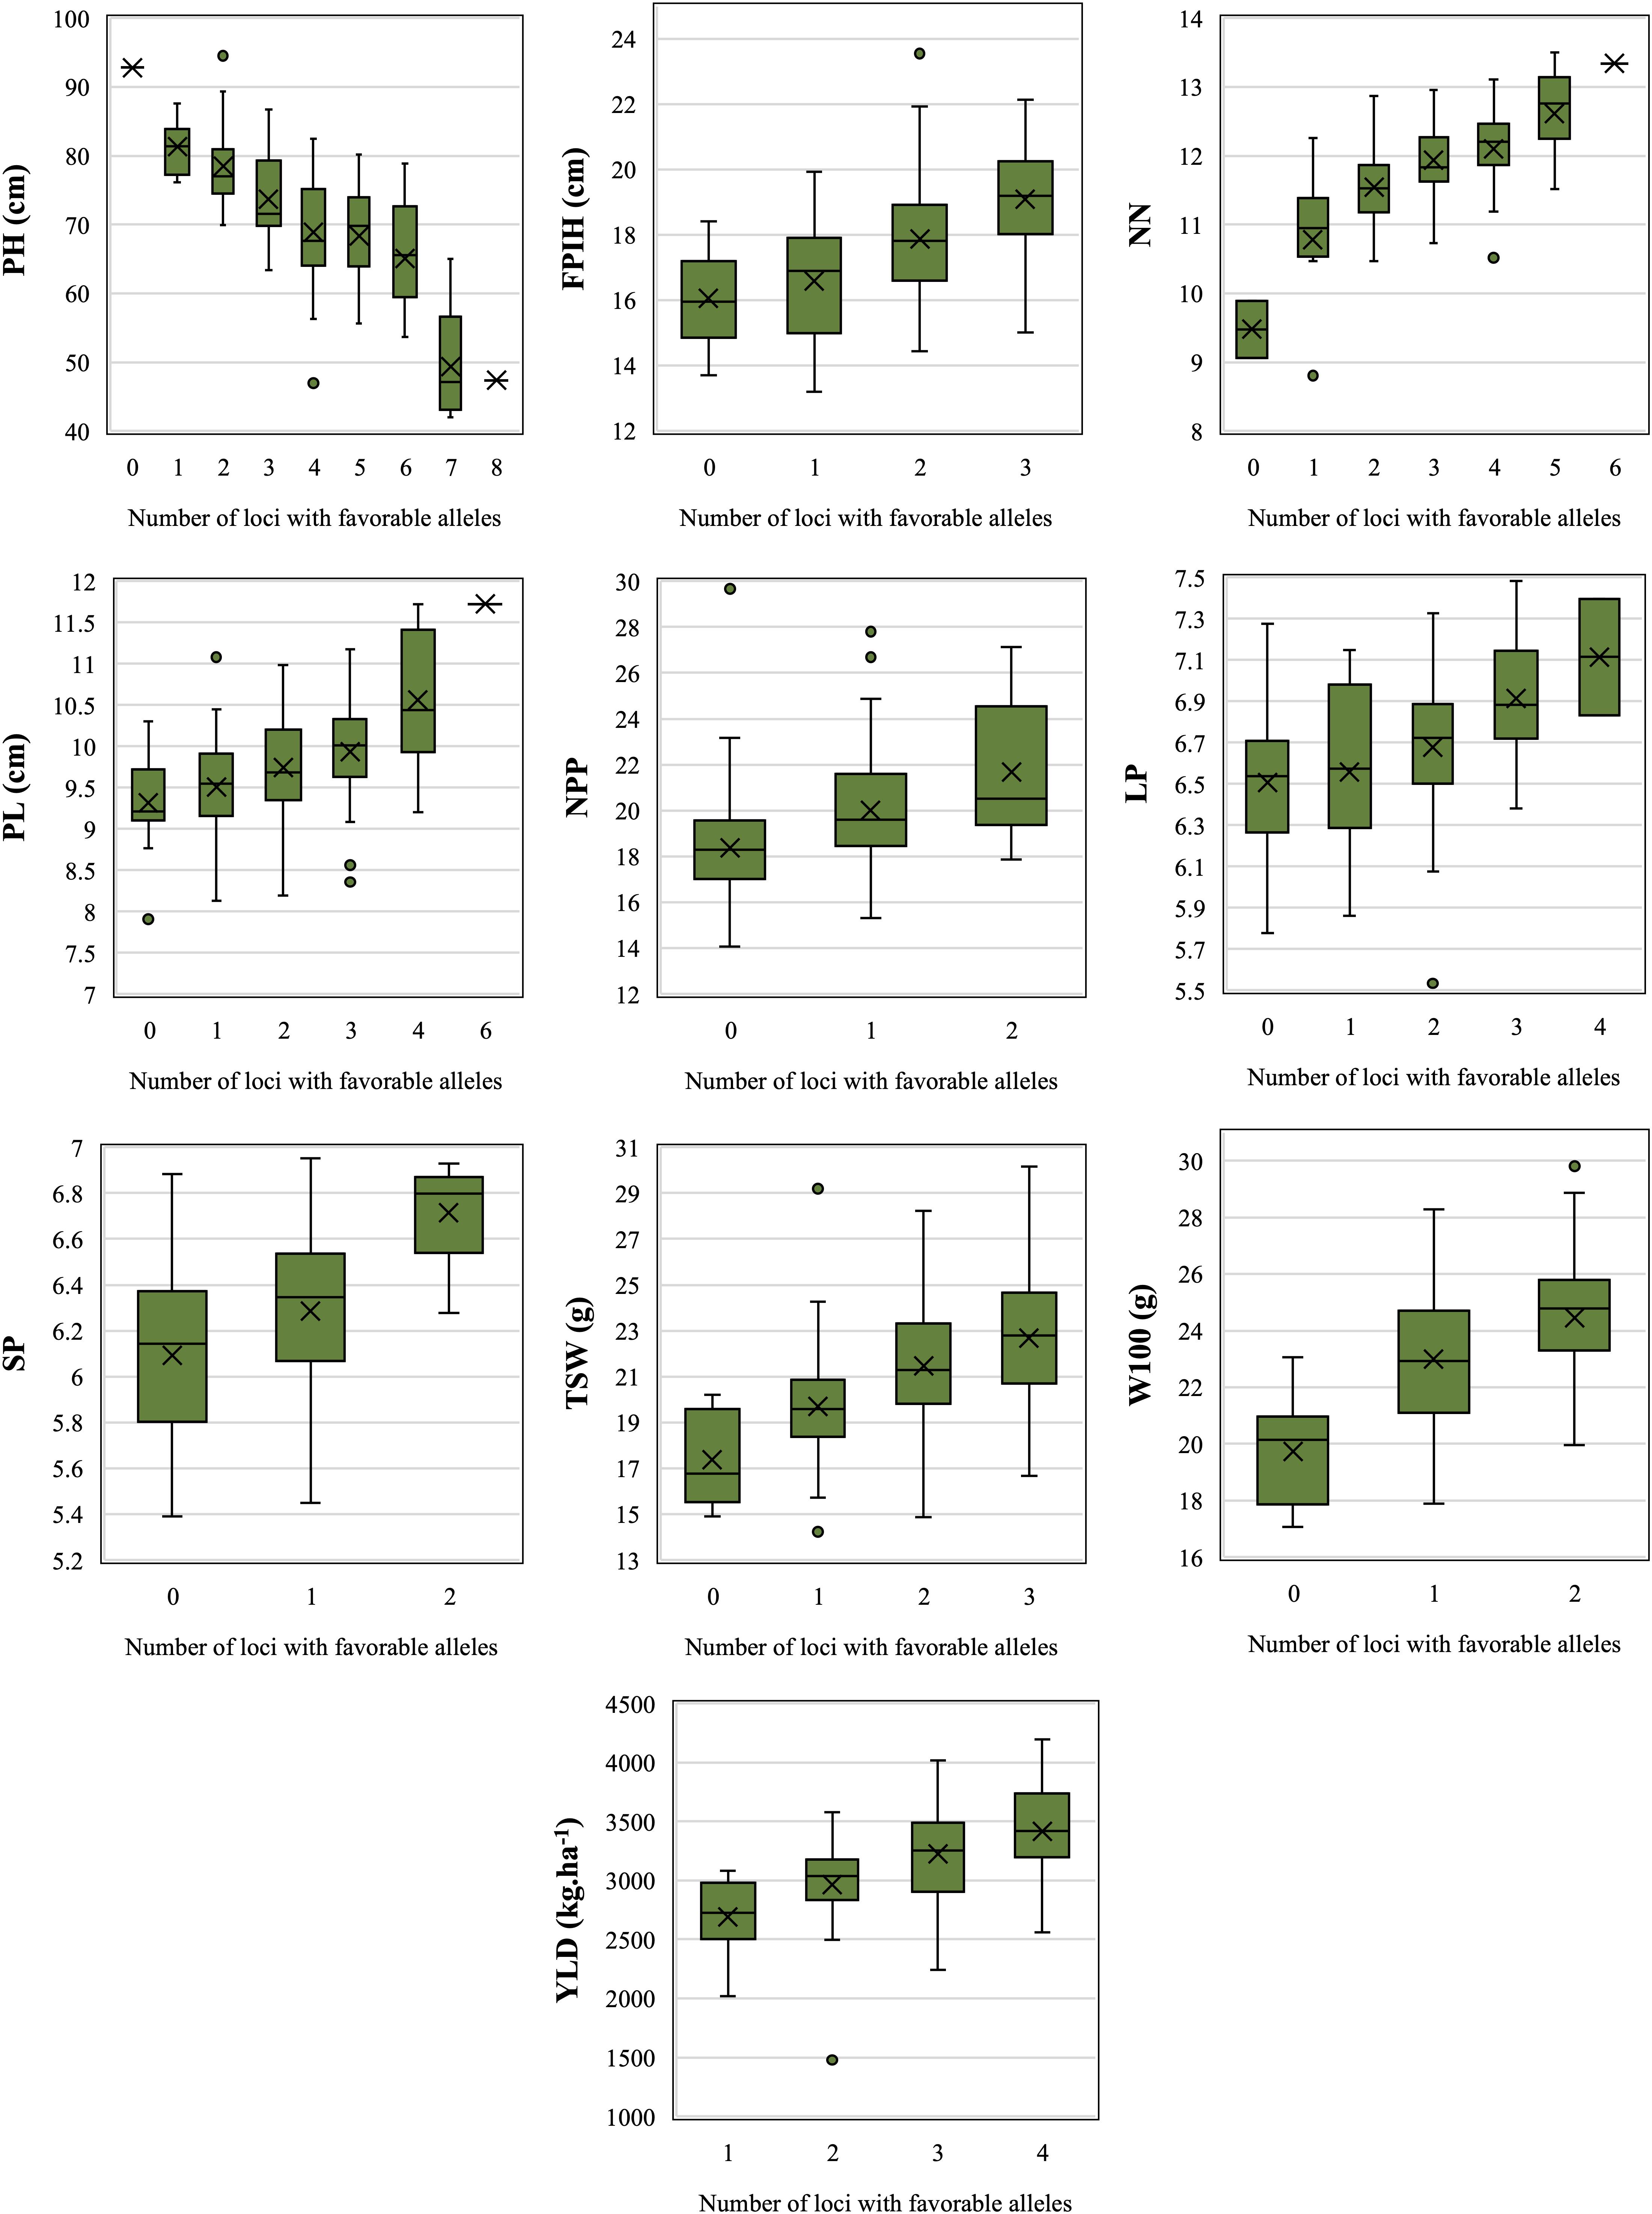
Figure 3. Accumulation of loci with favorable alleles in relation to adjusted means (LSmeans) for morpho-agronomic traits of common beans detected in accessions belonging to the Brazilian Diversity Panel (BDP). PH, plant height (cm); FPIH, first pod insertion height (cm); NN, number of nodules; PL, pod length (cm); NPP, total number of pods per plant; LP, number of locules per pod; SP, number of seeds per pod; TSW, total seed weight per plant (gm); W100, 100-seed weight (gm); YLD, grain yield (kg.ha–1).
All QTNs that had a positive effect (increased values) were considered as favorable alleles. The only exception was PH, for which common bean breeding programs search for plants with shorter size, for the purpose of mechanizing the harvest. The accumulation of favorable alleles in the same accession resulted in a gradual increase, or decrease in the case of PH, in all traits (Figure 3). Comparing the mean values between genotypes with zero and those with the maximum number of favorable alleles, PH was the most influenced trait, revealing a difference of 51.7% between the two genotype groups, reducing the values from 92.8 to 48 cm. For those traits where higher values are favorable, the greatest increase was observed for NN (34%, from 9.47 to 12.7), followed by TSW (30%, from 17.4 to 22.7 g), YLD (27%, from 2,688 to 3,419 kg.ha–1), W100 (24%, from 19.7 to 24.5 g), FPIH (19%, from 16 to 19 cm), NPP (18%, from 18.4 to 21.7), PL (14%, from 9.3 to 10.6 cm), LP (10%, from 6.5 to 7.14), and SP (10%, from 6.1 to 6.7).
The distance determined using the average LD decay (296 kb) was used to select potential candidate genes at a specific QTN distance. Since the search was conducted in a large genomic region around the QTNs, many genes were identified for the 10 traits evaluated in this study, resulting in 1,528 genes with known putative functions, and of these, 74% were identified more than once in regions of overlap between QTNs. According to GO annotation, the genes were grouped in three functional categories: 55% had a molecular function, 32% had functions related to biological processes, and 13% were cellular components. In the molecular function category, the main functions detected were protein binding, ATP binding, and protein kinase activity; for biological processes, the functions were related to protein phosphorylation, oxidation-reduction processes, and transcription regulation, and for cellular components, the functions were related to the membrane and integral components of the membrane.
Discussion
Although several studies already identified QTNs associated with morpho-agronomic traits in common beans using GWAS (Nemli et al., 2014; Kamfwa et al., 2015; Moghaddam et al., 2016; Soltani et al., 2016; Nascimento et al., 2018; Resende et al., 2018; Lei et al., 2020; Wu et al., 2020), panels composed exclusively of common beans of Mesoamerican origin and adapted to environmental conditions in Brazil had not been sufficiently explored (Valdisser et al., 2020). Moreover, few studies using the GWAS multi-locus approach have been conducted in common bean. The use of the GWAS multi-locus methods has grown in recent years, becoming one of the main tools to identify molecular markers associated with traits of interest, especially for traits considered complex, i.e., controlled by multiple genes of small effect and highly influenced by the environment (Wen et al., 2018; Zhang et al., 2019; Yang et al., 2020).
A GxE (Genotype by Environment) interaction was observed for most of the morpho-agronomic traits evaluated in the present study, indicating that the accessions’ differential behavior depends on the evaluation environments. The presence of GxE interaction is frequently observed in GWAS studies, where it interferes with the occurrence of the QTN x Environment interaction (Pan et al., 2018; Fattahi and Fakheri, 2019). The estimates of h2 obtained in the present study were similar to those observed in literature (Rana et al., 2015; Asfaw et al., 2017). The h2 is the central parameter of any breeding program, used to estimate the response to selection and explain the proportion of phenotypic variation due to genetic variations (Falconer and Mackay, 1996).
Correlations were observed among the traits related to the pods (PL, LP, and SP), the plant architecture traits (PH, FPIH, and NN), and the production components (TSW, W100, and YLD). Similar results were reported in several studies on common beans (Rana et al., 2015; Asfaw et al., 2017; Nadeem et al., 2020). The positive correlations observed between YLD and LP, SP, TSW, and W100 corroborate the possibility of indirect selection of YLD through these traits. However, Asfaw et al. (2017), studying the relationship between morpho-agronomic traits in 202 accessions of Andean and Mesoamerican origin, reported that the correlation between YLD and W100 occurs only in Andean common beans. Furthermore, the same authors recommended the indirect selection of YLD through NPP, independent of the gene pool. Although no positive correlation between YLD and NPP was found in this study, moderate correlations with TSW and SP were observed.
Quantitative genetics assumes that the genetic correlations between traits can be attributed to gene linkage and/or pleiotropy (Saltz et al., 2017). If pleiotropy is the main reason for genetic correlations between two traits, the same QTN can be identified in both traits. However, if gene linkage is the main reason, an overlap of the location between QTNs is expected. Thus, the pleiotropic QTNs identified between the PL-LP and NPP-TSW traits may be considered one of the causes of the correlations observed in these traits. On the other hand, the high number of QTNs identified in overlapping genomic regions indicates that genetic linkage may be the leading cause of the observed genetic correlations in the other assessed traits. Pleiotropy or linkage effects have been reported for many traits such as productivity, biomass, and plant height (Soltani et al., 2016).
Among the ML-GWAS methods used, the ISIS-EM-BLASSO detected the highest number of SNPs. However, it was the least efficient based on the number of verified QTNs. On the other hand, the FASTmrMLM method, while it detected the lowest number of QTNs detected, was considered the most efficient of the methods evaluated. Several studies comparing the ISIS-EM-BLASSO, pLARmEB, mrMLM, and FASTmrMLM methods have already been performed in many crops and the results are similar to those observed in the present study (Ma et al., 2018; Misra et al., 2018; Zhang et al., 2018; Fang et al., 2020). Although the ML-GWAS methods have similar approaches, the differential identification of QTNs is related to different screening and estimation models of each method (Zhang et al., 2018). From the present study results, FASTmrMLM can be considered the most reliable method, as it presented a low rate of false-positive associations. The FASTmrMLM method results from an improvement of the mrMLM method, which is a faster, more reliable, with higher statistical power, higher estimation accuracy, and low false-positive rate (Tamba and Zhang, 2018).
Most of the QTNs identified in this study were observed in only one environment, indicating the presence of frequent QTN x Environment interactions. Several studies have reported previously the presence of these morpho-agronomic traits interaction in common beans, suggesting that the gene expression of these QTNs is influenced by the evaluation environment (MacQueen et al., 2020; Wu et al., 2020). The presence of the QTN x Environment interaction is considered one of the main challenges in selecting QTNs in breeding programs, as these QTNs are more prone to environmental effects. On the other hand, the stable QTNs provided a remarkable demonstration of gradual improvement of all the traits evaluated in this study through the accumulation of favorable alleles.
Significant increases in productivity (YLD) and its primary components (NPP, SP, TSW, W100) were observed, and alleles that caused a significant PH reduction were identified. The PH is an essential factor in the formation of production components, and at the same time, it promotes or inhibits other components, affecting mainly the resistance to lodging, NN and NPP (Fang et al., 2020). Small-sized plants are associated with a determinate growth habit, less susceptibility to lodging, and shorter cycles (Chang et al., 2018). Over the years, with the technification of agriculture, common bean breeding programs have sought to develop plants with these traits, as they facilitate management and mechanized harvesting, reducing harvest losses and susceptibility to some diseases, allowing an increase in the number of crops per year due to a reduction in the cycle (Teixeira et al., 1999).
Most QTNs identified in this study had a small effect, confirming the complex and quantitative nature of the main morpho-agronomic traits in common beans (Gupta et al., 2020; MacQueen et al., 2020). As most of the traits studied are controlled by polygenes, the effect of each locus individually is relatively small. Nevertheless, it is vital to identify small-effect loci that cumulatively can explain the variation in a trait (Nakano and Kobayashi, 2020). The selection of higher-effect QTNs is preferable for the selection assisted by molecular markers (SAM) (Nadeem et al., 2018; Oladosu et al., 2019). However, the use of small-effect QTNs associated with the traits of interest is considered an important strategy in approaches to genomic selection (GS) since only these QTNs can replace the need for high-density genotyping by random SNPs and thus reduce genotyping costs. Moreover, models of GS using only SNPs known to be associated with the traits of interest showed greater accuracy of prediction since they showed lower background noise in constructing these models (He et al., 2019a; Ali et al., 2020).
Among the candidate gene models identified in this study, nine (Phvul.001G189200, Phvul.001G192200, Phvul.003G039900, Phvul.006G098300, Phvul.007G246700, Phvul.008G013300, Phvul.008G268700, Phvul.008G277352, and Phvul.011G020500) were previously identified in other studies of GWAS for morpho-agronomic traits in common beans (Cichy et al., 2015; Moghaddam et al., 2016; Soltani et al., 2017; Tock et al., 2017; MacQueen et al., 2020). The candidate gene model Phvul.003G039900, associated with W100 in the present study, was also identified for seed weight by MacQueen et al. (2020). The same authors observed an association between the gene model Phvul.006G098300 and PH, whereas this gene was associated with FPIH in the present study. The gene model Phvul.003G039900 has a putative methyltransferase activity function and the gene model Phvul.006G098300 is related to transferase activity and transferring acyl groups other than amino-acyl groups.
The candidate gene model Phvul.008G013300, related to PL in this study, was also associated with the weight of seeds as reported by Moghaddam et al. (2016) and has a serine-type endopeptidase activity and proteolysis functions. The candidate gene model Phvul.011G020500 was associated with PH, NPP, and TSW, while this same gene model was associated with the aerial part’s biomass trait in the observations of Soltani et al. (2017). Several functions were reported for this gene, such as DNA-binding transcription factor activity, transcription regulator complex, regulation of transcription and cell cycle.
Considering that the genomic regions around the significant QTNs for the different traits assessed in this study overlapped one another, 74% of the identified genes were also detected for more than one trait. Due to the strong LD observed in common beans, it is difficult to assign a gene precisely to a trait, especially when it comes to polygenic traits (Ikram et al., 2020). The genes located in the genomic regions around the identified QTNs may serve as promising targets for studying molecular mechanisms responsible for morpho-agronomic traits in common beans.
In this study, 64 QTNs were identified for ten morpho-agronomic traits in common beans. Thirty-nine of them were identified as favorable alleles that can significantly increase trait expression and potentially yield and its components in the cultivation of common beans through allele pyramiding. The results reinforce the importance of conducting phenotyping of individuals in multiple environments, using multiple detection methods to increase the reliability of QTNs obtained in GWAS studies. The QTNs identified proved adequate for implementation in common bean breeding programs, mainly for improving Mesoamerican common beans from the Black and Carioca commercial classes, which are the primary targets in Brazil.
Data Availability Statement
The raw data supporting the conclusions of this article will be made available by the authors, without undue reservation.
Author Contribuitions
JD, VM-C, and LG conceived and designed the study. JD collected plant material, extracted DNA, and performed the genotyping. JD, JS, AN, LR, and DZ performed the phenotyping. JD and LG performed bioinformatics and statistical analyses. JD and DZ drafted the manuscript. JD, VM-C, JS, DZ, PR, PG, and LG edited and revised the final manuscript. All authors read and approved the final manuscript.
Conflict of Interest
The authors declare that the research was conducted in the absence of any commercial or financial relationships that could be construed as a potential conflict of interest.
Publisher’s Note
All claims expressed in this article are solely those of the authors and do not necessarily represent those of their affiliated organizations, or those of the publisher, the editors and the reviewers. Any product that may be evaluated in this article, or claim that may be made by its manufacturer, is not guaranteed or endorsed by the publisher.
Acknowledgments
We would like to thank the Instituto de Desenvolvimento Rural do Paranaì (IDR-Paranaì) and the University of California, Davis (through the Gepts’ Lab) for support this research and the Coordenação de Aperfeiçoamento de Pessoal de Niìvel Superior—Brasil (CAPES) for the scholarship to JD in Brazil and abroad (Finance Code 001).
Supplementary Material
The Supplementary Material for this article can be found online at: https://www.frontiersin.org/articles/10.3389/fpls.2021.748829/full#supplementary-material
Footnotes
References
Ali, M., Zhang, Y., Rasheed, A., Wang, J., and Zhang, L. (2020). Genomic prediction for grain yield and yield-related traits in chinese winter wheat. Int. J. Mol. Sci. 21:1342. doi: 10.3390/ijms21041342
Ariani, A., Berny Mier y Teran, J. C., and Gepts, P. (2016). Genome-wide identification of SNPs and copy number variation in common bean (Phaseolus vulgaris L.) using genotyping-by-sequencing (GBS). Mol. Breed. 36:87. doi: 10.1007/s11032-016-0512-9
Ariani, A., Berny Mier y Teran, J. C., and Gepts, P. (2017). Spatial and temporal scales of range expansion in wild Phaseolus vulgaris. Mol. Biol. Evol. 35, 119–131. doi: 10.1093/molbev/msx273
Asfaw, A., Ambachew, D., Shah, T., and Blair, M. W. (2017). Trait associations in diversity panels of the two common bean (Phaseolus vulgaris l.) gene pools grown under well-watered and water-stress conditions. Front. Plant Sci. 8:733. doi: 10.3389/fpls.2017.00733
Assefa, T., Assibi Mahama, A., Brown, A. V., Cannon, E. K. S., Rubyogo, J. C., Rao, I. M., et al. (2019). A review of breeding objectives, genomic resources, and marker-assisted methods in common bean (Phaseolus vulgaris L.). Mol. Breed. 39:20. doi: 10.1007/s11032-018-0920-0
Beebe, S. E., Rao, I. M., Blair, M. W., and Acosta-Gallegos, J. A. (2013). Phenotyping common beans for adaptation to drought. Front. Physiol. 4:35. doi: 10.3389/fphys.2013.00035
Berny Mier Y Teran, J. C., Konzen, E. R., Palkovic, A., Tsai, S. M., Rao, I. M., Beebe, S., et al. (2019). Effect of drought stress on the genetic architecture of photosynthate allocation and remobilization in pods of common bean (Phaseolus vulgaris L.), a key species for food security. BMC Plant Biol. 19:171. doi: 10.1186/s12870-019-1774-2
Berny Mier y Teran, J. C., Konzen, E. R., Medina, V., Palkovic, A., Ariani, A., Tsai, S. M., et al. (2018). Root and shoot variation in relation to potential intermittent drought adaptation of Mesoamerican wild common bean (Phaseolus vulgaris L.). Ann. Bot. 124, 917–932. doi: 10.1093/aob/mcy221
Berny Mier y Teran, J. C., Konzen, E. R., Palkovic, A., Tsai, S. M., and Gepts, P. (2020). Exploration of the yield potential of mesoamerican wild common beans from contrasting eco-geographic regions by nested recombinant inbred populations. Front. Plant Sci. 11:346. doi: 10.3389/fpls.2020.00346
Broughton, W. J., Hernandez, G., Blair, M., Beebe, S., Gepts, P., and Vanderleyden, J. (2003). Beans (Phaseolus spp.)–model food legumes. Plant Soil 252, 55–128. doi: 10.1023/A:1024146710611
Browning, B. L., and Browning, S. R. (2016). Genotype imputation with millions of reference samples. Am. J. Hum. Genet. 98, 116–126. doi: 10.1016/j.ajhg.2015.11.020
Burle, M. L., Fonseca, J. R., del Peloso, M. J., Melo, L. C., Temple, S. R., and Gepts, P. (2011). Integrating phenotypic evaluations with a molecular diversity assessment of a brazilian collection of common bean landraces. Crop Sci. 51, 2668–2680. doi: 10.2135/cropsci2010.12.0710
Burle, M. L., Fonseca, J. R., Kami, J. A., and Gepts, P. (2010). Microsatellite diversity and genetic structure among common bean (Phaseolus vulgaris L.) landraces in Brazil, a secondary center of diversity. Theor. Appl. Genet. 121, 801–813. doi: 10.1007/s00122-010-1350-5
Chang, F., Guo, C., Sun, F., Zhang, J., Wang, Z., Kong, J., et al. (2018). Genome-wide association studies for dynamic plant height and number of nodes on the main stem in summer sowing soybeans. Front. Plant Sci. 9:1184. doi: 10.3389/fpls.2018.01184
Cichy, K. A., Porch, T. G., Beaver, J. S., Cregan, P., Fourie, D., Glahn, R. P., et al. (2015). A Phaseolus vulgaris diversity panel for Andean bean improvement. Crop Sci. 55, 2149–2160. doi: 10.2135/cropsci2014.09.0653
Contreras-Soto, R. I., Mora, F., De Oliveira, M. A. R., Higashi, W., Scapim, C. A., and Schuster, I. (2017). A genome-wide association study for agronomic traits in soybean using SNP markers and SNP-Based haplotype analysis. PLoS One 12:e0171105. doi: 10.1371/journal.pone.0171105
Cui, Y., Zhang, F., and Zhou, Y. (2018). The application of multi-locus GWAS for the detection of salt-tolerance loci in rice. Front. Plant Sci. 9:1464. doi: 10.3389/fpls.2018.01464
Danecek, P., Auton, A., Abecasis, G., Albers, C. A., Banks, E., DePristo, M. A., et al. (2011). The variant call format and VCFtools. Bioinformatics 27, 2156–2158. doi: 10.1093/bioinformatics/btr330
Delfini, J., Moda-Cirino, V., dos Santos Neto, J., Ruas, P. M., Sant’Ana, G. C., Gepts, P., et al. (2021a). Population structure, genetic diversity and genomic selection signatures among a Brazilian common bean germplasm. Sci. Rep. 11:2964. doi: 10.1038/s41598-021-82437-4
Delfini, J., Moda-Cirino, V., dos Santos Neto, J., Zeffa, D. M., Nogueira, A. F., Ribeiro, L. A. B., et al. (2021b). Genome-wide association study for grain mineral content in a Brazilian common bean diversity panel. Theor. Appl. Genet 134, 2795–2811. doi: 10.1007/s00122-021-03859-2
Delfini, J., Moda-Cirino, V., Ruas, C. D. F., Dos Santos Neto, J., Ruas, P. M., Buratto, J. S., et al. (2017). Distinctness of Brazilian common bean cultivars with carioca and black grain by means of morphoagronomic and molecular descriptors. PLoS One 12:e0188798. doi: 10.1371/journal.pone.0188798
Falconer, D. S., and Mackay, T. F. C. (1996). Introduction to Quantitative Genetics. Essex: Longmam.
Fang, Y., Liu, S., Dong, Q., Zhang, K., Tian, Z., Li, X., et al. (2020). Linkage analysis and multi-locus genome-wide association studies identify QTNs controlling soybean plant height. Front. Plant Sci. 11:9. doi: 10.3389/fpls.2020.00009
Fattahi, F., and Fakheri, B. A. (2019). Evolutionary dynamics models in biometrical genetics supports QTL × environment interactions. J. Genet. 98:39. doi: 10.1007/s12041-019-1089-y
Gepts, P., Kmiecik, K., Pereira, P., and Bliss, F. A. (1988). Dissemination pathways of common bean (Phaseolus vulgaris, Fabaceae) deduced from phaseolin electrophoretic variability. I. Am. Econ. Bot. 42, 73–85. doi: 10.1007/BF02859036
Gupta, N., Zargar, S. M., Singh, R., Nazir, M., Mahajan, R., and Salgotra, R. K. (2020). Marker association study of yield attributing traits in common bean (Phaseolus vulgaris L.). Mol. Biol. Rep. 47, 6769–6783. doi: 10.1007/s11033-020-05735-6
Hallauer, A. R., and Miranda Filho, J. B. (1988). Quantitative Genetics in Maize Breeding. Ames, IA: Iowa State University Press.
He, L., Xiao, J., Rashid, K. Y., Yao, Z., Li, P., Jia, G., et al. (2019b). Genome-wide association studies for pasmo resistance in flax (Linum usitatissimum L.). Front. Plant Sci. 9:1982. doi: 10.3389/fpls.2018.01982
He, L., Xiao, J., Rashid, K. Y., Jia, G., Li, P., Yao, Z., et al. (2019a). Evaluation of genomic prediction for Pasmo resistance in flax. Int. J. Mol. Sci. 20:359. doi: 10.3390/ijms20020359
Hoyos-Villegas, V., Song, Q., and Kelly, J. D. (2017). Genome-wide association analysis for drought tolerance and associated traits in common bean. Plant Genome 10, 1–17. doi: 10.3835/plantgenome2015.12.0122
Ikram, M., Han, X., Zuo, J.-F., Song, J., Han, C.-Y., Zhang, Y.-W., et al. (2020). Identification of QTNs and their candidate genes for 100-seed weight in soybean (Glycine max L.) using multi-locus genome-wide association studies. Genes 11:714. doi: 10.3390/genes11070714
Kamfwa, K., Cichy, K. A., and Kelly, J. D. (2015). Genome-wide association study of agronomic traits in common bean. Plant Genome 8, 1–12. doi: 10.3835/plantgenome2014.09.0059
Keller, B., Ariza-Suarez, D., de la Hoz, J., Aparicio, J. S., Portilla-Benavides, A. E., Buendia, H. F., et al. (2020). Genomic prediction of agronomic traits in common bean (Phaseolus vulgaris L.) under environmental stress. Front. Plant Sci. 11:1001. doi: 10.3389/fpls.2020.01001
Korte, A., and Ashley, F. (2013). The advantages and limitations of trait analysis with GWAS?: a review self-fertilisation makes Arabidopsis particularly well suited to GWAS. Plant Methods 9:29.
Kwak, M., and Gepts, P. (2009). Structure of genetic diversity in the two major gene pools of common bean (Phaseolus vulgaris L., Fabaceae). Theor. Appl. Genet. 118, 979–992. doi: 10.1007/s00122-008-0955-4
Lei, L., Wang, L., Wang, S., and Wu, J. (2020). Marker-trait association analysis of seed traits in accessions of common bean (Phaseolus vulgaris L.) in China. Front. Genet. 11:698. doi: 10.3389/fgene.2020.00698
Li, C., Fu, Y., Sun, R., Wang, Y., and Wang, Q. (2018). Single-locus and multi-locus genome-wide association studies in the genetic dissection of fiber quality traits in upland cotton (Gossypium hirsutum l.). Front. Plant Sci. 9:1083. doi: 10.3389/fpls.2018.01083
Ma, L., Liu, M., Yan, Y., Qing, C., Zhang, X., Zhang, Y., et al. (2018). Genetic dissection of maize embryonic callus regenerative capacity using multi-locus genome-wide association studies. Front. Plant Sci. 9:561. doi: 10.3389/fpls.2018.00561
MacQueen, A. H., White, J. W., Lee, R., Osorno, J. M., Schmutz, J., Miklas, P. N., et al. (2020). Genetic associations in four decades of multienvironment trials reveal agronomic trait evolution in common bean. Genetics 215, 267–284. doi: 10.1534/genetics.120.303038
Misra, G., Badoni, S., Domingo, C. J., Cuevas, R. P. O., Llorente, C., Mbanjo, E. G. N., et al. (2018). Deciphering the genetic architecture of cooked rice texture. Front. Plant Sci. 9:1405. doi: 10.3389/fpls.2018.01405
Moghaddam, S. M., Mamidi, S., Osorno, J. M., Lee, R., Brick, M., Kelly, J., et al. (2016). Genome-wide association study identifies candidate loci underlying agronomic traits in a middle american diversity panel of common bean. Plant Genome 9, 1–21. doi: 10.3835/plantgenome2016.02.0012
Nadeem, M. A., Karaköy, T., Yeken, M. Z., Habyarimana, E., Hatipoglu, R., Çiftçi, V., et al. (2020). Phenotypic characterization of 183 Turkish common bean accessions for agronomic, trading, and consumer-preferred plant characteristics for breeding purposes. Agronomy 10:272. doi: 10.3390/agronomy10020272
Nadeem, M. A., Nawaz, M. A., Shahid, M. Q., Doðan, Y., Comertpay, G., Yıldız, M., et al. (2018). DNA molecular markers in plant breeding: current status and recent advancements in genomic selection and genome editing. Biotechnol. Biotechnol. Equip. 32, 261–285. doi: 10.1080/13102818.2017.1400401
Nakano, Y., and Kobayashi, Y. (2020). Genome-wide association studies of agronomic traits consisting of field-and molecular-based phenotypes. Rev. Agric. Sci. 8, 28–45. doi: 10.7831/ras.8.0_28
Nascimento, M., Nascimento, A. C. C., Silva, F. F. E., Barili, L. D., Do Vale, N. M., Carneiro, J. E., et al. (2018). Quantile regression for genome-wide association study of flowering time-related traits in common bean. PLoS One 13:e0190303. doi: 10.1371/journal.pone.0190303
Nemli, S., Asciogul, T. K., Kaya, H. B., Kahraman, A., Eşiyok, D., and Tanyolac, B. (2014). Association mapping for five agronomic traits in the common bean (Phaseolus vulgaris L.). J. Sci. Food Agric. 94, 3141–3151. doi: 10.1002/jsfa.6664
Oladosu, Y., Rafii, M. Y., Samuel, C., Fatai, A., Magaji, U., Kareem, I., et al. (2019). Drought resistance in rice from conventional to molecular breeding: a review. Int. J. Mol. Sci. 20:3519. doi: 10.3390/ijms20143519
Oladzad, A., Porch, T., Rosas, J. C., Moghaddam, S. M., Beaver, J., Beebe, S. E., et al. (2019). Single and multi-trait GWAS identify genetic factors associated with production traits in common bean under abiotic stress environments. G3 9, 1881–1892. doi: 10.1534/g3.119.400072
Pan, L., He, J., Zhao, T., Xing, G., Wang, Y., Yu, D., et al. (2018). Efficient QTL detection of flowering date in a soybean RIL population using the novel restricted two-stage multi-locus GWAS procedure. Theor. Appl. Genet. 131, 2581–2599. doi: 10.1007/s00122-018-3174-7
Parker, T. A., Berny Mier y Teran, J. C., Palkovic, A., Jernstedt, J., and Gepts, P. (2020a). Pod indehiscence is a domestication and aridity resilience trait in common bean. New Phytol. 225, 558–570. doi: 10.1111/nph.16164
Parker, T. A., Palkovic, A., and Gepts, P. (2020b). Determining the genetic control of common bean early-growth rate using unmanned aerial vehicles. Remote Sens. 12:1748. doi: 10.20944/preprints202004.0309.v1
Pritchard, J. K., Stephens, M., and Donnelly, P. (2000). Inference of population structure using multilocus genotype data. Genetics 155, 945–959.
Rana, J. C., Sharma, T. R., Tyagi, R. K., Chahota, R. K., Gautam, N. K., Singh, M., et al. (2015). Characterisation of 4274 accessions of common bean (Phaseolus vulgaris L.) germplasm conserved in the indian gene bank for phenological, morphological and agricultural traits. Euphytica 205, 441–457. doi: 10.1007/s10681-015-1406-3
Rawal, V., and Navarro, D. K. (2019). The Global Economy of Pulses. Rome: Food and Agriculture Organization.
Resende, R. T., de Resende, M. D. V., Azevedo, C. F., Silva, F. F. E., Melo, L. C., Pereira, H. S., et al. (2018). Genome-wide association and regional heritability mapping of plant architecture, lodging and productivity in phaseolus vulgaris. G3 8, 2841–2854. doi: 10.1534/g3.118.200493
Saltz, J. B., Hessel, F. C., and Kelly, M. W. (2017). Trait correlations in the genomics era. Trends Ecol. Evol. 32, 279–290. doi: 10.1016/j.tree.2016.12.008
Singh, S. P., Nodari, R., and Gepts, P. (1991). Genetic diversity in cultivated common bean: i. allozymes. Crop Sci. 31:19. doi: 10.2135/cropsci1991.0011183x003100010004x
Soltani, A., Bello, M., Mndolwa, E., Schroder, S., Moghaddam, S. M., Osorno, J. M., et al. (2016). Targeted analysis of dry bean growth habit: interrelationship among architectural, phenological, and yield components. Crop Sci. 56, 3005–3015. doi: 10.2135/cropsci2016.02.0119
Soltani, A., MafiMoghaddam, S., Walter, K., Restrepo-Montoya, D., Mamidi, S., Schroder, S., et al. (2017). Genetic architecture of flooding tolerance in the dry bean middle-American diversity panel. Front. Plant Sci. 8:1183. doi: 10.3389/fpls.2017.01183
Tamba, C. L., Ni, Y. L., and Zhang, Y. M. (2017). Iterative sure independence screening EM-Bayesian LASSO algorithm for multi-locus genome-wide association studies. PLoS Comput. Biol. 13:e1005357. doi: 10.1371/journal.pcbi.1005357
Tamba, C. L., and Zhang, Y.-M. (2018). A fast mrMLM algorithm for multi-locus genome-wide association studies. Biorxiv [Preprint] doi: 10.1101/341784 bioRxiv: 341784,
Teixeira, F. F., Ramalho, M. A. P., and Abreu, ÂD. F. B. (1999). Genetic control of plant architecture in the common bean (Phaseolus vulgaris L.). Genet. Mol. Biol. 22, 577–582. doi: 10.1590/S1415-47571999000400019
Tock, A. J., Fourie, D., Walley, P. G., Holub, E. B., Soler, A., Cichy, K. A., et al. (2017). Genome-wide linkage and association mapping of halo blight resistance in common bean to race 6 of the globally important bacterial pathogen. Front. Plant Sci. 8:1170. doi: 10.3389/fpls.2017.01170
Valdisser, P. A., Müller, B. S., de Almeida Filho, J. E., Júnior, O. P. M., Guimarães, C. M., Borba, T. C., et al. (2020). Genome-wide association studies detect multiple QTLs for productivity in Mesoamerican diversity panel of common bean under drought stress. Front. Plant Sci. 11:574674. doi: 10.3389/fpls.2020.574674
Wang, M., Jiang, N., Jia, T., Leach, L., Cockram, J., Waugh, R., et al. (2012). Genome-wide association mapping of agronomic and morphologic traits in highly structured populations of barley cultivars. Theor. Appl. Genet. 124, 233–246. doi: 10.1007/s00122-011-1697-2
Wang, S. B., Feng, J. Y., Ren, W. L., Huang, B., Zhou, L., Wen, Y. J., et al. (2016). Improving power and accuracy of genome-wide association studies via a multi-locus mixed linear model methodology. Sci. Rep. 6:19444. doi: 10.1038/srep19444
Ward, B. P., Brown-Guedira, G., Kolb, F. L., Van Sanford, D. A., Tyagi, P., Sneller, C. H., et al. (2019). Genome-wide association studies for yield-related traits in soft red winter wheat grown in Virginia. PLoS One 14:e0208217. doi: 10.1371/journal.pone.0208217
Wei, T., and Simko, V. (2017). R Package “corrplot” Visualization of a Correlation Matrix (Version 0.84).
Wen, Y. J., Zhang, H., Ni, Y. L., Huang, B., Zhang, J., Feng, J. Y., et al. (2018). Methodological implementation of mixed linear models in multi-locus genome-wide association studies. Brief. Bioinform. 19, 700–712. doi: 10.1093/bib/bbw145
Wu, J., Wang, L., Fu, J., Chen, J., Wei, S., Zhang, S., et al. (2020). Resequencing of 683 common bean genotypes identifies yield component trait associations across a north–south cline. Nat. Genet. 52, 118–125. doi: 10.1038/s41588-019-0546-0
Yang, Y., Chai, Y., Zhang, X., Lu, S., Zhao, Z., Wei, D., et al. (2020). Multi-locus GWAS of quality traits in bread wheat: mining more candidate genes and possible regulatory network. Front. Plant Sci. 11:1091. doi: 10.3389/fpls.2020.01091
Ya-Wen, Z., Pei, L., and Yuan-Ming, Z. (2019). mrMLM.GUI: Multi-Locus Random-SNP-Effect Mixed Linear Model Tools for Genome-Wide Association Study with Graphical User Interface. R Package Version 4.0.
Zhang, J., Feng, J. Y., Ni, Y. L., Wen, Y. J., Niu, Y., Tamba, C. L., et al. (2017). PLARmEB: Integration of least angle regression with empirical Bayes for multilocus genome-wide association studies. Heredity 118, 517–524. doi: 10.1038/hdy.2017.8
Zhang, J., Song, Q., Cregan, P. B., Nelson, R. L., Wang, X., Wu, J., et al. (2015). Genome-wide association study for flowering time, maturity dates and plant height in early maturing soybean (Glycine max) germplasm. BMC Genomics 16:217. doi: 10.1186/s12864-015-1441-4
Zhang, K., Fan, G., Zhang, X., Zhao, F., Wei, W., Du, G., et al. (2017). Identification of QTLs for 14 agronomically important traits in Setaria italica based on SNPs generated from high-throughput sequencing. G3 7, 1587–1594. doi: 10.1534/g3.117.041517
Zhang, Y., Liu, P., Zhang, X., Zheng, Q., Chen, M., Ge, F., et al. (2018). Multi-locus genome-wide association study reveals the genetic architecture of stalk lodging resistance-related traits in maize. Front. Plant Sci. 9:611. doi: 10.3389/fpls.2018.00611
Keywords: Phaseolus vulgaris L., GWAS—genome-wide association study, yield, genetic improvement, favorable alleles
Citation: Delfini J, Moda-Cirino V, dos Santos Neto J, Zeffa DM, Nogueira AF, Ribeiro LAB, Ruas PM, Gepts P and Gonçalves LSA (2021) Genome-Wide Association Study Identifies Genomic Regions for Important Morpho-Agronomic Traits in Mesoamerican Common Bean. Front. Plant Sci. 12:748829. doi: 10.3389/fpls.2021.748829
Received: 28 July 2021; Accepted: 15 September 2021;
Published: 07 October 2021.
Edited by:
Frédéric Marsolais, Agriculture and Agri-Food Canada (AAFC), CanadaReviewed by:
Kelvin Kamfwa, University of Zambia, ZambiaAnfu Hou, Morden Research and Development Centre, Canada
Copyright © 2021 Delfini, Moda-Cirino, dos Santos Neto, Zeffa, Nogueira, Ribeiro, Ruas, Gepts and Gonçalves. This is an open-access article distributed under the terms of the Creative Commons Attribution License (CC BY). The use, distribution or reproduction in other forums is permitted, provided the original author(s) and the copyright owner(s) are credited and that the original publication in this journal is cited, in accordance with accepted academic practice. No use, distribution or reproduction is permitted which does not comply with these terms.
*Correspondence: Leandro Simões Azeredo Gonçalves, bGVhbmRyb3NhZ0B1ZWwuYnI=