 Keisuke Tasaki1†
 Aiko Watanabe1
 Keiichirou Nemoto1Shigekazu Takahashi1Fumina Goto1Nobuhiro Sasaki1†Takashi Hikage2
 Masahiro Nishihara1*
- 1Iwate Biotechnology Research Center, Kitakami, Japan
- 2Hachimantai City Floricultural Research and Development Center, Hachimantai, Japan
Gentians cultivated in Japan (Gentiana triflora and Gentiana scabra and hybrids) have blue flowers, but flower colour intensity differs among cultivars. The molecular mechanism underlying the variation in flower colour intensity is unclear. Here, we produced F2 progeny derived from an F1 cross of intense- and faint-blue lines and attempted to identify the genes responsible for flower colour intensity using RNA-sequencing analyses. Comparative analysis of flower colour intensity and transcriptome data revealed differentially expressed genes (DEGs), although known flavonoid biosynthesis-related genes showed similar expression patterns. From quantitative RT-PCR (qRT-PCR) analysis, we identified two and four genes with significantly different expression levels in the intense- and faint-blue flower lines, respectively. We conducted further analyses on one of the DEGs, termed GtMIF1, which encodes a putative mini zinc-finger protein homolog, which was most differently expressed in faint-blue individuals. Functional analysis of GtMIF1 was performed by producing stable tobacco transformants. GtMIF1-overexpressing tobacco plants showed reduced flower colour intensity compared with untransformed control plants. DNA-marker analysis also confirmed that the GtMIF1 allele of the faint-blue flower line correlated well with faint flower colour in F2 progeny. These results suggest that GtMIF1 is one of the key genes involved in determining the flower colour intensity of gentian.
Introduction
Flower colour is one of the most important traits in ornamental plants. Consumers prefer a variety of flower colours; therefore, breeders are continually striving to produce novel varieties with different colours. In most cases, new varieties are produced by conventional cross-breeding and repeated selections, but several techniques, such as mutation, transgenes, and molecular markers, are also useful (Yi Li, 2006; Nishihara and Nakatsuka, 2010; Singh, 2014; Zhao and Tao, 2015; Noman et al., 2017). Typical biotechnological products are transgenic roses and carnations with a modified bluish flower colour, which does not exist in nature. These varieties have been commercially available for over a decade. Development of blue chrysanthemum has also been achieved by genetic engineering (Noda, 2018), although commercial use has not yet been approved owing to government GMO regulations. More recently, genome editing technologies have been developed, including the CRIPSR/Cas9 system, which has been used to alter flower colour in several plant species, including morning glory (Watanabe et al., 2017, 2018), torenia (Nishihara et al., 2018a), and petunia (Yu et al., 2021).
Colour intensity is another aspect of flower colour. Even if the same pigments accumulate in flower petals, the amounts of accumulated pigment greatly affect the flower colour visible to the human eye. Faint colours are preferable in some cases, while intense colour may be preferred in others. Intermediate colour may also be required in some situations. Therefore, breeding efforts have focused on flower colour intensity and cultivars with varying degrees of flower colour intensity are produced for most ornamental plants. Scientists have been trying to elucidate the mechanisms of flower colour variations for many years. The main flower pigments are flavonoids, carotenoids, and betalains (Tanaka et al., 2008; Ohmiya, 2011; Polturak and Aharoni, 2018). The former two are widely distributed in the plant kingdom and responsible for not only flower colour but also for the colour of various organs, including the leaves, stems, roots, and fruits. Betalains are restricted to the order Caryophyllales and are responsible for colouration of various organs (Polturak and Aharoni, 2018). Each biosynthetic pathway has been well characterised, and most genes involved in the biosynthesis of these pigments have already been identified.
In Japan, cultivated gentians (Gentiana triflora and Gentiana scabra and their hybrids; Japanese gentian from hereon) have been used extensively as cut flowers and potted plants for ornamental purposes for more than half a century (Kodama, 2006; Nishihara et al., 2018b). The wild-type flower colour of Gentiana species is blue, and the main pigment responsible for that colour is a delphinidin-based polyacylated anthocyanin, gentiodelphin (Goto et al., 1982). Using natural flower colour mutants as breeding materials, pink- and white-flowered cultivars have been produced (Nishihara et al., 2018b). A pink-flowered gentian has also been produced using ion beam irradiation (Sasaki et al., 2018), and red-flowered gentian cultivars have been produced using the embryo rescue technique (Eason et al., 2007). Recently, we clarified that the co-pigmentation effects of novel xanthones on cyanidin 3-O-glucoside contributed to vivid red flower colour (Sasaki et al., 2021). Colour patterns can also enhance the ornamental value of flowers. In gentian, we recently revealed that a striped bicolour phenotype resulted from post-transcriptional gene silencing of the chalcone synthase gene (CHS; Ohta et al., 2021). Chlorophyll also contributes to formation of the green colour of ornamental flowers; uniquely, gentian flowers have green spots consisting of functional chloroplasts in restricted areas of epidermal cells (Takahashi et al., 2020).
Among these flower colour variations, blue is the most popular and comprises more than 80% of gentian production in Iwate prefecture, Japan. The blue colour varies from faint purple to dark blue, depending on the cultivar. Most flavonoid biosynthetic genes and their regulatory genes have been identified in gentian (Nishihara et al., 2018b). Using genome-editing technology targeting anthocyanin-modifying enzymes, such as glucosyltransferase and acyltransferase, we confirmed that these enzymes were indispensable for gentiodelphin production and contributed to the deep, vivid blue flower colour in planta (Tasaki et al., 2019). More recently, we also identified a glutathione S-transferase (GST1) gene involved in transporting anthocyanin into the vacuole in Japanese gentian (Tasaki et al., 2020). The accumulated anthocyanin is the main factor determining flower colour in gentian.
Flower colour is affected not only by pigment quality (the types of accumulated pigments), but also pigment quantity (the amounts of accumulated pigments). Several studies have attempted to elucidate the regulatory mechanism(s) of flower colour intensity in floricultural plants. For example, Ohno et al. (2013) revealed that a basic helix–loop–helix transcription factor, DvIVS, determines flower colour intensity in cyanic dahlia cultivars. In Cymbidium orchids, the diversity of flower colour intensities and patterning is derived from subtle variations in the concentration and pattern of pigment accumulation via temporal and spatial regulation of anthocyanin biosynthesis (Wang et al., 2014). Transcriptome analysis of Paeonia ostia suggested that differential expression of genes encoding anthocyanin repressors was the main factor responsible for flower colour intensity (Gao et al., 2015). However, there are no scientific studies of flower colour intensity in Japanese gentian, and the mechanism(s) regulating intensity is unknown. Thus, in the present study we attempted to identify the genes responsible for flower colour intensity in Japanese gentian. For this purpose, F2 progenies, derived by crossing F1 lines with intense- and faint-blue flowers, were subjected to transcriptome analysis using RNA-sequencing. Of the differentially expressed genes (DEGs) between intense and faint-blue flowers, we focused on a putative mini zinc-finger (MIF) protein homolog, termed GtMIF1, which showed the greatest difference in expression between faint and intense-blue flowers and performed functional analysis using stable tobacco transformants. We also developed a DNA marker and performed validity tests using F2 plants. The results suggest that GtMIF1 is involved in the regulation of flower colour intensity in Japanese gentian. Furthermore, the novel biological function of GtMIF1 would contribute in gaining insight into the functional roles of this protein family in higher plants.
Materials and Methods
Plant Materials
In this study, we used G. triflora double haploid (DH) lines produced by unfertilised ovule culture (Doi et al., 2013). For development of progeny segregated by flower colour intensity, ‘Ashiro-no-Hatsuaki’-derived DH line (AH), with intense-blue flowers, and ‘Matsuo’-derived DH line (Mat), with faint flowers, were used to produce F1 line (26-852) (Figure 1). The F2 progeny line (27-867) was produced by self-pollination of one F1 progeny line (26-852-20). All seedlings were grown in cell trays at Hachimantai City Floricultural Research and Development Centre and moved to Iwate Biotechnology Research Centre for flowering. Transplanted potted F2 seedlings were cultivated in a closed glass greenhouse maintained at 22°C–27°C under natural sunlight with supplementary lighting with halogen lamps for forcible induction of flowering in the first year. For production of reliable reference sequences, the ‘Iwate-Otome’-derived DH line (IO) and F1 line 26-850 (AH × IO) were also used for de novo assembly.
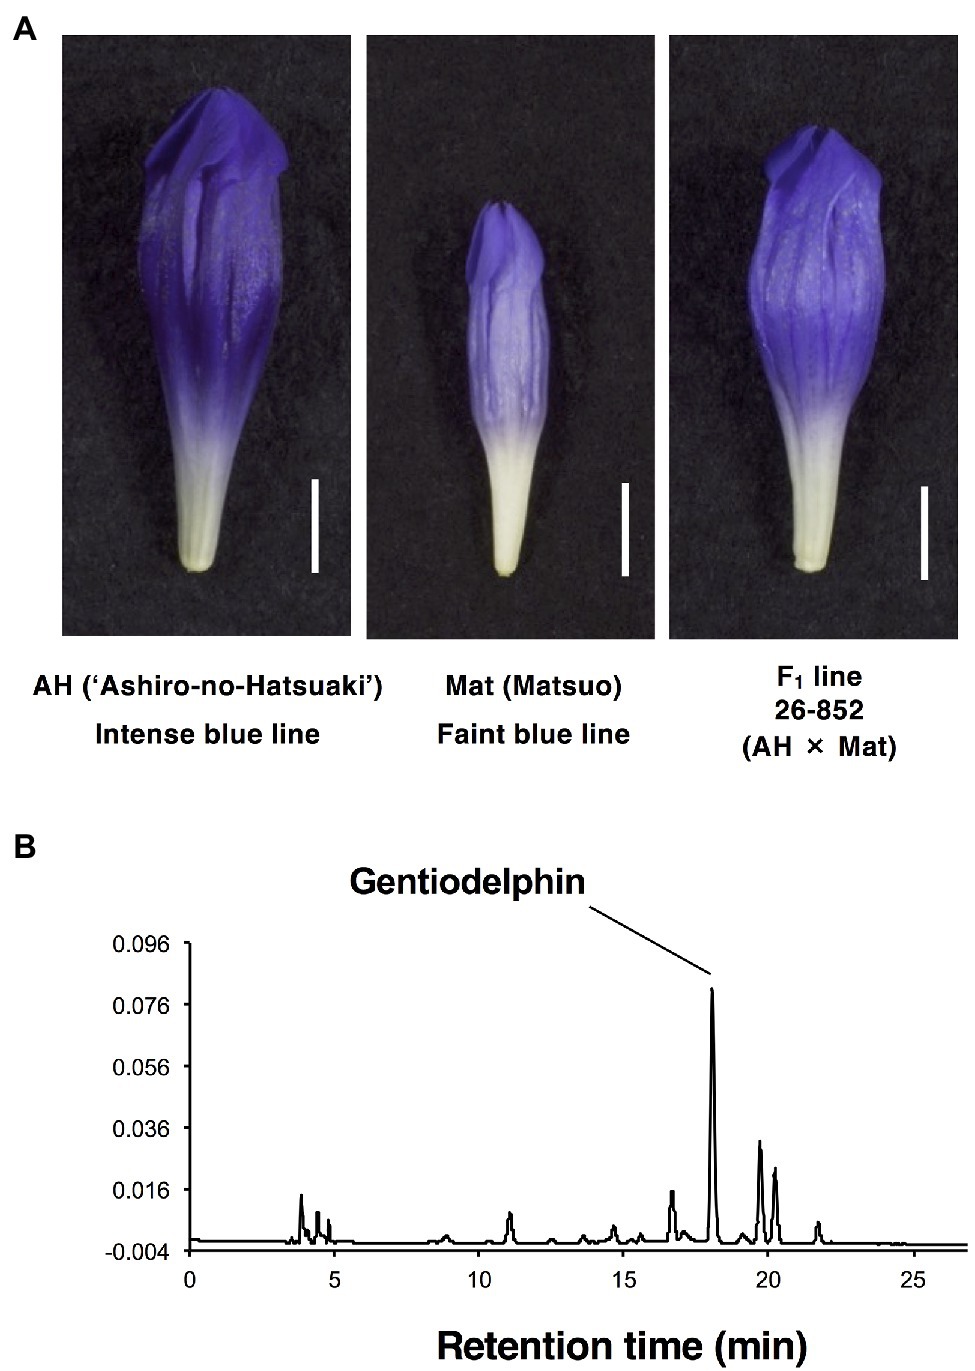
Figure 1. Flower phenotypes of parents and F1 used for crossing in this study. (A) AH, intense-blue doubled haploid line 26-853_Go1230 in gentian cultivar ‘Ashiro-no-Hatsuaoi’. Mat, faint-blue flower line 24-2007MAR7-Go5 doubled haploid. F1 line 26-852 (AH x Mat). (B) Chromatogram of anthocyanin pigment extracts from petals of the AH line at 520 nm.
Analysis of Flower Petal Colour Intensity
For evaluation of flower colour intensity, the colorimetric value L*, which indicates the lightness of the adaxial surface of the limb area of fresh petals at anthesis, was measured using a CM-3600A spectrophotometer (Konica Minolta, Tokyo, Japan) as described previously (Tasaki et al., 2019).
Analysis of Accumulated Pigments in Flower Petals
The anthocyanin composition and content of petal extracts from parents, F1 and F2 progeny were analysed using high-performance liquid chromatography (HPLC). Fresh petals from the first opened flower of each plant were collected and stored at −80°C until use. The cryopreserved petals were immediately soaked in 80% methanol containing 0.1% (v/v) trifluoroacetic acid for 24 h to extract the anthocyanins, filtered using a spin column, and then separated with an HPLC–photodiode array detector system (L-2455 Diode Array Detector, AS-4010 Auto sampler and D-2000 Elite chromatography DATA station, Hitachi High-Technologies, Tokyo, Japan; LC-20AT pump, Shimadzu Co., Kyoto, Japan) equipped with an ODS column (inner diameter 4.6 × 250 mm; Wakopak Handy ODS, Wako Pure Chemical Industries, Ltd., Osaka, Japan) using a linear gradient elution (1 ml min−1) of 10%–40% acetonitrile in 1.0% aqueous phosphoric acid for 30 min.
Selection of DEGs Between Intense- and Faint-Blue Gentian Lines by RNA-Sequencing
Total RNAs were extracted from the petals and leaves using an RNeasy Plant Mini Kit (Qiagen, Hilden, Germany). RNA-sequencing (RNA-seq) steps, mRNA purification from the total RNA, library construction, and Illumina paired-end sequencing on the NextSeq 500 system (150 bp, paired-end; Illumina Inc., San Diego, CA, United States) are summarised in Supplementary Table S1. All RNA-seq libraries were constructed independently from each RNA extract of the plant tissues. Raw sequence reads were pre-processed using a FASTX toolkit. De novo assembly for development of a reference for transcriptome analysis was performed using Trinity (v2.1.1) with parameter ‘--min_contig_length 500’. This reference was constructed using preprocessed sequence reads of petals in floral development stages S1–S4 of the G. triflora lines, AH, Mat, and F1 line 26-852, ‘Iwate-Otome’ DH (IO), AH × IO F1 line 26-850, and that of fresh leaf of AH and Mat lines. Obtained contigs were annotated using blastx v2.2.26 (uniprot_sprot) and blastn v2.2.26 (nr) on Maser (Management and Analysis System for Enormous Reads; Kinjo et al., 2018). The summary of the results of de novo assembly and annotation is shown in Supplementary Table S2.
Two types of expression profiles for DEG analysis were constructed using RNA-seq reads of the petals of the first one just-opened flower of five F2 intense-blue lines (27-867-048, 27-867-060, 27-867-030, 27-867-003, and 27-867-067) and five F2 faint-blue lines (27-867-056, 27-867-077, 27-867-008, 27-867-087, and 27-867-076), and the petals of floral development stages S1–S4 of AH and Mat, respectively. FPKM values among these samples were estimated using RSEM software (v1.5.3; Li and Dewey, 2011), with the reference constructed by de novo assembly consisting of 148,061 contigs. To identify DEGs between the two F2 groups (intense- and faint-blue flower lines), a Trimmed mean of M-values (TMM) software (Robinson et al., 2010; Robinson and Oshlack, 2010) was first used to normalise the FPKM values among the F2 samples; then, NOISeq software (Tarazona et al., 2011, 2015) was used with the expression profiles of five individual plants from each F2 intense- and faint-blue lines as biological replicates. In this analysis, 7,110 annotated contigs with high expression levels were used as the target genes from 148,061 contigs. Normalisation of the FPKM values of the petals of S1–S4 of AH and Mat was also performed using the TMM software.
Quantitative RT-PCR Analysis of Gentian
Total RNAs were extracted from representative F2 individuals of each intense- and faint-blue flower line. Quantitative RT-PCR (qRT-PCR) was performed using the QuantStudio 3 Real-Time PCR system, as described previously (Sasaki et al., 2021). Relative expression levels of two IBGs and four FBGs were determined. GtUBQ was used as an internal standard.
Cloning of GtMIF1
To isolate GtMIF1-1 and GtMIF1-2, total RNAs were extracted from flowers of F2 line plants that showed lower L* values, using an RNeasy Plant Mini Kit (Qiagen). For synthesising first-strand cDNA, 100 ng of total RNA was reverse transcribed using the ReverTra Ace qPCR RT Master Mix with gDNA Remover kit (Toyobo Co., Ltd., Osaka, Japan) according to the manufacturer’s instructions. The open reading frame (ORF) of GtMIF1-1 and GtMIF1-2 was amplified by PCR using PrimSTAR max DNA Polymerase (Takara Bio Inc., Shiga, Japan) and synthesised cDNA as a template. The DNA fragments were cloned into pDONR221, and the sequences were confirmed. Primer sets for cloning are shown in Supplementary Table S3.
Production and Phenotype Analysis of Tobacco Transformants Overexpressing GtMIF1
To overexpress GtMIF1, cDNA containing an ORF was amplified using primers, GtMIF1Start (Xba I) and GtMIF1Stop (Sac I) using TaKaRa PrimeSTAR GXL DNA Polymerase and was subcloned into PCR-BluntII TOPO (Invitrogen, Carlsbad, CA, United States). The sequence was confirmed using the ABI PRISM 3500 Genetic Analyser (Applied Biosystems, Foster City, CA, United States). The GtMIF1 fragment was cut out from the cloning vector and ligated into the XbaI and SacI sites of a binary vector, pSKAN35SGUS (Nakatsuka et al., 2012) to replace GtMIF1 with GUS. To enhance expression, Arabidopsis ADH enhancer and terminator were inserted, resulting in pSKAN35SGtMIF1. The binary vector was transformed into Agrobacterium tumefaciens strain EHA101 by electroporation. Tobacco transformation and selection of T1 plants were performed as follows. Seeds of Nicotiana tabacum cv. SR1 were aseptically sown and grown for approximately 1 month on solidified Murashige and Skoog (MS) medium supplemented with 3% sucrose in a plastic box. Leaf sections were prepared and inoculated overnight with bacterial solution and co-cultivated for 2 days. Leaf sections were transferred to regeneration medium (solidified MS medium supplemented with 3% sucrose, 1 mg/L BAP, and 0.1 mg/L NAA) containing 100 mg/L kanamycin and 300 mg/L carbenicillin. Kanamycin-resistant shoots were excised from leaf sections and transferred to rooting medium (solidified MS medium supplemented with 3% sucrose) containing 100 mg/L kanamycin and 300 mg/L carbenicillin. Rooted plants were acclimatised and grown in a closed greenhouse until flowering. T1 seeds were produced by selfing of each T0 plant. Obtained T1 seeds were sown on MS medium supplemented with 3% sucrose and 100 mg/L kanamycin. Kanamycin-resistant seedlings were acclimatised, and plant phenotypes were observed in a closed greenhouse.
Quantitative RT-PCR Analysis of Tobacco Plants
Total RNAs were extracted using an RNeasy Plant Mini Kit (Qiagen) from flowers of three T1 lines and the untransformed control, SR1. They were subjected to qRT-PCR analysis as described above. Introduced foreign GtMIF1 and endogenous gene expression levels, including NtCHS, NtFLS, NtANS and transcription factors, NtAn1a, NtAn1b and NtAn2, were calibrated using UBQ gene expression as an internal standard. A minimum of five flowers were used for this analysis. All primers used are listed in Supplementary Table S3.
Development of Molecular DNA Markers for GtMIF1
To assess whether MIF1 inheritance and flower colour intensity were correlated, PCR-based markers to distinguish the presence of the GtMIF1 allele in faint-blue flower lines were applied to the F2 progeny. Because the F2 individuals used for the RNA-seq analysis died during the experiment, we sowed new seeds of F2 progeny from the same plant of F1 line (26-852-20) and analysed their flower colour intensity by spectrophotometer for 2 years. DNA was extracted using a GenElute plant genomic DNA miniprep kit (Sigma-Aldrich, St. Louis, MO, United States) from leaves of each F2 progeny and subjected to PCR analysis. GtMIF1 specifically amplifying the faint-blue MIF1 allele was designed from the gentian draft genome (unpublished) and used for this analysis. Primer sets are shown in Supplementary Table S3. PCR was performed using MightyAmp DNA Polymerase Ver.3 (Takara Bio) according to the manufacturer’s instructions. Analysis of PCR products was performed using 1.6% agarose gel electrophoresis.
Results
Inheritance of Flower Colour Intensity in F2 Progeny in Gentian
The appearance of flowers of AH, Mat, and their F1 line (26-852) can be seen in Figure 1A. AH has a more intense colour than Mat, and the F1 progeny shows intermediate colour intensity. Other F1 progeny showed a similar colour intensity to line (26-852). In contrast, F2 progeny showed various degrees of colour intensity. The HPLC profile of petal extracts (520 nm) from these samples showed one major peak for gentiodelphin and its intermediate metabolites. The typical result of AH is shown in Figure 1B. Based on these peak areas, the total anthocyanin and gentiodelphin contents in parental lines, AH (five plants), and Mat (eight plants), F1 line 26-852 (four plants), and F2 line 27-867 (78 plants) were estimated and are shown in decreasing order of total anthocyanin content (Figure 2A). The total anthocyanin content of AH flowers was, on average, 2.7-fold greater than that of Mat flowers. The total anthocyanin content of the F1 plants was intermediate between that of AH and Mat. F2 plants showed a range of anthocyanin contents that fell between the values for AH and Mat. The difference between the highest (27-867-012) and lowest (27-867-079) anthocyanin content in F2 plants was 4.7-fold. The gentiodelphin content (Figure 2A, blue bars) of F2 plants did not match perfectly with the total anthocyanin content, but showed a similar overall order.
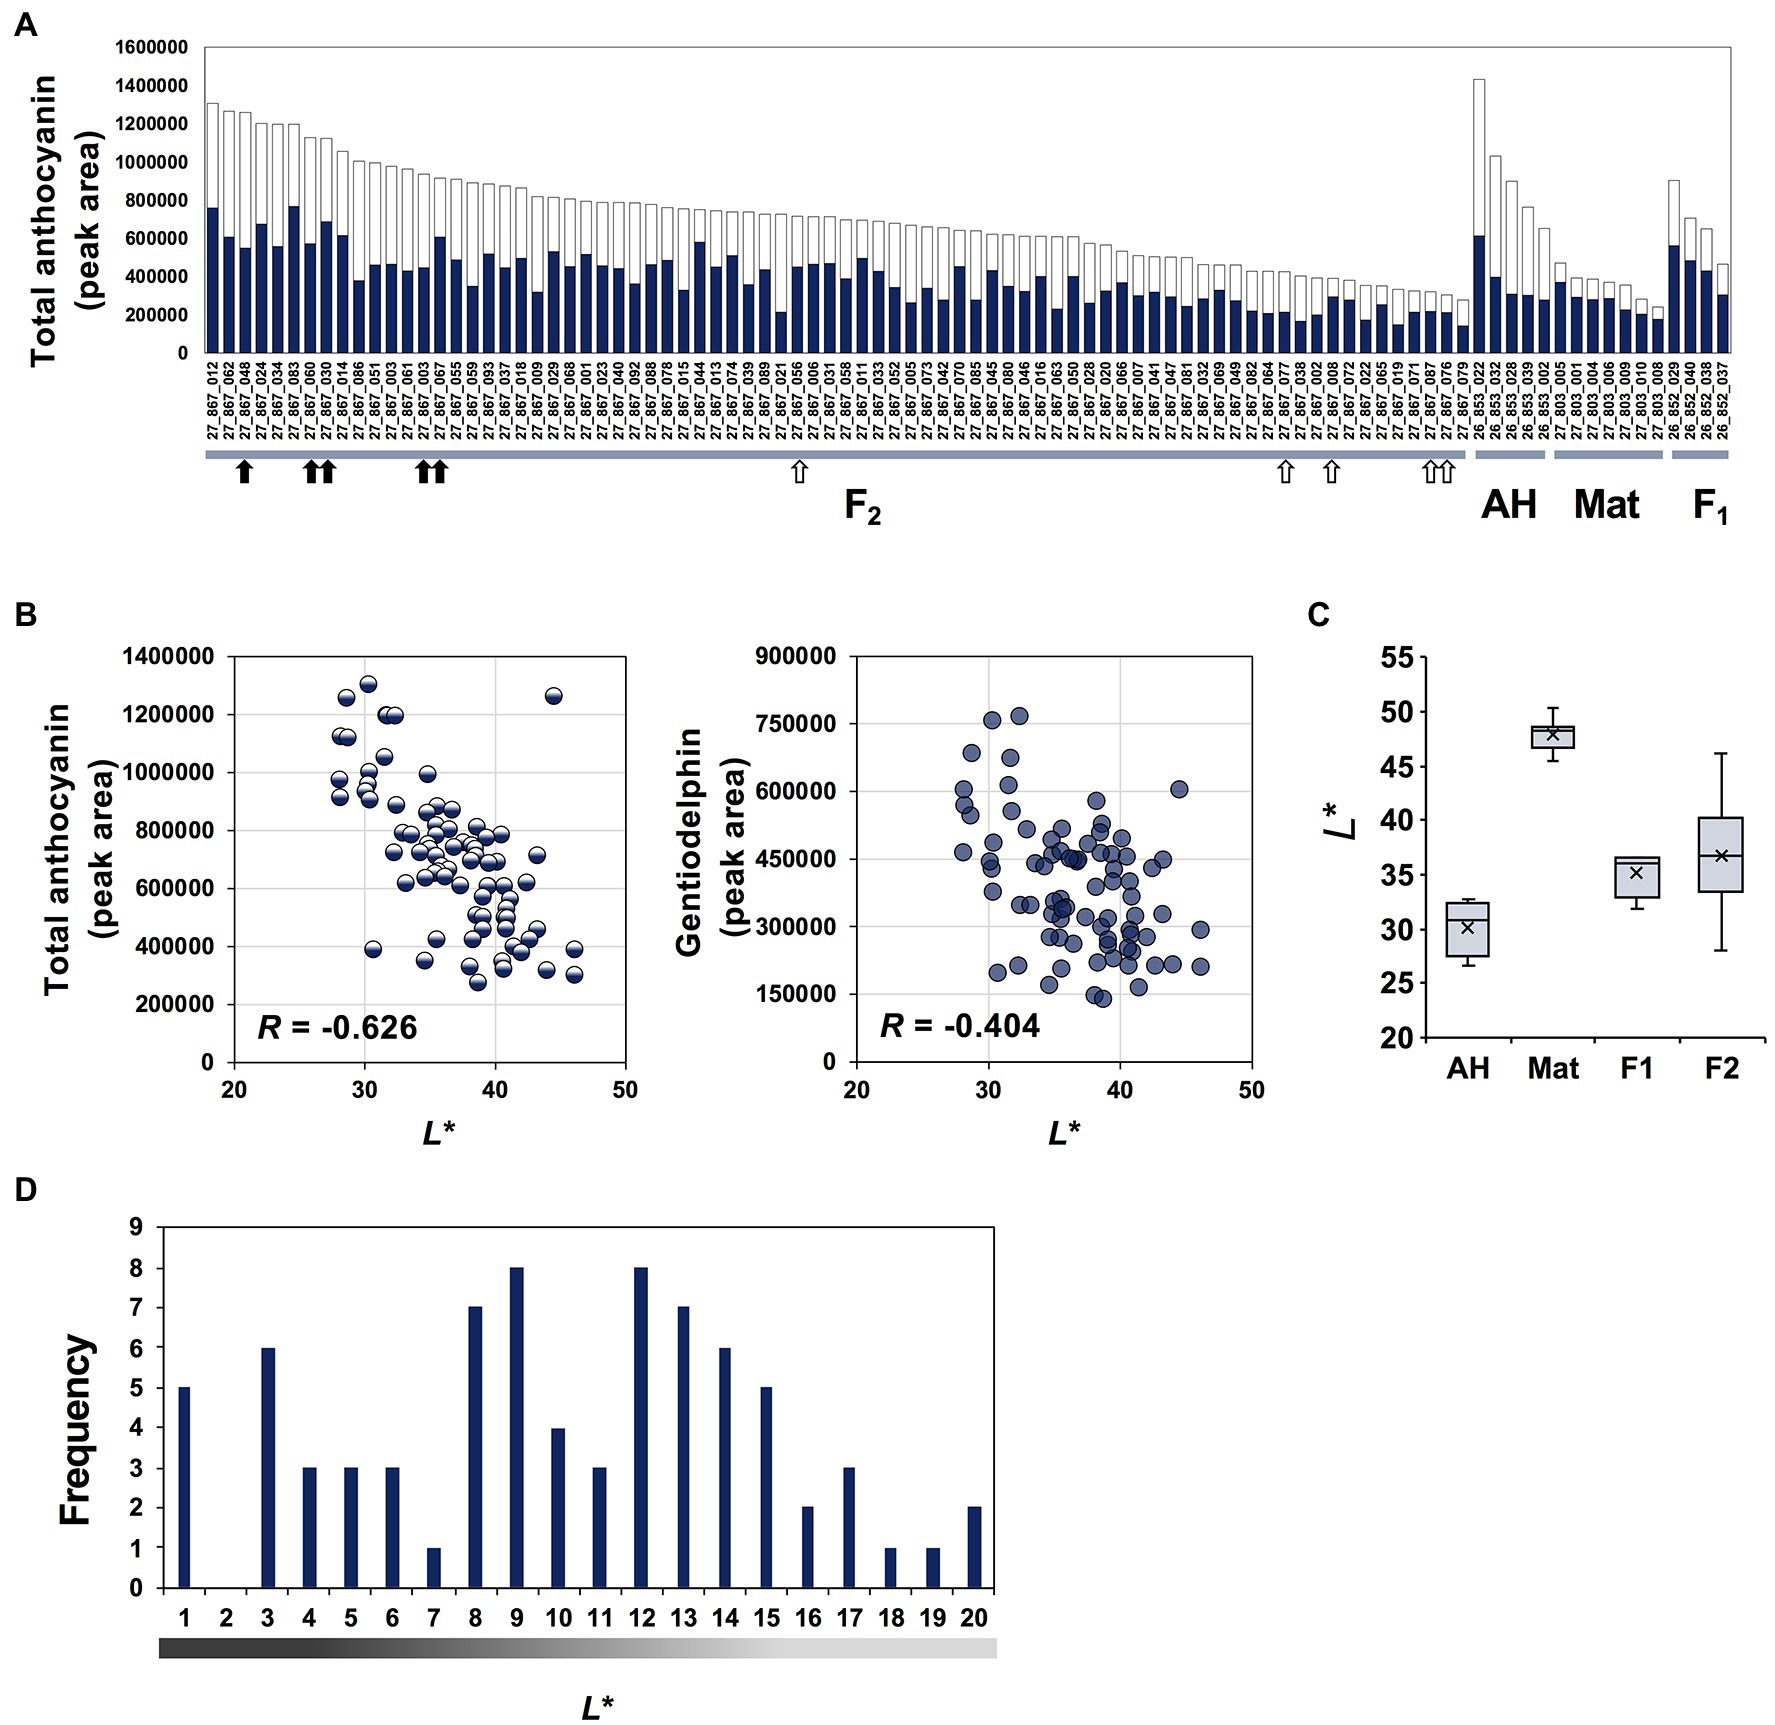
Figure 2. Anthocyanin content and L* values for parents, F1 and F2 progeny. (A) Total anthocyanin content estimated from high-performance liquid chromatography peak area. Five AH, seven Mat, four F1 progenies 26-852 (AH × Mat), and 78 F2 progenies 27-867 are shown. Bar colour indicates peak areas of gentiodelphin (blue) and other anthocyanins (white). Black and white arrows indicate lines of the intense- and faint-blue flower groups subjected to RNA-seq analysis, respectively. (B) Plots of L* values and total anthocyanin or gentiodelphin contents. (C) Box plot of L* values of parental lines, F1 and F2 progeny. (D) Histogram of F2 plants. L* values representing flower colour intensity are separated into 20 steps.
Next, to objectively evaluate flower colour intensity, colorimetric measurement was performed on each flower petal. We used L* values of the CIELAB colour space, which represents the darkness or lightness of the colour (black = 0 and white = 100), to quantify the visible flower colour intensity. L* values corresponded well with visual observations of flower colour intensity. L* values showed stronger correlations (R = −0.626) with total anthocyanin content than with gentiodelphin content (R = −0.404; Figure 2B), but both contributed to flower colour intensity. Box plots of L* values of AH, Mat and their F1 and F2 seedlings are shown in Figure 2C. Compared with the L* values of AH (average 30.08) and Mat (average 47.88), those of F1 were intermediate and closer to AH. F2 seedlings showed a wide range of intensities (range 28.07–46.08). The frequency distribution of L* values among the 78 plants in F2 27-867 is shown in Figure 2D. Among these F2 plants, five that showed lower L* values (27-867-048, 27-867-060, 27-867-030, 27-867-003, and 27-867-067) and five that showed higher L* values (27-867-056, 27-867-077, 27-867-008, 27-867-087, and 27-867-076) were selected for additional RNA-seq analysis. Flowers of these lines are shown in Supplementary Figure S1.
Construction of Reference Sequence and Selection of DEGs Between Intense- and Faint-Blue Flowers Using RNA-Seq Analysis
As a result of RNA-sequencing for reference construction based on petals and/or leaves of AH, Mat, 26-852, IO and 26-850, a total of 743,968,608 high-quality 75–130 base length reads (83.4% of the raw data) were obtained. The reference was constructed using Trinity software and consisted of 148,061 contigs (annotated 50,948 contigs), showing N50 = 1,519 bp (Supplementary Table S2). These contigs were used as a reference for the construction of two types of expression profiles. All the raw sequence data for reference construction were registered to the DDBJ DRA database (accession no. DRA010021).
As a result of RNA-sequencing of S4 petals of each of the five F2 intense- and faint-blue flower lines, 6,595,446 high-quality, 75–130 base length reads (81.3% of the raw data) were obtained. All the raw sequence data of the F2 lines were registered to the DDBJ DRA database (accession no. DRA013625). Using these data and the reference described above, normalised expression profiles of the F2 lines were constructed using the RSEM and TMM softwares. Conversely, the normalised expression profiles of S1–S4 petals in AH and Mat were constructed using their 8,777,392 high-quality 75–130 base length reads (76.1% of the raw reads) by the method described above. All the raw sequence data were registered to the DDBJ DRA database (accession no. DRA014102). Information regarding RNA-sequencing, such as raw reads, processed reads, and accession, is summarised in Supplementary Table S1.
Then, we attempted to obtain DEGs between faint- and intense-blue flower lines. The screening procedure for DEGs based on the normalised expression profiles is summarised in Figure 3A. From 50,948 annotated contigs, 7,110 that showed high expression levels in F2 lines were selected. Using these, NOISeq analysis was performed and 334 contigs that satisfied the condition of values >0.8 were selected (Figure 3B). Although the NOISeq screening described above was performed using S4 petals of F2 progenies, in the next screening, S1–S4 total expression values of petals in AH and Mat were confirmed to consider the entire period of flower development.
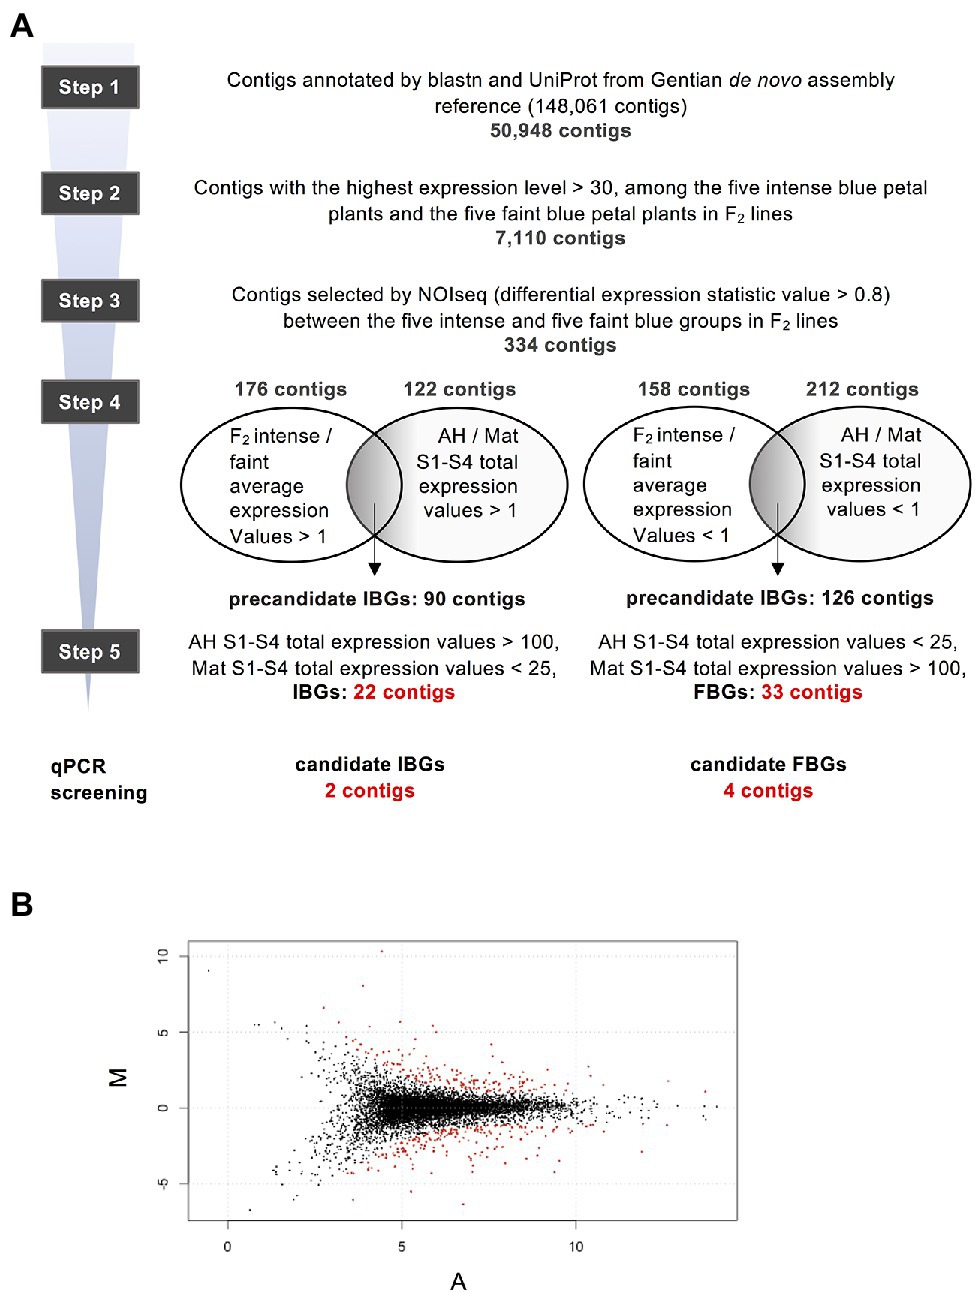
Figure 3. Schematic of screening procedure of differential expression genes (DEGs). (A) Screening procedures of the DEGs. (B) MA-plot of 7,110 contigs in step 2. Red plots are 334 contigs of differentially expression genes selected from the probability of differential expression estimated using NOISeq analysis (Tarazona et al., 2015), with parameter q > 0.8.
There were 176 contigs that satisfied the condition of values >1 for the average expression levels of five intense-blue flower lines/average expression levels of the five faint-blue flower lines. Among these contigs, 90 were selected as precandidate intense-blue genes (IBGs), which satisfied the condition of values >1 for expressions levels for S1–S4-total for AH/S1–S4-total for Mat. There were 158 contigs that satisfied the condition of values <1 for the average expression levels of the five intense-blue flower lines/average expression levels of the five faint-blue flower lines. Among these, 126 contigs were selected as precandidate FBGs, which satisfied the condition of values <1 for S1–S4-total expression for AH/S1–S4-total expression for Mat.
From the precandidate 90 IBG contigs, 22 were selected as candidate IBGs using the following optional conditions: AH S1–S4 total expression value >100, Mat S1–S4 total expression value <25. In a similar fashion, from 86 precandidate contigs, 33 were selected as candidate faint-blue genes (FBGs) using the following conditions: AH S1–S4 total expression value <100, Mat S1–S4 total expression value >25. The top 10 selected contigs, for IBGs and FBGs, are shown in Table 1, and all contigs before and after the step 4 selection are shown in Supplementary Tables S4 and S5, respectively.

Table 1. List of the top 10 DEGs [intense-blue genes (IBGs) and faint-blue genes (FBGs)].
Quantitative RT-PCR Analysis of the Candidate Genes
To further narrow down the candidate genes, we performed qRT-PCR analysis for each of the top 10 IBG and FBG contigs screened by normalised expression data of RNA-seq. All contigs were expressed in the S4 petals of AH and Mat (Supplementary Figure S2). Therefore, S4 petals of the intense- and faint-blue flower groups in F2 progeny were used for qRT-PCR analysis. The designed primers are listed in Supplementary Table S3, and the screening workflow is summarised in Supplementary Table S6. The first screening was performed on each of the top 10 DEGs (Table 1) using F2 progeny of two intense-blue individuals and two faint-blue individuals. Among four patterns of the relative expression of the intense- (IB1, IB3) and faint-blue group plants (FB2, FB4) in F2 progenies, six and seven contigs that satisfied the conditions of >4.00 for IBG and <0.25 for FBG in at least three patterns were selected as candidates for IBG and FBG, respectively. In the second screening, two and five candidates for IBG and FBG were selected using Welch’s t-test (p < 0.05, n = 6) in IB and FB plants, respectively. Finally, in the third screening, two and four candidates for IBG and FBG were selected by Welch’s t-test (p < 0.05, n = 10) in 10 plants, including four more individuals added after the second screening. The expression levels of two candidate IBGs and four candidate FBGs and statistical differences between the intense- and faint-blue groups are shown in Figure 4. The two-dimensional scatter between gene expression levels and their corresponding L* values showed different spatial distributions between the intense- and faint-blue groups (Supplementary Figure S3). We selected the first ranking gene from the NOISeq analysis, FBG1, which was a homolog of the MIF protein gene GtMIF1; this was subjected to further functional analysis.
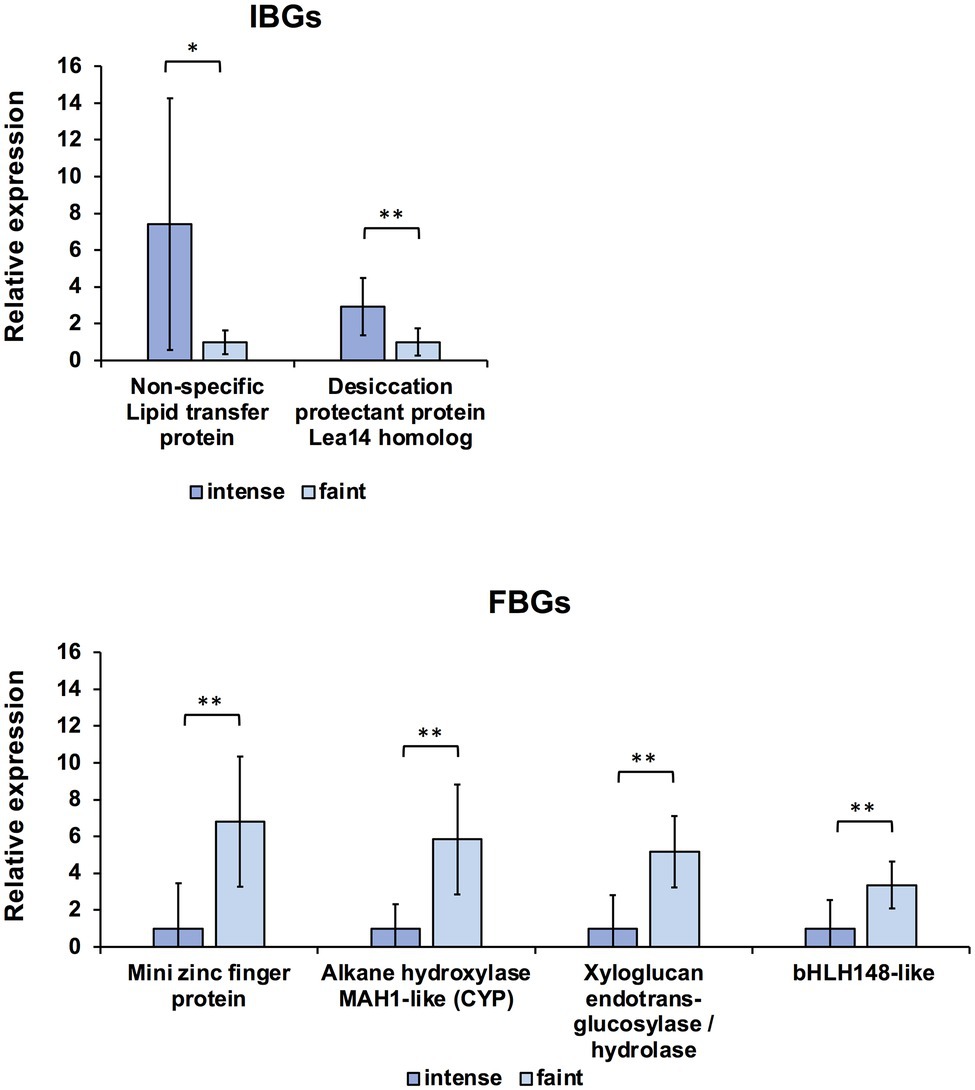
Figure 4. Quantitative RT-PCR (qRT-PCR) analysis of candidate intense-blue genes (IBGs) and faint-blue genes (FBGs) in petal stage 4 of intense- and faint-blue F2 individuals. Expression of each gene was normalised using GtUBQ as the internal control. Error bars indicate means ± SDs. * Shows statistical significance (Welch’s t-test at **p < 0.01, *p < 0.05).
Cloning of GtMIF1 and Homology Analysis
GtMIF1-1 and GtMIF1-2 were isolated from the F2 plant line that showed the lowest L* value. cDNAs of GtMIF1-1 and GtMIF1-2 have been registered in a public database under accession numbers, LC699354 and LC699355, respectively. Alignment with other plant MIF proteins shows that the deduced amino acid sequences of GtMIF1-1 and GtMIF1-2 contain a conserved zinc-finger (ZF) domain (CX3HX11CX12–26CX2CXCHX3H) in which five cysteine and histidine residues (Hu and Ma, 2006) are completely conserved (Supplementary Figure S4). GtMIF1-1 and GtMIF1-2 are considered as allelic because they have high similarity (98.3%) and were cloned from F2 progeny. The 3′-terminus and 3′-UTR of GtMIF1-1 and GtMIF1-2 was different (Supplementary Figure S5). Phylogenetic analysis, based on amino acid sequences, showed that both GtMIF1-1 and GtMIF1-2 are close to rice OsMIF3, OsMIF4, and maize ZmMIF4 (Supplementary Figure S6). In terms of dicotyledonous plants, GtMIF1-1 and GtMIF1-2 are close to cotton (GhiMIF2) and tomato (SlIMA).
Production and Phenotype Analysis of Tobacco Transformants Overexpressing GtMIF1
Japanese gentian is difficult to stably transform, except particular cultivars; therefore, we used tobacco to gain insights into the function of GtMIF1. Transgenic tobacco plants (Nicotiana tabacum L.) expressing GtMIF1 were produced via Agrobacterium-mediated transformation using the binary vector pSKAN35SGtMIF1. Eleven kanamycin-resistant lines were obtained and grown in a closed greenhouse. Some plants showed abnormal growth; 10 lines set flowers (Supplementary Figure S7A). GtMIF1 expression levels in the leaves were determined by qRT-PCR analysis. Primary transformants with strong GtMIF1 expressing lines (nos. 3–6) showed reduced growth and morphological aberrations, such as wavy leaves, and these plant lines were infertile. Flower colours tended to be lighter, except for line no. 7. Finally, seven lines set seeds by self-pollination and from these we selected three (nos. 2, 9 and 10). T1 seeds of these three lines were sown on kanamycin-containing medium, and kanamycin-resistant transgenic plants were grown in a closed greenhouse for further detailed analysis. The plants showed reduced height and slightly wavy leaves compared with untransformed WT plants (Supplementary Figure S8). The flower colours of these three lines were paler than those of WT plants (Figure 5A; Supplementary Figure S7B). To analyse the effect of GtMIF1 overexpression on tobacco flowers, we performed qRT-PCR analysis of several endogenous genes involved in flavonoid biosynthesis. GtMIF1 expression was confirmed in T1 flowers, and the expression levels were similar among the three lines. Expression levels of the structural genes (NtCHS, NtANS, and NtFLS) and transcription factor genes (NtAn2, NtAn1a, and NtAn1b) responsible for flavonoid biosynthesis in tobacco flowers were not significantly different from WT, except for NtCHS, NtANS and NtAn2 of line no. 10 (Figure 5B).
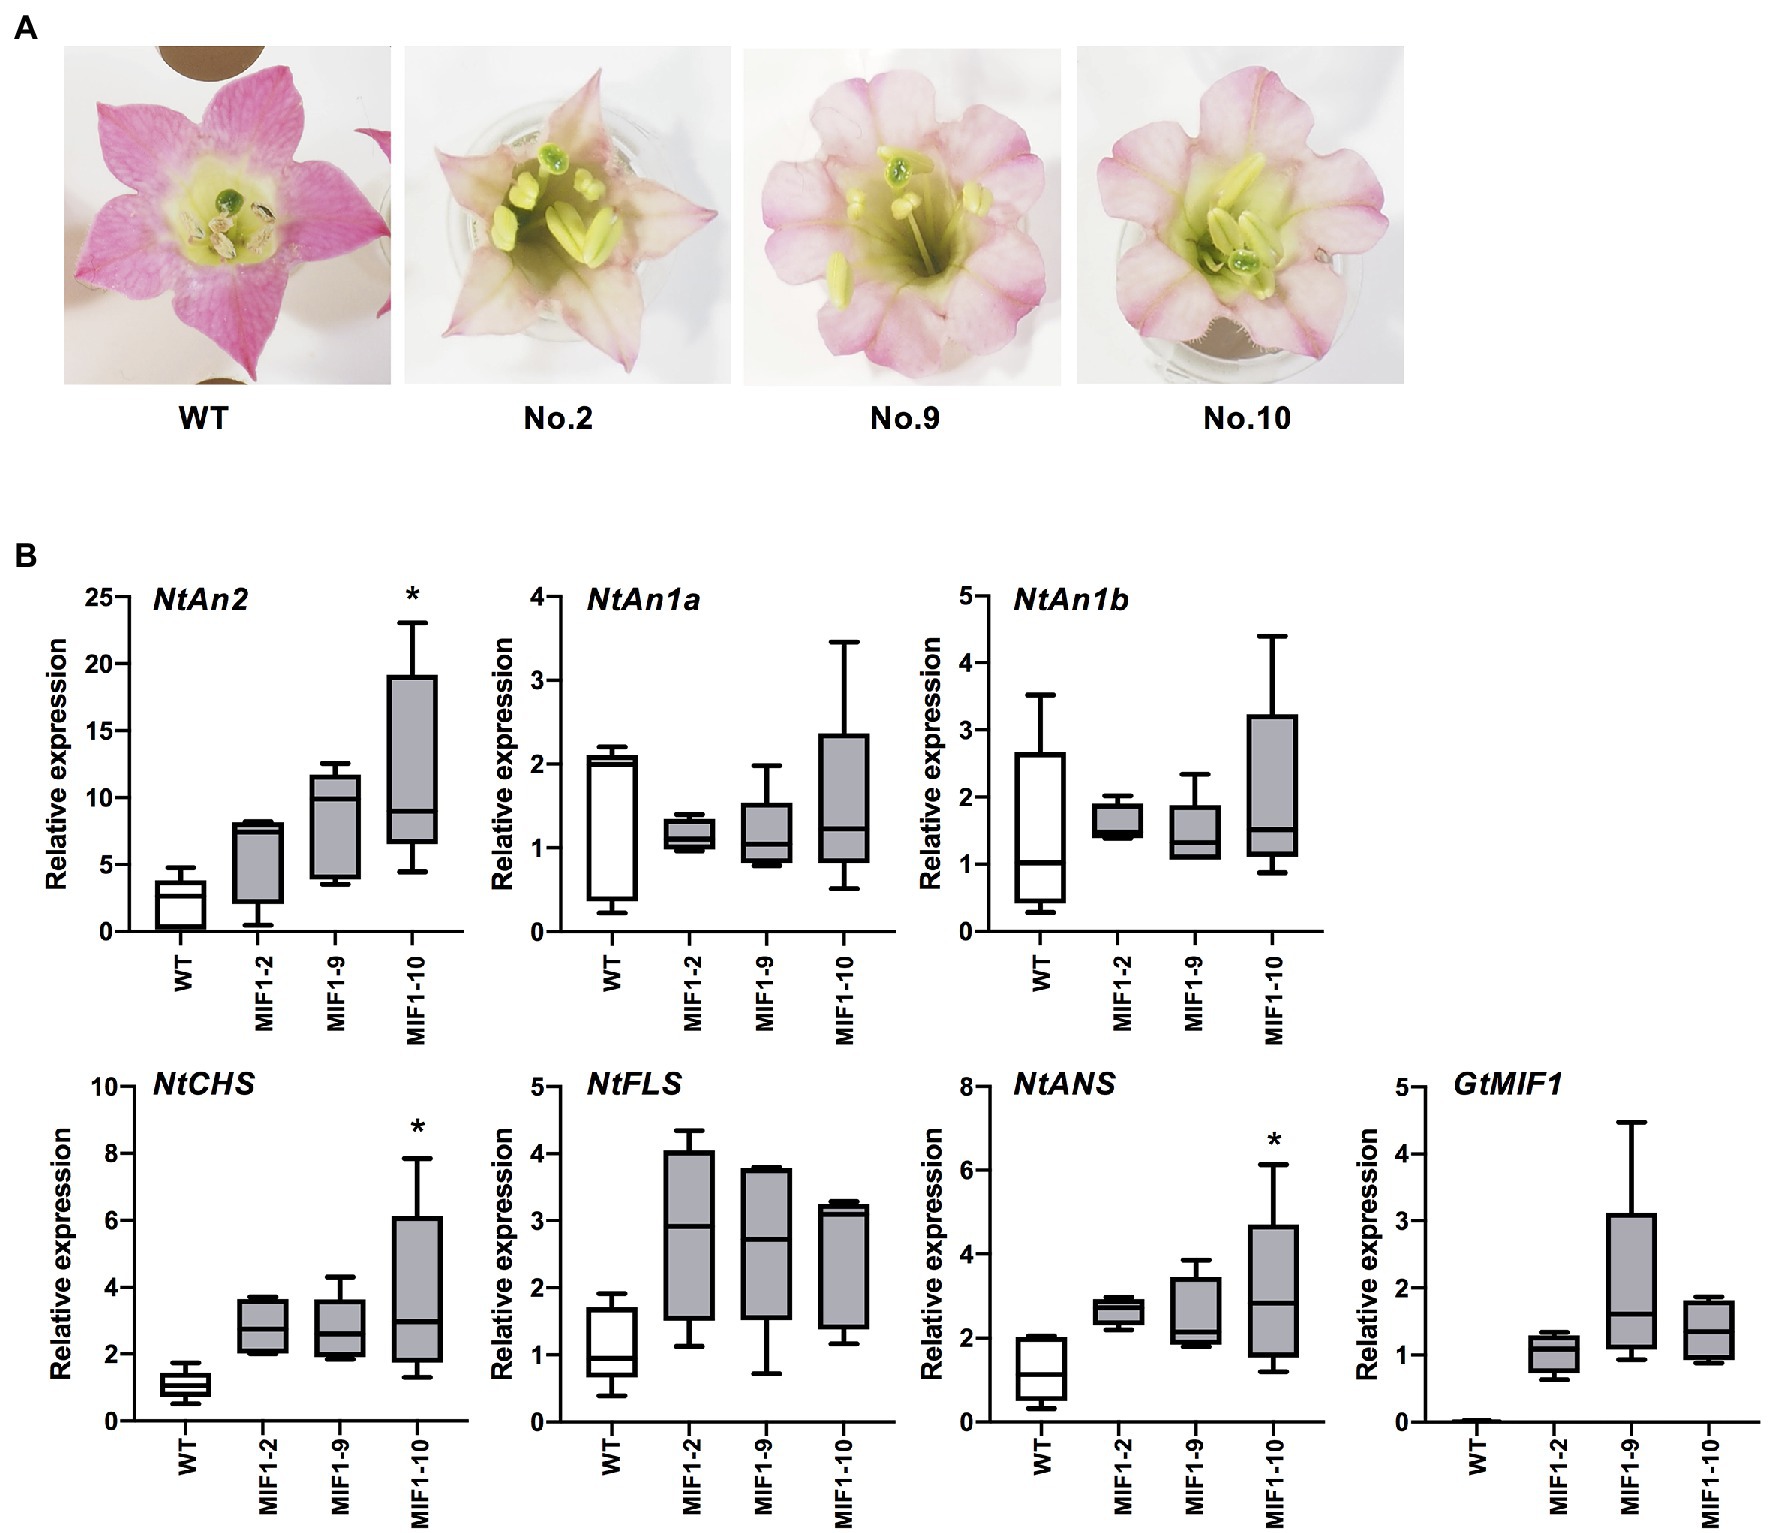
Figure 5. Transgenic tobacco plants overexpressing GtMIF1. (A) Typical flowers of WT and three T2 lines. (B) qRT-PCR analysis of flavonoid biosynthesis-related genes in petals. Relative expression levels are shown using tobacco UBQ gene as an internal reference. * Indicates a significant difference between the expression levels of GtMIF1-ox lines and those of WT (Welch’s t-test at *p < 0.05).
Analysis of Inheritance of GtMIF1 by DNA Marker and L* Value
Japanese gentians are perennial plants; therefore, we analysed the stability of flower colour intensity for 2 years. Measurement of L* values in F2 progeny indicated a strong correlation (R = 0.78) between years (Figure 6A). To analyse the relationship between flower colour intensity, represented by L*, and GtMIF1, we analysed these F2 progeny using genomic PCR targeted for GtMIF1. We designed PCR primers specifically amplifying a GtMIF allele in the faint-blue flower line. This DNA marker was amplified in individuals with both homozygous and heterozygous GtMIF1 faint alleles but was not amplified in individuals with homozygous GtMIF1 intense allele. PCR amplification was observed in 68 of the 83 individuals analysed (Figure 6B; Supplementary Figure S9), matching the expected frequency of a 3:1 segregation (chi-squared test, p < 0.05), suggesting that GtMIF1 was inherited as a single locus. The PCR amplifications were predominantly observed in individuals with faint colour intensity, except for two lines (009-70 and 009-67; Figure 6B).
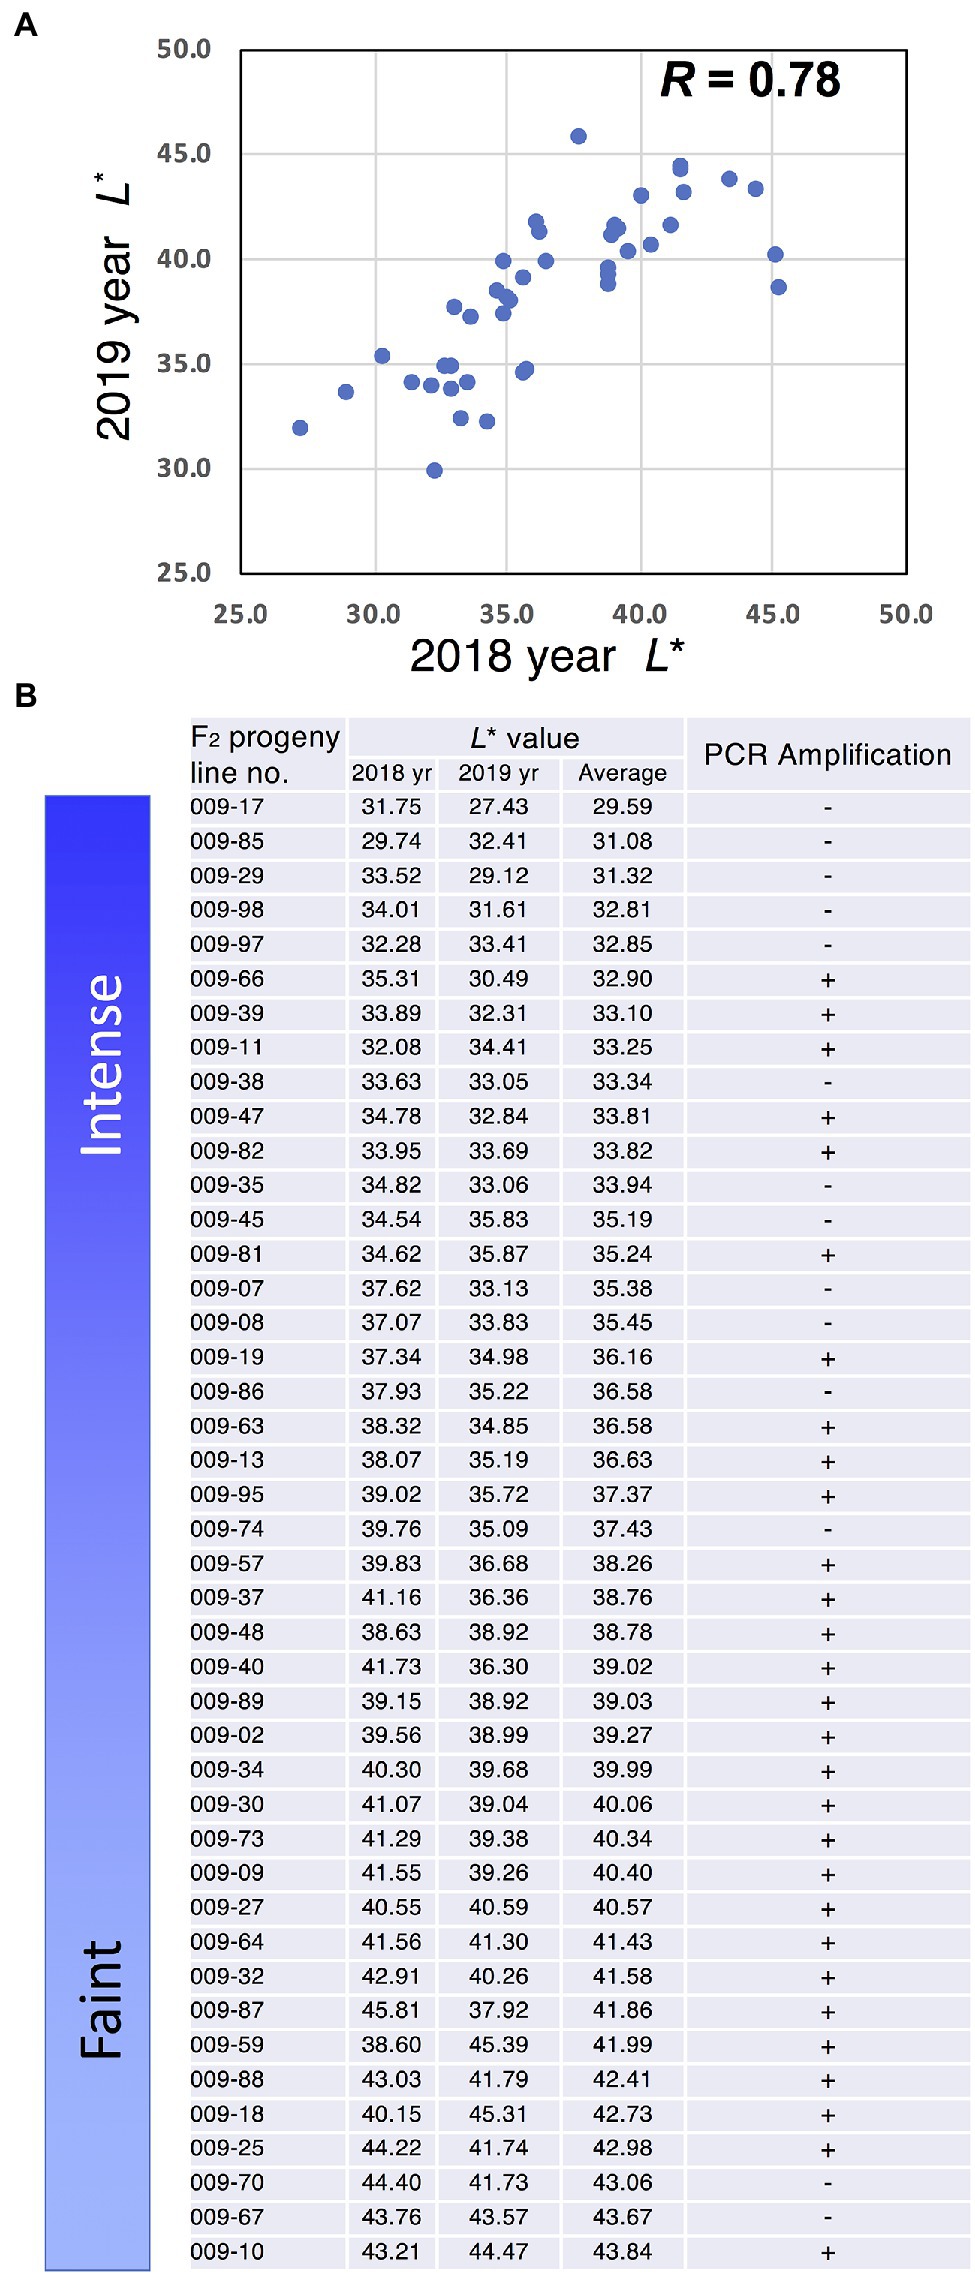
Figure 6. Relationship between GtMIF1 and L* value. (A) L* value plots for 2 years. (B) PCR analysis of the GtMIF1 allele associated with faint-blue colour in F2 progeny.
Discussion
Ornamental flowers show various flower colours such as red, blue, and yellow, determined by plant pigments such as flavonoids, carotenoids, and betalains (Tanaka et al., 2008). The main pigments differ greatly among plant species and even among cultivars. Even with the same type of pigment, flower colour shows variation. Both the quality and quantity of accumulated pigments are important for the determination of flower colour, and, in some cases, they are responsible for pattern formation.
Among the flower pigments, flavonoids are the most well known. The chemical structures of approximately 8,000 kinds of flavonoids, including coloured anthocyanins, have been characterised to date (Iwashina, 2015). Although the accumulated pigments and their biosynthetic pathways are well characterised, there are few reports on regulation of the quantity of pigments in flowers. Differences in the expression levels of structural genes are likely responsible for flower colour intensity. The underlying mechanism may be differences in the promoter of each gene or the expression levels of transcription factors responsible for the relevant genes. The MYB-bHLH-WDR complex is involved in flavonoid biosynthesis (Xu et al., 2015), and MYBs are the most characterised transcription factor genes related to anthocyanin biosynthesis (Yan et al., 2021). In P. ostia, two transcription factors, PoMYB2 and PoSPL1, negatively regulate anthocyanin accumulation (Gao et al., 2015). Genes responsible for anthocyanin transport also reportedly affect flower colour. In carnation, DcGSTF2, encoding glutathione S-transferase-like gene, is responsible for flower colour intensity (Sasaki et al., 2012). In Japanese cultivated gentian, genes involved in flavonoid biosynthesis and transcriptional regulation have been characterised (Nakatsuka et al., 2014), but no genes related to regulation of flower colour intensity have been identified.
Here, we hypothesised that previously characterised structural and/or transcription factor genes are the key genes responsible for the variation in Japanese gentian flower colour intensity between intense-blue (Ashiro-no-Hatsuaki) and faint-blue (Matsuo) lines. However, RNA-seq analyses revealed that the expression levels of structural and transcription factor genes involved in flavonoid biosynthesis were unclear for the different flower colour intensities (Supplementary Figure S10), indicating the existence of another relevant gene(s). To identify the genes responsible, we produced progenies and analysed the inheritance of flower colour intensity. The F1 plants showed intermediate flower colour intensity and F2 plants obtained from self-pollination of one F1 plant (26-852-20) showed varying colour intensity, as indicated by L* values (Figure 2D). This suggests that flower colour intensity in gentian is a quantitative trait locus (QTL). The QTL of flower colour intensity based on anthocyanin amount has been investigated in other plant species, such as rose (Henz et al., 2015) and Mimulus (Yuan et al., 2013). It is also known that the allele situation of the flavonoid biosynthetic and regulatory genes affects the flower colour intensity. The heterozygote of functional/non-functional alleles generally shows fainter flower colour than that of functional alleles, although several examples of single-gene overdominance were reported (Liberatore et al., 2013). Besides anthocyanin biosynthesis, branching biosynthetic pathways to other flavonoid classes, such as flavones and flavonols, can also have quantitative effects on the colour intensity (Luo et al., 2015; LaFountain et al., 2017). However, except for pigment biosynthesis-related genes, genes that are quantitatively related to flower colour intensity have not been clarified. We focused on an FBG1 (MIF protein homolog) because it was the highest-ranking contig from the NOISeq analysis. Based on individual plants, FBG1 was selected as a possible candidate gene by two-dimensional scatter plot (Supplementary Figure S3).
We cloned two genes, GtMIF1-1 and GtMIF1-2, encoding putative small zinc-finger proteins that show a highly conserved MINI ZF domain in plants (Supplementary Figure S4). In Arabidopsis, AtMIF1 and AtMIF3 are expressed in vegetative organs, and AtMIF2 is expressed in the floral meristem (Hu and Ma, 2006; Winter et al., 2007). AtMIF1 is related to vascular development, and its overexpression using the CaMV35S promoter revealed pleiotropic defects of plant development, such as dwarfism, dark-green leaves, and altered flower morphology (Hu and Ma, 2006). AtMIF2 and its tomato homolog, S1IMA, are reported to regulate floral meristem termination, and their overexpression also induced severe reductions in plant and flower size (Bollier et al., 2018). Our results also revealed that overexpression of GtMIF1 in tobacco caused morphological aberrations, including reduced plant height and wavy leaves. Plant lines with strong expression showed extreme phenotypes and were infertile (Supplementary Figure S7A). Although GtMIF1-1 and GtMIF1-2 were not classified in the same clade as AtMIFs and S1IMA in the phylogenetic tree, our results support the hypothesis that GtMIF1 has a similar function to AtMIFs and S1IMA.
In previous studies of Arabidopsis and tomato, the effects of MIF genes on flower colour were not examined. However, our results clearly showed a reduction in flower colour intensity in GtMIF1-overexpressing tobacco flowers (Figure 5A), suggesting that GtMIF1 also affects flower pigmentation. Because a constitutive 35S promoter was used for the ectopic expression of GtMIF1 in tobacco plants, the phenotype of dwarf or wavy leaves may have been observed. In future studies, transgenic studies using own or petal-specific promoters are necessary to reveal the exact function of GtMIF1 in gentian petals. Moreover, promoter analysis between two GtMIF1 alleles would provide firm evidence of the contribution of GtMIF1 in flower colour intensity regulation. In the future, we would like to clarify the molecular mechanism of flower colour intensity regulation by GtMIF1.
In tobacco GtMIF1-overexpressing lines, the expression levels of flavonoid biosynthetic genes and transcription factor genes did not differ overall and fell within the expected variation (Figure 5B). Although a significant difference in the expression of some genes was observed in line MIF1-10, the expression levels of foreign GtMIF1 were comparable among the three transgenic lines, indicating that the activated expressions of NtAn2, NtCHS and NtANS were not responsible for the variation in flower colour. Moreover, these three genes usually increase anthocyanin accumulation; therefore, it is unlikely that reduced flower colour would result from activation of these genes. In gentian, there were also no notable differences in the expression levels of known flavonoid-related genes between the two parental lines (Supplementary Figure S10). These findings suggest that direct regulation of flavonoid biosynthetic genes is not responsible for differences in flower colour intensity. It is likely that hormonal changes are responsible for flower colour reduction because dwarf and morphological aberrations were observed (Supplementary Figures S7C, S8). In Gerbera hybrida, a MIF homolog protein inhibited petal elongation by activating the GASA protein family gene, GEG (Han et al., 2017). In that study, decreases and increases in flower pigmentation were observed in GhMIF-overexpressed and GhMIF-VIGS lines, respectively, although the analysis was not focused on petal colour. Arabidopsis AtMIF1 gene is known to affect the development of various plants via hormone network pathways; therefore, it is likely that hormone-mediated signalling pathways contribute to flower colour intensity variation in gentian. In Arabidopsis, it is difficult to study the involvement of AtMIF genes in flower colour regulation, because Arabidopsis have colourless petals.
Next, to analyse whether GtMIF1 was involved in the regulation of flower colour intensity in gentian, we developed a PCR-based DNA marker and analysed the F2 population for 2 years. The strong correlation between years indicated that flower colour intensity was comparatively stable and plant age did not affect the phenotype. Analysis of the DNA marker confirmed that MIF1 was inherited as a single locus and correlated well with faint colour intensity (Figure 6). We previously developed DNA markers to distinguish blue from pink or white flowers (Kakizaki et al., 2009; Nakatsuka et al., 2011). In those cases, the responsible genes were functional specific genes such as F3′5′H, MYB3 and ANS; therefore, the concordance rate was almost 100% between genotype and phenotype. However, in this study, the PCR marker of MIF1 did not perfectly match the faint flower phenotype. The loss of MIF1 linkage observed in F2 (e.g., lines 009-70 and 009-67 in Figure 6B) suggests that other genes also play a role in the determination of flower colour intensities. One possible reason of the segregation inconsistency of MIF1 allele is a recombination event; in this case, neighbouring GtMIF1 may be alternative candidates for the trait. Several genes are also predicted in genome contigs containing GtMIF1 (Supplementary Figure S11). GtMYBP9 may be a candidate because it is near to AmMIXTA and MIXTA-like proteins that regulate epidermal cell shape and pigmentation in Antirrhinum majus (Baumann et al., 2007). Further analysis is necessary to completely understand the regulation mechanism of flower colour intensity in Japanese gentian.
Among the selected FBGs, FBG5, FBG6, and FBG7 were annotated as putative alkane hydroxylase MAH1-l like (CYP), xyloglucan endotransglucosylase/hydrolase, and bHLH148-like, respectively. As far as we know, there are no reports on the involvement of these genes in anthocyanin biosynthesis. Two putative peroxidases, FBG8 and FBG15, were also included in the list (Supplementary Table S5). The mechanism of anthocyanin degradation is poorly understood, but the involvement of peroxidase is suspected in several plant species. In Brunfelsia calycina flowers, a vacuolar class III peroxidase, encoded by BcPrx01, was identified as a candidate gene for changes in colour from purple to white. BcPrx01 expression and activity in petals were associated with the degradation of anthocyanins (Zipor et al., 2015). Furthermore, grapevine VviPrx31, encoding a putative peroxidase, is reportedly a candidate gene of anthocyanin degradation in ripening berries, although its activity has not been confirmed (Movahed et al., 2016). In paprika, enzymatic degradation of anthocyanins is likely responsible for fading of colouration in fruit (Yamada et al., 2019). Phylogenetic analysis indicated that FGB8 and FBG15 were close to BcPrx01 (Supplementary Figure S12); therefore, it is likely that these genes are involved in anthocyanin degradation in gentian flowers. We could not find any relevant references about other selected DEGs; therefore, further analysis is necessary to assess their contribution to flower colour intensity in gentian.
In conclusion, we identified candidate genes responsible for flower colour intensity in Japanese gentian. Functional analysis of GtMIF1 confirmed that this gene has the ability to reduce flower colour in heterologous tobacco plants. Progeny analysis using a GtMIF1 DNA marker revealed that this gene is involved in flower colour intensity in F2 individuals. Thus, it is likely that GtMIF1 is one of the key genes that determine flower colour intensity in gentian. Environmental conditions such as light and temperature are known to affect anthocyanin accumulation in plants (Azuma et al., 2012). High temperature in the field or dim light during transport of cut flowers also influences flower colour intensity in gentian. For breeding of stable colour cultivars, further analyses of these environmental factors, as well as genetic features, are necessary.
Data Availability Statement
The datasets presented in this study can be found in online repositories. The names of the repository/repositories and accession number(s) can be found at: DDBJ—DRA013625, DRA010021, DRA014102, LC699354, and LC699355.
Author Contributions
KT and MN conceived the original research plan and wrote the manuscript. AW, FG, and NS performed sampling, RNA and DNA extractions, and measurement by spectrophotometer. KT performed RNA-seq and bioinformatic analyses. AW, KN, and ST performed qRT-PCR analyses. KN, AW, and MN performed MIF1 cloning and DNA-marker analyses. TH performed crossing and cultivated gentian population. KT and NS performed HPLC analysis. All authors contributed to the article and approved the submitted version.
Funding
This work was financially supported by commissioned projects, ‘Breeding of floricultural plants adapted for high practical needs and development of low cost cultivation techniques’ of the Ministry of Agriculture, Forestry and Fisheries, Japan.
Conflict of Interest
The authors declare that the research was conducted in the absence of any commercial or financial relationships that could be construed as a potential conflict of interest.
Publisher’s Note
All claims expressed in this article are solely those of the authors and do not necessarily represent those of their affiliated organizations, or those of the publisher, the editors and the reviewers. Any product that may be evaluated in this article, or claim that may be made by its manufacturer, is not guaranteed or endorsed by the publisher.
Acknowledgments
We are grateful for use of the NIG supercomputer at the ROIS National Institute of Genetics (Japan). We also thank Yoshimi Kurokawa and Rie Washiashi, IBRC technical staff, for their technical supports. We thank Motoki Shimizu and Akira Abe (Department of Genomics and Breeding, Iwate Biotechnology Research Center) for the use of data of draft de novo genome assembly of gentian.
Supplementary Material
The Supplementary Material for this article can be found online at: https://www.frontiersin.org/articles/10.3389/fpls.2022.906879/full#supplementary-material
References
Azuma, A., Yakushiji, H., Koshita, Y., and Kobayashi, S. (2012). Flavonoid biosynthesis-related genes in grape skin are differentially regulated by temperature and light conditions. Planta 236, 1067–1080. doi: 10.1007/s00425-012-1650-x
Baumann, K., Perez-Rodriguez, M., Bradley, D., Venail, J., Bailey, P., Jin, H., et al. (2007). Control of cell and petal morphogenesis by R2R3 MYB transcription factors. Development 134, 1691–1701. doi: 10.1242/dev.02836
Bollier, N., Sicard, A., Leblond, J., Latrasse, D., Gonzalez, N., Gevaudant, F., et al. (2018). At-MINI ZINC FINGER2 and Sl-INHIBITOR OF MERISTEM ACTIVITY, a conserved missing link in the regulation of floral meristem termination in Arabidopsis and tomato. Plant Cell 30, 83–100. doi: 10.1105/tpc.17.00653
Doi, H., Hoshi, N., Yamada, E., Yokoi, S., Nishihara, M., Hikage, T., et al. (2013). Efficient haploid and doubled haploid production from unfertilized ovule culture of gentians (Gentiana spp.). Breed. Sci. 63, 400–406. doi: 10.1270/jsbbs.63.400
Eason, J. R., Debenham, M., McLachlan, A., and Morgan, E. (2007). Novel red-flowered gentiana: an emerging export cut flower crop from New Zealand. Acta Hortic. 755, 259–266. doi: 10.17660/actahortic.2007.755.33
Gao, L., Yang, H., Liu, H., Yang, J., and Hu, Y. (2015). Extensive transcriptome changes underlying the flower color intensity variation in Paeonia ostii. Front. Plant Sci. 6:1205. doi: 10.3389/fpls.2015.01205
Goto, T., Kondo, T., Tamura, H., Imagawa, H., Iino, A., and Takeda, K. (1982). Structure of gentiodelphin, an acylated anthocyanin from Gentiana maikinoi, that is stable in dilute aqueous solution. Tetrahedron Lett. 23, 3695–3698. doi: 10.1016/S0040-4039(00)88660-8
Han, M., Jin, X., Yao, W., Kong, L., Huang, G., Tao, Y., et al. (2017). A mini zinc-finger protein (MIF) from Gerbera hybrida activates the GASA protein family gene, GEG, to inhibit ray petal elongation. Front. Plant Sci. 8:1649. doi: 10.3389/fpls.2017.01649
Henz, A., Debener, T., and Linde, M. (2015). Identification of major stable QTLs for flower color in roses. Mol. Breed. 35:190. doi: 10.1007/s11032-015-0382-6
Hu, W., and Ma, H. (2006). Characterization of a novel putative zinc finger gene MIF1: involvement in multiple hormonal regulation of Arabidopsis development. Plant J. 45, 399–422. doi: 10.1111/j.1365-313X.2005.02626.x
Iwashina, T. (2015). Contribution to flower colors of flavonoids including anthocyanins: a review. Nat. Prod. Commun. 10, 529–544. doi: 10.1177/1934578X1501000335
Kakizaki, Y., Nakatsuka, T., Kawamura, H., Abe, J., Abe, Y., Yamamura, S., et al. (2009). Development of codominant DNA marker distinguishing pink from blue flowers in Gentiana scabra. Breed. Res. 11, 9–14. doi: 10.1270/jsbbr.11.9
Kinjo, S., Monma, N., Misu, S., Kitamura, N., Imoto, J., Yoshitake, K., et al. (2018). Maser: one-stop platform for NGS big data from analysis to visualization. Database 2018:bay027. doi: 10.1093/database/bay027
Kodama, K. (2006). “IV-9. Gentian,” in Japanese Society of Hortuculture Science (ed), Horticulture in Japan 2006 (Kyoto: Shoukadoh Publishing), 248–253.
LaFountain, A. M., Chen, W., Sun, W., Chen, S., Frank, H. A., Ding, B., et al. (2017). Molecular basis of overdominance at a flower color locus. G3 7, 3947–3954. doi: 10.1534/g3.117.300336
Li, B., and Dewey, C. N. (2011). RSEM: accurate transcript quantification from RNA-seq data with or without a reference genome. BMC Bioinform. 12:323. doi: 10.1186/1471-2105-12-323
Liberatore, K. L., Jiang, K., Zamir, D., and Lippman, Z. B. (2013). “Heterosis: the case for single-gene overdominance,” in Polyploid and Hybrid Genomics. eds. Z. J. Chen and J. A. Birchler (Oxford, UK: John Wiley & Sons, Inc.), 137–152.
Luo, P., Ning, G., Wang, Z., Shen, Y., Jin, H., Li, P., et al. (2015). Disequilibrium of flavonol synthase and dihydroflavonol-4-reductase expression associated tightly to white vs. red color flower formation in plants. Front. Plant Sci. 6:1257. doi: 10.3389/fpls.2015.01257
Movahed, N., Pastore, C., Cellini, A., Allegro, G., Valentini, G., Zenoni, S., et al. (2016). The grapevine VviPrx31 peroxidase as a candidate gene involved in anthocyanin degradation in ripening berries under high temperature. J. Plant Res. 129, 513–526. doi: 10.1007/s10265-016-0786-3
Nakatsuka, T., Saito, M., Sato-Ushiku, Y., Yamada, E., Nakasato, T., Hoshi, N., et al. (2011). Development of DNA markers that discriminate between white- and blue-flowers in Japanese gentian plants. Euphytica 184, 335–344. doi: 10.1007/s10681-011-0534-7
Nakatsuka, T., Saito, M., Yamada, E., Fujita, K., Kakizaki, Y., and Nishihara, M. (2012). Isolation and characterization of GtMYBP3 and GtMYBP4, orthologues of R2R3-MYB transcription factors that regulate early flavonoid biosynthesis, in gentian flowers. J. Exp. Bot. 63, 6505–6517. doi: 10.1093/jxb/ers306
Nakatsuka, T., Sasaki, N., and Nishihara, M. (2014). Transcriptional regulators of flavonoid biosynthesis and their application to flower color modification in Japanese gentians. Plant Biotechnol. 31, 389–399. doi: 10.5511/plantbiotechnology.14.0731a
Nishihara, M., Higuchi, A., Watanabe, A., and Tasaki, K. (2018a). Application of the CRISPR/Cas9 system for modification of flower color in Torenia fournieri. BMC Plant Biol. 18:331. doi: 10.1186/s12870-018-1539-3
Nishihara, M., and Nakatsuka, T. (2010). Genetic engineering of novel flower colors in floricultural plants: recent advances via transgenic approaches. Methods Mol. Biol. 589, 325–347. doi: 10.1007/978-1-60327-114-1_29
Nishihara, M., Tasaki, K., Sasaki, N., and Takahashi, H. (2018b). Development of basic technologies for improvement of breeding and cultivation of Japanese gentian. Breed. Sci. 68, 14–24. doi: 10.1270/jsbbs.17074
Noda, N. (2018). Recent advances in the research and development of blue flowers. Breed. Sci. 68, 79–87. doi: 10.1270/jsbbs.17132
Noman, A., Aqeel, M., Deng, J., Khalid, N., Sanaullah, T., and Shuilin, H. (2017). Biotechnological advancements for improving floral attributes in ornamental plants. Front. Plant Sci. 8:530. doi: 10.3389/fpls.2017.00530
Ohmiya, A. (2011). Diversity of carotenoid composition in flower petals. Jpn. Agric. Res. Q. 45, 163–171. doi: 10.6090/jarq.45.163
Ohno, S., Deguchi, A., Hosokawa, M., Tatsuzawa, F., and Doi, M. (2013). A basic helix-loop-helix transcription factor DvIVS determines flower color intensity in cyanic dahlia cultivars. Planta 238, 331–343. doi: 10.1007/s00425-013-1897-x
Ohta, Y., Atsumi, G., Yoshida, C., Takahashi, S., Shimizu, M., Nishihara, M., et al. (2021). Post-transcriptional gene silencing of the chalcone synthase gene CHS causes corolla lobe-specific whiting of Japanese gentian. Planta 255:29. doi: 10.1007/s00425-021-03815-w
Polturak, G., and Aharoni, A. (2018). "La vie en rose": biosynthesis, sources, and applications of betalain pigments. Mol. Plant 11, 7–22. doi: 10.1016/j.molp.2017.10.008
Robinson, M. D., McCarthy, D. J., and Smyth, G. K. (2010). edgeR: a bioconductor package for differential expression analysis of digital gene expression data. Bioinformatics 26, 139–140. doi: 10.1093/bioinformatics/btp616
Robinson, M. D., and Oshlack, A. (2010). A scaling normalization method for differential expression analysis of RNA-seq data. Genome Biol. 11:R25. doi: 10.1186/gb-2010-11-3-r25
Sasaki, N., Nemoto, K., Nishizaki, Y., Sugimoto, N., Tasaki, K., Watanabe, A., et al. (2021). Identification and characterization of xanthone biosynthetic genes contributing to the vivid red coloration of red-flowered gentian. Plant J. 107, 1711–1723. doi: 10.1111/tpj.15412
Sasaki, N., Nishizaki, Y., Uchida, Y., Wakamatsu, E., Umemoto, N., Momose, M., et al. (2012). Identification of the glutathione S-transferase gene responsible for flower color intensity in carnations. Plant Biotechnol. 29, 223–227. doi: 10.5511/plantbiotechnology.12.0120a
Sasaki, N., Watanabe, A., Asakawa, T., Sasaki, M., Hoshi, N., Naito, Z., et al. (2018). Evaluation of the biological effect of ion beam irradiation on perennial gentian and apple plants. Plant Biotechnol. 35, 249–257. doi: 10.5511/plantbiotechnology.18.0612a
Singh, A. K. (2014). Breeding and Biotechnology of Flowers: Vol. 01: Commercial Flowers. New Delhi: NIPA.
Takahashi, S., Ozawa, S., Sonoike, K., Sasaki, K., and Nishihara, M. (2020). Morphological and cytological observations of corolla green spots reveal the presence of functional chloroplasts in Japanese gentian. PLoS One 15:e0237173. doi: 10.1371/journal.pone.0237173
Tanaka, Y., Sasaki, N., and Ohmiya, A. (2008). Biosynthesis of plant pigments: anthocyanins, betalains and carotenoids. Plant J. 54, 733–749. doi: 10.1111/j.1365-313X.2008.03447.x
Tarazona, S., Furio-Tari, P., Turra, D., Pietro, A. D., Nueda, M. J., Ferrer, A., et al. (2015). Data quality aware analysis of differential expression in RNA-seq with NOISeq R/Bioc package. Nucleic Acids Res. 43:e140. doi: 10.1093/nar/gkv711
Tarazona, S., Garcia-Alcalde, F., Dopazo, J., Ferrer, A., and Conesa, A. (2011). Differential expression in RNA-seq: a matter of depth. Genome Res. 21, 2213–2223. doi: 10.1101/gr.124321.111
Tasaki, K., Higuchi, A., Watanabe, A., Sasaki, N., and Nishihara, M. (2019). Effects of knocking out three anthocyanin modification genes on the blue pigmentation of gentian flowers. Sci. Rep. 9:15831. doi: 10.1038/s41598-019-51808-3
Tasaki, K., Yoshida, M., Nakajima, M., Higuchi, A., Watanabe, A., and Nishihara, M. (2020). Molecular characterization of an anthocyanin-related glutathione S-transferase gene in Japanese gentian with the CRISPR/Cas9 system. BMC Plant Biol. 20:370. doi: 10.1186/s12870-020-02565-3
Wang, L., Albert, N. W., Zhang, H., Arathoon, S., Boase, M. R., Ngo, H., et al. (2014). Temporal and spatial regulation of anthocyanin biosynthesis provide diverse flower colour intensities and patterning in Cymbidium orchid. Planta 240, 983–1002. doi: 10.1007/s00425-014-2152-9
Watanabe, K., Kobayashi, A., Endo, M., Sage-Ono, K., Toki, S., and Ono, M. (2017). CRISPR/Cas9-mediated mutagenesis of the dihydroflavonol-4-reductase-B (DFR-B) locus in the Japanese morning glory Ipomoea (Pharbitis) nil. Sci. Rep. 7:10028. doi: 10.1038/s41598-017-10715-1
Watanabe, K., Oda-Yamamizo, C., Sage-Ono, K., Ohmiya, A., and Ono, M. (2018). Alteration of flower colour in Ipomoea nil through CRISPR/Cas9-mediated mutagenesis of carotenoid cleavage dioxygenase 4. Transgenic Res. 27, 25–38. doi: 10.1007/s11248-017-0051-0
Winter, D., Vinegar, B., Nahal, H., Ammar, R., Wilson, G. V., and Provart, N. J. (2007). An “electronic fluorescent pictograph” browser for exploring and analyzing large-scale biological data sets. PLoS One 2:e718. doi: 10.1371/journal.pone.0000718
Xu, W., Dubos, C., and Lepiniec, L. (2015). Transcriptional control of flavonoid biosynthesis by MYB-bHLH-WDR complexes. Trends Plant Sci. 20, 176–185. doi: 10.1016/j.tplants.2014.12.001
Yamada, Y., Nakayama, M., Shibata, H., Kishimoto, S., and Ikeda, T. (2019). Anthocyanin production and enzymatic degradation during the development of dark purple and lilac paprika fruit. J. Am. Soc. Hortic. Sci. 144, 329–338. doi: 10.21273/jashs04727-19
Yan, H., Pei, X., Zhang, H., Li, X., Zhang, X., Zhao, M., et al. (2021). MYB-mediated regulation of anthocyanin biosynthesis. Int. J. Mol. Sci. 22:3103. doi: 10.3390/ijms22063103
Yu, J., Tu, L., Subburaj, S., Bae, S., and Lee, G. J. (2021). Simultaneous targeting of duplicated genes in Petunia protoplasts for flower color modification via CRISPR-Cas9 ribonucleoproteins. Plant Cell Rep. 40, 1037–1045. doi: 10.1007/s00299-020-02593-1
Yuan, Y.-W., Sagawa, J. M., Young, R. C., Christensen, B. J., and Bradshaw, H. D. (2013). Genetic dissection of a major anthocyanin QTL contributing to pollinator-mediated reproductive isolation between sister species of Mimulus. Genetics 194, 255–263. doi: 10.1534/genetics.112.146852
Zhao, D., and Tao, J. (2015). Recent advances on the development and regulation of flower color in ornamental plants. Front. Plant Sci. 6:261. doi: 10.3389/fpls.2015.00261
Keywords: anthocyanin, DNA marker, flower colour intensity, gentian, MIF1, RNA-seq
Citation: Tasaki K, Watanabe A, Nemoto K, Takahashi S, Goto F, Sasaki N, Hikage T and Nishihara M (2022) Identification of Candidate Genes Responsible for Flower Colour Intensity in Gentiana triflora. Front. Plant Sci. 13:906879. doi: 10.3389/fpls.2022.906879
Edited by:
Stefan Martens, Fondazione Edmund Mach, ItalyReviewed by:
Kevin Davies, The New Zealand Institute for Plant and Food Research Ltd., New ZealandHui Zhou, Anhui Academy of Agricultural Sciences, China
Copyright © 2022 Tasaki, Watanabe, Nemoto, Takahashi, Goto, Sasaki, Hikage and Nishihara. This is an open-access article distributed under the terms of the Creative Commons Attribution License (CC BY). The use, distribution or reproduction in other forums is permitted, provided the original author(s) and the copyright owner(s) are credited and that the original publication in this journal is cited, in accordance with accepted academic practice. No use, distribution or reproduction is permitted which does not comply with these terms.
*Correspondence: Masahiro Nishihara, bW5pc2hpaGFAaWJyYy5vci5qcA==
†Present addresses: Keisuke Tasaki, Department of Agriculture, Faculty of Agriculture, Tokyo University of Agriculture, Kanagawa, Japan
Nobuhiro Sasaki, Department of Agricultural Biology, Graduate School of Agriculture, Osaka Metropolitan University, Osaka, Japan