 Wencheng Lu1†
 Xunchao Zhao
 Yingpeng Han
- 1Heihe Branch of Heilongjiang Academy of Agricultural Sciences, Heihe, China
- 2Key Laboratory of Soybean Biology in Chinese Ministry of Education (Key Laboratory of Soybean Biology and Breeding/Genetics of Chinese Agriculture Ministry), Northeast Agricultural University, Harbin, China
Soluble sugar is a major indicator of the intrinsic quality of vegetable soybean [Glycine max (L.) Merr. ]. The improvement of soluble sugar content in soybean is very important due to its healthcare functions for humans. The genetic mechanism of soluble sugar in soybean is unclear. In this study, 278 diverse soybean accessions were utilized to identify the quantitative trait nucleotides (QTNs) for total soluble sugar content in soybean seeds based on a genome-wide association study (GWAS). A total of 25,921 single-nucleotide polymorphisms (SNPs) with minor allele frequencies (MAFs) ≥ 5% and missing data ≤ 10% were selected for GWAS. Totally, thirteen QTNs associated with total soluble sugar content were identified, which were distributed on ten chromosomes. One hundred and fifteen genes near the 200-kb flanking region of these identified QTNs were considered candidate genes associated with total soluble sugar content in soybean seed. Gene-based association analysis and haplotype analysis were utilized to further identify the effect of candidate genes on total soluble sugar content. Totally, 84 SNPs from seventeen genes across four chromosomes were significantly associated with the total soluble sugar content. Among them, three SNPs from Glyma.02G292900 were identified at two locations, and other eighty-one SNPs from sixteen genes were detected at three locations. Furthermore, expression level analysis of candidate genes revealed that Glyma.02G293200 and Glyma.02G294900 were significantly positively associated with soluble sugar content and Glyma.02G294000 was significantly negatively associated with soluble sugar content. Six genes (i.e., Glyma.02G292600, Glyma.02G292700, Glyma.02G294000, Glyma.02G294300, Glyma.02G294400, and Glyma.15G264200) identified by GWAS were also detected by the analysis of differential expression genes based on soybean germplasms with higher and lower soluble sugar content. Among them, Glyma.02G294000 is the only gene that was identified by gene-based association analysis with total soluble sugar content and was considered an important candidate gene for soluble sugar content. These candidate genes and beneficial alleles would be useful for improving the soluble sugar content of soybean.
Introduction
The soybean [Glycine max (L.) Merr.] seeds are widely utilized in the processing of soybean products, such as soy milk, tofu, and bean paste. Approximately, 40 g protein, 35 g carbohydrates, 20 g oil, and 5 g ash are present in 100 g of dried soybean seeds (Krober and Cartter, 1962). Among carbohydrates, the concentration of soluble sugars is as high as 16.6% (Hymowitz et al., 1974), which contributes to the quality and nutritional values of soy food. The primary component of total soluble sugar in mature soybean seeds is sucrose, accounting for about 5% of soybean dry matter, and its improvement is beneficial for the taste and sweetness of soybean products. The other two components that play an important role are raffinose and stachyose, accounting for 1.5 and 3% of the total soluble sugar content in soybean dry matter, respectively (Hymowitz et al., 1972; Openshaw and Hadley, 1978; Kuo et al., 1988; Wilson, 2004), which have a great influence on the fabric of soybean fresh food and soybean products. There are also other minor sugars in soybean seeds, such as glucose, fructose, and galactose, which account for a small proportion of soluble carbohydrates, <1% totally (Hymowitz et al., 1972). Thus, improving soluble sugar contents in soybean, such as increasing sucrose content and reducing raffinose and stachyose contents, plays a vital role in soybean genetic breeding and quality improvement, which has attracted the attention of soybean breeders.
Vegetable soybeans (G. max (L.) Merr.) are also known as edamame, which is harvested as a green and fully filled pod when the seeds are ~80% mature. Vegetable soybeans are rich in protein, soluble sugars, starch, dietary fiber, minerals, vitamins, and other phytochemicals, such as isoflavones, with anticancer and other health-promoting activities (Kumar et al., 2011; Kao et al., 2020). Due to the many nutritional benefits to humans, the demand for vegetable soybeans is likely to continue to increase in the future (Jiang et al., 2018). Sweetness, aroma, taste, and texture are important aspects of the edible quality of vegetable soybeans. Chemical substances that affect sweetness, taste, and flavor include sucrose, free amino acids, organic acids, inorganic salts, and flavonoids. Among them, the sweetness mainly depends on the content of sucrose, the texture and flavor depend on the content of free amino acids, and the content of lipoxygenase and hardness determines the beany flavor and softness of the mouthfeel. It is the most important and sustainable goal of vegetable soybean breeding to improve the overall quality of vegetable soybeans, such as appearance quality, nutritional quality, and taste quality, and increase the yield of vegetable soybeans (Golicz et al., 2016; Varshney et al., 2020).
The increasingly mature molecular marker technology is beneficial in soybean breeding. Currently, hundreds of quantitative trait loci (QTLs) related to agronomic and quality traits have been mapped in different populations across nearly all chromosomes of soybean, while only a small number of studies about a genetic study and QTL analysis of soluble sugars in soybean seeds were reported. Few QTLs related to soluble sugars (e.g., sucrose, raffinose, and stachyose) were detected, indicating that this field is worth considering. Kim et al. (2005) identified two QTLs for oligosaccharide and sucrose. Kim et al. (2006) detected two QTLs, located on Chr.12 and Chr.16, indicating that the phenotypic variation of sucrose content is lower than 10%. Maroof and Buss (2011) detected a major QTL on chromosome 11 (LG B1) for sucrose and stachyose contents. One QTL for sucrose and raffinose, and two QTLs for stachyose were detected in a set of 170 F2:3 RILs by Wang et al. (2014). Akond et al. (2015) identified fourteen significant QTLs associated with soluble sugar contents by an F5:7 population with 92 lines, including QTLs related to sucrose (three QTLs across three LGs), raffinose (seven QTLs across six LGs), and stachyose (four QTLs across four LGs) contents. However, due to the low resolution and density of the detected QTL, it is difficult to detect the QTLs related to soluble sugar content by molecular marker-assisted selection (MAS).
A genome-wide association analysis (GWAS) is thought to be a valid alternative to linkage analysis, its resolution and accuracy are higher than linkage analysis, and it plays a significant role in analyzing the genetic basis of soybean complex traits (Li et al., 2015). At present, GWAS has been widely utilized in genetic analysis of soybean quality breeding, for instance, protein content (Hwang et al., 2014), oil content (Hwang et al., 2014), fatty acid content (Cao et al., 2017), and amino acid content (Grant et al., 2010). The restricted two-stage multi-locus GWAS (RTM-GWAS) was considered a procedure that can comprehensively and effectively detect QTL, which has been applied widely nowadays (Khan et al., 2019). However, up to date, no studies related to the analysis of soluble sugar content in soybean seeds on the basis of genome sequencing technology had been reported.
In this study, 278 tested soybean germplasms and 25,921 polymorphic single-nucleotide polymorphism (SNP) markers were conducted for a GWAS of total soluble sugar content in fully developed grains of soybean. The purpose was to clarify the genetic structure of soluble sugar content in soybean grains and to unearth the candidate genes related to soluble sugar content by means of peak SNPs in soybean seeds, and the genes related to soybean soluble sugar content were screened and predicted by candidate gene-based association analysis and gene expression analysis, in order to provide a basis for the cultivation of soybean germplasm with a higher soluble sugar content.
Materials and Methods
Planting and Phenotyping
A panel of 278 soybean germplasms (landraces and elite cultivars) was collected to analyze the phenotypic variation and genotyping by sequencing (Supplementary Table S1). We planted the germplasms at three locations, including Harbin (117°17′E, 33°18′N), Gongzhuling (124°82′E, 43°50′N), and Shenyang (41°48′N, 123°25′E), in 2019. Three replications and a randomized complete block design were applied for field experimental trials. In addition, the single row plots of 3 m long and 0.65 m between rows were exploited in each tested environment. When plants reached full development, 10 randomly selected plants from each row in each plot were picked up to measure the total soluble sugar content.
Measurement of Total Soluble Sugar Content
Total soluble sugar content in soybean seeds was extracted and quantified according to the method described by Taira (1990) and Fox and Robyt (1991). Approximately, 10 g of tested and fully developed grains of soybean were milled to a fine powder and dried. Then, 3 g sample, 200 ml distilled water, and 20 ml HCl [25% (w/w)] were mixed in a glass bottle (250 ml). The bottle was homogenized for 5 s by shaking and placed in a water bath at 100°C for 4 h. Later, the bottle was taken out and quickly cooled to room temperature in ice water for 20 min. A volume of 5.5 ml NaOH [40% (w/v)] was poured into the bottle, and then the mixture was filtered through a filter paper into a 500-ml glass filter flask after mixing the liquid upside down. The solution was transferred to a 500-ml volumetric flask and filled to calibration with distilled water and mix it. A volume of 3 ml solution was pipetted into a 100-ml volumetric flask and filled to calibration with distilled water to dilute to measurable concentration. After mixing, the modified phenol-sulfuric acid method was used for measuring the total soluble sugar content. A volume of 25 μl of each sample extract and 25 μl of 5% (w/v) phenol were placed in each well of a 96-well general assay plate; 125 μl of concentrated H2SO4 was poured into each well after placing the plate on the ice and mixing it for 30 s at a slow speed. The plate was sealed and then placed in a water bath at 80°C for 30 min. The absorbance at 490 nm was read in a Titertek Multiskan Plus spectrophotometer equipped for reading. The concentration of total sugar in each sample was determined by the standard curve. Each sample analysis was performed in triplicate.
Genotyping Data
The genomic DNA of each sample from young leaf was isolated by the method of CTAB and sequenced via the specific locus amplified fragment sequencing (SLAF-seq) methodology (Sun et al., 2013). Two digest enzymes, MseI (EC 3.1.21.4) and HaeIII (EC: 3.1.21.4) (Thermo Fisher Scientific Inc., Waltham, MA, USA), were used to acquire more than 50,000 sequencing tags from each accession, and the length of the tags varied from 300 to 500 bp. The acquired sequencing tags of each accession, distributed in unique genomic regions of the twenty chromosomes in soybean, were used to define sequencing libraries. The alignment between the raw paired-end reads and soybean reference genome Williams 82 (version: Glyma.Wm82.a2) was performed via the Short Oligonucleotide Alignment Program 2 (SOAP2) software. The raw reads in the same genomic position were utilized to define the SLAF groups using more than 58,000 high-quality SLAF tags from each tested sample. When MAF ≥ 0.05, the SNPs were defined. As long as the depth of minor allele/the total depth of the sample is more than one-third of the total, then the genotype was defined to be heterozygous (Han et al., 2016).
Population Structure Evaluation and Linkage Disequilibrium Analysis
The assessment approach for the population structure of the association panel was principle component analysis (PCA) of the GAPIT software (Lipka et al., 2012). The linkage disequilibrium (LD) block between pairs of SNPs (MAF ≥ 0.05 and missing data ≤ 10%) and r2 (squared allele frequency correlations) was calculated using TASSEL 3.0 (Bradbury et al., 2007). In contrast to the GWAS, missing SNP genotypes were not imputed with the major allele before LD analysis. The parameters in the program included MAF (≥0.05) and the integrity of each SNP (≥80%).
Association Analysis
The RTM-GWAS procedure was performed to detect the signals associated with the total soluble sugar content in soybean seeds based on 25,921 SNPs and 278 soybean germplasms under three environments (He et al., 2017). Of this association study, two stages were conducted. The first stage was to preselect markers by a single-locus association test based on the simple linear model. The second stage was to detect genome-wide QTLs for preselected markers under the multi-locus multi-allele model featured with forward selection and backward elimination. In these two stages, the three eigenvectors with the largest eigenvalues of the GSC matrix calculated from the genome-wide SNPs were incorporated as covariates for population structure correction. The significance level used for preselection markers was P ≤ 0.05. In addition, the stepwise regression level was P ≤ 0.01. The conservative Bonferroni criterion was utilized here (Khan et al., 2019). The genotype-environment interaction also was considered.
Prediction of Candidate Genes for Total Soluble Sugar Content
The 200-kb genomic region of each peak SNP was regarded as the candidate interval, and genes located in the interval were treated as candidate genes and then identified and annotated the candidate genes with the soybean reference genome (Wm82. a2. v1, http://www.soybase.org) (Cheng et al., 2017).
The SNP variations happened in a genomic region of candidate genes, including exon regions, splicing sites, untranslated regions (UTRs), intronic regions, and upstream and downstream regions, which were detected in twenty soybean lines with higher and lower soluble sugar content based on genome re-sequencing data. SNPs located in these regions of candidate genes with MAF <0.05 were filtered out, and then LD KNNI imputation was used to impute the genotypes of these SNPs. Association analysis was conducted by obtaining SNP data and total soluble sugar content using the general linear model (GLM) method in TASSEL version 5.0 for identifying total soluble sugar-related haplotypes (Bradbury et al., 2007). Significant SNPs affecting the target trait were asserted when the test statistics reached P < 0.01.
Candidate genes were further analyzed by analyzing the expression levels of 14 soybean germplasms, including seven germplasms, each with high and low-soluble sugar content. RNA purification kit (TIANGEN, DP432) was used to extract total RNA from soybean seeds. Then, first-strand cDNA was synthesized according to the TIANScript RT kit (TIANGEN, KR104). Real-time fluorescence quantification was conducted by ABI 7500 Fast using SuperRealPreMix Plus (SYBR Green) Kit (TIANGEN, FP205) to confirm the transcript abundance of candidate genes. The reaction systems for reverse transcription and real-time fluorescence quantification were performed according to the manufacturer's instructions. The real-time PCR programs were as follows: holding stage: 95°C for 30 s; cycling stage: 95°C for 3 s, 60°C for 30 s, and 72°C for 30 s for 40 cycles; melt curve stage: 95°C for 15 s, 60°C for 1 min, 95°C for 30 s, and 60°C for 15 s. Three technical replicates and three biological duplications were conducted for each sample. A comparative threshold method (2−ΔΔCT) was utilized to calculate the relative transcript levels of candidate genes in diverse soybean germplasm. GmActin4 (GenBank accession no. AF049106) was considered the internal standard control. The primer sequences for real-time fluorescence quantitative analysis are shown in Supplementary Table S2.
RNA Sequencing and Co-Expression Analysis
According to results from the 278 tested soybean varieties, seven lines with high-soluble sugar content and seven lines with low-soluble sugar content were chosen for RNA-seq analysis. Seeds were collected at the fully developed stage, and each sample had two replicates. The collected samples were rapidly put into liquid nitrogen for freezing and stored at −80°C. Total RNA was extracted from twenty-eight soybean lines using TRIzol reagent (Invitrogen). The quality of RNA samples was examined, and then libraries were successfully constructed. All constructed libraries were sequenced using the Illumina platform.
The differential gene expression (DEG; |log2FC| ≥1.5) was used to calculate the Pearson correlation coefficient. Self-matches and duplicates were removed, and the Pearson correlation cutoff value of 0.87 was obtained. The achieving and visualizing of the network were applied using the Cytoscape 3.6.0 software.
Results
Statistical and Variation Analysis of Total Soluble Sugar Content
As shown in Table 1 and Figure 1, the total soluble sugar content showed a wide range of variation in three test environments on the basis of 278 soybean germplasms, for instance, minimum, maximum, means, coefficient of variation (CV%), skewness, and kurtosis. The phenotypic value varied a lot among different locations, especially the phenotypic value range of “Harbin” (from 79.58 to 164.66 mg/g) was higher than that of “Gongzhuling” (from 55.20 to 121.53 mg/g) and “Shenyang” (from 63.56 to 111.22 mg/g). The CVs% under three locations were observed from 10.52 to 12.89%. Simultaneously, the kurtosis and skewness of the association panel we observed in all tested environments were normal and without any saliency, which indicated that it was suitable for GWAS analysis.
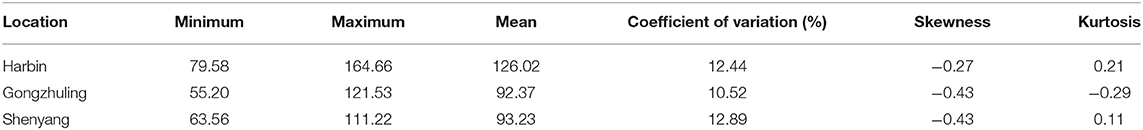
Table 1. Statistical analysis and variation of total soluble sugar content of association panel.
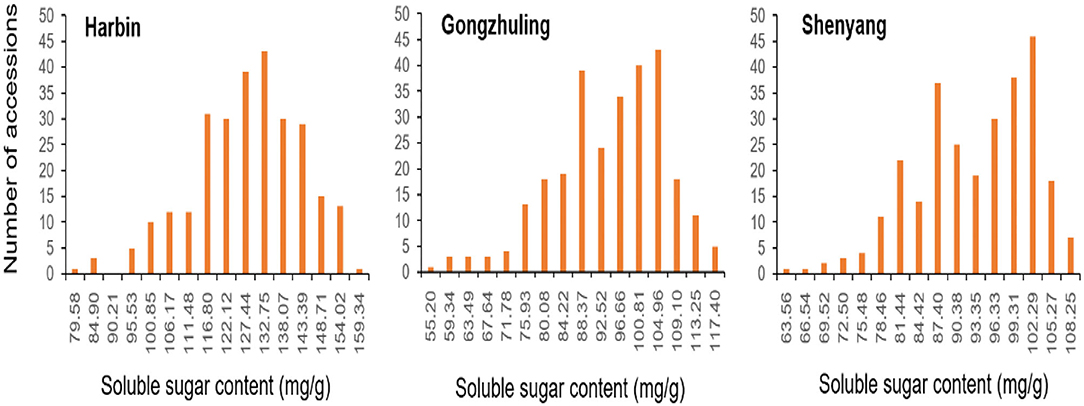
Figure 1. Variation of total soluble sugar content among 278 accessions in three environments (“Harbin,” “Gongzhuling,” and “Shenyang”).
Sequencing and Genotyping
Totally, 25,921 high-quality markers (MAF ≥ 0.05, missing data ≤ 10%) from the genomic DNA of an association panel consisting of 278 soybean germplasms were utilized for genotyping in view of the SLAF-seq approach. These SNPs spanned a wide range of the twenty chromosomes of soybean genome, with a range of 946.7 Mbp totally, accounting for ~86.06% of the soybean genome (Figure 2). Diversity of marker density were observed among different chromosomes with an average distance of 36.52 kb between two SNPs and an average number of 1,296 SNPs per chromosome, which varied from the largest number of 2,894 SNPs in Chr.06 to the fewest number of 385 SNPs in Chr.11.
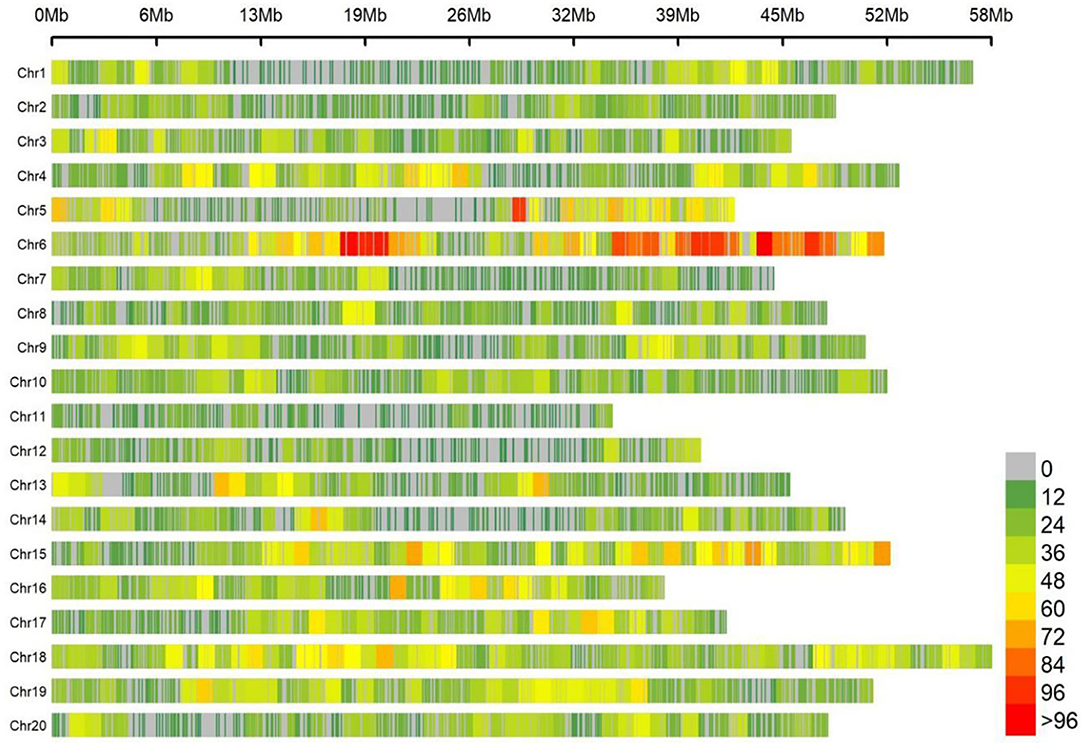
Figure 2. Single-nucleotide polymorphism (SNP) density and distribution across 20 soybean chromosomes.
Analysis of Linkage Disequilibrium and Population Structure
The mapping resolution for genome scans and GWA mapping were depicted by analyzing the average extent of LD decay distance. The mean LD decay distance of the panel was ~216.13 kb, when r2 drops to 0.4 (Figure 3A). A total of 25,921 SNPs were used for scanning the population stratification of association panels through the principal component (PC) and kinship analysis. The results demonstrated that the first three PCs accounted for 14.94% of the genetic variation, PC2 was the point that the entire genetic variation sharply declined, and PC3 was the inflection point, which demonstrated that the first three PCs uncommonly affect the mapping population (Figures 3B,C).
Figure 3. Mapping genetic data of populations. (A) Linkage disequilibrium (LD) decay of genome-wide association study (GWAS) population. (B) The first three PCs of 25,921 SNPs used in the GWAS. (C) Population structure of soybean germplasms.
Quantitative Trait Nucleotides Associated With Total Soluble Sugar Content by GWAS
Totally, thirteen quantitative trait nucleotides (QTNs) that covered ten chromosomes associated with the total soluble sugar content were determined based on RTM-GWAS (Table 2; Figure 4), including rs47259089 on Chr.02, rs27824573 on Chr.06, rs10931728 on Chr.07, rs11039122 on Chr.09, rs5036567 and rs10157456 on Chr.12, rs28054318 on Chr.13, rs36090182 and rs49892059 on Chr.15, rs14145078 on Chr.17, rs9733379 and rs17293362 on Chr.18, and rs25527752 on Chr.19. To confirm whether these detected QTNs are related to total soluble sugar content, the effects of alleles were evaluated. By comparison, the total soluble sugar content of soybean germplasm containing different alleles was found, which indicated that the difference in alleles significantly affected the total soluble sugar content (Table 2). Hence, these appropriate alleles would be beneficial for MAS of soybean with suitable soluble sugar content.
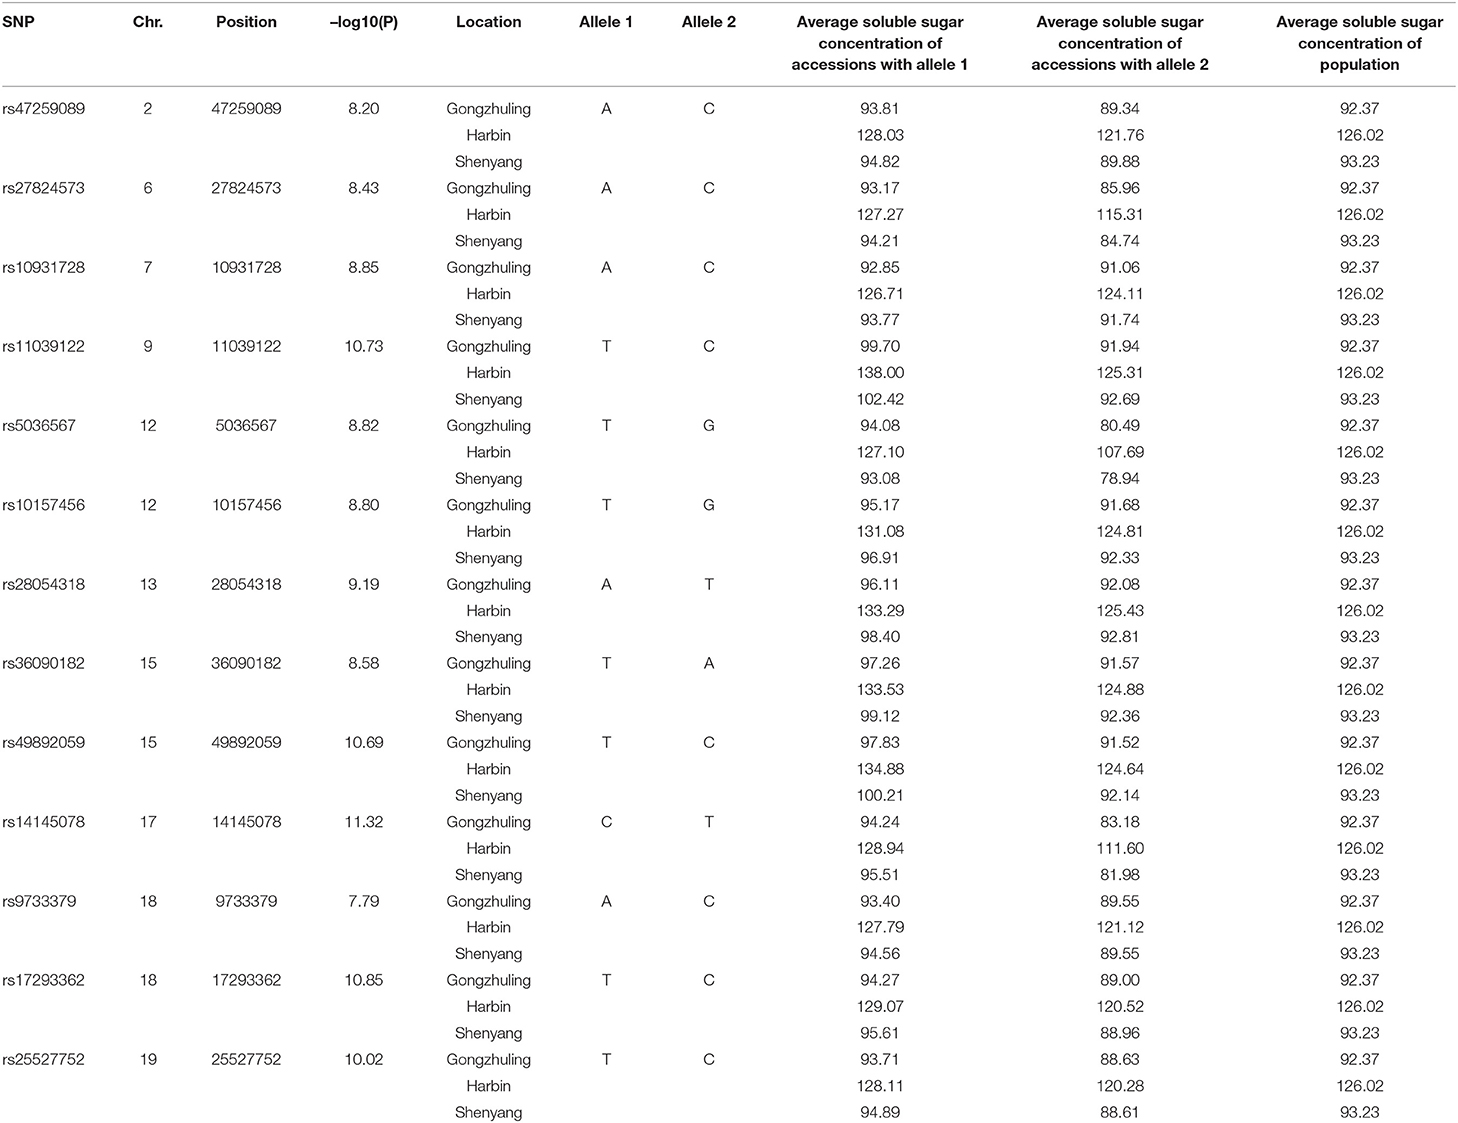
Table 2. Peak SNP and beneficial allele associated with total soluble sugar content identified by GWAS.
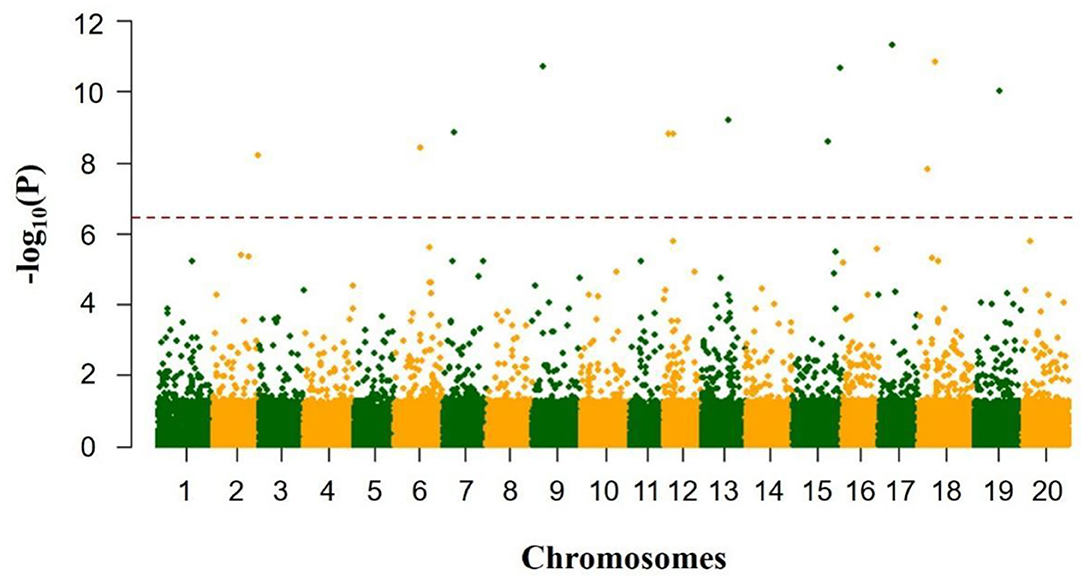
Figure 4. GWAS results of total soluble sugar content from 278 soybean accessions.
Prediction of Candidate Genes Controlling Total Soluble Sugar Content
The 200-kb flanking regions of the thirteen identified QTNs were thought to be candidate regions, and a total of 115 genes with functional annotation were in regions including four genes with unknown functional annotation (Table 3). A total of 107 genes among them were related to cell, cell wall, co-factor and vitamin metabolism, development, DNA, hormone metabolism, lipid metabolism, misc, nucleotide metabolism, protein, PS, redox, RNA, secondary metabolism, signaling, Tricarboxylic Acid/organic transformation, stress, and transport, and other eight genes were not assigned (Supplementary Figure S1).

Table 3. Gene models in the flanking regions of peak SNPs.
Among these genes, Glyma.02G293900 (located 33.658 kb near Chr02: 47259089 on Chr.2), belonged to glycosyl hydrolase, was directly involved in the carbohydrate metabolic process, which could catalyze cellulose to form cellobiose. Glyma.02G294000 (located 21.096 kb near Chr02: 47259089 on Chr.2), a member of O-Glycosyl hydrolases family 17 protein, was involved in the starch and sucrose metabolism, which catalyzes the synthesis of D-glucose. Glyma.12G069000 (located 18.504 kb near Chr12: 5036567 on Chr.12) was a beta-galactosidase 8, and it plays a catalytic role in the process of galactose metabolism and promotes the formation of D-galactose. Glyma.19G072300 (located 40.71 kb near Chr19: 25527752 on Chr.19) was an ADP-glucose pyrophosphorylase family protein, which was involved in the carbohydrate metabolic process.
A gene-based association analysis was performed based on the GLM method to predict the potential effects of candidate genes associated with total soluble sugar content. Through the genome resequencing of twenty lines, including ten higher and ten lower total soluble sugar lines, a total of 117 SNPs with MAF ≥ 0.05 were identified among thirty-two candidate genes. Totally, 84 SNPs from seventeen genes across four chromosomes were significantly associated with the total soluble sugar content. Among them, three SNPs from the gene Glyma.02G292900 were detected at two environments, and other eighty-one SNPs from seventeen genes were detected at all three environments (Figure 5; Supplementary Table S3). Among them, Glyma.02G293900 was reported to be involved in the carbohydrate metabolic process, which is useful for the synthesis of cellobiose, and may further affect sucrose content. Glyma.02G294000 was a member of O-Glycosyl hydrolases family 17 protein, which was involved in the process of starch and sucrose metabolism, which may affect the degradation of UDP-glucose and then influence the soluble sugar content. Other genes could be regarded as novel genes affecting the total soluble sugar content of soybean. The allelic effects of different alleles between each significant SNP were analyzed, and the results demonstrated that there was a significant difference in the soluble sugar content of soybean germplasm under different alleles of twenty candidate genes (Supplementary Table S4). Thus, these beneficial alleles from candidate genes would be useful for MAS in soybeans with a higher soluble sugar content.
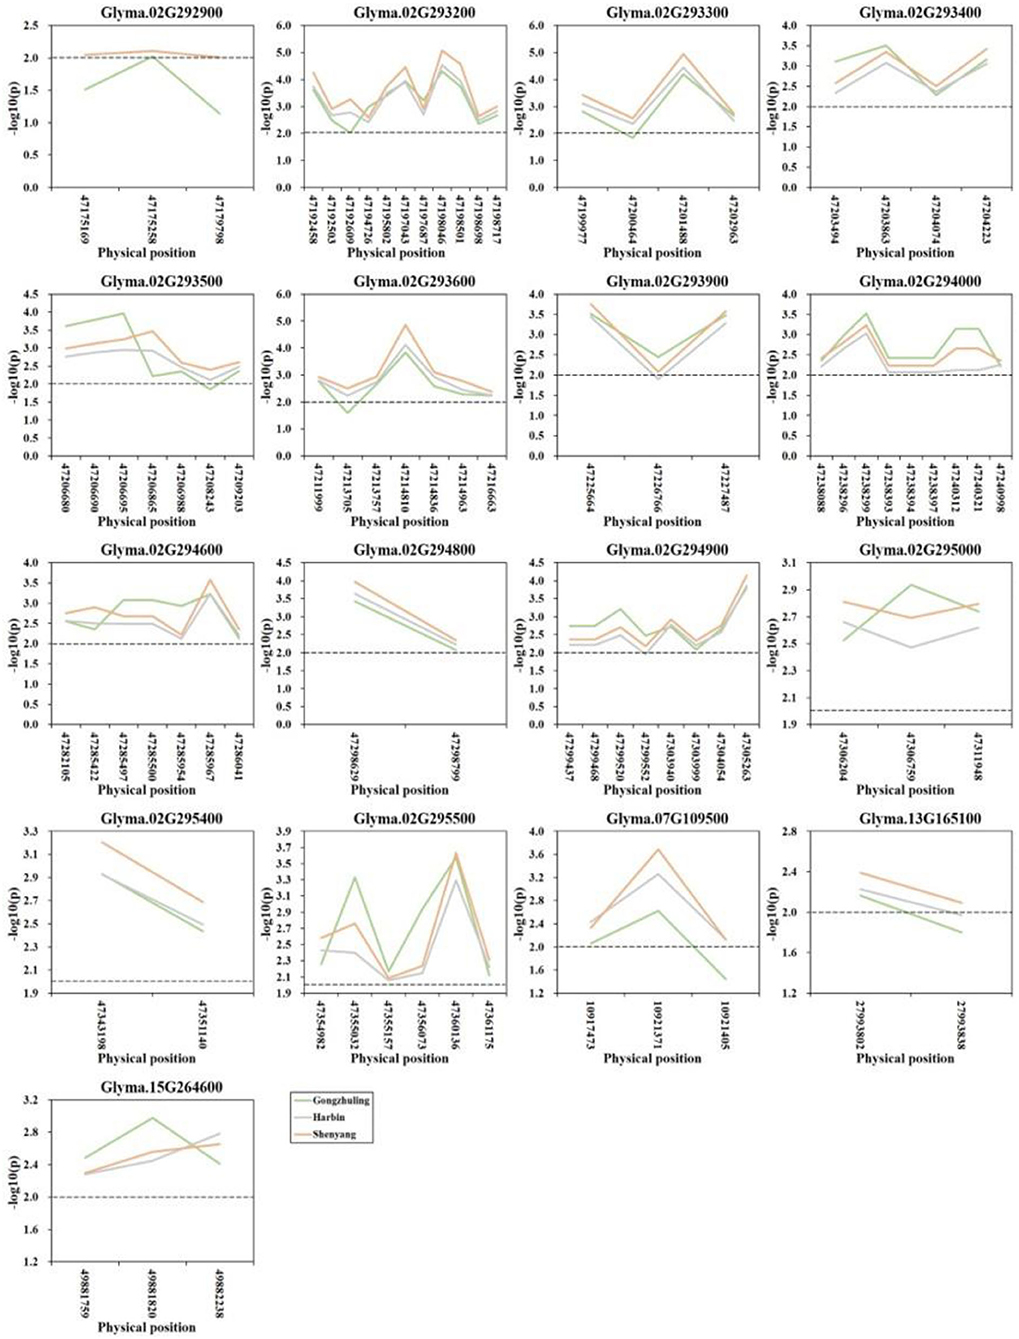
Figure 5. Candidate gene-based association analysis with total soluble sugar content. Horizontal line indicates that the threshold is set to 2.0.
Seventeen candidate genes obtained by haplotype analysis were subjected to expression analysis to further dissect their potential functions, which was based on seven of each soybean germplasm with high- and low-soluble sugar content (Supplementary Figure S2). Among these genes, five genes (i.e., Glyma.02G293400, Glyma.02G293900, Glyma.02G295000, Glyma.07G109500, and Glyma.13G165100) showed low expression or almost no expression in soybean seeds, and the expression levels of other genes in different germplasms showed some differences. The expression levels of the two candidate genes (e.g., Glyma.02G294000 and Glyma.02G294800) in the low-soluble sugar germplasm showed an overall slightly higher expression level than in the high-soluble sugar content germplasm, and other genes showed the opposite trend (Figure 6). We analyzed the correlation between the expression levels of these twelve candidate genes expressed in soybean seeds and soluble sugar content using Pearson's correlation coefficients. As a result, the expression levels of Glyma.02G293200 and Glyma.02G294900 showed a significant positive correlation with soluble sugar content. There was a significant negative correlation between the expression of Glyma.02G294000 and soluble sugar content. The expression levels of other genes showed no significant correlation with soluble sugar content (Supplementary Table S5). These candidate genes detected may play a key role in the regulation of soluble sugar content in soybean seeds.
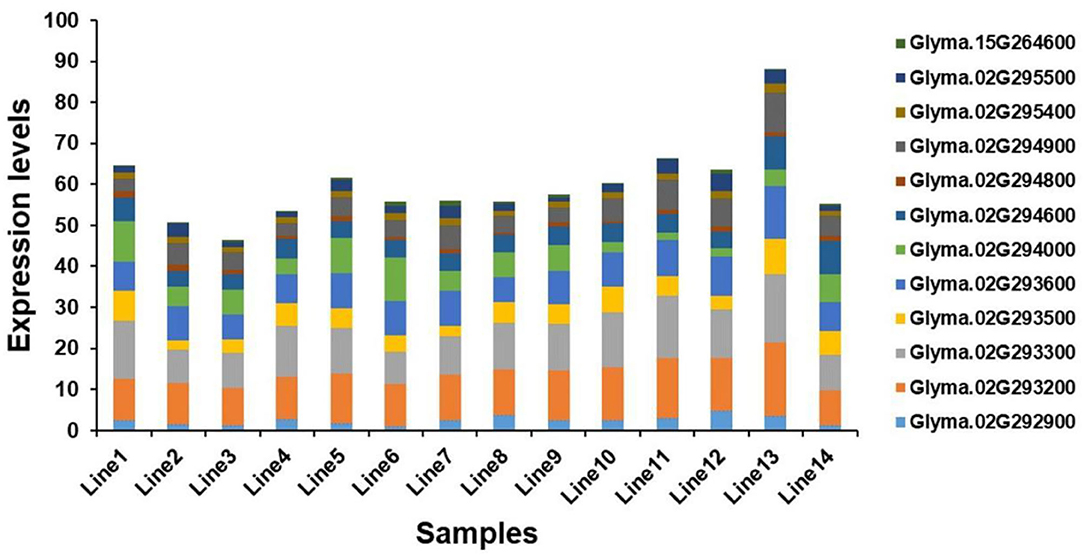
Figure 6. Expression level analysis of candidate genes. Line 1 to Line 7 are germplasms with low-soluble sugar content, and Line 8 to Line 14 are germplasms with high-soluble sugar content.
Construction of Gene Co-Expression Networks Related to Soluble Sugar Content
The DEG (|log2FC| ≥1.5) was detected between soybean lines with high- and low-soluble sugar content and was used to construct the gene co-expression networks of candidate genes. A total of 1,291 DEGs were identified. Among the candidate genes underlying soluble sugar content of soybean seeds, six genes were commonly found with DEG and GWAS, including genes encoding a B-cell receptor-associated 31-like (Glyma.02G292600), Stigma-specific Stig1 family protein (Glyma.02G292700), O-Glycosyl hydrolases family (Glyma.02G294000), Domain of unknown function (Glyma.02G294300), hydroxyproline-rich glycoprotein family protein (Glyma.02G294400), and GDSL-motif lipase 5 (Glyma.15G264200) (Supplementary Table S6).
The expression of the Glyma.02G292600 gene was identified to be correlated with 15 genes, involving integrase-type DNA-binding superfamily protein (Glyma.13G151900, r = 0.93), glycosyl hydrolase 9B8 (Glyma.14G019900, r = 0.91), and oxidative stress 3 (Glyma.05G225900, r = 0.91). The Glyma.02G294000 gene was found to be correlated with only one gene, which is LRR family protein (Glyma.16G191300, r = 0.87) (Figure 7). Meantime, Glyma.02G294000 was found by co-expression and candidate gene-based association analysis and was used as candidate genes for soluble sugar content. In addition, Glyma.02G292700, Glyma.02G294300, Glyma.02G294400, and Glyma.15G264200 genes were discovered to be correlated with 53, 4, 1, and 1 genes, respectively (Supplementary Table S6).
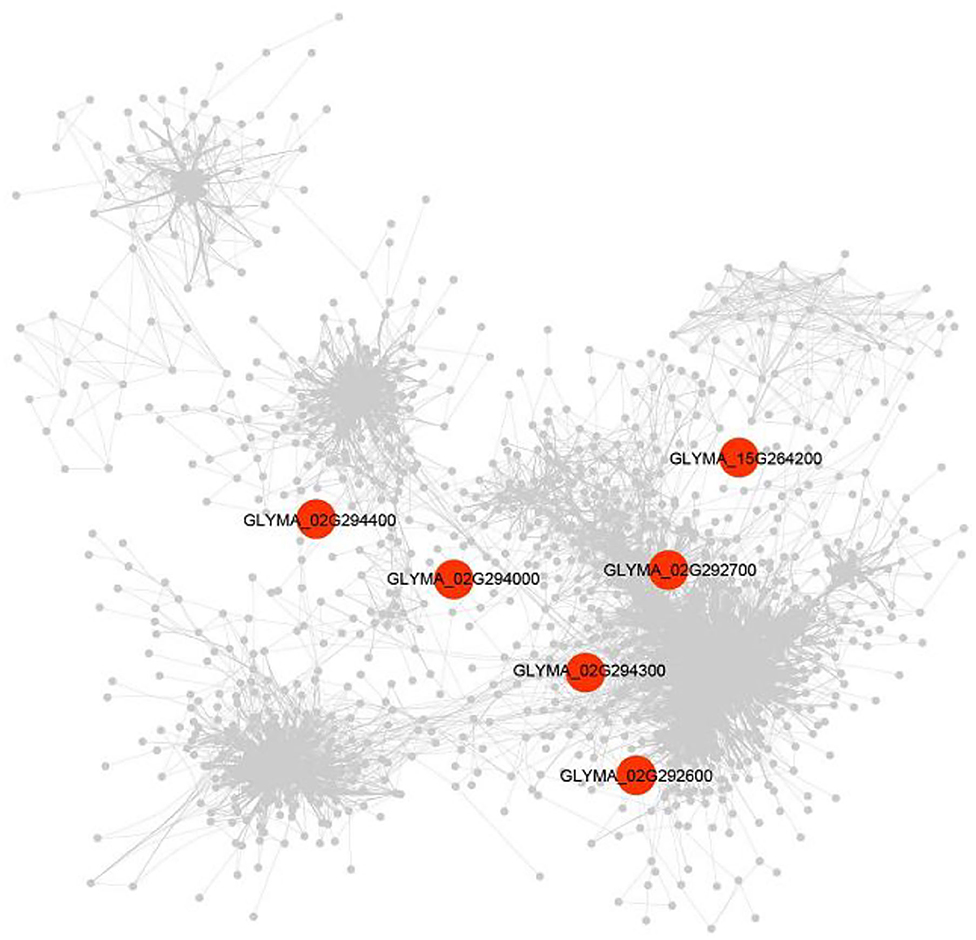
Figure 7. A gene co-expression network underlying soluble sugar content. The co-expression was performed with transcriptome data under high- vs. low-soluble sugar content (n = 1,515). Red shapes represent the genes that were detected by GWAS.
Discussion
Sweetness is an important aspect of the edible quality of vegetable soybeans, and it is one of the distinguishing characteristics of vegetable soybeans from ordinary grain soybeans. The sweetness of vegetable soybeans is mainly attributed to the soluble sugar content, of which the sucrose content accounts for about 71% of the total soluble sugars, which is the key factor determining the sweetness of vegetable soybeans; also, it is highly correlated with the food quality score of vegetable soybeans. Soluble sugar is a major indicator of the intrinsic quality of vegetable soybean. How to increase the soluble sugar content of vegetable soybeans has become an urgent problem to be solved in production. The breeding of soybean lines with suitable soluble sugar content has become the main aspect of soybean fabric breeding. Studies have shown that there were abundant genetic variations in sugar components and total soluble sugar content of soybean germplasm, which could provide abundant germplasm resources for breeding (Geater and Fehr, 2000; Hou et al., 2009). For this study, 278 soybean germplasms were selected for the evaluation of soluble sugar content in fully developed seeds at three locations. In these environments, the soluble sugar content of these tested germplasms demonstrated an extensive variation and the range of variation was similar to previous studies (Hymowitz et al., 1972, 1974). In addition, the soluble sugar content varies greatly in different environments. Until now, few QTLs associated with a soluble sugar content of soybean seeds were reported by linkage analysis. Totally, thirty-seven QTLs related to sucrose concentration and fifteen QTLs related to oligosaccharide concentration were identified (http://www.soybase.org). GWAS was proven to be beneficial for the identification of candidate loci that correlated with numerous traits in crop plants such as soybean (Bandillo et al., 2015; Sonah et al., 2015; Vuong et al., 2015; Patil et al., 2016). A GWAS analysis was performed to sustain the QTL analysis and the major QTL (qSuc_08) for sucrose they identified through more than 91,000 SNPs derived from the cross of G. max (Williams 82) and Glycine soja (PI 483460B) (Patil et al., 2018). For our study, a total of thirteen QTNs related to total soluble sugar content were detected. The QTLs identified in this study did not overlap with previous studies, but some of the candidate genes near the QTLs identified in this study have been shown to be associated with soluble sugar content. Furthermore, the results of our study for QTNs detection indicate that the total soluble sugar content of tested soybean germplasms with excellent alleles was higher than soybean germplasms with other alleles. Therefore, these identified QTNs were effective for regulating the soluble sugar content in soybean.
At present, hundreds of candidate genes are involved in the metabolism process of soluble sugar in soybean (http://www.soybase.org). GWAS was the primary selection for excavating and evaluating major genes due to the relatively short LD fragments (Li et al., 2015). A total of 115 genes in the 200-kb flanking regions of the thirteen identified QTNs were considered candidate genes in this study. Among them, a total of four genes, including Glyma.02G293900, Glyma.02G294000, Glyma.12G069000, and Glyma.19G072300, were proven to be involved in the metabolism of soluble sugar content in plants. To verify the accuracy of these candidate genes, we performed gene-based association analysis and haplotype analysis. As a result, seventeen candidate genes with 84 significant SNPs were detected (Supplementary Tables S3, S4). Glyma.02G293900 and Glyma.02G294000 were the two genes we further validate that were associated with sugar metabolism in soybean, which indicated the reliability of our research. To further explore the candidate genes, we used 14 materials with extreme phenotypic values (seven high-soluble sugar germplasms and seven low-soluble sugar germplasms) to analyze the candidate gene expression levels. The results indicated that the expression levels of Glyma.02G293200 and Glyma.02G294900 were significantly positively correlated with soluble sugar content, and Glyma.02G294000 was significantly negatively correlated with soluble sugar content. Glyma.02G294000 is a member of O-Glycosyl hydrolases family 17 protein that is involved in the metabolic process of starch and sucrose and may affect the degradation of UDP-glucose and the content of soluble sugars. The expression levels of these three candidate genes may directly regulate the soluble sugar content in fully developed grains of soybean. In this study, we found that the Glyma.02G294000 gene was involved in the metabolic process of starch and sucrose. The co-expression analysis found that Glyma.02G294000 gene was found to be correlated with LRR family protein (Glyma.16G191300, r = 0.87). Therefore, we speculate that the Glyma16g191300 gene may be involved in the accumulation of soluble sugar content. Whether other candidate genes may play a role in the soluble sugar content of soybean seeds is also worth exploring. Therefore, the candidate genes and beneficial alleles we detected are valuable for increasing the content of soluble sugar in soybean.
Data Availability Statement
The original contributions presented in the study are publicly available. This data can be found here: https://www.ebi.ac.uk/eva/?eva-study=PRJEB55008. Any queries should be directed to the corresponding author.
Author Contributions
YH designed and supervised the research and contributed to genotyping. WL and MS conceived the study and contributed to population development. XZ and HJ contributed to phenotypic evaluation. DH and XY analyzed the data. WL, MS, and YH wrote the manuscript. All authors read and approved the final manuscript.
Funding
This study was financially supported by the National Natural Science Foundation of China (31971967 and 31871650), the National Key Research and Development Program of China (2021YFD1201604 and 2019YFD1002601), the Youth and Middle-aged Scientific and Technological Innovation Leading Talents Program of the Crops (2015RA228), the National Ten Thousand Talent Program (W03020275), the Postdoctoral Scientific Research Development Fund of Heilongjiang Province (LBH-Z15017 and LBH-Q17015), and the Program on Industrial Technology System of National Soybean (CARS-04-PS06).
Conflict of Interest
The authors declare that the research was conducted in the absence of any commercial or financial relationships that could be construed as a potential conflict of interest.
Publisher's Note
All claims expressed in this article are solely those of the authors and do not necessarily represent those of their affiliated organizations, or those of the publisher, the editors and the reviewers. Any product that may be evaluated in this article, or claim that may be made by its manufacturer, is not guaranteed or endorsed by the publisher.
Supplementary Material
The Supplementary Material for this article can be found online at: https://www.frontiersin.org/articles/10.3389/fpls.2022.930639/full#supplementary-material
Supplementary Figure S1. Functional categories of the candidate genes related to soluble sugar content in soybean.
Supplementary Figure S2. Soluble sugar content of 14 soybean germplasms. 1–7 represent germplasm with low-soluble sugar content, and 8–14 represent germplasm with high-soluble sugar content.
Supplementary Table S1. Source of 278 soybean accessions.
Supplementary Table S2. PCR primers used for expression analysis by RT-qPCR.
Supplementary Table S3. Haplotype analysis of candidate genes.
Supplementary Table S4. Haplotypes analysis of genes related to total soluble sugar content. Significance of ANOVA: *P < 0.05, **P < 0.01.
Supplementary Table S5. Correlation analysis of soluble sugar contents with expression levels of candidate genes.
Supplementary Table S6. The Pearson correlation analysis of transcriptome data.
References
Akond, M., Liu, S., Kantartzi, S. K., Meksem, K., Bellaloui, N., Lightfoot, D. A., et al. (2015). Quantitative trait loci underlying seed sugars content in “MD96-5722” by “Spencer” recombinant inbred line population of soybean. Food Nutr. Sci. 6, 964. doi: 10.4236/fns.2015.611100
Bandillo, N., Jarquin, D., Song, Q., Nelson, R. L., Cregan, P., Specht, J., et al. (2015). A population structure and genome-wide association analysis on the USDA soybean germplasm collection. Plant Genome 8, 1–13. doi: 10.3835/plantgenome2015.04.0024
Bradbury, P. J., Zhang, Z., Kroon, D. E., Casstevens, T. M., Ramdoss, Y., and Buckler, E. S. (2007). TASSEL: software for association mapping of complex traits in diverse samples. Bioinformatics 23, 2633–2635. doi: 10.1093/bioinformatics/btm308
Cao, Y., Li, S., Wang, Z., Chang, F., Kong, J., Gai, J., et al. (2017). Identification of major quantitative trait loci for seed oil content in soybeans by combining linkage and genome-wide association mapping. Front. Plant Sci. 8, 1222. doi: 10.3389/fpls.2017.01222
Cheng, P., Gedling, C. R., Patil, G., Vuong, T. D., Shannon, J. G., Dorrance, A. E., et al. (2017). Genetic mapping and haplotype analysis of a locus for quantitative resistance to Fusarium graminearum in soybean accession PI 567516C. Theor. Appl. Genet. 130, 999. doi: 10.1007/s00122-017-2866-8
Fox, J. D., and Robyt, J. F. (1991). Miniaturization of three carbohydrate analyses using a microsample plate reader. Anal. Biochem. 195, 93–96. doi: 10.1016/0003-2697(91)90300-I
Geater, C. W., and Fehr, W. R. (2000). Association of total sugar content with other seed traits of diverse soybean cultivars. Crop Sci. 40, 1552–1555. doi: 10.2135/cropsci2000.4061552x
Golicz, A. A., Batley, J., and Edwards, D. (2016). Towards plant pangenomics. Plant Biotechnol. J. 14, 1099–1105. doi: 10.1111/pbi.12499
Grant, D., Nelson, R. T., Cannon, S. B., and Shoemaker, R. C. (2010). SoyBase, the USDA-ARS soybean genetics and genomics database. Nucleic Acids Res. 38, D843–D846. doi: 10.1093/nar/gkp798
Han, Y., Zhao, H., Li, D., Li, Y., Lightfoot, D. A., Yang, Z., et al. (2016). Domestication footprints anchor genomic regions of agronomic importance in soybeans. New Phytol. 209, 871–884. doi: 10.1111/nph.13626
He, J., Meng, S., Zhao, T., Xing, G., Yang, S., Li, Y., et al. (2017). An innovative procedure of genome-wide association analysis fits studies on germplasm population and plant breeding. Theor. Appl. Genet. 130, 2327–2343. doi: 10.1007/s00122-017-2962-9
Hou, A., Chen, P., Alloatti, J., Li, D., Mozzoni, L., Zhang, B., et al. (2009). Genetic variability of seed sugar content in worldwide soybean germplasm collections. Crop Sci. 49, 903–912. doi: 10.2135/cropsci2008.05.0256
Hwang, E.-Y., Song, Q., Jia, G., Specht, J. E., Hyten, D. L., Costa, J., et al. (2014). A genome-wide association study of seed protein and oil content in soybean. BMC Genom. 15, 1–12. doi: 10.1186/1471-2164-15-1
Hymowitz, T., Collins, F., Panczner, J., and Walker, W. (1972). Relationship between the content of oil, protein, and sugar in soybean seed 1. Agron. J. 64, 613–616. doi: 10.2134/agronj1972.00021962006400050019x
Hymowitz, T., Dudley, J., Collins, F., and Brown, C. (1974). Estimations of protein and oil concentration in corn, soybean, and oat seed by near-infrared light reflectance 1. Crop Sci. 14, 713–715. doi: 10.2135/cropsci1974.0011183X001400050031x
Jiang, G. L., Rutto, L. K., Ren, S., et al. (2018). Genetic analysis of edamame seed composition and trait relationships in soybean lines. Euphytica. 214, 158. doi: 10.1007/s10681-018-2237-9
Kao, C. F., He, S. S., Wang, C. S., Lai, Z. Y., Lin, D. G., and Chen, S. (2020). A modified Roger's distance algorithm for mixed quantitative-qualitative phenotypes to establish a Core collection for Taiwanese vegetable soybeans. Front. Plant Sci. 11, 612106. doi: 10.3389/fpls.2020.612106
Khan, M. A., Tong, F., Wang, W., He, J., Zhao, T., and Gai, J. (2019). Correction to: Analysis of QTL–allele system conferring drought tolerance at seedling stage in a nested association mapping population of soybean [Glycine max (L.) Merr.] using a novel GWAS procedure. Planta 249, 1653–1653. doi: 10.1007/s00425-019-03143-0
Kim, H.-K., Kang, S.-T., Cho, J.-H., Choung, M.-G., and Suh, D.-Y. (2005). Quantitative trait loci associated with oligosaccharide and sucrose contents in soybean (Glycine max L.). J. Plant Biol. 48, 106–112. doi: 10.1007/BF03030569
Kim, H. K., Kang, S. T., and Oh, K. W. (2006). Mapping of putative quantitative trait loci controlling the total oligosaccharide and sucrose content of Glycine max seeds. J. Plant Res. 119, 533–538. doi: 10.1007/s10265-006-0004-9
Krober, O. A., and Cartter, J. L. (1962). Quantitative interrelations of protein and nonprotein constituents of soybeans 1. Crop Sci. 2, 171–172. doi: 10.2135/cropsci1962.0011183X000200020028x
Kumar, V., Rani, A., Goyal, L., Pratap, D., Billore, S. D., and Chauhan, G. S. (2011). Evaluation of vegetable-type soybean for sucrose, taste-related amino acids, and isoflavones contents. Int. J. Food Prop. 14, 1142–1151. doi: 10.1080/10942911003592761
Kuo, T. M., VanMiddlesworth, J. F., and Wolf, W. J. (1988). Content of raffinose oligosaccharides and sucrose in various plant seeds. J. Agr. Food Chem. 36, 32–36. doi: 10.1021/jf00079a008
Li, Y.-H., Reif, J. C., Ma, Y.-S., Hong, H.-L., Liu, Z.-X., Chang, R.-Z., et al. (2015). Targeted association mapping demonstrating the complex molecular genetics of fatty acid formation in soybean. BMC Genom. 16, 1–13. doi: 10.1186/s12864-015-2049-4
Lipka, A. E., Tian, F., Wang, Q., Peiffer, J., Li, M., Bradbury, P. J., et al. (2012). GAPIT: genome association and prediction integrated tool. Bioinformatics 28, 2397–2399. doi: 10.1093/bioinformatics/bts444
Maroof, M. A. S., and Buss, G. R. (2011). Low Phytic Acid, Low Stachyose, High Sucrose Soybean Lines. United States Patent Appl. Publ. U.S. Patent No. 8,003,856.
Openshaw, S., and Hadley, H. (1978). Maternal effects on sugar content in soybean seeds 1. Crop Sci. 18, 581–584. doi: 10.2135/cropsci1978.0011183X001800040014x
Patil, G., Do, T., Vuong, T. D., Valliyodan, B., Lee, J.-D., Chaudhary, J., et al. (2016). Genomic-assisted haplotype analysis and the development of high-throughput SNP markers for salinity tolerance in soybean. Sci. Rep. 6, 1–13. doi: 10.1038/srep19199
Patil, G., Vuong, T. D., Kale, S., Valliyodan, B., Deshmukh, R., Zhu, C., et al. (2018). Dissecting genomic hotspots underlying seed protein, oil, and sucrose content in an interspecific mapping population of soybean using high-density linkage mapping. Plant Biotechnol. J. 16, 1939–1953. doi: 10.1111/pbi.12929
Sonah, H., O'Donoughue, L., Cober, E., Rajcan, I., and Belzile, F. (2015). Identification of loci governing eight agronomic traits using a GBS-GWAS approach and validation by QTL mapping in soya bean. Plant Biotechnol. J. 13, 211–221. doi: 10.1111/pbi.12249
Sun, X., Liu, D., Zhang, X., Li, W., Liu, H., Hong, W., et al. (2013). SLAF-seq: an efficient method of large-scale de novo SNP discovery and genotyping using high-throughput sequencing. PLoS ONE 8, e58700. doi: 10.1371/journal.pone.0058700
Taira, H. (1990). Quality of soybeans for processed foods in Japan. Jpn. Agric. Res. Q. 24, 224–230.
Varshney, R. K., Sinha, P., Singh, V. K., Kumar, A., Zhang, Q., and Bennetzen, J. L. (2020). 5Gs for crop genetic improvement. Curr. Opin. Plant Biol. 56, 190–196. doi: 10.1016/j.pbi.2019.12.004
Vuong, T., Sonah, H., Meinhardt, C., Deshmukh, R., Kadam, S., Nelson, R., et al. (2015). Genetic architecture of cyst nematode resistance revealed by genome-wide association study in soybean. BMC Genom. 16, 1–13. doi: 10.1186/s12864-015-1811-y
Wang, Y., Chen, P., and Zhang, B. (2014). Quantitative trait loci analysis of soluble sugar contents in soybean. Plant Breed. 133, 493–498. doi: 10.1111/pbr.12178
Keywords: genome-wide association analysis, candidate genes, soluble sugar, vegetable soybean, single nucleotide polymorphism
Citation: Lu W, Sui M, Zhao X, Jia H, Han D, Yan X and Han Y (2022) Genome-Wide Identification of Candidate Genes Underlying Soluble Sugar Content in Vegetable Soybean (Glycine max L.) via Association and Expression Analysis. Front. Plant Sci. 13:930639. doi: 10.3389/fpls.2022.930639
Received: 28 April 2022; Accepted: 18 May 2022;
Published: 04 August 2022.
Edited by:
Xujun Fu, Zhejiang Academy of Agricultural Sciences, ChinaReviewed by:
Hengyou Zhang, Northeast Institute of Geography and Agroecology (CAS), ChinaLong Yan, Hebei Academy of Agriculture and Forestry Sciences (HAAFS), China
Xiaobo Wang, Anhui Agricultural University, China
Copyright © 2022 Lu, Sui, Zhao, Jia, Han, Yan and Han. This is an open-access article distributed under the terms of the Creative Commons Attribution License (CC BY). The use, distribution or reproduction in other forums is permitted, provided the original author(s) and the copyright owner(s) are credited and that the original publication in this journal is cited, in accordance with accepted academic practice. No use, distribution or reproduction is permitted which does not comply with these terms.
*Correspondence: Yingpeng Han, aHlwMjM0Mjg2QGFsaXl1bi5jb20=
†These authors have contributed equally to this work