 Yanming Zhao1,2†
 Miaomiao Zhou
 Guiying Wang
 Chengfu Su
- 1College of Agronomy, Qingdao Agricultural University, Qingdao, China
- 2Shandong Provincial Key Laboratory of Dryland Farming Technology, Qingdao Agricultural University, Qingdao, China
Kernel size is an important agronomic trait for grain yield in maize. The purpose of this study was to validate a major quantitative trait locus (QTL), qKW-1, which was identified in the F2 and F2:3 populations from a cross between the maize inbred lines SG5/SG7 and to predict candidate genes for kernel width (KW) in maize. A major QTL, qKW-1, was mapped in multiple environments in our previous study. To validate and fine map qKW-1, near-isogenic lines (NILs) with 469 individuals were developed by continuous backcrossing between SG5 as the donor parent and SG7 as the recurrent parent. Marker-assisted selection was conducted from the BC2F1 generation with simple sequence repeat (SSR) markers near qKW-1. A secondary linkage map with four markers, PLK12, PLK13, PLK15, and PLK17, was developed and used for mapping the qKW-1 locus. Finally, qKW-1 was mapped between the PLK12 and PLK13 intervals, with a distance of 2.23 cM to PLK12 and 0.04 cM to PLK13, a confidence interval of 5.3 cM and a phenotypic contribution rate of 23.8%. The QTL mapping result obtained was further validated by using selected overlapping recombinant chromosomes on the target segment of maize chromosome 3. Transcriptome analysis showed that a total of 12 out of 45 protein-coding genes differentially expressed between the two parents were detected in the identified qKW-1 physical interval by blasting with the Zea_Mays_B73 v4 genome. GRMZM2G083176 encodes the Niemann–Pick disease type C, and GRMZM2G081719 encodes the nitrate transporter 1 (NRT1) protein. The two genes GRMZM2G083176 and GRMZM2G081719 were predicted to be candidate genes of qKW-1. Reverse transcription-polymerase chain reaction (RT-qPCR) validation was conducted, and the results provide further proof of the two candidate genes most likely responsible for qKW-1. The work will not only help to understand the genetic mechanisms of KW in maize but also lay a foundation for further cloning of promising loci.
Introduction
Maize is one of the most important agricultural crops and serves as a food, animal feed, and industrial material (Li et al., 2017). Maize is very important in food security (Liu et al., 2014). Obtaining high grain yield is one of the most important goals for breeders in maize breeding. However, many yield traits are complex quantitative traits that are controlled by multiple genes. Kernel size traits, including kernel length, kernel width (KW), and kernel thickness, are considered important traits affecting yield (Doebley et al., 2006). As one of the most important yield components, KW has high heritability and is less affected by the environment (Veldboom and Lee, 1994, 1996; Peng et al., 2011). Therefore, analyzing the genetic basis of KW has theoretical guiding significance for the innovation of germplasm resources and the cultivation of high-yielding varieties in maize breeding.
Along with the rapid development of maize genomics and utilization of novel molecular markers, the study of quantitative trait locus (QTL) mapping related to kernel size traits has made remarkable progress in maize. QTLs controlling important agronomic traits in maize were detected by analyzing phenotypic value based on constructed genetic maps. Veldboom and Lee (1994) developed an F2:3 population that contains 150 lines derived from a cross between Mo17 and H99. The population was used for QTL mapping of maize kernel-related traits. Five QTLs controlling kernel length were detected on chromosomes 1, 3, 6, 7, and 8, whereas six QTLs controlling 100-kernel weight were detected on chromosomes 1, 3, 4, 5, and 8 (Veldboom and Lee, 1994). Li et al. (2009) used the important maize inbred lines Huangzao number 4 and Qi 319 as materials to construct a segregation population. A population containing 226 F2:3 lines was applied to detect QTLs conferring kernel-related traits. The results showed that 15 kernel-related QTLs were detected in the F2:3 population, and most of the kernel-related traits were significantly correlated with each other, whereas kernel thickness was negatively correlated with maize yield (Li et al., 2009). Peng et al. (2011) used the maize inbred line 319 cross Ye 478 and Huangzao number 4, respectively, to construct segregation populations, and two populations containing 230 and 235 lines, respectively, were developed and applied for QTL mapping for kernel-related traits in maize. The results showed that a major QTL for KW was detected with a phenotypic contribution rate greater than 10% (Peng et al., 2011). Li et al. (2010c) constructed a recombinant inbred line (RIL) population, F2:3 groups and BC2F2 groups by crossing two maize inbred lines with different kernel shapes, Dan 232 and N04. QTL mapping results showed that 5 important meta-QTLs were detected on chromosomes 1, 4, 5, 7, and 10 (Li et al., 2010c). Qin et al. (2015) developed an RIL population with 130 lines by crossing Huangzao number 4 and Mo17 for mapping QTLs conferring KW in maize. A total of 4 KW QTLs were identified with contribution rates of 6.01–15.91%, among which the physical interval for Qqkwid 10 decreased to 143.4–143.7 Mb (Qin et al., 2015). Li et al. (2016) selected 627 important maize inbred lines as materials and used correlation analysis and stepwise regression methods to explore the kernel characteristics of Chinese maize inbred line germplasm resources. The results showed that the contribution rate of KW to 100-grain volume is between 54 and 71% (Li et al., 2016). Many QTL mapping or fine mapping works for kernel size or kernel weight have been completed in recent years (Liu et al., 2014; Zhang et al., 2014; Chen et al., 2016). To date, more than 150 QTLs for kernel size or weight have been identified by using different maize populations (Gramene QTL database).
It is especially important that QTLs be validated and fine mapped for application in further marker-assisted breeding processes. Near-isogenic lines (NILs) are among the most widely accepted populations commonly used in QTL fine mapping. NILs have been successfully used in confirming and fine mapping QTLs in many species, such as rice (Lin et al., 2003; Li et al., 2004; Xie et al., 2006) and wheat (Xue et al., 2013; Zheng et al., 2015; Zhang et al., 2020). In maize, Nie et al. (2019) mapped a major QTL, qkrnw4, associated with kernel row number with an NIL. Gao et al. (2019) mapped qLRI4 that conferred leaf rolling index by using NIL populations. Yang et al. (2018) mapped a major QTL, qkc7.03, to a 416.27 kb physical interval for kernel cracking with developed NILs.
Great achievements in QTL mapping or isolating underlying genes for kernel size have been made in many species, such as rice (Wan et al., 2006; Song et al., 2007; Li et al., 2011; Qiu et al., 2012; Kang et al., 2018), Arabidopsis thaliana (Xia et al., 2013; Du et al., 2014), soybean (Xu et al., 2011; Han et al., 2012), and wheat (Sun et al., 2009; Ramya et al., 2010). In particular, genes controlling rice kernel size or weight, such as GS3 (Fan et al., 2006), GS5 (Li et al., 2011), qGL3 (Zhang et al., 2012), GW2 (Song et al., 2007), GW8 (Wang et al., 2012), GS2 (Hu J. et al., 2015), and qGW7/GL7 (Wang et al., 2015), have been successfully cloned. The study of identifying and cloning kernel size-related genes has lagged in maize. Both maize and rice are diploid monocotyledonous gramineous plants. The homologous gene in maize was obtained by blasting the rice genome: this gene most likely controls the same trait in the two species of maize and rice. To date, a large number of genes associated with maize kernels have been identified by using homology-based cloning technology. Li et al. (2010a) successfully cloned two genes, ZmGW2–CHR4 and ZmGW2–CHR5, in a natural maize population by blasting the kernel-related gene GW2 sequence in rice. The GW2 gene in rice is a pleiotropic gene that correlates not only with KW but also kernel weight. Li et al. (2010b) successfully cloned the Zm-GS3 gene in maize by blasting the sequence of the rice kernel-related gene GW3. Previous studies have shown that GW3 is a pleiotropic gene related to kernel length and kernel weight in rice. After cloning and functional analysis of the Zm-GS3 gene, it was found that the Zm-GS3 gene is closely related to kernel development in maize. Liu et al. (2015) successfully cloned the Zm-GS5 gene in maize by blasting the rice kernel shape-related gene GS5 sequence. Zm-GS5 is limited to a small segment on chromosome 3. Previous studies have used the BC2F6 population through multigeneration backcrossing and selfing of the ruminant grass and maize inbred line Mo17 for mapping kernel-related QTLs. A major QTL for kernel weight is limited to a segment of chromosome 3, which is consistent with the segment of the gene Zm-GS5 found in the results of Liu et al. obtained in 2015 (Liu et al., 2015).
Based on previous studies, the purposes of this study were (1) to validate and fine map the identified major QTL qKW-1 by using BC4F2 NILs and (2) to reveal differentially expressed genes (DEGs) between SG5 and SG7 by RNA-sequencing (RNA-seq) technology and predict candidate genes responsible for KW.
Materials and Methods
Near-Isogenic Lines Development and Phenotyping
Near-isogenic lines for the qKW-1 locus were developed by using continuous backcrossing combined with the marker-assisted selection method (Figure 1). F1 hybrid seeds were obtained from a cross between Zea mays L. SG5 and Zea mays L. SG7 in the summer of 2018 in Qingdao, Shandong Province, China. F1 hybrid seeds were planted in winter 2018 in Sanya, China. BC1 seeds were obtained from the backcross between F1 (female parent) and SG7 (recurrent parent). BC2 to BC4 generation materials were planted and obtained alternately in Sanya of Hainan Province and Qingdao of Shandong Province in China from 2019 to 2021. A total of 469 BC4F2 plants were then planted in Qingdao for phenotyping in the summer of 2021.
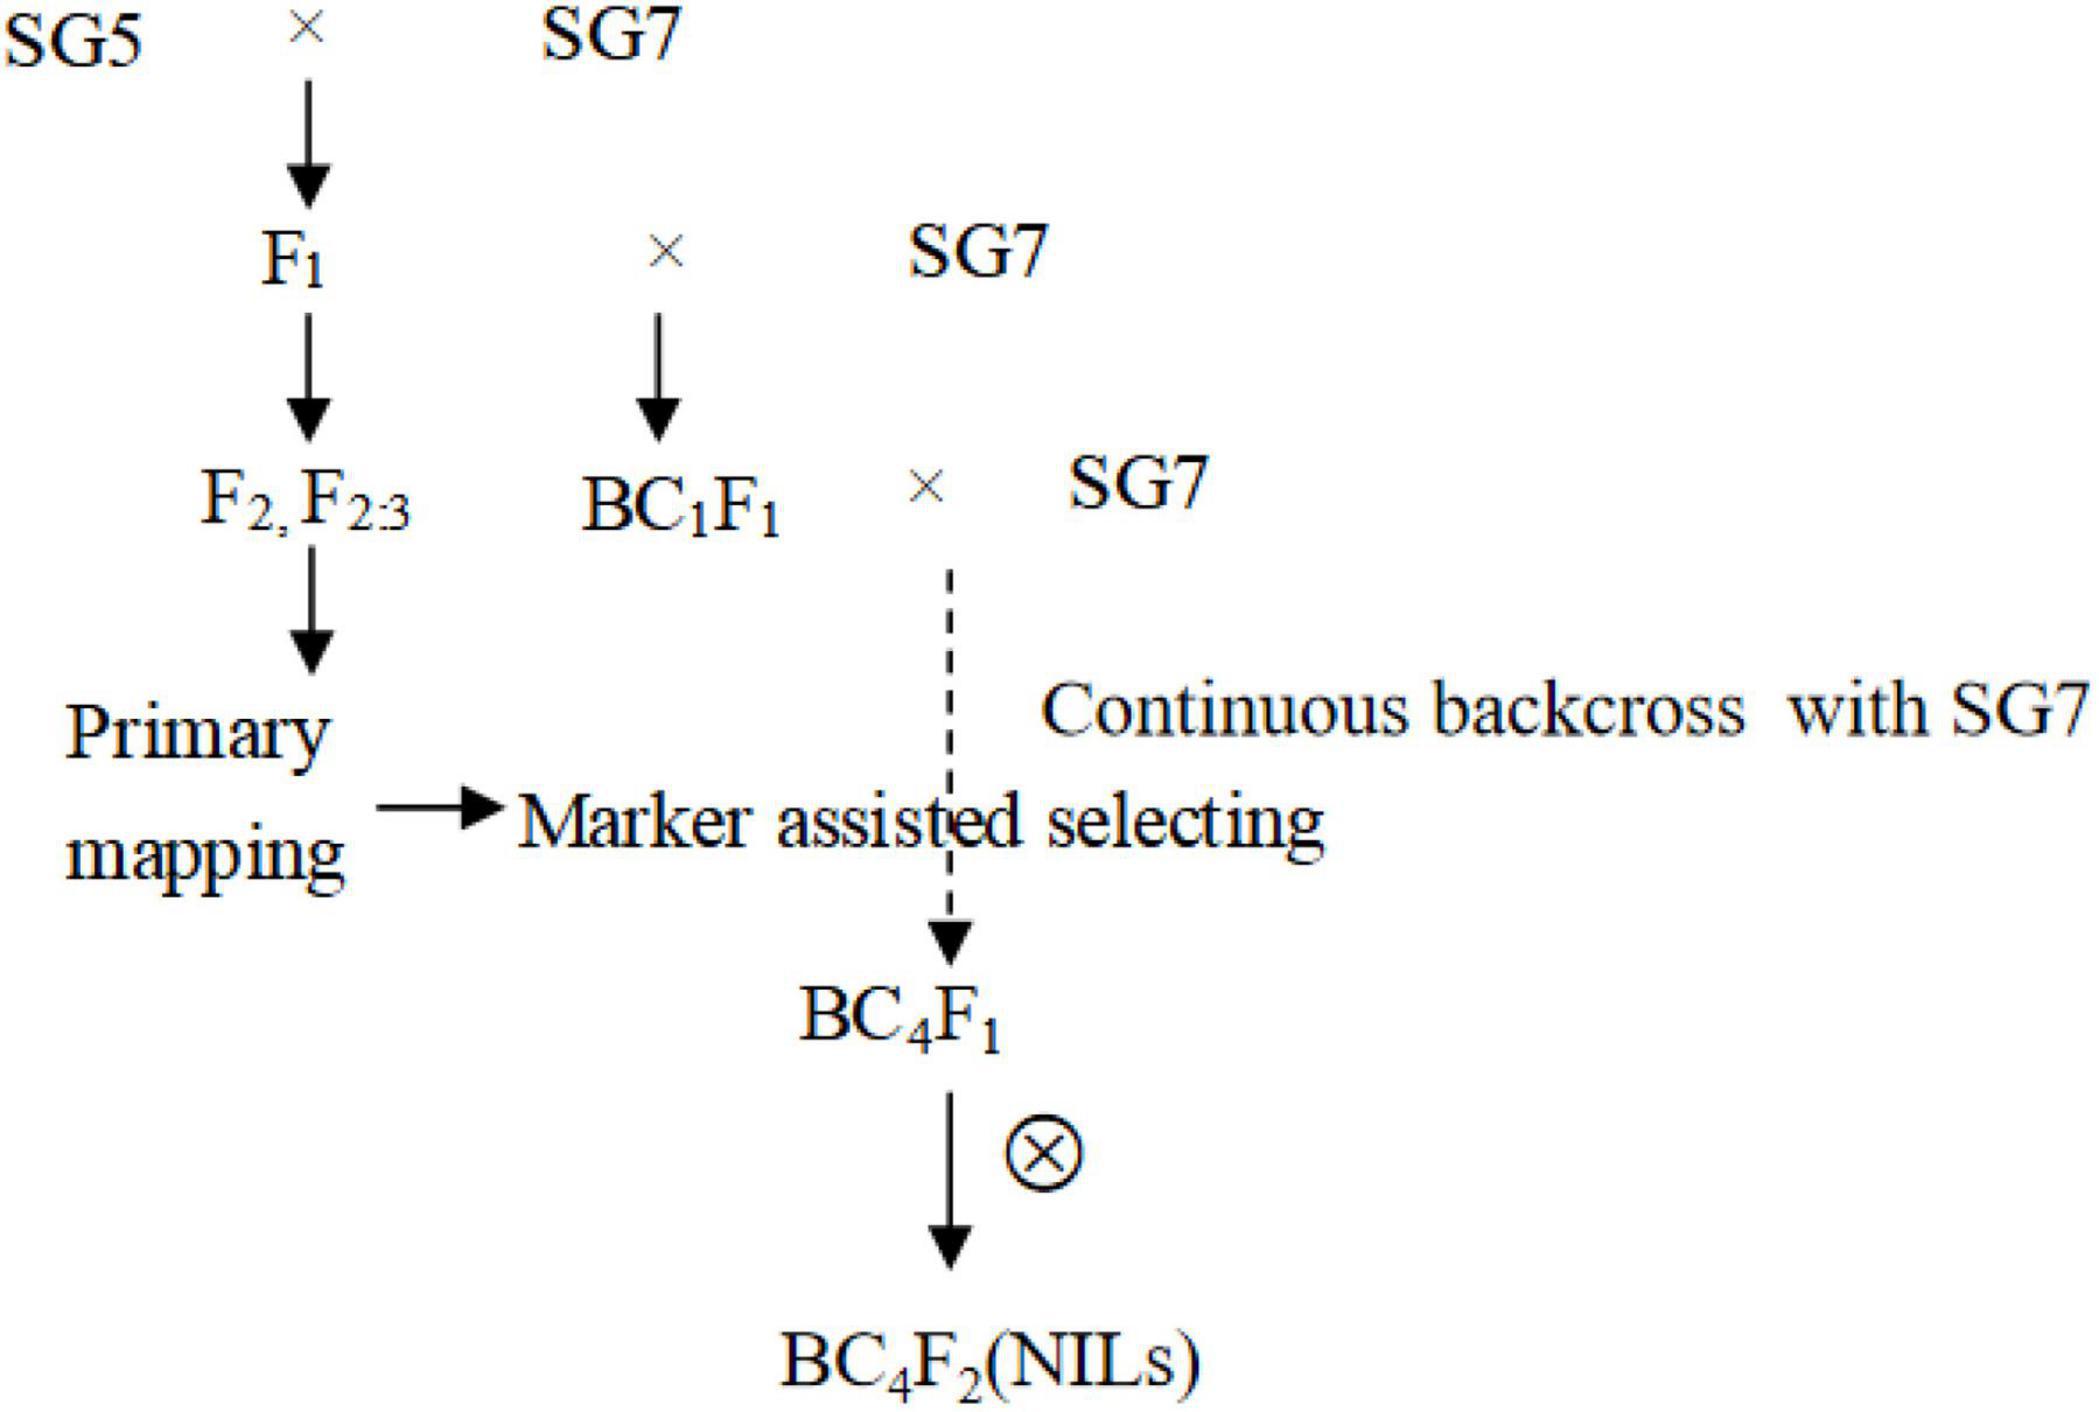
Figure 1. The development process of NILS based on primary mapping results in F2 population from the cross between Zea mays L. SG5 and Zea mays L. SG7. Polymorphic simple sequence repeat (SSR) markers between SG5 and SG7 was used for marker assisted selection from BC2F1 till BC4F1 generation. Heterozygous genotypes for qKW-1 locus were selected by using polymorphic SSR markers in qKW-1 region each generation.
A total of 50 simple sequence repeat (SSR) molecular markers (Supplementary Table 1) within approximately 10 Mb of the physical interval in which qKW-1 was located were selected for polymorphism screening. These SSR primers were synthesized by Shanghai Institutes for Biological Sciences according to the sequences published based on resequencing maize genome results (Xu et al., 2013). Polymorphic SSR markers between donor parent SG5 and recurrent parent SG7 were used for marker-assisted selection from the BC2F1 to BC4F1 generation. From the BC2F1 to BC4F1 generations, heterozygous genotypes for the qKW-1 locus were selected by using polymorphic SSR markers in the qKW-1 region of each generation. The BC4F2 population applied for QTL fine mapping was developed by selfing several BC4F1 individuals with heterozygous qKW-1 loci.
The BC4F2 individuals were planted in the field within boundary rows by using a completely randomized design method. A single-row plot with row spacing of 50 cm was adopted, and each plot grew 15 plants with plant spacing of 35 cm. The KW trait was investigated after the corns were harvested and dried naturally. The phenotypic value of each BC4F2 individual was estimated by the mean value of 10 kernels randomly selected from the middle part of the ear.
DNA Extraction and Genotyping
Young healthy leaves from the two parents, and each of the BC4F2 individuals were collected and frozen in liquid nitrogen and then transferred to an −80°C freezer. Genomic DNA from the BC4F2 population and parents was extracted following the manufacturer’s protocols with the Plant Genomic DNA Kit (TIANGEN, Beijing, China). DNA degradation and contamination were monitored on 1% agarose gels. DNA purity was checked using a NanoPhotometer® spectrophotometer (IMPLEN, Westlake Village, CA, United States). The DNA concentration was measured using a Qubit® DNA Assay Kit with a Qubit® 2.0 Fluorometer (Life Technologies, CA, United States).
Polymorphic SSR markers in the objective heterozygous qKW-1 segment were applied for polyacrylamide gel electrophoresis (PAGE) analysis. Recoding alleles for each SSR in each BC4F2 individual, heterozygous genotypes are coded as 1. Homozygous genotypes identical to SG5 were coded as 0, whereas homozygous genotypes identical to SG7 were coded as 2.
The optimal system was in a 10-μl reaction volume containing 5 μl 2 × 3G Taq Master Mix with Red Dye for PAGE (Vazyme Biotech Co., Ltd., Nanjing, Jiangsu, China), 10 μmol/L forward primer and 1 μl reverse primer, respectively, and 15–20 ng template DNA, with ultrapure grade water added to a total volume of 10 μl. The polymerase chain reactions (PCRs) were performed in BIO-RAD-T100 Thermal Cyclers with the following program: 95°C, 3 min; 95°C, 15 s; 60°C, 15 s, and 72°C, 1 min, followed by 34 additional cycles. PCR products were kept at 4°C and electrophoresed on an 8% native-PAGE gel. Gels were run in PAGE running buffer (1 × TBE) at 120 V for 3 h and then silver-stained. Recoding alleles for each SSR in each BC4F2 individual, heterozygous genotypes are coded as 1. Homozygous genotypes identical to SG5 were coded as 0, whereas homozygous genotypes identical to SG7 were coded as 2.
Near-Isogenic Lines Genetic Background Assessment and Quantitative Trait Locus Validation
Five SSR markers were randomly selected from each of the other nine chromosomes except chromosome 3, in which the qKW-1 locus was located. Forty-five SSR markers were applied for BC4F2 genetic background assessment. The secondary linkage map of the qKW-1 segment was generated by JoinMap 3.0 software (Van Ooijen and Voorrips, 2001) with a logarithm of the odds (LOD) threshold of 10.0. QTL Cartographer v2.5 was applied for QTL mapping with the CIM method, walking speed 1 cM. The LOD score threshold was determined by the result of 1,000 permutations for the KW trait.
Candidate Gene Prediction for qKW-1 by RNA-Sequencing Technology
Grains of SG5 and SG7 were sampled on the 5th, 10th, and 15th days after selfing, with three biological replicates. All collected samples were immediately frozen in liquid nitrogen and then transferred to a −80°C environment before RNA extraction. We obtained 18 grain samples in total. All samples were sequenced on the Illumina NovaSeq platform. Raw reads in fastq format were first processed by in-house Perl scripts. Clean reads were then obtained after deleting reads containing adapter and poly-N sequences and removing reads of low quality from the raw data. In addition, the guanine–cytosine (GC) content, Q20 and Q30 of the clean reads were calculated. High-quality clean data were then used for further downstream analysis. The reference genome was downloaded directly from the genome website,1 and correlated files of gene annotation were also downloaded from the same website. Bowtie v2.2.3 was used to build the reference genome index, and TopHat v2.0.12 (Trapnell et al., 2013) was used to align paired-end clean reads to the reference genome. The number of reads mapped to each gene was counted by HTSeq v0.6.1. For each gene, the expected number of fragments per kilobase of transcript sequence per million base pairs (FPKM) was calculated by analyzing the gene length and reads mapped to the gene. FPKM is a widely accepted method currently used to evaluate levels of gene expression based on considering the sequencing depth effect and gene length of the read count simultaneously (Trapnell et al., 2010). The DEGSeq R package (1.20.0) was applied to analyze differential expression between the two conditions. The p-values adjusted by using the Benjamini and Hochberg method were used. The threshold of corrected p-value 0.005 and log 2 (fold change) of 1 (absolute value) was considered to represent significantly DEGs. More information about the methods for reference genome index construction, paired-end clean read alignment and count, FPKM calculation, and DEG analysis is provided in our previous study (Zhao and Su, 2019).
By analyzing DEGs between SG5 and SG7, the DEGs that were overlaid onto the physical interval of qKW-1 were considered candidate genes for kernel size in maize. The detected DEGs were further annotated based on the Blast SwissProt database.
Reverse Transcription-Polymerase Chain Reaction Analysis
Reverse transcription-polymerase chain reaction (RT-qPCR) experiments for candidate genes were performed to verify the reliability of the RNA-seq experimental data. RT-qPCR primers were designed by the Primer-BLAST2 online tool. Some basic principles for primer design are as follows: the length of the amplification product is between 50 and 150 bp, the primer length is between 18 and 24 nt, the difference between the Tm values of forward and reverse primers should not be too large (less than 3°C), the Tm values should be controlled between 58 and 64°C, and 60°C is the optimal temperature. The GC content in the 45–55% interval is the most suitable. To avoid complementation or hybridization between each pair of primers, the base at the 3′ end of the primer should preferably be G or C. The BLAST procedure is used to test the specificity of the primers. The Evo M-MLV RT-PCR Kit from Sangon Biotech (Shanghai) Co., Ltd. was used for reverse transcription of total RNA to synthesize the first strand of cDNA. The RT-PCR analysis was performed by a real-time fluorescence quantitative PCR instrument using the 2 × SYBR® Green dye method. The actin gene was used as the internal reference gene, and 2–△△Ct was used to analyze the results. The sequences of the primers are listed as follows: Actin (F: GTCCATGAGGCCACGTACAA; R: CCGGACCAGTTTCGTCATA), GRMZM2G083176 (F: GTTCA TGGCTAGATCCGGCA; R: ACGAAGTGAGATGACGACGG), and GRMZM2G081719 (F: CCGGCCACCATCAAGAAGAT; R: CTCCGGTAATGTCTCTGGG). The reaction system and reaction procedure are shown in Supplementary Tables 3, 4.
Results
Quantitative Trait Locus Primary Mapping
The mean value of KW for the female parent SG5 was 8.07 mm, whereas for the male parent SG7 was 11.17 mm. The KW trait was highly and significantly different between SG5 and SG7 (Figures 2, 3B). A major QTL, qKW-1, for the KW trait was repeatedly detected in all three environments, with an average phenotypic variation contribution rate of 15.8%, by using the F2 and F2:3 populations developed from a cross between the maize inbred lines SG5 and SG7 (Wang et al., 2020). NILs will be developed for validating and fine mapping qKW-1 loci next.
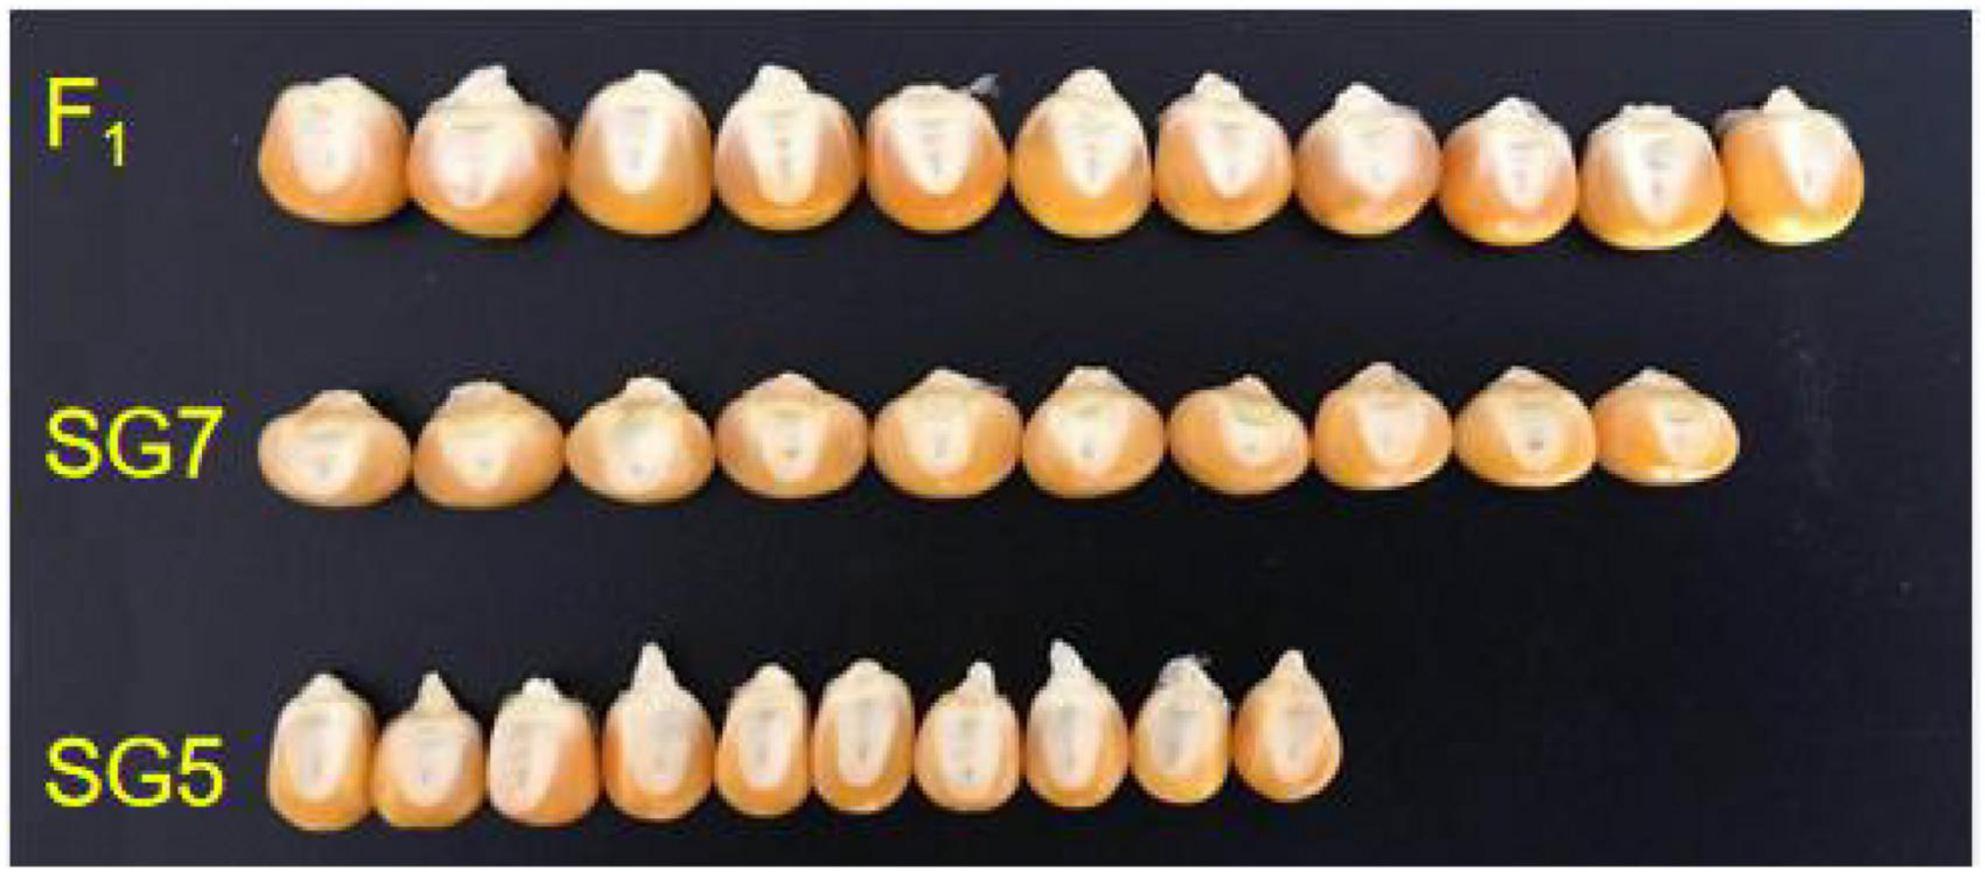
Figure 2. 10 kernel width (KW) difference between SG5, SG7, and F1 hybrid seed derived from the cross between SG5 and SG7.
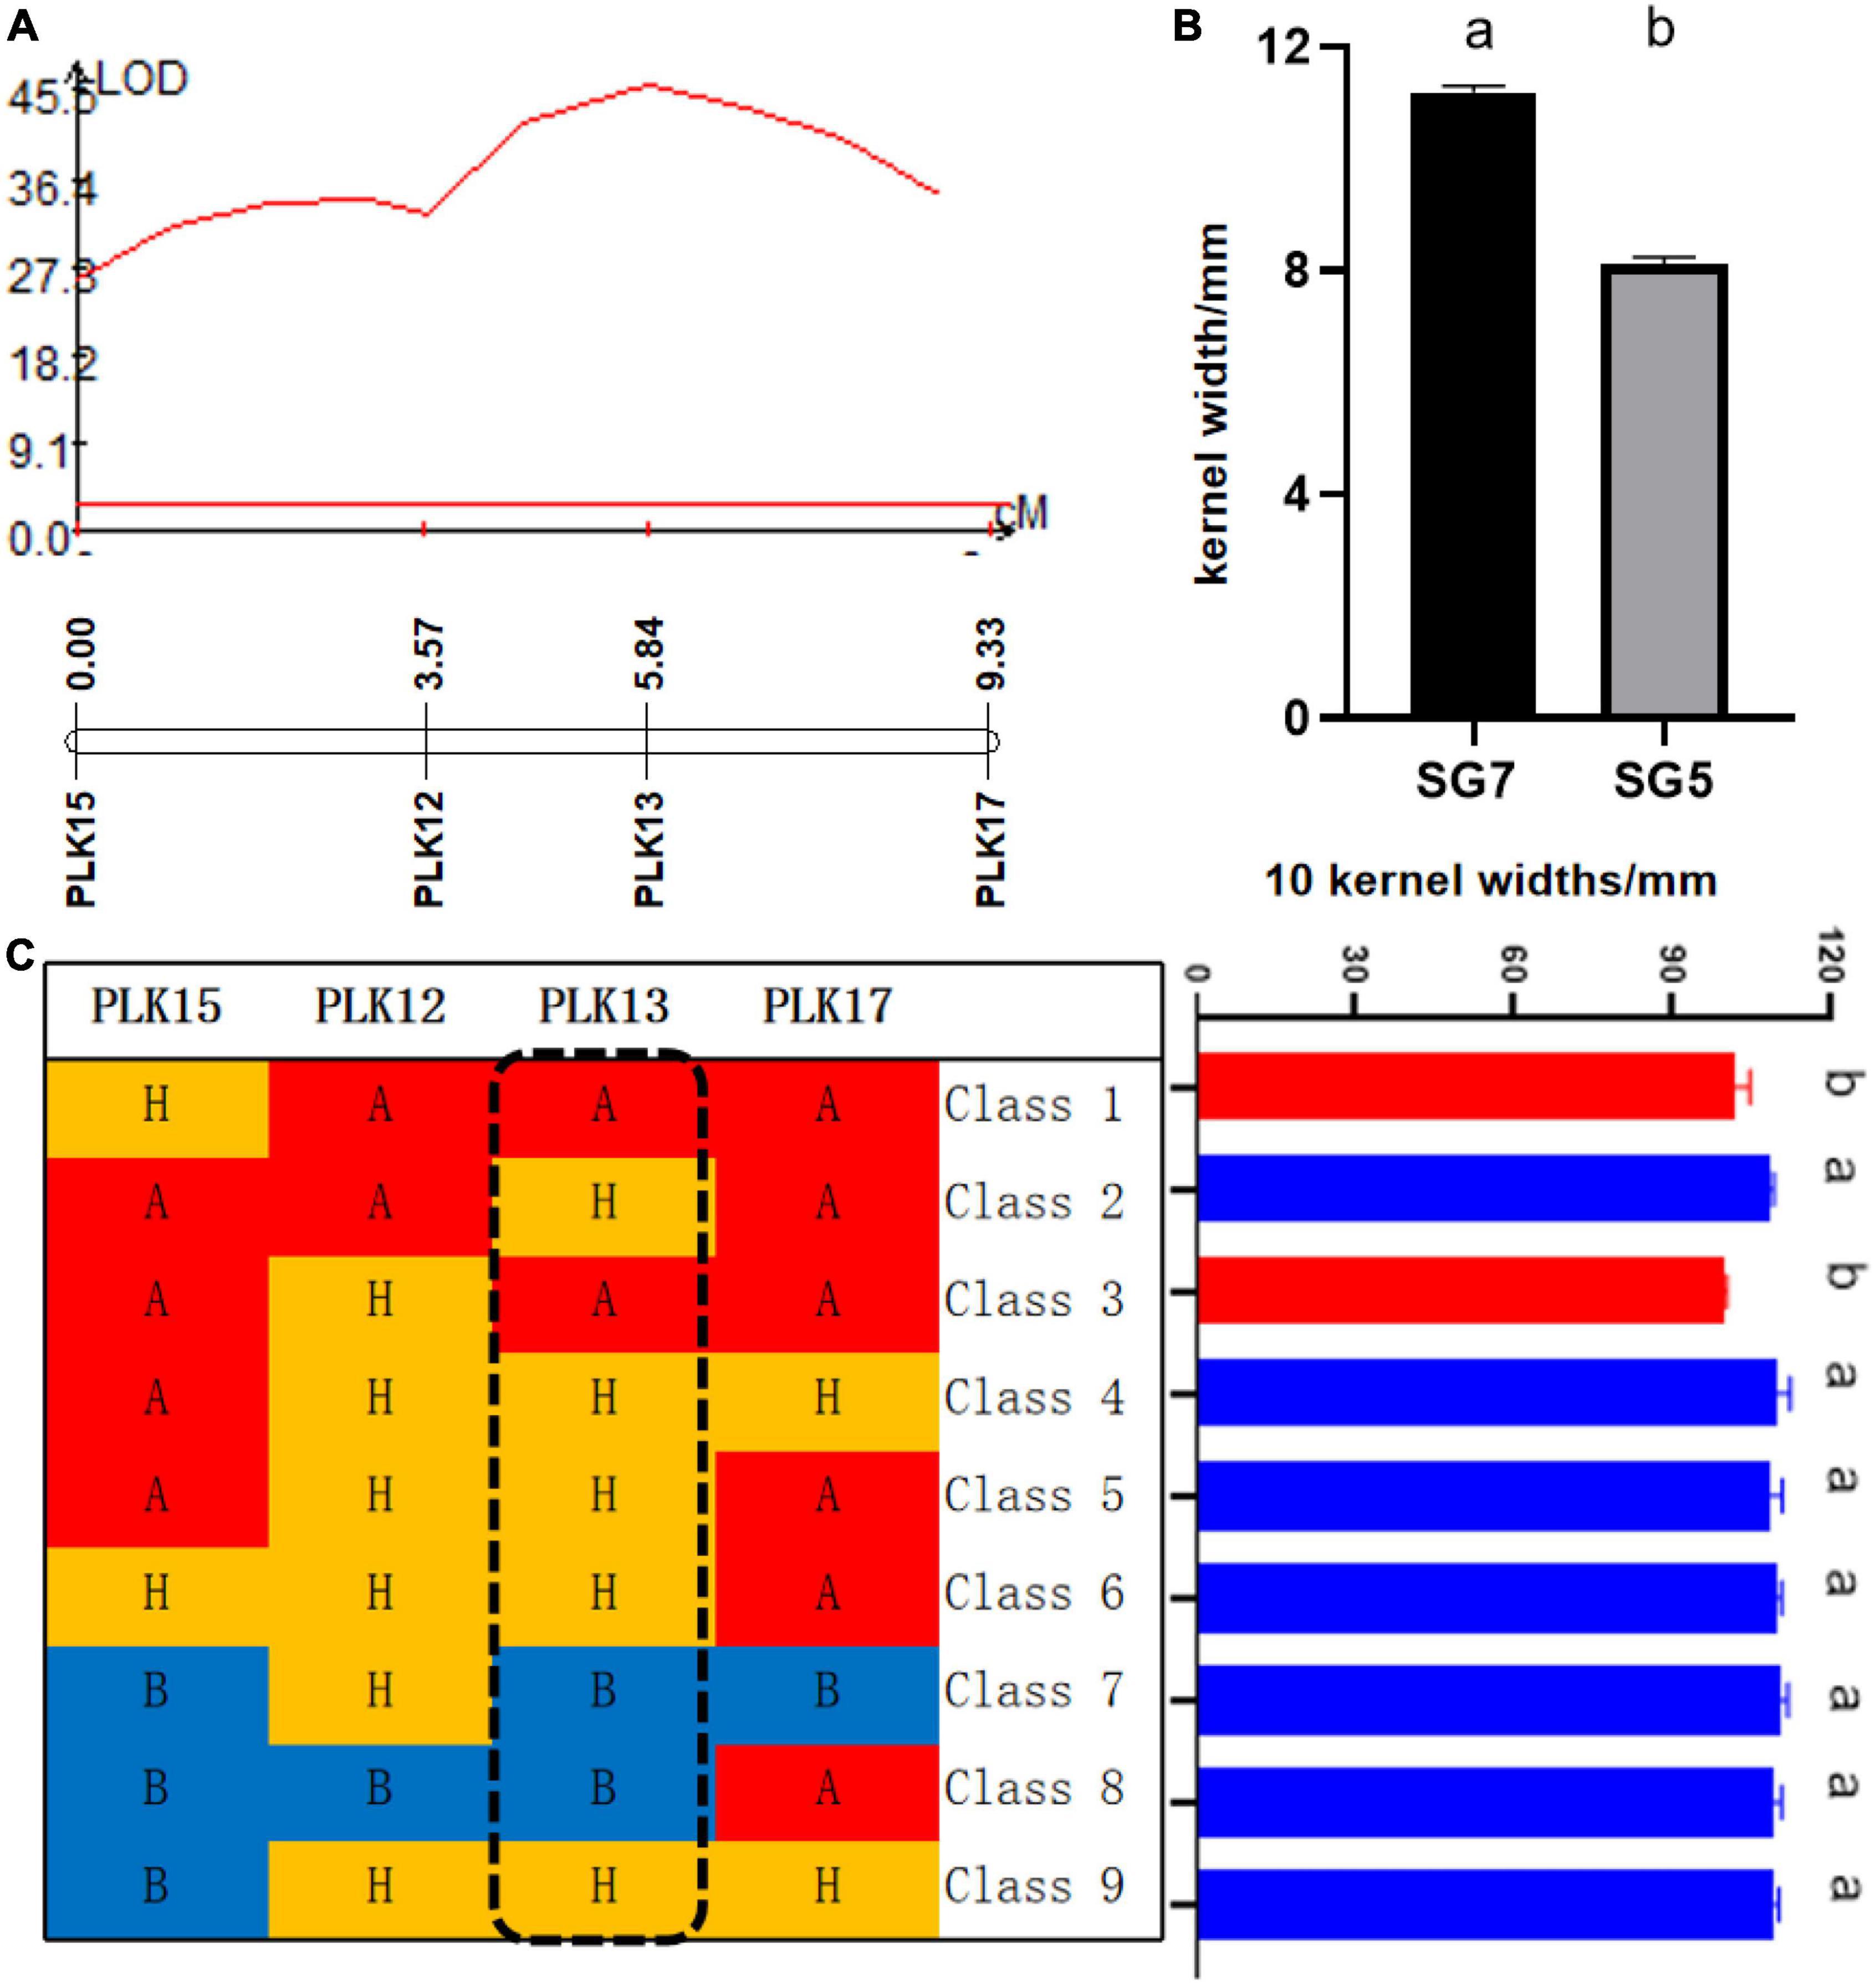
Figure 3. (A) Logarithm of the odds (LOD) profile of qKW-1, which was identified in the BC4F2 population. (B) Kernel width (KW) significance test of difference between SG5 and SG7, different letters a and b mean that difference was significant between SG5 and SG7. (C) qKW-1 was mapped to a 5.76-cM genetic interval between the markers PLK12 and PLK17 by using 469 BC4F2 plants. Class 1–9 are shown for the recombinant plants with different recombination types. Graphical genotypes of recombinant lines and their KWs separated in BC4F2. Capital letter A with red color background represents the chromosomal segments for the homozygous SG5. Capital letter B with blue color background represents the chromosomal segments for the homozygous SG7. Capital letter H with yellow color background represents the chromosomal segments for the heterozygous alleles. Different lower case letters a and b indicate significant difference at 0.05 level.
Development of Near-Isogenic Lines and Phenotypic Evaluation
Four pairs of polymorphic SSR markers (Table 1) out of 20 SSRs (Supplementary Table 1) between donor parent SG5 and recurrent parent SG7 were obtained for marker-assisted selection from the BC2F1 to BC4F2 generation. The four markers PLK12, PLK13, PLK15, and PLK17 were found to be located at 31.55, 31.65, 32.51, and 33.89 Mb, respectively, on chromosome 3 by blasting maize B73 RefGen_v5. A total of 5 individuals with heterozygous genotypes for the qKW-1 locus were selected from 103 BC2F1 plants by using the above four polymorphic SSR markers. The seeds of the 5 selected BC2F1 individuals were planted and subjected to continuous backcrossing with SG7. Plants with four heterozygous markers around the qKW-1 locus on chromosome 3 were detected and selected in each generation from BC2 to BC4. In BC4F1, the plants heterozygous for four markers were selected for developing BC4F2. A total of 469 BC4F2 plants were obtained and planted in Qingdao for phenotyping KW traits in the summer of 2021. Figure 4 shows some of the segregation genotypes of SSR primers for PLK13 on chromosome 3 in the BC4F2 population.
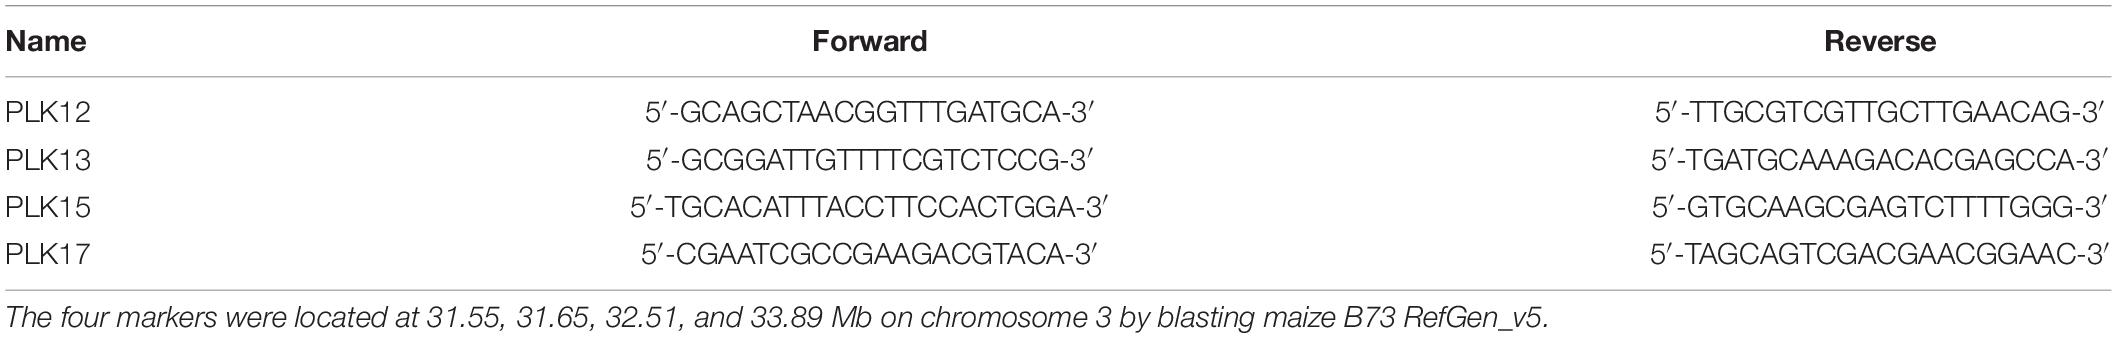
Table 1. List of primers used for developing secondary genetic linkage map and fine mapping qKW-1.
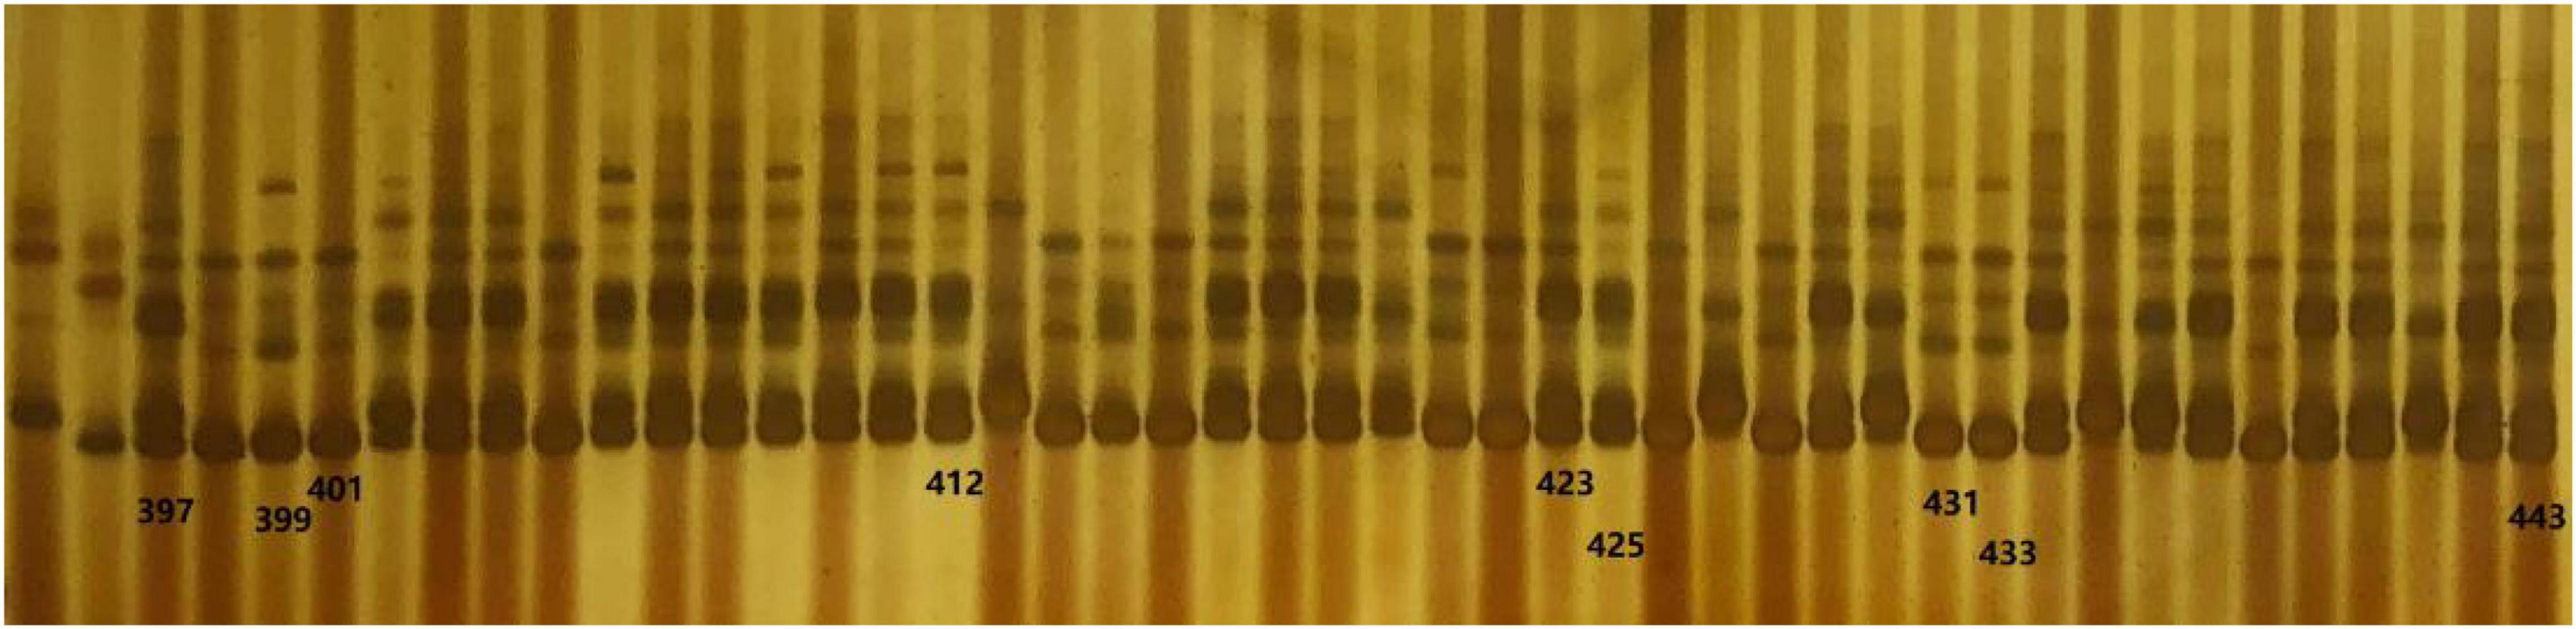
Figure 4. Part of genotype of simple sequence repeat (SSR) primer PLK13 on chromosome 3 in BC4C2 population. Lane 1 denotes genotype of female parent SG5, whereas lane 2 denotes genotype of recurrent parent SG7.
The phenotype statistical analysis indicated that the frequency distribution of 10 KW s among BC4F2 lines exhibited a mixed distribution with transgressive segregation [range, 92.67–115.44 mm; mean, 107.27 mm; SG5, 80.7 mm; SG7, 111.7 mm (Figure 5); standard deviation, 0.18]. It showed significant genetic variation among the individuals. Statistical analysis of the phenotype of the BC4F2 population was based on the different segregating genotypes of the four pairs of markers. The results showed that if the marker genotype was the maternal type (0-band type), the 10 KWs were less than 104.49 mm, whereas if the marker genotype was the paternal type (2-band type), the 10 KWs were greater than 109.79 mm. The maternal genotype had a minimizing effect on KW, whereas the paternal genotype had an enlarging effect on KW (Table 2). To further compare the significance differences of the phenotypes with different segregating genotypes of the four pairs of markers, the BC4F2 population phenotypes were grouped according to different segregating genotypes. Variance analysis was performed. The analysis of variance (ANOVA) results of the four pairs of primers showed that the obtained p-values were all less than 0.01, reaching a very significant level. Among the four pairs of markers, the PLK13 marker had the largest F-value of 131.72, suggesting that the qKW-1 locus had the strongest correlation or the closest genetic distance to PLK13 (Table 3). The multiple comparison results showed that the phenotypic differences of each of the four pairs of markers reached a significant level (Table 4 and Figure 6).
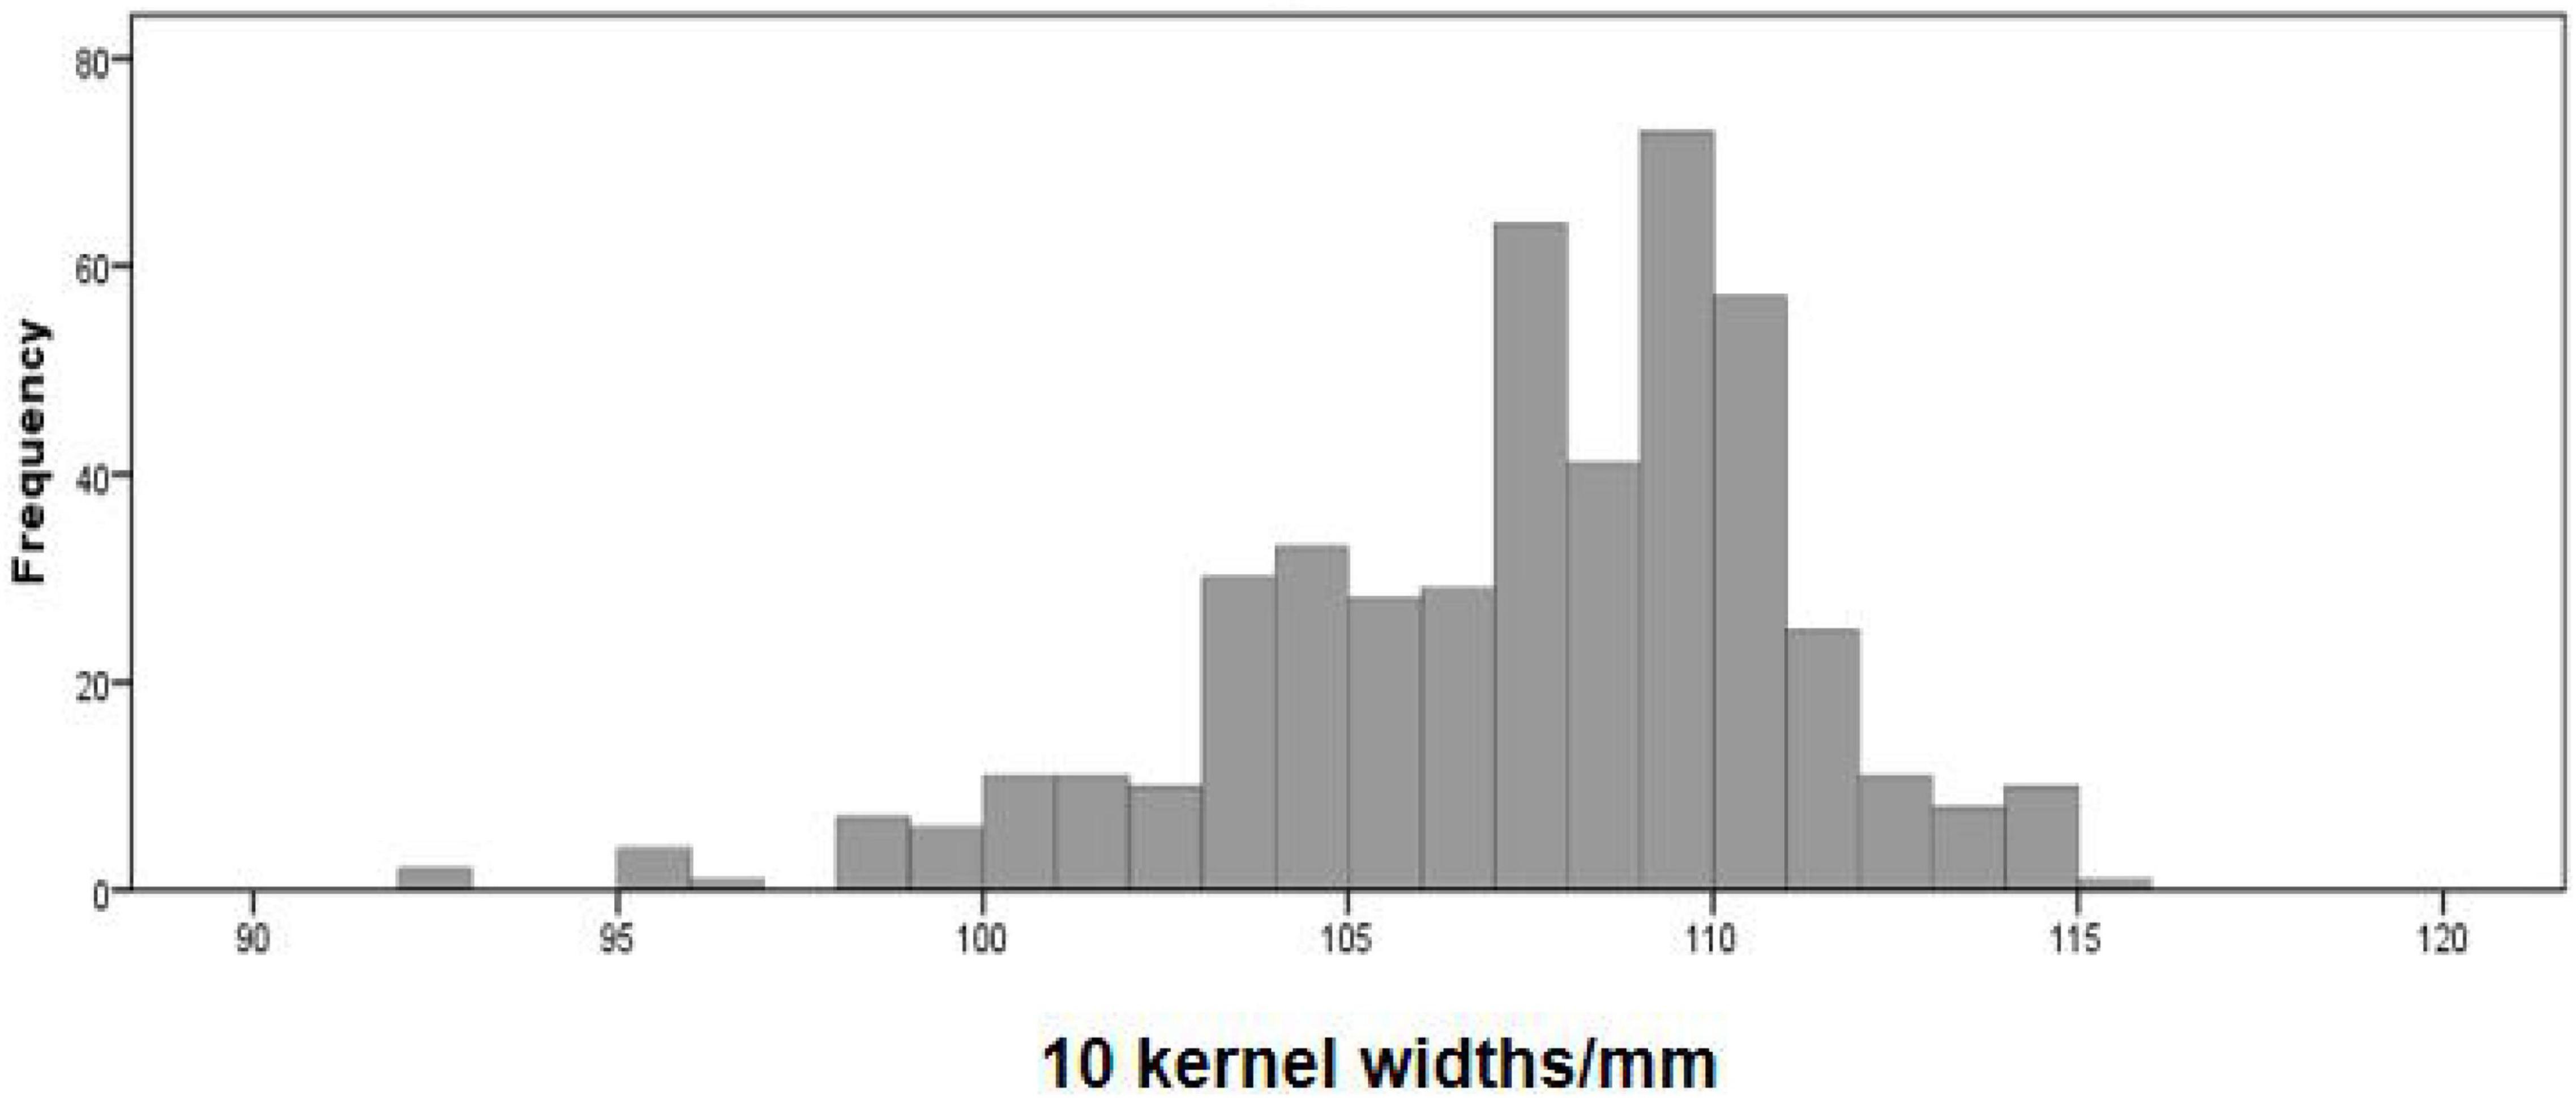
Figure 5. Distribution of kernel width (KW) traits in BC4F2 population derived from the cross of SG5 and SG7. SG5 as donor parent, whereas SG7 as recurrent parent.
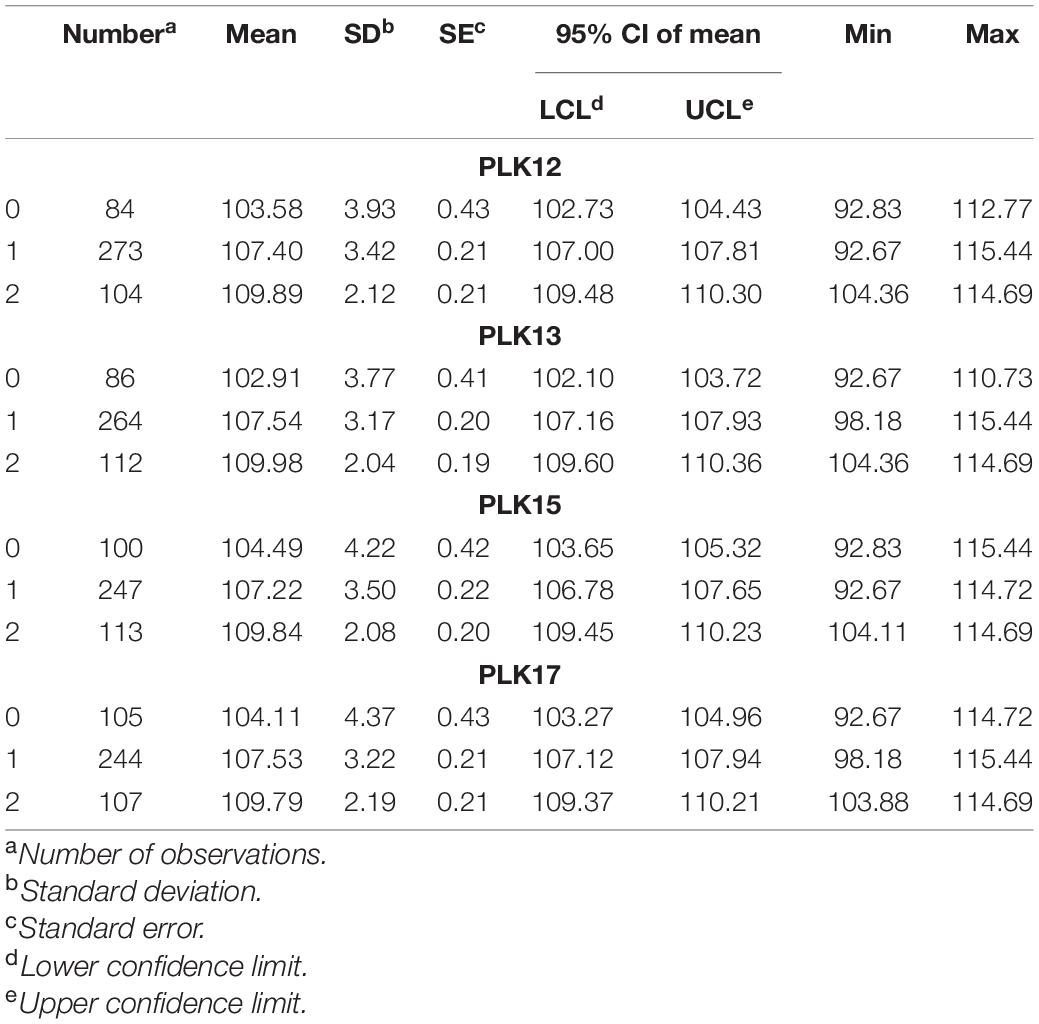
Table 2. Descriptive statistical analysis the phenotype of the BC4F2 population (0 means female SG5 type, 1 means heterozygous type, 2 means paternal SG7 type).
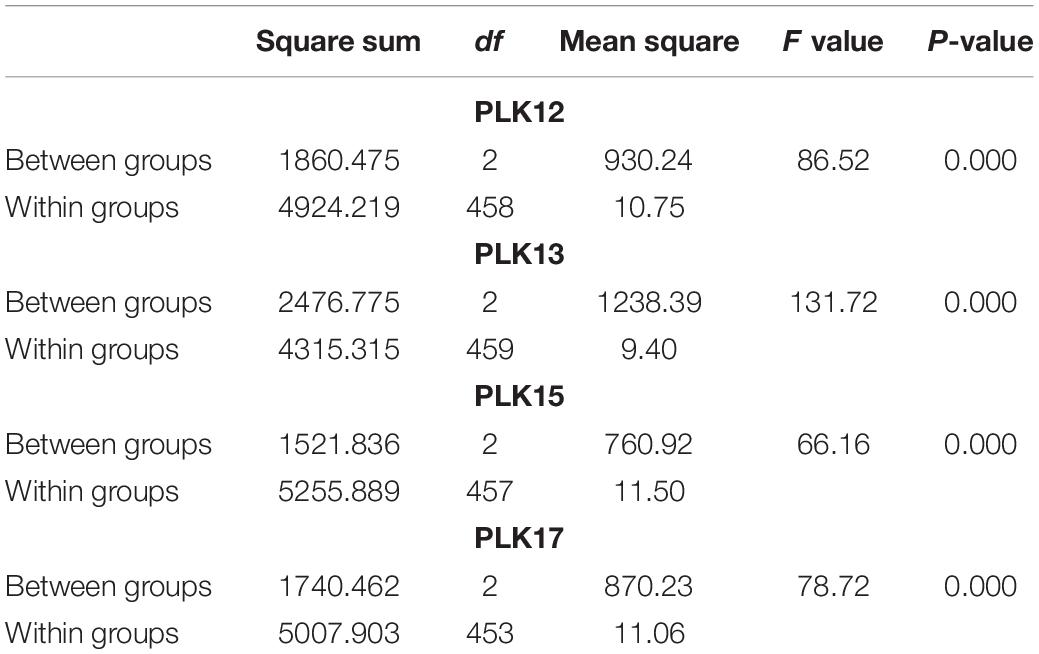
Table 3. The results of phenotypic analysis of variance (ANOVA) of BC4F2 population grouped according to different marker genotypes (the first group for the maternal SG5 type, the second group for the heterozygous genotype, and the third group for the paternal SG7 type).
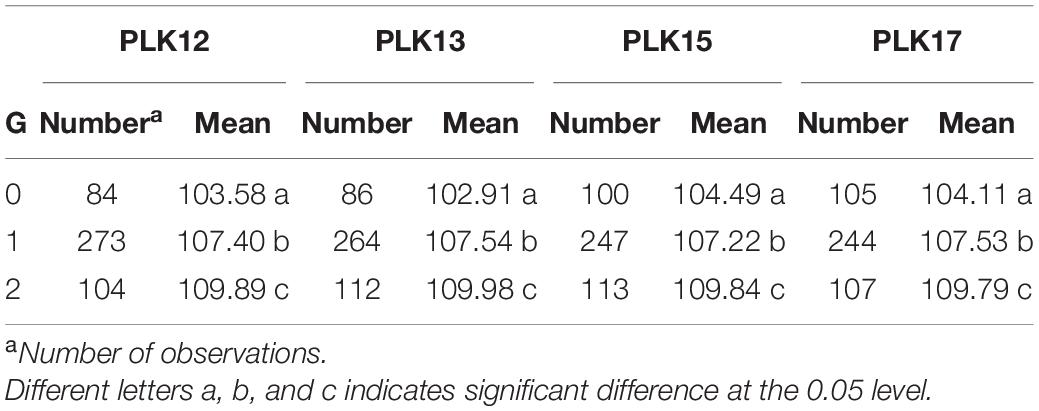
Table 4. Difference significance analysis of phenotypes of BC4F2 populations (0 means maternal SG5 type, 1 means heterozygous type, 2 means paternal SG7 type).
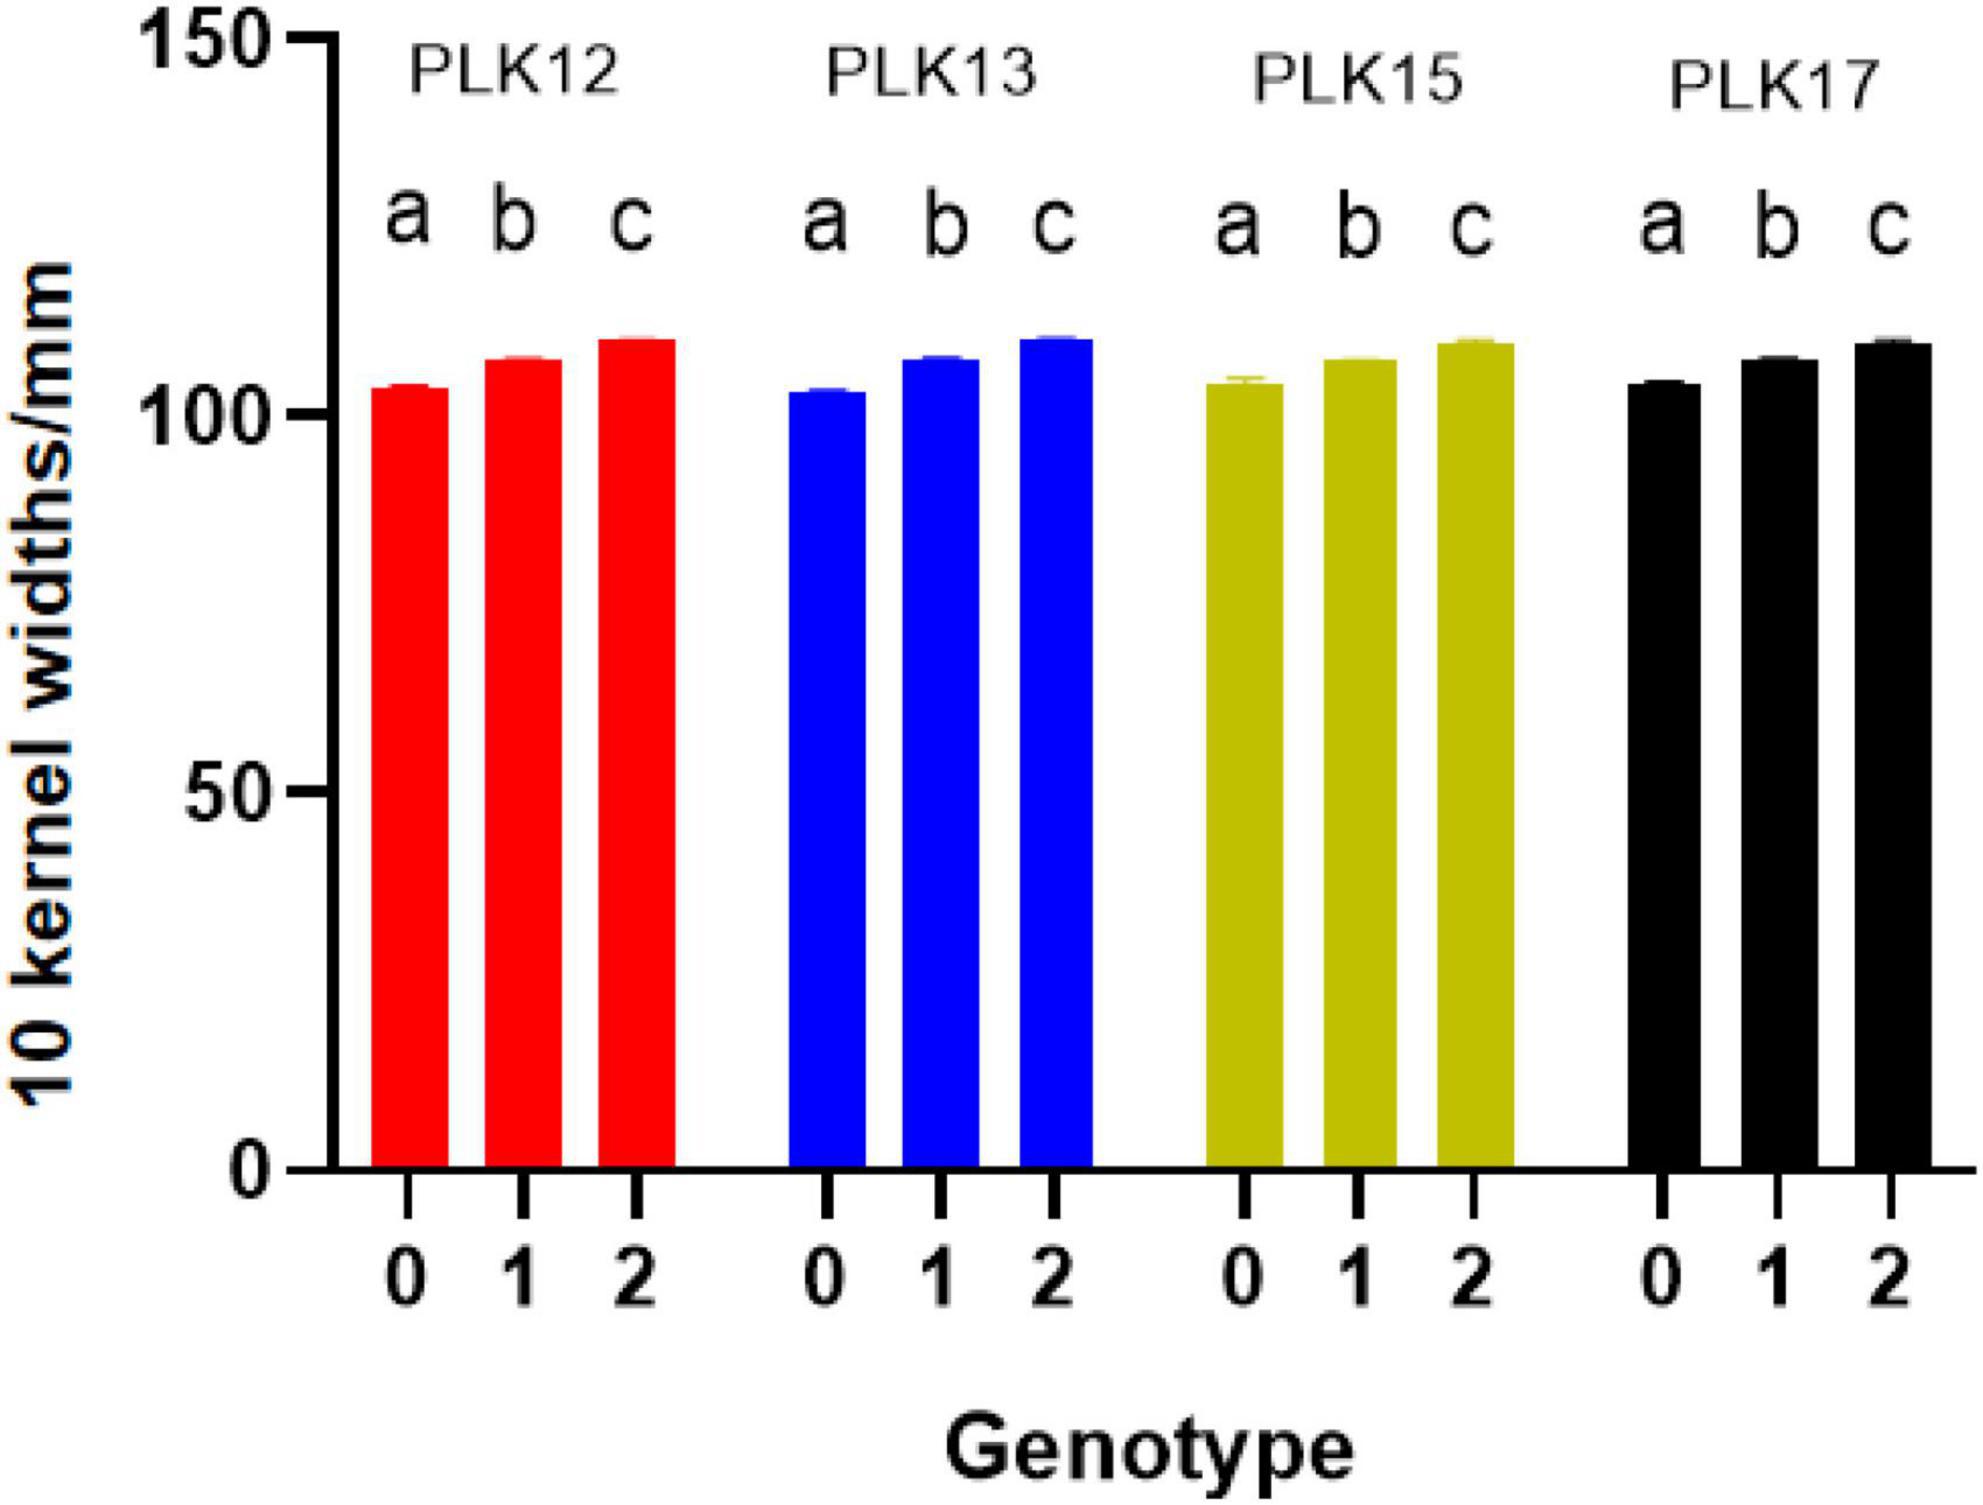
Figure 6. Phenotype significance test of difference for BC4F2 individuals (different letters indicate significant difference at the 0.05 level; 0 means maternal SG5 type, 1 means heterozygous type, 2 means paternal SG7 type).
Near-Isogenic Population Background Detection
Theoretically, after a four-generation continuous backcross process, approximately 96.9% of the loci of the whole genome became homozygous in the BC4F2 population. To confirm that the genetic background of the BC4F2 population was homozygous, 45 randomly selected SSR markers from all 9 chromosomes except 3 were used for further genetic background analysis. The results showed that the genotypes of all 45 SSR markers were homozygous and were confirmed to be the same as that of the recurrent parent SG7. Figure 7 displays some of the genotypes of SSR marker P17 on chromosome 7, and all offspring genotypes are the same as SG7.
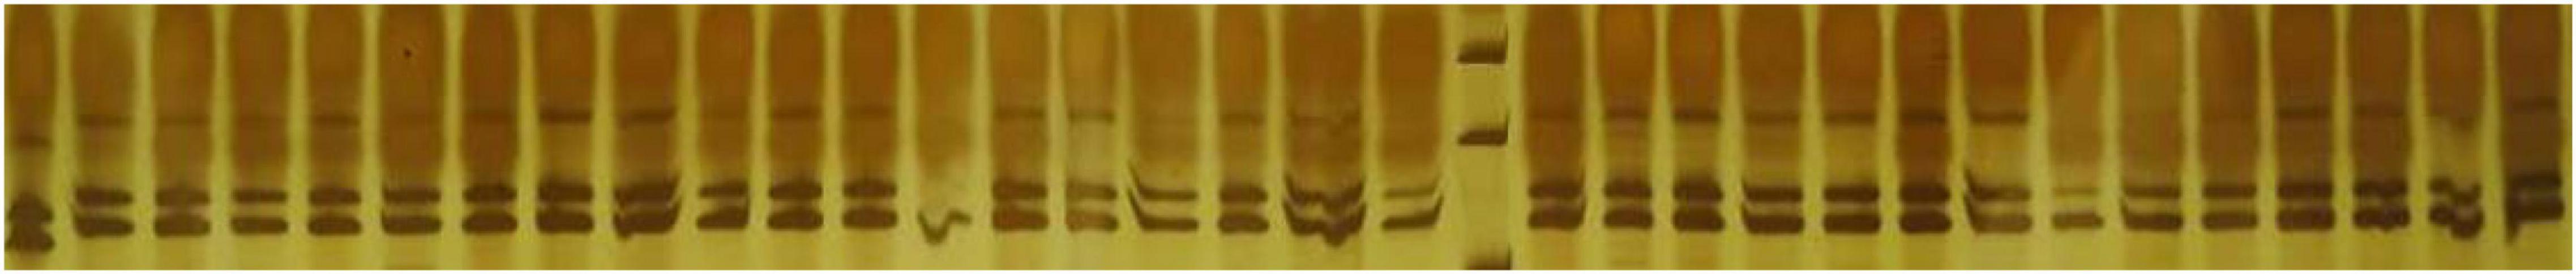
Figure 7. Part of genotype of simple sequence repeat (SSR) primers P17 on chromosome 7 in BC4C2 population. Lane 1 denotes genotype of female parent SG5, whereas lane 2 denotes genotype of recurrent parent SG7.
Secondary Genetic Linkage Map Construction and Quantitative Trait Locus Analysis
From 2017 to 2019, a BC4F2 NIL population consisting of 469 lines was developed by introgressing the qKW-1 genomic region of SG5 into the SG7 genetic background. A secondary linkage map with four markers (Table 1) around qKW-1 was generated. The secondary linkage map was 9.33 cM (2.34 Mb) in length, and the genetic distances between each two adjacent markers were 3.57, 2.27, 0.80, 5.67, and 3.49 cM (Figure 3A). The order of markers on the genetic map is slightly different from that of the physical map. The order of the four markers on the genetic map was PLK15, PLK12, PLK13, and PLK17. By blasting maize B73 RefGen_v5, the four markers PLK12, PLK13, PLK15, and PLK17 were found to be located at 31.55, 31.65, 32.51, and 33.89 Mb, respectively, on chromosome 3. Then, the major QTL qKW-1 was detected with the secondary linkage map of NILs by the CIM method in QTL Cartographer v2.5. qKW-1 had an additive effect of 2.87 mm and explained 23.8% of the phenotypic variation. The LOD peak indicated that qKW-1 was most likely located between PLK12 and PLK13, and the LOD value was 45.5 (Figure 3A). The distances from qKW-1 to PLK12 and PLK13 were 2.23 and 0.04 cM, respectively, with a 95% confidence interval of 3.6–8.9 cM, which indicates a confidence distance of 5.3 cM.
To confirm the narrowed qKW-1 interval, nine recombinant types, namely, Class 1–Class 9, were selected from 469 NILs. Class 1 indicates 5 recombinants with PLK12, PLK13, and PLK17 homozygous for SG5 and heterozygous for PLK15. Class 2 indicates 5 recombinants with PLK12, PLK15, and PLK17 homozygous for SG5 and heterozygous for PLK17. Class 3 indicates four recombinants with PLK13, PLK15, and PLK17 homozygous for SG5 and heterozygous for PLK12. Class 4 indicates 10 recombinants heterozygous for PLK12, PLK13, and PLK17 and PLK15 homozygous for SG5. Class 5 indicates 4 recombinants heterozygous for PLK12 and PLK13 and PLK15 and PLK17 homozygous for SG5. Class 6 indicates 4 recombinants heterozygous for PLK12, PLK13, and PLK15, whereas PLK17 is homozygous for SG5. Class 7 indicates 9 recombinants with PLK13, PLK15, and PLK17 homozygous for SG7, whereas PLK12 is heterozygous. Class 8 indicates 4 recombinants with PLK12, PLK13, and PLK15 homozygous for SG7, whereas PLK17 is heterozygous. Class 9 indicates 3 recombinants heterozygous for PLK12, PLK13, and PLK17, whereas PLK12 is homozygous for SG7. At PLK13 loci, Classes 1 and 3 were homozygous for SG5, whereas Classes 7 and 8 were homozygous for SG7 (Table 5). There was a significant difference in phenotypic values between the two sets of recombinant classes 1 and 3 and classes 7 and 8 (Figure 3C). The progeny test of homozygous segregants indicated that qKW-1 was most likely located near PLK13. The selected overlapping recombinant chromosomes also supported the location of qKW-1 mapped in BC4F2.
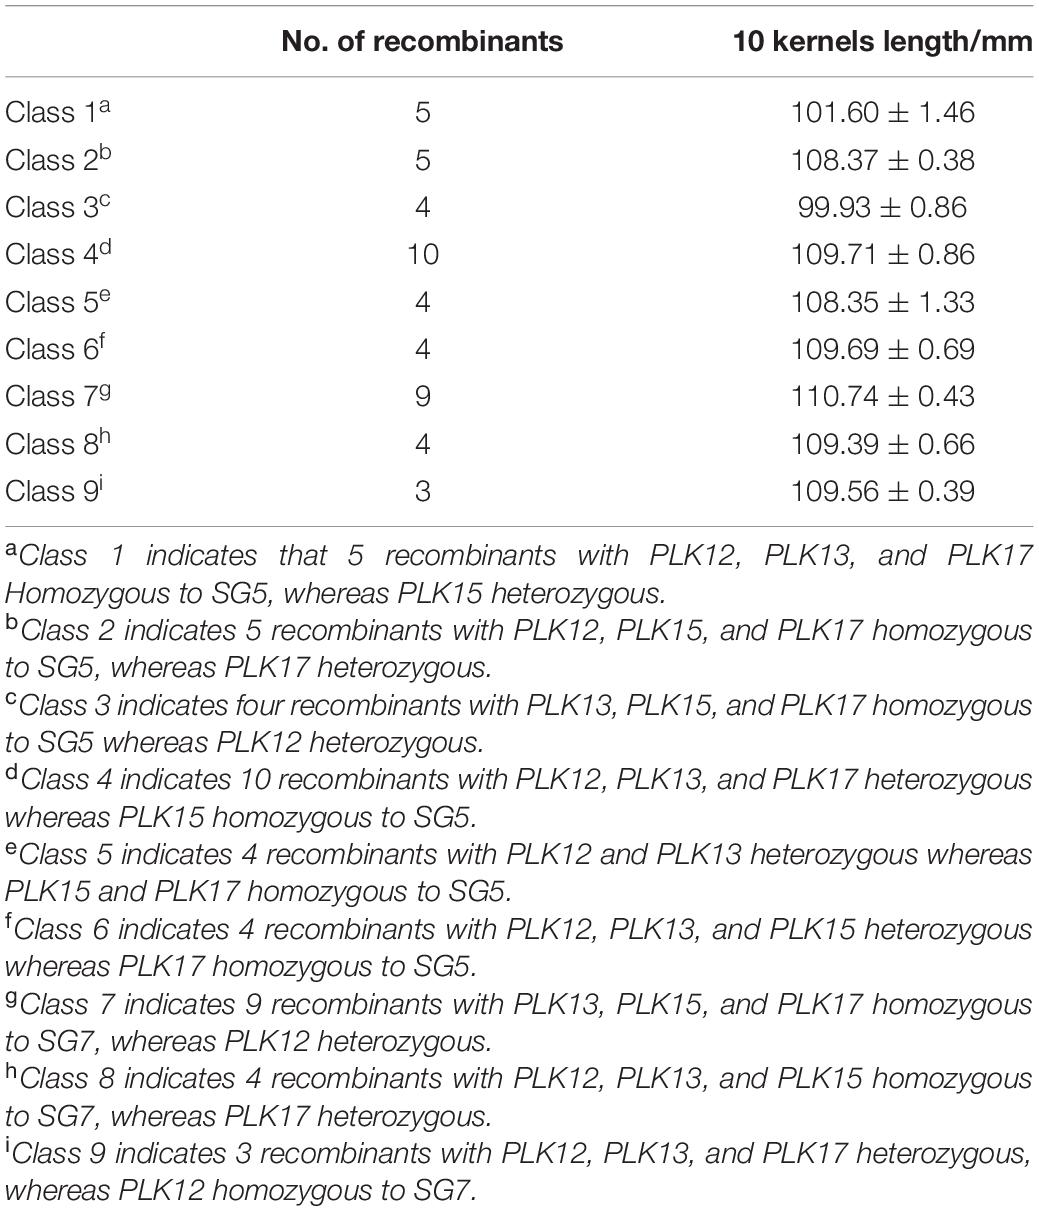
Table 5. Statistical analysis of phenotypic values from different kinds of recombinant types of near-isogenic lines (NILs) around the qKW-1 region.
Candidate Gene Prediction
The RNA-seq procedure was conducted for 18 RNA grain samples at different developmental stages. According to the above results, the 95% confidence interval of qKW-1 was 3.6–8.9 cM, which was located in the PLK12 to PLK17 marker interval. The physical distance between PLK12 and PLK17 was 2.34 Mb. The 2.34 Mb physical interval of qKW-1 encompassed 45 protein coding genes (Supplementary Table 2). After DEG analysis, a total of 12 protein-coding genes were differentially expressed and retained in the qKW-1 physical intervals (Table 6). Previous studies indicated that non-specific phospholipase C (NPC) is involved in plant growth, development, and stress responses (Yang et al., 2021). NRT1.1B is associated with root microbiota composition and nitrogen use in field-grown rice (Zhang et al., 2019). GRMZM2G083176 encodes NPC, and GRMZM2G081719 encodes the nitrate transporter 1 (NRT1) protein. The two genes GRMZM2G083176 and GRMZM2G081719 were predicted to be candidate genes of qKW-1, which is most likely responsible for qKW-1.
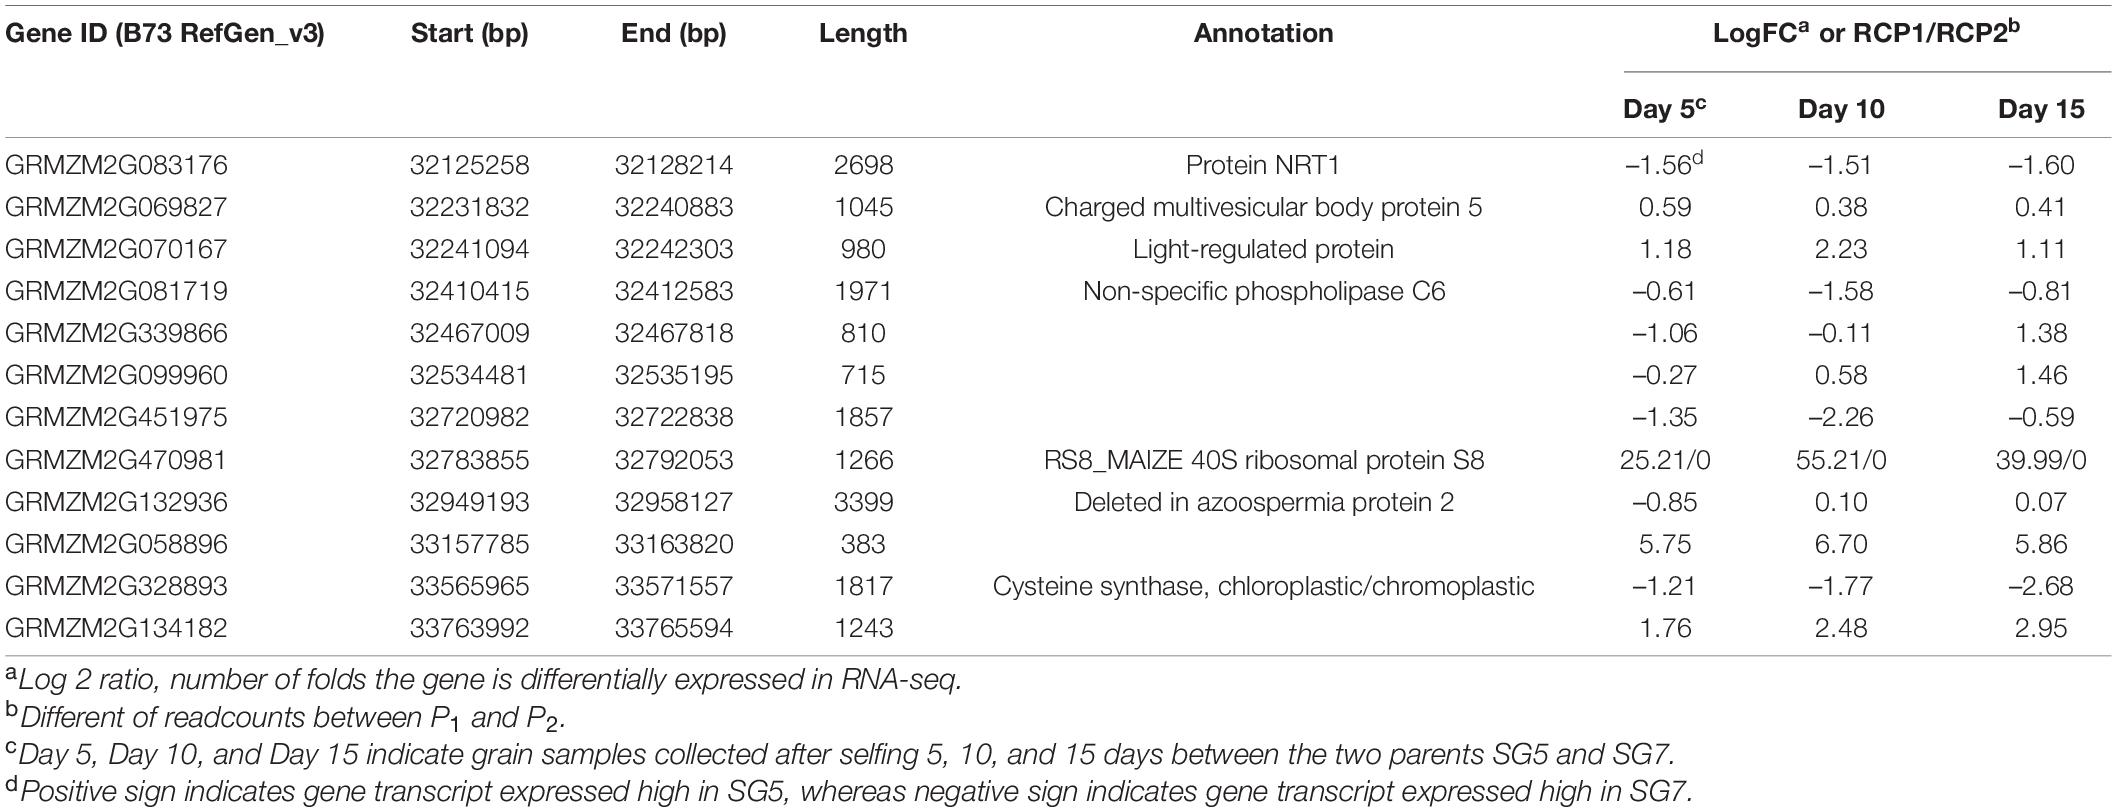
Table 6. Differentially expressed genes (DEGs) out of 40 protein coding genes in 2.34-Mb physical interval on chromosome 9 and candidate gene predicted for qKW-1.
Reverse Transcription-Polymerase Chain Reaction Analysis
To verify the accuracy of the RNA-seq results, the actin gene was used as a reference gene, and two differentially expressed candidate genes, GRMZM2G083176 and GRMZM2G081719, were used for RT-qPCR analysis. The results showed that the change trend of the expression levels of the two candidate genes was basically consistent with the change trend of the gene expression levels obtained from RNA-seq analysis. The expression trends of GRMZM2G083176 and GRMZM2G081719 are basically consistent. There was no significant difference in the expression levels of SG5 and SG7 between the two stages on Day 0 (grain samples collected before selfing for 10 days) and Day 30 (grain samples collected after selfing for 30 days). At Day 5, Day 10, and Day 15 (grain samples collected after selfing for 5, 10, and 15 days between the two parents SG5 and SG7), the expression levels of the two candidate genes in SG7 were significantly increased and significantly higher than those in SG5. The expression level of GRMZM2G083176 reached the highest level on Day 10, whereas the expression level of GRMZM2G081719 reached the highest level on Day 5. The expression levels of the two genes were significantly different during grain development stages. RT-qPCR analysis results further verified the correctness of GRMZM2G083176 and GRMZM2G081719 prediction as candidate genes.
Further studies are still needed to clarify whether the two genes regulate grain development independently or interact to affect grain development (Figure 8).
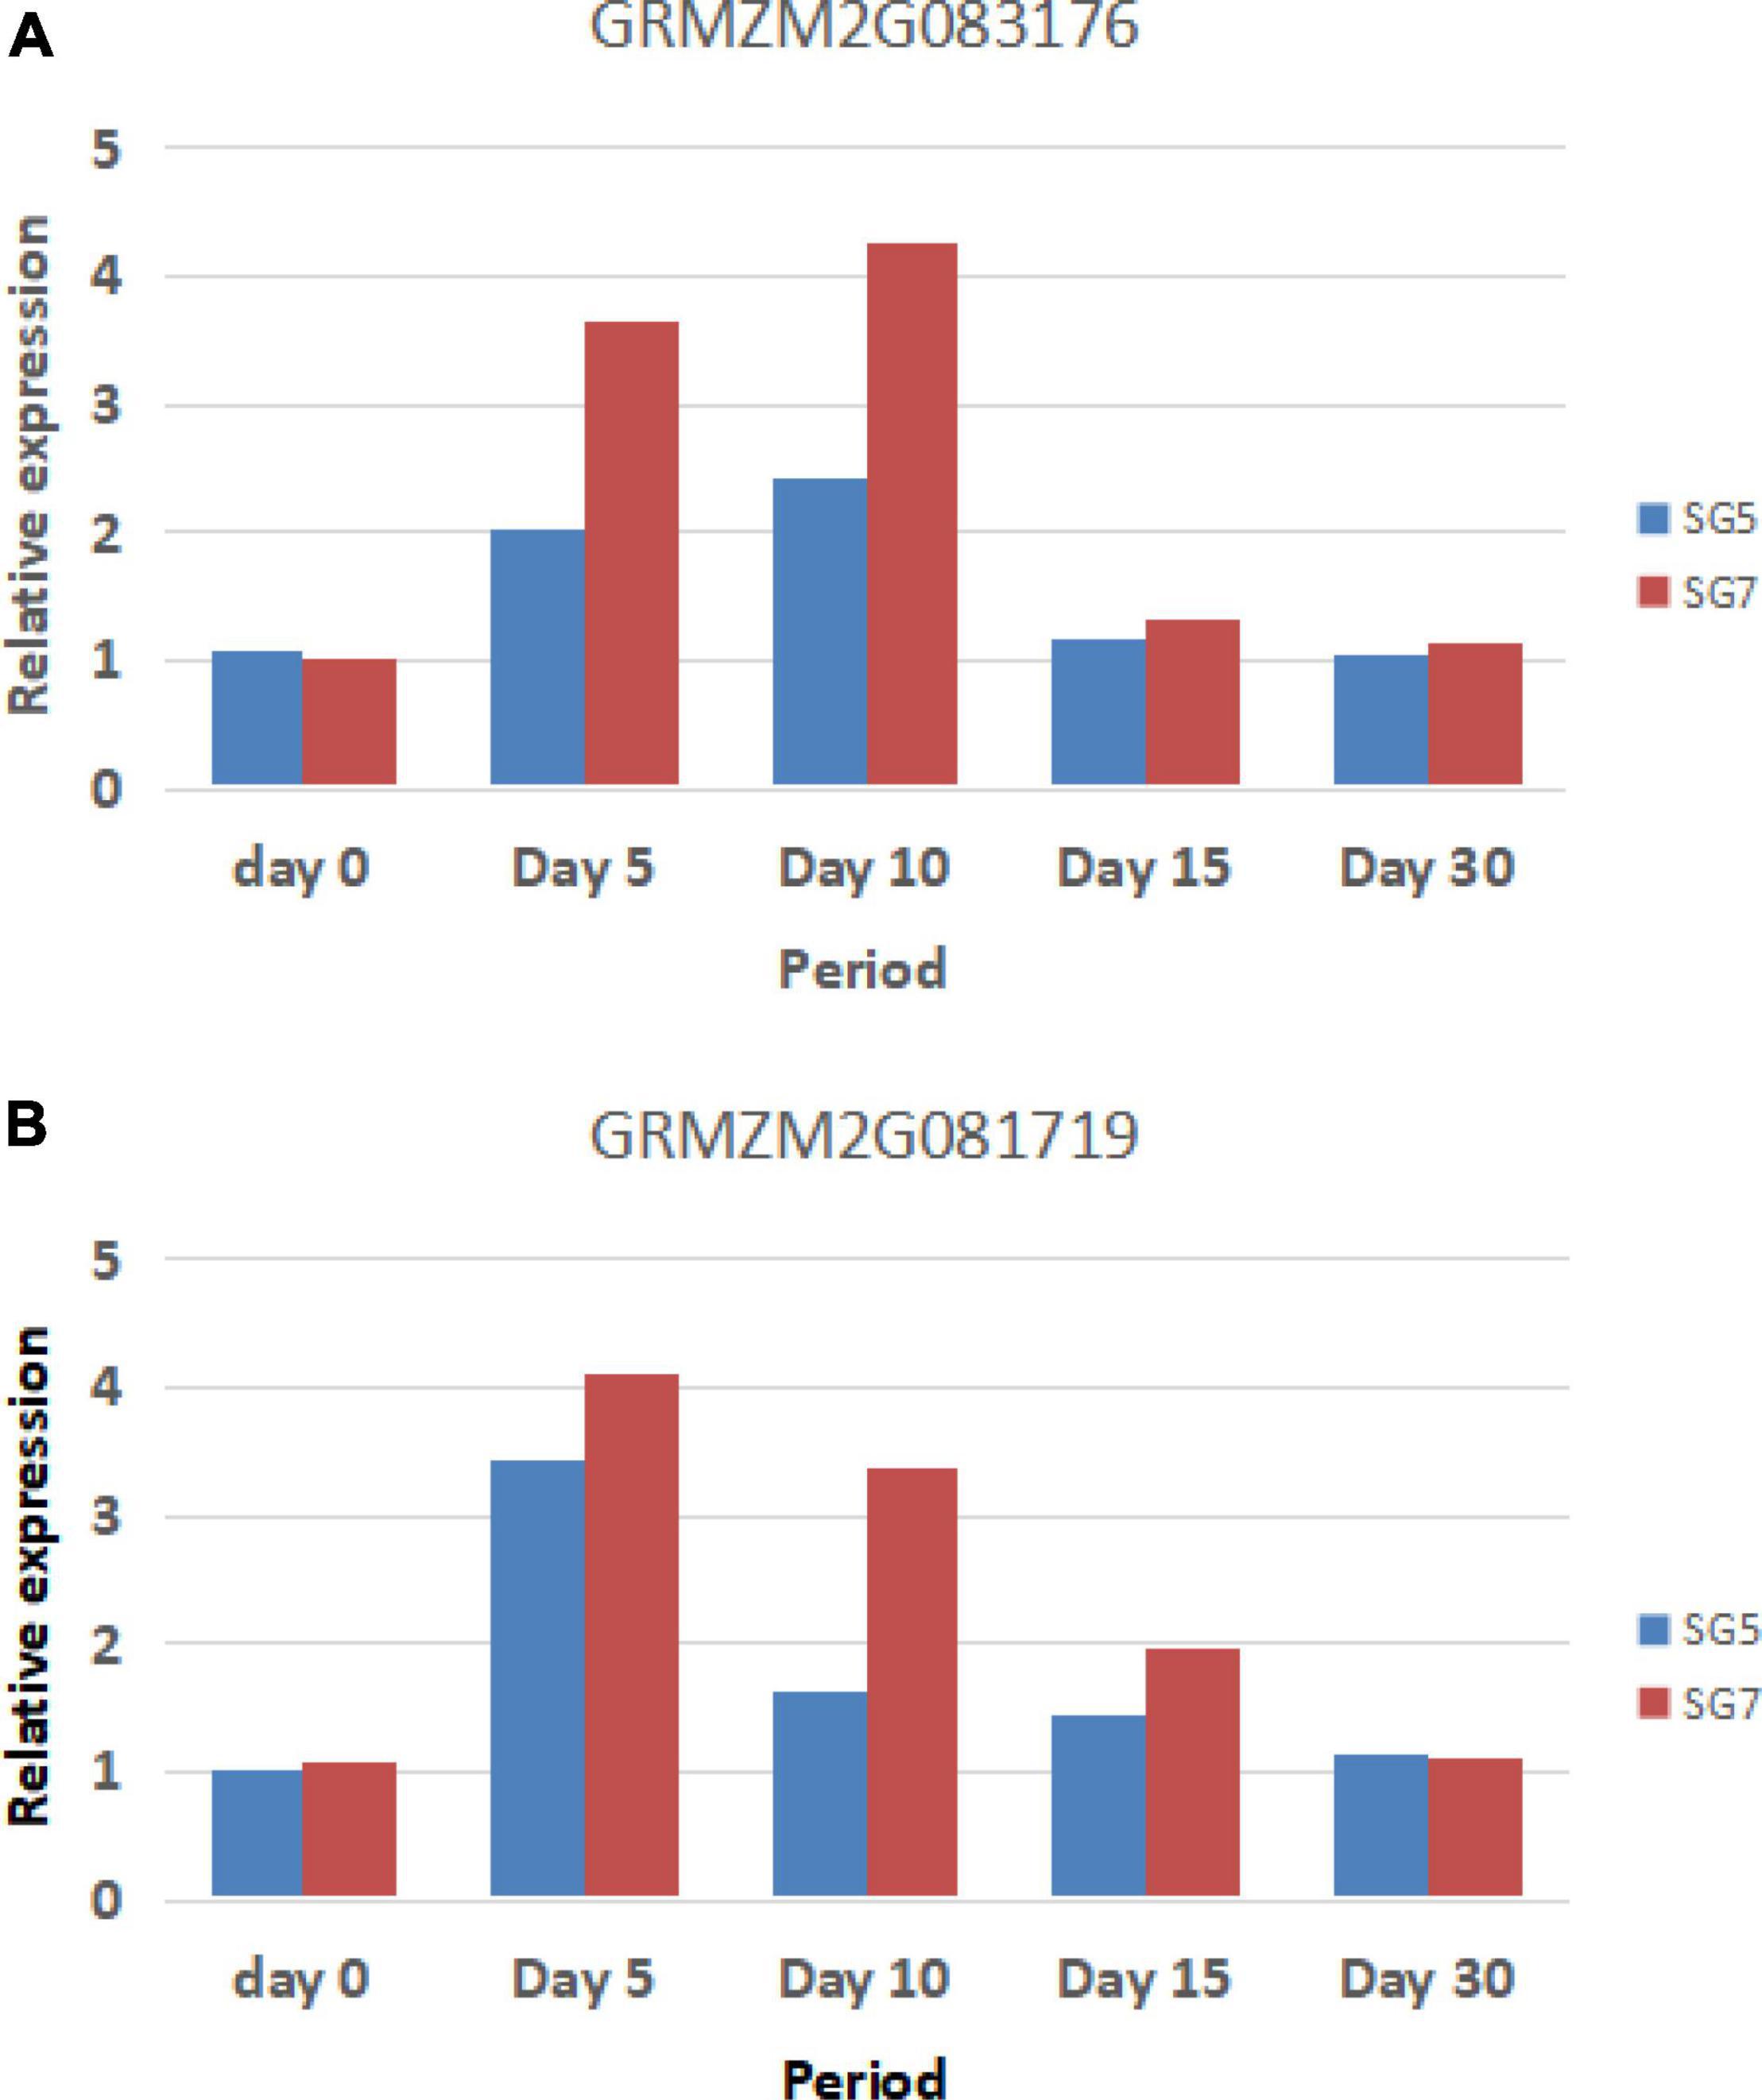
Figure 8. The reverse transcription-polymerase chain reaction (RT-PCR) validation genes and their expression levels. Panel A indicates GRMZM2G083176 expression levels, whereas panel B indicates GRMZM2G081719 expression levels (Day 0 indicates grain samples collected before selfing 10 days, whereas Day 5, Day 10, Day 15, and Day 30 indicate grain samples collected after selfing 5, 10, 15, and 30 days between the two parents SG5 and SG7).
Discussion
Due to different genetic materials and genetic backgrounds, the results obtained by different researchers are also different. Liu (2013) identified 16 QTLs related to KW, mainly distributed on chromosomes 1, 2, 3, 4, 5, and 9. Li et al. (2009) identified a KW–related QTL located on chromosome 8 in a single ecological environment and concluded that the KW trait significantly affected the seed setting percentage. Qin et al. (2015) mapped the KW QTL qkwid10 on chromosome 10. Chen et al. (2017) conducted meta-QTL analysis based on collecting information on QTLs conferring maize yield-related traits from 33 published studies. A total of 76 MQTLs for maize yield and its related traits were identified on all 10 maize chromosomes, with the number per chromosome ranging from four on chromosome 4–10 on chromosome 5 (Chen et al., 2017). According to meta-QTL analysis results, MQTL-19 for ear-related traits and kernel-related traits was found to be limited within a physical interval of 31.06–63.84 Mb by blasting maize B73 RefGen_v4. The physical interval of qKW-1 in this study overlapped with the MQTL-19 interval, but with more decreased physical intervals. The genetic effect of the qKW-1 region is relatively stable under different genetic backgrounds, and it can be used as an important candidate region for marker-assisted breeding and map-based cloning in maize.
Near-isogenic lines can be developed by backcrossing, selecting residual heterozygous lines in RILs, and using mutants. The genetic background of NILs is the same, with only the target trait gene differing. NILs are an ideal material for genetic research at the gene level. Molecular markers closely linked to the target gene can be accurately screened by using NILs, which is convenient for fine mapping of the target gene. For example, the early tomato anti-virus gene Tm-2a (Young et al., 1988) and the semidwarf stem gene sdg (Liang et al., 1994) of rice were identified by using NILs. Using NILs to analyze gene functions can eliminate interference from other genes and genetic backgrounds. In addition, NILs are more helpful for accurately analyzing the expression differences of target genes. For example, Zhao et al. (2011) introduced the exogenous pea ferritin gene (Pea-Fer) into Xiushui 11 rice and constructed NILs. The results showed that the Pea-Fer gene could significantly increase the iron content in rice grains (Zhao et al., 2011). NILs can also be directly used as breeding materials. For example, the multiline varieties used for rice blast resistance in Japan in the early days are actually a group of NILs containing different rice blast resistance genes (Koizumi, 2001). The development of NILs by using only backcross technology requires much work and time. In this study, the method of developing NILs using backcrossing combined with molecular marker-assisted selection greatly accelerated the development of NILs.
A secondary genetic linkage map was constructed by using the advanced genetic population developed in this study. The target qKW-1 was limited in a 2.34-Mb physical interval. In order to avoid the omission of important genetic information, the range of candidate genes was defined according to the marker interval where the confidence interval located in. The confidence interval of qKW-1 in this study was 3.6–8.9 cM, whereas the marker interval PLK12–PLK17 was 3.6–9.3 cM in the secondary genetic linkage map; therefore, the 2.34-Mb physical interval between PLK12 and PLK17 was applied for candidate gene analysis. Since the 2.34-Mb interval was not small enough and unknown genetic elements, RNA-seq and RT-qPCR experiments were conducted to analyze DEGs between the two parents SG5 and SG7. Finally, 12 DEGs were obtained, and the 12 genes were used for comparative genomics studies. Previous studies indicated that non-specific phospholipase C is involved in plant growth, development and stress responses (Yang et al., 2021). Results from Cao et al. (2016) indicate that the overexpression of NPC1 leads to brittle stem nodes and panicle nodes and increased seed shattering due to a decrease in mechanical strength in nodes tissues. NRT1.1B is associated with root microbiota composition and nitrogen use in field-grown rice (Zhang et al., 2019). Hu B. et al. (2015) used the IR24 chromosome single-segment substituted lines of Nipponbare background to map QTLs related to the ClO3– resistance and confirmed that the QTL is nitrate transporter gene OsNRT1.1B through map-based cloning technology. The results showed that indica OsNRT1.1B has higher NO3– absorption and transport activities than japonica OsNRT1.1B. Multisite field experiments indicated that indica OsNRT1.1B can significantly improve the yield and nitrogen use efficiency (NUE) of japonica rice varieties, which has important application value (Hu B. et al., 2015). GRMZM2G083176 encodes NPC and GRMZM2G081719 encodes NRT1 protein. The two genes GRMZM2G083176 and GRMZM2G081719 were predicted as a candidate gene of qKW-1, which is most likely responsible for qKW-1. The obtained results not only lay a foundation for further qKW-1 marker-assisted breeding but also provide ideal materials for map-based cloning and molecular mechanism analysis of the qKW-1 gene in maize.
Conclusion
The major QTL qKW-1 for KW was verified and fine-mapped between the PLK12 and PLK13 marker intervals, with a distance of 2.23 cM to PLK12 and 0.04 cM to PLK13, a confidence interval of 5.3 cM and a phenotypic contribution rate of 23.8%. The QTL mapping result obtained was further validated by using selected overlapping recombinant chromosomes on the target segment of maize chromosome 3. Transcriptome analysis and RT-qPCR validation were conducted, and the results provide further proof of the two candidate genes GRMZM2G083176 and GRMZM2G081719, which are most likely responsible for qKW-1.
Data Availability Statement
The RNA-seq data presented in this study are deposited in the NCBI SRA repository, accession number PRJNA673992.
Author Contributions
YZ and XM developed F2, F2:3, and BC4F2 population and genotyping. MZ, JW, and GW involved in phenotypes investigation. CS analyzed the data and drafted the manuscript. All authors read and approved the final manuscript.
Funding
This work was supported by the Natural Science Foundation of Shandong Province of China (Grant #ZR2021MC071), the Natural Science Foundation of China (Grant #31460359), and the Natural Science Foundation of Guizhou Province of China (Grant #Qian Kehe J word [2014]2155 and Grant #Qian Kehe LH word [2015]7605).
Conflict of Interest
The authors declare that the research was conducted in the absence of any commercial or financial relationships that could be construed as a potential conflict of interest.
Publisher’s Note
All claims expressed in this article are solely those of the authors and do not necessarily represent those of their affiliated organizations, or those of the publisher, the editors and the reviewers. Any product that may be evaluated in this article, or claim that may be made by its manufacturer, is not guaranteed or endorsed by the publisher.
Supplementary Material
The Supplementary Material for this article can be found online at: https://www.frontiersin.org/articles/10.3389/fpls.2022.935654/full#supplementary-material
Footnotes
- ^ ftp://ftp.ensemblgenomes.org/pub/plants/release-29/fasta/zea_mays/dna/Zea_mays.AGPv3.29.dna.toplevel.fa.gz
- ^ https://www.ncbi.nlm.nih.gov/tools/primer-blast/
References
Cao, H., Zhuo, L., Su, Y., Sun, L., and Wang, X. (2016). Non-specific phospholipase C1 affects silicon distribution and mechanical strength in stem nodes of rice. Plant J. 86, 308–321. doi: 10.1111/tpj.13165
Chen, L., An, Y., Li, Y.-X., Li, C., Shi, Y., Song, Y., et al. (2017). Candidate loci for yield-related traits in maize revealed by a combination of metaQTL analysis and regional association mapping. Front. Plant Sci. 8:2190. doi: 10.3389/fpls.2017.02190
Chen, L., Li, Y.-X., Li, C., Wu, X., Qin, W., Li, X., et al. (2016). Fine-mapping of qGW4. 05, a major QTL for kernel weight and size in maize. BMC Plant Biol. 16:81. doi: 10.1186/s12870-016-0768-6
Doebley, J. F., Gaut, B. S., and Smith, B. D. (2006). The molecular genetics of crop domestication. Cell 127, 1309–1321. doi: 10.1016/j.cell.2006.12.006
Du, L., Li, N., Chen, L., Xu, Y., Li, Y., Zhang, Y., et al. (2014). The ubiquitin receptor DA1 regulates seed and organ size by modulating the stability of the ubiquitin-specific protease UBP15/SOD2 in Arabidopsis. Plant Cell 26, 665–677. doi: 10.1105/tpc.114.122663
Fan, C., Xing, Y., Mao, H., Lu, T., Han, B., Xu, C., et al. (2006). GS3, a major QTL for grain length and weight and minor QTL for grain width and thickness in rice, encodes a putative transmembrane protein. Theor. Appl. Genet. 112, 1164–1171. doi: 10.1007/s00122-006-0218-1
Gao, L., Yang, G., Li, Y., Fan, N., Li, H., Zhang, M., et al. (2019). Fine mapping and candidate gene analysis of a QTL associated with leaf rolling index on chromosome 4 of maize (Zea mays L.). Theor. Appl. Genet. 132, 3047–3062.
Han, Y., Li, D., Zhu, D., Li, H., Li, X., Teng, W., et al. (2012). QTL analysis of soybean seed weight across multi-genetic backgrounds and environments. Theor. Appl. Genet. 125, 671–683. doi: 10.1007/s00122-012-1859-x
Hu, B., Wang, W., Ou, S., Tang, J., Li, H., Che, R., et al. (2015). Variation in NRT1. 1B contributes to nitrate-use divergence between rice subspecies. Nat. Genet. 47, 834–838. doi: 10.1038/ng.3337
Hu, J., Wang, Y., Fang, Y., Zeng, L., Xu, J., Yu, H., et al. (2015). A rare allele of GS2 enhances grain size and grain yield in rice. Mol. Plant 8, 1455–1465. doi: 10.1016/j.molp.2015.07.002
Kang, Y.-J., Shim, K.-C., Lee, H.-S., Jeon, Y.-A., Kim, S.-H., Kang, J.-W., et al. (2018). Fine mapping and candidate gene analysis of the quantitative trait locus gw8. 1 associated with grain length in rice. Genes Genom. 40, 389–397. doi: 10.1007/s13258-017-0640-6
Koizumi, S. (2001). “Rice blast control with multilines in Japan,” in Exploiting Biodiversity for Sustainable Pest Management, eds T. W. Mew, E. Borrmeo, and B. Hardy (Manila: International Rice Research Institute), 143–157. doi: 10.1007/s00122-006-0290-6
Li, H., Hearne, S., Bänziger, M., Li, Z., and Wang, J. (2010c). Statistical properties of QTL linkage mapping in biparental genetic populations. Heredity 105, 257–267. doi: 10.1038/hdy.2010.56
Li, H., Yang, Q., Fan, N., Zhang, M., Zhai, H., Ni, Z., et al. (2017). Quantitative trait locus analysis of heterosis for plant height and ear height in an elite maize hybrid Zhengdan 958 by design III. BMC Genet. 18:36. doi: 10.1186/s12863-017-0503-9
Li, J., Thomson, M., and Mccouch, S. R. (2004). Fine mapping of a grain-weight quantitative trait locus in the pericentromeric region of rice chromosome 3. Genetics 168, 2187–2195. doi: 10.1534/genetics.104.034165
Li, Q., Li, L., Yang, X., Warburton, M. L., Bai, G., Dai, J., et al. (2010a). Relationship, evolutionary fate and function of two maize co-orthologs of rice GW2associated with kernel size and weight. BMC Plant Biol. 10:143. doi: 10.1186/1471-2229-10-143
Li, Q., Yang, X., Bai, G., Warburton, M. L., Mahuku, G., Gore, M., et al. (2010b). Cloning and characterization of a putative GS3 ortholog involved in maize kernel development. Theor. Appl. Genet. 120, 753–763. doi: 10.1007/s00122-009-1196-x
Li, X., Li, Y.-X., Wu, X., Bai, N., Song, Y.-C., Zhang, D.-F., et al. (2016). Characteristic analysis of kernel related traits in important maize inbred lines of China. J. Plant Genet. Resour. 17, 1–5.
Li, Y., Fan, C., Xing, Y., Jiang, Y., Luo, L., Sun, L., et al. (2011). Natural variation in GS5 plays an important role in regulating grain size and yield in rice. Nat. Genet. 43, 1266–1269. doi: 10.1038/ng.977
Li, Y.-X., Wang, Y., Shi, Y.-S., Song, Y.-C., Wang, T., and Li, Y. (2009). Correlation analysis and QTL mapping for traits of kernel structure and yield components in maize. Sci. Agric. Sin. 42, 408–418.
Liang, C., Gu, M., Pan, X., Liang, G., and Zhu, L. (1994). RFLP tagging of a new semidwarfing gene in rice. Theor. Appl. Genet. 88, 898–900. doi: 10.1007/BF01254003
Lin, H., Liang, Z.-W., Sasaki, T., and Yano, M. (2003). Fine mapping and characterization of quantitative trait loci Hd4 and Hd5 controlling heading date in rice. Breed. Sci. 53, 51–59.
Liu, J., Deng, M., Guo, H., Raihan, S., Luo, J., Xu, Y., et al. (2015). Maize orthologs of rice GS5 and their trans-regulator are associated with kernel development. J. Integr. Plant Biol. 57, 943–953. doi: 10.1111/jipb.12421
Liu, Y., Wang, L., Sun, C., Zhang, Z., Zheng, Y., and Qiu, F. (2014). Genetic analysis and major QTL detection for maize kernel size and weight in multi-environments. Theor. Appl. Genet. 127, 1019–1037. doi: 10.1007/s00122-014-2276-0
Nie, N., Ding, X., Chen, L., Wu, X., An, Y., Li, C., et al. (2019). Characterization and fine mapping of qkrnw4, a major QTL controlling kernel row number in maize. Theor. Appl. Genet. 132, 3321–3331. doi: 10.1007/s00122-019-03427-9
Peng, B., Li, Y., Wang, Y., Liu, C., Liu, Z., Tan, W., et al. (2011). QTL analysis for yield components and kernel-related traits in maize across multi-environments. Theor. Appl. Genet. 122, 1305–1320. doi: 10.1007/s00122-011-1532-9
Qin, W.-W., Li, Y.-X., Li, C.-H., Chen, L., Wu, X., Bai, N., et al. (2015). QTL mapping for kernel related traits based on a high-density genetic map. Acta Agron. Sin. 41, 1510–1518.
Qiu, X., Gong, R., Tan, Y., and Yu, S. (2012). Mapping and characterization of the major quantitative trait locus qSS7 associated with increased length and decreased width of rice seeds. Theor. Appl. Genet. 125, 1717–1726. doi: 10.1007/s00122-012-1948-x
Ramya, P., Chaubal, A., Kulkarni, K., Gupta, L., Kadoo, N., Dhaliwal, H., et al. (2010). QTL mapping of 1000-kernel weight, kernel length, and kernel width in bread wheat (Triticum aestivum L.). Theor. Appl. Genet. 51, 421–429. doi: 10.1007/BF03208872
Song, X.-J., Huang, W., Shi, M., Zhu, M.-Z., and Lin, H.-X. (2007). A QTL for rice grain width and weight encodes a previously unknown RING-type E3 ubiquitin ligase. Nat. Genet. 39, 623–630. doi: 10.1038/ng2014
Sun, X.-Y., Wu, K., Zhao, Y., Kong, F.-M., Han, G.-Z., Jiang, H.-M., et al. (2009). QTL analysis of kernel shape and weight using recombinant inbred lines in wheat. Euphytica 165, 615–624.
Trapnell, C., Hendrickson, D. G., Sauvageau, M., Goff, L., Rinn, J. L., and Pachter, L. (2013). Differential analysis of gene regulation at transcript resolution with RNA-seq. Nat. Biotechnol. 31, 46–53. doi: 10.1038/nbt.2450
Trapnell, C., Williams, B. A., Pertea, G., Mortazavi, A., Kwan, G., Van Baren, M. J., et al. (2010). Transcript assembly and quantification by RNA-Seq reveals unannotated transcripts and isoform switching during cell differentiation. Nat. Biotechnol. 28, 511–515. doi: 10.1038/nbt.1621
Van Ooijen, J., and Voorrips, R. (2001). Software for the Calculation of Genetic Linkage Maps. Wageningen: Plant Research International Wageningen.
Veldboom, L. R., and Lee, M. (1996). Genetic mapping of quantitative trait loci in maize in stress and nonstress environments: I. Grain yield and yield components. Crop Sci. 36, 1310–1319.
Veldboom, L., and Lee, M. (1994). Molecular-marker-facilitated studies of morphological traits in maize. II: determination of QTLs for grain yield and yield components. Theor. Appl. Genet. 89, 451–458. doi: 10.1007/BF00225380
Wan, X., Wan, J., Jiang, L., Wang, J., Zhai, H., Weng, J., et al. (2006). QTL analysis for rice grain length and fine mapping of an identified QTL with stable and major effects. Theor. Appl. Genet. 112, 1258–1270. doi: 10.1007/s00122-006-0227-0
Wang, G., Zhao, Y., Mao, W., Ma, X., and Su, C. (2020). QTL analysis and fine mapping of a major QTL conferring kernel size in maize (Zea mays). Front. Genet. 11:603920. doi: 10.3389/fgene.2020.603920
Wang, S., Li, S., Liu, Q., Wu, K., Zhang, J., Wang, S., et al. (2015). The OsSPL16-GW7 regulatory module determines grain shape and simultaneously improves rice yield and grain quality. Nat. Genet. 47:949. doi: 10.1038/ng.3352
Wang, S., Wu, K., Yuan, Q., Liu, X., Liu, Z., Lin, X., et al. (2012). Control of grain size, shape and quality by OsSPL16 in rice. Nat. Genet. 44:950. doi: 10.1038/ng.2327
Xia, T., Li, N., Dumenil, J., Li, J., Kamenski, A., Bevan, M. W., et al. (2013). The ubiquitin receptor DA1 interacts with the E3 ubiquitin ligase DA2 to regulate seed and organ size in Arabidopsis. Plant Cell 25, 3347–3359. doi: 10.1105/tpc.113.115063
Xie, X., Song, M.-H., Jin, F., Ahn, S.-N., Suh, J.-P., Hwang, H.-G., et al. (2006). Fine mapping of a grain weight quantitative trait locus on rice chromosome 8 using near-isogenic lines derived from a cross between Oryza sativa and Oryza rufipogon. Theor. Appl. Genet. 113, 885–894. doi: 10.1007/s00122-006-0348-5
Xu, J., Liu, L., Xu, Y., Chen, C., Rong, T., Ali, F., et al. (2013). Development and characterization of simple sequence repeat markers providing genome-wide coverage and high resolution in maize. DNA Res. 20, 497–509. doi: 10.1093/dnares/dst026
Xu, Y., Li, H.-N., Li, G.-J., Wang, X., Cheng, L.-G., and Zhang, Y.-M. (2011). Mapping quantitative trait loci for seed size traits in soybean (Glycine max L. Merr.). Theor. Appl. Genet. 122, 581–594. doi: 10.1007/s00122-010-1471-x
Xue, S., Xu, F., Li, G., Zhou, Y., Lin, M., Gao, Z., et al. (2013). Fine mapping TaFLW1, a major QTL controlling flag leaf width in bread wheat (Triticum aestivum L.). Theor. Appl. Genet. 126, 1941–1949. doi: 10.1007/s00122-013-2108-7
Yang, B., Zhang, K., Jin, X., Yan, J., Lu, S., Shen, Q., et al. (2021). Acylation of non-specific phospholipase C4 determines its function in plant response to phosphate deficiency. Plant J. 106, 1647–1659. doi: 10.1111/tpj.15260
Yang, M., Chen, L., Wu, X., Gao, X., Li, C., Song, Y., et al. (2018). Characterization and fine mapping of qkc7.03: a major locus for kernel cracking in maize. Theor. Appl. Genet. 131, 437–448. doi: 10.1007/s00122-017-3012-3
Young, N. D., Zamir, D., Ganal, M. W., and Tanksley, S. D. (1988). Use of isogenic lines and simultaneous probing to identify DNA markers tightly linked to the tm-2a gene in tomato. Genetics 120, 579–585. doi: 10.1093/genetics/120.2.579
Zhang, J., Liu, Y.-X., Zhang, N., Hu, B., Jin, T., Xu, H., et al. (2019). NRT1. 1B is associated with root microbiota composition and nitrogen use in field-grown rice. Nat. Biotechnol. 37, 676–684. doi: 10.1038/s41587-019-0104-4
Zhang, X., Wang, J., Huang, J., Lan, H., Wang, C., Yin, C., et al. (2012). Rare allele of OsPPKL1 associated with grain length causes extra-large grain and a significant yield increase in rice. Proc. Natl. Acad. Sci. U.S.A. 109, 21534–21539. doi: 10.1073/pnas.1219776110
Zhang, Z., Li, A., Song, G., Geng, S., Gill, B. S., Faris, J. D., et al. (2020). Comprehensive analysis of Q gene near-isogenic lines reveals key molecular pathways for wheat domestication and improvement. Plant J. 102, 299–310. doi: 10.1111/tpj.14624
Zhang, Z., Liu, Z., Hu, Y., Li, W., Fu, Z., Ding, D., et al. (2014). QTL analysis of kernel-related traits in maize using an immortalized F2 population. PLoS One 9:e89645. doi: 10.1371/journal.pone.0089645
Zhao, Y., and Su, C. (2019). Mapping quantitative trait loci for yield-related traits and predicting candidate genes for grain weight in maize. Sci. Rep. 9:16112. doi: 10.1038/s41598-019-52222-5
Zhao, F., Ren, S., Guo, Z., and Shen, S. (2011). Effects of exogenous pea-ferritin gene on the important biological features of rice using near isogenic lines. J. Agric. Biotechnol. 19, 63–68.
Keywords: maize, NILs, QTL validation, kernel width, candidate genes
Citation: Zhao Y, Ma X, Zhou M, Wang J, Wang G and Su C (2022) Validating a Major Quantitative Trait Locus and Predicting Candidate Genes Associated With Kernel Width Through QTL Mapping and RNA-Sequencing Technology Using Near-Isogenic Lines in Maize. Front. Plant Sci. 13:935654. doi: 10.3389/fpls.2022.935654
Received: 04 May 2022; Accepted: 06 June 2022;
Published: 30 June 2022.
Edited by:
Baohua Wang, Nantong University, ChinaReviewed by:
Huatao Chen, Jiangsu Academy of Agricultural Sciences (JAAS), ChinaZhitong Yin, Yangzhou University, China
Copyright © 2022 Zhao, Ma, Zhou, Wang, Wang and Su. This is an open-access article distributed under the terms of the Creative Commons Attribution License (CC BY). The use, distribution or reproduction in other forums is permitted, provided the original author(s) and the copyright owner(s) are credited and that the original publication in this journal is cited, in accordance with accepted academic practice. No use, distribution or reproduction is permitted which does not comply with these terms.
*Correspondence: Chengfu Su, Y2hmc3UyMDA4QDE2My5jb20=
†These authors have contributed equally to this work