 Jeewan Pandey
 Douglas C. Scheuring1
 M. Isabel Vales
- 1Department of Horticultural Sciences, Texas A&M University, College Station, TX, United States
- 2Texas A&M University AgriLife Research and Extension Center, Lubbock, TX, United States
In potato breeding, morphological tuber traits are important selection targets to meet the demands of the fresh and processing markets. Understanding the genetic basis of tuber traits should guide selection and improve breeding efficiencies. However, this is challenging in potato due to the complexity of the traits and the polyploid nature of the potato genome. High-throughput affordable molecular markers and new software specific for polyploid species have the potential to unlock previously unattainable levels of understanding of the genetic basis of tuber traits in tetraploid potato. In this study, we genotyped a diversity panel of 214 advanced clones with the 22 K SNP potato array and phenotyped it in three field environments in Texas. We conducted a genome-wide association study using the GWASpoly software package to identify genomic regions associated with tuber morphological traits. Some of the QTLs discovered confirmed prior studies, whereas others were discovered for the first time. The main QTL for tuber shape was detected on chromosome 10 and explained 5.8% of the phenotypic variance. GWAS analysis of eye depth detected a significant QTL on chromosome 10 and explained 3.9% of the phenotypic variance. Our study found that multiple QTLs govern russeting in potato. A major QTL for flesh color on chromosome 3 that explained 26% of the phenotypic variance likely represents the Y locus responsible for yellow flesh in potato tubers. Several QTLs were detected for purple skin color on chromosome 11. Furthermore, genomic estimated breeding values were obtained, which will aid in the early identification of superior parental clones that should increase the chances of producing progenies with higher frequencies of the desired tuber traits. These findings will contribute to a better understanding of the genetic basis of morphological traits in potato, as well as to identifying parents with the best breeding values to improve selection efficiency in our potato breeding program.
Introduction
Domestication and selective breeding have resulted in significant morphological variation in organ shape in cultivated plant species (Sun et al., 2017). Examples of studies on phenotypic diversity and their genetic basis include grain size and shape in wheat (Gegas et al., 2010), fruit shape in tomato and melon (Monforte et al., 2014), and phenotypic diversification in Brassica rapa and Brassica oleracea (Cheng et al., 2016). Potato domestication took place around 8,000 years ago from a wild diploid Solanum species in an area located on the border of present-day Peru and Bolivia (Spooner et al., 2005). Modern cultivars are the result of extensive crossbreeding between cultivar groups as well as wild species. Andean tetraploid varieties likely resulted from repeated sexual polyploidization of early landrace diploids (Spooner et al., 2014). The domestication of potatoes involved selection of shorter stolons, larger tubers, diverse tuber shapes, and reduction of bitter tuber glycoalkaloids (Spooner et al., 2005).
Potato breeding activities are mainly concentrated on developing cultivars for the processing and table/fresh markets. Processing potatoes are used to produce chip, French fries, and dehydrated products. Table/fresh market types are further grouped as reds, russets, whites, purples, and yellows (based on skin or flesh color). Market-group-specific morphological traits include tuber shape, eye depth, degree of russeting, tuber number, tuber weight, skin color, and flesh color. Tuber shape is extremely important and is based on historical regional preferences coupled with local culinary practices (Stark et al., 2020). Chips are made with round tubers, whereas French fries are made with oblong to long tubers. Likewise, consumers expect red and yellow table stock cultivars to be round or oval (Chen et al., 2018). The irregular shape and deep eyes in potatoes lead to higher costs due to significant peeling losses and thus are undesirable traits (Li et al., 2005; ŚLiwka et al., 2008). Another trait, skin russeting texture is an inherited characteristic in some potato cultivars such as Russet Burbank and Russet Norkotah (De Jong, 1981). Russet skin is not present in native potatoes. In Europe, smooth skin texture has been preferred by consumers, whereas russet skin is desired in the USA and Canada. Tuber size, skin color, and flesh color traits are also preferred by consumers and industry depending on the use of potatoes. Thus, breeding for tuber morphological traits in potatoes is crucial as these traits affect consumption.
The cultivated potato is a vegetatively propagated crop with a complex autotetraploid (2n = 4x = 48) genome, a basic chromosome number of 12, and a genome size of 844 Mb (Xu et al., 2011). Due to high heterozygosity, broad segregation for many traits will occur when breeders make crosses (Bonierbale et al., 2020). Some of these traits are poorly characterized and their heritability is often low (Thiele et al., 2021). Due to this complexity in autopolyploids, most molecular analytical tools and software have been limited to diploids (Bourke et al., 2018a). Utilizing bi-parental populations in diploid potatoes, quantitative trait loci (QTL) mapping studies have been performed to map several tuber quality traits. Tuber shape inheritance, whether it is monogenic or polygenic, has been inconsistent. van Eck et al. (1994a), using restriction fragment length polymorphisms (RFLPs), identified a single locus, Ro, that explains the inheritance of qualitative tuber shape, with round being dominant over long on chromosome 10. Other reports using populations with different genetic backgrounds mention QTLs on chromosomes 2, 5, and 11 (Bradshaw et al., 2008), and 2 and 11 (ŚLiwka et al., 2008). Eye depth was linked to the Ro locus on chromosome 10 (Li et al., 2005; ŚLiwka et al., 2008). Similarly, using QTL analysis, a dominant allele at the Y (yellow) locus on potato chromosome 3 was identified for the yellow flesh color (Bonierbale et al., 1988). A beta-carotene hydroxylase gene (BCH) was found in the same position as the Y locus, suggesting that this is the most likely candidate gene for yellow flesh (Thorup et al., 2000; Kloosterman et al., 2010). Anthocyanin pigments accumulate in the tuber skin and flesh, giving it a red or purple color (Eichhorn and Winterhalter, 2005). Anthocyanin pigmentation in tuber skin was first mapped on chromosome 10 by van Eck et al. (1994b). The Pf locus is tightly linked to the I locus (encoding an MYB transcription factor) and regulates the synthesis of purple and red anthocyanins (De Jong, 1987; De Jong et al., 2004). The R locus, involved in the biosynthesis of red anthocyanins was first mapped on chromosome 2 by van Eck et al. (1993) and it encodes dihydroflavonol 4-reductase (dfr) (De Jong et al., 2003; Zhang et al., 2009). The P locus involved in the production of blue/purple anthocyanins in potato was first mapped by van Eck et al. (1993) on chromosome 11. Jung et al. (2005) reported that the P locus encodes flavonoid 3′,5′-hydroxylase (f3′5′h) gene and it is expressed in the tuber skin only in the presence of I locus.
High-throughput and affordable molecular markers and recent analytical platforms suitable for the analysis of polyploid species hold the promise of unlocking previously unattainable levels of understanding of the cultivated tetraploid potato genome. TetraploidSNPMap (Hackett et al., 2017) uses allelic dosage to carry out linkage analysis and QTL mapping in autotetraploid species. Other polyploid mapping softwares include the PERGOLA package in R (Grandke et al., 2017), polymapR (Bourke et al., 2018b), and MAPpoly (Mollinari and Garcia, 2019). Advancements in tools for genomic analysis in polyploid species have aided in the identification of QTLs that account for significant amounts of phenotypic variance within a polyploid population. However, underestimation the QTL number, effect, and phenotypic variance explained, and low resolution of individual QTL in a bi-parental population often obstruct causal gene identification (Zhu et al., 2008).
Another powerful strategy to discover markers linked to complex traits is to perform Genome-Wide Association Studies (GWAS) (Cortes et al., 2021). GWAS is an effective method for circumventing many of the limitations of bi-parental linkage mapping. It takes advantage of genetic variation that exists among natural or developed populations utilizing historical recombination and knowledge of population structure (Ortiz, 2020). GWAS pinpoints QTLs by analyzing marker-trait associations that can be attributed to the strength of linkage disequilibrium (LD) between markers and functional polymorphisms across a set of diverse germplasm (Zhu et al., 2008). One challenge in applying GWAS to polyploid species is how to define relatedness between polyploid individuals (i.e., how to generate the kinship matrix, K). GWAS can now account for the kinship matrix (K) in potatoes using GWASpoly (Rosyara et al., 2016). GWASpoly also considers allelic dosage (AAAA, AAAa, AAaa, Aaaa, aaaa). For computational efficiency, Yang et al. (2014) proposed the leave-one-chromosome-out (LOCO) method. In LOCO method, a different covariance matrix is calculated for each chromosome based on the markers from all other chromosomes (Yang et al., 2014) and is now implemented in version 2 of GWASPoly. Sharma et al. (2018) examined various GWAS models in cultivated potato genotypes using the Infinium 8 K Potato SNP Array and found that kinship, not population structure, was the most important factor in determining the extent of false associations. Klaassen et al. (2019) evaluated a panel of 277 varieties using SolSTW 20 K Infinium SNP marker array (Vos et al., 2015) and revealed four QTLs for protein content in tetraploid potato. Similarly, Zia et al. (2020) performed a GWAS using SolCAP 12 K array for various morpho-agronomic traits in a panel of 237 tetraploid potato genotypes. Kaiser et al. (2020) used GWAS to identify genetic features associated with common scab resistance in the tetraploid population using the Illumina Infinium 8,303 Potato Array. Recently, Yousaf et al. (2021) reported SNPs associated with potato stolon traits and root traits.
For practical breeding applications, genomic selection (GS) based on genome-wide marker effects is a very promising marker-assisted selection procedure that should speed up the selection of the best candidate clones (to advance in the breeding program or to be used as parents) and thus contributes to increasing genetic gains. Genomic selection is based on genomic estimated breeding values (GEBV) that are predicted from high-density DNA markers dispersed across the genome (Meuwissen et al., 2001). Genomic selection has been effectively applied in animal breeding (Meuwissen et al., 2016) as well as in plant breeding, particularly in cereals like wheat (Poland et al., 2012; Bassi et al., 2016), maize (Bernardo and Yu, 2007; Crossa et al., 2017) and barley (Lorenz et al., 2012). Genomic selection is still in its infancy for many crops and its promise for cultivar improvement has been demonstrated by recent studies in potato (Habyarimana et al., 2017; Sverrisdóttir et al., 2017; Endelman et al., 2018; Bradshaw, 2021; Selga et al., 2021; Wilson et al., 2021). Genetic variance partitioning and genome-wide prediction can be done with allele dosage information (Endelman et al., 2018). GEBV will allow selection of superior parents or advancement of better clones for next-generation to be faster and more effective than using phenotypic information alone.
The Texas A&M University Potato Breeding Program has a collection of 214 advanced clones selected over 40 years and maintained in vitro (Pandey et al., 2021). The clones have been propagated and evaluated under field conditions. Since there is variation in tuber morphology traits, this panel can be used to explore genomic regions associated with tuber traits and to identify superior individuals to use as parents. Recent molecular marker-dense platforms and analytical software optimized to conduct statistical genomic analysis in polyploid species are expected to provide good allelic calls and better calculations of relatedness, handle additive and dominant models, as well as allow more accurate detection of QTL number, position, effects, and phenotypic variance explained. In this study, we aimed to detect QTLs associated with tuber shape, eye depth, degree of russeting, tuber number, tuber weight, skin color and flesh color, and to identify clones with superior tuber traits to be use in the breeding program based on genomic estimated breeding values.
Materials and methods
Plant materials
The association panel consisted of 214 tetraploid potato clones including advanced clones entered into tissue culture over several decades, varieties released by the Texas A&M Potato Breeding Program, and reference varieties for various market groups. The collection comprised 31 chipping, 62 russet, 32 yellow-skinned, 68 red-skinned, and 21 purple-skinned clones (Pandey et al., 2021). The reference varieties evaluated were: Russet Norkotah (standard, fresh market russet), Atlantic (chipper), Russet Burbank (processing russet), White LaSoda (a white-skinned mutant of Red LaSoda selected by the TAMU Program, fresh market white flesh), and a Yukon Gold strain (TXYG79, fresh market yellow flesh). Analysis of population structure and discriminant analysis of principal components in the panel displayed three sub-populations, as reported earlier (Pandey et al., 2021).
Genotyping
Genomic DNA was extracted from 50 to 80 mg of fresh young potato leaves from tissue culture plantlets using the DNeasy Plant Pro Kit (Qiagen, Valencia, CA, United States). Samples were assayed using the Infinium 22 K V3 Potato Array on the Illumina iScan (Illumina Inc., San Diego, CA, United States) at Michigan State University. The marker dataset was filtered for polymorphism and minor allele frequency as described in Pandey et al. (2021).
Field experiments and phenotyping
Three field experiments were conducted in Texas to obtain tuber traits data. In 2019, tuber traits were evaluated in Dalhart (35°58′N, 102°44′W; DAL 2019), and in 2020, the traits were evaluated in Springlake (34°6′N, 102°19′W; SPR 2020) and Dalhart (DAL 2020). In all three environments, entries were planted in 12-hill plots with two replications in a randomized complete block design. Seed tuber pieces were planted with 30 cm spacing between hills and 70 cm spacing between rows. In Springlake, trials were planted in late March and harvested in early July, whereas in Dalhart, trials were planted in early May and harvested in early September, with vine desiccation 2–3 weeks before harvest. Standard potato production practices were followed during the growing period in all years (details are in the 2019 and 2020 reports of Texas A&M Potato Breeding Program: https://potato.tamu.edu/reports/). The environmental conditions during the potato growing season were representative of the subregion (High Plains) which is characterized by a cold semi-arid climate. Temperature and precipitation regimes during the growing season can be obtained from the 2019 and 2020 reports of the Texas A&M Potato Breeding Program: https://potato.tamu.edu/reports/. Rainfall was supplemented with center pivot irrigation.
For the traits assessed visually, the scores were given by replication and were representative of all tubers harvested per plot. Tuber shape was determined using a 1 to 5 scale, where 1 = round, to 5 = long. Tuber shape was also measured as the ratio of tuber length to width (roundness score) and tuber length to thickness (flatness score). Length (mm) of the tuber was the distance from the stolon end to the bud end of the tuber, width (mm) was the highest dimension in the equatorial area of the tuber, and thickness (mm) was measured perpendicularly to width. For each clone, length, and width data were collected from five tubers (from the 113.4 to 170.1 g grading group) per replication using a bar-coded ruler. Eye depth was evaluated on a 1–5 scale, where 1 = very deep eyes, to 5 = very shallow eyes. The degree of skin russeting texture was evaluated on a 1–5 scale, where 1 = no russeting (smooth) to 5 = heavy russetting. Grading score was obtained on a 1–5 scale, where 1 = poor, to 5 = excellent. Average weight per tuber was calculated by dividing the total tuber yield of the plot by the number of tubers; average tuber number per plant was calculated as a total number of tubers harvested per plot per replication divided by plant stand at 60 DAP (days after planting), and the average tuber weight per plant was calculated from the total tuber yield of the plot divided by the plant number plant stand at 60 DAP.
Objective color measurements for the skin and flesh color were obtained from three tubers per plot per replication with a colorimeter, Konica–Minolta Chroma Meter CR-400 with 8-mm aperture and 0° viewing angle (Konica-Minolta, Inc., Tokyo, Japan), using the International Commission on Illumination (CIE) 1976 L*a*b* color spaces. The instrument was calibrated against a standard white reference tile provided by the instrument manufacturer. CIE 1976 L*a*b* is a three-dimensional color space where L* (lightness) represents the white to black axis, a* represents the red to green axis, and b* represents the yellow to blue axis. The colorimeter collected an average of three readings per tuber, and each reading covered 50.3 mm2 (8 mm diameter area) of the surface. Data were recorded using Color Data Software CM-S100w SpectraMagic NX (Version 2.8). The color was expressed in LCH color space, in which L* is lightness, C is chroma (saturation) and H is hue angle. Purple skin in tuber was scored as a binary trait (Purple/Non-purple).
Statistical analyses
Analysis of variance across environments (DAL 2019, DAL 2020, and SPR 2020 - combined) and by individual environment, was done for each tuber trait using mixed models in JMP Pro 16® (SAS Institute, Cary, NC). Clones were treated as fixed effects, while the environment, replication within environments, and their interaction were treated as random effects. To determine the significance of location (Dalhart vs Springlake) and location by clone interactions, the DAL 2020 and SPR 2020 datasets were used; locations were treated as fixed effects. To ascertain the significance of year, and year by clone interaction, analysis of variance was done for 2 years at the Dalhart location using the DAL 2020 and DAL 2020 datasets; years were considered random effects.
Tuber morphological traits were also analyzed separately for each of the three environments (location-year) and combined across environments using the software package META-R (Alvarado et al., 2020). Best linear unbiased estimates (BLUEs), range, LSD, and CV were generated using standard procedures implemented in META-R. Phenotypic correlations between pairs of traits were calculated as simple Pearson correlations. Broad-sense heritability of a given trait in an individual environment (repeatability) was calculated on a genotype mean basis as:
where is the genotypic variance, is the error variance, and r is the number of replications.
Broad-sense heritability on a genotype mean basis for the combination of all environments was calculated as:
where is the genotypic variance, is the variance of the interaction of genotype and environment, is the variance of the experimental error, is the number of replications, and is the number of environments.
BLUEs were calculated for each genotype, considering the effects of genotypes as fixed. BLUEs used for GWAS for a single environment were estimated as:
where Yik is the value for the trait of interest, μ is the mean trait effect, Ri is the effect of the ith replicate, Gk is the effect of the kth genotype, and εik is the error associated with the ith replication, and the kth genotype.
Likewise, BLUEs used for GWAS for the combined environment considering genotypes fixed was estimated as:
where Yijr = trait value for the genotype i in the environment j and rep r, m = grand mean of trait, G = genotype, E = environment, R(E) = replication within an environment, e = random error.
Narrow-sense heritability was calculated using a two-stage approach described by Damesa et al. (2017), and ASReml-R (VSN International, UK) for variance component estimation.
Assessment of linkage disequilibrium and genome-wide association studies
Linkage disequilibrium was estimated for all SNPs with pairwise correlation coefficient (r2) based on allele frequencies (Hill and Robertson, 1968) using LD.plot function in GWASpoly (Rosyara et al., 2016). A monotone decreasing, convex spline was fit using the R package scam. The appropriate window size to filter the most significant markers was determined based on the extent of LD in the panel, visualized using the function LD.plot.
The whole marker dataset was filtered for polymorphisms and minor allele frequencies and 10,116 SNPs were retained for further analysis. Association analysis was performed with the BLUEs for tuber traits with 10,116 SNPs using the GWASpoly Version 2 package in R (Rosyara et al., 2016). To control population structure, the leave-one-chromosome-out (LOCO) method (Yang et al., 2014) was used. Additive and dominant genetic models were tested for each trait. A Bonferroni test was run for each trait and year to establish a LOD threshold corresponding to a genome-wide false-positive rate of 5%. Manhattan plots were produced using GWASpoly. The proportion of phenotypic variance explained by significant SNPs was estimated using the function fit. QTL in GWASpoly based on the change in the likelihood obtained from backward elimination (Sun et al., 2010). Contextual sequences of candidate SNPs were used in a BLAST search of DM1–3 pseudomolecules (Version 4.03) in the Spud DB database (http://solanaceae.plantbiology.msu.edu/) to identify putative candidate genes.
Genomic estimated breeding values
Genetic variance partitioning and genome-wide prediction was done with allele dosage information (Endelman et al., 2018).1 The BLUEs were used as the response variable for partitioning of variance. The model was
where is the genotypic value for clone i in year j, is the fixed effect for year j, is the (centered) allele dosage for clone i at marker k, and is the fixed effect for marker k. The vector of additive values, a, follows a multivariate normal distribution with covariance proportional to a genomic relationship matrix (G) estimated from markers (VanRaden, 2008; Endelman et al., 2018). Non-additive effects were captured using independent and identically distributed residual genetic values, . The sij random has no free variance parameters and follows a multivariate normal distribution (Damesa et al., 2017). The model residuals represent the genotype x year interaction.
Well-established methods were utilized to compute best linear unbiased predictors (BLUP) and standard errors. For a generic random vector u, BLUP , where , , V is the variance–covariance matrix of the response variable, and X is the incidence matrix for fixed effects (Searle et al., 1992). The squared correlation with the true value, which equals and , represents the reliability of .
Results
Phenotypic data analysis
The potato association mapping panel showed variation for tuber morphology traits and represents a promising resource for GWAS (Table 1). The frequency distribution of phenotypic data showed that most tuber traits were not normally distributed (Figure 1). For the eye depth, the distribution was skewed toward superficial (shallow) eyes. In the case of the degree of russeting, most clones had either smooth or russet skin, with few clones with intermediate or buff type skin. Large variation was found for average tuber weight from very small to large. A larger tuber is often preferred, but there is a growing market for small size potatoes; in the latter case, a high tuber number is desired.
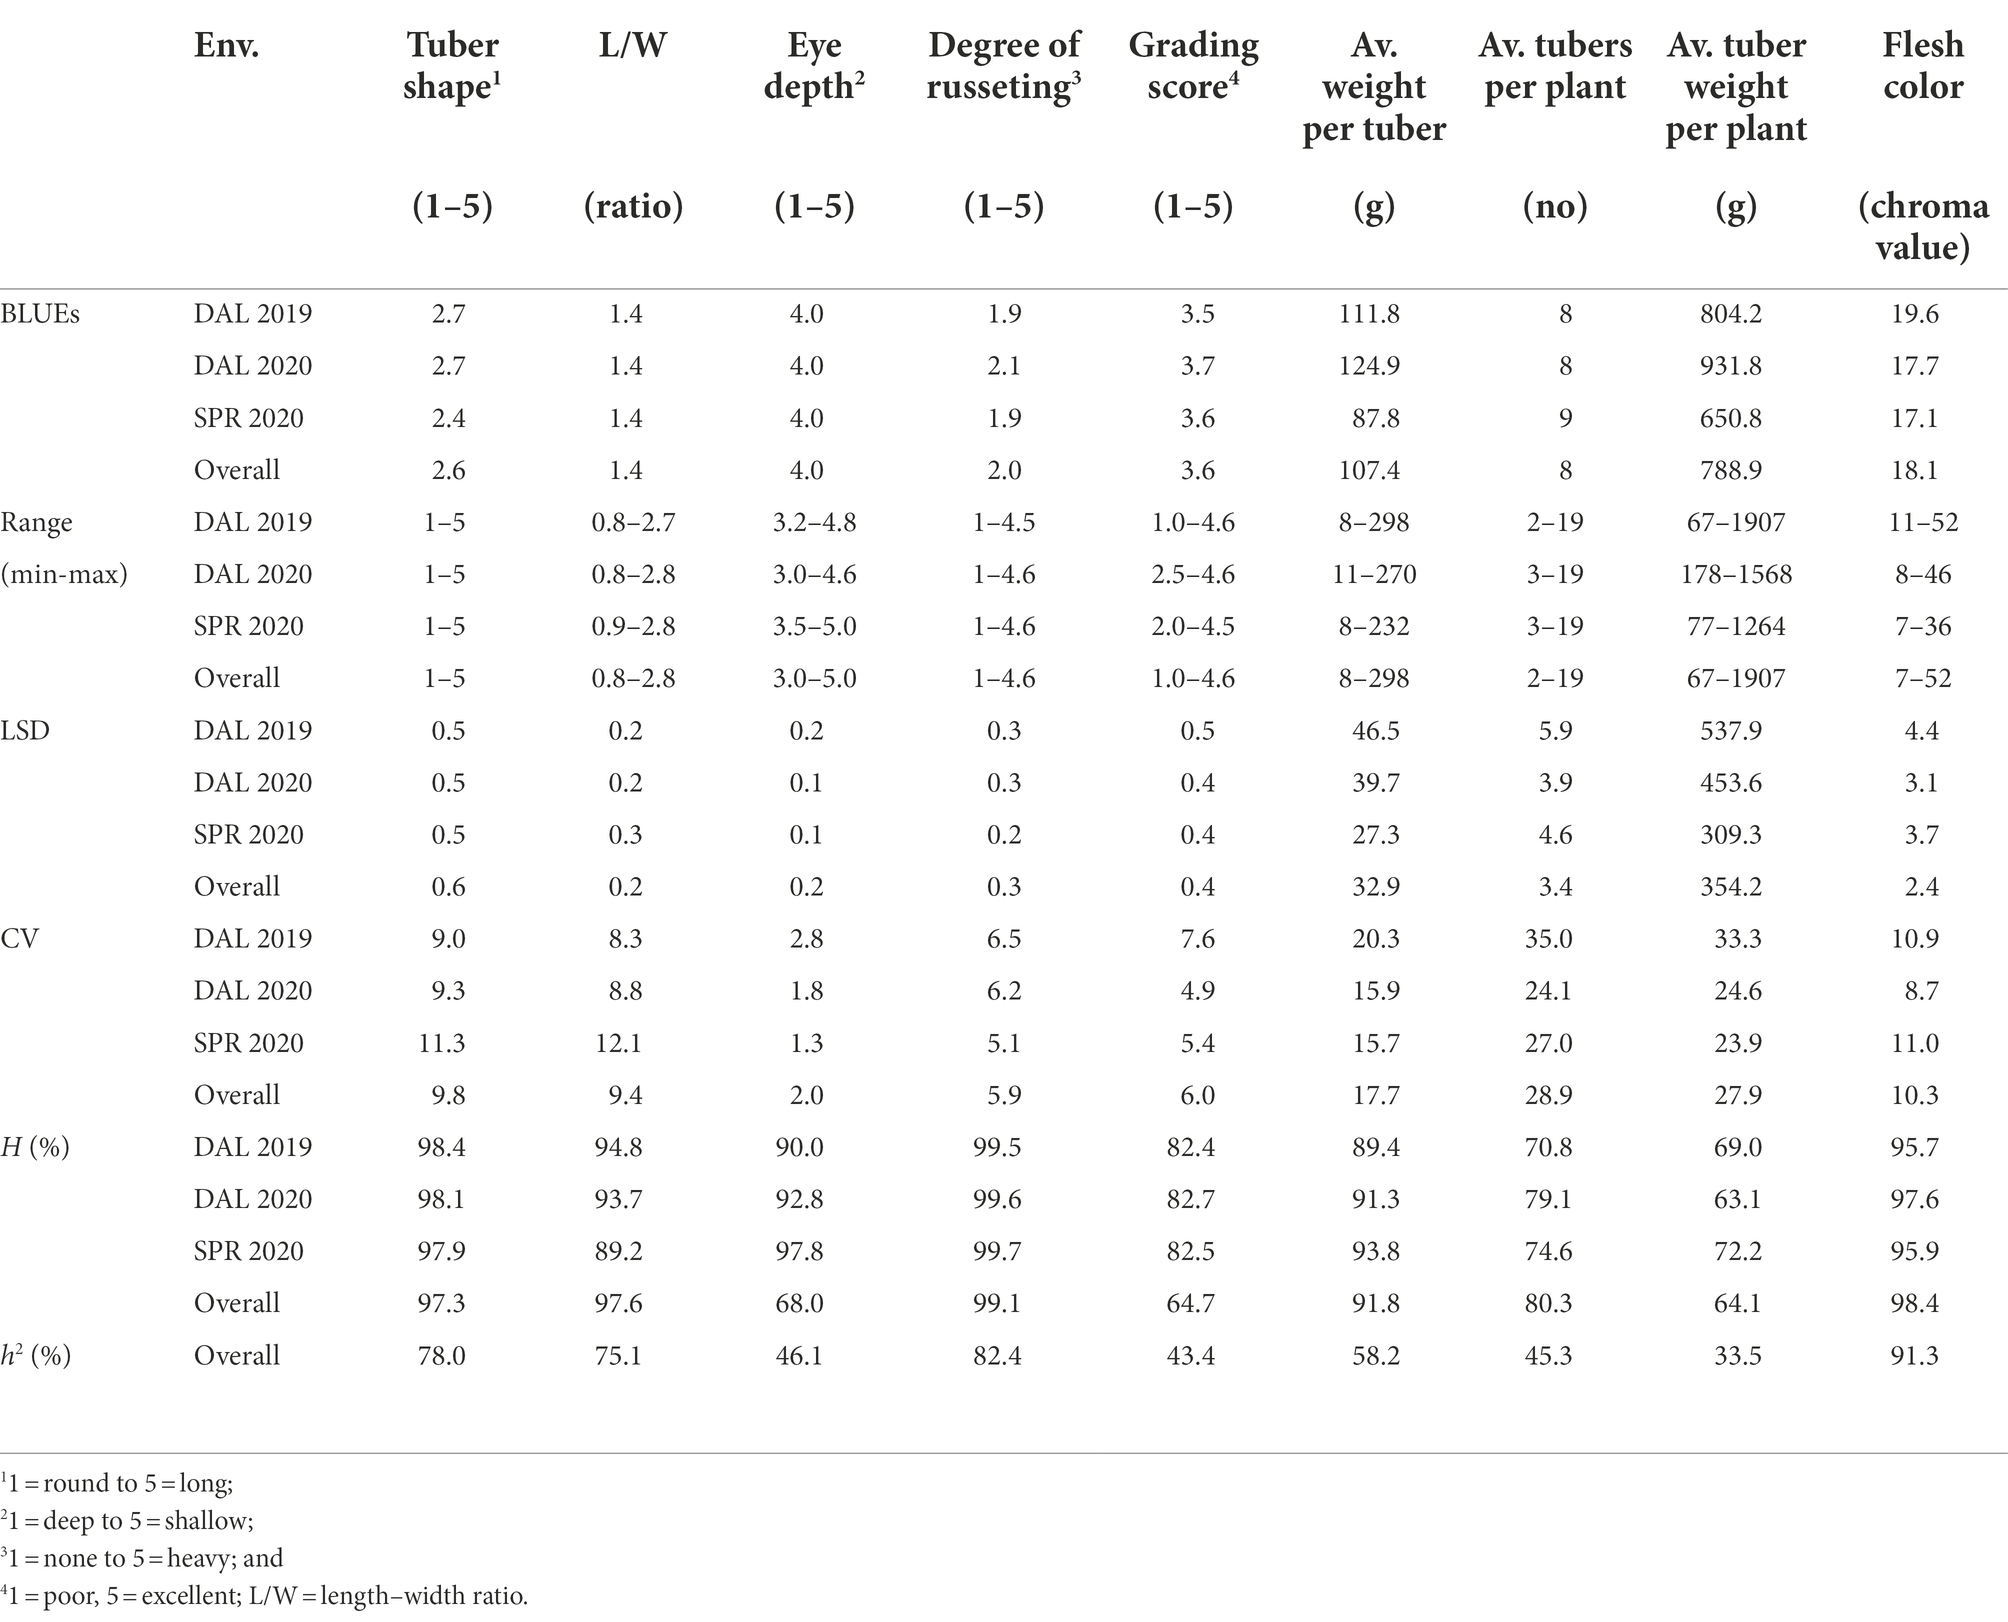
Table 1. Summary statistics based on best linear unbiased estimators (BLUEs), broad-sense and narrow-sense heritability for tuber morphological traits of 214 potato clones evaluated in three environments (Env.) in Texas: Dalhart 2019 (DAL 2019), Dalhart 2020 (DAL 2020), and Springlake 2020 (SPR 2020).
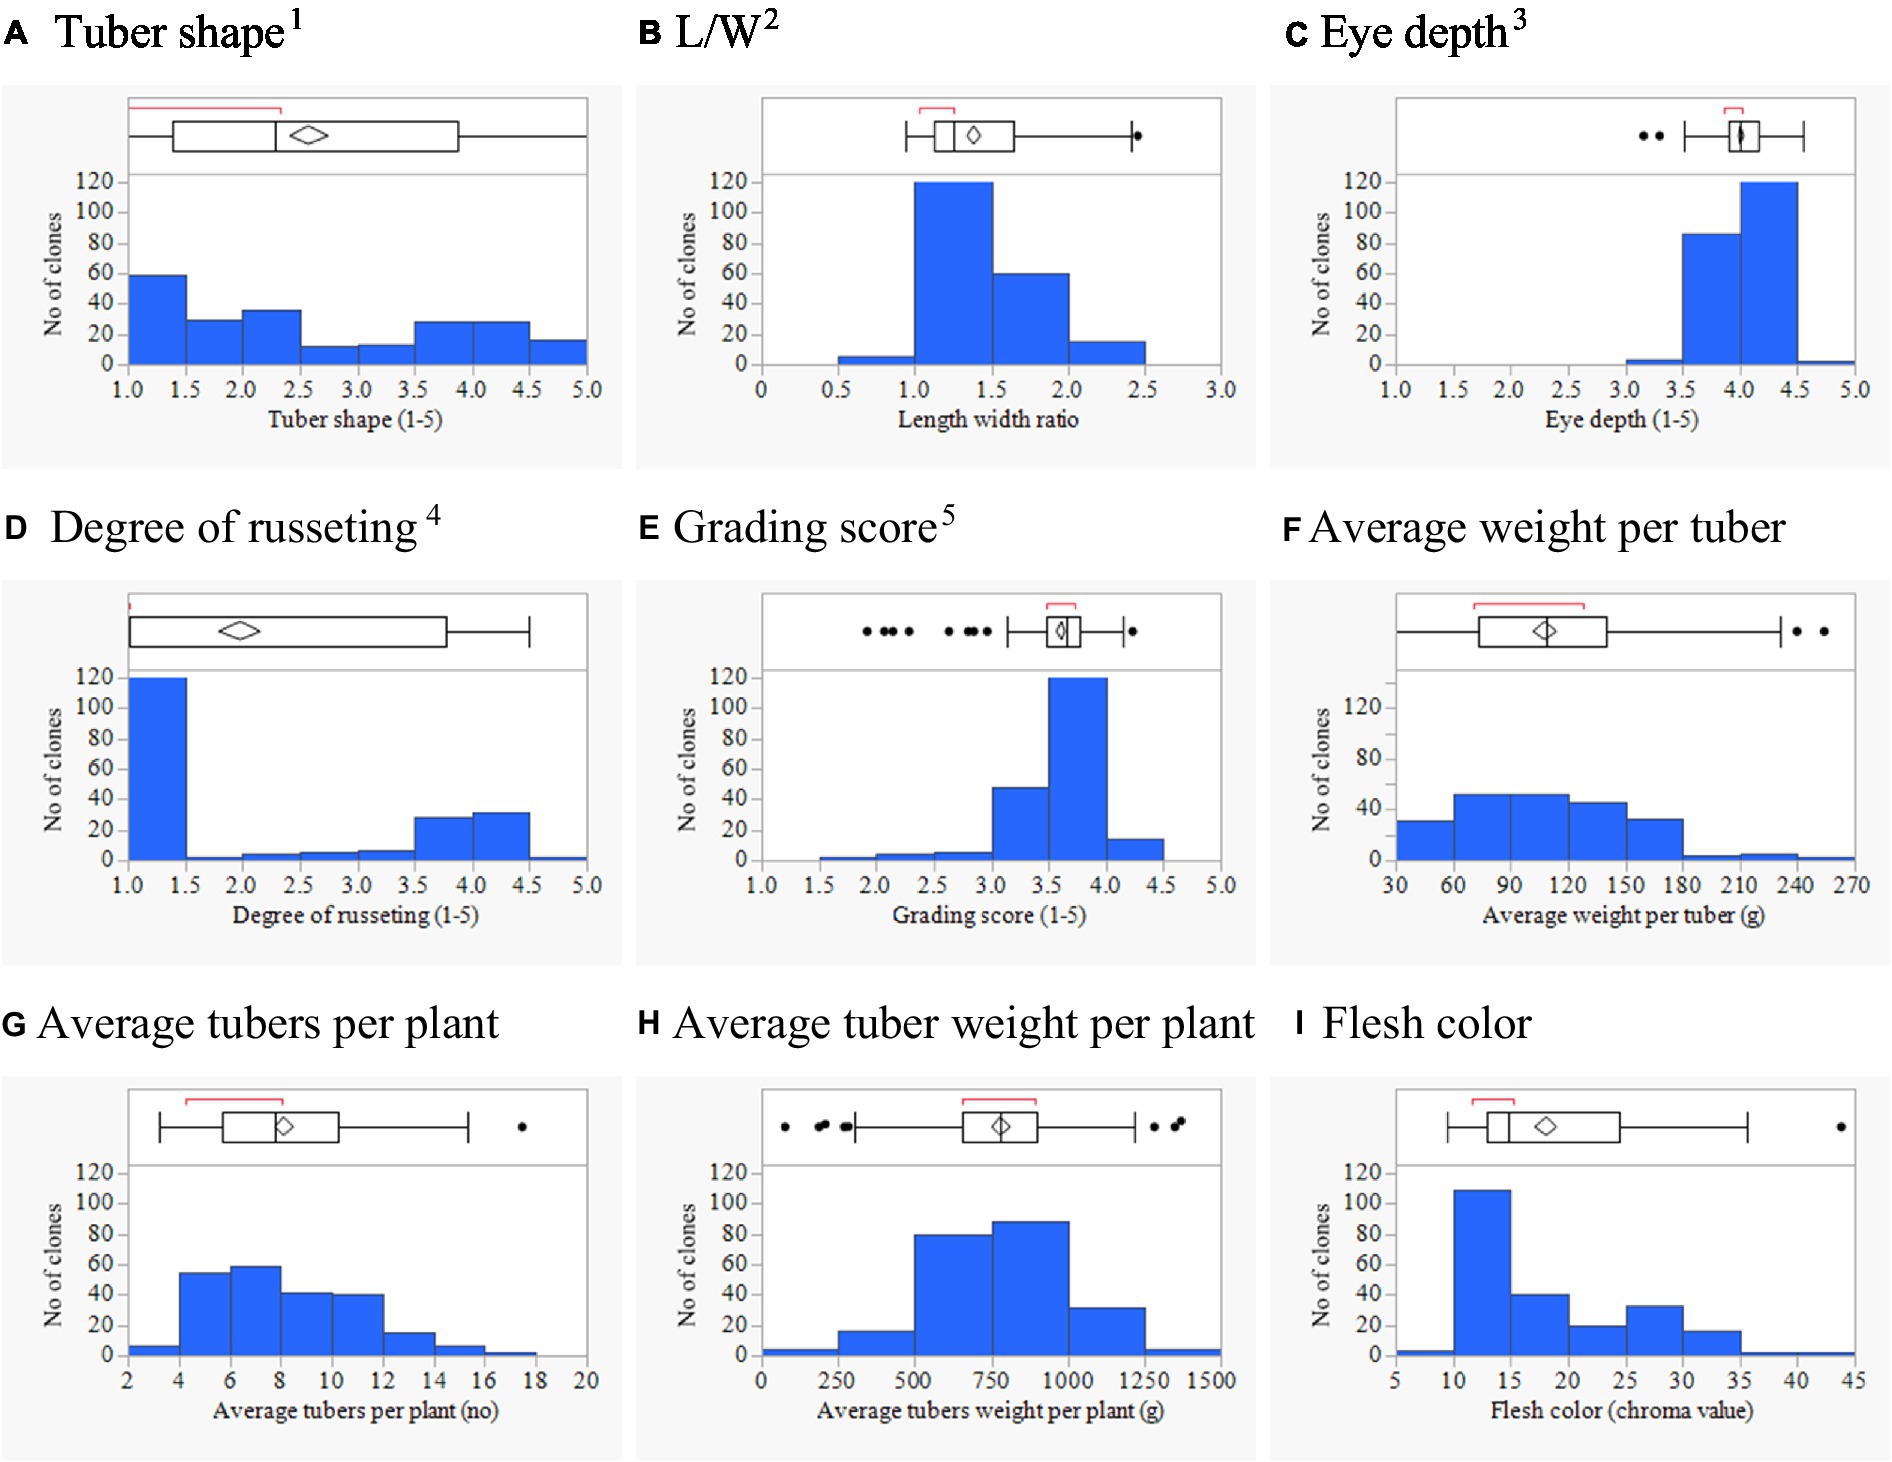
Figure 1. Phenotypic distributions of 214 potato clones for tuber shape (A), L/W (B), eye depth (C), degree of russeting (D), grading score (E), average weight per tuber (F), average tuber number per plant (G), average tuber weight per plant (H), and flesh color (I) combined across three environments in Texas: Dalhart 2019, 2020 and Springlake 2020. 11 = round to 5 = long; 21 = deep to 5 = shallow; 31 = none to 5 = heavy; 41 = poor, 5 = excellent; and L/W = length–width ratio.
Significant variation was found between market groups for various tuber traits (Table 2). For example, the tuber shape score was significantly higher in a russet market group (4.0) than in chips and reds (1.9 and 1.7, respectively). The degree of russeting was significantly higher in russets than in chips, yellows, purples, and reds. The russets also had a significantly lower average tuber number per plant and higher average weight per tuber than other market groups (Table 2).
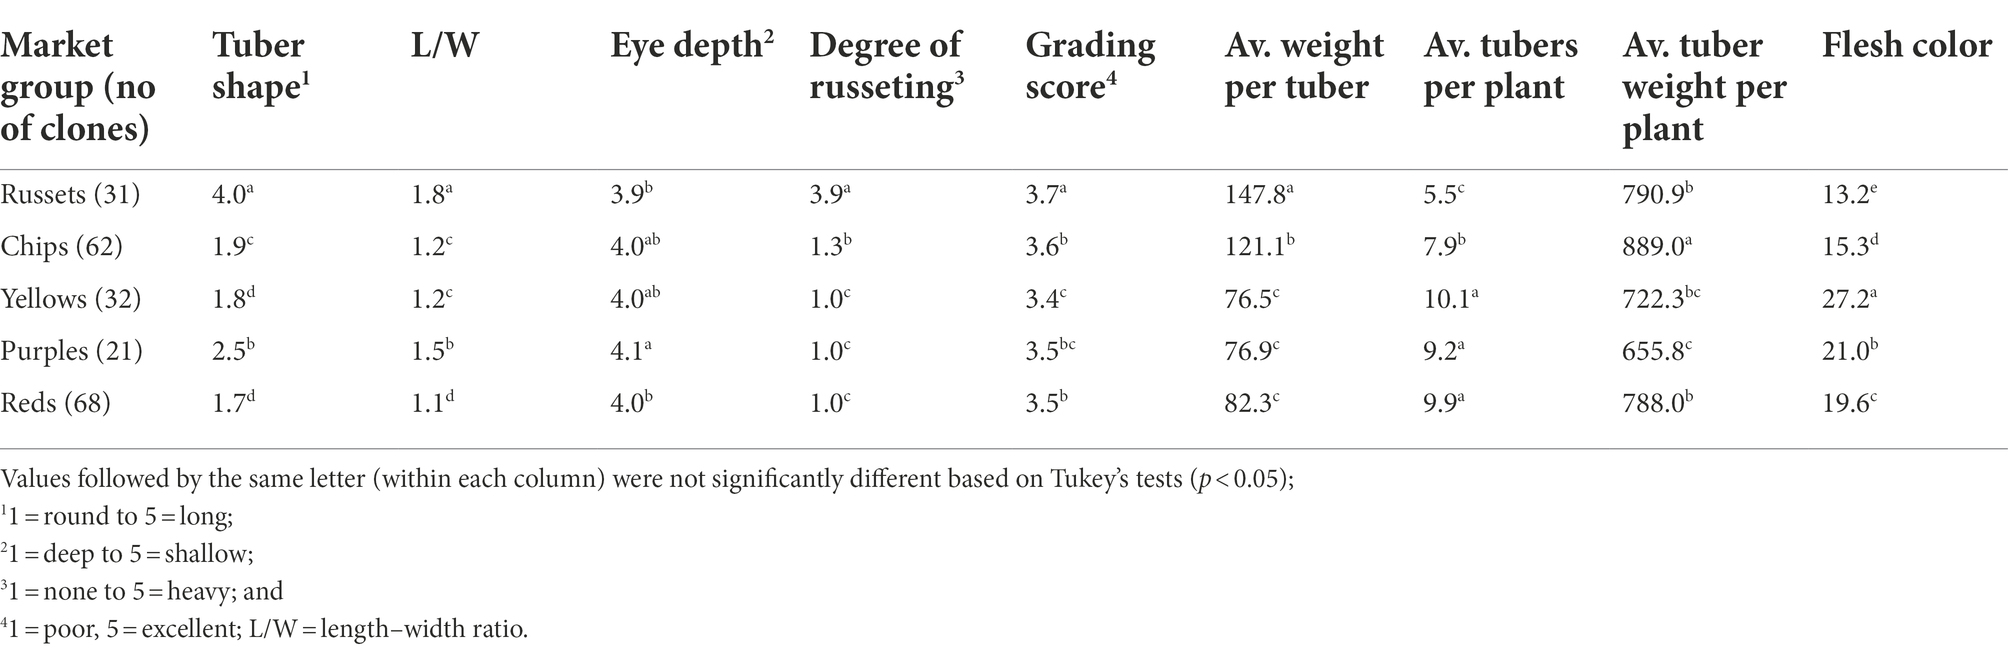
Table 2. Mean BLUE values of 214 potatoes (by market group) for tuber morphological traits evaluated in three environments in Texas: Dalhart 2019, 2020, and Springlake 2020.
Analysis of variance showed that clones were significantly different in tuber morphological traits (Table 3). Likewise, the interactions were significant between clone and environments, clone and location, and clone and year for tuber traits (Table 3). Analysis of variance with the data from two sites (DAL 2020 and SPR 2020) indicated that there was a significant difference between locations for tuber shape, length–width ratio, degree of russeting, eye depth, the average weight per tuber, average tuber weight per plant, and grading score (Table 3). For example, the average tuber weight was significantly higher in Dalhart (125.6 g) than Springlake (88.1 g). However average tubers per plant and flesh color were not significantly different when comparing the two locations (Table 3). Analysis of variance with the data from 2 years (DAL 2019 and DAL 2020) indicated that there was no significant difference between years for tuber traits (Table 3). High broad-sense heritability (H > 0.95) was observed for tuber shape, L/W, degree of russeting, and flesh color across three environments (DAL 2019, DAL 2020, and SPR 2020; Table 1). The highest narrow-sense heritability (h2) of 0.91 was for flesh color and the lowest (0.33) was for average tuber weight per plant across three environments (DAL 2019, DAL 2020, and SPR 2020; Table 1).
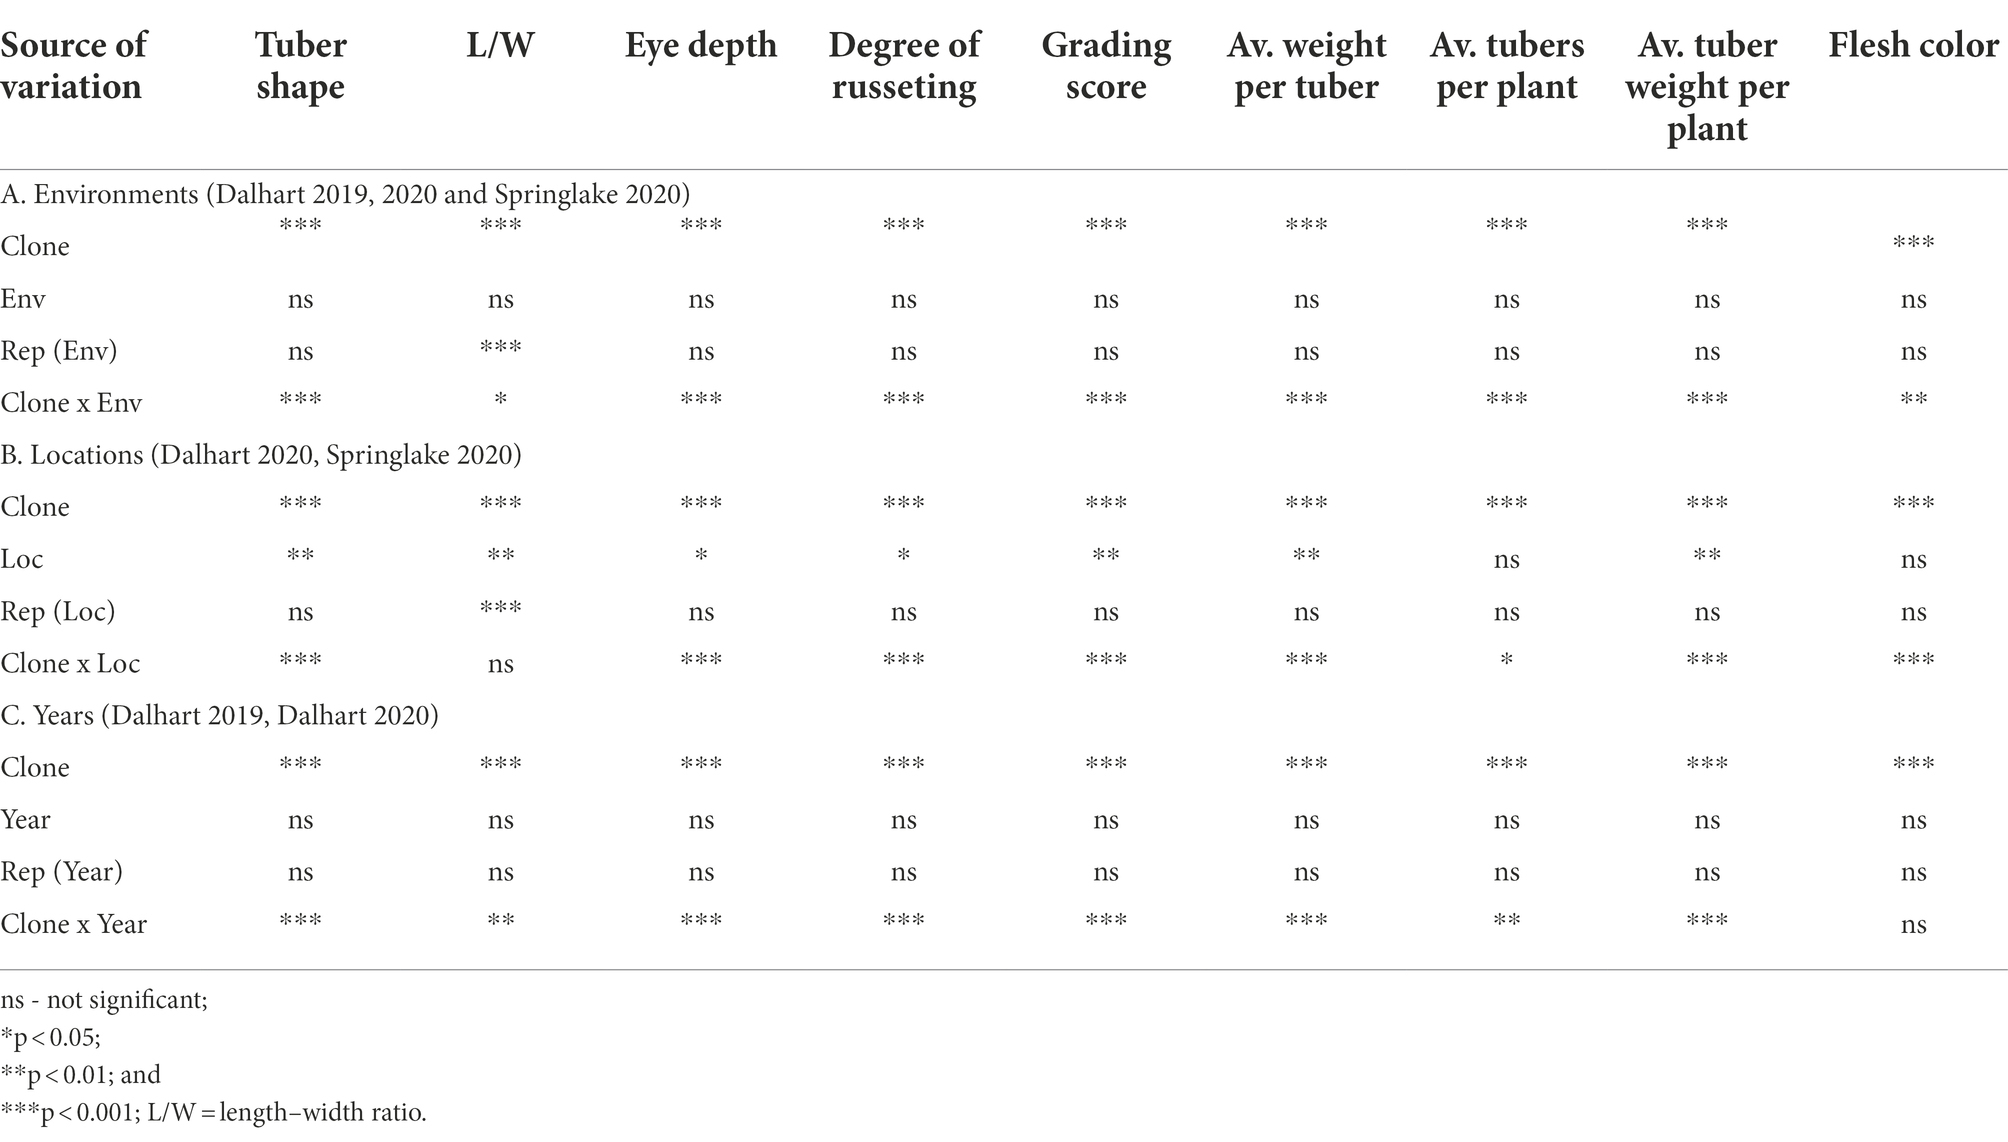
Table 3. Analysis of variance assessing the effect of (A) environments (Env), (B) locations (Loc), and (C) years on the tuber morphology traits in 214 tetraploid advanced potato clones evaluated in Texas.
Pearson correlations (r) for the combined environments were positive between visual tuber shape and L/W ratio (r = 0.89; p < 0.001), visual tuber shape and russeting (r = 0.78; p < 0.001; russet potatoes tended to be oblong to long), L/W and russeting (r = 0.70; p < 0.001; similar interpretation but using L/W objective values), visual tuber shape and average weight per tuber (r = 0.68; p < 0.001), visual tuber shape and grading score (r = 0.27; p < 0.001; Figure 2). Negative correlation were found between tuber shape and average tubers per plant (r = −0.69; p < 0.001; plants with more tubers tended to be rounder), L/W and average tubers per plant (r = −0.59; p < 0.001), tuber shape and flesh color (r = −0.44; p < 0.001), L/W and flesh color (r = −0.40; p < 0.001), average tuber per plant and average weight per tuber (−0.71), average weight per tuber and flesh color (−0.49), grading score and flesh color (−0.26).
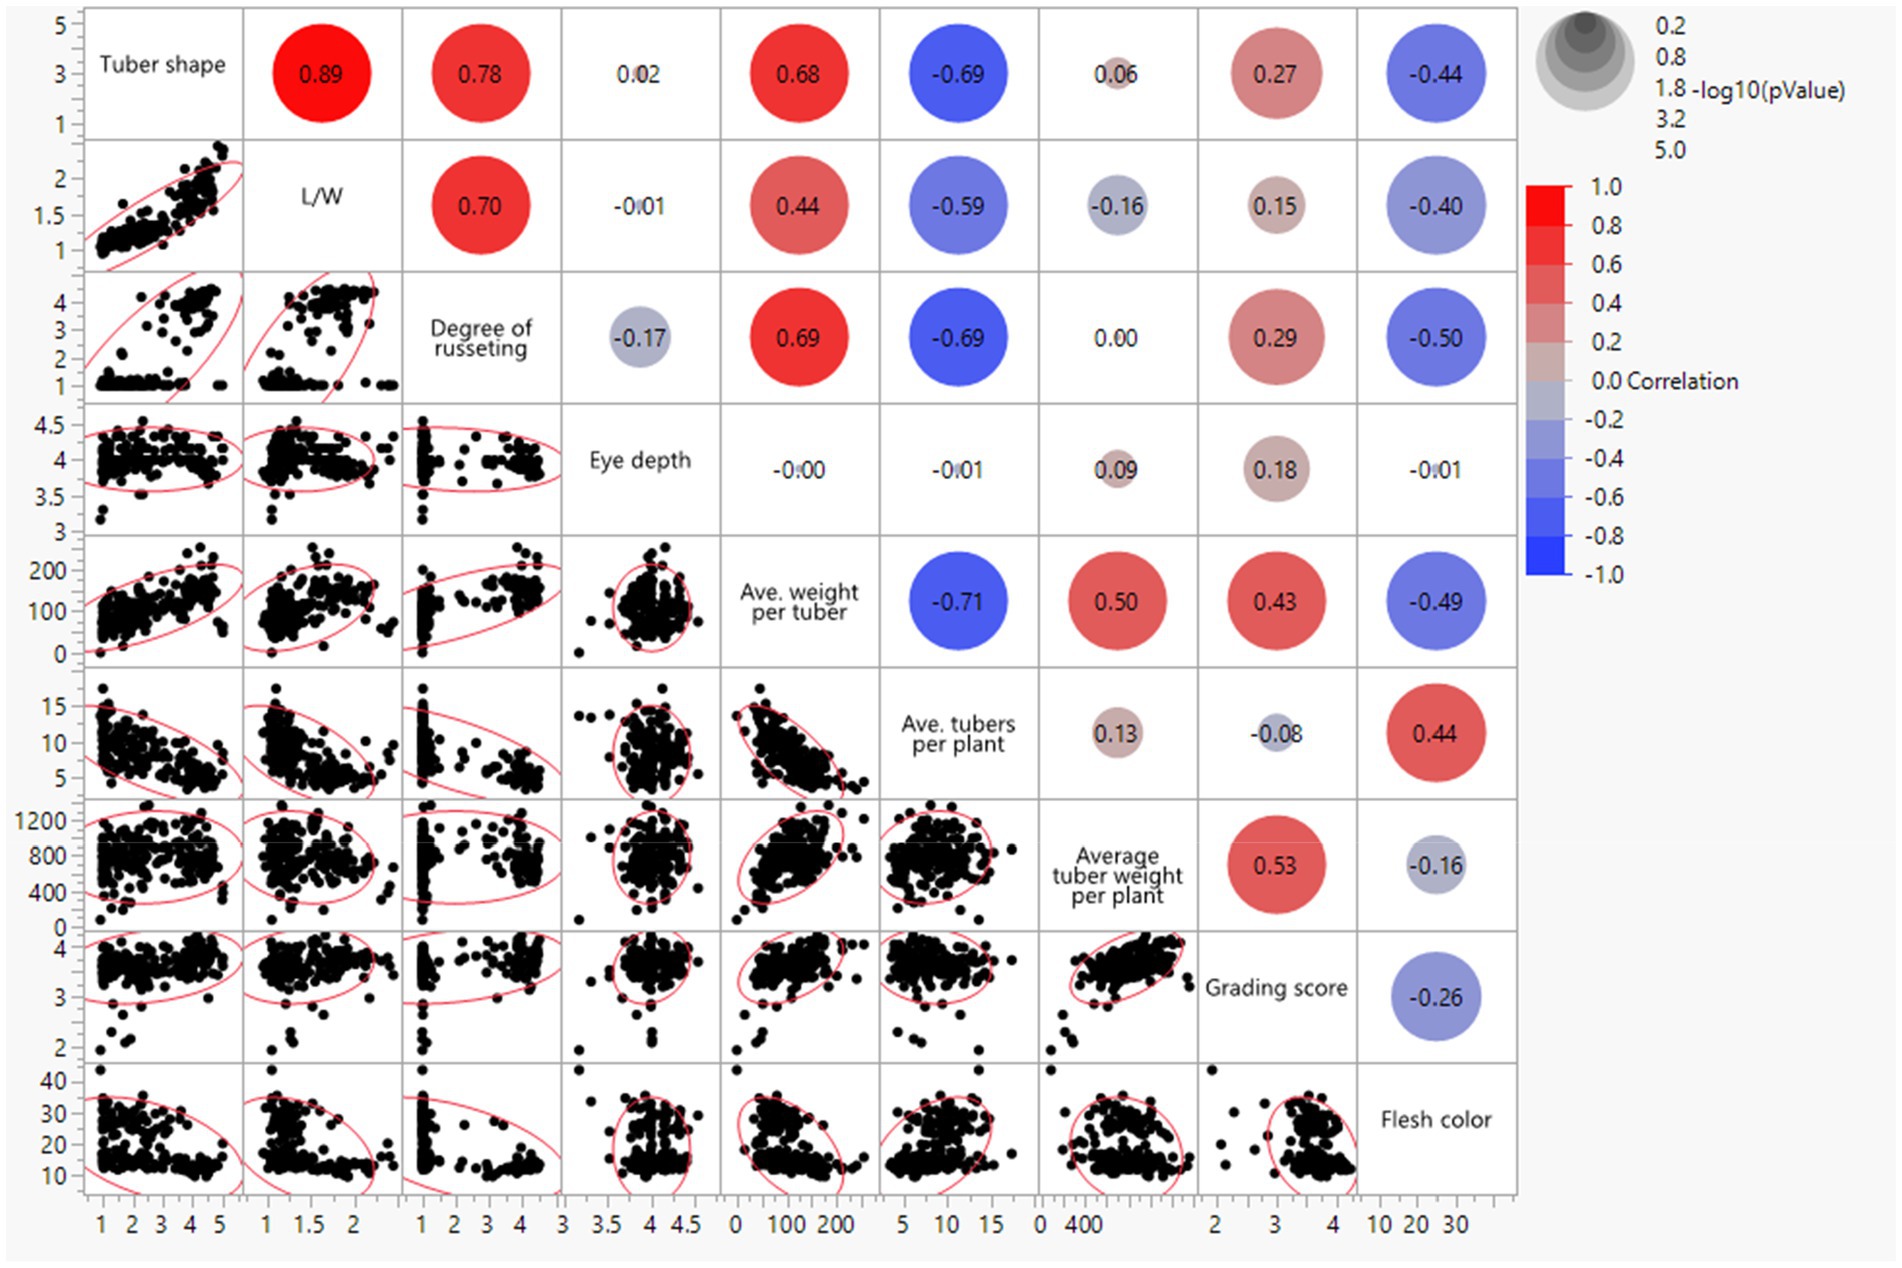
Figure 2. Bivariate scatter plots with a fitted line (bottom of the diagonal) and the value of the correlation (top of the diagonal) for tuber traits of 214 potato clones evaluated in three environments in Texas: Dalhart 2019, 2020, and Springlake 2020.
Linkage disequilibrium and GWAS analysis
The calculated genome-wide LD was low (Figure 3). From the shape of the curve, a 5–10 Mb window seemed appropriate to filter the most significant markers in the output. The inflation of the -log10(p) was examined using a quantile-quantile plot (Q–Q plots) of the observed vs. expected values under the null hypothesis. Significant QTLs were detected for tuber shape (Figure 4), L/W (Figure 5), eye depth (Figure 6), degree of russeting (Figure 7), grading score (Figure 8), the intensity of flesh color (Figure 9) and purple skin color (Figure 10). The marker-trait associations identified in this study were then compared to QTLs reported in previous QTL mapping/GWAS publications (Supplementary Table S1). A QTL on chromosome 10 was identified for tuber shape (based on 1–5 scale) in the additive and the dominant models (1-dom-alt and 1-dom-ref). The SNP at the peak of the QTL was solcap_snp_c2_25485 at a position of 48.7 Mb, explaining 5.8 and 4.0% of the tuber shape variation in the dominant model (1-dom-alt) and additive model, respectively. The SNP solcap_snp_c2_25522 at a position of 48.6 Mb explained 4.3% of the tuber shape variation in the dominant model (1-dom-ref). The SNPs at the peak of the QTLs for tuber shape were near to the genome super scaffold PGSC0003DMB000000385 which annotates as a ribosomal protein S6 kinase. QTLs for L/W coincided with those detected for tuber shape (on chromosome 10), but additional QTLs were identified on chromosomes 1, 5, and 9, explaining between 3.2 to 6.1% of the phenotypic variance. QTLs for eye depth were found on chromosomes 3, 5, and 10. QTLs for a degree of skin russeting were found on all chromosomes, except 3, 6, and 8, and the phenotypic variance explained ranged between 3.2 to 10.5%. A QTL for grading score was identified on chromosome 4 and explained 4.2 and 4.4% of the variation in the additive and dominant model (1-dom-ref), respectively. QTLs for the intensity of flesh color were detected on chromosomes 1 and 3. The SNP PotVar0120627 at a position of 48.6 Mb at the peak of the QTL explained 26.2% of the flesh color variation in the dominant model (1-dom-alt). This SNP marker is near the super scaffold PGSC0003DMG400010169 where the beta-carotene hydroxylase gene (Bch or Chy2) is located (yellow locus - Y). QTLs for purple skin color were detected on chromosomes 1, 2, 3, 4, and 11; and phenotypic variance explained ranged between 9.1 to 25.1%.
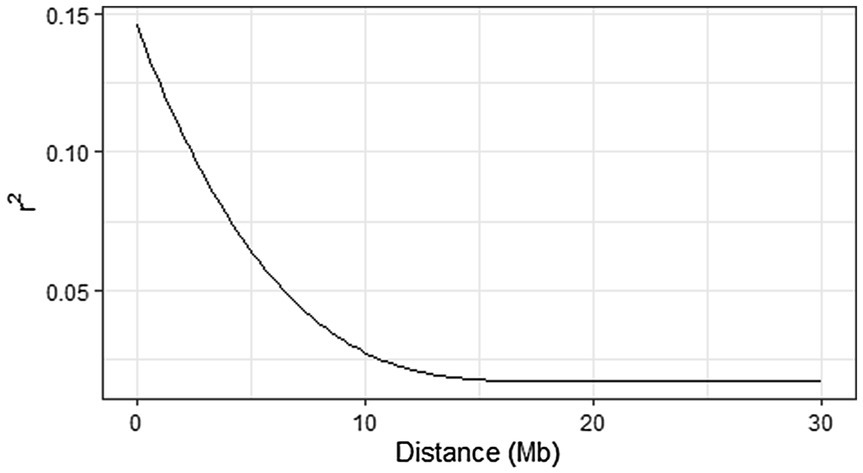
Figure 3. Genome-wide linkage disequilibrium (LD) decay (in Mb) in 214 potato clones using LD. plot function in GWASpoly. A monotone decreasing, convex spline was fit using the R package scam.
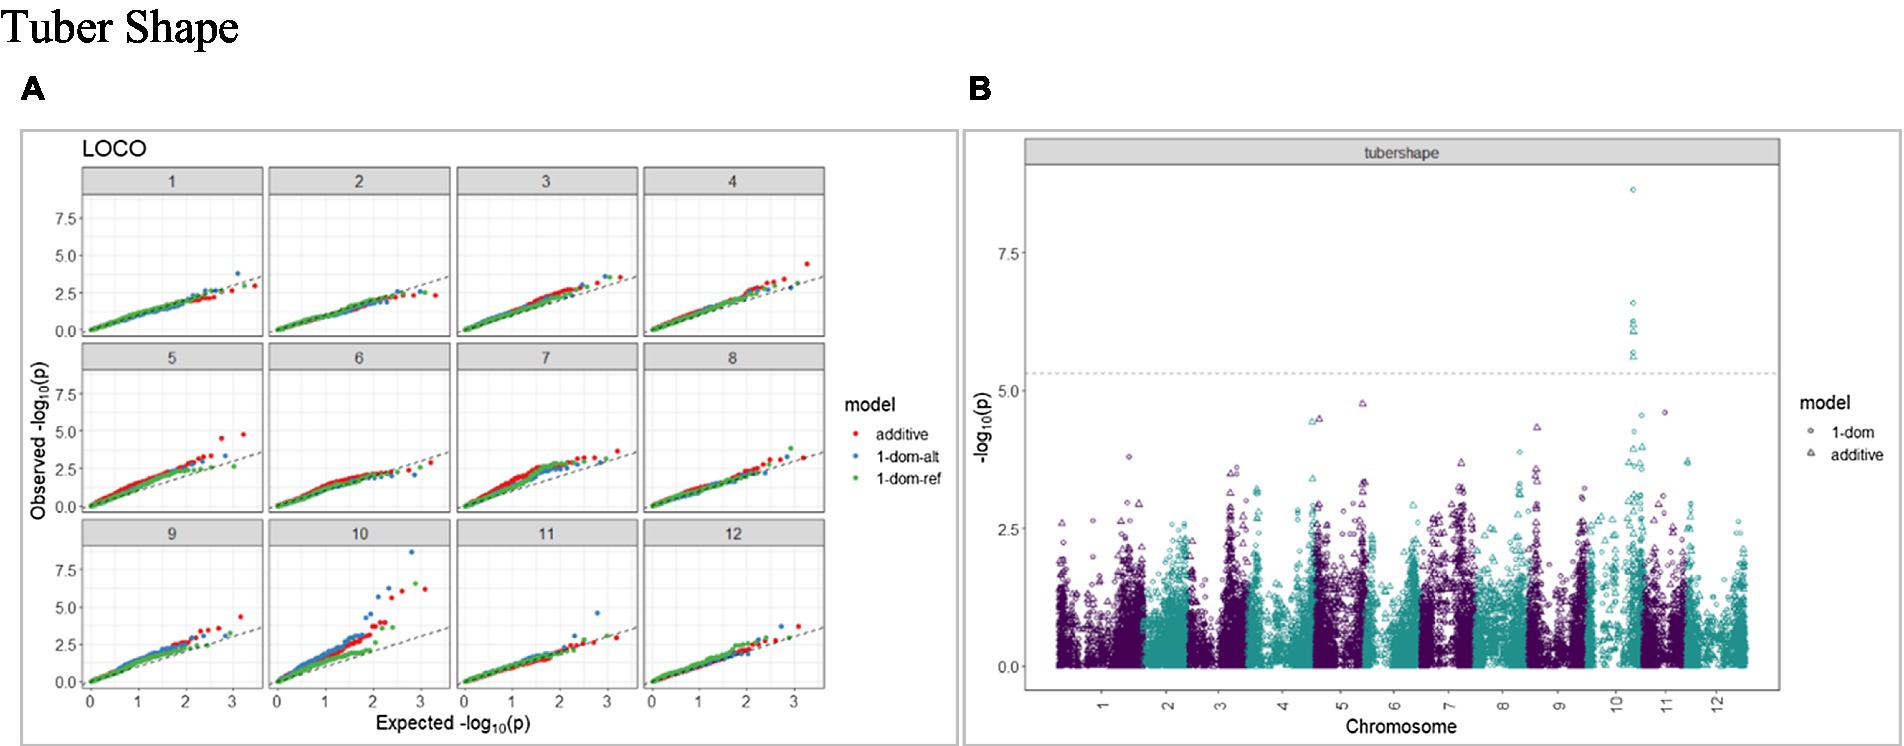
Figure 4. Q–Q plots of observed vs. expected −log10 (p values) (A) and corresponding Manhattan plot (B) for tuber shape using additive and dominant models. GWAS was based on 214 potato clones evaluated for tuber traits of 214 potato clones evaluated in three environments in Texas: Dalhart 2019, 2020, and Springlake 2020. The Bonferroni threshold was at 5.3 for the additive, 5.0 for 1-dom-alt, and 5.1 for the 1-dom-ref model.
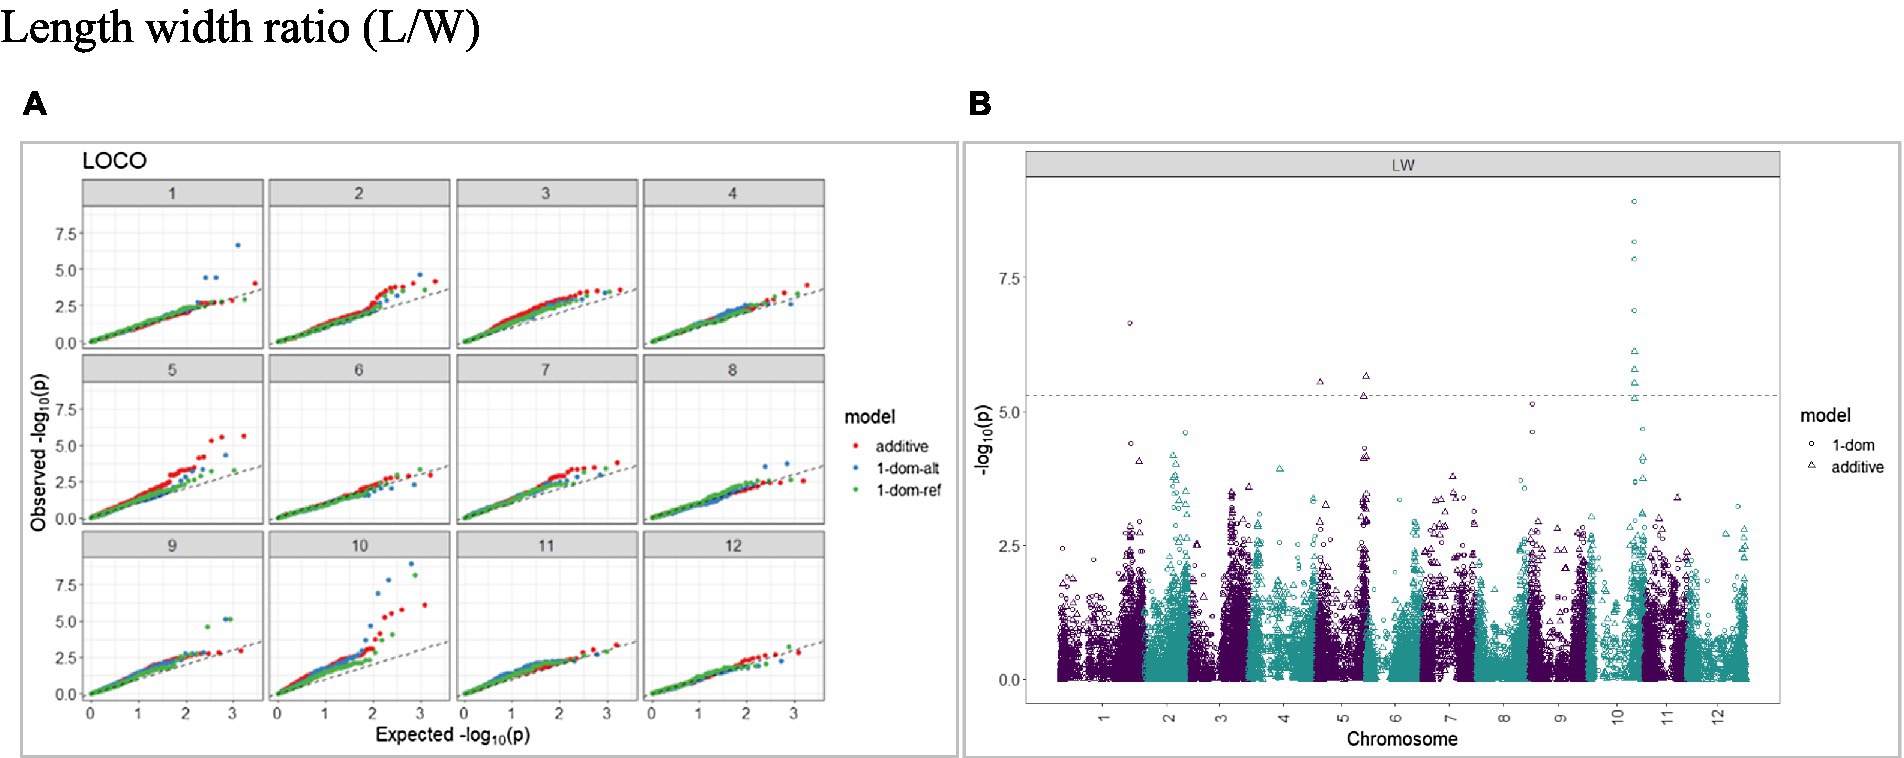
Figure 5. Q–Q plots of observed vs. expected -log10 (p values) (A) and corresponding Manhattan plot (B) for length–width ratio (L/W) using the additive and dominant model for tuber traits of 214 potato clones evaluated in three environments in Texas: Dalhart 2019, 2020 and Springlake 2020. The Bonferroni threshold is at 5.3 for the additive, 5.0 for 1-dom-alt, and 5.1 for the 1-dom-ref model.
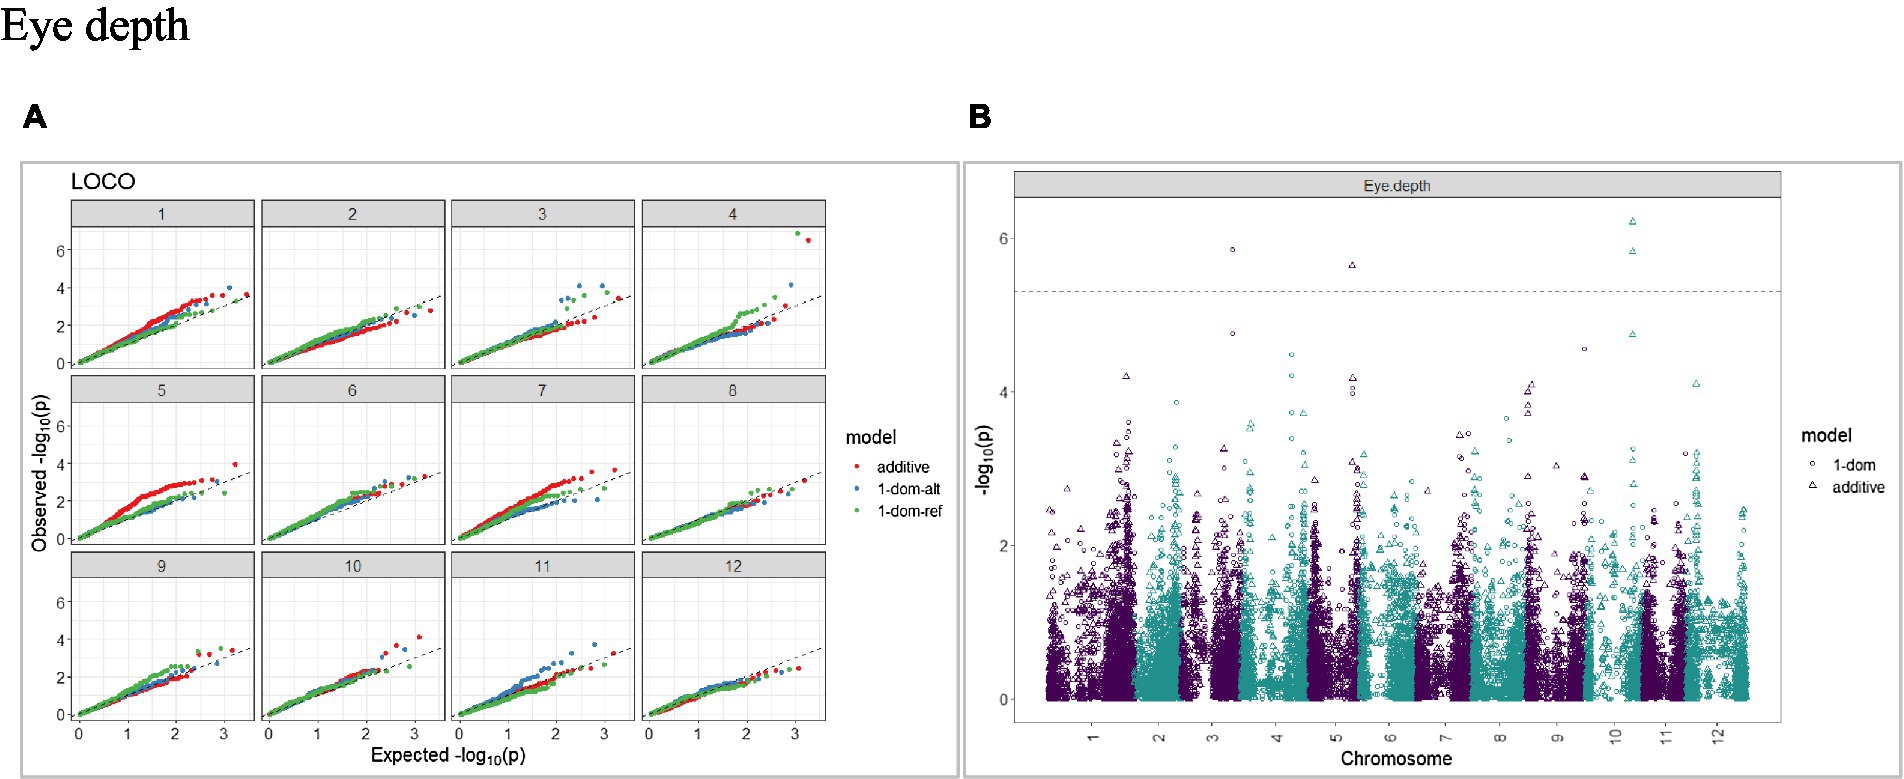
Figure 6. Q–Q plots of observed vs. expected -log10 (p values) (A) and corresponding Manhattan plot (B) for tuber eye depth using the additive and dominant model for tuber traits of 214 potato clones evaluated in three environments in Texas: Dalhart 2019, 2020 and Springlake 2020. The Bonferroni threshold was at 5.3 for the additive, 5.0 for 1-dom-alt, and 5.1 for the 1-dom-ref model.
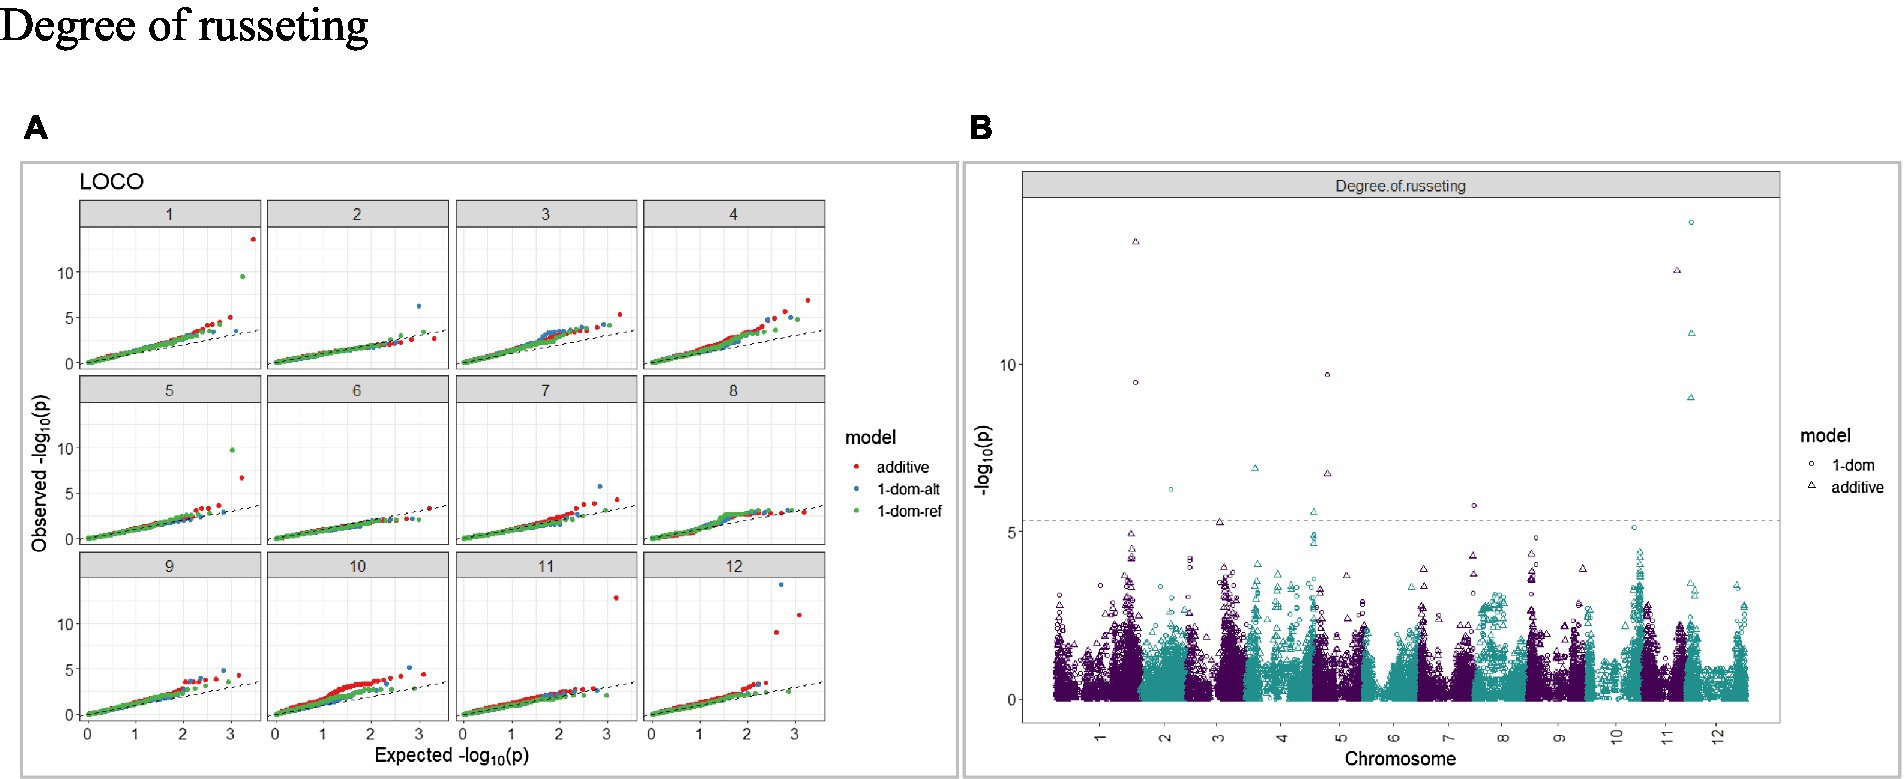
Figure 7. Q–Q plots of observed vs. expected -log10 (p values) (A) and corresponding Manhattan plot (B) for a degree of russeting using the additive and dominant model for tuber traits of 214 potato clones evaluated in three environments in Texas: Dalhart 2019, 2020 and Springlake 2020. The Bonferroni threshold was at 5.3 for the additive, 5.0 for 1-dom-alt, and 5.1 for the 1-dom-ref model.
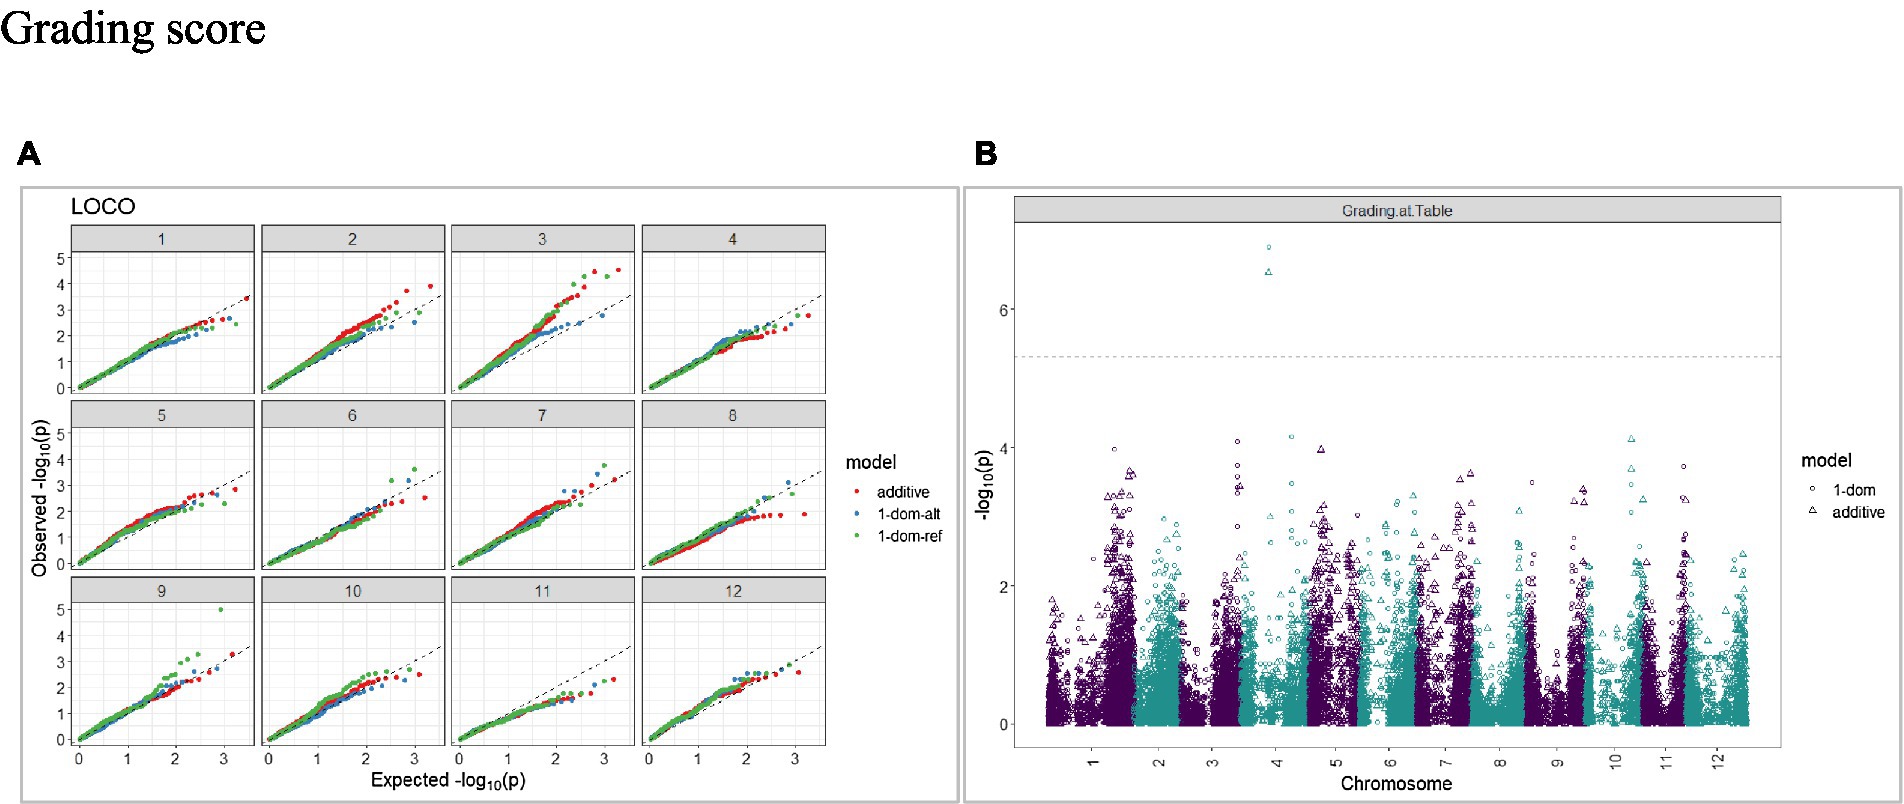
Figure 8. Q–Q plots of observed vs. expected -log10 (p values) (A) and corresponding Manhattan plot (B) for grading score using the additive and dominant model in three combined environments for tuber traits of 214 potato clones evaluated in three environments in Texas: Dalhart 2019, 2020 and Springlake 2020. The Bonferroni threshold was at 5.3 for the additive, 5.0 for 1-dom-alt, and 5.1 for the 1-dom-ref model.
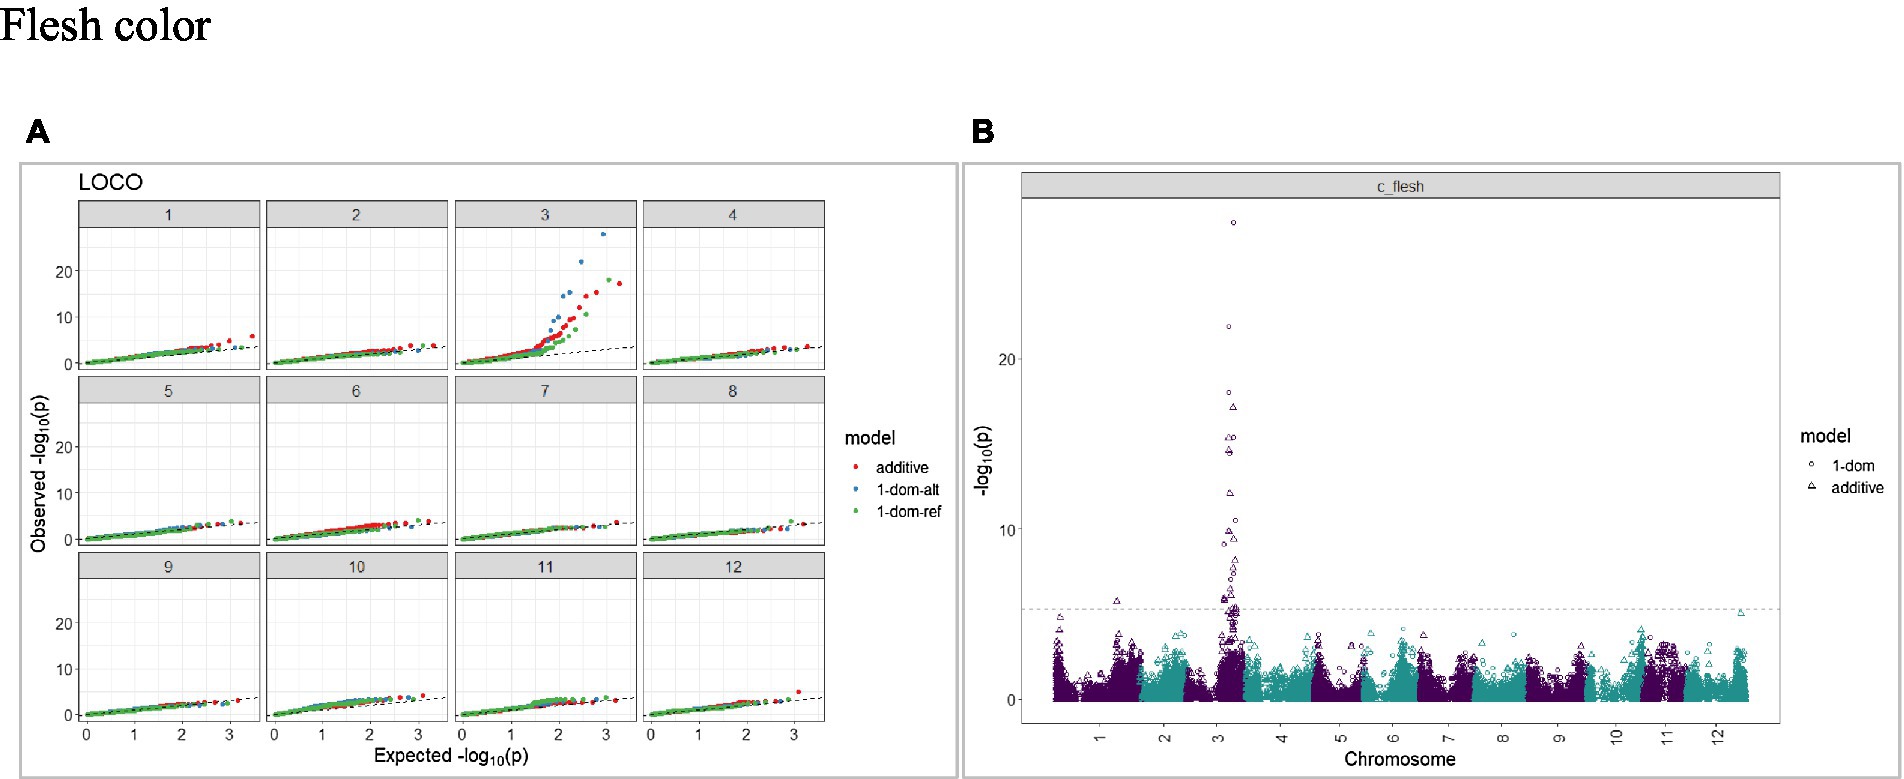
Figure 9. Q–Q plots of observed vs. expected -log10 (p values) (A) and corresponding Manhattan plot (B) for intensity (chroma value) of flesh color using the additive and dominant model for tuber traits of 214 potato clones evaluated in three environments in Texas: Dalhart 2019, 2020 and Springlake 2020. The Bonferroni threshold was at 5.3 for the additive, 5.0 for 1-dom-alt, and 5.1 for the 1-dom-ref model.
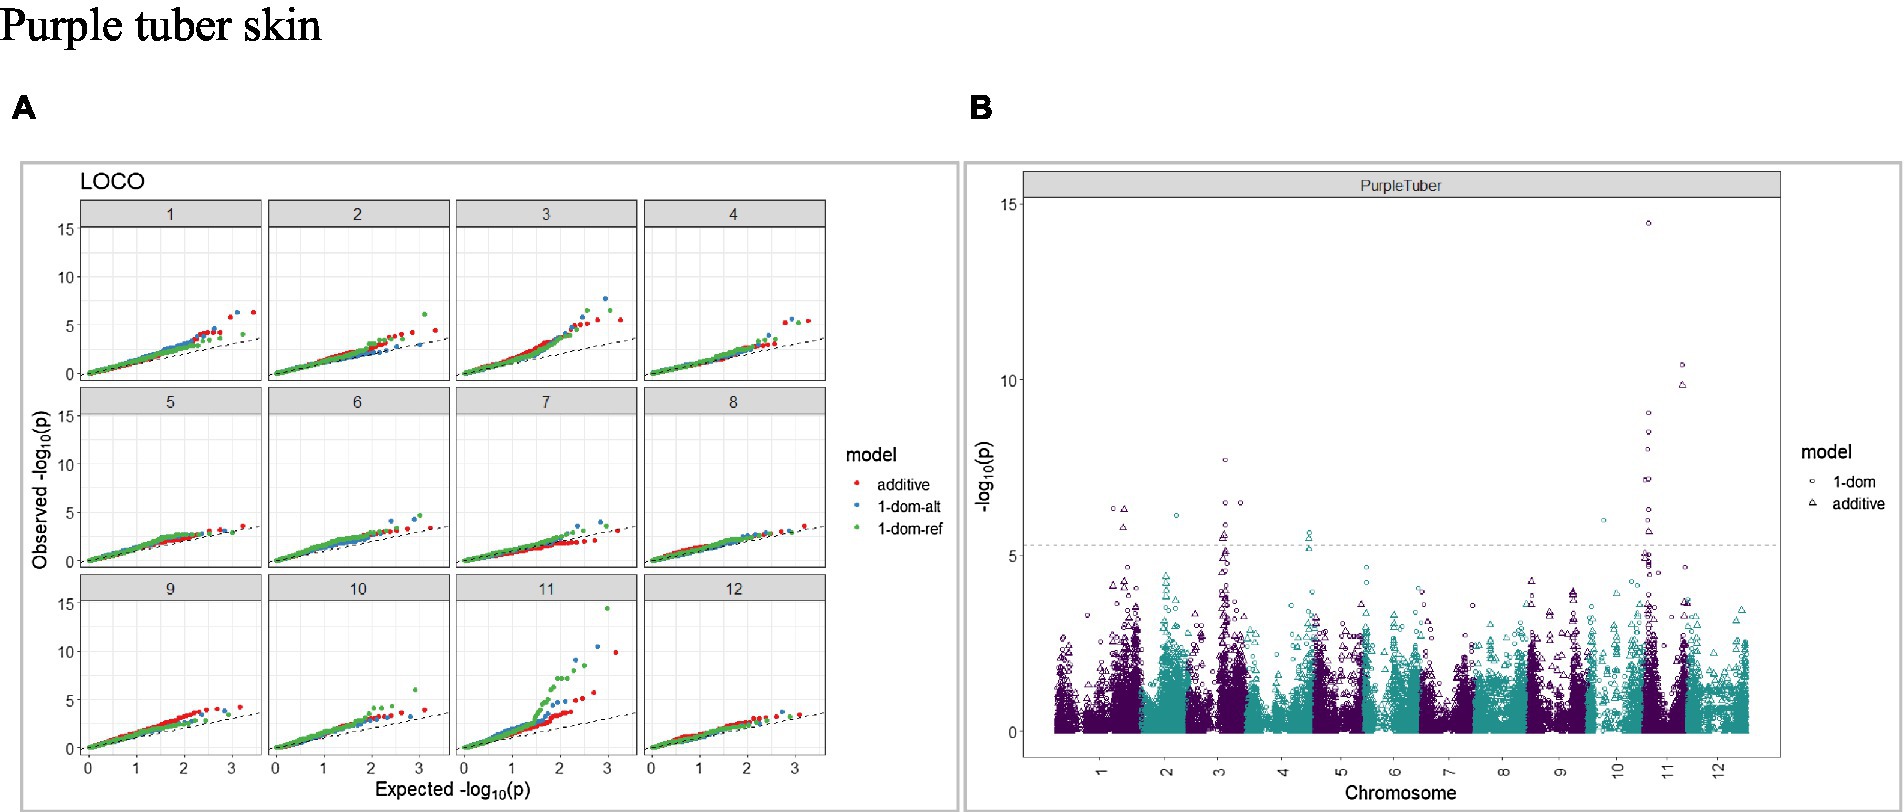
Figure 10. Q–Q plots of observed vs. expected -log10 (p values) (A) and corresponding Manhattan plot (B) for purple skin color using the additive and dominant model for tuber traits of 214 potato clones evaluated in three environments in Texas: Dalhart 2019, 2020 and Springlake 2020. The Bonferroni threshold was at 5.3 for the additive, 5.0 for 1-dom-alt, and 5.1 for the 1-dom-ref model.
Breeding values of tuber traits
In a breeding program, genomic estimated breeding values (GEBVs) can guide parental selection and the advancement of superior clones. Based on the GEBVs (Supplementary Table S2), clones PTTX05PG07-1 W, COTX08365F-3P/P, and ATX84378-6Ru had among the highest values for long tuber shape, whereas clones COTX10138-15Wpe/Y, NDTX5003-2R, and ATX91322-2Y/Y were among the clones with the lowest GEBVs for tuber shape (best for rounder tuber shape). Clone TX08385-2P/YP had the lowest GEBV for a degree of russeting (best for smooth skin) and clone AOTX95265-4Ru had the highest GEBV for a degree of russeting. Clone ATX91322-2Y/Y had the highest GEBV for eye depth (shallow eyes). ATX84706-2Ru, NDTX092238Cs-1P/W, and ATTX95490-2 W were among the clones with the highest GEBVs for average tuber weight, average tubers per plant, and average tuber weight per plant, respectively. Clone TX13590-9Ru had the highest GEBV for grading score. For practical applications, GEBVs should be considered in the context of market group and selection criteria. Using multi-trait standardized (Z scores) and weighted (depending on the importance of each trait for the market group) GEBVs should contribute to improving selection efficiency and save time and resources required for tuber multiplication and phenotyping.
Discussion
Breeding for tuber traits in potato can be done more efficiently if there is knowledge of the heritability and genetic basis of tuber morphological characteristics. Molecular markers together with phenotypic evaluations provide efficient and economical mean not only to detect marker-trait associations, but also to obtain GEBVs and to select (early in the breeding process) potato clones carrying desirable traits (as parents and/or generation advancement).
In this study, we identified QTLs associated with tuber shape, eye depth, degree of russeting, tuber number, tuber weight, skin color, and flesh color. There was significant variation for most evaluated traits. The phenotypic distribution was not normal for several tuber traits. A common approach to analyzing non-normally distributed traits is to transform the data (Feng et al., 2014). An alternative to data transformation, often in agricultural research, is to analyze the datasets using mixed models (Piepho et al., 2003).
Strong correlations existed between several of the tuber morphological traits evaluated. Prashar et al. (2014) used a 1–4 ‘breeder’s scale’ and a more ‘quantitative LW’ method to evaluate tuber shape and achieved a correlation coefficient of 0.91 between the two scoring methods. Our study found a correlation of 0.89 between ‘assessed’ (1–5) tuber shape and ‘measured’ (L/W) ratio. The same QTL (on chromosome 10) was identified for ‘assessed’ and ‘measured’ tuber shape traits through GWAS (Supplementary Table S1). The fact that high correlation was obtained between the two traits used to evaluate tuber shape and that the same QTL was identified implies that visual tuber shape evaluation based on a 1–5 scale - despite being less quantitative and more subjective- was appropriate to evaluate tuber shape fast and practically in the potato breeding program. The L/W ratio used in this study was more quantitative and objective (barcode ruler and automated data transfer to a computer), but it was limited to measuring five tubers per replication from one grading class (113.4–170.1 g grading group) and could not represent the whole plot (smaller tubers within a plot tend to be rounder than large tubers). More precise L/W ratios could be obtained if all tubers in the plot are evaluated and high-throughput analysis is done via digital image-based methods (Si et al., 2017; Przybylak et al., 2020). Depending on the interest, capacity, and goal of the breeding program, automated digital imaging and appropriate software should be considered to evaluate tuber shape based on L/W but also other traits like skin color, skin texture, eye depth, eye number, and skin damage. Most of the russet potatoes are oblong to long (Table 2), so the correlation coefficient of russeting was high with tuber shape and L/W. A negative correlation (r = −0.69) was observed between tuber shape and tubers per plant which means that if tubers were round, there were more tubers per plant, and if tubers were elongated, there were fewer tubers per plant. Understanding tuber characteristics will make visual and indirect selection (based on molecular markers alone) in potato breeding programs more efficient.
High broad-sense heritability was observed for tuber shape, L/W, degree of russeting, and flesh color traits. Love et al. (1997) found broad-sense heritability above 0.80 for russeting. Moderate broad-sense heritability was observed for eye depth and average tuber weight per plant. Likewise, narrow-sense heritability also referred to as “SNP-based heritability,” was the highest (h2 = 0.82) for russeting compared to that of other traits. The lower heritability estimates can be due to the underrepresentation of significant causal loci by markers (Speed et al., 2012) or dominance. Sood et al. (2020) showed that narrow-sense heritability was moderate for eye depth, average tuber weight, and average tubers per plant. In our study, we obtained similar results. High narrow-sense heritability means that most of the phenotypic variation is genetically controlled by additive effects, and that selection should be successful (Ozturk and Yildirim, 2014; Ozimati et al., 2019). Hence, selecting traits with high narrow-sense heritability would be extremely useful in a breeding program aimed at exploiting continuous genetic gain.
A panel of 214 tetraploid potato clones was genotyped with a high-density SNP marker array and phenotyped for tuber morphological traits at three environments in Texas. A GWAS approach optimized for polyploid species (GWASpoly) was implemented to find marker-trait associations. Some of the QTLs detected for tuber morphological traits in this study coincided with those identified in previous studies, whereas others were discovered for the first time. We report a significant QTL on chromosome 10 (SNP at peak: solcap_snp_c2_25485 at a position of 48.7 Mb) associated with tuber shape and explaining 5.8% of the phenotypic variance in the dominant model. Zia et al. (2020) also detected the same QTL (SNP at peak: solcap_snp_c2_25485) associated with tuber shape. Previous bi-parental mapping studies (Prashar et al., 2014; Hara-Skrzypiec et al., 2018) mapped a major QTL for tuber shape to the same location on chromosome 10. The Ro locus on chromosome 10 has been identified as the major locus controlling tuber shape (van Eck et al., 1994a). GWAS conducted by Sharma et al. (2018) reported a QTL (SNP at peak: solcap_snp_c1_8019) located at 48.9 Mb on chromosome 10. In addition to the QTLs identified for the tuber shape, we reported additional QTLs on chromosomes 1, 5, and 9 for L/W. Li et al. (2005) reported that the locus Ro was closely linked with a major locus for eye depth. In our study, we also found a QTL on chromosome 10 for eye depth that co-localized with tuber shape.
Early studies by Clark (1933) discovered that the action of complementary factors resulted in the russet skin texture in tubers, but the number of genes involved was not indicated. Few subsequent studies attempted to identify the number of QTLs/genes involved in the russeting of potato tuber skins. Multiple QTLs on chromosomes 1, 2, 4, 5, 7, 10, 11, and 12 were identified for russeting in this study.
In our study, a QTL for flesh color (chroma value) was observed on chromosome 3 at 48.5 Mb (SNP at peak: PotVar0120627) and another QTL with peak at 43.9 Mb (PotVar0070260). The most significant QTL (SNPs at peak: PotVar0120627 and solcap_snp_c2_17552) explained 26 and 14% of the trait variance, respectively. In most tetraploid potato cultivars, the flesh color varies from white to dark yellow due to varying amounts of carotenoids which convey the yellow color. The dominant Y-locus is largely responsible for the yellow flesh color of potatoes, and it maps to chromosome 3 (Bonierbale et al., 1988; Thorup et al., 2000). Beta-carotene hydroxylase (Bch or Chy2) is the most likely candidate gene responsible for the yellow flesh color (yellow locus - Y) (Brown et al., 2006; Kloosterman et al., 2010). One isoform (PGSC0003DMG400009501) of the Bch gene is located at 44.1 Mb on chromosome 3 (Xu et al., 2011).
The presence of anthocyanins in a limited number of cultivars results in red or blue/purple flesh color (Bonar et al., 2018). The detection of genomic regions and desirable alleles linked to anthocyanin content could be used in potato breeding programs to increase bioactive compounds. In our study, QTLs for purple skin color were detected on various chromosomes, including chromosome 1, peak at 69.8 Mb (additive model) and chromosome 11 at 4.3 Mb and 39.4 Mb (additive model). Parra-Galindo et al. (2019) detected QTLs associated with cyanidin and delphinidin concentrations on chromosome 1 at 50.7 Mb and chromosome 11 at 40 Mb, respectively. Previous studies showed that the potato P locus is required to produce blue/purple anthocyanin pigments and it is located on chromosome 11 (van Eck et al., 1993; De Jong et al., 2004; Jung et al., 2005).
No QTLs were detected for yield-related traits like average weight per tuber, average tubers per plant, and average tuber weight per plant. To acquire appropriate statistical power, GWAS requires much larger population sizes (Hong and Park, 2012). This study was based on only 214 potato clones. In addition, yield-related traits have large phenotypic variation and are highly affected by the environments. Thus, GWAS did not uncover the causative loci. Korte and Farlow (2013) indicated that GWAS often has difficulties in detecting more subtle or multiple QTLs.
Plant breeding is a continuous process that involves the selection and recombination of superior lines. The most important traits in potato breeding are complex and controlled by several genes. Slater et al. (2014) demonstrated the advantage of GEBVs for effective selection for tuber traits in potato breeding. To utilize the GEBVs for selection purposes, the traits may be combined into an index of overall merit. It is feasible to distinguish superior and inferior genotypes by integrating multiple traits using a multiple-trait selection index (Bernardo, 2020). The best index to use depends on the market needs and the objectives of the breeding program. Generating Z-indexes (Mendes et al., 2009; standardized/normalized) has been used as an alternative to identify superior lines in common bean (Lima et al., 2015), upland rice (Ribeiro et al., 2016), and quince cultivars (Coutinho et al., 2019). The incorporation of genomic selection into applied breeding programs in potato appears to be very promising. However, the combination of traits in a multi-trait index and assigning relative weight to each trait still bring some subjectivity on the part of the breeders (relative importance of traits considering the market demands for each class, industry needs, environmental factors and disease/pest considerations) and would benefit from developing models that consider different scenarios and guide the selection process to maximize selection efficiencies and genetic gains.
Conclusion
The main purpose of the current study was to find QTLs associated with tuber shape, eye depth, degree of russeting, tuber number, tuber weight, skin color, and flesh color in potatoes. Besides the rediscovery of QTL for tuber morphology traits in potatoes, we identified new loci affecting the variation for the studied traits. The genomic estimated breeding values for clones could be used to develop a standardized and weighted selection index for multiple traits which can then be applied to each market group separately.
Data availability statement
The raw data supporting the conclusions of this article will be made available by the authors, without undue reservation.
Author contributions
JP: conceptualization, original draft, data collection and analysis, and review and editing. DS and JK: data collection and review and editing. MV: conceptualization, funding acquisition, project administration, supervision, data collection and analysis, and review and editing. All authors contributed to the article and approved the submitted version.
Funding
This research work was supported by funding from USDA-NIFA (grant no: 2019-34141-35449) and USDA-NIFA-SCRI (award no: 2020-51181-32156).
Conflict of interest
The authors declare that the research was conducted in the absence of any commercial or financial relationships that could be construed as a potential conflict of interest.
Publisher’s note
All claims expressed in this article are solely those of the authors and do not necessarily represent those of their affiliated organizations, or those of the publisher, the editors and the reviewers. Any product that may be evaluated in this article, or claim that may be made by its manufacturer, is not guaranteed or endorsed by the publisher.
Acknowledgments
We gratefully acknowledge potato breeding programs at USDA-ARS Centers (Aberdeen, Idaho; Beltsville, Maryland; and Prosser, Washington) as well as State Universities (Colorado State University, University of Wisconsin, University of Minnesota, and North Dakota State University) for contributing unselected potato families to the TAMU Potato Breeding Program. Furthermore, we thank Mike Jensen, Sanjeev Gautam, Angel Chappell, Nina Rau, Taylor Swoboda, and Mythreyi Jamadagni for technical assistance in the lab and field.
Supplementary material
The Supplementary Material for this article can be found online at: https://www.frontiersin.org/articles/10.3389/fpls.2022.952263/full#supplementary-material
Footnotes
1. ^Pandey, J., Scheuring, D. C., Koym, J. W., Endelman, J.B., and Vales, M. I. (2022). Genomic selection and genome-wide association studies in tetraploid chipping potatoes. Unpublished manuscript.
References
Alvarado, G., Rodríguez, F. M., Pacheco, A., Burgueño, J., Crossa, J., Vargas, M., et al. (2020). META-R: A software to analyze data from multi-environment plant breeding trials. The Crop J. 8, 745–756. doi: 10.1016/j.cj.2020.03.010
Bassi, F. M., Bentley, A. R., Charmet, G., Ortiz, R., and Crossa, J. (2016). Breeding schemes for the implementation of genomic selection in wheat (Triticum spp.). Plant Sci. 242, 23–36. doi: 10.1016/j.plantsci.2015.08.021
Bernardo, R. (2020). Reinventing quantitative genetics for plant breeding: something old, something new, something borrowed, something BLUE. Heredity 125, 375–385. doi: 10.1038/s41437-020-0312-1
Bernardo, R., and Yu, J. (2007). Prospects for genome-wide selection for quantitative traits in maize. Crop Sci. 47, 1082–1090. doi: 10.2135/cropsci2006.11.0690
Bonar, N., Liney, M., Zhang, R., Austin, C., Dessoly, J., Davidson, D., et al. (2018). Potato miR828 is associated with purple tuber skin and flesh color. Front. Plant Sci. 9:1742. doi: 10.3389/fpls.2018.01742
Bonierbale, M. W., Amoros, W. R., Salas, E., and De Jong, W. (2020). “Potato breeding,” in The Potato Crop: Its Agricultural, Nutritional and Social Contribution to Humankind. eds. H. Campos and O. Ortiz (Cham, Switzerland: Springer International Publishing. Springer), 163–217.
Bonierbale, M. W., Plaisted, R. L., and Tanksley, S. D. (1988). RFLP maps based on a common set of clones reveal modes of chromosomal evolution in potato and tomato. Genetics 120, 1095–1103. doi: 10.1093/genetics/120.4.1095
Bourke, P. M., van Geest, G., Voorrips, R. E., Jansen, J., Kranenburg, T., Shahin, A., et al. (2018b). PolymapR-linkage analysis and genetic map construction from F1 populations of outcrossing polyploids. Bioinformatics 34, 3496–3502. doi: 10.1093/bioinformatics/bty371
Bourke, P. M., Voorrips, R. E., Visser, R. G. F., and Maliepaard, C. (2018a). Tools for genetic studies in experimental populations of polyploids. Front. Plant Sci. 9:513. doi: 10.3389/fpls.2018.00513
Bradshaw, J. E. (ed.) (2021). “Introgression, base broadening and potato population improvements,” in Potato Breeding: Theory and Practice. (Springer, Cham, Switzerland: Springer International Publishing), 341–403.
Bradshaw, J. E., Hackett, C. A., Pande, B., Waugh, R., and Bryan, G. J. (2008). QTL mapping of yield, agronomic, and quality traits in tetraploid potato (Solanum tuberosum subsp. tuberosum). Theor. Appl. Genet. 116, 193–211. doi: 10.1007/s00122-007-0659-1
Brown, C. R., Kim, T. S., Ganga, Z., Haynes, K., De Jong, D., Jahn, M., et al. (2006). Segregation of total carotenoid in high-level potato germplasm and its relationship to beta-carotene hydroxylase polymorphism. Am. J. Potato Res. 83, 365–372. doi: 10.1007/BF02872013
Chen, N., Zhu, W., Xu, J., Duan, S., Bian, C., Hu, J., et al. (2018). Molecular marker development and primary physical map construction for the tuber shape Ro gene locus in diploid potato (Solanum tuberosum L.). Mol. Breed. 39:6. doi: 10.1007/s11032-018-0913-z
Cheng, F., Sun, R., Hou, X., Zheng, H., Zhang, F., Zhang, Y., et al. (2016). Subgenome parallel selection is associated with morphotype diversification and convergent crop domestication in Brassica rapa and Brassica oleracea. Nat. Genet. 48, 1218–1224. doi: 10.1038/ng.3634
Clark, C. F. (1933). Further studies of the origin of russeting in the potato. Am. Potato J. 10, 88–91. doi: 10.1007/BF02880771
Cortes, L. T., Zhang, Z., and Yu, J. (2021). Status and prospects of genome-wide association studies in plants. Plant Genome 14:e20077. doi: 10.1002/tpg2.20077
Coutinho, G., Pio, R., de Souza, F. B. M., da Hora Farias, D., Bruzi, A. T., and Guimarães, P. H. S. (2019). Multivariate analysis and selection indices to identify superior quince cultivars for cultivation in the tropics. HortScience 54, 1324–1329. doi: 10.21273/HORTSCI14004-19
Crossa, J., Pérez-Rodríguez, P., Cuevas, J., Montesinos-López, O., Jarquín, D., de los Campos, G., et al. (2017). Genomic selection in plant breeding: methods, models, and perspectives. Trends Plant Sci. 22, 961–975. doi: 10.1016/j.tplants.2017.08.011
Damesa, T. M., Möhring, J., Worku, M., and Piepho, H.-P. (2017). One step at a time: stage-wise analysis of a series of experiments. Agron. J. 109, 845–857. doi: 10.2134/agronj2016.07.0395
De Jong, H. (1981). Inheritance of russeting in cultivated diploid potatoes. Potato Res. 24, 309–313. doi: 10.1007/BF02360368
De Jong, H. (1987). Inheritance of pigmented tuber flesh in cultivated diploid potatoes. Am. Potato J. 64, 337–343. doi: 10.1007/BF02853595
De Jong, W. S., De Jong, D. M., De Jong, H., Kalazich, J., and Bodis, M. (2003). An allele of dihydroflavonol 4-reductase associated with the ability to produce red anthocyanin pigments in potato (Solanum tuberosum L.). Theor. Appl. Genet. 107, 1375–1383. doi: 10.1007/s00122-003-1395-9
De Jong, W. S., Eannetta, N. T., De Jong, D. M., and Bodis, M. (2004). Candidate gene analysis of anthocyanin pigmentation loci in the Solanaceae. Theor. Appl. Genet. 108, 423–432. doi: 10.1007/s00122-003-1455-1
Eichhorn, S., and Winterhalter, P. (2005). Anthocyanins from pigmented potato (Solanum tuberosum L.) varieties. Food Res. Int. 38, 943–948. doi: 10.1016/j.foodres.2005.03.011
Endelman, J. B., Carley, C. A. S., Bethke, P. C., Coombs, J. J., Clough, M. E., Jong, W. S. D., et al. (2018). Genetic variance partitioning and genome-wide prediction with allele dosage information in autotetraploid potato. Genetics 209, 77–87. doi: 10.1534/genetics.118.300685
Feng, C., Wang, H., Lu, N., Chen, T., He, H., Lu, Y., et al. (2014). Log-transformation and its implications for data analysis. Shanghai Arch. Psychiatry 26, 105–109. doi: 10.3969/j.issn.1002-0829.2014.02.009
Gegas, V. C., Nazari, A., Griffiths, S., Simmonds, J., Fish, L., Orford, S., et al. (2010). A genetic framework for grain size and shape variation in wheat. Plant Cell 22, 1046–1056. doi: 10.1105/tpc.110.074153
Grandke, F., Ranganathan, S., van Bers, N., de Haan, J. R., and Metzler, D. (2017). PERGOLA: fast and deterministic linkage mapping of polyploids. BMC Bioinform. 18:12. doi: 10.1186/s12859-016-1416-8
Habyarimana, E., Parisi, B., and Mandolino, G. (2017). Genomic prediction for yields, processing and nutritional quality traits in cultivated potato (Solanum tuberosum L.). Plant Breed. 136, 245–252. doi: 10.1111/pbr.12461
Hackett, C. A., Boskamp, B., Vogogias, A., Preedy, K. F., and Milne, I. (2017). TetraploidSNPMap: software for linkage analysis and QTL mapping in autotetraploid populations using SNP dosage data. J. Hered. 108, 438–442. doi: 10.1093/jhered/esx022
Hara-Skrzypiec, A., Śliwka, J., Jakuczun, H., and Zimnoch-Guzowska, E. (2018). QTL for tuber morphology traits in diploid potato. J. Appl. Genet. 59, 123–132. doi: 10.1007/s13353-018-0433-x
Hill, W. G., and Robertson, A. (1968). Linkage disequilibrium in finite populations. Theor. Appl. Genet. 38, 226–231. doi: 10.1007/BF01245622
Hong, E. P., and Park, J. W. (2012). Sample size and statistical power calculation in genetic association studies. Genom. Inform. 10, 117–122. doi: 10.5808/GI.2012.10.2.117
Jung, C. S., Griffiths, H. M., De Jong, D. M., Cheng, S., Bodis, M., and De Jong, W. S. (2005). The potato P locus codes for flavonoid 3′,5′-hydroxylase. Theor. Appl. Genet. 110, 269–275. doi: 10.1007/s00122-004-1829-z
Kaiser, N. R., Coombs, J. J., Felcher, K. J., Hammerschmidt, R., Zuehlke, M. L., Buell, C. R., et al. (2020). Genome-wide association analysis of common scab resistance and expression profiling of tubers in response to thaxtomin a treatment underscore the complexity of common scab resistance in tetraploid potato. Am. J. Potato Res. 97, 513–522. doi: 10.1007/s12230-020-09800-5
Klaassen, M. T., Willemsen, J. H., Vos, P. G., Visser, R. G. F., van Eck, H. J., Maliepaard, C., et al. (2019). Genome-wide association analysis in tetraploid potato reveals four QTLs for protein content. Mol. Breed. 39:151. doi: 10.1007/s11032-019-1070-8
Kloosterman, B., Oortwijn, M., Uitdewilligen, J., America, T., de Vos, R., Visser, R. G., et al. (2010). From QTL to candidate gene: Genetical genomics of simple and complex traits in potato using a pooling strategy. BMC Genomics 11:158. doi: 10.1186/1471-2164-11-158
Korte, A., and Farlow, A. (2013). The advantages and limitations of trait analysis with GWAS: A review. Plant Methods 9:29. doi: 10.1186/1746-4811-9-29
Li, X.-Q., De Jong, H., De Jong, D. M., and De Jong, W. S. (2005). Inheritance and genetic mapping of tuber eye depth in cultivated diploid potatoes. Theor. Appl. Genet. 110, 1068–1073. doi: 10.1007/s00122-005-1927-6
Lima, D. C., Abreu, Â. D. F. B., Ferreira, R. A. D. C., and Ramalho, M. A. P. (2015). Breeding common bean populations for traits using selection index. Sci. Agric. 72, 132–137. doi: 10.1590/0103-9016-2014-0130
Lorenz, A. J., Smith, K. P., and Jannink, J.-L. (2012). Potential and optimization of genomic selection for fusarium head blight resistance in six-row barley. Crop Sci. 52, 1609–1621. doi: 10.2135/cropsci2011.09.0503
Love, S. L., Werner, B. K., and Pavek, J. J. (1997). Selection for individual traits in the early generations of a potato breeding program dedicated to producing cultivars with tubers having long shape and russet skin. Am. Potato J. 74, 199–213. doi: 10.1007/BF02851598
Mendes, F. F., Ramalho, M. A. P., and Abreu, Â. D. F. B. (2009). Selection index for choosing segregating populations of common bean. Pesq. Agrop. Brasileira 44, 1312–1318. doi: 10.1590/S0100-204X2009001000015
Meuwissen, T. H. E., Hayes, B. J., and Goddard, M. E. (2001). Prediction of total genetic value using genome-wide dense marker maps. Genetics 157, 1819–1829. doi: 10.1093/genetics/157.4.1819
Meuwissen, T., Hayes, B., and Goddard, M. (2016). Genomic selection: A paradigm shift in animal breeding. Anim. Front. 6, 6–14. doi: 10.2527/af.2016-0002
Mollinari, M., and Garcia, A. A. F. (2019). Linkage analysis and haplotype phasing in experimental autopolyploid populations with high ploidy level using hidden Markov models. G3: genes. Genom. Gene. 9, 3297–3314. doi: 10.1534/g3.119.400378
Monforte, A. J., Diaz, A., Caño-Delgado, A., and van der Knaap, E. (2014). The genetic basis of fruit morphology in horticultural crops: lessons from tomato and melon. J. Exp. Bot. 65, 4625–4637. doi: 10.1093/jxb/eru017
Ortiz, R. (2020). Genomic-led potato breeding for increasing genetic gains: achievements and outlook. Crop Breed. Gene. Genom. 2:10. doi: 10.20900/cbgg20200010
Ozimati, A., Kawuki, R., Esuma, W., Kayondo, S. I., Pariyo, A., Wolfe, M., et al. (2019). Genetic variation and trait correlations in an east African cassava breeding population for genomic selection. Crop Sci. 59, 460–473. doi: 10.2135/cropsci2018.01.0060
Ozturk, G., and Yildirim, Z. (2014). Heritability estimates of some quantitative traits in potatoes. Turkish J. Field Crops 19:262. doi: 10.17557/tjfc.66538
Pandey, J., Scheuring, D. C., Koym, J. W., Coombs, J., Novy, R. G., Thompson, A. L., et al. (2021). Genetic diversity and population structure of advanced clones selected over forty years by a potato breeding program in the USA. Sci. Rep. 11:8344. doi: 10.1038/s41598-021-87284-x
Parra-Galindo, M.-A., Piñeros-Niño, C., Soto-Sedano, J. C., and Mosquera-Vasquez, T. (2019). Chromosomes I and X harbor consistent genetic factors associated with the anthocyanin variation in potato. Agronomy 9:366. doi: 10.3390/agronomy9070366
Piepho, H. P., Büchse, A., and Emrich, K. (2003). A Hitchhiker’s guide to mixed models for randomized experiments. J. Agron. Crop Sci. 189, 310–322. doi: 10.1046/j.1439-037X.2003.00049.x
Poland, J., Endelman, J., Dawson, J., Rutkoski, J., Wu, S., Manes, Y., et al. (2012). Genomic selection in wheat breeding using genotyping-by-sequencing. Plant Genome 5:6. doi: 10.3835/plantgenome2012.06.0006
Prashar, A., Hornyik, C., Young, V., McLean, K., Sharma, S. K., Dale, M. F. B., et al. (2014). Construction of a dense SNP map of a highly heterozygous diploid potato population and QTL analysis of tuber shape and eye depth. Theor. Appl. Genet. 127, 2159–2171. doi: 10.1007/s00122-014-2369-9
Przybylak, A., Kozłowski, R., Osuch, E., Osuch, A., Rybacki, P., and Przygodziński, P. (2020). Quality evaluation of potato tubers using neural image analysis method. Agriculture 10:112. doi: 10.3390/agriculture10040112
Ribeiro, D. C., de Lima, I. P., Mendes, M. P., and Oliveira, H. (2016). Selection for multiple traits in upland rice progenies using the Z index. Int. J. Curr. Res. 8, 25924–25928.
Rosyara, U. R., De Jong, W. S., Douches, D. S., and Endelman, J. B. (2016). Software for genome-wide association studies in autopolyploids and its application to potato. The plant. Genome 9:73. doi: 10.3835/plantgenome2015.08.0073
Searle, S. R., Casella, G., and McCulloch, C. E. (1992). Variance Components. Hoboken, NJ: John Wiley & Sons.
Selga, C., Reslow, F., Pérez-Rodríguez, P., and Ortiz, R. (2021). The power of genomic estimated breeding values for selection when using a finite population size in genetic improvement of tetraploid potato. G3: genes, genomes. Genetics 12:jkab362. doi: 10.1093/g3journal/jkab362
Sharma, S. K., MacKenzie, K., McLean, K., Dale, F., Daniels, S., and Bryan, G. J. (2018). Linkage disequilibrium and evaluation of genome-wide association mapping models in tetraploid potato. G3: genes, genomes. Genetics 8, 3185–3202. doi: 10.1534/g3.118.200377
Si, Y., Sankaran, S., Knowles, N. R., and Pavek, M. J. (2017). Potato tuber length-width ratio assessment using image analysis. Am. J. Potato Res. 94, 88–93. doi: 10.1007/s12230-016-9545-1
Slater, A. T., Wilson, G. M., Cogan, N. O. I., Forster, J. W., and Hayes, B. J. (2014). Improving the analysis of low heritability complex traits for enhanced genetic gain in potato. Theor. Appl. Genet. 127, 809–820. doi: 10.1007/s00122-013-2258-7
ŚLiwka, J., Wasilewicz-Flis, I., Jakuczun, H., and Gebhardt, C. (2008). Tagging quantitative trait loci for dormancy, tuber shape, regularity of tuber shape, eye depth and flesh color in diploid potato originated from six Solanum species. Plant Breed. 127, 49–55. doi: 10.1111/j.1439-0523.2008.01420.x
Sood, S., Lin, Z., Caruana, B., Slater, A. T., and Daetwyler, H. D. (2020). Making the most of all data: combining non-genotyped and genotyped potato individuals with HBLUP. Plant Genome 13:e20056. doi: 10.1002/tpg2.20056
Speed, D., Hemani, G., Johnson, M. R., and Balding, D. J. (2012). Improved heritability estimation from genome-wide SNPs. Am. J. Hum. Genet. 91, 1011–1021. doi: 10.1016/j.ajhg.2012.10.010
Spooner, D. M., Ghislain, M., Simon, R., Jansky, S. H., and Gavrilenko, T. (2014). Systematics, diversity, genetics, and evolution of wild and cultivated potatoes. Bot. Rev. 80, 283–383. doi: 10.1007/s12229-014-9146-y
Spooner, D. M., McLean, K., Ramsay, G., Waugh, R., and Bryan, G. J. (2005). A single domestication for potato based on multilocus amplified fragment length polymorphism genotyping. Proc. Natl. Acad. Sci. 102, 14694–14699. doi: 10.1073/pnas.0507400102
Stark, J. C., Love, S. L., and Knowles, N. R. (2020). “Tuber quality,” in Potato Production Systems. eds. J. C. Stark, M. Thornton, and P. Nolte (United States: Springer International Publishing), 479–497.
Sun, L., Chen, J., Xiao, K., and Yang, W. (2017). Origin of the domesticated horticultural species and molecular bases of fruit shape and size changes during the domestication, taking tomato as an example. Hort. Plant J. 3, 125–132. doi: 10.1016/j.hpj.2017.07.007
Sun, G., Zhu, C., Kramer, M. H., Yang, S.-S., Song, W., Piepho, H.-P., et al. (2010). Variation is explained in mixed-model association mapping. Heredity 105, 333–340. doi: 10.1038/hdy.2010.11
Sverrisdóttir, E., Byrne, S., Sundmark, E. H. R., Johnsen, H. Ø., Kirk, H. G., Asp, T., et al. (2017). Genomic prediction of starch content and chipping quality in tetraploid potato using genotyping-by-sequencing. Theor. Appl. Genet. 130, 2091–2108. doi: 10.1007/s00122-017-2944-y
Thiele, G., Dufour, D., Vernier, P., Mwanga, R. O. M., Parker, M. L., Geldermann, E. S., et al. (2021). A review of varietal change in roots, tubers and bananas: consumer preferences and other drivers of adoption and implications for breeding. Int. J. Food Sci. Technol. 56, 1076–1092. doi: 10.1111/ijfs.14684
Thorup, T. A., Tanyolac, B., Livingstone, K. D., Popovsky, S., Paran, I., and Jahn, M. (2000). Candidate gene analysis of organ pigmentation loci in the Solanaceae. Proc. Natl. Acad. Sci. U. S. A. 97, 11192–11197. doi: 10.1073/pnas.97.21.11192
van Eck, H. J., Jacobs, J. E., Ton, J., Stiekemat, W. J., and Jacobsen, E. (1994a). Multiple alleles for tuber shape in diploid potato detected by qualitative and quantitative genetic analysis using RFLPs. Genetics 137, 303–309. doi: 10.1093/genetics/137.1.303
van Eck, H. J., Jacobs, J. M. E., van den Berg, P. M. M. M., Stiekema, W. J., and Jacobsen, E. (1994b). The inheritance of anthocyanin pigmentation in potato (Solanum tuberosum L.) and mapping of tuber skin colour loci using RFLPs. Heredity 73, 410–421. doi: 10.1038/hdy.1994.189
van Eck, H. J., Jacobs, J. M. E., van Dijk, J., Stiekema, W. J., and Jacobsen, E. (1993). Identification and mapping of three flower colour loci of potato (S. tuberosum L.) by RFLP analysis. Theor. Appl. Genet. 86-86, 295–300. doi: 10.1007/BF00222091
VanRaden, P. M. (2008). Efficient methods to compute genomic predictions. J. Dairy Sci. 91, 4414–4423. doi: 10.3168/jds.2007-0980
Vos, P. G., Uitdewilligen, J. G., Voorrips, R. E., Visser, R. G., and van Eck, H. J. (2015). Development and analysis of a 20K SNP array for potato (Solanum tuberosum): An insight into the breeding history. Theor. Appl. Genet. 128, 2387–2401. doi: 10.1007/s00122-015-2593-y
Wilson, S., Zheng, C., Maliepaard, C., Mulder, H. A., Visser, R. G. F., van der Burgt, A., et al. (2021). Understanding the effectiveness of genomic prediction in tetraploid potato. Front. Plant Sci. 12:672417. doi: 10.3389/fpls.2021.672417
Xu, X., Pan, S., Cheng, S., Zhang, B., Mu, D., Ni, P., et al. (2011). Genome sequence and analysis of the tuber crop potato. Nature 475, 189–195. doi: 10.1038/nature10158
Yang, J., Zaitlen, N. A., Goddard, M. E., Visscher, P. M., and Price, A. L. (2014). Advantages and pitfalls in the application of mixed-model association methods. Nat. Genet. 46, 100–106. doi: 10.1038/ng.2876
Yousaf, M. F., Demirel, U., Naeem, M., and Çalışkan, M. E. (2021). Association mapping reveals novel genomic regions controlling some root and stolon traits in tetraploid potato (Solanum tuberosum L.). 3. Biotech 11:174. doi: 10.1007/s13205-021-02727-6
Zhang, Y., Cheng, S., De Jong, D., Griffiths, H., Halitschke, R., and De Jong, W. (2009). The potato R locus codes for dihydroflavonol 4-reductase. Theor. Appl. Genet. 119, 931–937. doi: 10.1007/s00122-009-1100-8
Zhu, C., Gore, M., Buckler, E. S., and Yu, J. (2008). Status and prospects of association mapping in plants. Plant Genome 1, 5–20. doi: 10.3835/plantgenome2008.02.0089
Keywords: tuber morphology, genome-wide association studies, single-nucleotide polymorphism, Solanum tuberosum ssp. tuberosum L., genomic prediction
Citation: Pandey J, Scheuring DC, Koym JW and Vales MI (2022) Genomic regions associated with tuber traits in tetraploid potatoes and identification of superior clones for breeding purposes. Front. Plant Sci. 13:952263. doi: 10.3389/fpls.2022.952263
Edited by:
Jeanne M. E. Jacobs, AgResearch Ltd, New ZealandReviewed by:
David De Koeyer, Agriculture and Agri-Food Canada, CanadaMaria De La O Leyva Perez, Teagasc Food Research Centre, Ireland
Copyright © 2022 Pandey, Scheuring, Koym and Vales. This is an open-access article distributed under the terms of the Creative Commons Attribution License (CC BY). The use, distribution or reproduction in other forums is permitted, provided the original author(s) and the copyright owner(s) are credited and that the original publication in this journal is cited, in accordance with accepted academic practice. No use, distribution or reproduction is permitted which does not comply with these terms.
*Correspondence: M. Isabel Vales, aXNhYmVsLnZhbGVzQHRhbXUuZWR1; Jeewan Pandey, eW91cmplZXdhbkB0YW11LmVkdQ==