 Jianshuang Shen1
 Mingzhi Li
 Songheng Jin
- 1Jiyang College, Zhejiang A&F University, Zhuji, China
- 2Department of Life Science and Health, Huzhou College, Huzhou, Zhejiang, China
- 3Bio and Data Biotechnology Co., Ltd., Guangzhou, China
Rhododendron × pulchrum, an important horticultural species, is widely distributed in Europe, Asia, and North America. To analyze the phylogenetic and organelle genome information of R. × pulchrum and its related species, the organelle genome of R. × pulchrum was sequenced and assembled. The complete mitochondrial genome showed lineage DNA molecules, which were 816,410 bp long and contained 64 genes, namely 24 transfer RNA (tRNA) genes, 3 ribosomal RNA (rRNA) genes, and 37 protein-coding genes. The chloroplast genome of R. × pulchrum was reassembled and re-annotated; the results were different from those of previous studies. There were 42 and 46 simple sequence repeats (SSR) identified from the mitochondrial and chloroplast genomes of R. × pulchrum, respectively. Five genes (nad1, nad2, nad4, nad7, and rps3) were potentially useful molecular markers. The R. × pulchrum mitochondrial genome collinear alignment among five species of the Ericaceae showed that the mitochondrial genomes of these related species have a high degree of homology with R. × pulchrum in this gene region, and the most conservative genes were trnC-GCA, trnD-GUC, trnM-CAU, trnN-GUU, trnY-GUA, atp4, nad4, nad2, nad5, ccmC, and rrn26. The phylogenetic trees of mitochondrial genome showed that R. simsii was a sister to R. × pulchrum. The results verified that there was gene rearrangement between R. × pulchrum and R. simsii mitochondrial genomes. The codon usage bias of 10 Ericaceae mitochondrial genes and 7 Rhododendron chloroplast genes were influenced by mutation, while other genes codon usages had undergone selection. The study identified 13 homologous fragments containing gene sequences between the chloroplast and mitochondrial genomes of R. × pulchrum. Overall, our results illustrate the organelle genome information could explain the phylogenetics of plants and could be used to develop molecular markers and genetic evolution. Our study will facilitate the study of population genetics and evolution in Rhododendron and other genera in Ericaceae.
Introduction
Plants contain two organelles: the plastid and mitochondrion. These organelles retain their own genomes, which originated independently from nuclear genomes (Gray, 2012). The plastid genomes of higher plants are conserved in size, gene content, gene structure, and gene order (Sugiura, 1995; Wicke et al., 2011). Most plastomes are a circular molecule of double-stranded DNA containing four typical regions, ranging from 72 to 217 kb in size and containing ∼130 genes (Jansen et al., 2011). Plastid genomes with conserved structures and high substitution rates are used to study phylogeny, biology, and photosynthetic gene degradation in plants (Wu and Ge, 2012; Thomas et al., 2017; Shen et al., 2020).
Compared with plastid genomes, plant mitochondrial genomes have a broad distribution in size, from 66 to 11,000 kb, multipartite genome variations, arrangements among species, gene sequence transfer or loss, and other unique features (Knoop, 2004; Parkinson et al., 2005; Sloan et al., 2012; Wu et al., 2022). The mitochondrial genome size, chromosome number, and copy number variations have been explored in plants (Alverson et al., 2011). For example, the Arabidopsis thaliana mitochondrial genome has a typical circular structure (Sloan et al., 2018), while in Silene conica and Chenopodium album, the mitochondrial genomes possess linear or multichromosomal architectures (Backert and Borner, 2000; Sloan et al., 2012; Sanchez-Puerta et al., 2017). The mitochondrial genome could be used to develop molecular markers and analyze mitochondrial genome expansion mechanisms (Zubaer et al., 2018). Comparing mitochondrial genomes with related species could provide a new way to explain evolutionary mechanisms and mitochondrial genome rearrangements and to identify species taxa (Li et al., 2018; Zubaer et al., 2018).
The whole organelle genomes of plants have been sequenced on an Illumina Hiseq Platform (Shen et al., 2020; Xu et al., 2021). However, Illumina read lengths often do not span longer repeats; these regions are incompletely assembled and thus influence the accuracy of the length and content of the genome. With the development of this technique, third-generation sequencing (TGS) methods, such as Oxford Nanopore and PacBio sequencing with long-read length, could improve the coverage and assembly accuracy of previously unassembled genomic regions and is a useful tool to understand plant organelle genome information (Shearman et al., 2016). Thousands of plant plastid genomes and hundreds of complete land plant mitochondrial genomes are currently available, with most of these coming from crop species (Wu et al., 2022). Ericales comprises about 25 families (Anderberg et al., 2002), and only 10 plant species from 5 families have mitochondrial genome data published in the NCBI GenBank database. Few mitochondrial genomes of Rhododendron have been published, only report simple gene annotation information (Xu et al., 2021). Genes from mitochondrial genomes could provide a new explanation for the phylogenetic relationships among species in Ericales. Phylogenetic interrelationships in Ericales need to be further investigated using molecular data accumulated from multiple genes (Anderberg et al., 2002). The complete plastome sequences of 11 species of the genus Rhododendron belonging to Ericaceae are currently available in the NCBI GenBank database; these include five species (Rhododendron delavayi var. Delavayi, R. griersonianum, R. henanense subsp. lingbaoense, R. platypodum, and R. delavayi.) belonging to the Subgen. Hymenanthes, one species (R. molle) belonging to Subgen. Pentanthera, and five species (R. kawakamii, R. datiandingense, R. micranthum, R. concinnum, and R. simsii) belonging to Subgen. Tsutsusi. Most of these Rhododendron chloroplast genomes were assembled by second-generation sequencing, analyzing the genome structural and phylogeny (Thomas et al., 2017; Li et al., 2018; Zubaer et al., 2018). The results of these studies were quite different. Such as whether exit IRs region, and the results are surprisingly differences among Rhodordendron species. Compared with plastome sequences, Rhodordendron species mitochondrial genome-related studies on genome variations, arrangements, chloroplast-to-mitochondrial gene transfer have been poorly understood, depending on limited genomic data. With the development of new techniques, increasing organelle genome data have been published and analyzed, and chloroplast-to-mitochondrial gene transfer has been considered a characteristic feature of long-term evolution (Gui et al., 2016; Nguyen et al., 2020). Previous studies mainly focused on the gene transfer of nuclear DNA from the organelle in angiosperms (Smith, 2011; Park et al., 2014). Thus, the mitochondrial and plastid genome information of Rhodordendron species need to be further studies.
Rhododendron × pulchrum Sweet (Hirado azalea, R. × pulchrum), an important horticultural species, is widely distributed in the temperate regions of Europe, Asia, and North America (Galle, 1985). R. × pulchrum is considered as horticultural cultivar of “Omurasaki” and Hirado azalea cultivars. Recent study revealed the genetic relationship of R. × pulchrum and its related cultivars with putative ancestral species (including R. ripense Makino, R. macrosepalum, R. scabrum, R. × pulchrum “Ômurasaki,” and R. × mucronatum “Shiro-ryûkyû) using F3”5’H gene sequences and AFLP technique (Scariot et al., 2007; Meanchaipiboon et al., 2021). In addition, the chloroplast (cpDNA) origin of “Omurasaki” and Hirado azalea cultivar groups were reported in Kobayashi et al. (2021). “Omurasaki” and the most of Hirado azalea cultivar owned cpDNA of R. ripense, Japanese wild azalea (Shirasawa et al., 2021). So far, there has been no report on the mitochondrial genome of R. × pulchrum. Further studies on the mitochondrial and plastid genome information of Rhodordendron species are needed, which will facilitate the study of population genetics and evolution in Rhododendron and help to understand the evolutionary mechanisms and identifying species taxa in Ericaceae. The previously published plastid genome of R. × pulchrum was sequenced with the Illumina Hiseq Platform (Shen et al., 2019, 2020). Herein, we used TGS methods combined with second-generation sequencing technology to detect the complete mitochondrial and plastid genomes of R. × pulchrum. We assembled and annotated the complete mitochondrial and plastid genomes of R. × pulchrum and analyzed the genome content, organization, and phylogenetic analysis. We performed a comparative mitogenomic analysis of the Rhododendron species to identify regions of variation, conservation, and rearrangement across the genomes. We also analyzed gene transfer between the mitochondrial and plastid genomes of R. × pulchrum. The mitochondrial and plastid genome information could explain the phylogenetic and evolutionary relationships of plants and could be used to develop molecular markers and genetic engineering.
Materials and methods
DNA extraction and sequencing
The young green leaves of cutting clones of Rhododendron × pulchrum Sweet cultivars with purple large flowered type (Supplementary Figure 1) were collected from the nursery of Zhejiang A&F University (stored in the Institute of Botany, Chinese Academy of Sciences Mem, and the specimen accession number is PE00820836) and stored immediately at −80°C. Total genomic DNA was extracted from the young leaves using the modified Cetyltrimethylammonium Bromide (CTAB) method (Doyle, 1987). High-quality DNA was used for subsequent library preparation and sequencing using PromethION and BGISEQ-500 platforms (Bio & Data Biotechnologies Co., Ltd., Guangzhou, China). To obtain long non-fragmented sequence reads, ∼15 μg of genomic DNA was sheared and size-selected (30–80 kb) with a BluePippin (Sage Science, Beverly, MA, USA). The selected fragments were processed using the Ligation Sequencing 1D Kit (Oxford Nanopore, Oxford, UK) according to the manufacturer’s instructions and sequenced using the PromethION DNA sequencer (Oxford Nanopore, Oxford, UK) for 48 – 72 h.
Following DNA extraction, we fragmented 1 μg of purified DNA and used it to set up 300 bp short-insert libraries. These qualified libraries were sequenced with PE150 bp on a BGISEQ-500 sequencer according to the manufacturer’s instructions. Sequencing was performed using SPAdes v-3.13.0 software (Bankevich et al., 2012), and TGS data were assembled individually using Canu v-1.5 software (Koren et al., 2017). The assembled contigs were aligned with all the manufacturer’s instructions detailed in the literature (Huang et al., 2017).
Preprocessing of sequenced reads
For the long reads, adapter trimming was performed using Porechop v0.2.41 and removing reads with quality score < 7 was performed using Guppy. For the short reads, raw reads were preprocessed by Fastp v.0.20.1 with default parameters (Chen et al., 2018) in order to trim adaptors and remove the low-quality reads (Phred quality scores < 20).
Assembly of the mitochondrial genome
Mixed de novo assembly for third- and second-generation sequencing was performed using SPAdes v-3.13.0 software (parameters −k 21,33,55,77,89 –careful, orther default) (Bankevich et al., 2012), and third-generation (long) sequencing data were assembled individually using Canu v-1.5 software with settings of (1) genome size of 0.8 Mb and (2) corrected Error Rate = 0.03 (Koren et al., 2017). The assembled contigs were aligned with all mitochondrial sequences of the Ericales species from the NCBI, and candidate mitochondrial contigs were extracted. The candidate mitochondrial contigs were then polished using Pilon software (Walker et al., 2014), and the second-generation (short) sequencing read extensions were performed on the contigs using Geneious prime software (Kearse et al., 2012). The repeats at the ends of the selected mitochondrial contigs were identified using Geneious Prime software. Contigs were linked based on the terminal repeats, and the assembled long contigs were subjected to short read comparison and end extension until no reads could be further extended (Kearse et al., 2012). The assembly was identified by comparing the mitochondrial genome of 4 species from Ericales, namely R. simsii (NC053763), Vaccinium macrocarpon (NC023338), Monotropa hypopitys (MK990822), and Arctostaphylos glauca (MZ779111), as a reference.
Assembly of the chloroplast genome
The TGS reads were aligned to all chloroplast genome data of the Ericales species from NCBI using Minimap2 software (Li, 2018), and reads with alignment lengths greater than 5,000 bp were extracted for subsequent assembly. The second-generation sequencing reads were download from Genbank and aligned with the company’s (Bio and Data Biotechnology Co., Ltd., Guangzhou, China) self-built chloroplast genome database using Bowtie2 software (Langmead and Salzberg, 2012), and the aligned reads were used for subsequent assembly. The chloroplast candidate third- and second-generation reads extracted above were used for chloroplast genome assembly using Unicycler version: v0.4.8 software with default parameters (Wick et al., 2017). The chloroplast genome of R. × pulchrum was reassembled and re-annotated in our study; all new reads were deposited to the NCBI Sequence Read Archive (SRA) under accession number MN182619.2.
Complete chloroplast genome collinear alignment compared between MN182619.1 and MN182619.2 of Rhododendron × pulchrum had been compared using LASTZ software (version 1.02.00) (Harris, 2007; Kearse et al., 2012). The breakage and inversion sites were randomly selected to design primers for Polymerase Chain Reaction (PCR) experiments to verified the accuracy of the chloroplast genome.
Annotation of the mitochondrial and chloroplast genomes
Mitochondrial and chloroplast genome annotation was performed using GeSeq software (Tillich et al., 2017), and annotation results were manually corrected using Geneious prime (Kearse et al., 2012). The genome map was drawn using the Organellar Genome DRAW tool (OGDRAW) v.1.3.1 for further comparison of gene order and content (Greiner et al., 2019). The relative synonymous codon usage (RSCU) was calculated following Sharp and Li (1986).
Identification of repeats
Simple sequence repeats (SSR) using MISA (MIcroSAtellite identification tool) software for SSR analysis (Thiel et al., 2003), and parameters were set as follows (unit_size, min_repeats): 1–10 2–6 3–5 4–5 5–5 6–5, interruptions (max_difference_between_2_SSRs): 100. Using a tandem repeat finder to analyze tandem repeat sequences, the parameters were set as 2, 7, 7, 80, 10, 50, 500, −f, −d, and −m (Benson, 1999).
Phylogenetic analysis
Phylogenies were constructed by maximum likelihood (ML) using Fasttree software (Price et al., 2010). The sequences were initially aligned using MAFFTv7.313 (Katoh and Standley, 2013), and the ML tree was constructed using Fasttree 2 software under the GTR + Gamma model (Price et al., 2010).
The mitochondrial phylogenetic tree selected 8 coding gene fragments (atp1, atp4, atp9, ccmC, matR, nad3, nad6, and rps12) shared by the mitochondrial genomes of 13 related species: R. × pulchrum (OM283814), R. simsii (NC053763), Vaccinium macrocarpon (NC023338), Arctostaphylos glauca (MZ779111), Monotropa hypopitys (MK990822), Aegiceras corniculatum (NC056358), Argania spinosa (MZ151883), Camellia sinensis var. Assamica (MK574877), Camellia sinensis (NC043914), Actinidia eriantha (MZ959063), A. chinensis (MZ959061), and A. arguta (MH559343). Vitis vinifera (NC012119) was used as an outgroup sample for sequence alignment. The mitochondrial evolutionary tree of Ericales was constructed in this study. The length of the homologous part for the 8 genes in 13 related species had been shown in Supplementary Table 1.
The chloroplast evolutionary tree selected 57 coding gene fragments (atpA, atpB, atpE, atpH, atpI, cemA, matK, ndhA, ndhB, ndhC, ndhD, ndhE, ndhF, ndhH, ndhI, ndhJ, petA, petB, petD, petG, petL, petN, psaA, psaB, psaC, psaI, psbA, psbB, psbC, psbD, psbE, psbF, psbJ, psbK, psbL, psbM, rbcL, rpl2, rpl14, rpl22, rpl23, rpl32, rpl33, rpl36, rpoA, rpoC1, rpoC2, rps2, rps3, rps4, rps7, rps8, rps11, rps12, rps14, rps15, and rps18) shared by the genomes of closely related species for sequence alignment, and the involved 15 species, namely Rhododendron delavayi var. delavayi (NC047438), R. griersonianum (NC050162), R. henanense subsp. lingbaoense (MT239363), R. platypodum (MT985162), R. delavayi (MN711645), R. molle (MZ073672), R. kawakamii (NC058233), R. datiandingense (NC057644), R. micranthum (MT239365), R. concinnum (MT239366), R. ripense (DRR298903-DRR298907), R. ovatum (SRR12917131-SRR12917132), R. latoucheae (SRR13425299), R. × pulchrum (MN182619.2) and R. simsii (MT239364). Actinidia deliciosa (NC026691), and A. chinensis (NC026690) were used as outgroup samples for sequence alignment. The Rhododendron genus has extensive chloroplast data; thus, only the Rhododendron chloroplast evolutionary tree was constructed in our study. The length of the homologous part for the 57 genes 15 related species had been shown in Supplementary Table 2.
Codon usage bias patterns analysis
Codon usage bias parameters RSCU and Effective number of codons (ENC) were calculated using CondonW 1.4.4 software (Peden and John, 2000). ENC is used to analyze the effect of gene base composition on codon usage bias (Wright, 1990). These two parameters were used to describe the patterns of codon usage bias. Five mitochondrial genomes from Ericaceae were selected to calculated parameters of codon usage bias, including Monotropa hypopitys (MK990822), Arctostaphylos glauca (MZ779111), Vaccinium macrocarpon (NC023338), Rhododendron simsii (NC053763), and R. × pulchrum (OM283814). The 15 chloroplast genomes of Rhododendron were selected to calculated parameters of codon usage bias, including Rhododendron delavayi var. delavayi (NC047438), R. griersonianum (NC050162), R. henanense subsp. lingbaoense (MT239363), R. platypodum (MT985162), R. delavayi (MN711645), R. molle (MZ073672), R. kawakamii (NC058233), R. datiandingense (NC057644), R. micranthum (MT239365), R. concinnum (MT239366), R. ripense (DRR298903-DRR298907), R. ovatum (SRR12917131-SRR12917132), R. latoucheae (SRR13425299), and R. simsii (MT239364), and R. × pulchrum (MN182619.2).
Genomic comparison of related species and horizontal gene transfer between chloroplast and mitochondrial genomes
The mitochondrial genome of R. × pulchrum was used as a reference, and it was compared with R. simsii (NC_053763) to determine the mitochondrial rearrangement. Mauve software was used to analyze mitochondrial rearrangement and draw structural variation (Darling et al., 2004).
The mitochondrial genomes of R. × pulchrum (OM283814) and R. simsii (NC_053763) were analyzed for collinearity using Dottup software (Rice et al., 2000). LASTZ version 1.02.00 was used to perform a whole-gene collinear alignment to detect the collinear segment (Harris, 2007; Kearse et al., 2012). The parameters were set as follows: step = 20 and seed pattern = 12 of 19. The results were displayed using the R. × pulchrum mitochondrial genome as a reference and compared with four other genomes belonging to the Ericaceae family (R. simsii, V. macrocarpon, A. glauca, and M. hypopitys). Horizontal gene transfer (HGT) between the chloroplast and mitochondrial genomes was determined using LASTZ version 1.02.00 (Harris, 2007).
Results
Mitochondrial genome organization and features
The mitochondrial genome assembly had an average read coverage higher than 325 × in this study. The genebank accession number of the R. × pulchrum mitochondrial genome is OM283814. Whole mitochondrial genome (mitogenome) sequencing produced 36,533,204 clean reads (SRA accession number SRR17758703) from the second-generation sequencing platform and 5,364,975 pass reads (SRA accession number SRR17758704) from the TGS platform. The sequencing and assembly statistics are summarized in Supplementary Table 3.
The mitochondrial genome was composed of lineage DNA molecules and assembled at 816,410 bp, with GC contents of 45.7% for R. × pulchrum (Figure 1 and Supplementary Figure 4). The complete mitochondrial genome of R. × pulchrum contained 64 annotated genes, namely, 24 transfer RNA (tRNA) genes, 3 ribosomal RNA (rRNA) genes, and 37 protein-coding genes (mRNA) (Table 1). These gene positions and arrangements are depicted in Figure 1.
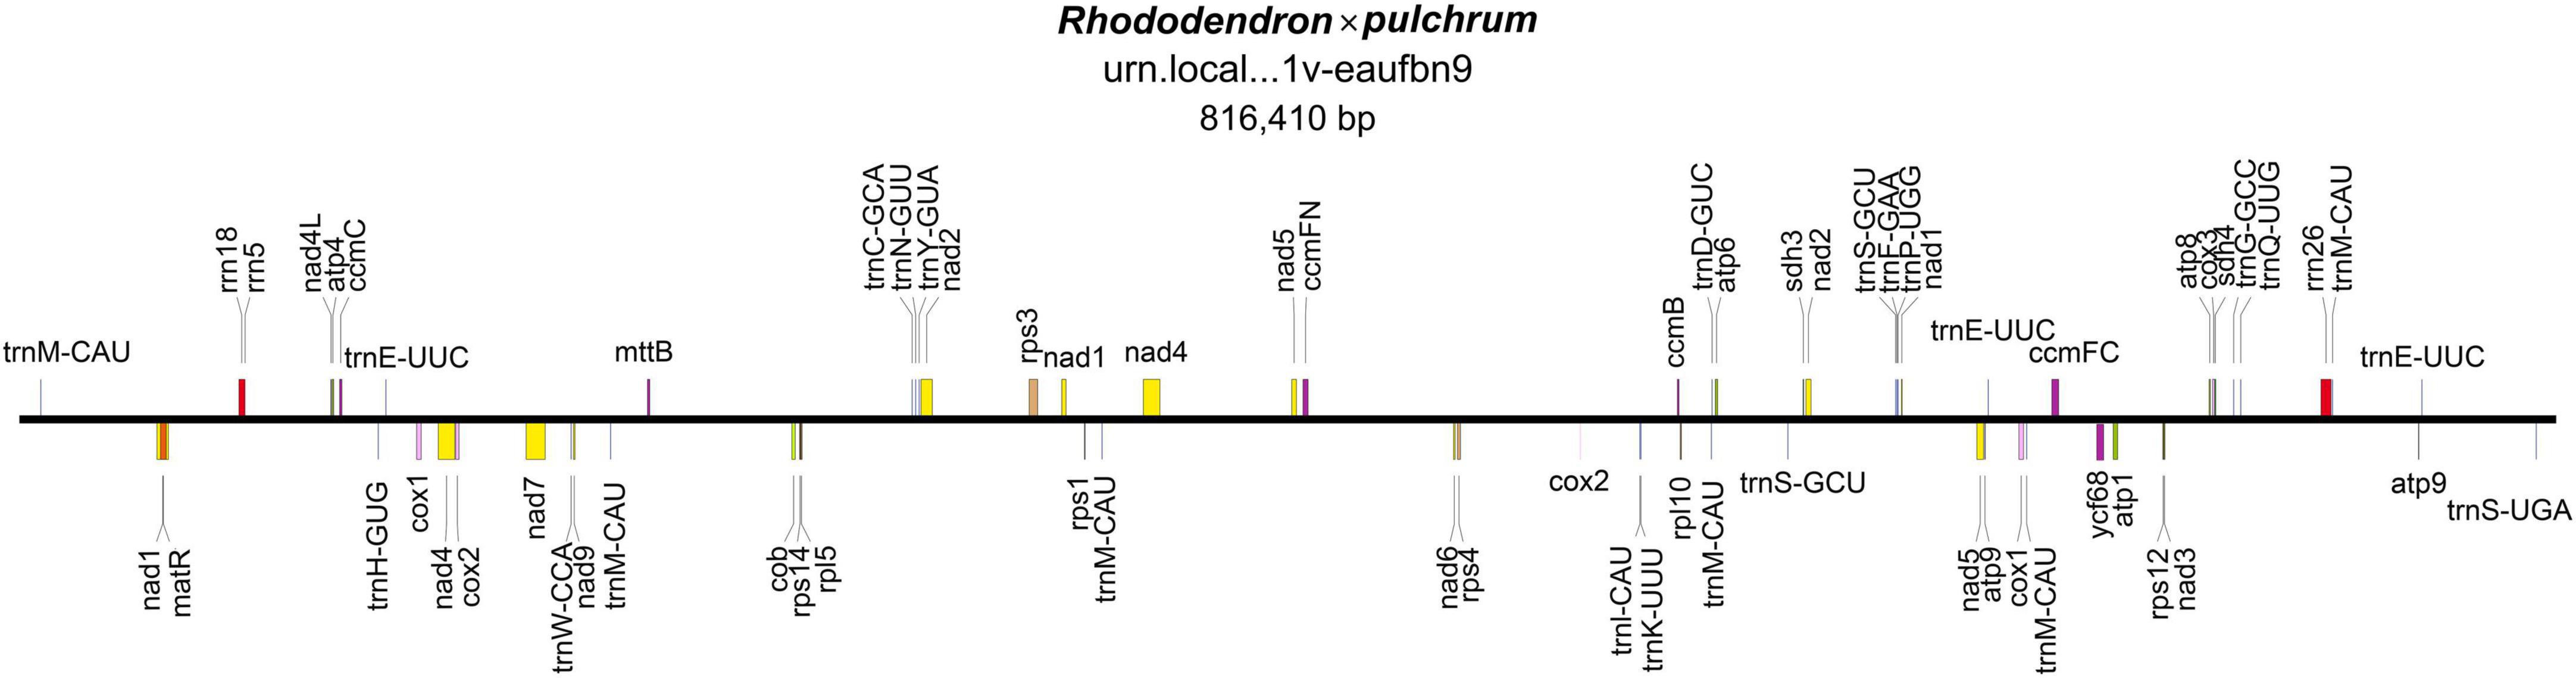
Figure 1. Gene map of the Rhododendron × pulchrum mitochondrial genome.
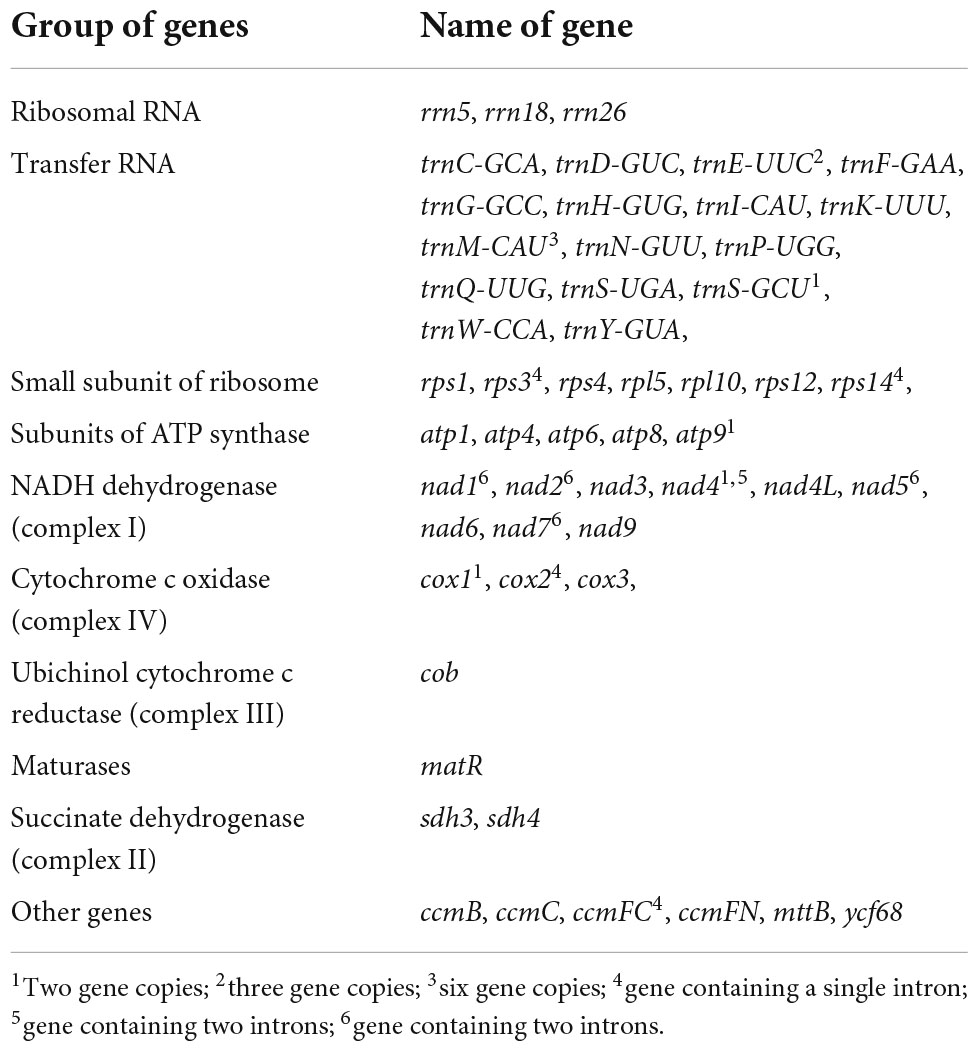
Table 1. Annotated genes in the Rhododendron × pulchrum mitochondrial genome.
In total, 9 intron-containing genes (rps14, Cox2, ccmFC, rps3, nad1, nad 2, nad4, nad5, and nad7) were annotated (Table 1), among which nad4 had protein-coding genes with two introns, nad1, nad 2, nad5, and nad7 protein-coding genes had four introns, and the others had one intron.
We then estimated the codon usage frequency based on the protein-coding and tRNA genes. As shown in Supplementary Table 5 and Supplementary Figure 2, UUC, AUU, and UUU were the most frequent codons, contributing to the high AU content of the R. × pulchrum mitochondrial genome (54.3%). The mitochondrial genome was composed of 11,196 codons (65 different types) encoding 20 amino acids, among which leucine (Leu) was the most frequently used amino acid (11.59%, 1,298), and cysteine (Cys) was the least abundant (1.46%, 163) (Supplementary Table 5). The results suggest that the R. × pulchrum mitochondrial genome prefers synonymous codons ending with A or T with a RSCU > 1, excepting UUG ending with G.
Forty-two SSRs were identified from the R. × pulchrum mitochondrial genome, with 36 mononucleotides (63.35%), 4 dinucleotides (2.71%), and 2 trinucleotides (26.24%) (Supplementary Table 6). Two SSRs contained guanine (G) or cytosine (C), whereas the remaining 34 SSRs had either polyadenine (poly A) or polythymine (poly T). Six SSR markers were located in gene coding regions, including AG (6) and CT (6) located in the nad4 gene, two A (10) located in the nad1 and nad2 genes, and two A (12) located in the nad7 and rps3 genes. A total of 28 tandem repeats (TR) were identified in the R. × pulchrum mitochondrial genome (Supplementary Table 7). Among these, only one TR (742,682–742,724 bp) was located in the rrn26 gene; the others were all located in intergenic spaces.
Mitochondrial genome comparison
The mitochondrial phylogenetic tree from Ericales showed that the 8 species were clustered into four groups, which is consistent with their taxonomic information. Five species in the Ericaceae family were clustered into one clade: R. simsii, V. macrocarpon, A. glauca, M. hypopitys, and R. × pulchrum. Furthermore, R. simsii was found to be a sister to R. × pulchrum (Figure 2).
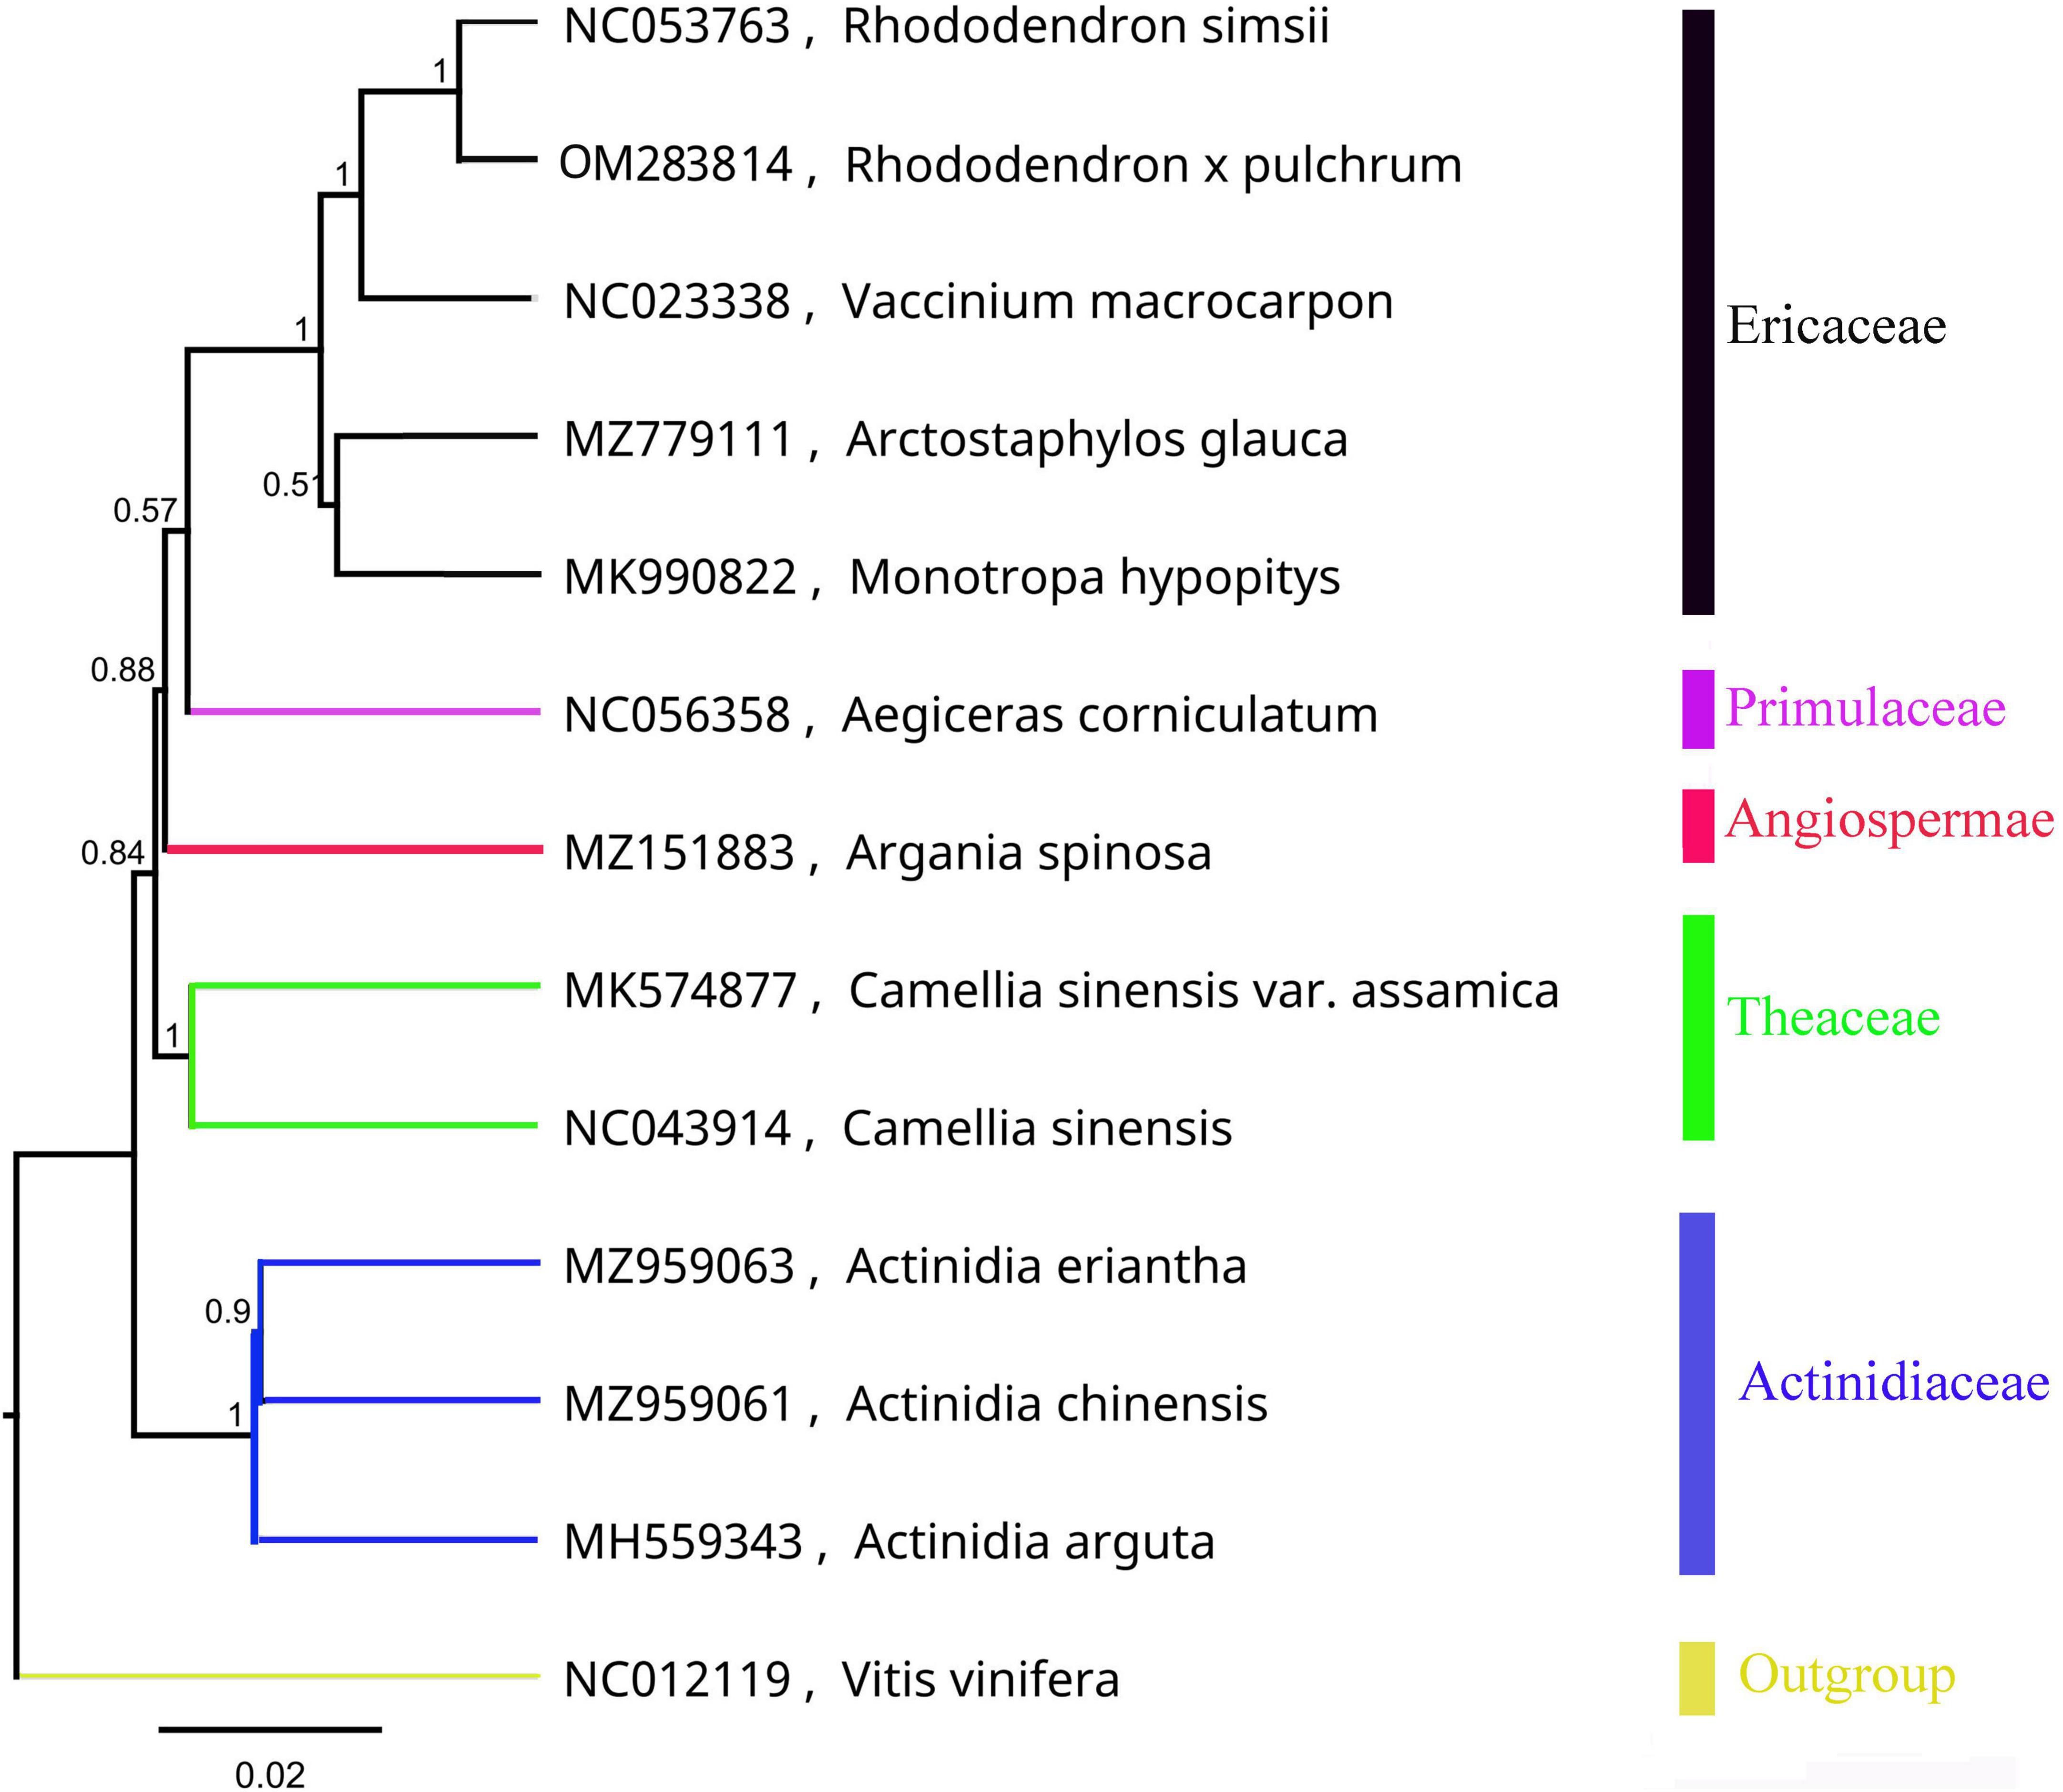
Figure 2. Phylogenetic tree of Ericales species based on mitochondrial genomes. Vitis vinifera (NC012119) was used as the outgroup.
The R. × pulchrum mitochondrial genome was used as a reference, and a whole-genome collinear alignment was compared among five species from the Ericaceae family, as shown in Figure 3. The mitochondrial genome of these related species had a high degree of homology with R. × pulchrum in the gene region, in which the most conservative genes were atp4, ccmC, nad4, trnC-GCA, trnN-GUU, trnY-GUA, nad2, nad5, trnM-CAU, trnD-GUC, and rrn26. R. × pulchrum and R. simsii mitochondrial genomes had more homologous coverage than the other three species of Ericaceae. Furthermore, the mitochondrial genome organization between R. × pulchrum and R. simsii mitochondrial genomes showed that there was still complex variation (Supplementary Figure 3).
Figure 3. Complete mitochondrial genome collinear alignment compared between five species from the Ericaceae family. (Rhododendron × pulchrum as the reference; blue bars represent homologous high-scoring segment pairs in a codirectional orientation, whereas red bars represent reversed pairs. Yellow arrows represent coding sequences, red arrows represent ribosomal RNA genes, purple arrows represent transfer RNA genes, green arrows represent protein-coding genes, and gray arrows represent exonic regions. Black squares represent homology; the larger the number, the larger the area of the black squares, and the more closely related species have homologous fragments. Red wireframes are the most conservative regions. These regions, marked from left to right in the figure, are distributed from left to right and contain the following genes: atp4 and ccmC; nad4; trnC-GCA, trnN-GUU, trnY-GUA, and nad2; nad4; nad5; trnM-CAU and trnD-GUC; nad2; rrn26, and trnM-CAU).
The mitochondrial genome of R. × pulchrum was used as a reference, and it was compared with R. simsii (NC_053763) to analyze mitochondrial genome rearrangement and collinearity using the Mauve and Lastz programs. The mitochondrial genomes of R. × pulchrum and R. simsii were divided into 63 locally collinear blocks (LCB). These LCBs differed substantially in the size and relative position of the two Rhododendron species studied (Figure 4). Moreover, most LCBs contained gene sequences, with 42 genes involved in total (Supplementary Table 8). The rearrangement analysis indicated that many genes had rearrangements between R. × pulchrum and R. simsii mitochondrial genomes (Supplementary Table 8).
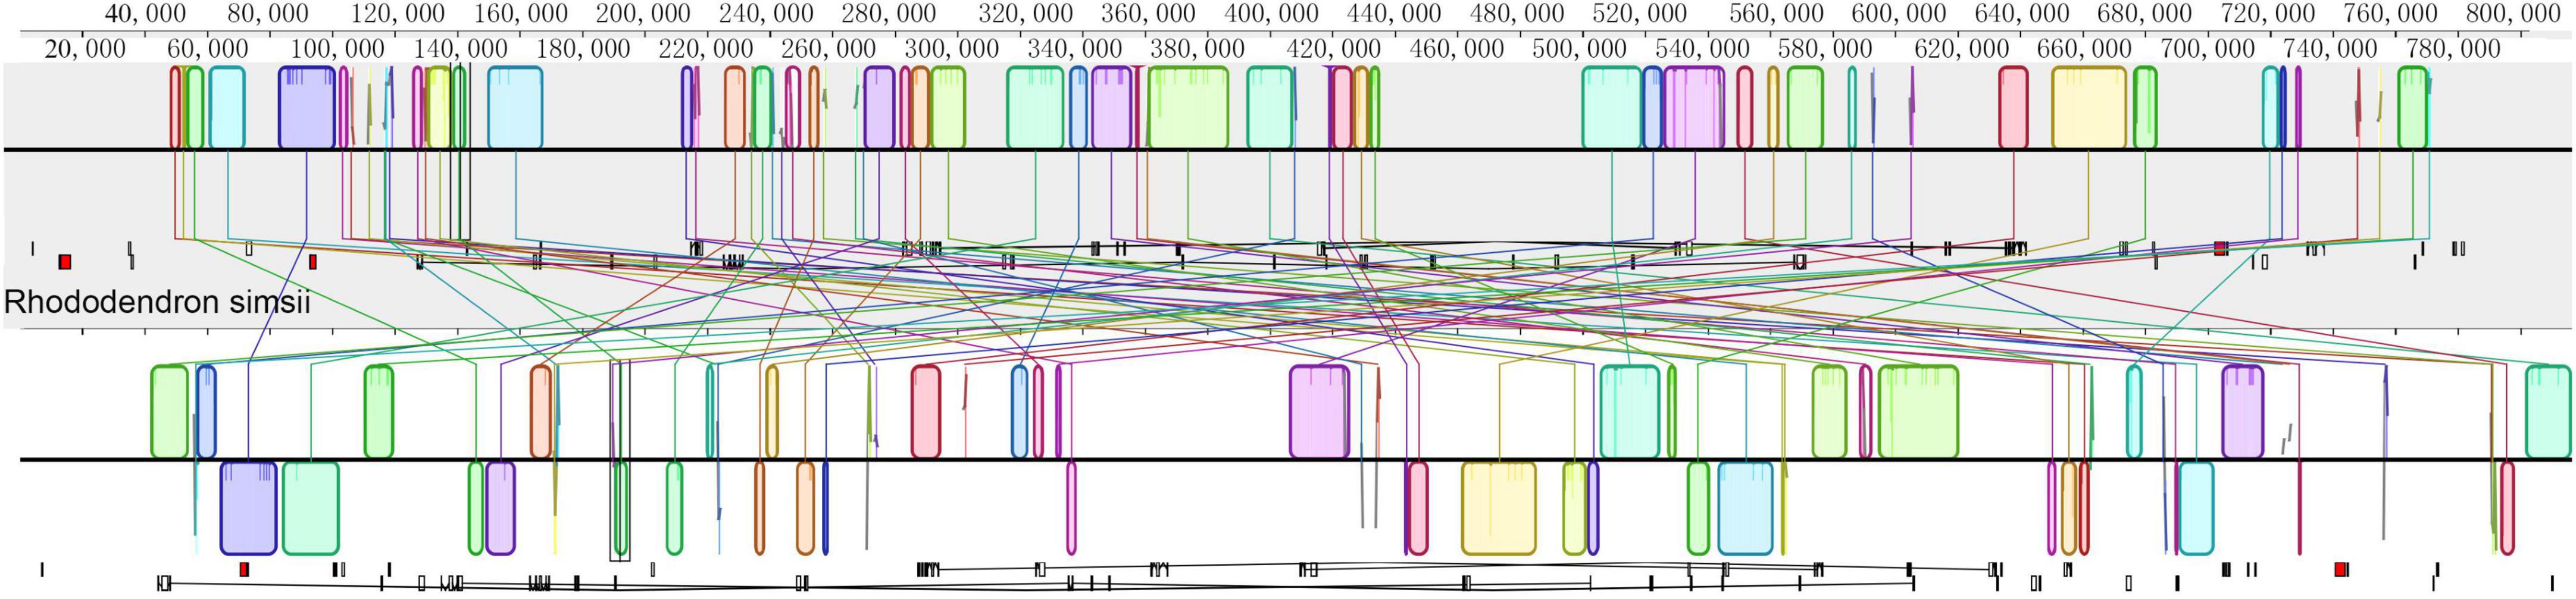
Figure 4. Mauve visualization of mitochondrial genome-wide comparison between Rhododendron × pulchrum and R. simsii. [The progressive mauve alignment (in the Mauve program) shows the homologous blocks shared among the mitochondrial genomes, and it also connected these blocks with lines, indicating the corresponding position among the homologous blocks to visualize the gene arrangement].
Chloroplast genome organization and features
The results showed that the complete R. × pulchrum chloroplast genome was 146,941 bp in length (Figure 5) and did not take the form of a typical quadripartite structure, due to the lack of inverted repeats (IR). The GC content of the chloroplast genome of R. × pulchrum was 35.8%. The complete chloroplast genome of R. × pulchrum contained 119 genes that were annotated, namely 34 tRNA genes, 4 rRNA genes, and 81 protein-coding genes (mRNA) (Table 2 and Figure 5). In total, 7 protein-coding genes (ndhB3, petB, petD, atpF, rpl16, rps12, and rps16) and 6 tRNA (trnA-UGC, trnK-UUU, trnI-GAU, trnG-UCC, trnL-UAA, and trnV-UAC), which were intron-containing genes, were annotated (Table 1). Among these, only pafI4 protein-coding genes contained two introns, and the others had one intron.
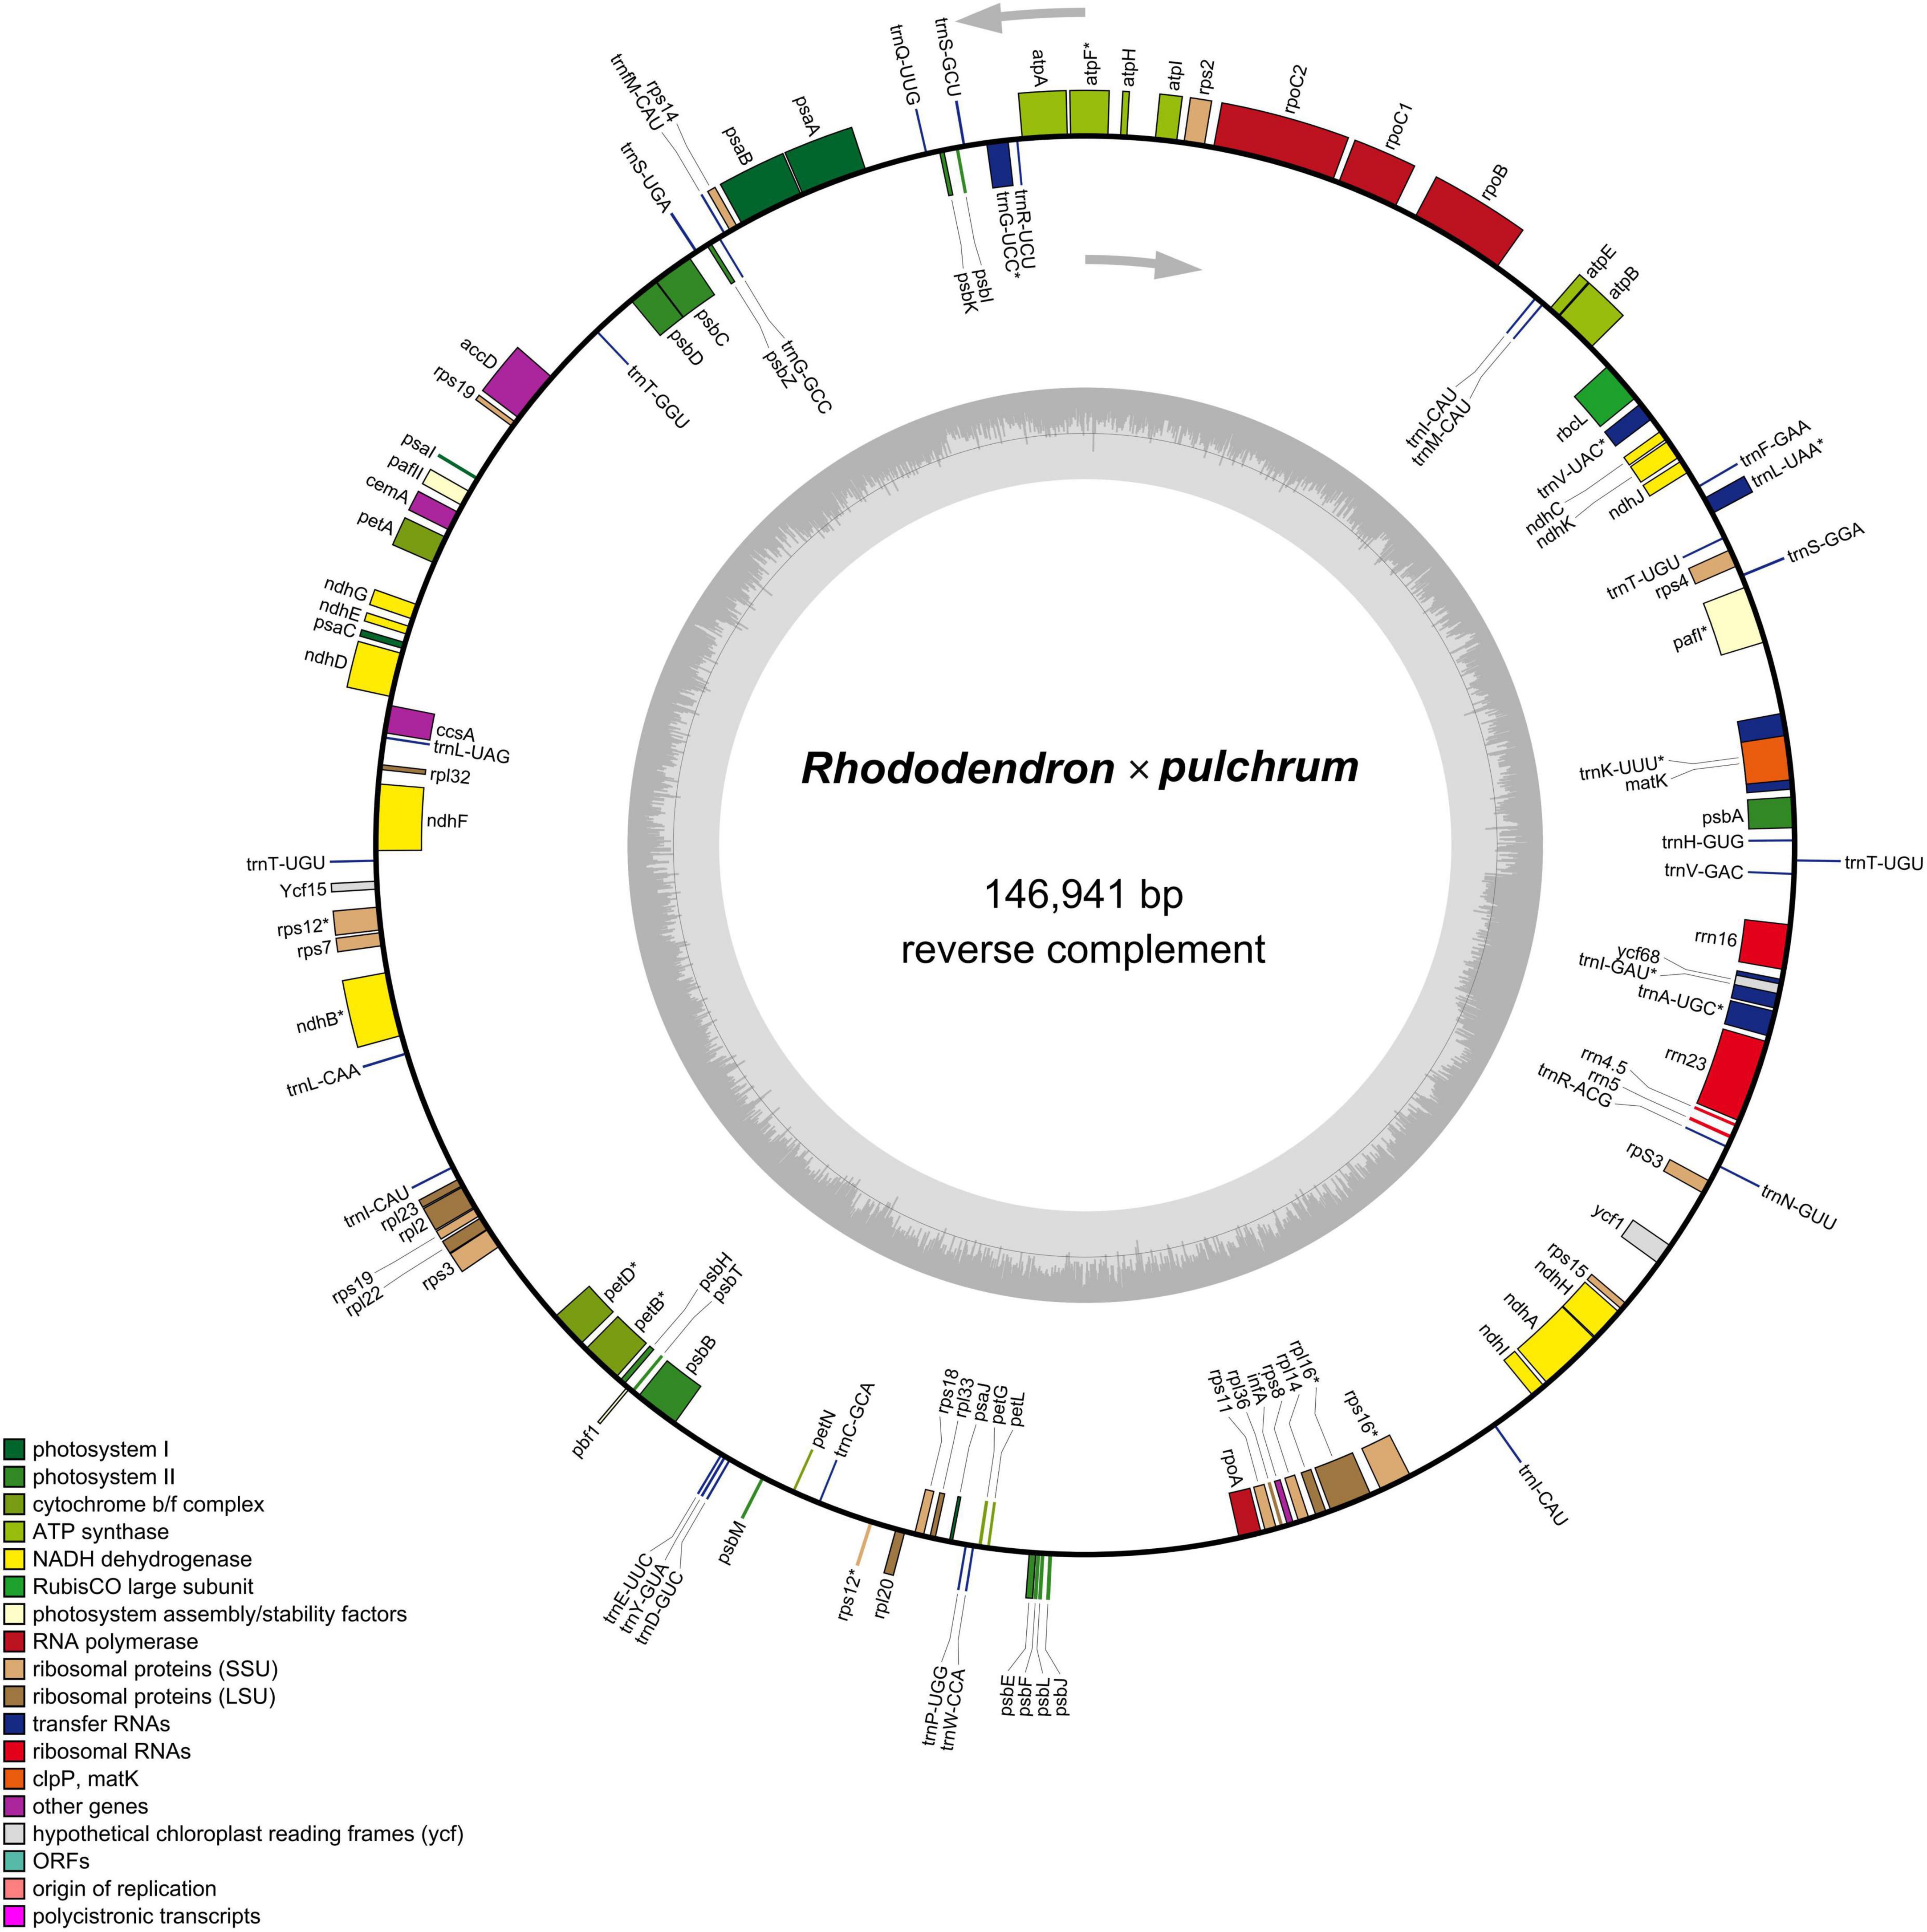
Figure 5. Gene map of the Rhododendron × pulchrum chloroplast genome. (Genes residing in the inside and outside of the outer circle are in the forward and reverse directions, respectively. The dark and light gray bars in the inner circle denote the G + C and A + T contents, respectively).
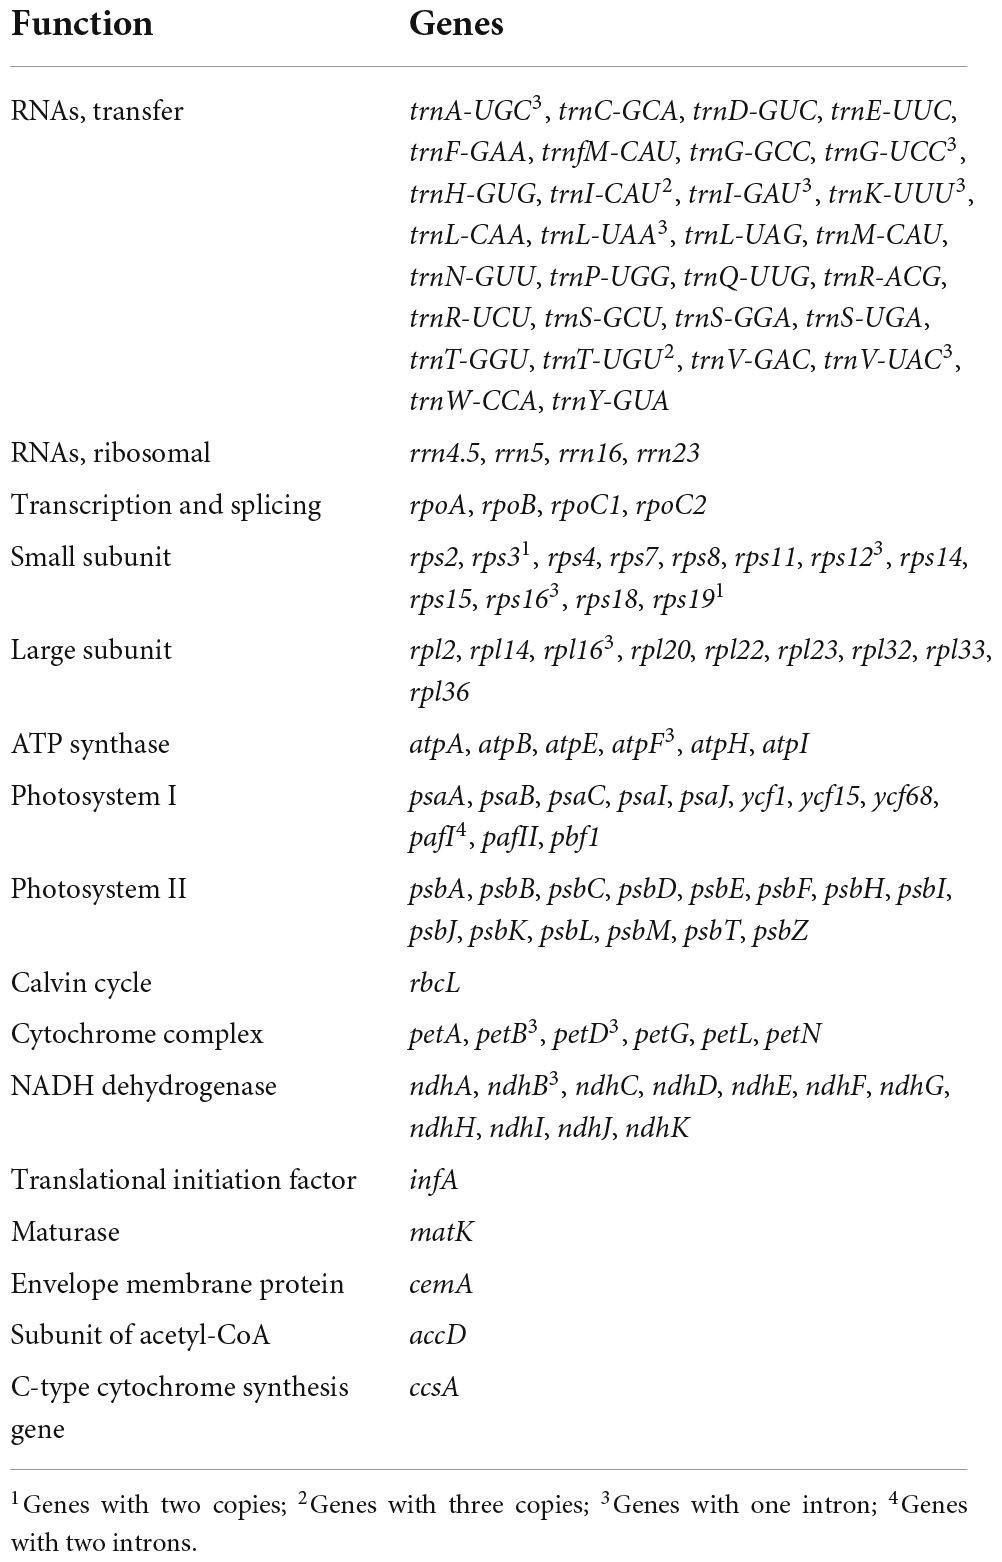
Table 2. Annotated genes of the Rhododendron × pulchrum chloroplast genome.
The codon usage frequency based on the protein-coding and tRNA genes is shown in Supplementary Table 9 and Supplementary Figure 4. The chloroplast genome was composed of 19,278 codons (65 different types) encoding 20 amino acids, among which leucine (Leu) was the most frequently used amino acid (10.68%, 2,058) and cysteine (Cys) was the least abundant (1.12%, 215) (Supplementary Table 8). The results suggest that the R. × pulchrum chloroplast genome prefers synonymous codons ending with A or U with a RSCU > 1 (Supplementary Table 9 and Supplementary Figure 4).
Forty-six SSRs were identified from the R. × pulchrum chloroplast genome, including 41 mononucleotides and 5 dinucleotides (Supplementary Table 10). All SSRs contained only polyadenine (poly A) or polythymine (poly T), without guanine (G) or cytosine (C).
Chloroplast genome comparison
The chloroplast genome phylogenetic tree of 15 species from Rhododendron showed that these species were clustered into three groups, which is consistent with their taxonomic information. Five species in Subgen. Hymenanthes were clustered into one clade: R. delavayi var. Delavayi, R. griersonianum, R. henanense subsp. lingbaoense, R. platypodum, and R. delavayi. R. molle belonging to Subgen. Pentanthera was clustered into one clade. The other 6 species belonging to Subgen. Tsutsusi were clustered into one clade. Among these 6 species, R. kawakamii and R. datiandingense belonged to Sect. Vireya, R. micranthum and R. concinnum belonged to Sect. Rhododendron, and R. × pulchrum and R. simsii belonged to Sect. Tsutsusi. Furthermore, R. ripense was found to be a sister to R. × pulchrum (Figure 6).
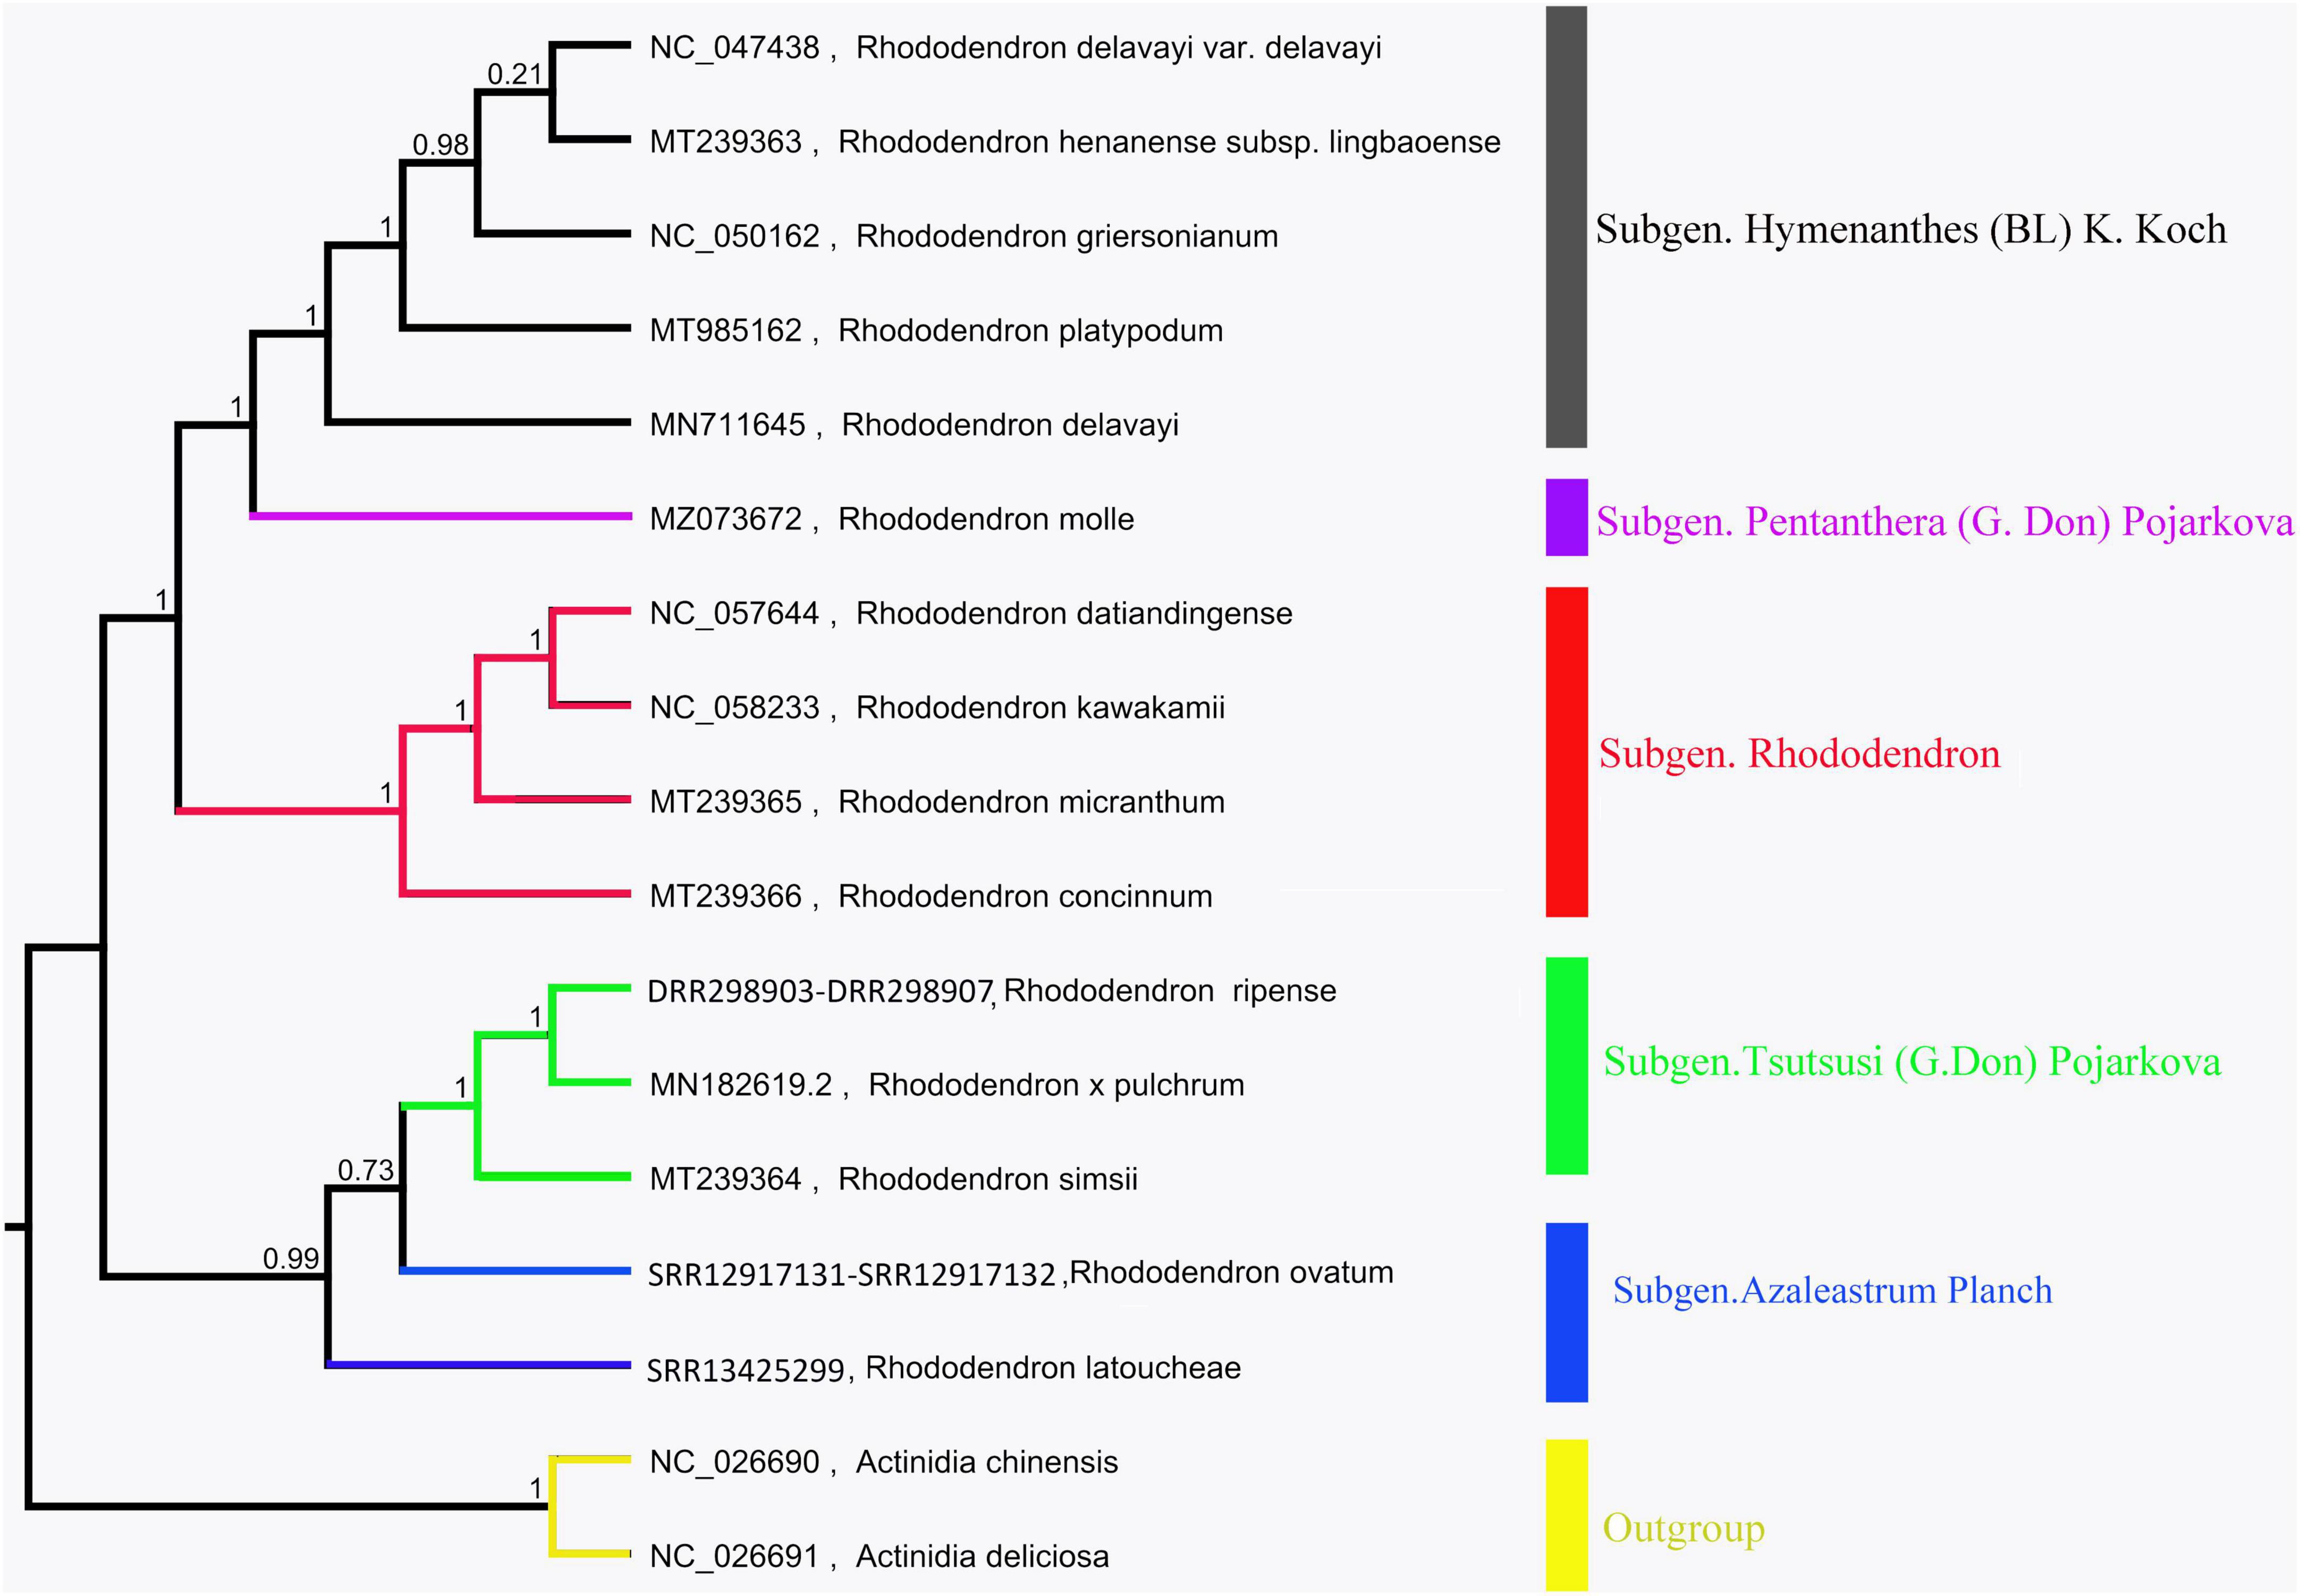
Figure 6. Phylogenetic tree of Rhododendron species based on chloroplast genomes. Actinidia deliciosa and Actinidia chinensis were used as the outgroups.
Codon usage bias patterns and evolution
Codon usage frequency of five mitochondrial genomes from Ericaceae had been shown in Supplementary Table 11, there have 30∼32 codons with a RSCU > 1 among these five species, these codons ending with A or T, excepting UUG (Leu) ending with G. Codons GCU (Ala), CAU (His), and UAA (Ter) were the most frequent codons (RSCU > 1.5), CAS (His) was the low frequent codons (RSCU < 0.5) among these five species. Codon usage frequency of 15 chloroplast genomes of Rhododendron had been shown in Supplementary Table 12, there have 30∼31 codons with a RSCU > 1 among these 15 species, these codons ending with A or T, excepting UUG (Leu) ending with G. Further, 14∼19 codons were the most frequent codons (RSCU > 1.5), 16∼20 codons were the low frequent codons (RSCU < 0.5) among these 15 species.
The number of genes of ENC value below 35 in M. hypopitys, V. macrocarpon, A. glauca, R. × pulchrum, and R. simsii mitochondrial genomes are 0, 0, 1 (ccmC), 1 (atp9), and 1 (atp9) (Supplementary Table 13). NEC plot analysis had shown that there have 10 genes on or above standard curve line in 5 Ericaceae species mitochondrial genomes, including atp4, atp6, ccmFc, nad1, nad9, rpl10, rps3, rps10, rps12, rps19, the other genes below standard curve line (Figure 7 and Table 3). Twenty of these genes in the five species are all below standard curve line (Figure 7 and Table 3). There had found three genes with ENC value below 35 in 15 Rhododendron species chloroplast genomes, including petN (found in 15 species), psbI (found in 14 species, except MT239363), rpl36 (found in 11 species, except MT239365, MT239366, NC_057644, and NC_058233) (Supplementary Table 15). Genes atpH, ndhH, petL, psaC, psbM, rpl23, and rps11 were found all on or above NEC standard curve in 15 Rhododendron species chloroplast genomes (Figure 8 and Supplementary Table 14).
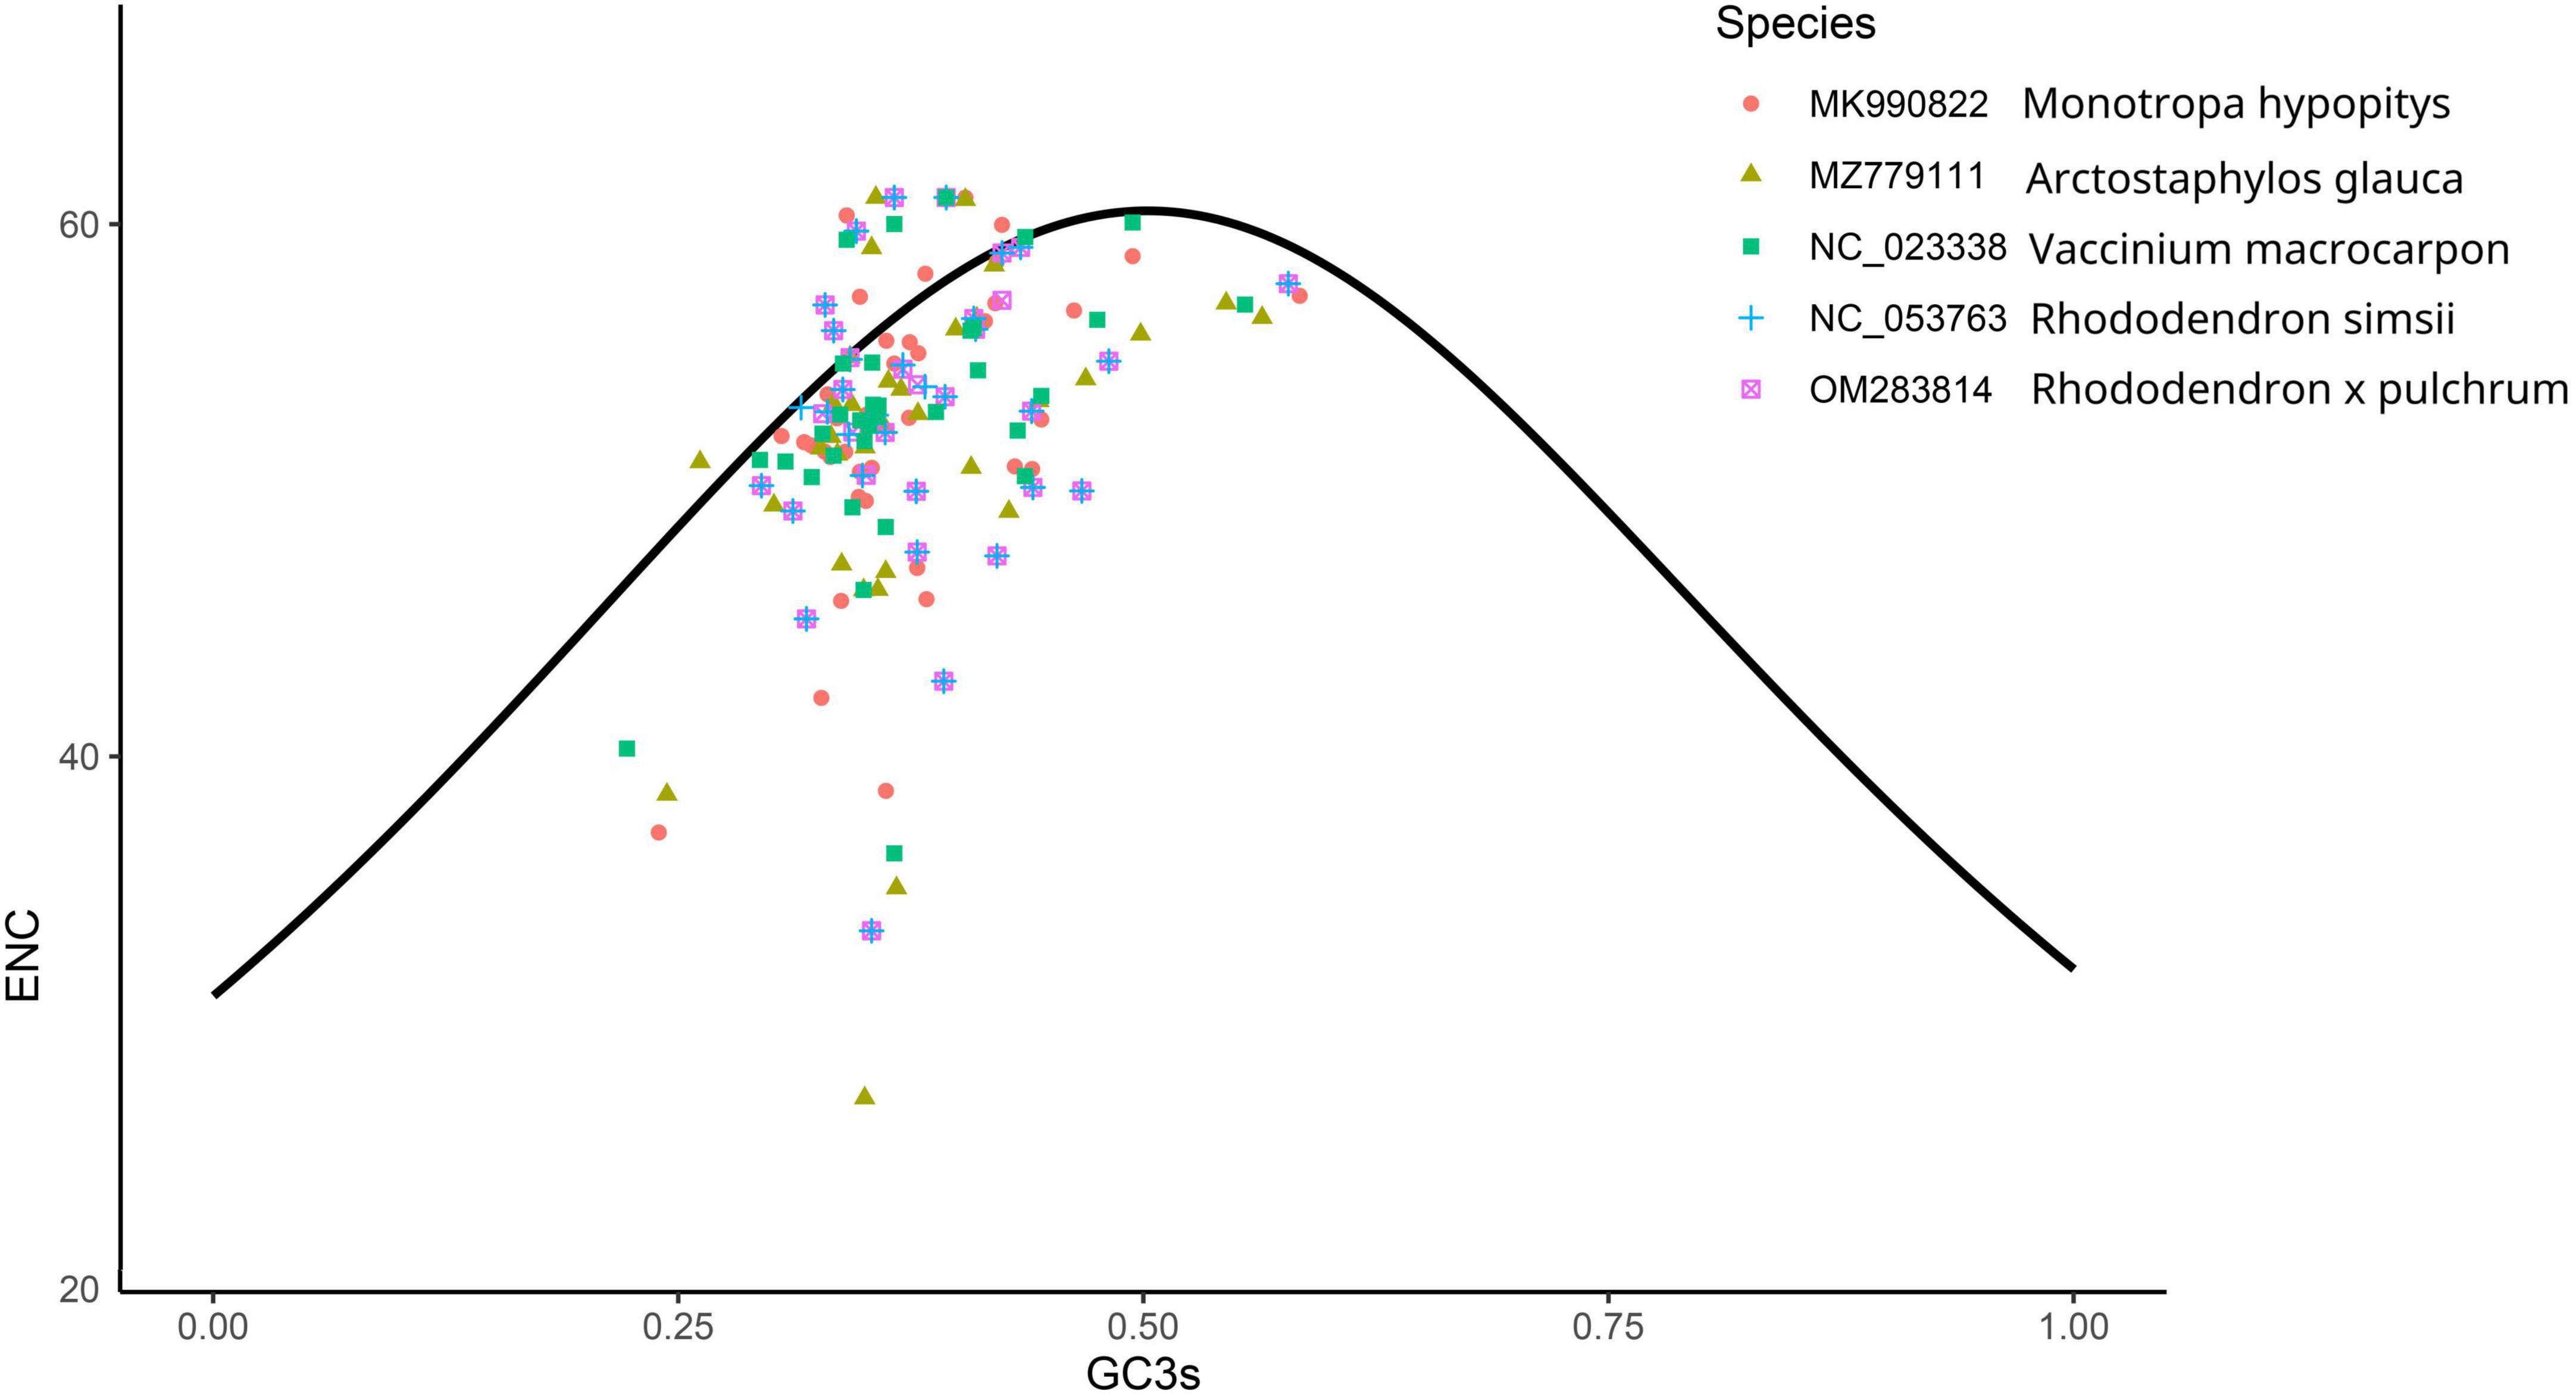
Figure 7. ENC Plot analysis of genes in 5 Ericales species mitochondrial genomes. (Y-axis: Effective number of codons value of gene; X-axis: GC3 content of gene; Standard curve line is calculated as follows: ENC = 2 + GC3 + 29/(GC32 + (1-GC3)2).
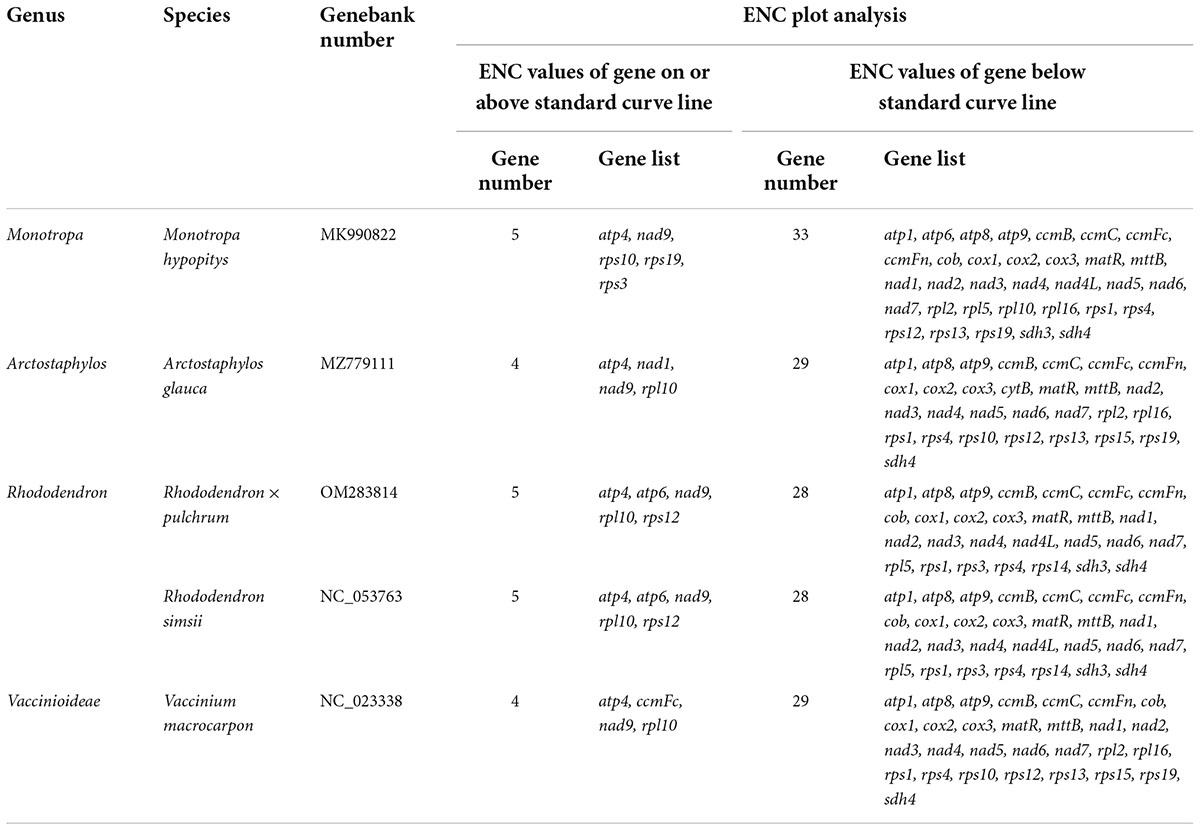
Table 3. Plot of ENC of genes in 5 Ericaceae species mitochondrial genomes.
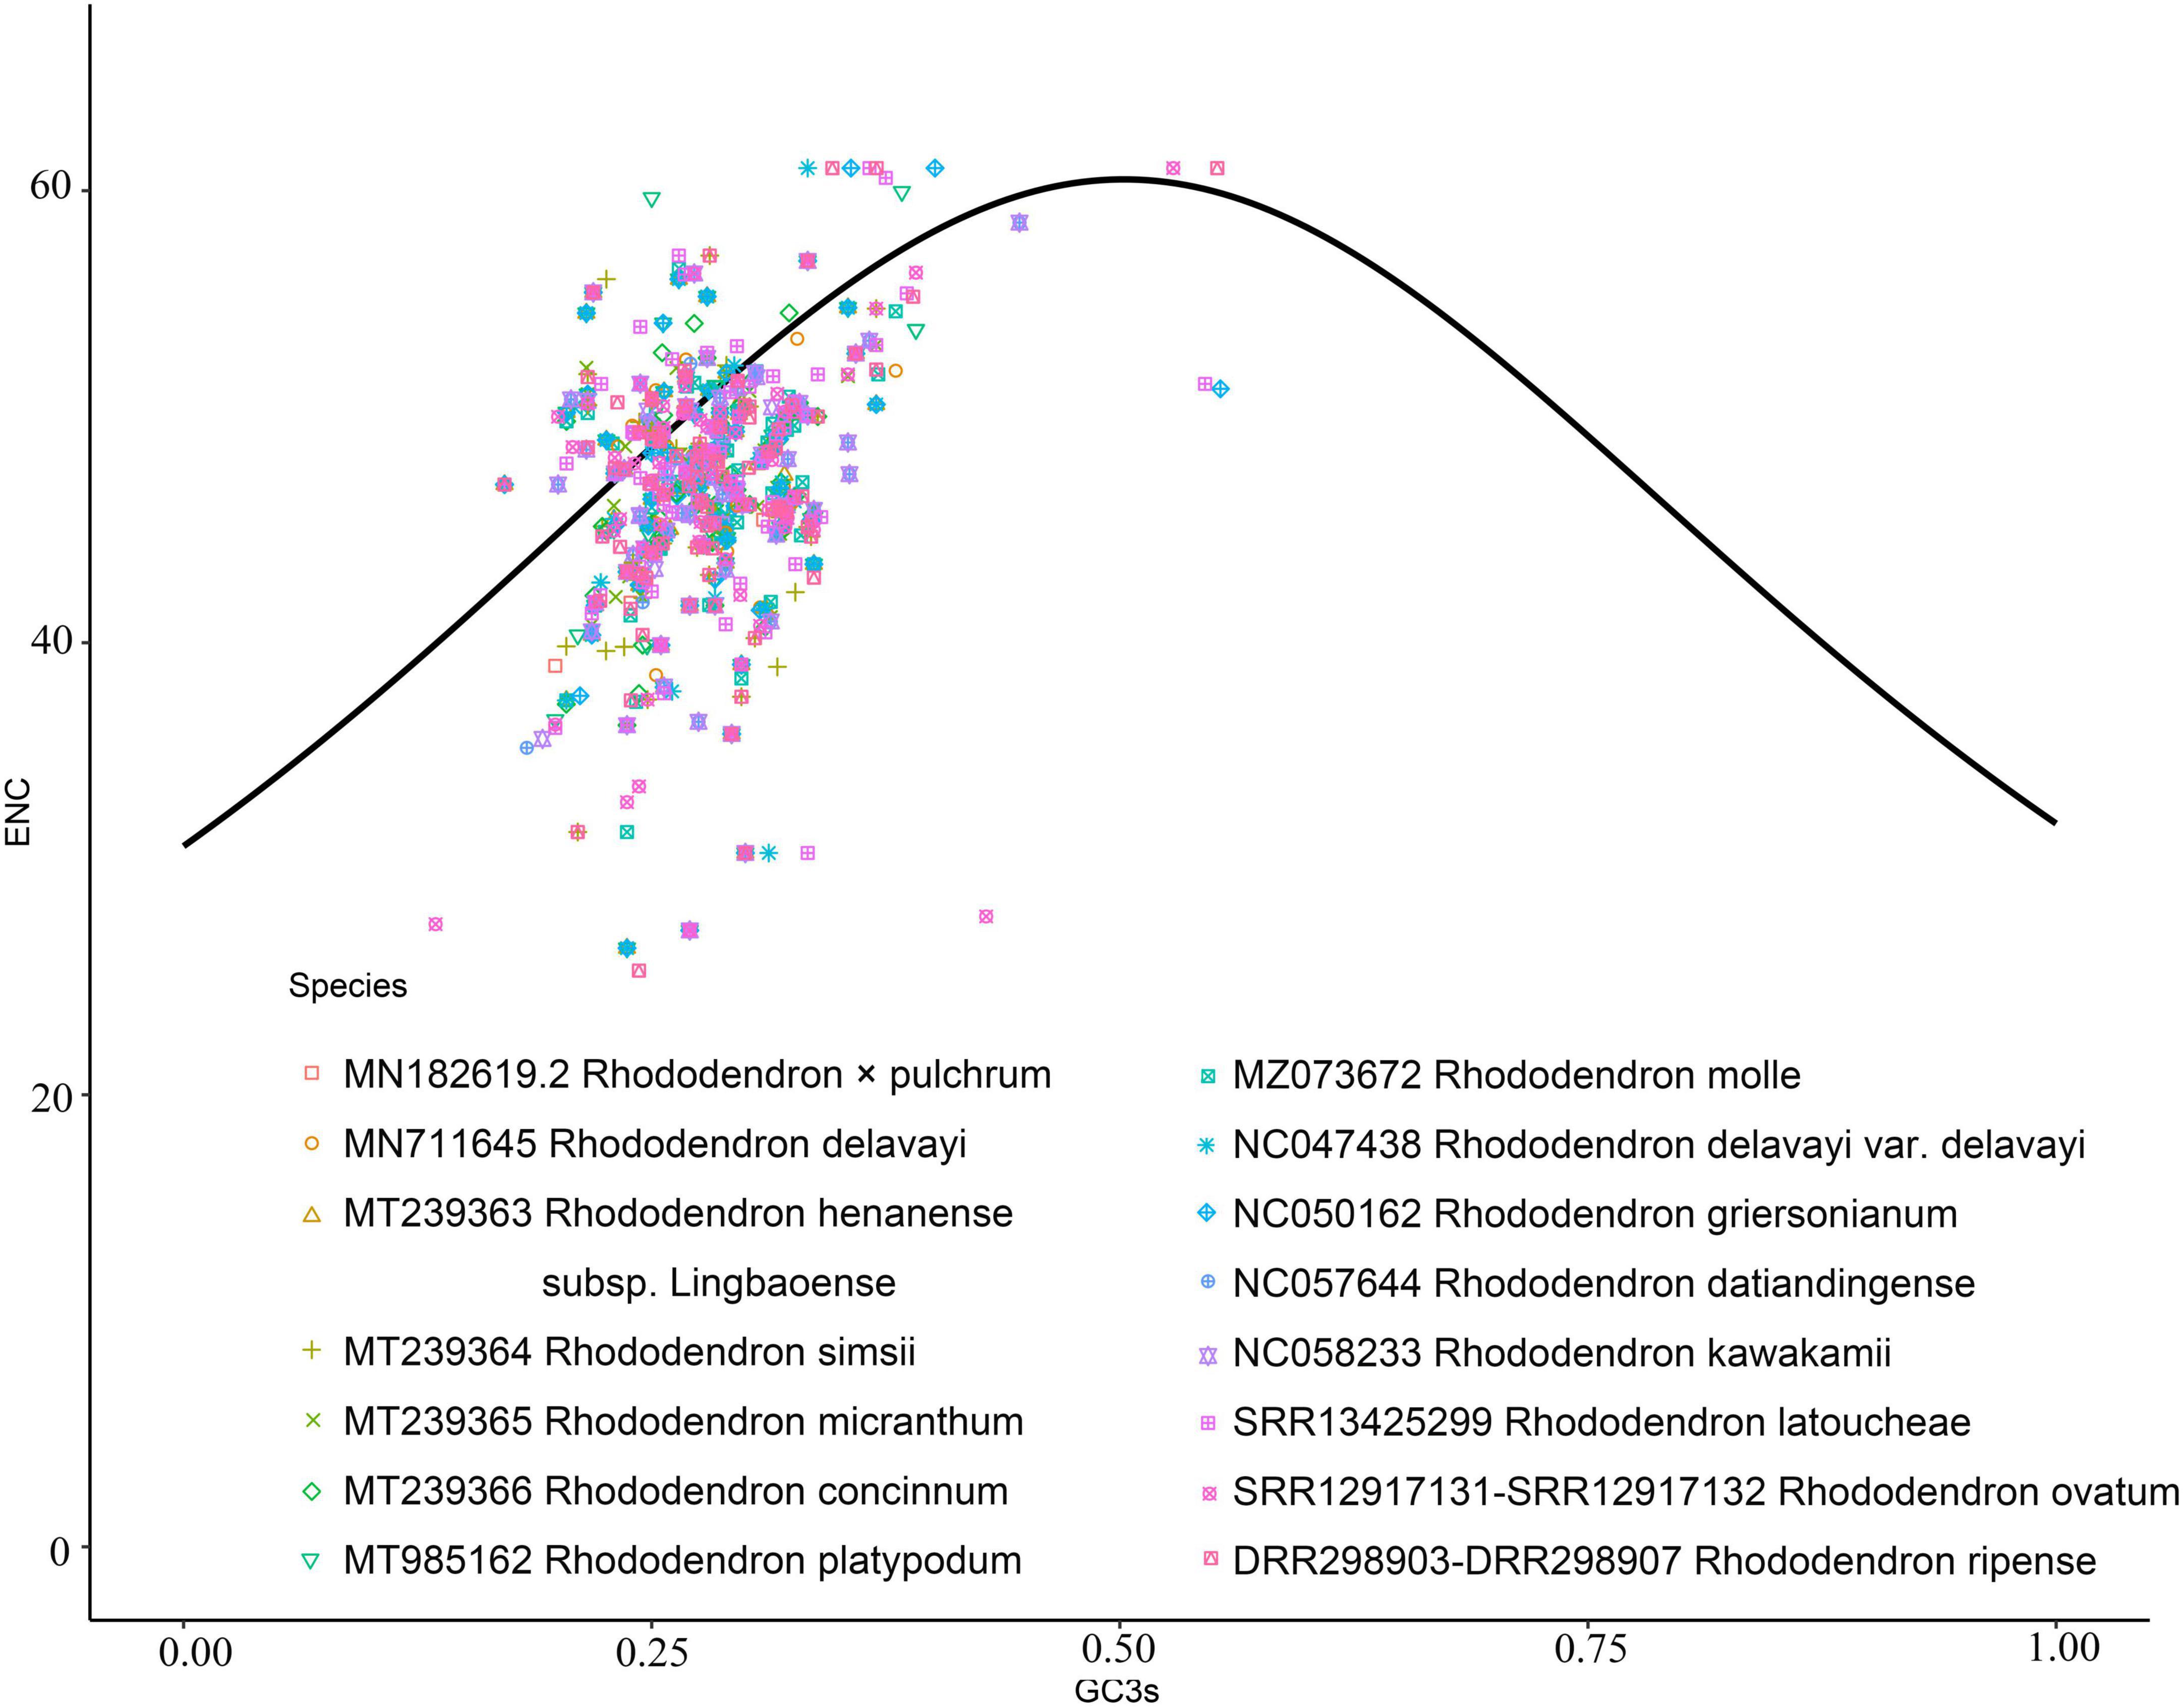
Figure 8. ENC Plot analysis of genes in 12 Rhododendron species chloroplast genomes. (Y-axis: Effective number of codons value of gene; X-axis: GC3 content of gene; Standard curve line is calculated as follows: ENC = 2 + GC3 + 29/(GC32 + (1-GC3)2).
Gene transfer among mitochondrial and chloroplast genomes
The length of the mitochondrial genome sequence (816,410 bp) was found to be approximately 5.6 times longer than the chloroplast genome (146,941 bp) of R. × pulchrum. Thirteen homologous fragments containing gene sequences were identified between the chloroplast and mitochondrial genomes of R. × pulchrum (Table 4). The fragments ranged from 68 to 1,799 bp and retained > 70% of their sequence identity with their original chloroplast counterparts. These fragments had a total length of 4,447 bp, accounting for 0.54 and 3.03% of the mitochondrial and chloroplast genomes, respectively. Three mitochondrial genes were identified: trnM-CAU, trnD-GUC, and ycf68. A total of 13 chloroplast genes were identified, including trnA-UGC, trnD-GUC, trnI-GAU, trnM-CAU, trnT-UGU, psbF, psbL, psbD, ndhA, ndhF, rrn16, rrn23, and ycf68.
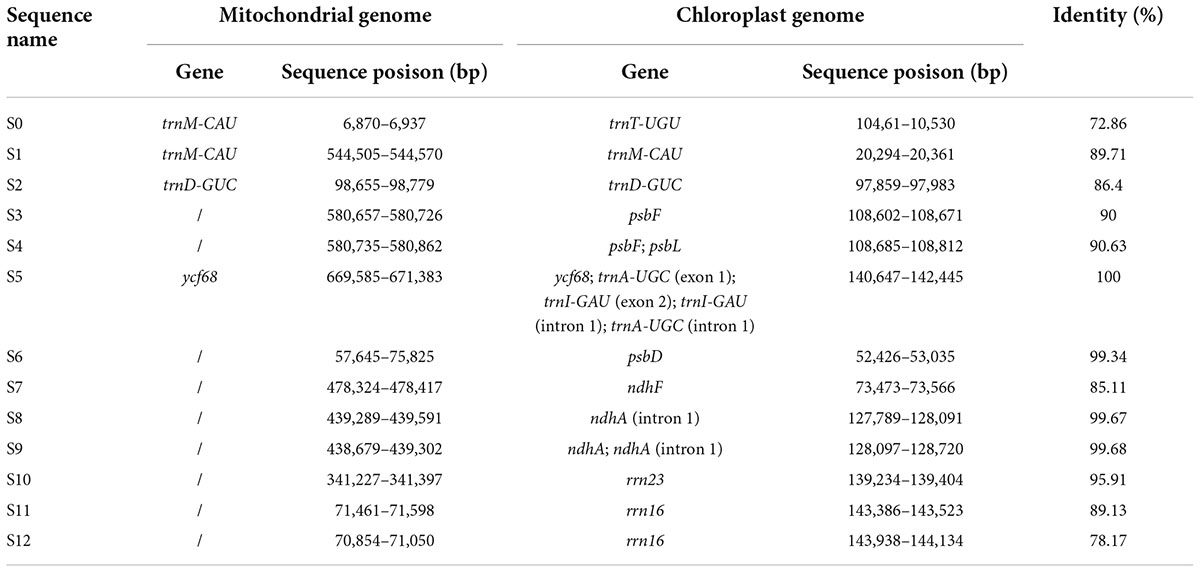
Table 4. Gene transfer among mitochondrial and chloroplast genomes of Rhododendron × pulchrum.
Discussion
Mitochondrial genome structure and size variations
Plant mitochondrial genomes usually have a typical circular structure (Sloan et al., 2018), while in some species, the mitochondrial genomes showed linear or multichromosomal architecture, such as Silene conica and Chenopodium album (Backert and Borner, 2000; Sloan et al., 2012; Sanchez-Puerta et al., 2017). Plant mitochondrial genomes have a broad distribution in size, usually ranging from 66 to 11,000 kb (Wu et al., 2022). The mitochondrial genome of R. × pulchrum was identified as a lineage DNA molecule with 816,410 bp. The mitochondrial genome of R. simsii showed a lineage DNA molecule with 802,707 bp (Xu et al., 2021), while V. macrocarpon showed a single circular scaffold with 468,115 bp (Luis et al., 2019). In plant taxonomy, R. simsii and R. × pulchrum belong to the Rhododendron genus of Ericaceae, and V. macrocarpon belongs to the Vaccinioideae of Ericaceae. The size of the assembly mitochondrial genomes for the 11 species of Ericales ranged from 425,282 to 816,410 nucleotides; in the 5 species of Ericaceae, they ranged from 459,678 to 816,410 nucleotides. Previous studies have shown that plant mitochondrial genomes can exhibit wide variations among species (Wu et al., 2022). These results showed that the changes in the structure and size of the mitochondrial genomes of the Ericales species varied widely, which may be related to species evolution and phylogenetic affinities. The structure and size of mitochondrial genomes among the closely related species are closer, such as between R. simsii and R. × pulchrum (Xu et al., 2021) and between C. sinensis and C. sinensis var. Assamice (Zhang et al., 2019), indicating that the mitochondrial genome may be a potential strategy for studying the evolution of plants and identifying species taxa (Li et al., 2018; Zubaer et al., 2018).
The mitochondrial genome of R. × pulchrum is the longest genome reported thus far for species of the Ericales, containing 36 protein coding genes, 3 rRNA genes, and 24 tRNA genes, similar to R. simsii (Xu et al., 2021) and C. sinensis var. Assamice (Zhang et al., 2019). However, multiple copies of genes are completely different in the mitochondrial genomes of the three different species from Ericales: R. × pulchrum, R. simsii, and C. sinensis var. Assamice. Moreover, there were more annotated genes in the C. sinensis var. Assamice mitochondrial genome than in R. × pulchrum, with related genes including rrn16, rpl2, rpl16, rps7, rps13, rps19, and trnfM. Multichromosomal genomes in plants have been found in variable copy numbers (Alverson et al., 2011; Wu et al., 2015), while mitochondrial gene copy numbers have no more detailed data, which may be due to the limited data of plant mitochondria until now. The mitochondrial genes atp1 and matR are conserved and have been used to study phylogenetic interrelationships in Ericales (Anderberg et al., 2002). These results were consistent with our study. Thus, plant mitochondrial genomes are needed for further research and will provide novel insights into genome evolution and molecular markers of these diversely structured genomes.
Chloroplast genome structure and size variations
Previous studies have confirmed that whole chloroplast genome sequencing data using second-generation sequencing technology (Illumina Hiseq Platform) are reliable (Zhang et al., 2019; Xu et al., 2021). Using second-generation sequencing technology, the complete chloroplast genome of R. × pulchrum was found to be 136,249 bp in length, without a typical quadripartite structure due to missing inverted repeats, and the GC content was 35.98%. In total, 73 functional genes were identified, including 2 rRNA genes, 29 tRNA genes, and 42 protein-coding genes (Shen et al., 2020). In this study, second- and TGS technologies were used to reassemble and reannotate the complete chloroplast genome of R. × pulchrum. Our new results showed that the complete R. × pulchrum chloroplast genome was 146,941 bp in length (Figure 5); it lacked a typical quadripartite structure, and the GC content showed no significant change compared with the results of previous research. However, the complete chloroplast genome of R. × pulchrum contained 119 annotated genes; 46 more genes were annotated than in previous studies, including 5 tRNA genes, 2 rRNA genes, and 39 protein-coding genes (mRNA) (Table 1). The previously published plastid genome of R. × pulchrum was sequenced with the Illumina Hiseq Platform (Shen et al., 2019, 2020). In this study, we used TGS methods combined with second-generation sequencing technology to detect the complete plastid genomes of R. × pulchrum. The sequencing results of the two methods were compared using Lastz software for investing the accuracy of the results. Complete chloroplast genome collinear alignment compared between MN182619.1 and MN182619.2 of Rhododendron × pulchrum had been shown in Figure 9A. The comparison results found there have multiple breakage and inversion sites, 6 of this breakage sites with long segment (10,000–30,000 bp) were selected to design primers for PCR experiments (Supplementary Table 16). The PCR results meet the expected size (Figure 9B) and the sequencing results were consistent with MN182619.2 (Figure 9C). Our study illustrated that TGS technology (Oxford Nanopore Platform) could improve the accuracy of coverage and assembly of previously unassembled genomic regions, and guarantee the accuracy of the length and content of the genomes. Third-generation sequencing technology may be a useful tool to explain plant organelle genome information (Shearman et al., 2016) for TGS methods with a long-read length.
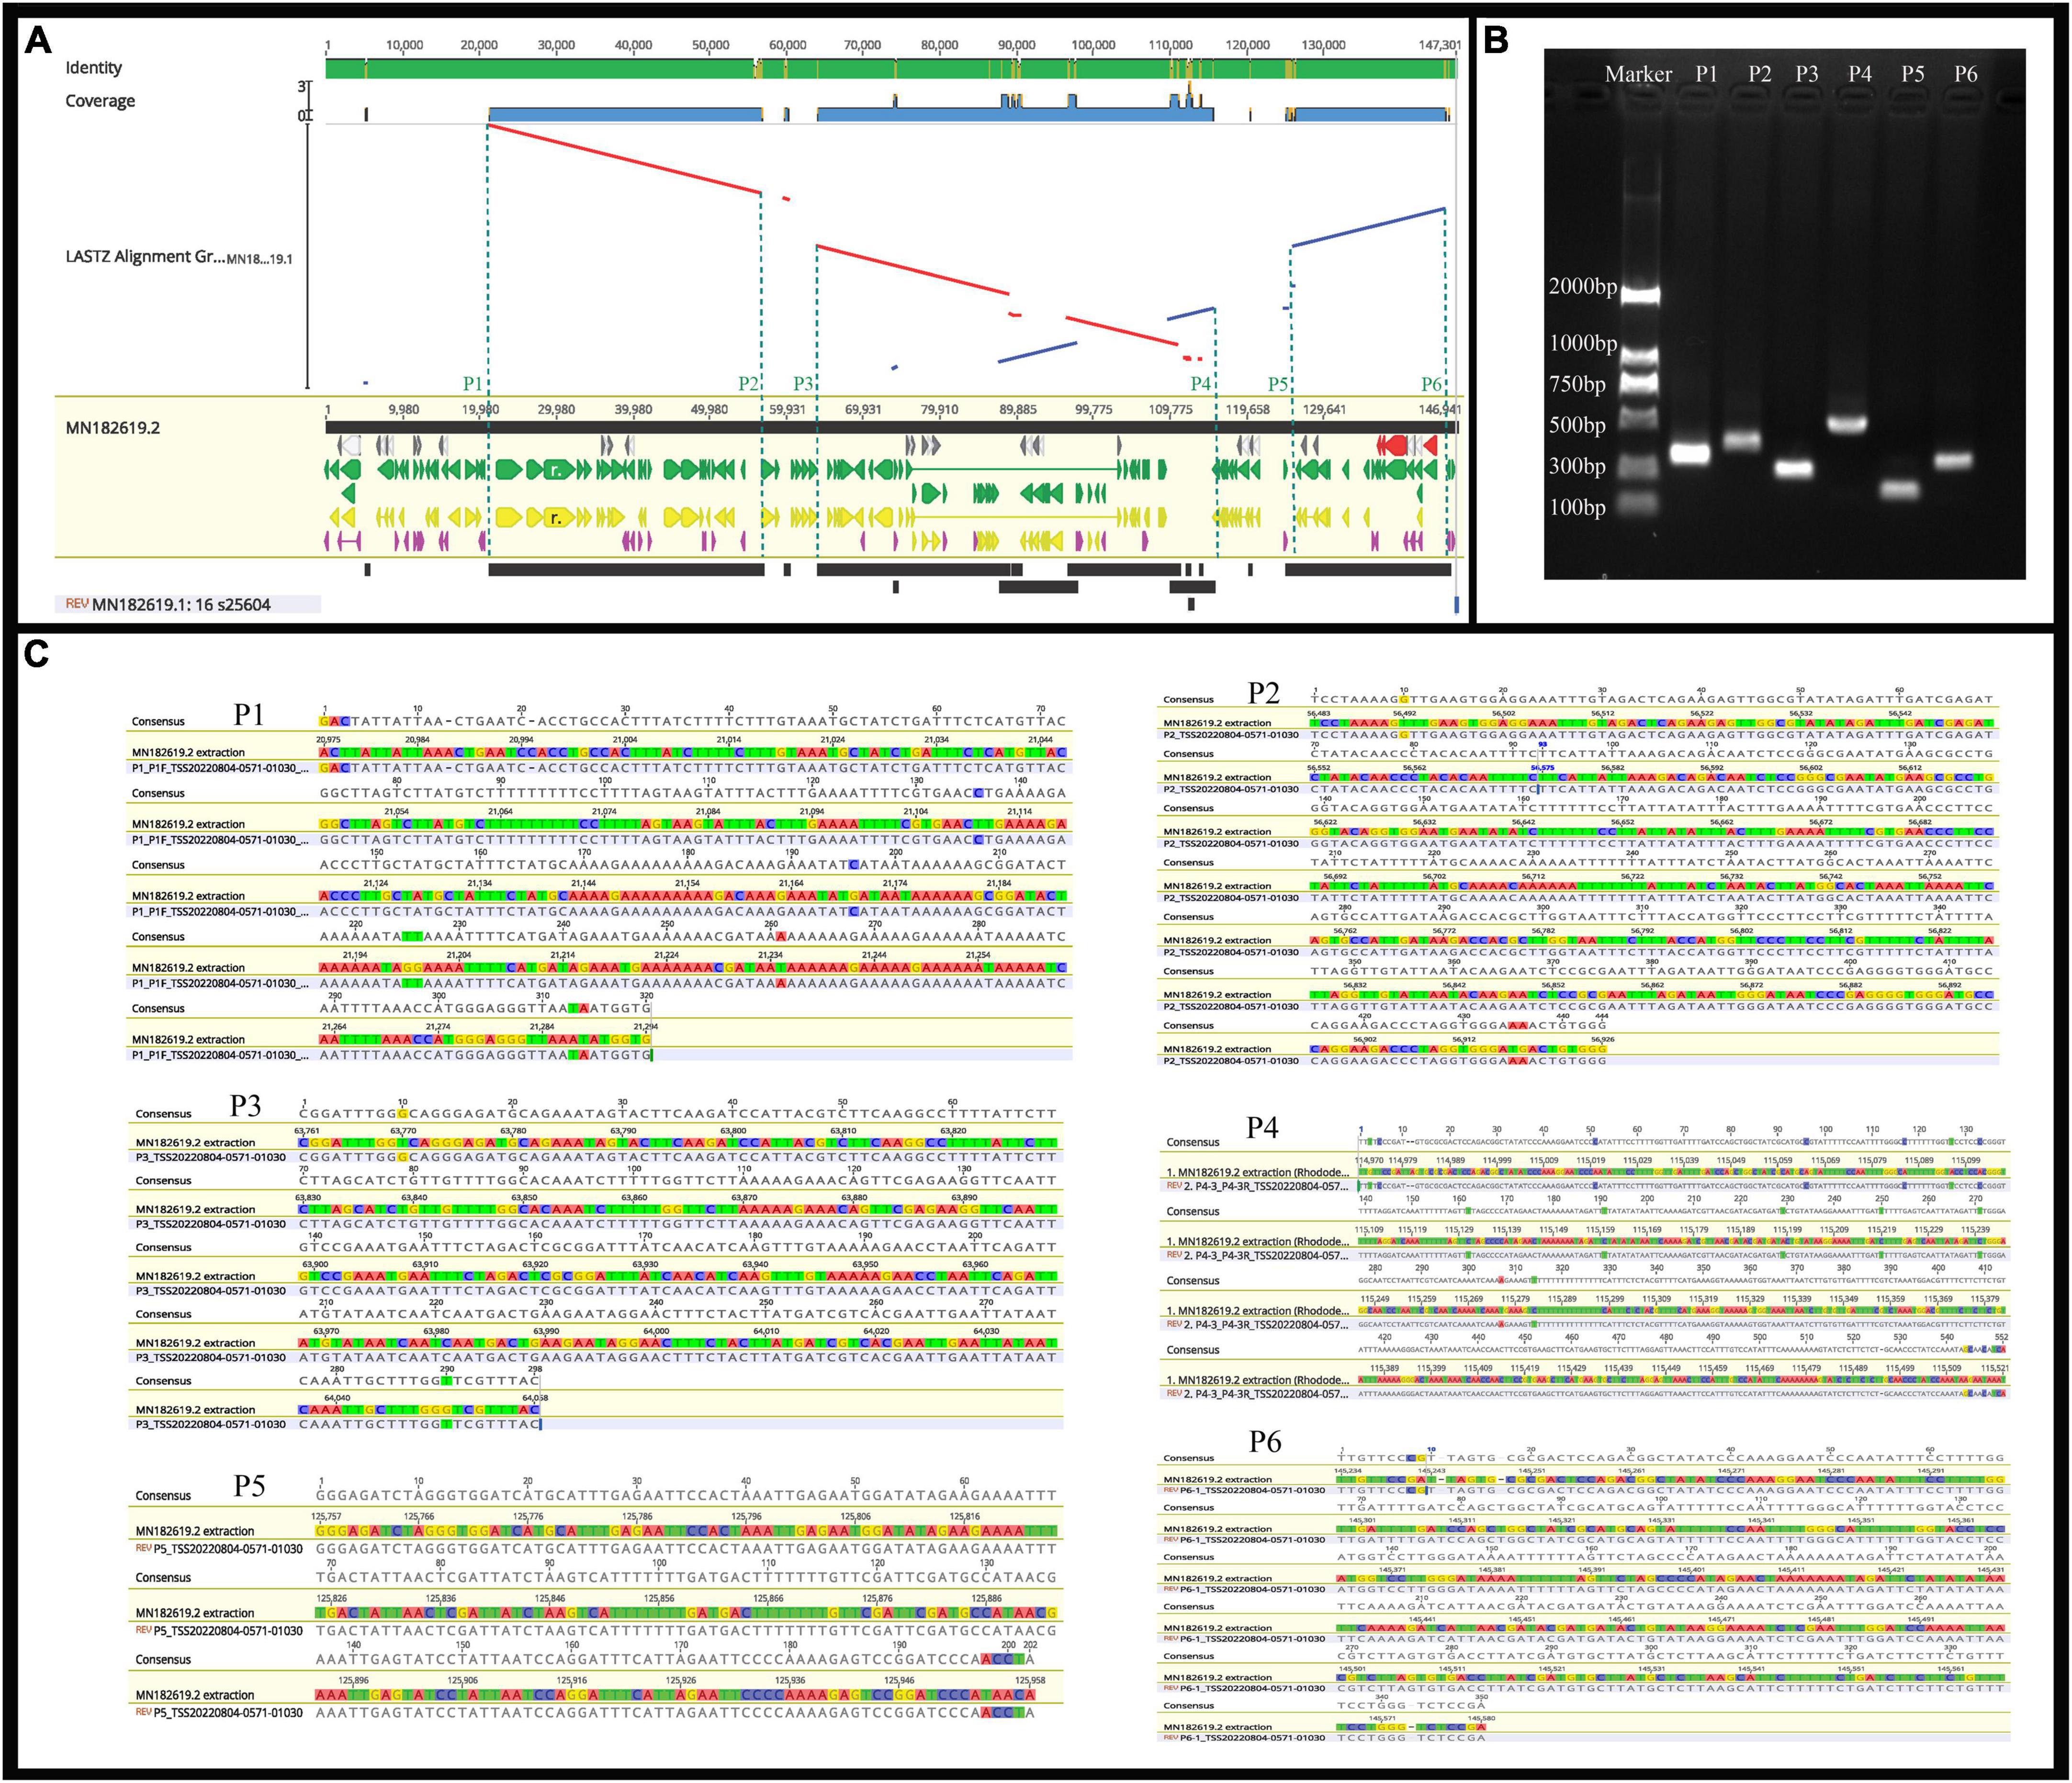
Figure 9. The identified of the results between MN182619.1 and MN182619.2. (A) Complete chloroplast genome collinear alignment compared between MN182619.1 and MN182619.2 of Rhododendron × pulchrum. MN182619.1 as the reference; blue bars represent homologous high-scoring segment pairs in a codirectional orientation, whereas red bars represent reversed pairs. Yellow arrows represent coding sequences, red arrows represent ribosomal RNA genes, purple arrows represent transfer RNA genes, green arrows represent protein-coding genes, and gray arrows represent exonic regions. Black squares represent homology; the larger the number, the larger the area of the black squares, and the more closely related species have homologous fragments. Red wireframes are the most conservative regions. The P1∼P6 sites located in 21,232, 56,637, 63,979, 115,230, 125,853, and 145,493 bp position of MN182619.2. (B) PCR products detection. (The P1∼P6 sites located in 21,232, 56,637, 63,979, 115,230, 125,853, and 145,493 bp position of MN182619.2; the expected size of the P1∼P6 are 355, 444, 300, 581, 201, and 348 bp, respectively). (C) Results of PCR compared with plastid genomes fasta (MN182619.2) that assembled with third-generation combined with second-generation sequencing methods. [A∼E (P1∼P6): Six broken sites were randomly selected from the result of collinearly aligned (LASTZ) of MN182619.1 and MN182619.2, as shown in Figure 5. The upper numbers indicate PCR results, the lower numbers indicate the point of plastid genomes fasta that assembled with third-generation combined with second-generation sequencing methods].
According to the published data, the plastid genomes of most plants are display the typical quadripartite structure by showing the LSC, LSC, and two IRs (Wicke et al., 2011; Shen et al., 2020). Our results indicate that the R. × pulchrum cp genome lacks the IRs, this is inconsistent with Rhododendron delavayi (Li et al., 2020). The plastid genomes of Rhodordendron species are display different structure. These illustrating that the plastid genome may be a potential strategy for studying the evolution and identifying species taxa of Rhodordendron species (Li et al., 2018; Zubaer et al., 2018).
Phylogenetic and mitochondrial genome comparison
The mitochondrial and chloroplast phylogenetic trees of 8 species from Ericales and 15 species from Rhododendron showed results consistent with their taxonomic information. These results illustrate that organelle genome sequence data are suitable for studying phylogeny in plants (Wu and Ge, 2012; Thomas et al., 2017; Shen et al., 2020). The phylogenetic trees in this study showed that R. ripense was a sister to R. × pulchrum (Figures 2, 6). Previous studies indicated R. × pulchrum cultivar owned cpDNA of R. ripense (Shirasawa et al., 2021), and R. ripense is considered as one of the putative ancestral species of R. × pulchrum (Scariot et al., 2007; Meanchaipiboon et al., 2021), These findings are consistent with our study. The R. × pulchrum mitochondrial genome was used as a reference; a whole-genome collinear alignment compared among five species from the Ericaceae family found a high degree of homology with R. × pulchrum in the gene regions compared with interval regions. This illustrates that gene regions are more conserved than interval regions in the mitochondrial genomes of the Ericaceae species. The 11 conservative genes (atp4, ccmC, nad4, trnC-GCA, trnN-GUU, trnY-GUA, nad2, nad5, trnM-CAU, trnD-GUC, and rrn26) identified in this study will be useful for understanding the evolutionary mechanisms and identifying species taxa in Ericaceae (Li et al., 2018; Zubaer et al., 2018).
The mitochondrial genomes of R. × pulchrum and R. simsii were identified as 63 LCBs; these LCBs differed substantially in size and relative position (Figure 4). Moreover, most LCBs contain gene sequences. Our results indicate that gene sizes are not significantly different (Xu et al., 2021). Although many genes have rearrangements between R. × pulchrum and R. simsii mitochondrial genomes, there are very complex variations in their mitochondrial genomes, which may be resulting in hybridization and genome doubling events. These results are consistent with a previous study that showed high variation and recombination in plant mitochondrial genomes (Galtier, 2011). Moreover, gene order in plant mitochondrial genomes is highly variable (Fischer et al., 2006; Schoch et al., 2015; Li et al., 2017). The arrangement of genes in mitochondria may be used to assess phylogenetic relationships among different species (Li et al., 2017).
Codon usage bias patterns and evolution
Codon usage bias are usually used in animals and insects to analysis phylogenetic and evolution of different species, however, there are few reports on plants (Sun et al., 2009; Huang and Ma, 2018). The gene codon usage bias of mitochondrial chloroplast genes with low ENC values (ENC < 35; Supplementary Tables 13, 14) maybe caused by mutation, while the codon usage bias of the other genes are caused by choice or other factors (Wright, 1990). Thus, we can infer the gene codon usages bias of only 10 Ericaceae mitochondrial genes (atp4, atp6, ccmFc, nad1, nad9, rpl10, rps3, rps10, rps12, and rps19) and 7 Rhododendron chloroplast genes (atpH, ndhH, petL, psaC, psbM, rpl23, and rps11) were influenced by mutation, while other genes codon usage bias had undergone natural or artificial selection. NEC plot analysis of mitochondrial genes showed the codon usages of the genes between R. × pulchrum and R. simsii are consistent, the gene codon usages in Rhododendron species from the same subgenus or subsection species in chloroplasts genomes are also consistent. These results showed NEC plot analysis of mitochondrial and chloroplast genomes maybe suitable for evolutionary analysis of Ericaceae plants.
Gene transfer between mitochondrial and chloroplast genomes
Previous research has detected intracellular gene transfer between different genomes, which has been disclosed through sequencing analysis of nuclear, mitochondrial, and chloroplast genomes (Timmis et al., 2004; Nguyen et al., 2020). Most of these studies focused on the gene transfer of nuclear DNA from the organelle in angiosperms (Smith, 2011; Park et al., 2014). With the development of new techniques, increasing organelle genome data have been published and analyzed, and chloroplast-to-mitochondrial gene transfer has been considered a characteristic feature of long-term evolution (Gui et al., 2016; Nguyen et al., 2020). In this study, 13 homologous fragments containing gene sequences were identified between the chloroplast and mitochondrial genomes of R. × pulchrum (Table 4), which may be the result of horizontal gene transfer between organelle genomes. In mitochondrial genomes of R. × pulchrum, 10 chloroplast genes have not been annotated, including 3 tRNA (trnA-UGC, trnI-GAU, and trnT-UGU), 2 ribosomal genes (rrn16 and rrn23), 3 photosynthetic genes (psbF, psbL, and psbD), and 2 NADH dehydrogenase genes (ndhA and ndhF), but contain their homologous fragments (Table 4). Ribosomal genes participate in the synthesis of the ribosomal complex, which participates in the proteins required for normal cell function (Depamphilis and Palmer, 1990; Wang et al., 2019). The photosynthetic genes and NADH dehydrogenase genes participate in the synthesis of photosynthetic system II and chloroplast NADH dehydrogenase complex, which are involved in photosynthesis (Sazanov et al., 1998; Cai et al., 2021). It is speculated that these genes related to photosynthesis, such as psbF, psbL, psbD, ndhA, and ndhF, may be the result of chloroplast genes transferred to mitochondria in R. × pulchrum. Further research on plant mitochondrial and chloroplast genomes is needed and will provide novel insight into genome evolution, phylogenetic relationships, and molecular markers of these diversely structured genomes.
Conclusion
This study detected the complete mitochondrial genome and reassembled the chloroplast genome of R. × pulchrum. Genome organization features, genome comparison with related species, and gene transfer among mitochondrial and chloroplast genomes were researched. Phylogenetic relationships, codon usage bias patterns and evolution were compared with related species. Our results R. × pulchrum revealed that the organelles genome variation of Ericaceae species is very complex. Our results will be useful for understanding the evolutionary mechanisms and identifying species taxa in Ericaceae.
Data availability statement
The datasets presented in this study can be found in online repositories. The names of the repository/repositories and accession number(s) can be found in the article/Supplementary material.
Author contributions
JS and SJ: conceptualization, validation, resources, data curation, and writing—original draft preparation, review and editing. XL and ML: methodology. ML, XH, and HC: software. SJ: funding acquisition. All authors have read and agreed to the published version of the manuscript.
Funding
This research was funded by the National Key Research and Development Project (2019YFE0118900), the National Natural Science Foundation of China (31971641 and 32201608), the Zhejiang Provincial Natural Science Foundation of China (LY16C160011), and the Jiyang College of Zhejiang A&F University under grant (RQ1911B07).
Conflict of interest
Author ML was employed by the company Bio and Data Biotechnology Co., Ltd.
The remaining authors declare that the research was conducted in the absence of any commercial or financial relationships that could be construed as a potential conflict of interest.
Publisher’s note
All claims expressed in this article are solely those of the authors and do not necessarily represent those of their affiliated organizations, or those of the publisher, the editors and the reviewers. Any product that may be evaluated in this article, or claim that may be made by its manufacturer, is not guaranteed or endorsed by the publisher.
Supplementary material
The Supplementary Material for this article can be found online at: https://www.frontiersin.org/articles/10.3389/fpls.2022.969765/full#supplementary-material
Footnotes
References
Alverson, A. J., Rice, D. W., Dickinson, S., Barry, K., and Palmer, J. D. (2011). Origins and recombination of the bacterial-sized multichromosomal mitochondrial genome of cucumber. Plant Cell 23, 2499–2513. doi: 10.1105/tpc.111.087189
Anderberg, A. A., Rydin, C., and Källersjö, M. (2002). Phylogenetic relationships in the order ericales s.l.: Analyses of molecular data from five genes from the plastid and mitochondrial genomes. Am. J. Bot. 89, 677–687. doi: 10.3732/ajb.89.4.677
Backert, S., and Borner, T. (2000). Phage T4-like intermediates of DNA replication and recombination in the mitochondria of the higher plant Chenopodium album (L.). Curr. Genet. 37, 304–314. doi: 10.1007/s002940050532
Bankevich, A., Nurk, S., Antipov, D., Gurevich, A. A., Dvorfin, M., Kulikov, A. S., et al. (2012). SPAdes: A new genome assembly algorithm and its applications to single-cell sequencing. J. Comput. Biol. 19, 455–477. doi: 10.1089/cmb.2012.0021
Benson, G. (1999). Tandem repeats finder: A program to analyze DNA sequences. Nucleic Acids Res. 27, 573–580. doi: 10.1093/nar/27.2.573
Cai, X. L., Landis, J. B., Wang, H. X., Wang, J. H., Zhu, Z. X., and Wang, H. F. (2021). Plastome structure and phylogenetic relationships of Styracaceae (Ericales). BMC Ecol. Evol. 21:103. doi: 10.1186/s12862-021-01827-4
Chen, S., Zhou, Y., Chen, Y., and Gu, J. (2018). fastp: An ultra-fast all-in-one FASTQ preprocessor. Bioinformatics 34, i884–i890. doi: 10.1101/274100
Darling, A. C. E., Mau, B., Blattner, F. R., and Perna, N. T. (2004). Mauve: Multiple alignment of conserved genomic sequence with rearrangements. Genome Res. 14, 1394–1403. doi: 10.1101/gr.2289704
Depamphilis, C. W., and Palmer, J. D. (1990). Loss of photosynthetic and chlororespiratory genes from the plastid genome of a parasitic flowering plant. Nature 348, 337–339. doi: 10.1038/348337a0
Doyle, J. J. (1987). A rapid DNA isolation procedure for small quantities of fresh leaf tissue. Phytochem. Bull. 19, 11–15.
Fischer, G., Rocha, E. P., Brunet, F., Vergassola, M., and Dujon, B. (2006). Highly variable rates of genome rearrangements between hemiascomycetous yeast lineages. PLoS Genet. 2:e32. doi: 10.1371/journal.pgen.0020032
Galtier, N. (2011). The intriguing evolutionary dynamics of plant mitochondrial DNA. BMC Biol. 9:61. doi: 10.1186/1741-7007-9-61
Gray, M. W. (2012). Mitochondrial evolution. CSH Perspect. Biol. 4:a011403. doi: 10.1126/science.283.5407.1476
Greiner, S., Lehwark, P., and Bock, R. (2019). Organellar genome DRAW (OGDRAW) version 1.3. 1: Expanded toolkit for the graphical visualization of organellar genomes. Nucleic Acids Res. 47, W59–W64. doi: 10.1093/nar/gkz238
Gui, S. T., Wu, Z. H., Zhang, H. Y., Zheng, Y. Z., Zhu, Z. X., Liang, D. Q., et al. (2016). The mitochondrial genome map of Nelumbo nucifera reveals ancient evolutionary features. Sci. Rep. 6:11. doi: 10.1038/srep30158
Harris, R. S. (2007). Improved pairwise alignmnet of genomic DNA. Ph.D. thesis. State College, PA: The Pennsylvania State University.
Huang, J., and Ma, T. (2018). Comparative analysis of two mitochondrial genomes of flesh flies (Sarcophaga antilope and Sarcophaga dux) with phylogeny and evolutionary timescale for sarcophagidae. Int. J. Biol. Macromol. 120, 1955–1964. doi: 10.1016/j.ijbiomac.2018.10.001
Huang, J., Liang, X. M., Xuan, Y. K., Geng, C. Y., and Li, Y. X. (2017). A reference human genome data set of the BGISEQ-500 sequencer. Gigascience 6, 1–9. doi: 10.1093/gigascience/gix024
Jansen, R. K., Saski, C., Lee, S., Hansen, A. K., and Daniell, H. (2011). Complete plastid genome sequences of three rosids (Castanea, Prunus, Theobroma): Evidence for at least two independent transfers of rpl22 to the nucleus. Mol. Biol. Evol. 28, 835–847. doi: 10.1093/molbev/msq261
Katoh, K., and Standley, D. M. (2013). MAFFT multiple sequence alignment software version 7: Improvements in performance and usability. Mol. Biol. Evol. 30, 772–780. doi: 10.1093/molbev/mst010
Kearse, M., Moir, R., Wilson, A., Stones-Havas, S., Cheung, M., Sturrock, S., et al. (2012). Geneious basic: An integrated and extendable desktop software platform for the organization and analysis of sequence data. Bioinformatics 28, 1647–1649. doi: 10.1093/bioinformatics/bts199
Knoop, V. (2004). The mitochondrial DNA of land plants: Peculiarities in phylogenetic perspective. Curr. Genet. 46, 123–139. doi: 10.1007/s00294-004-0522-8
Kobayashi, N., Nakatsuka, A., Ohta, H., Kurashige, Y., Huylenbroeck, J. V., Scariot, V., et al. (2021). Contribution of the Rhododendron ripense Makino chloroplast genome to the development of evergreen azalea cultivars. Hort. J. 90, 223–231. doi: 10.2503/hortj.UTD-251
Koren, S., Walenz, B. P., Berlin, K., Miller, J. R., Bergman, N. H., and Phillippy, A. M. (2017). Canu: Scalable and accurate long-read assembly via adaptive k-mer weighting and repeat separation. Genome Res. 27, 722–736. doi: 10.1101/gr.215087.116
Langmead, B., and Salzberg, S. L. (2012). Fast gapped-read alignment with Bowtie 2. Nat. Methods 9, 357–359. doi: 10.1038/nmeth.1923
Li, H. (2018). Minimap2: Pairwise alignment for nucleotide sequences. Bioinformatics 34, 3094–3100. doi: 10.1093/bioinformatics/bty191
Li, H., Guo, Q., Li, Q., and Yang, L. (2020). Long-reads reveal that Rhododendron delavayi plastid genome contains extensive repeat sequences, and recombination exists among plastid genomes of photosynthetic ericaceae. PeerJ 8:e9048. doi: 10.7717/peerj.9048
Li, Q., Yang, M., Chen, C., Xiong, C., Jin, X., Pu, Z. Q., et al. (2018). Characterization and phylogenetic analysis of the complete mitochondrial genome of the medicinal fungus Laetiporus sulphureus. Sci. Rep. 8:9104. doi: 10.1038/s41598-018-27489-9
Li, X., Xu, X. X., Zhang, F., Wang, M., Xu, Y., Tang, D., et al. (2017). The mitochondria-targeted antioxidant mitoq ameliorated tubular injury mediated by mitophagy in diabetic kidney disease via nrf2/pink1. Redox Biol. 11, 297–311. doi: 10.1016/j.redox.2016.12.022
Luis, D. G., Lorraine, R. B., Jessica, R., Tyler, S., and Juan, Z. (2019). Pacbio sequencing reveals identical organelle genomes between american cranberry (Vaccinium macrocarpon Ait.) and a wild relative. Genes 10:291. doi: 10.3390/genes10040291
Meanchaipiboon, S., Kobayashi, N., and Nakatsuka, A. (2021). Genetic relationships among Hirado azalea cultivars and their putative parents inferred from flavonoid 3’, 5’ hydroxylase gene sequences. Hort. J. 90, 114–121. doi: 10.2503/hortj.UTD-228
Nguyen, V. B., Giang, V. N. L., Waminal, N. E., Park, H. S., Kim, N. H., Jang, W., et al. (2020). Comprehensive comparative analysis of chloroplast genomes from seven Panax species and development of an authentication system based on species-unique single nucleotide polymorphism markers. J. Ginseng Res. 44, 135–144. doi: 10.1016/j.jgr.2018.06.003
Park, S., Ruhlman, T. A., Sabir, J. S. M., Mutwakil, M. H. Z., Baeshen, M. N., Sabir, M. J., et al. (2014). Complete sequences of organelle genomes from the medicinal plant Rhazya stricta (Apocynaceae) and contrasting patterns of mitochondrial genome evolution across asterids. BMC Genom. 15:405. doi: 10.1186/1471-2164-15-405
Parkinson, C. L., Mower, J. P., Qiu, Y. L., Shirk, A. J., Song, K., Young, N. D., et al. (2005). Multiple major increases and decreases in mitochondrial substitution rates in the plant family Geraniaceae. BMC Evol. Biol. 5:73. doi: 10.1186/1471-2148-5-73
Peden, and John, F. (2000). Analysis of codon usage, Vol. 9. Nottingham: University of Nottingham, 73–74. doi: 10.0.3.238/expr.1997.4185
Price, M. N., Dehal, P. S., and Arkin, A. P. (2010). FastTree 2–approximately maximum-likelihood trees for large alignments. PLoS One 5:e9490. doi: 10.1371/journal.pone.0009490
Rice, P., Longden, I., and Bleasby, A. (2000). EMBOSS: The European molecular biology open software suite. Trends Genet. 16, 276–277. doi: 10.1016/S0168-9525(00)02024-2
Sanchez-Puerta, M. V., García, L. E., Wohlfeiler, J., and Ceriotti, L. F. (2017). Unparalleled replacement of native mitochondrial genes by foreign homologs in a holoparasitic plant. New Phytol. 214, 376–387. doi: 10.1111/nph.14361
Sazanov, L. A., Burrows, P. A., and Nixon, P. J. (1998). The plastid ndh genes code for an NADH-specifc dehydrogenase: Isolation of a complex I analogue from pea thylakoid membranes. Proc. Natl. Acad. Sci. U.S.A. 95, 1319–1324. doi: 10.1073/pnas.95.3.1319
Scariot, V., Handa, T., and Riek, J. D. (2007). A contribution to the classification of evergreen azalea cultivars located in the lake maggiore area (italy) by means of AFLP markers. Euphytica 158, 47–66. doi: 10.1007/s10681-007-9425-3
Schoch, C. L., Seifertb, K. A., Huhndorfc, S., Robertd, V., Spougea, J. L., Levesqueb, C. A., et al. (2015). Nuclear ribosomal internal spacer (ITS) region as a universal DNA barcode marker for fungi. Proc. Natl. Acad. Sci. U.S.A. 109, 6241–6246. doi: 10.1073/pnas.1117018109
Sharp, P. M., and Li, W. H. (1986). Codon usage in regulatory genes in Escherichia coli does not reflect selection for ‘rare’ codons. Nucleic Acids Res. 14, 7737–7749. doi: 10.1093/nar/14.19.7737
Shearman, J. R., Sonthirod, C., Naktang, C., Pootakham, W., Yoocha, T., Sangsrakru, D., et al. (2016). The two chromosomes of the mitochondrial genome of a sugarcane cultivar: Assembly and recombination analysis using long PacBio reads. Sci. Rep. 6:31533. doi: 10.1038/srep31533
Shen, J. S., Li, X. Q., Zhu, X. T., Huang, X. L., and Jin, S. H. (2019). Complete chloroplast genome of Rhododendron pulchrum, an ornamental medicinal and food tree. Mitochondrial DNA B 4, 3527–3528. doi: 10.1080/23802359.2019.1676181
Shen, J. S., Li, X. Q., Zhu, X. T., Huang, X. L., and Jin, S. H. (2020). The complete plastid genome of Rhododendron pulchrum and comparative genetic analysis of Ericaceae species. Forests 11:158. doi: 10.3390/f11020158
Shirasawa, K., Kobayashi, N., Nakatsuka, A., Ohta, H., and Isobe, S. (2021). Whole-genome sequencing and analysis of two azaleas, rhododendron ripense and rhododendron kiyosumense. DNA Res. 28, 1–7. doi: 10.1093/dnares/dsab010
Sloan, D. B., Alverson, A. J., Chuckalovcak, J. P., Wu, M., McCauley, D. E., Palmer, J. D., et al. (2012). Rapid evolution of enormous, multichromosomal genomes in flowering plant mitochondria with exceptionally high mutation rates. PLoS Biol. 10:e1001241. doi: 10.1371/journal.pbio.1001241
Sloan, D. B., Wu, Z., and Sharbrough, J. (2018). Correction of persistent errors in Arabidopsis reference mitochondrial genomes. Plant Cell 30, 525–527. doi: 10.1105/tpc.18.00024
Smith, D. R. (2011). Extending the limited transfer window hypothesis to interorganelle DNA migration. Genome Biol. Evol. 3, 743–748. doi: 10.1093/gbe/evr068
Sugiura, M. (1995). The chloroplast genome. Essays Biochem. 30, 49–57. doi: 10.1007/978-94-011-2656-4_10
Sun, Z., Wan, D. G., Murphy, R. W., Ma, L., Zhang, X. S., and Huang, D. W. (2009). Comparison of base composition and codon usage in insect mitochondrial genomes. Genes Genom. 31, 65–71. doi: 10.1007/BF03191139
Thiel, T., Michalek, W., Varshney, R. K., and Graner, A. (2003). Exploiting EST databases for the development and characterization of gene-derived SSR-markers in barley (Hordeum vulgare L.). Theor. Appl. Genet. 106, 411–422. doi: 10.1007/s00122-002-1031-0
Thomas, W. A. B., Michael, B. B., Sasa, S., and John, V. F. (2017). On the brink: The highly reduced plastomes of nonphotosynthetic Ericaceae. New Phytol. 216:254. doi: 10.1111/nph.14681
Tillich, M., Lehwark, P., Pellizzer, T., Ulbricht-Jones, E. S., Fischer, A., Bock, R., et al. (2017). GeSeq–versatile and accurate annotation of organelle genomes. Nucleic Acids Res. 45, W6–W11. doi: 10.1093/nar/gkx391
Timmis, J. N., Ayliffffe, M. A., Huang, C. Y., and Martin, W. (2004). Endosymbiotic gene transfer: Organelle genomes forge eukaryotic chromosomes. Nat. Rev. Genet. 5, 123–U116. doi: 10.1038/nrg1271
Walker, B. J., Abeel, T., Shea, T., Priest, M., Abouelliel, A., Sakthikumar, S., et al. (2014). Pilon: An integrated tool for comprehensive microbial variant detection and genome assembly improvement. PLoS One 9:e112963. doi: 10.1371/journal.pone.0112963
Wang, L. Q., Zhang, H., Jiang, M., Chen, H., Huang, L., and Liu, C. (2019). Complete plastome sequence of Iodes cirrhosa Turcz the frst in the Icacinaceae, comparative genomic analyses and possible split of Idoes species in response to climate changes. PeerJ 7:e6663. doi: 10.7717/peerj.6663
Wick, R. R., Judd, L. M., Gorrie, C. L., and Holt, K. E. (2017). Unicycler: Resolving bacterial genome assemblies from short and long sequencing reads. PLoS Comput. Biol. 13:e1005595. doi: 10.1371/journal.pcbi.1005595
Wicke, S., Schneeweiss, G. M., DePamphilis, C. W., Müller, K. F., and Quandt, D. (2011). The evolution of the plastid chromosome in land plants: Gene content, gene order, gene function. Plant Mol. Biol. 76, 273–297. doi: 10.1007/s11103-011-9762-4
Wright, F. (1990). The ‘effective number of codons’ used in a gene. Gene 87, 23–29. doi: 10.1016/0378-1119(90)90491-9
Wu, Z. Q., and Ge, S. (2012). The phylogeny of the BEP clade in grasses revisited: Evidence from the whole-genome sequences of chloroplasts. Mol. Phylogenet. Evol. 62, 573–578. doi: 10.1016/j.ympev.2011.10.019
Wu, Z. Q., Liao, X. Z., Zhang, X. N., Tembrock, L. R., and Broz, A. (2022). Genomic architectural variation of plant mitochondria—a review of multichromosomal structuring. J. Syst. Evol. 60, 160–168. doi: 10.1111/jse.12655
Wu, Z., Cuthbert, J. M., Taylor, D. R., and Sloan, D. B. (2015). The massive mitochondrial genome of the angiosperm Silene noctiflflora is evolving by gain or loss of entire chromosomes. Proc. Natl. Acad. Sci. U.S.A. 112, 10185–10191. doi: 10.1073/pnas.1421397112
Xu, J., Luo, H., Nie, S., Zhang, R. G., and Mao, J. F. (2021). The complete mitochondrial and plastid genomes of Rhododendron simsii, an important parent of widely cultivated azaleas. Mitochondrial DNA B 6, 1197–1199. doi: 10.1080/23802359.2021.1903352
Zhang, F., Li, W., Gao, C., Zhang, D., and Gao, L. Z. (2019). Deciphering tea tree chloroplast and mitochondrial genomes of Camellia sinensis var. Assamica. Sci. Data 6:209. doi: 10.1038/s41598-018-35926-y
Keywords: Rhododendron, mitochondrial genome, chloroplast genome, gene transfer, phylogenetic
Citation: Shen J, Li X, Li M, Cheng H, Huang X and Jin S (2022) Characterization, comparative phylogenetic, and gene transfer analyses of organelle genomes of Rhododendron × pulchrum. Front. Plant Sci. 13:969765. doi: 10.3389/fpls.2022.969765
Received: 15 June 2022; Accepted: 30 August 2022;
Published: 21 September 2022.
Edited by:
Tangchun Zheng, Beijing Forestry University, ChinaReviewed by:
Nobuo Kobayashi, Shimane University, JapanQiqiang Guo, Guizhou University, China
Yong Yang, Zhejiang Academy of Agricultural Science, China
Copyright © 2022 Shen, Li, Li, Cheng, Huang and Jin. This is an open-access article distributed under the terms of the Creative Commons Attribution License (CC BY). The use, distribution or reproduction in other forums is permitted, provided the original author(s) and the copyright owner(s) are credited and that the original publication in this journal is cited, in accordance with accepted academic practice. No use, distribution or reproduction is permitted which does not comply with these terms.
*Correspondence: Songheng Jin, c2hqaW5AemFmdS5lZHUuY24=