 Kai-Chao Wu1,2,3†Cheng-Mei Huang4†
 Krishan K. Verma1,2,3†Zhi-Nian Deng1,2,3
 Hai-Rong Huang1,2,3Tian Pang1,2,3Hui-Qing Cao4Hai-Bin Luo1,2,3Sheng-Li Jiang4
 Lin Xu1,2,3*
- 1Sugarcane Research Institute, Guangxi Academy of Agricultural Sciences, Nanning, China
- 2Key Laboratory of Sugarcane Biotechnology and Genetic Improvement (Guangxi), Ministry of Agriculture and Rural Area, Nanning, China
- 3Guangxi Key Laboratory of Sugarcane Genetic Improvement, Nanning, China
- 4Guangxi Crop Genetic Improvement and Biotechnology Laboratory, Nanning, China
Drought is the abiotic factor that adversely affects plant growth, development survival, and crop productivity, posing a substantial threat to sustainable agriculture worldwide, especially in warm and dry areas. However, the extent of damage depends upon the crop growth stage, severity and frequency of the stress. In general, the reproductive growth phase is more sensitive to stresses causing a substantial loss in crop productivity. Saccharum spontaneum (L.) is the most variable wild relative of sugarcane with potential for use in sugarcane crop improvement programs. In the present study addresses the transcriptomic analysis of drought stress imposed by polyethylene glycol-6000 (PED-6000; w/v- 25%) on the root tip tissues of S. spontaneum GX83-10. The analysis of microarrays of drought-stressed roots was performed at 0 (CK), 2 (T2), 4 (T4), 8 (T8) and 24 h (T24). The analyzed data were compared with the gene function annotations of four major databases, such as Nr, KOG/COG, Swiss-Prot, and KEGG, and a total of 62,988 single-gene information was obtained. The differently expressed genes of 56237 (T4), 59319 (T8), and 58583 (T24), among which CK obtained the most significant number of expressed genes (35920) as compared to T24, with a total of 53683 trend genes. Gene ontology (GO) and KEGG analysis were performed on the 6 important trends, and a total of 598 significant GO IDs and 42 significantly enriched metabolic pathways. Furthermore, these findings also aid in the selection of novel genes and promoters that can be used to potentially produce crop plants with enhanced stress resistance efficiency for sustainable agriculture.
Introduction
Abiotic stress is a major problem to sustainable agriculture crop productivity around the globe, which can potentially affect the average crop production over 50% (Cui et al., 2017; Naeem et al., 2018; Waqas et al., 2019; Verma et al., 2021; Verma et al., 2022). Drought stress is one of the severe abiotic stress that inhibit plant growth, development and yield (Baiazidi-Aghdam et al., 2016). It is well-established that drought stress may impair various morpho-physiological, anatomical, cellular and metabolic processes associated with the regulation of plant development (Yoo et al., 2013; Liu et al., 2013; Cui et al., 2017). It also enhances leaf fall and chlorophyll damage, downregulate photosynthetic efficiency and loss in leaf area expansion/development, resulting in low plant productivity and sometimes total crop failure (Jiang et al., 2016; Kamran et al., 2018; Naeem et al., 2018; Verma et al., 2020; Verma et al., 2022). Polyethylene glycon (PEG) having molecular weight of 6000 is a natural polymer that is water soluble and nonionic. PEG 6000 is found to mimic drought stress and results in lowering of plant’s water potential due to osmotic stress (Ahmad et al., 2020).
During adverse environmental conditions, plants produce a large number of reactive oxygen species (ROS) associated with the regulation of various processes, i.e., pathogen defense, programmed cell death (PCD), and stomatal behavior (Liang et al., 2019). It causes oxidative damage to cell membranes, proteins, effective enzymatic activities [superoxide dismutase (SOD), catalase (CAT), peroxidase (POD), and ascorbate peroxidase (APX)], non-enzymatic (phenolic acids, carotenoids, flavonoids, ascorbic acid, proline, etc.), RNA and DNA (Dawood and El-Awadi, 2015; Baiazidi-Aghdam et al., 2016; Cui et al., 2017; Laxa et al., 2019; Verma et al., 2022). ROS plays important roles in maintaining normal plant growth, development and improving stress resistance capacity. The enhanced synthesis of osmolytes, i.e., soluble protein and proline, also plays stress tolerance functions (Sarropoulou et al., 2012; Turk et al., 2014). Cell death (also known as cell injury) is relative to the length or duration of exposure to stress and the severity of the damage caused (Turk et al., 2014; Verma et al., 2020).
Saccharum spontaneum L. is one of the wild species in the Saccharum complex and has a reservoir of genes for various economically important traits, such as tolerance to environmental stresses. Since the beginning of the new century, the world’s major sugarcane-producing countries have attached great importance to the investigation, collection, evaluation, and utilization of S. spontaneum germplasm resources (Zhang et al., 2010; Xu et al., 2017; Li et al., 2018; Xian et al., 2019; Xu et al., 2020; Xu et al., 2022). S. spontaneum has the most widely used wild germplasm for sugarcane breeding programs in China. In China, S. spontaneum grows in the wild and is widespread within the geographical range of northern latitudes (18-33°C) and eastern longitudes (97-122°C). More than 600 S. spontaneum clones were collected and conserved in China (Qi et al., 2022). Analysis of the genetic diversity of S. spontaneum using molecular markers showed significant geographical differences within the collection of S. spontaneum (Fan et al., 2013). It was obtained through interspecific hybridization combined with molecular markers to identify true hybrids and progeny and applied to sugarcane breeding (Yu et al., 2019; Zhang et al., 2019).
Saccharum spontaneum is most important for modern sugarcane breeding, commercial varieties contain about 10% of the chromosomes from S. spontaneum, and effectively used S. spontaneum stress-resistant parents and genes are minimal. At present, different drought stress resistance-related genes of S. spontaneum have been successfully cloned and preliminary functional analysis carried out, including SsPOD-1a, SsPOD-1b, SsSOD-1a, SsDREB2-a, SsDREB2-f, SsDREB2-1, SsDREB2-2, SsGST, SsCAT-1c, SsCAT-1d, Ssδ-OAT-2, SsREMO-1, ScPP2C, PIN gene family and NAC transcription factors (Xu et al., 2017; Liu et al., 2018; Yang et al., 2019; Huang et al., 2021; Qingqing et al., 2022). Assessing these efficient stress tolerance genes has provided new candidate gene resources for accelerating the genetic improvement of sugarcane. Still, limited reports were available on acquiring or utilizing significant stress tolerance genes in S. spontaneum for better crop improvement.
In the present study, based on the previous research (Wu et al., 2018a; Wu et al., 2018b), the stress-resistant genes were identified from the root system of S. spontaneum for further analysis of the regulation of molecular mechanisms in response to polyethylene glycol-6000 (PEG-6000; w/v 25%) stimulated drought stress and provide advanced approaches to improve the stress tolerance capacity by genetic engineering technologies.
Materials and methods
Plant material and experimental layout
The plant material of S. spontaneum GX83-10, the wild-type stress-resistant core germplasm, was collected in the Germplasm Resource Garden. The experiment was carried out in the greenhouse of Guangxi Sugarcane Genetic Improvement Key Laboratory, Sugarcane Research Institute, Guangxi Academy of Agricultural Sciences, Nanning, Guangxi, China. The pre-cultured seedlings with consistent rooting and growth were selected and transplanted (n = 50) in hydroponic culture with Hoagland nutrient solution (10 L). The nutrient solution was changed in a week at the seedling stage and every three days during elongation phase. The timing was set to oxygenate the nutrient solution once every hour during the experiment.
Each plant maintained 3 reproductive tiller stems during experimental duration, and juvenile tillers were removed regularly. The experiment was designed with five treatment levels, such as 0 h (CK), 2 h (T2), 4 h (T4), 8 h (T8), and 24 h (T24) under drought stress. Polyethylene glycol – 6000 (PEG-6000 w/v 25%) was used to stimulate drought stress treatment in S. spontaneum stems with five visible nodes. At the beginning of the experiment, root samples were collected at 0 h (T0, CK) treatment. PEG-6000 (25%) of the same volume was used to replace Hogland nutrient solution simultaneously, and root samples were collected 2, 4, 8 and 24 h after treatment. Three plants (n = 3) with consistent plant growth and proper root development were selected for transcriptomic analysis of each treatment. During sampling, ten white segments of root tips of each plant with a length of about 3-4 cm were cut and mixed. After naming, root samples were kept frozen under liquid N2 and stored at -80°C.
Isolation, library construction and sequencing of RNA
Total RNA of CK, T2, T4, T8 and T24 was extracted with TRIzol reagent, respectively (Wu et al., 2018a). After total RNA extraction, eukaryotic mRNA was enriched by Oligo(dT) beads, while prokaryotic mRNA was enriched for removing rRNA by Ribo-Zero™ Magnetic Kit (Epicenter). The enriched mRNA was fragmented into short fragments using fragmentation buffer and reverse transcripted into cDNA with random primers. Second-strand of cDNA was synthesized by DNA polymerase-I, RNase H, dNTP and buffer. Then the cDNA fragments were purified with a QiaQuick PCR extraction kit, end-repaired, poly(A) added, and ligated to Illumina sequencing adapters. The ligation product size was selected by agarose gel electrophoresis, PCR amplified and sequenced using Illumina HiSeqTM 4000 by Gene Denovo Biotechnology Co. Guangzhou, China (Supplementary Figure S1). All sequencing reads were uploaded to the National Center for Biotechnology Information (NCBI) [SRA accession number – PRJNA835339].
Transcriptome and reference transcriptome assembly
Filtering raw reads, de novo assembly was performed with short reads assembling program Trinity (Grabherr et al., 2011). The high-quality rRNA clean reads were removed and mapped to the reference transcriptome by default parameters of the short reads alignment tool Bowtie2 (Li et al., 2009) [Figures S2 and S3].
Analysis of unigene expression and basic annotation
The unigene expression was calculated and normalized to reads per kilobase per million (RPKM) (Mortazavi et al., 2008). The unigenes were annotated using the BLASTx program (http://www.ncbi.nlm.nih.gov/BLAST/) with an E-value threshold of 1e-5 to NCBI non-redundant protein sequence database (Nr) (http://www.ncbi.nlm.nih.gov), Swiss-Prot (http://www.expasy.ch/sprot), Kyoto Encyclopedia of Genes and Genomes (KEGG) (http://www.genome.jp/kegg), and COG/KOG (http://www.ncbi.nlm.nih.gov/COG). Protein functional annotations could be obtained according to the best alignment results.
Identification and analysis of differentially expressed genes
The edgeR package (http://www.r-project.org/) was used to identify DEGs across samples or groups. Identified genes with fold change ≥2 and false discovery rate (FDR) ≤0.05 as significant DEGs. DEGs were subjected to enrichment analysis of GO functions and KEGG pathways (Xu et al., 2022). Gene expression pattern analysis was used to cluster genes of similar expression patterns for multiple samples (@ 3 times). To examine the expression pattern of DEGs, each sample was normalized to 0, log2 (v1/v0), log2 (v2/v0), and clustered by Short Time-series Expression Miner software (STEM) (Ernst and Bar-Joseph, 2006). The clustered profiles with p-value (≤ 0.05) were considered significant profiles. The DEGs in all or each profile were subjected to Gene Ontology (GO) and KEGG pathway enrichment analysis. The hypothesis of the p-value calculation and FDR correction showed that GO terms or pathways with Q value ≤ 0.05 were enriched GO terms or pathways (Benjamini and Hochberg, 1995).
Quantitative real-time PCR (qRT-PCR) assay
Up-regulated genes were randomly selected for verification according to Wu et al. (2018a) and Xu et al. (2022). The validated samples, such as A1 (0 h), A2 (2 h), A3 (4 h), A4 (8 h) and A5 (24 h), treated with PEG-6000 (25%) for 0, 2, 4, 8 and 24 h, respectively. Unigene0049197 (alpha-tubulin) was used as a control gene. Special primers were designed for 13 different genes of expression validation of up-regulated genes using Premier 5.0 software (Supplementary Table S1).
Results
The total RNA quality was quantified by Agilent 2100 system (Figure S4). The results of total RNA extraction showed quality requirements for library construction (Table S2). A total of 57,036,239 bases were assembled in the experiment, and 62,988 genes were obtained (Table S3). The maximum length of the assembly (15429 nt), minimum (201 nt), average (905 nt) and N50 (1533 nt); the N50 length was larger than the average length (Table S3). Figure 1A showed the number of Unigenes of 1500 – 1599 nt was 1141, smaller than the number of genes of average length (1806). The unigenes have coverage distribution on reads of 1-1000 and above in S. spontaneum. Unigenes covering 11-100 reads were at 23216, followed by unigenes covering more than 1000 reads with 6431 (Figure 1B). Comprehensive analysis shows that the quality of the completed assembly was good.
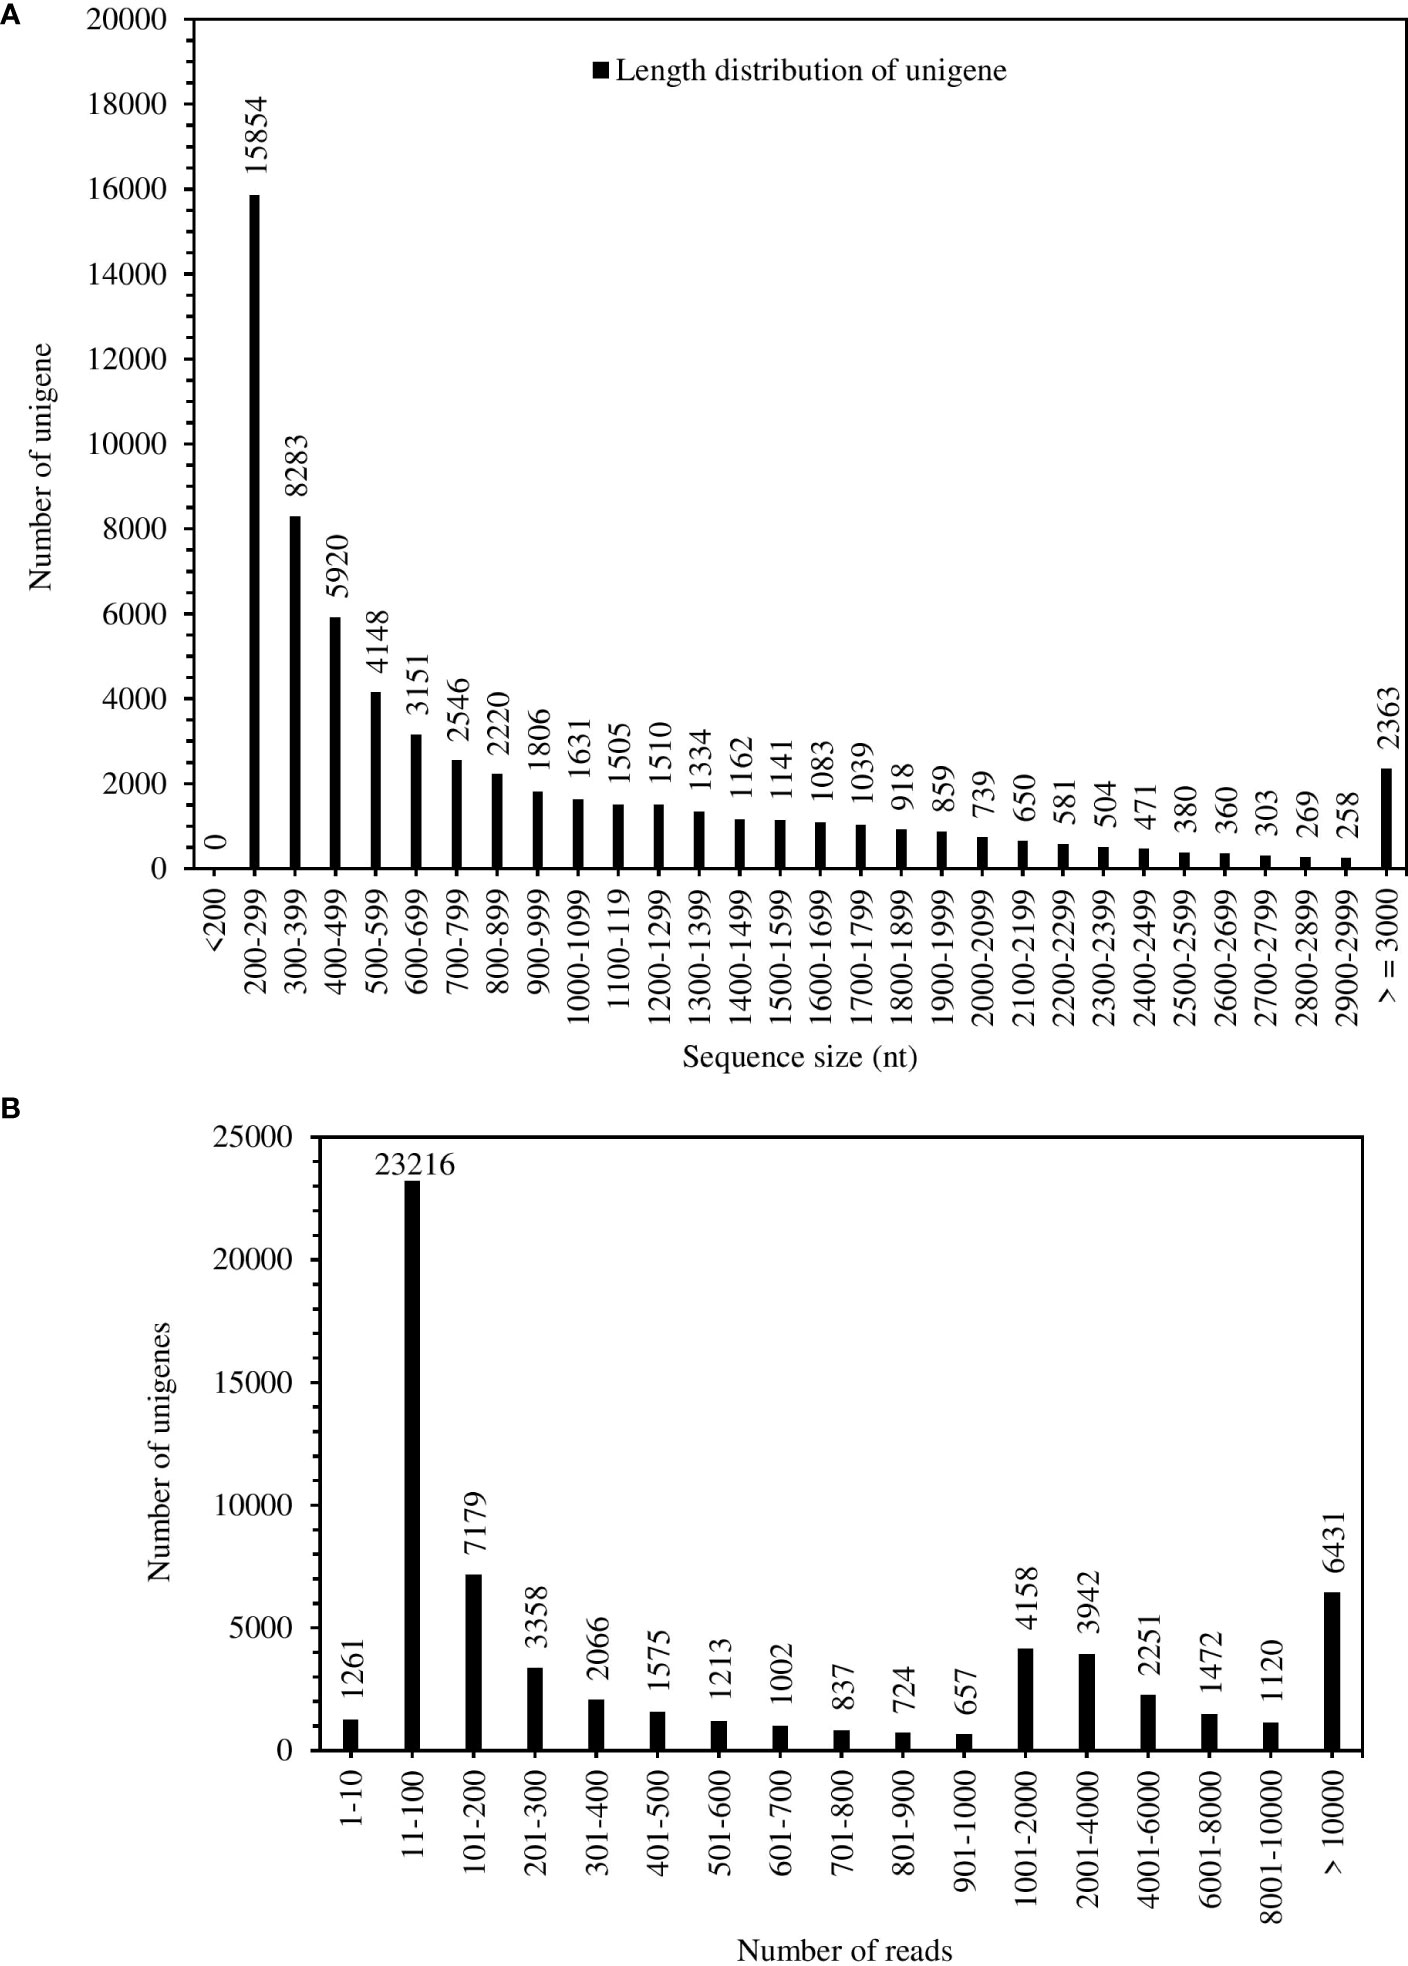
Figure 1 Unigenes length distribution (A) and coverage statistics (B) of S. spontaneum.
Analysis of gene annotation results
Functional annotation analysis of all 62,988 unigenes was found. The unigenes were matched as 39,411 (62.62%) in Nr database, 28,397 (45.08%) Swissprot database, 23,451 (36.65%) KOG database and 15,311 (24.31%) in the KEGG database. A total of 40,784 (64.75%) genes were successfully annotated, while 22,204 (35.25%) genes failed to be annotation (Table 1). The large number of unigenes were annotated with the Nr database, followed by Swissprot, KOG and KEGG (Figure 2A). Interestingly, KOG-Nr and Swissprot-Nr found the largest number of co-annotated unigenes. The Nr database revealed that 39,441 unigenes annotated sequences aligned with different plant species to known nucleotide sequences similar to other plants. Annotation results showed as 30.73, 23.44, 15.71, 3.15, 1.88, 1.62, 1.55, 1.46, 1.17 and 1.14%, matching with Zea mays, Setaria italica, Oryza sativa Japonica, Sorghum bicolor, Brachypodium distachyon, Oryza brachyantha, Aegilops tauschii, Saccharum hybrid cultivar R570, Triticum urartu, Oryza sativa Indica, respectively (Figure 2B). The results have high homology with Zea mays, Setaria italica and Oryza sativa Japonica genomes. These results support the genomic similarity of S. spontaneum tissues with the other plants, such as Z. mays, O. sativa and S. bicolor.

Table 1 Annotation statistics of four databases.
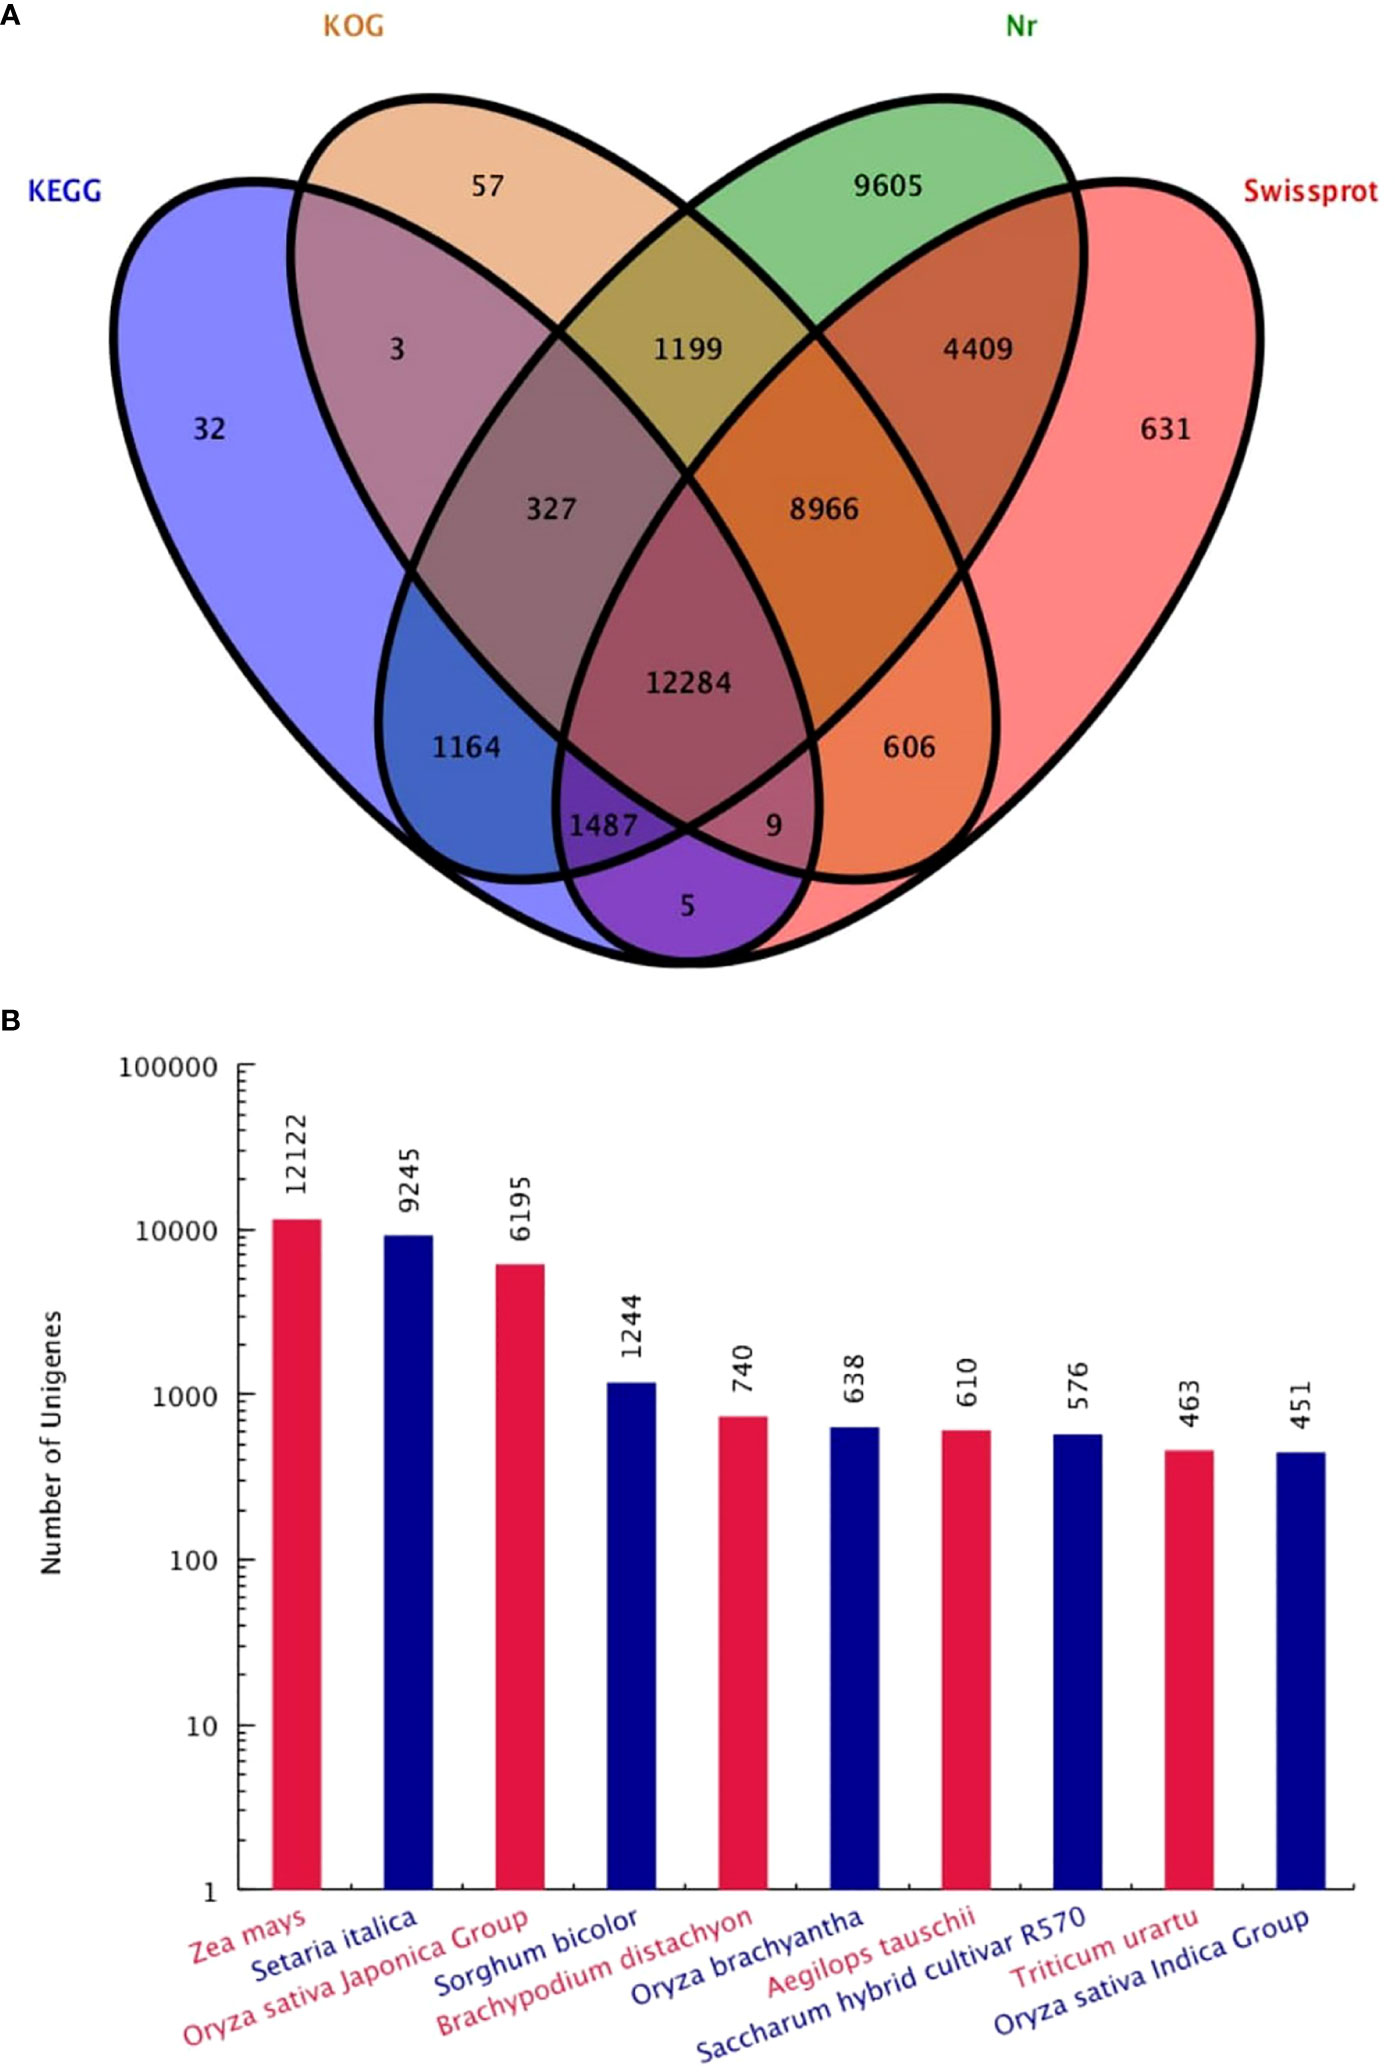
Figure 2 Venn diagram (A) of four major database annotations and statistical map of species distribution (B) of the first ten species are shown.
Gene ontology (GO) and KOG analysis
GO annotation found that all unigenes were enriched in 50 Ontology, 59093 unigenes (38.01%) in biological processes, 32282 (20.77%) in molecular functions, and 64072 (41.22%) in cellular components (Figure 3A). Most annotated classes in the biological process were included in “metabolic process” 15269 (9.82%), “cellular process” 13925 (8.96%), and “single-organism process” 9880 (6.36%). In the molecular function, most annotated unigenes were categorized as “binding” 15050 (9.68%), “catalytic activity” 13616 (8.76%), and “biological regulation” 4316 (2.78%). In the cellular component, most of the annotated unigenes were classified as “cell” 17120 (11.01%), “cell part” 17117 (11.01%), and “organelle” 15196 (9.78%). KOG classified all unigenes, and 39,559 unigenes were found to be aligned to the database and distributed into 25 categories (Figure 3B). KOG category as general function prediction was the largest group, i.e., 7,153 (18.08%), followed by post-translational modification, protein turnover, chaperones 4,602 (11.63%), and signal transduction mechanisms 4,576 (11.57%).
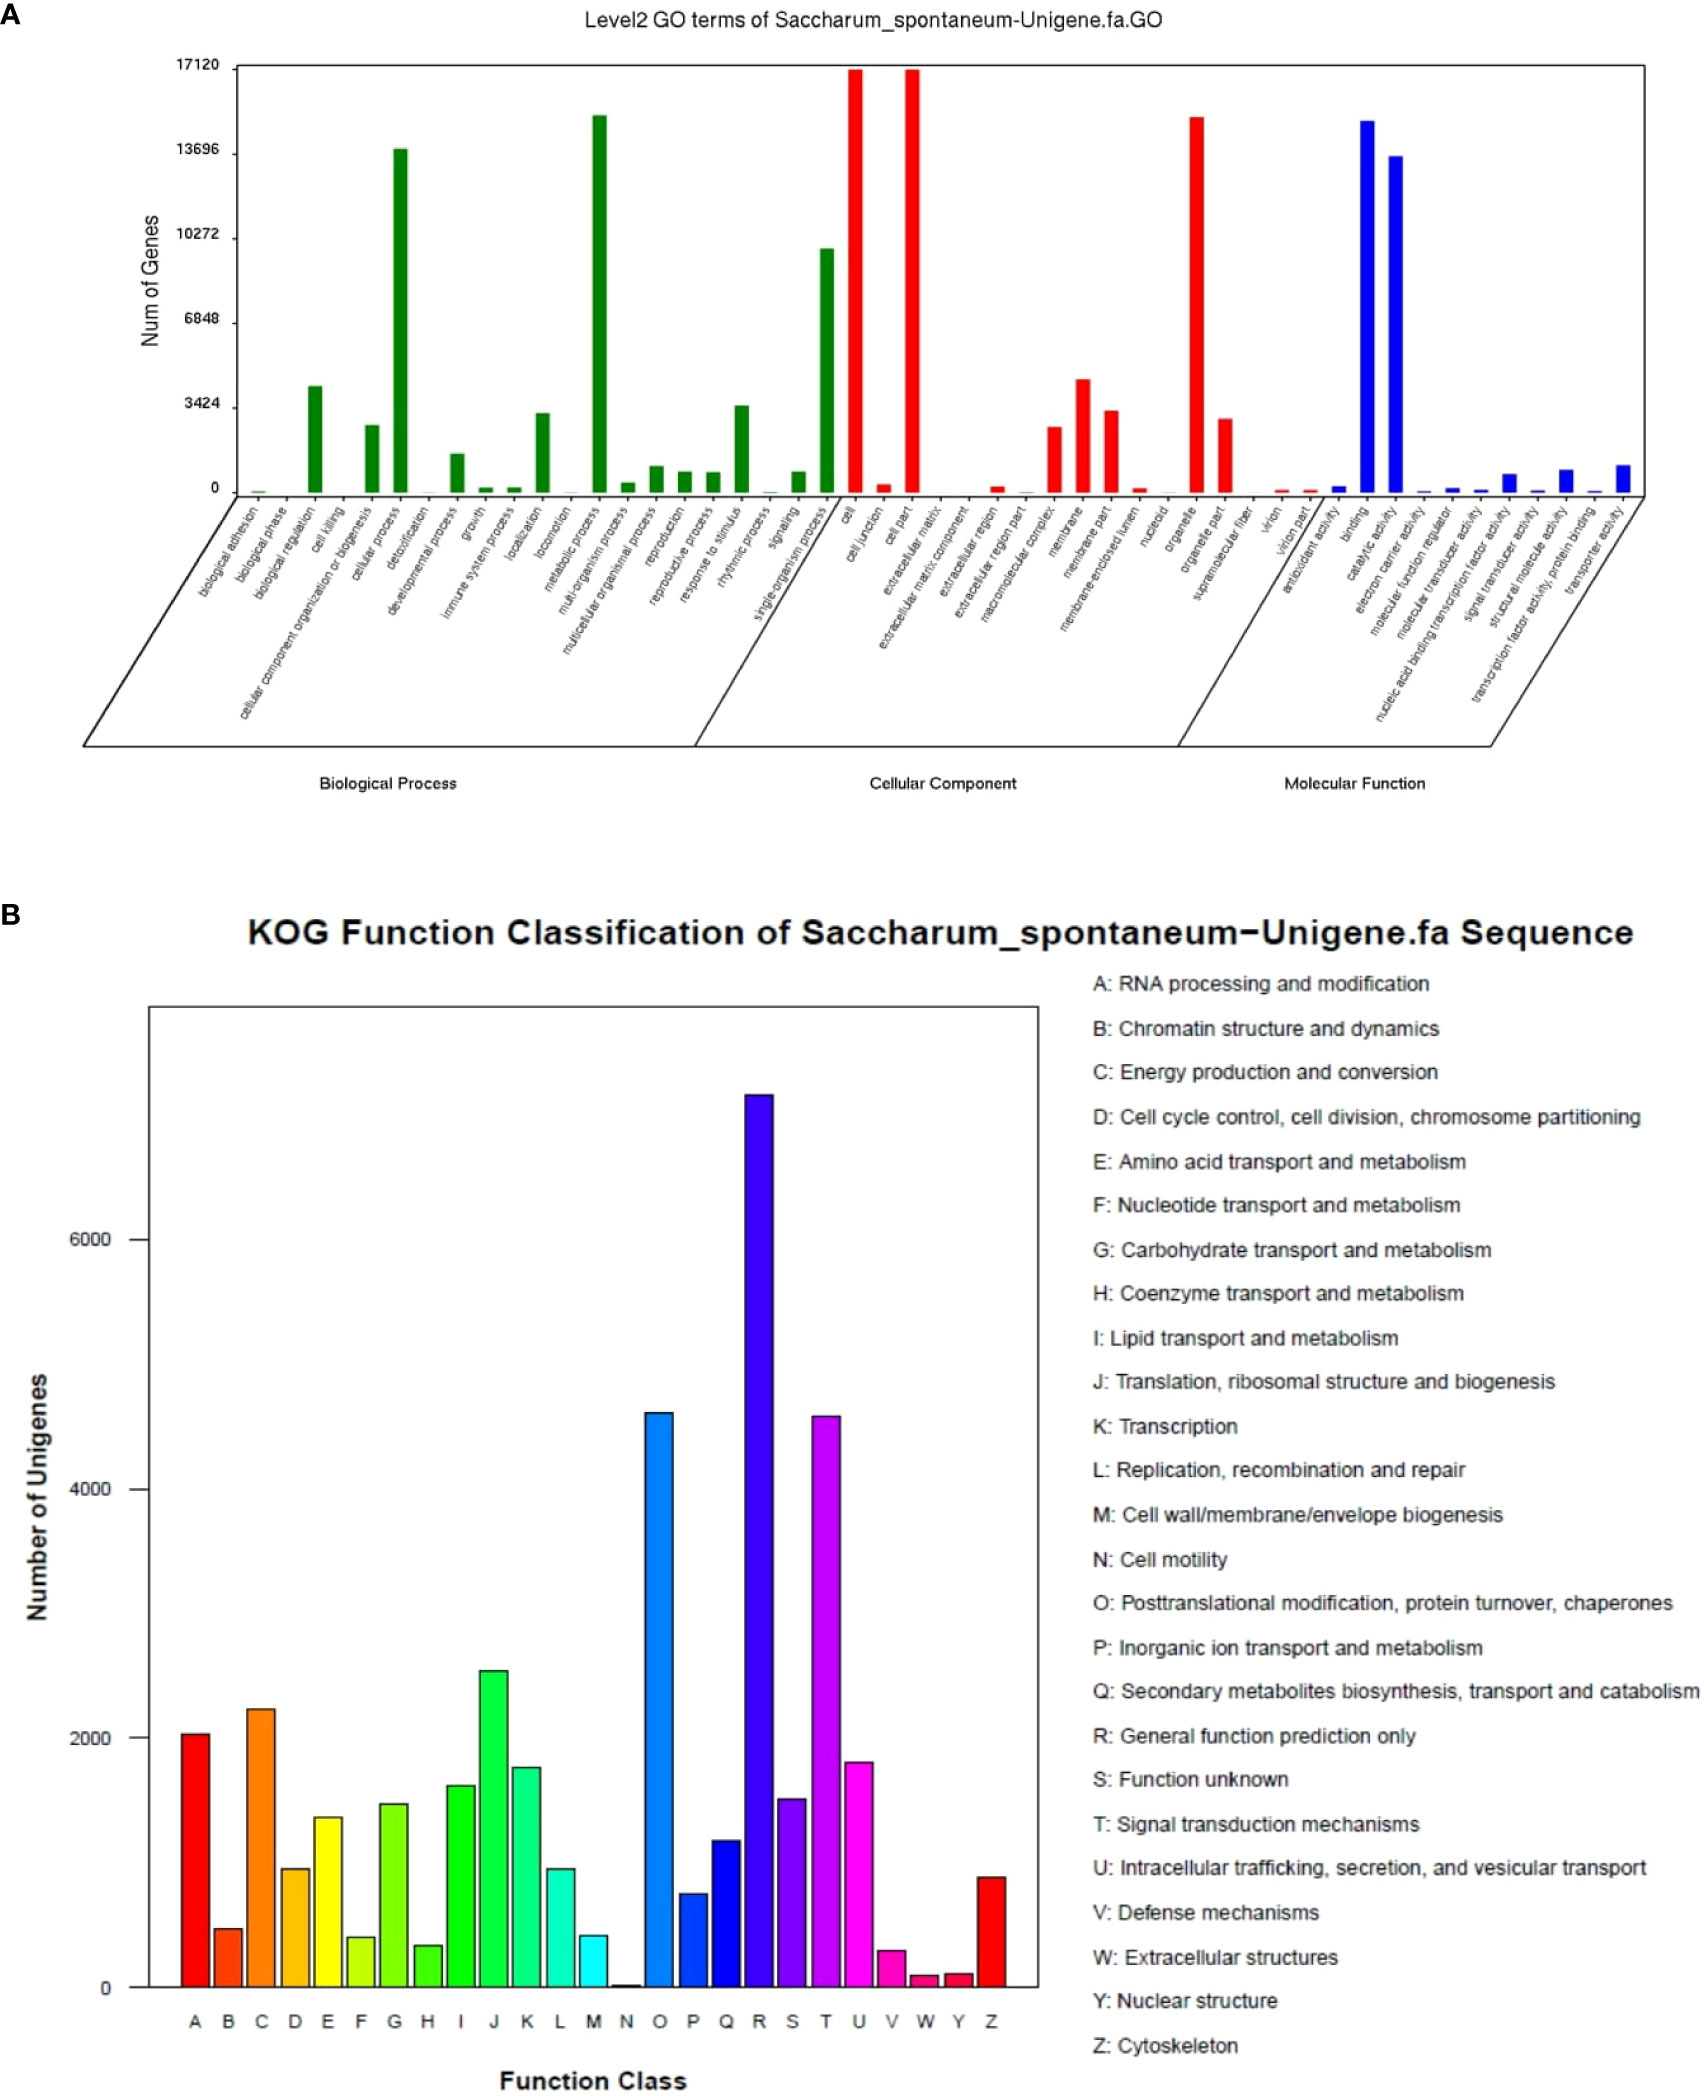
Figure 3 GO (A) and KOG (B) functions classification of expressed unigenes.
KEGG analysis
Our data revealed that 9,056 unigenes were enriched in 130 pathways, and 4,818 (53.20%) unigenes annotated to ribosome of translation, carbon metabolism of global and overview, biosynthesis of amino acids of global and overview, plant-pathogen interaction of environmental adaptation, oxidative phosphorylation of energy metabolism, protein processing in the endoplasmic reticulum of folding, sorting and degradation, spliceosome of transcription, RNA transport of translation, purine metabolism of nucleotide metabolism and phenylpropanoid biosynthesis of other secondary metabolites. Ribosome 1,099 (12.14%) was the largest group, followed by carbon metabolism 652 (7.20%) and biosynthesis of amino acids 498 (5.50%), shown in Table 2.
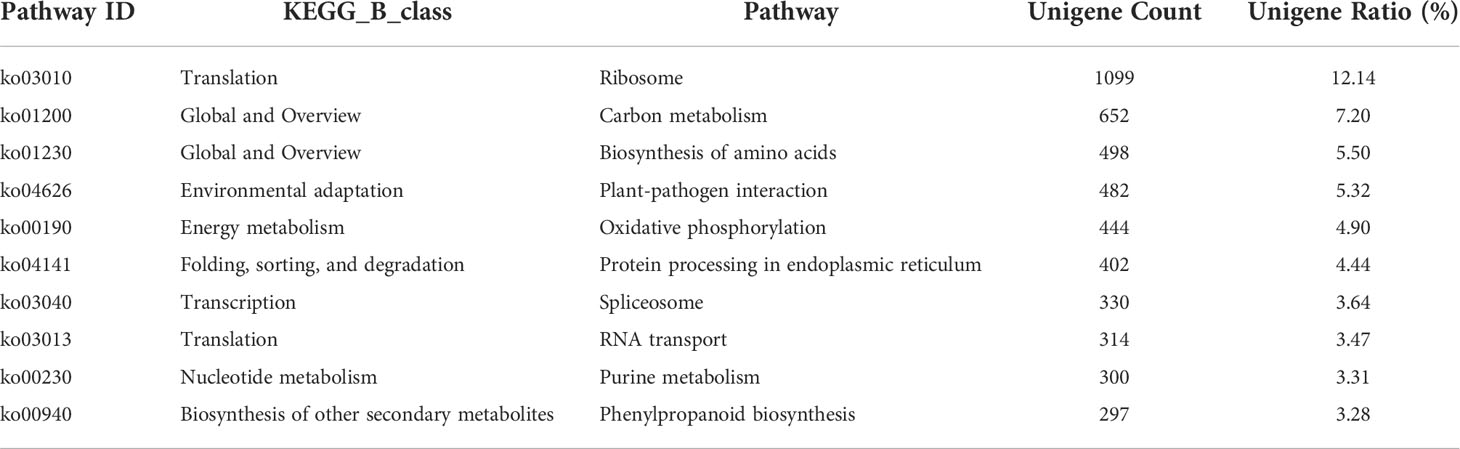
Table 2 Pathway list of unigenes (only the first 10 rows).
Changes in the expression and differentially expressed genes
The maximum number of genes was expressed in the T8 group, the minimum in T0 (CK), and the coverage of the total expressed genes of the samples were 99.16% (Table 3). Figure S5 represents the log10FPKM value of each treatment is more significant than 2.5, and each sample’s corresponding gene expression levels were not much different. Each gene expression’s abundance value is higher than (T1) CK and T8 was highest.

Table 3 Genes expression statistics of each sample (total reference genes 62988).
The PCA two-dimensional coordinate diagram shows that the PC1 explained 69.3% of the overall gene expression variance in all samples, and PC1 and PC2 explain 91.6% of the overall variance (Figure 4). As shown in Figure S6, the CK and treated plants are classified into two groups. The treated groups, such as T2, T4, and T8, belong to one subgroup, and T24 is a separate subgroup. The gene expression relationship between T4 and T8 treatments was more similar. The differentially expressed genes was compared among the samples FDR ≤ 0.05, and the difference fold was more than two times. () The number of upregulated (red dots), downregulated (green dots), and no difference (black dots) genes are shown in Figure S7. In terms of up-regulated genes, with the increase in processing time, the number of up-regulated genes among samples showed an increasing trend; group CK-vs-T24 showed the highest (19408) number of up-regulated genes (Figure 5). The number of down-regulated genes was comparatively low among T2, T4 and T8 as compared to T24. The number of down-regulated genes were high, especially T4-vs-T24 (16596) and T8-vs-T24 (16414) group, respectively. The down-regulated genes between CK and each treatment initially decreased and then increased, among which CK-vs-T24 showed that the number of down-regulated genes reached 16,512. The total number of DEGs, CK-vs-T24, monitored the highest number of genes (35920) (Figure S7).
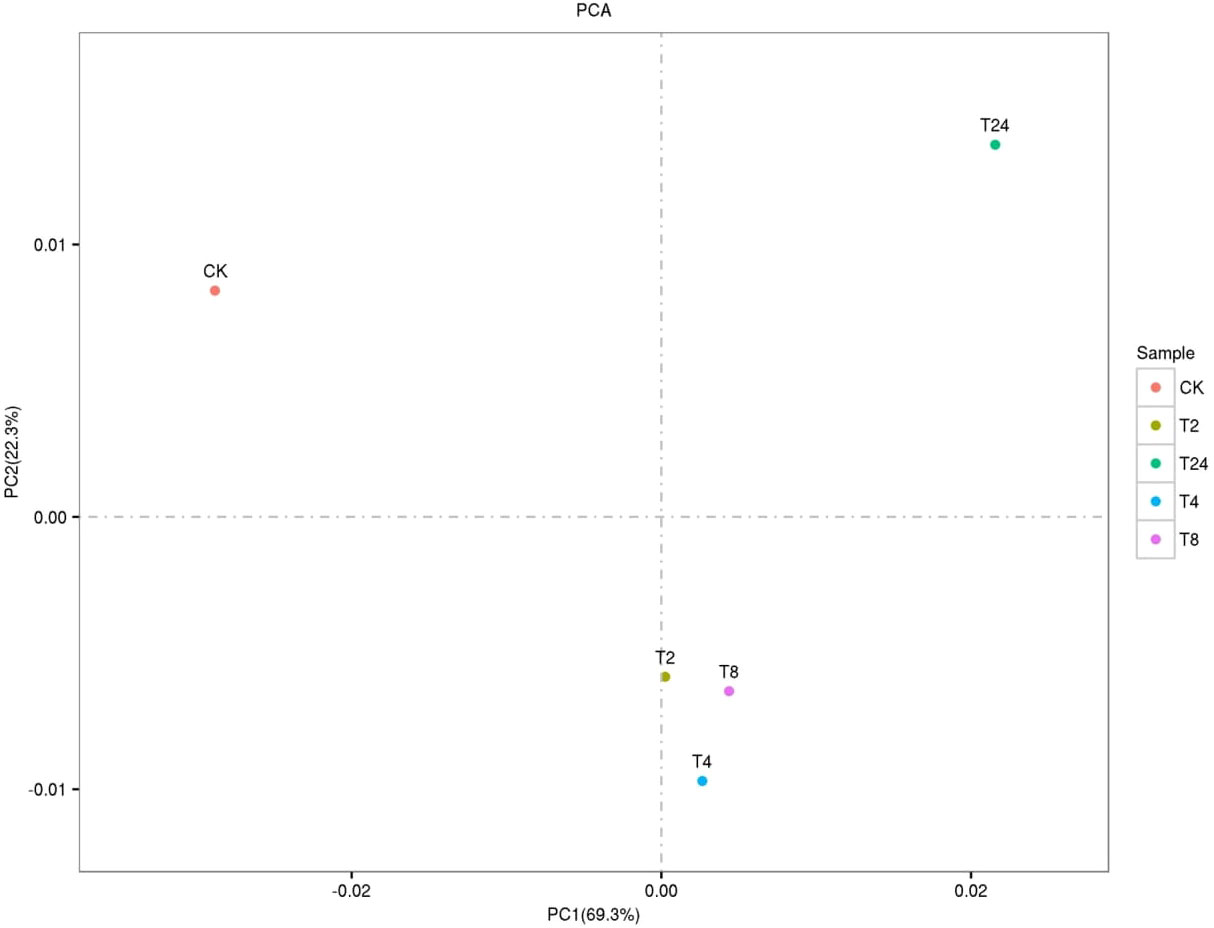
Figure 4 PCA two-dimensional coordinate diagram of six samples.
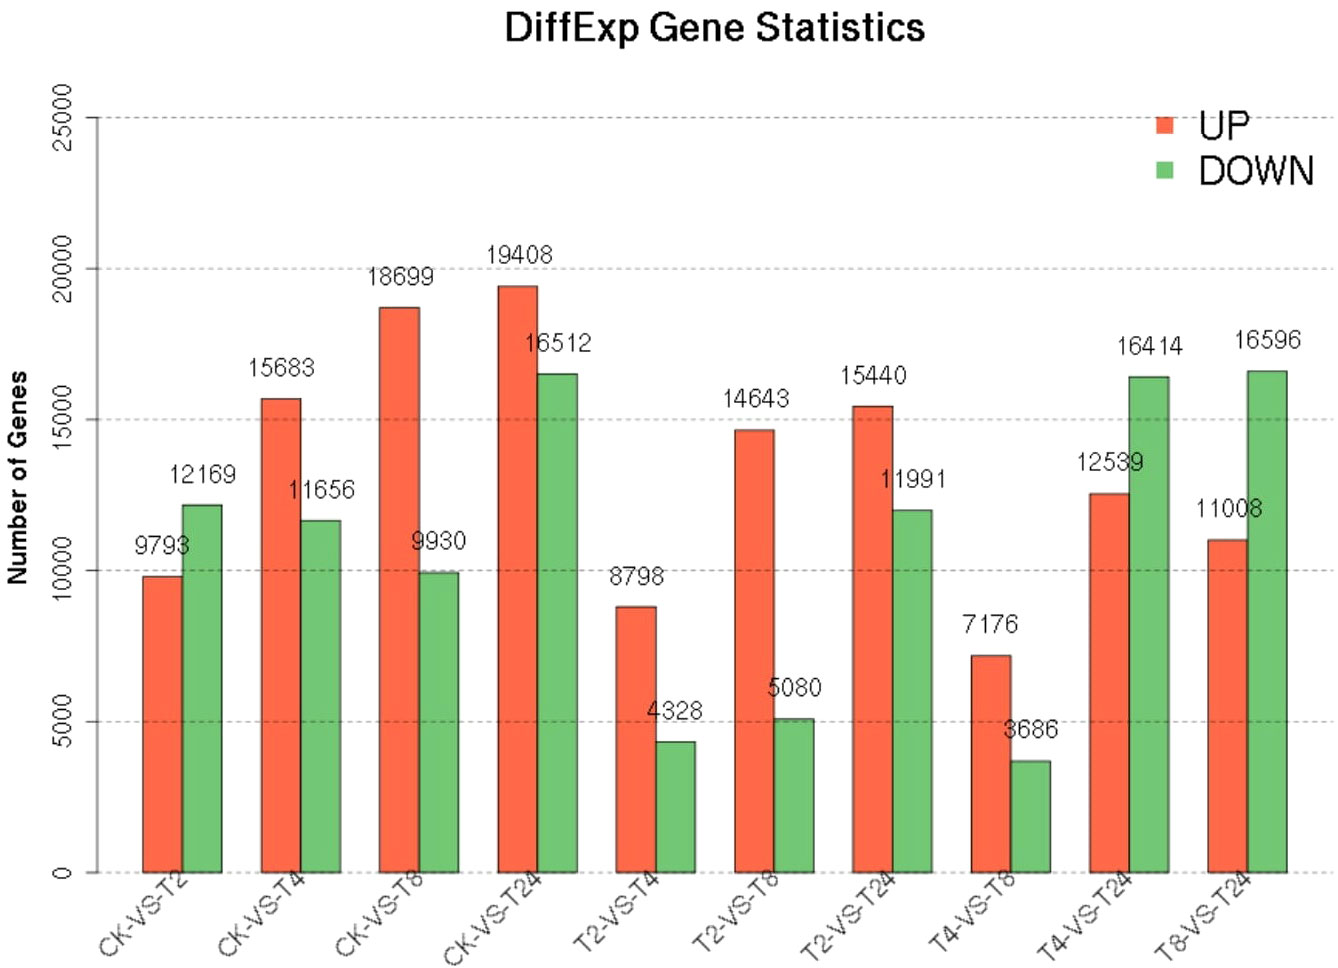
Figure 5 Statistics of differential genes between samples.
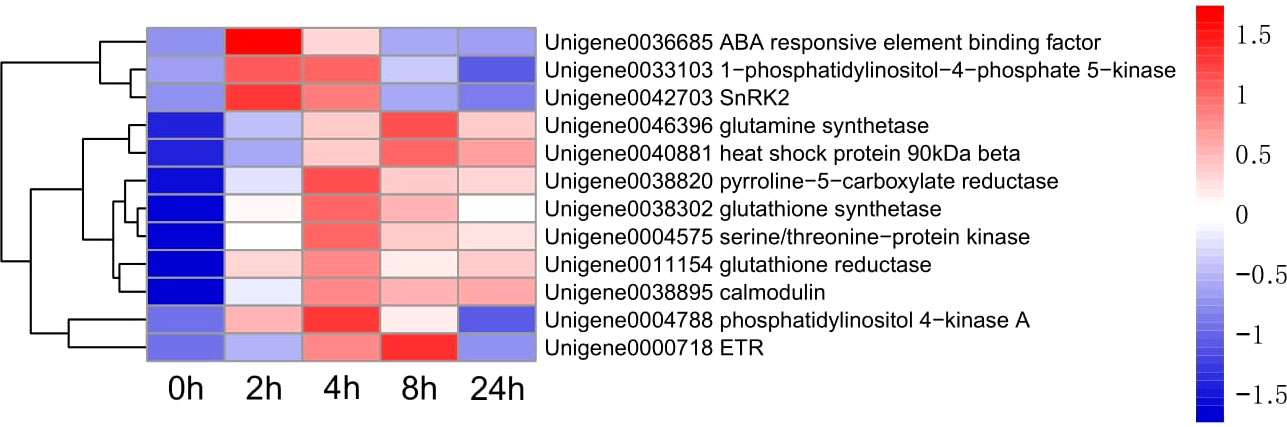
Figure 6 Heatmap of 12 genes expression.
Gene ontology (GO) and differentially expressed genes (DEGs)
The DEGs were significantly enriched to 367 GO IDs, including 149 in a cellular component, 113 in molecular function, and 105 in the biological process. In the cellular component, GO:0016020 (membrane) occupied the first place in the five gene sets, and GO:0044425 (membrane part), GO:0030529 (intracellular ribonucleoprotein complex) also appeared in the top three positions of the five gene sets. In molecular function, GO:0003824 (catalytic activity) occupied the first number in five gene sets, with gene coverage greater than 60%. GO:0016491 (oxidoreductase activity) was significantly enriched in eight gene sets, and the gene coverage in each gene set of about 10%. GO:0005198 structural molecule activity was found in seven gene sets, and the gene coverage was smaller than GO:0016491 (oxidoreductase activity). In the biological process, the top three enriched GO IDs were found in three and mostly in only one gene set. The more coverage rates in one gene set were GO:0044699 (single-organism process), greater than 50%, followed by GO:0044710 (single-organism metabolic process) and GO:0044763 (single-organism cellular function), greater than 30% (Figure 7; Table 4).
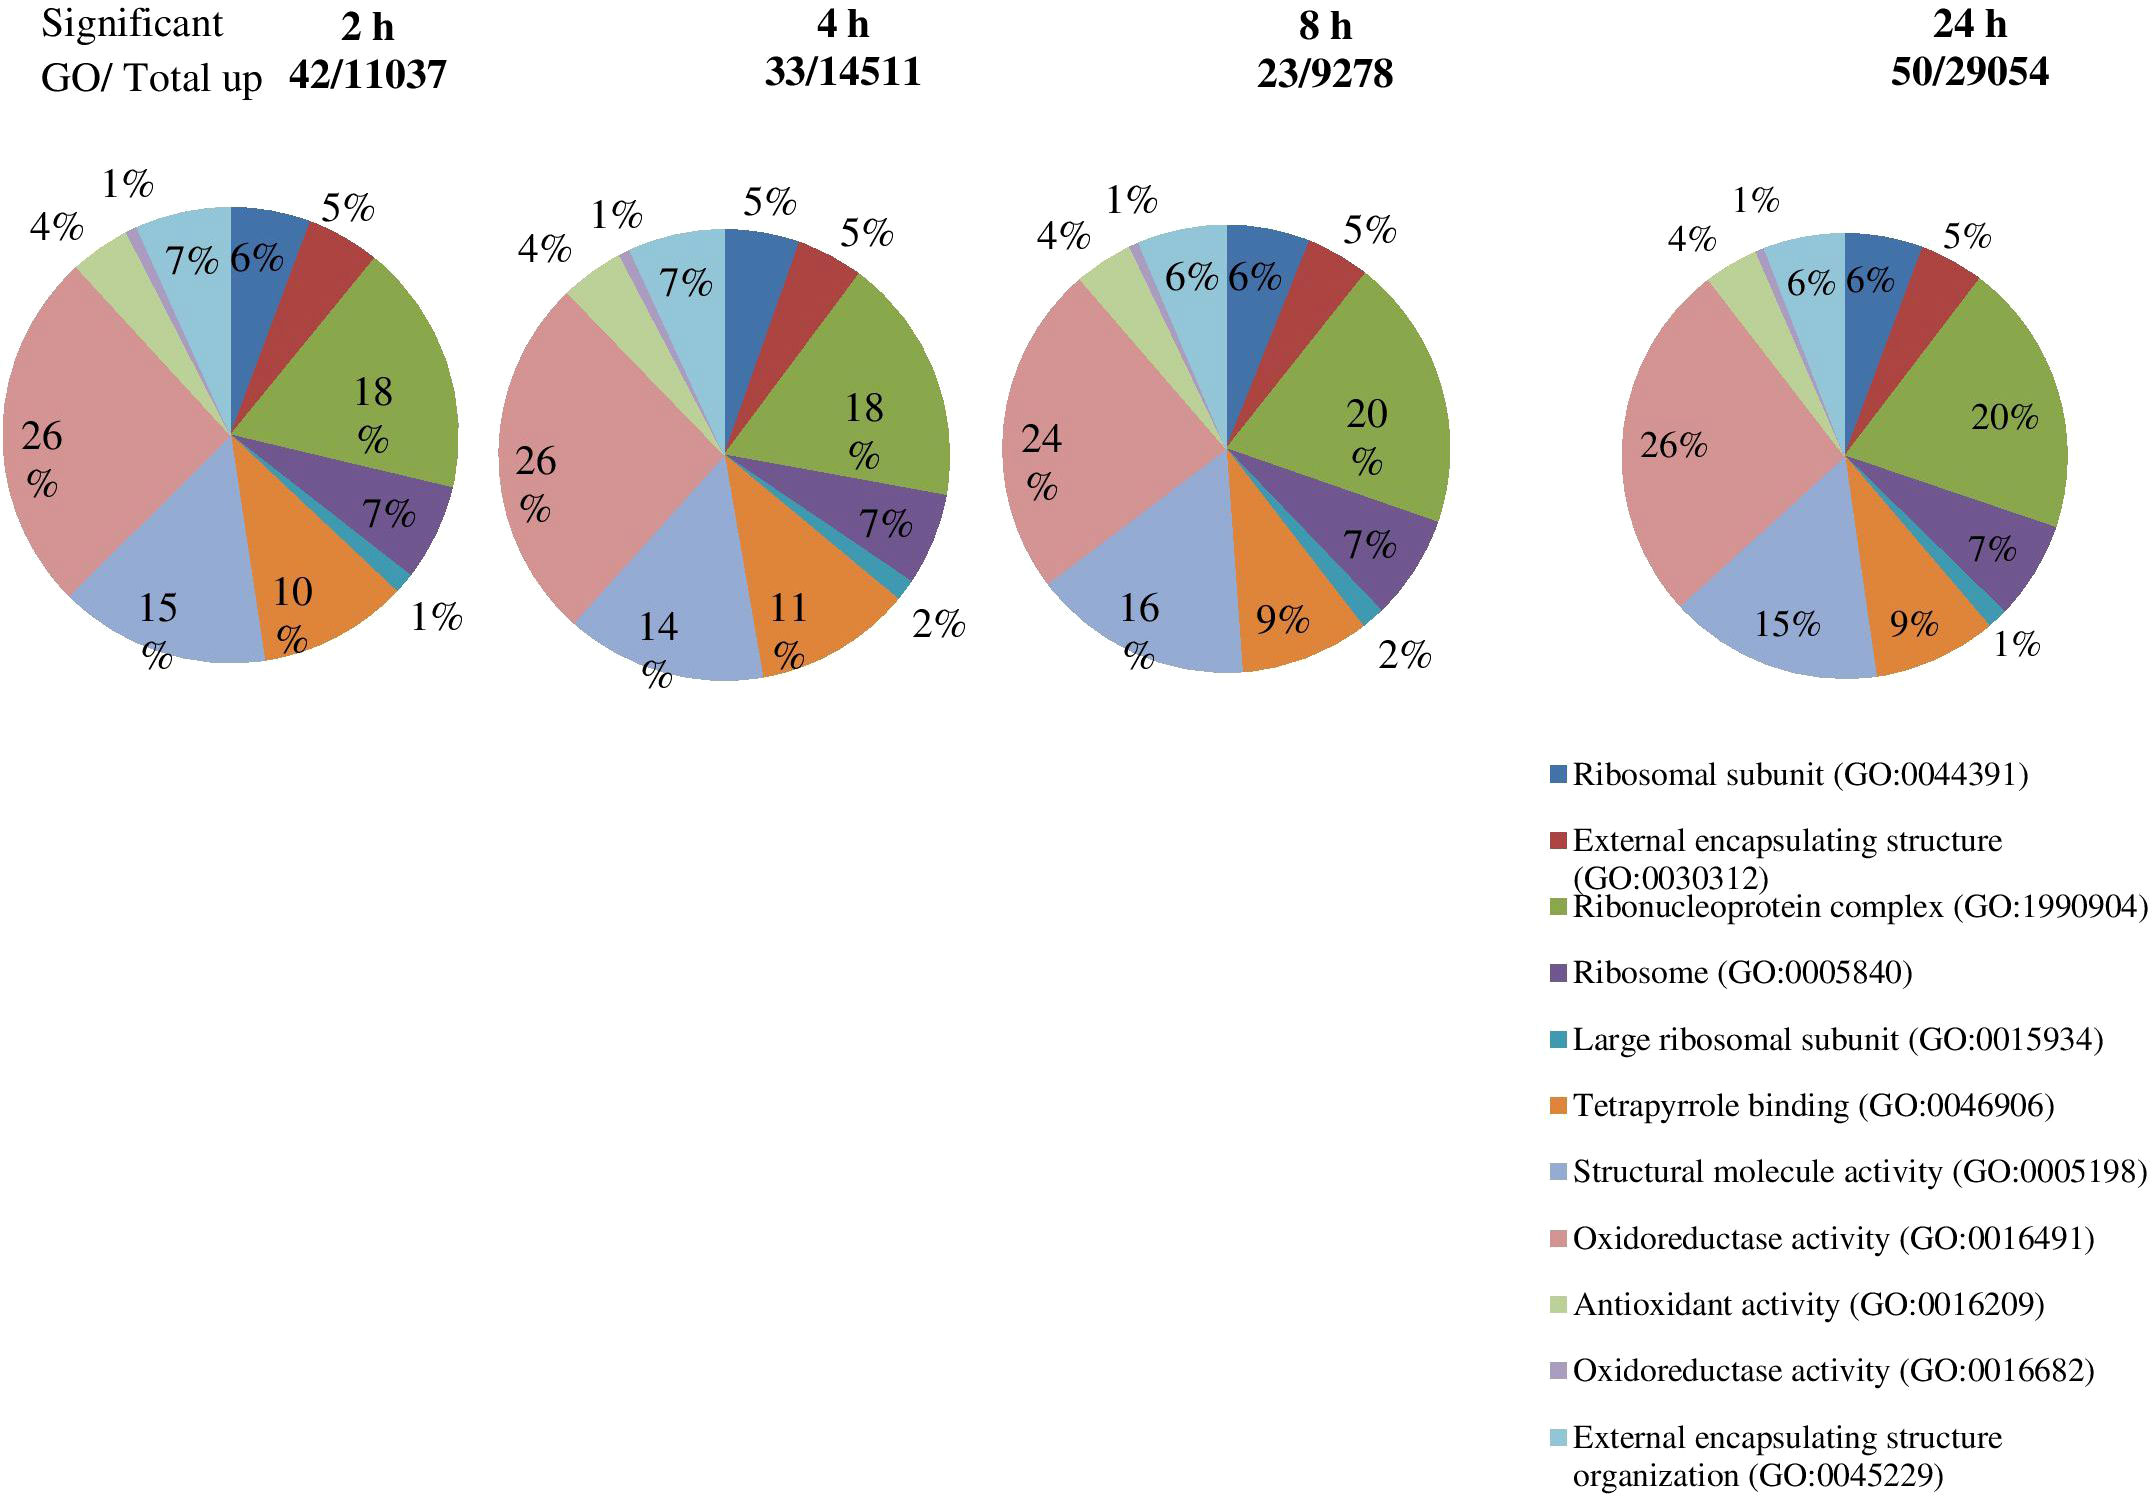
Figure 7 Significant GO enrichment analysis of genes in roots tips of S. spontaneum plants in response to drought stress. The number of upregulated genes identified in each comparison of specific time intervals.
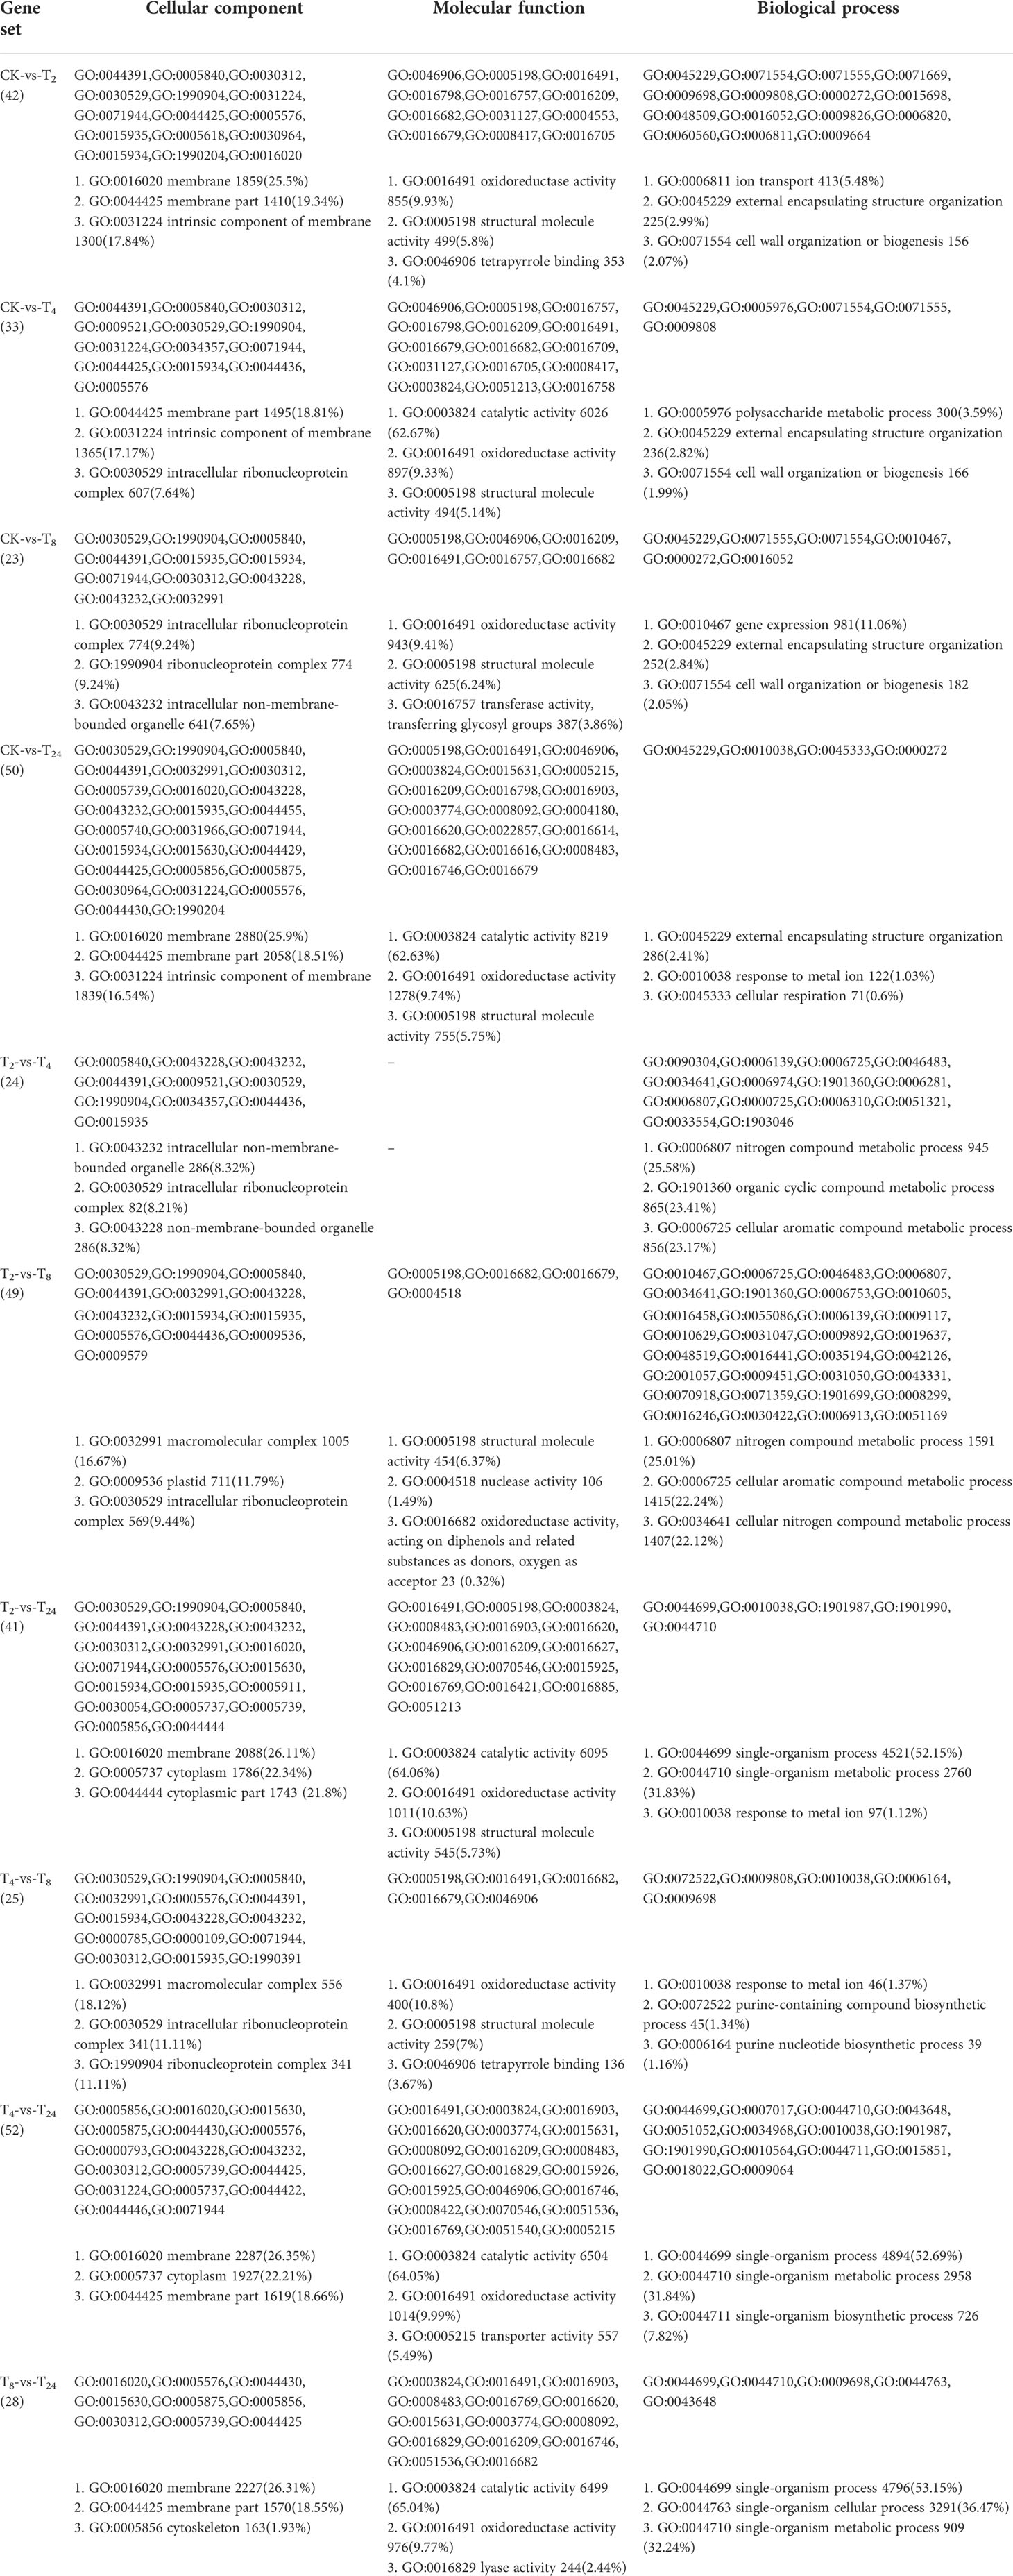
Table 4 Significant GO and top three enriched genes in different gene sets.
KEGG analysis of differentially expressed genes
The KEGG analysis results of all DEGs showed that the fifty-five significant pathways (42.31%) were enriched, and a total of 9056 genes distributed in ten gene sets (Figure 8; Table 5). ko03010 (Ribosome) was significantly enriched in eight gene sets and the pathway with the most significant number of genes in each gene set. ko00940 (Phenylpropanoid biosynthesis) and ko00190 (Oxidative phosphorylation) were found in seven and six gene sets, respectively. It can also be drawn from Table 5 that the three gene sets were significantly enriched, i.e., CK-vs-T24 (6024), T4-vs-T24 (4862) and T2-vs-T24 (4750). T4-vs-T24 (33 pathways) and low T2-vs-T8 (1 pathway) were enriched considerably.
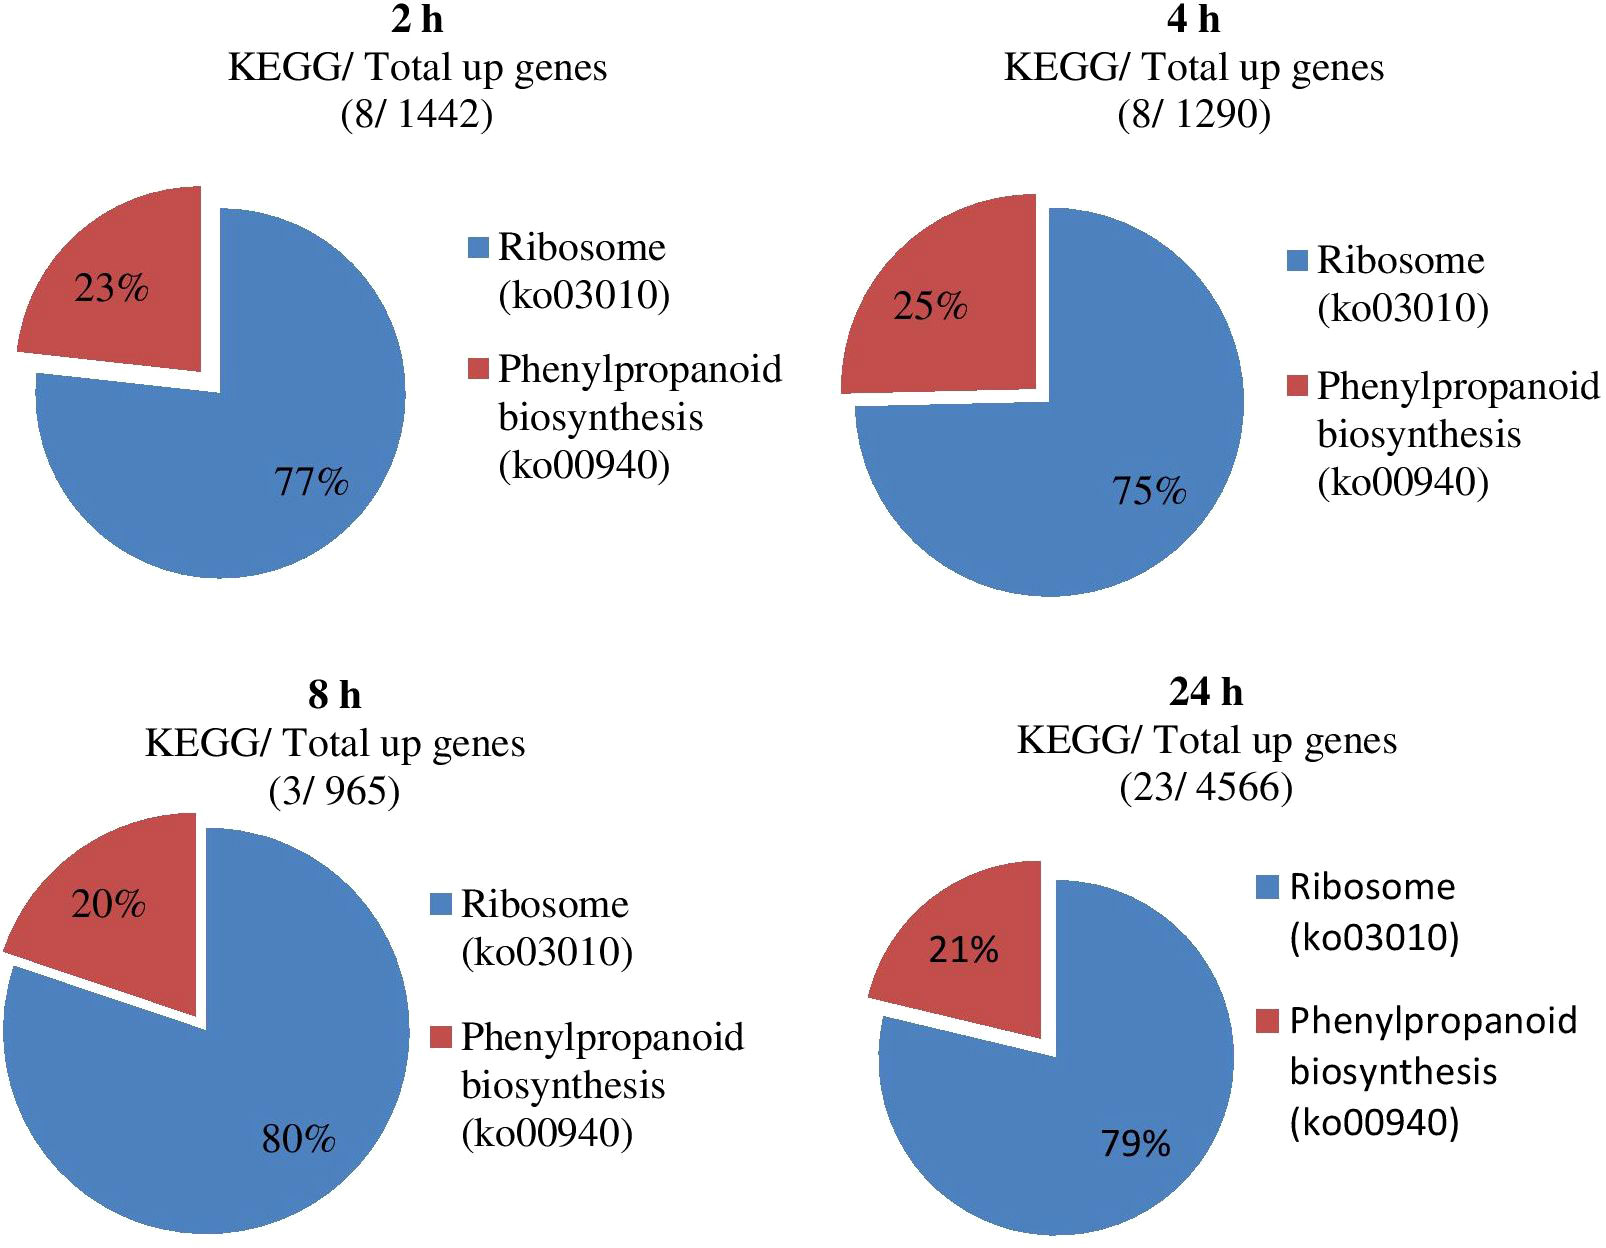
Figure 8 Impact of significant KEGG enrichment at different gene sets during stress conditions.
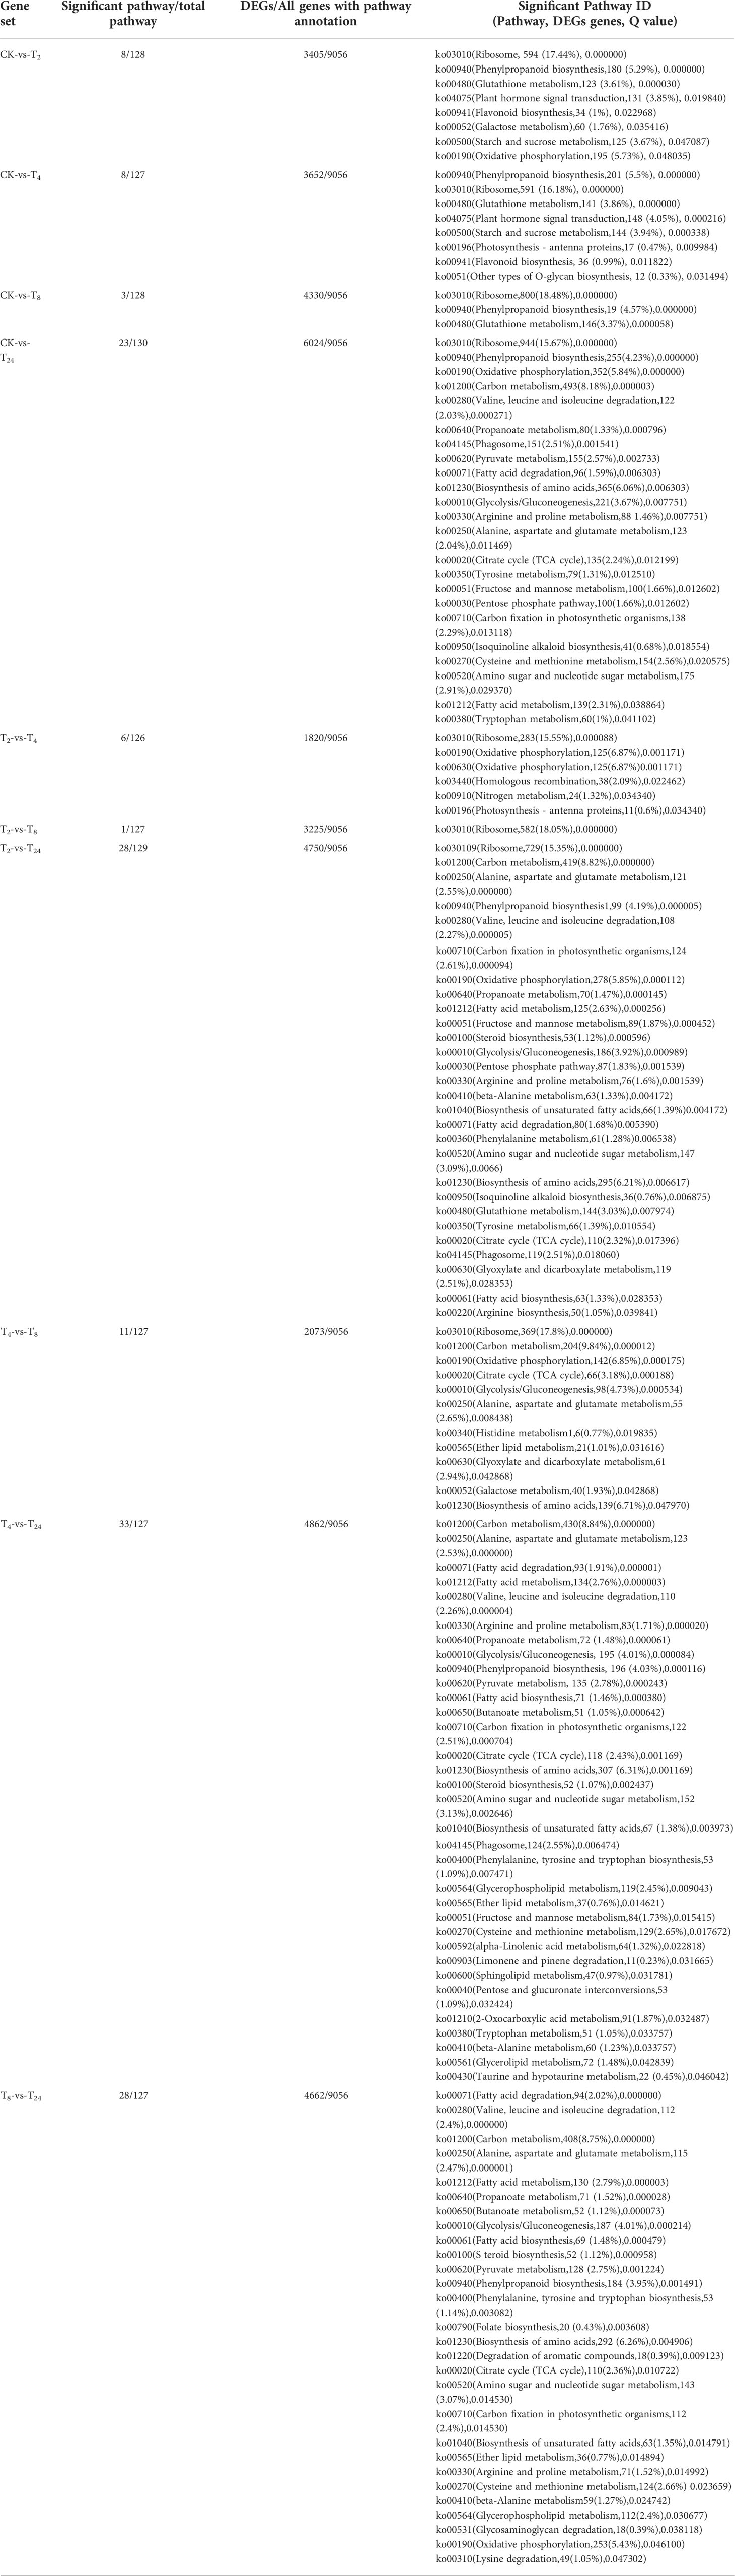
Table 5 Results of significant KEGG enrichment in different gene sets.
Trend analysis of expressed genes
All expressed genes were analyzed by Short Time-series Expression Miner software and corrected by FDR. With Q value ≤ 0.05 as the threshold, a total of 53683 trend genes, 20 trend lines, and 6 significant trend lines were observed (Figure S8). In trend profile 18, a total of 9,548 genes, the gene expression trend showed a significant upward trend within 0-4 h in response to PEG-6000 (25%) stressed condition. The expression level remained similar between 4 and 8 h and decreased slightly after 8 h. However, the CK was still up-regulated (Figure S9A). In profile 19, a total of 8,876 genes were observed and showed a continuous upward trend of gene expression from 0 - 24 h during drought stress condition (Figure S9B). In trend profile 0, a total of 7,207 genes were found, and the trend was different to profile 19. The gene expression showed a continuous downregulated pattern from 0 - 24 h (Figure S9C). A total of 5,195 genes were found in profile 5; the gene expression pattern showed a significant decrease from 0-2 h followed by an increase in 2-4 h, it remained stable at 4-8 h, and decreased again after 8 h (Figure S9D). In profile16 (4140 genes) was similar to profile18 with significantly increasing trend within 0-4 h, slight reduction between 4 and 8 h, and downregulated after 8 h (Figure S9E). A total of 2,477 genes were observed in profile 2 and similar to profile 5, with significant decrease from 0-2 h, relatively stable in the following 2-4 h, increase in 4-8 h and decline again after 8 h (Figure S9F).
Trend genes GO enrichment analysis
The results of GO enrichment analysis of all trend genes showed a total of 2,986 GO IDs, with 20 significantly enriched, including 13 in a cellular component, 7 in molecular functions, and 0 in the biological process (Figure 9; Table 6). The GO enrichment analysis of 6 significant trends showed the cellular component, profiles 0 and 19 were enriched with the most GO IDs, both of which were 22, while profile 2 was 0. GO:0044425 (membrane part) and GO:0031224 (an intrinsic membrane component) were enriched in 3 trend sets. In molecular function, profile 18 was found to be enriched to the most GO IDs (32), and GO:0016491 (oxidoreductase activity) and GO:0005198 (structural molecule activity) were found in 2 trend sets. GO: 0005488 (binding) and GO: 0003824 (catalytic activity) were found in profiles 18 and 19 with different genes. In biological process, profiles 5, 18, and 19 were enriched with more GO IDs, i.e., 194, 87 and 73, respectively. GO:0008152 (metabolic process) and GO:0071704 (organic substance metabolic process) have a large number of genes, which are enriched in profiles 18 and 19 (Figure 10; Table 7).
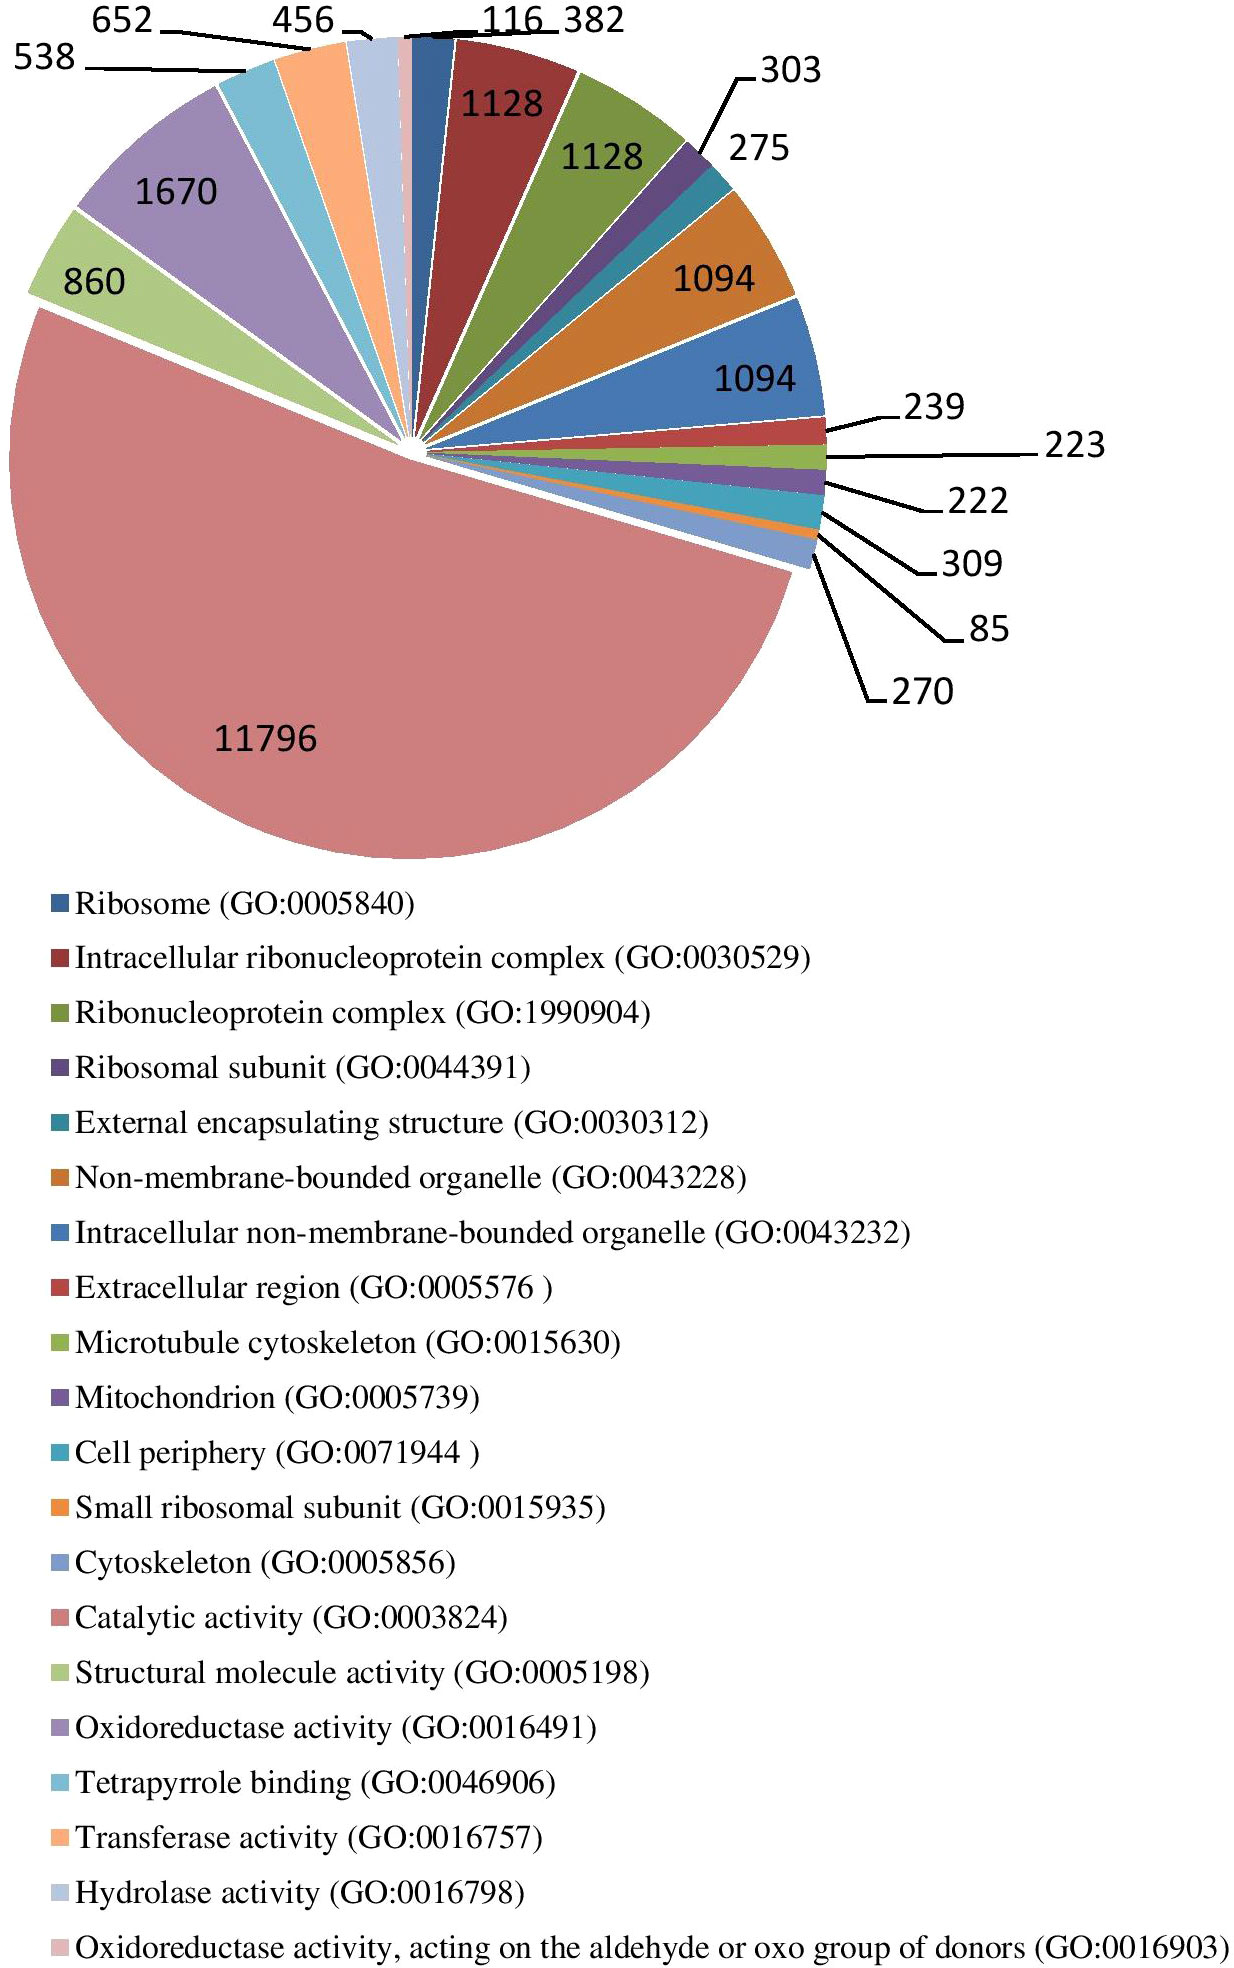
Figure 9 Gene ontology numbers indicated in significant GO IDs in all trends.
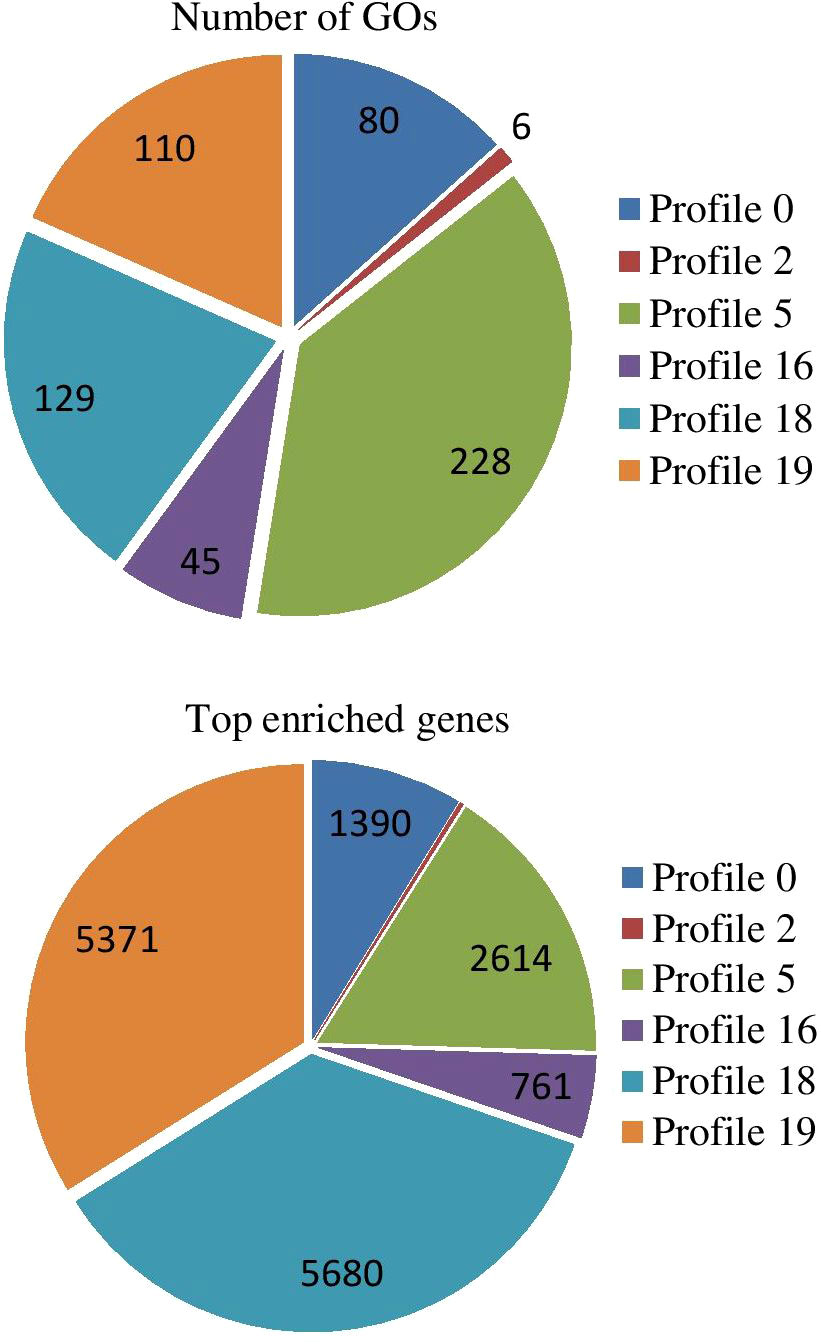
Figure 10 Significant GO enrichment analyses of top enriched genes in different trends.
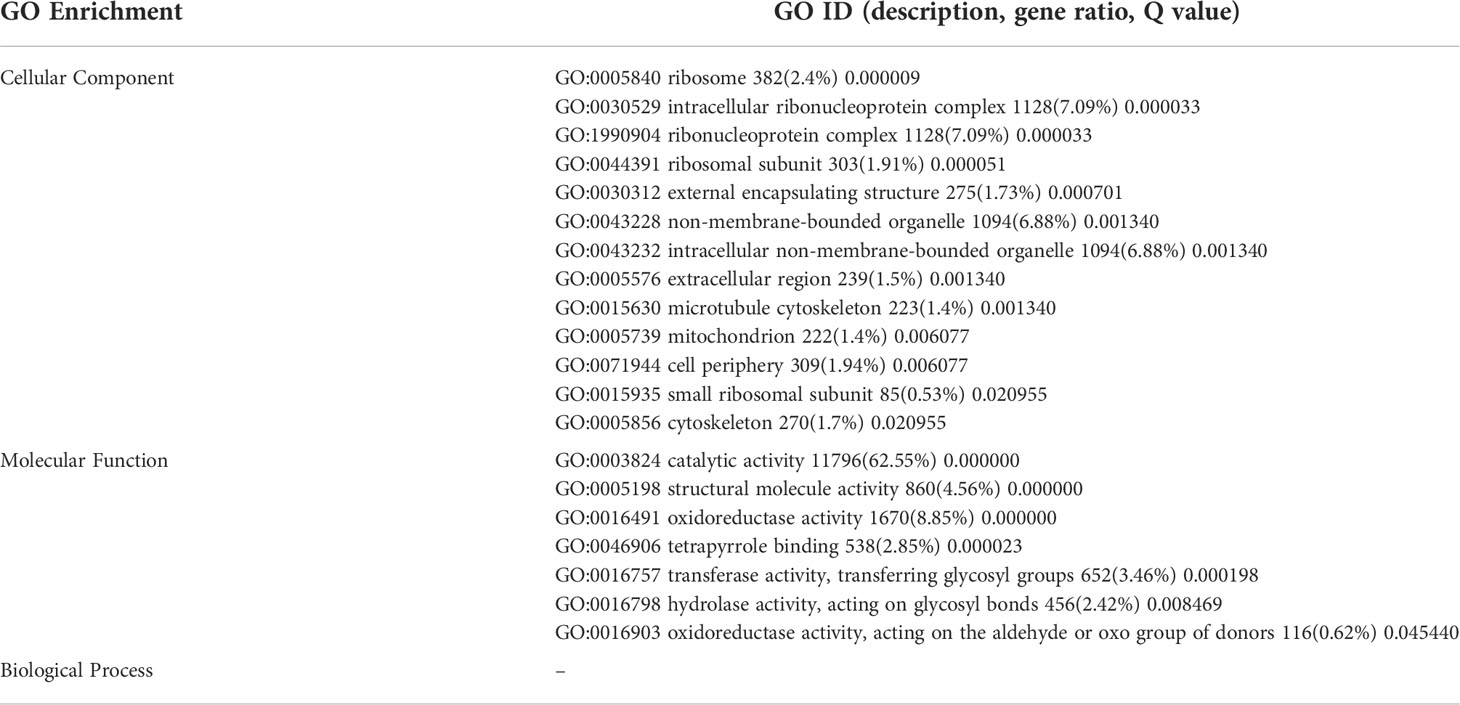
Table 6 Significant GO ID in all trends.
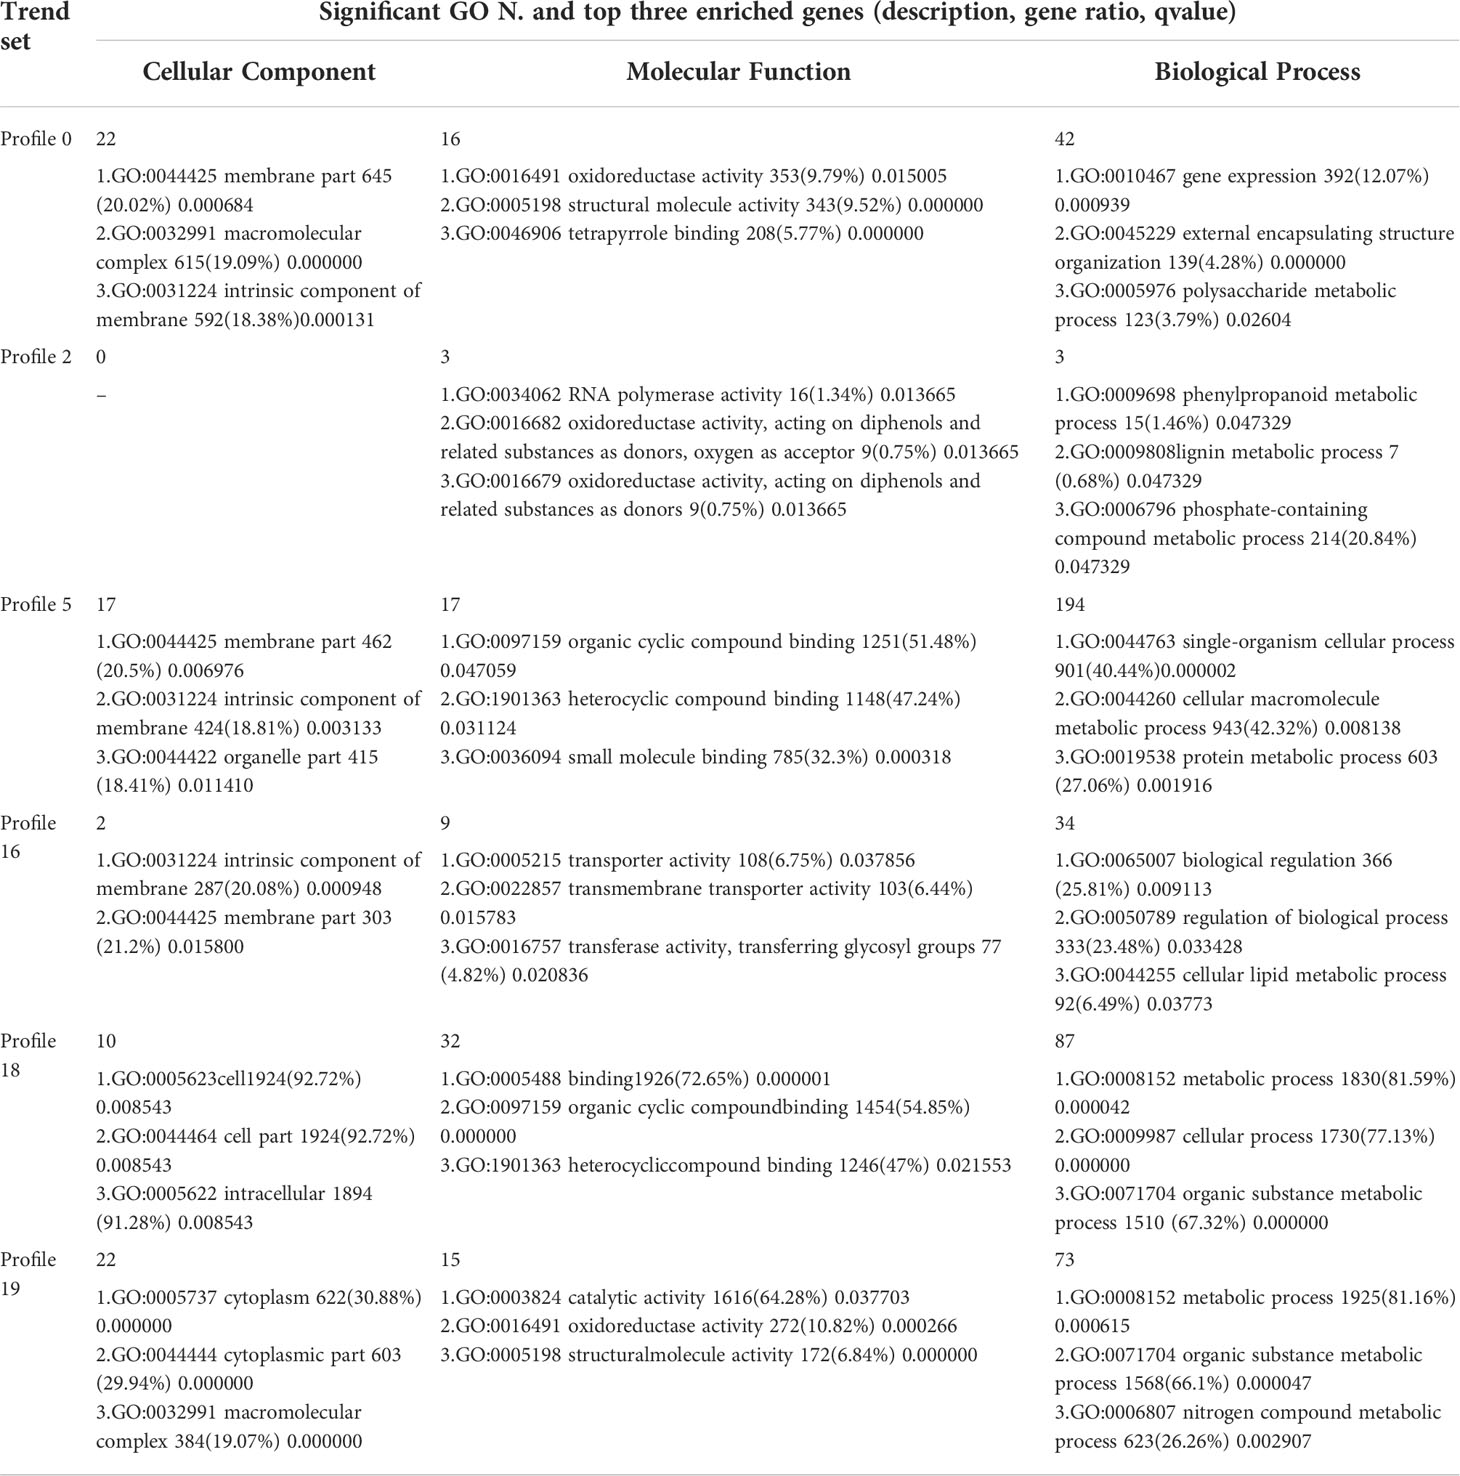
Table 7 Significant GO Enrichment in six significant trends.
Trend genes KEGG enrichment analysis
KEGG enrichment analysis was performed on all trend genes, and a total of 19 KEGG B class pathways and 130 KEGG pathways were observed (Figure 11). Pathway-related genes account for more percentage in the distribution of each trend gene set, with carbon metabolism (25.14%), translation (21.35%), and global and overview accounting for 17.36% (Figure 12A). More genes were significantly enriched in the pathways such as the ribosome (ko030101042; 13.19%), carbon metabolism (ko01200596; 7.55%), biosynthesis of amino acids (ko01230454; 5.75%), as shown in Figure 12B. KEGG analysis of 6 significant trends showed 42 effective pathways were enriched, and 5,630 DEGs were distributed in 6 trend sets (Table 8). The most important pathways and DEGs were enriched in profile 19. Ribosome (ko03010) pathway was found most enriched genes in profiles 0, 2 and 19.
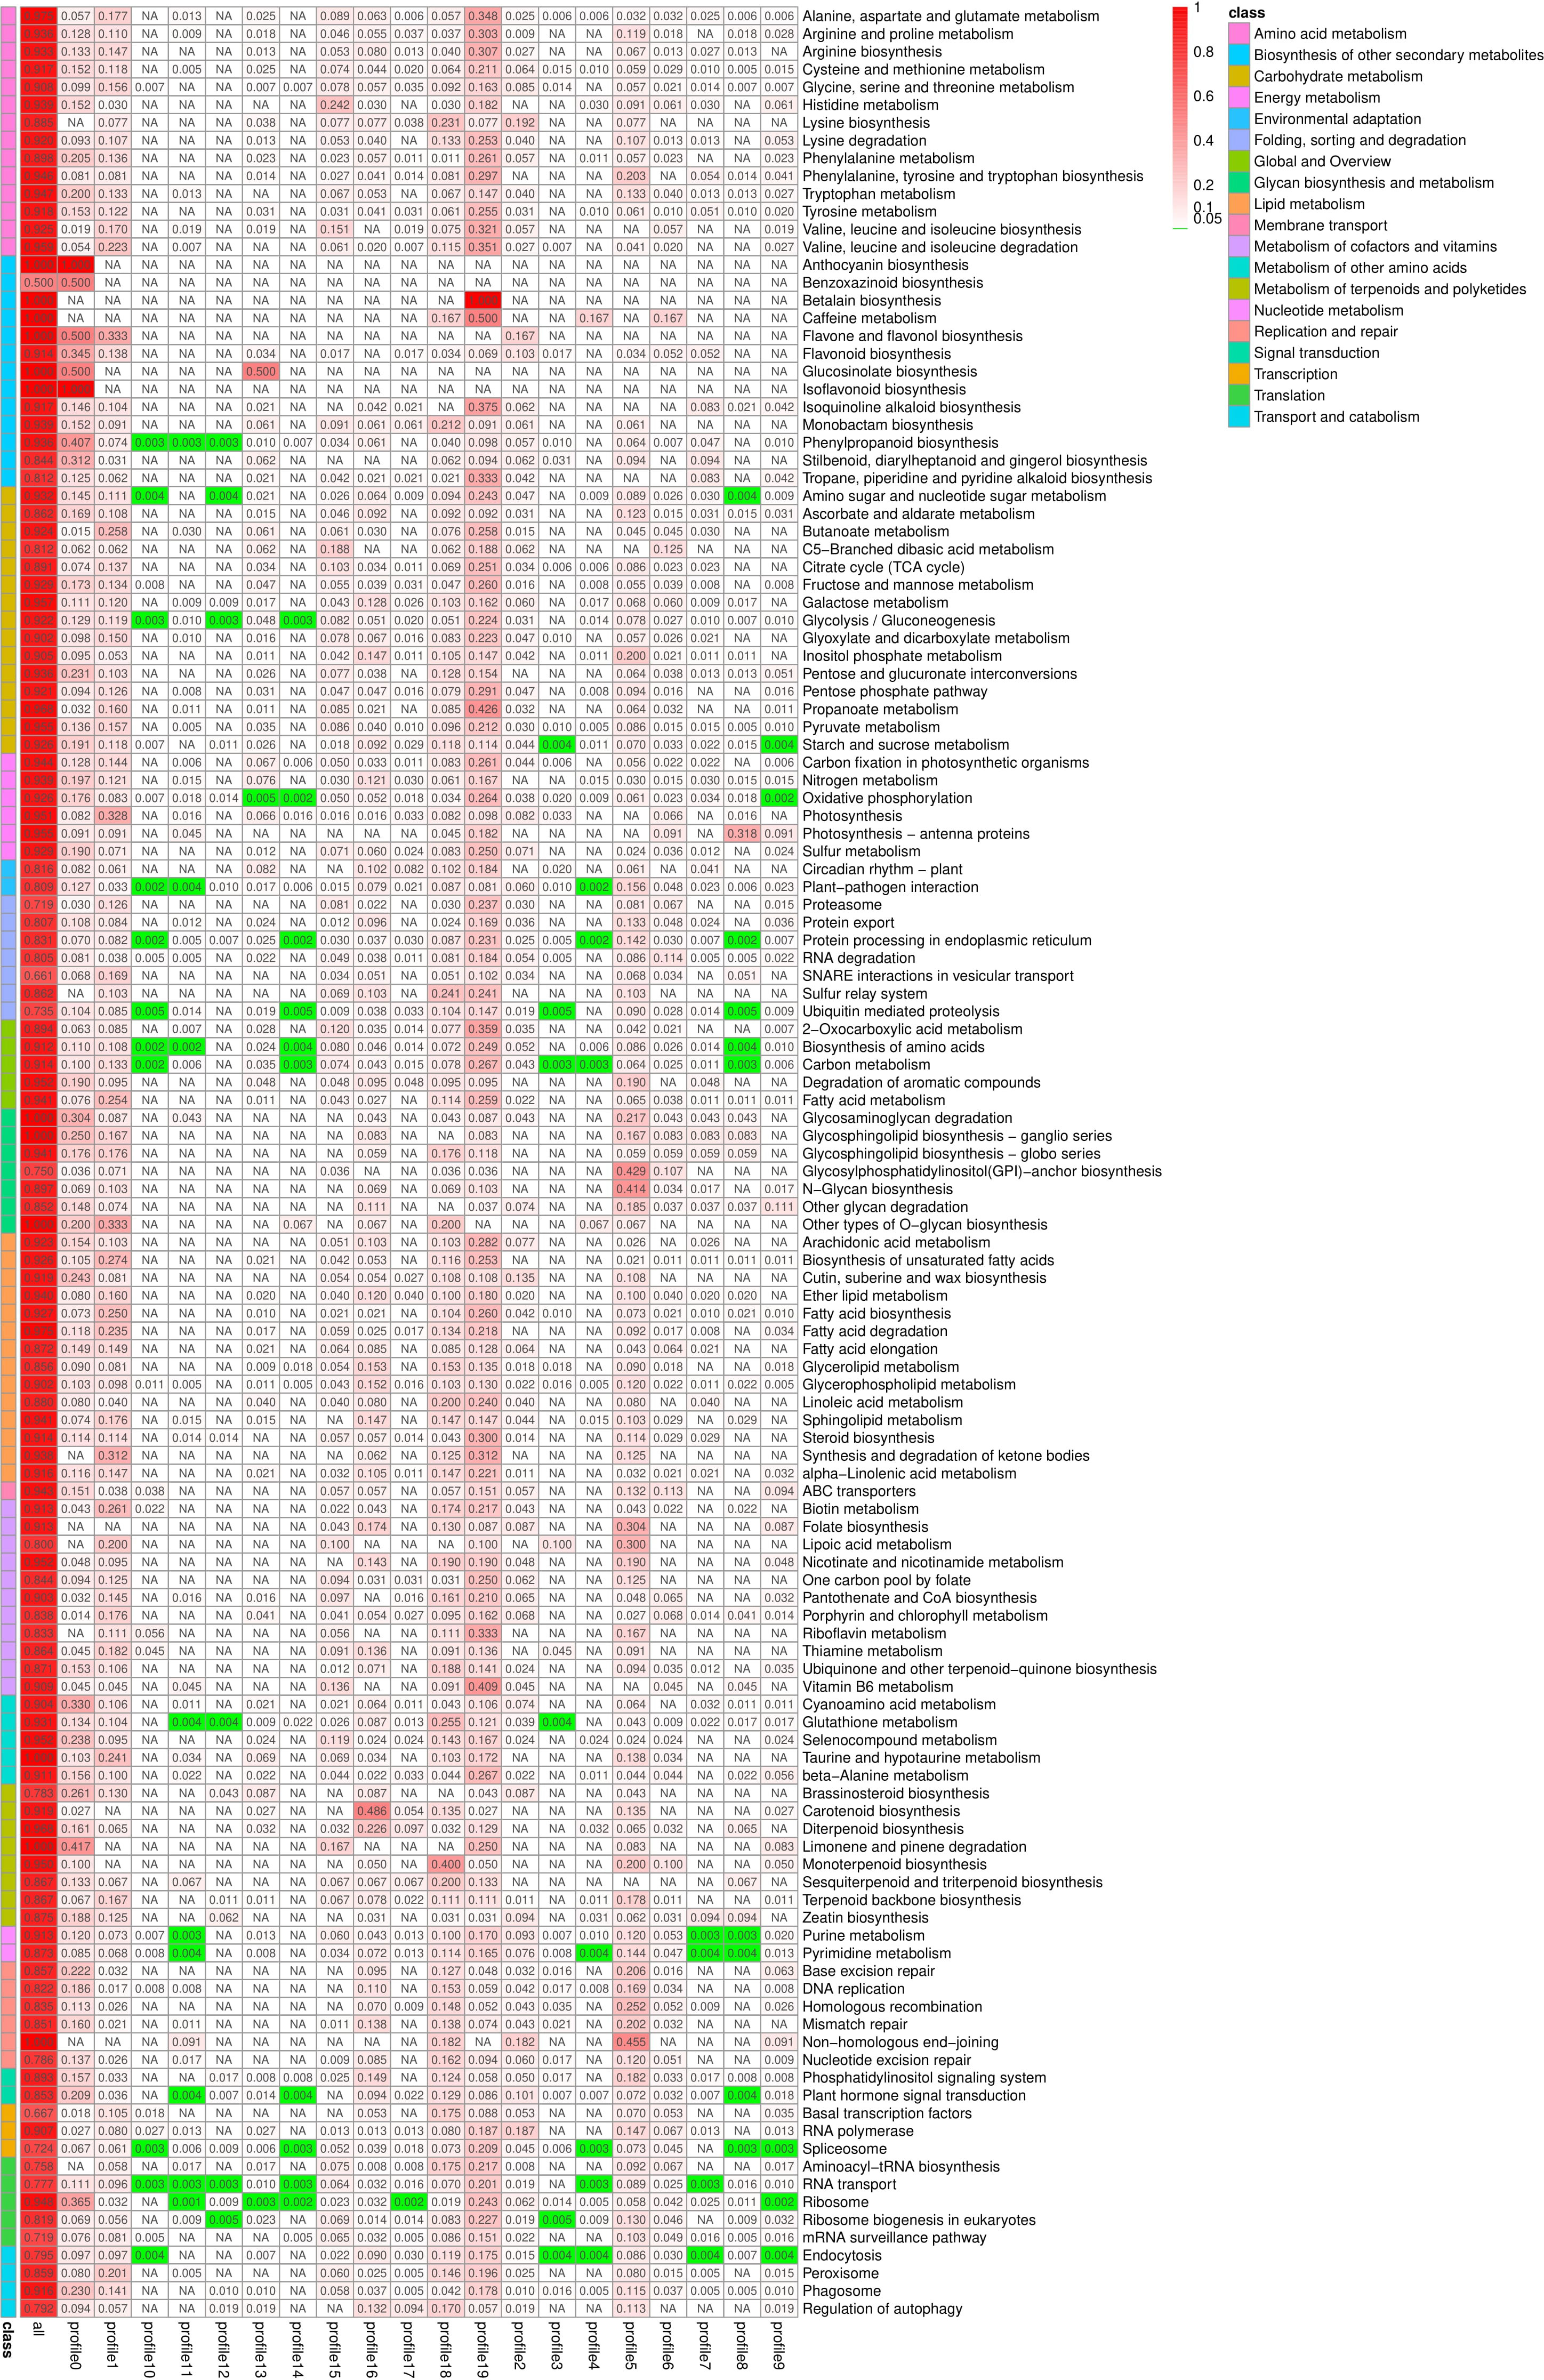
Figure 11 Pathway enrichment analysis rich factor heat map. NA, Not applicable.
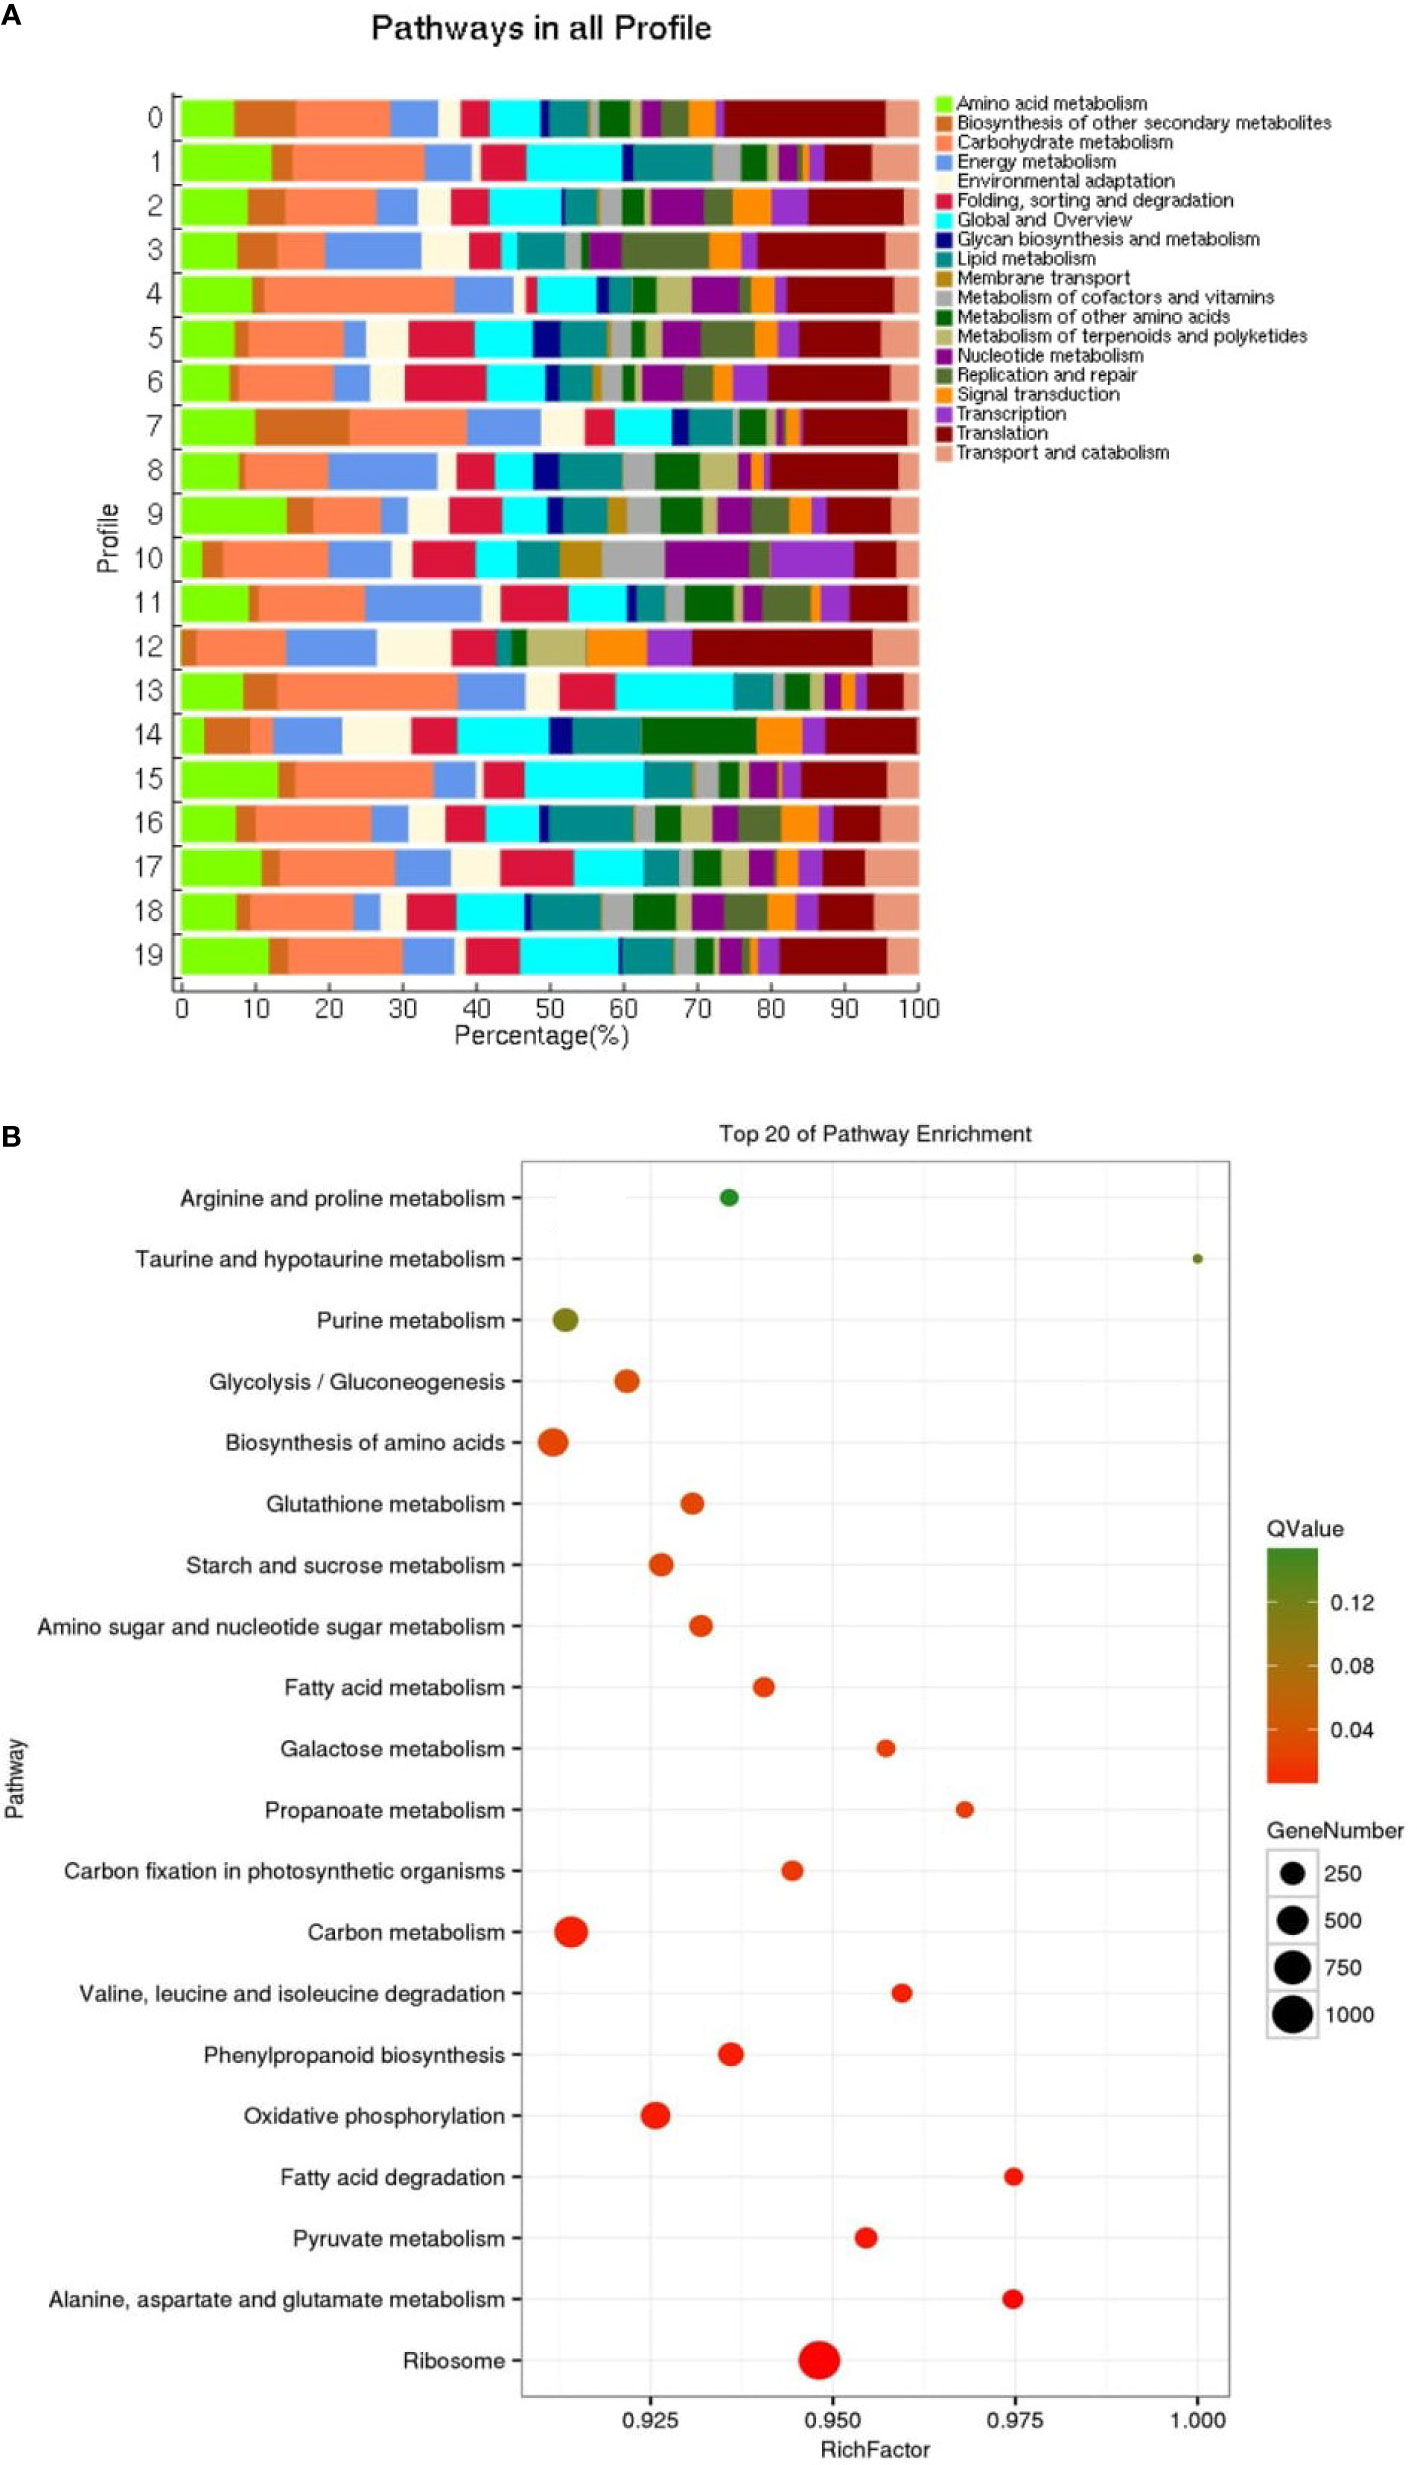
Figure 12 Distribution pathway (A) in all profiles and pathway enrichment (B) of all genes (top 20).
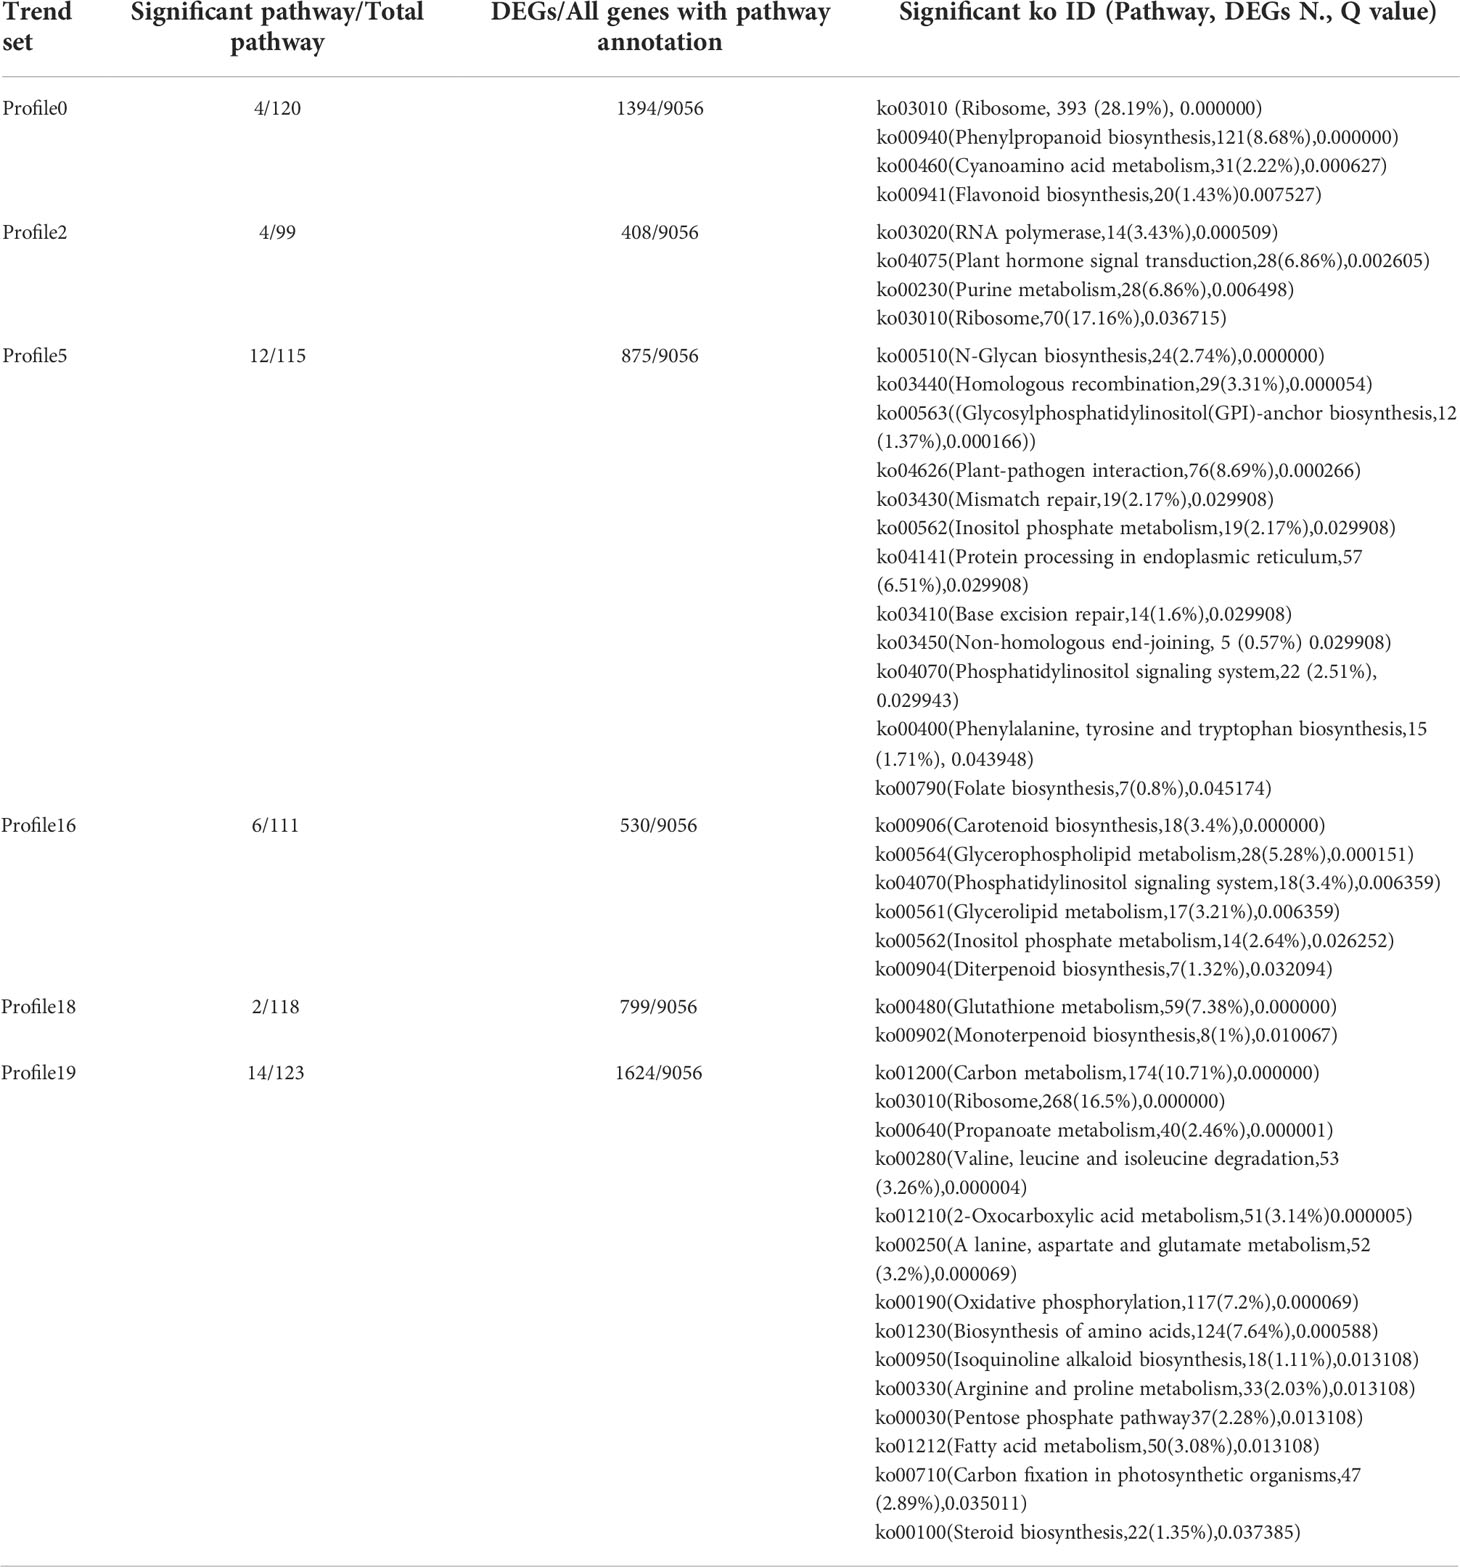
Table 8 Significant KEGG ID in six significant trends.
Gene validation
Up-regulated differentially expressed genes, such as ABA response component binding factor, phosphatidylinositol phosphate 5-kinase, snRK2, glutamine synthetase, 90 kDa β-heat shock protein, pyrroline-5-carboxylate reductase, glutathione synthetase, serine/threonine-protein kinase, glutathione reductase, calmodulin, phosphoinositide 4-kinase A, and ETR were selected to assess the transcriptomic sequencing results with qRT-PCR. In particular, the ABA response component binding factor and snRK2 are associated with ABA metabolism. The results showed that most genes were significantly up-regulated within 8 h during drought stress. Between 8 and 24 h, 9 genes were found up-regulated and 3 down-regulated (Figure 13). The 12 genes were clustered into two categories, among which Unigene0036685, Unigene0033103 and Unigene0042703 belong to one category (Figure 6).
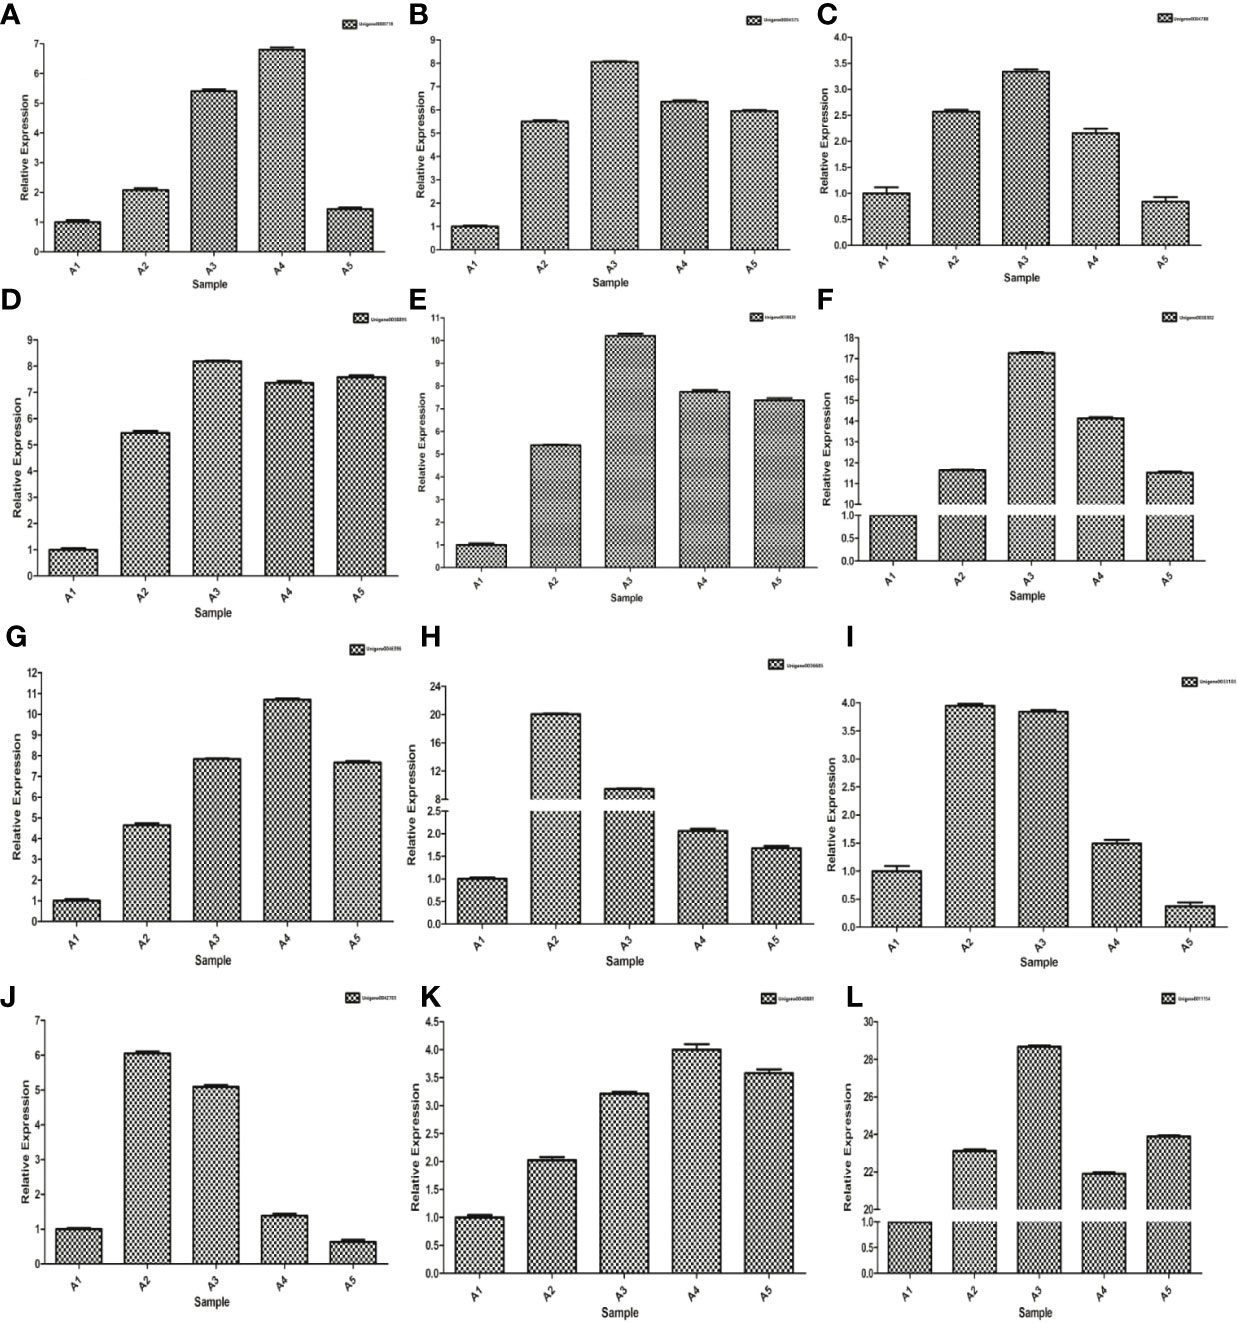
Figure 13 qRT-PCR expression validations of 12 genes. (A) Unigene0000718, (B) Unigene0004575, (C) Unigene0004788, (D) Unigene0011154, (E) Unigene0033103, (F) Unigene0036685, (G) Unigene0038302, (H) Unigene0038820, (I) Unigene004038895, (J) Unigene0040881, (K) Unigene0042703 and (L) Unigene0046396.
Discussion
Drought stress is a major limiting factor for proper plant growth and development, especially crop production (Liu et al., 2015; Verma et al., 2021; Verma et al., 2022). It affects various physiological and biochemical activities, i.e., photosynthetic CO2 assimilation rate, chlorophyll synthesis, and nutritional metabolism (Li et al., 2011; Osakabe et al., 2014). Plants rapidly accumulate small molecules that help adjust osmotic response to water deficient conditions (Verma et al., 2021). Reduction in cells’ water potential enhances cells’ efficiency in absorbing and retaining water. It also maintains the swelling pressure of cells and ensures the proper functioning of plant physiological processes (Blum, 2017). Plants have a physiological adaptive strategy to respond to variations in soil moisture (%) and resistance to drought-stress conditions (Farooq et al., 2009). Osmotic adjustment is an essential physiological adaptive strategy of plants subjected to stress (Verma et al., 2022). Overproduction of ROS accumulation may cause oxidative injury at the cellular level, damage cell membranes, and lead to enzyme inactivation, degradation of protein, and cell ion disturbances (Tarchoune et al., 2010). Plants can eliminate the excess production of ROS in cells via enzymatic and non-enzymatic antioxidative systems (Rao and Chaitanya, 2016; Li et al., 2022).
The transcriptomic sequencing approaches are widely applied to assess plant metabolic pathways, identify new transcripts, enhance genome annotation, and screen for specific functional genes during stress conditions (Zhang et al., 2018; Felix, 2019). In the present study, there were significant changes in S. spontaneum transcript levels during drought stress. Pathway annotation revealed that the DEGs were mainly enriched in plant hormone signal transduction, alanine, aspartate, glutamate metabolism, protein processing in the endoplasmic reticulum, nitrogen metabolism, ABC transporters, plant-pathogen interaction, and pyrimidine metabolism. These findings verified the transcriptomic analysis results of sugarcane during osmotic stress (Santana et al., 2017). Most of the genes were significantly upregulated at 8 h after drought stress, suggesting that stress stimulated S. spontaneum sterols to protect cells and balance normal photosynthetic responses. Similarly, the transcriptome responses reported that the phosphoesterase gene was upregulated and significantly impacted sugarcane stressed plants. Plant responses begin with stress situations at the cellular level via activation of signal transduction pathways (Wang et al., 2020; Li et al., 2022).
The perception of water stress can trigger the activation of abscisic acid (ABA)-dependent and ABA-independent regulatory systems that govern drought-inducible gene expression (Shinozaki and Yamaguchi-Shinozaki, 2007). Genes in response to the drought-stress can be differentiated into two groups based on their functions (Shinozaki and Yamaguchi-Shinozaki, 1997; Yamaguchi-Shinozaki and Shinozaki, 2006). The first group of gene products are involved in protecting cells and regulating the signal transduction pathways of stress responses. LEA genes have been reported to protect cell structures from the effects of water loss (Bray, 1993). The LEA gene products are proposed to be located in the cytoplasm and have several features, such as hydrophilism, biased in amino acid composition, and lacking of Cys and Trp. They mainly function in the sequestration of ions, protection of other proteins or membranes, and renaturation of unfolded proteins (Bray, 1993).
Genes encoding heat shock proteins (HSPs) have also been identified to contribute drought-stress tolerance plants (Shinozaki and Yamaguchi-Shinozaki, 2007). In different plant organs of the Indian sugarcane variety (CoS 767), genes encoding HSPs are shown to be up-regulated in response to drought stress (Gupta et al., 2010). In addition, genes encoding ribosomal proteins and putative disease-resistance proteins are also identified to be up-regulated in sugarcane plant organs subjected to drought stress conditions (Gupta et al., 2010). Like ribosomal protein and disease resistance protein, it is difficult to identify the regulation of genes encoding the major water channel proteins – aquaporins – in plant leaves during stress. Aquaporins are water transporter proteins essential in adjusting or maintaining the water status during adverse environmental variables (Luu and Maurel, 2005). Other gene products associated with signal transduction, such as lipid-transfer proteins and LHCB proteins, have also been reported to be induced by drought stress in commercial sugarcane varieties (Rodrigues et al., 2009; Rodrigues et al., 2011).
Our study agreed on the expression changes of some known gene families in S. spontaneum in response to polyethylene glycol- 6000 stimulated drought stress. A total of 57,036,239 bases were assembled in the experiment, and 62,988 genes were obtained (Table S3). The unigenes have coverage distribution on reads of 1-1000 and above in S. spontaneum. Unigenes covering 11-100 reads were at 23216, followed by unigenes covering more than 1000 reads at 6431. Comprehensive analysis shows that the quality of the completed assembly was good. These possible novel genes were identified and required more experiments to explore. Further, their functions in water resistance in S. spontaneum are still unknown and need to be studied.
Conclusion
In conclusion, we performed the combination of transcriptomic sequencing and differential expression analyses to identify pathways and genes altered under drought stress. Several physiological traits showed various trends, and transcripts in various metabolic processes reacted rapidly and strongly in response to drought stress. Genes in pathways of phenylpropanoid biosynthesis and biosynthesis of amino acids were greatly activated, and they may play important roles in stress tolerance in roots of S. spontaneum. Genes associated with ABA synthesis; ABA and solute transport were up-regulated during early drought stress in plant root tips. The differently expressed genes of 56237 (T4), 59319 (T8), and 58583 (T24), among which CK obtained the most significant number of expressed genes (35920) as compared to T24, with a total of 53683 trend genes. Our research is the first to explore the molecular mechanism and provide valuable information on differentially expressed metabolic pathways and genes of S. spontaneum in response to drought stress. This transcriptomic data will also stand as an excellent resource to explore drought stressed genes and assist in sustainable sugarcane improvement in years to come.
Data availability statement
The original contributions presented in the study are publicly available. This data can be found at NCBI, accession number PRJNA835339.
Author contributions
K-CW, C-MH, KV, and LX conduct the experiment. Z-ND, TP, and H-QC made statistical analyses. H-RH, H-QC, H-BL, and S-LJ participated in the analytical analysis. K-CW, C-MH, and KV wrote the first draft of the manuscript. All authors contributed to the article and approved the submitted version.
Funding
This work was financially supported by the National Natural Science Foundation of China (32060468, 31400281) and Guangxi Natural Science Foundation (2020GXNSFBA159024; 2020GXNSFAA259061).
Acknowledgments
We are grateful to Guangxi Academy of Agricultural Sciences, Nanning, Guangxi, China, for providing the necessary facilities and Guangzhou Genedenovo Biotechnology Co., Ltd. to assist in sequencing and bioinformatics analysis.
Conflict of interest
The authors declare that the research was conducted in the absence of any commercial or financial relationships that could be construed as a potential conflict of interest.
Publisher’s note
All claims expressed in this article are solely those of the authors and do not necessarily represent those of their affiliated organizations, or those of the publisher, the editors and the reviewers. Any product that may be evaluated in this article, or claim that may be made by its manufacturer, is not guaranteed or endorsed by the publisher.
Supplementary material
The Supplementary Material for this article can be found online at: https://www.frontiersin.org/articles/10.3389/fpls.2022.992755/full#supplementary-material
References
Ahmad, M. A., Javed, R., Adeel, M., Rizwan, M., Yang, Y. (2020). PEG 6000-stimulated drought stress improves the attributes of in vitro growth, steviol glycosides production and antioxidant activities in Stevia rebaudiana bertoni. Plants 9, 1552. doi: 10.3390/plants9111552
Baiazidi-Aghdam, M. T., Mohammadi, H., Ghorbanpour, M. (2016). Effects of nanoparticulate anatase titanium dioxide on physiological and biochemical performance of Linum usitatissimum (Linaceae) under well watered and drought stress conditions. Rev. Bras. Bot. 39, 139–146. doi: 10.1007/s40415-015-0227-x
Benjamini, Y., Hochberg, Y. (1995). Controlling the false discovery rate: A practical and powerful approach to multiple testing. J. R. Stat. Soc 57, 289–300. doi: 10.1111/j.2517-6161.1995.tb02031.x
Blum, A. (2017). Osmotic adjustment is a prime drought stress adaptive engine in support of plant production. Plant Cell Environ. 40, 4–10. doi: 10.1111/pce.12800
Bray, E. A. (1993). Molecular responses to water deficit. Plant Physiol. 103 (4), 1035–1040. doi: 10.1104/pp.103.4.1035
Cui, G., Zhao, X., Liu, S., Sun, F., Zhang, C., Xi, Y. (2017). Beneficial effects of melatonin in overcoming drought stress in wheat seedlings. Plant Physiol. Biochem. 118, 138–149. doi: 10.1016/j.plaphy.2017.06.014
Dawood, M. G., El-Awadi, M. E. (2015). Alleviation of salinity stress on Vicia faba l. plants via seed priming with melatonin. Acta Biol. Colombiana 20, 223–235. doi: 10.15446/abc.v20n2.43291
Ernst, J., Bar-Joseph, Z. (2006). STEM: a tool for the analysis of short time series gene expression data-4. BMC Bioinf. 7, 1–11. doi: 10.1186/1471-2105-7-191
Fan, L. N., Deng, H. H., Luo, Q. W., He, H. Y., Li, Y., Wang, Q. N., et al. (2013). Genetic diversity of Saccharum spontaneum l. from eight geographical regions in China assessed by simple sequence repeats. Genet. Mol. Res. 12, 5916–5925. doi: 10.4238/2013.November.26.1
Farooq, M., Aziz, T., Wahid, A., Lee, D. J., Siddique, K. H. M. (2009). Chilling tolerance in maize: Aagronomic and physiological approaches. Crop Pasture Sci. 60, 501–516. doi: 10.1071/CP08427
Felix, G. (2019). Conduct and quality control of differential gene expression analysis using high-throughput transcriptome sequencing (RNA-seq). Methods Mol. Biol. 1834, 29–43. doi: 10.1007/978-1-4939-8669-9_2
Grabherr, M. G., Haas, B. J., Yassour, M., Levin, J. Z., Thompson, D. A., Amit, I., et al. (2011). Full-length transcriptome assembly from RNA-seq data without a reference genome. Nat. Biotechnol. 29, 644–652. doi: 10.1038/nbt.1883
Gupta, V., Raghuvanshi, S., Gupta, A., Saini, N., Gaur, A., Khan, M. S., et al. (2010). The water-deficit stress- and red-rot-related genes in sugarcane. Funct. Integr. Genomics 10 (2), 207–214. doi: 10.1007/s10142-009-0144-9
Huang, N., Fang, Z., Li, L., Que, Y., Zhu, Y., Deng, X., et al. (2021). Identification and expression analysis of the PIN gene family in Saccharum spontaneum. Mol. Plant Breed. 19, 6338–6347. doi: 10.13271/j.mpb.019.006338
Jiang, C., Cui, Q., Feng, K., Xu, D., Li, C., Zheng, Q. (2016). Melatonin improves antioxidant capacity and ion homeostasis and enhances salt tolerance in maize seedlings. Acta Physiol. Plantarum 38, 82. doi: 10.1007/s11738-016-2101-2
Kamran, M., Wennan, S., Ahmad, I., Xiangping, M., Wenwen, C., Xudong, Z., et al. (2018). Application of paclobutrazol affect maize grain yield by regulating root morphological and physiological characteristics under a semi-arid region. Sci. Rep. 8, 1–15. doi: 10.1038/s41598-018-23166-z
Laxa, M., Liebthal, M., Telman, W., Chibani, K., Dietz, K. J. (2019). The role of the plant antioxidant system in drought tolerance. Antioxidants 8, 94. doi: 10.3390/antiox8040094
Liang, D., Ni, Z., Xia, H., Xie, Y., Lv, X., Wang, J., et al. (2019). Exogenous melatonin promotes biomass accumulation and photosynthesis of kiwifruit seedlings under drought stress. Sci. Horticult. 246, 34–43. doi: 10.1016/j.scienta.2018.10.058
Li, C., Jiang, D., Wollenweber, B., Li, Y., Dai, T., Cao, W. (2011). Waterlogging pretreatment during vegetative growth improves tolerance to waterlogging after anthesis in wheat. Plant Sci. 180, 672–678. doi: 10.1016/j.plantsci.2011.01.009
Li, P., Lin, P., Zhao, Z., Li, Z., Liu, Y., Huang, C., et al. (2022). Gene Co-expression analysis reveals transcriptome divergence between wild and cultivated sugarcane under drought stress. Int. J. Mol. Sci. 23, 569. doi: 10.3390/ijms23010569
Liu, J., Wang, W., Wang, L., Sun, Y. (2015). Exogenous melatonin improves seedling health index and drought tolerance in tomato. Plant Growth Regul. 77, 317–326. doi: 10.1007/s10725-015-0066-6
Liu, D., Wu, L., Naeem, M. S., Liu, H., Deng, X., Xu, L., et al. (2013). 5-aminolevulinic acid enhances photosynthetic gas exchange, chlorophyll fluorescence and antioxidant system in oilseed rape under drought stress. Acta Physiol. Plantarum 35, 2747–2759. doi: 10.1007/s11738-013-1307-9
Liu, Y., Yao, Y., Hu, X., Xu, L., Gao, Y., An, D. (2018). Cloning and allelic variation analysis of SsREMO-1 gene in Saccharum spontaneum L. Mol. Plant Breed. 16, 111–119. doi: 10.13271/j.mpb.016.002166
Li, S., Wang, X., Yang, Q. (2018). The ploidy identification of Saccharum spontaneum collected from Myanmar based on 5S rDNA-FISH localization. Mol. Plant Breed. 16, 1229–1235. doi: 10.13271/j.mpb.016.001229
Li, R. Q., Yu, C., Li, Y. R., Lam, T. W., Yiu, S. M., Kristiansen, K., et al. (2009). SOAP2: an improved ultrafast tool for short read alignment. Bioinformatics 25, 1966–1967. doi: 10.1093/bioinformatics/btp336
Luu, D. T., Maurel, C. (2005). Aquaporins in a challenging environment: molecular gears for adjusting plant water status. Plant Cell Environ. 28 (1), 85–96. doi: 10.1111/j.1365-3040.2004.01295.x
Mortazavi, A., Williams, B. A., McCue, K., Schaeffer, L., Wold, B. (2008). Mapping and quantifying mammalian transcriptomes by RNA-seq. Nat. Methods 5, 621–628. doi: 10.1038/nmeth.1226
Naeem, M., Naeem, M. S., Ahmad, R., Ahmad, R., Ashraf, M. Y., Ihsan, M. Z., et al. (2018). Improving drought tolerance in maize by foliar application of boron: Water status, antioxidative defense and photosynthetic capacity. Arch. Agron. Soil Sci. 64, 626–639. doi: 10.1080/03650340.2017.1370541
Osakabe, Y., Osakabe, K., Shinozaki, K., Tran, L. S. P. (2014). Response of plants to water stress. Front. Plant Sci. 5. doi: 10.3389/fpls.2014.00086
Qi, Y., Gao, X., Zeng, Q., Zheng, Z., Wu, C., Yang, R., et al. (2022). Sugarcane breeding, germplasm development and related molecular research in China. Sugar Tech. 24 (1), 73–85. doi: 10.1007/s12355-021-01055-6
Qingqing, S., Zhenfeng, Q., Shujie, G., Shaozhi, L., Xueting, Z., Lilian, H., et al. (2022). Cloning and expression analysis of NAC transcription factors in response to drought in Saccharum spontaneum L. J. Plant Genet. Resour. 23, 906–916. doi: 10.13430/j.cnki.jpgr.20211205001
Rao, D. E., Chaitanya, K. V. (2016). Photosynthesis and antioxidative defense mechanisms in deciphering drought stress tolerance of crop plants. Biol. Plant 60, 201–218. doi: 10.1007/s10535-016-0584-8
Rodrigues, F., Da Graça, J., De Laia, M., Nhani-Jr, A., Galbiati, J., Ferro, M., et al. (2011). Sugarcane genes differentially expressed during water deficit. Biol. Plant 55 (1), 43–53. doi: 10.1007/s10535-011-0006-x
Rodrigues, F. A., de Laia, M. L., Zingaretti, S. M. (2009). Analysis of gene expression profiles under water stress in tolerant and sensitive sugarcane plants. Plant Sci. 176 (2), 286–302. doi: 10.1016/j.plantsci.2008.11.007
Santana, A. P., Alvarado-Robledo, E. J., Zamora-Briseno, J. A., Ayala-Sumuano, J. T., Gonzalez-Mendoza, V. M., Espadas-Gil, F., et al. (2017). Transcriptional profiling of sugarcane leaves and roots under progressive osmotic stress reveals a regulated coordination of gene expression in a spatiotemporal manner. PloS One 12, e0189271. doi: 10.1371/journal.pone.0189271
Sarropoulou, V., Dimassi-Theriou, K., Therios, I., Koukourikou-Petridou, M. (2012). Melatonin enhances root regeneration, photosynthetic pigments, biomass, total carbohydrates and proline content in the cherry rootstock PHL-c (Prunus avium x prunus cerasus). Plant Physiol. Biochem. 61, 162–168. doi: 10.1016/j.plaphy.2012.10.001
Shinozaki, K., Yamaguchi-Shinozaki, K. (1997). Gene expression and signal transduction in water-stress response. Plant Physiol. 115 (2), 327–334. doi: 10.1104/pp.115.2.327
Shinozaki, K., Yamaguchi-Shinozaki, K. (2007). Gene networks involved in drought stress response and tolerance. J. Exp. Bot. 58 (2), 221–227. doi: 10.1093/jxb/erl164
Tarchoune, I., Sgherri, C., Izzo, R., Lachaal, M., Ouerghi, Z., Navari-Izzo, F. (2010). Antioxidative responses of Ocimum basilicum to sodium chloride or sodium sulphate salinization. Plant Physiol. Biochem. 48, 772–777. doi: 10.1016/j.plaphy.2010.05.006
Turk, H., Erdal, S., Genisel, M., Atici, O., Demir, Y., Yanmis, D. (2014). The regulatory effect of melatonin on physiological, biochemical and molecular parameters in cold-stressed wheat seedlings. Plant Growth Regul. 74, 139–152. doi: 10.1007/s10725-014-9905-0
Verma, K. K., Singh, P., Song, X.-P., Malviya, M. K., Singh, R. K., Chen, G.-L., et al. (2020). Mitigating climate change for sugarcane improvement: Role of silicon in alleviating abiotic stresses. Sugar Tech. 22, 741–749. doi: 10.1007/s12355-020-00831-0
Verma, K. K., Song, X. P., Lin, B., Guo, D. J., Singh, M., Rajput, V. D., et al. (2022). Silicon induced drought tolerance in crop plants: Physiological adaptation strategies. Silicon 14 (6), 2473–2487. doi: 10.1007/s12633-021-01071-x
Verma, K. K., Song, X. P., Verma, C. L., Chen, Z. L., Rajput, V. D., Wu, K. C., et al. (2021). Functional relationship between photosynthetic leaf gas exchange in response to silicon application and water stress mitigation in sugarcane. Bioll Res. 54, 15. doi: 10.1186/s40659-021-00338-2
Wang, T. J., Wang, X. H., Yang, Q. H. (2020). Comparative analysis of drought-responsive transcriptome in different genotype Saccharum spontaneum l. Sugar Tech. 22, 411–427. doi: 10.1007/s12355-019-00774-1
Waqas, M. A., Kaya, C., Riaz, A., Farooq, M., Nawaz, I., Wilkes, A., et al. (2019). Potential mechanisms of abiotic stress tolerance in crop plants induced by thiourea. Front. Plant Sci. 10, 1336. doi: 10.3389/fpls.2019.01336
Wei, L.-P., Wu, K.-C., Huang, C.-M., Wei, Y.-W., Cao, H.-Q., Xu, L., et al. (2018a). Transcriptome reveals differentially expressed genes in Saccharum spontaneum GX83-10 leaf under drought stress. Sugar Tech. 20, 756–764. doi: 10.1007/s12355-018-0608-0
Wu, K. C., Xu, L., Tang, S., Wei, Y., Huang, C., Cao, H., et al. (2018b). Analysis of cDNA-SCoT differential expression of caucetus gene under drought stress. South. Agric. J. 49, 201–208. doi: 10.3969/j.issn.2095-1191.2018.02.01
Xian, W., Liao, J., Deng, Y., Jing, Y., Wang, L. (2019). Genetic diversity evaluation of wax content and agronomic traits in 38 Saccharum spontaneum leaves. Jiangsu Agric. Sci. 47, 80–83. doi: 10.15889/j.issn.1002-1302.2019.22.017
Xu, L., Deng, Z.-N., Wu, K.-C., Malviya, M. K., Solanki, M. K., Verma, K. K., et al. (2022). Transcriptome analysis reveals a gene expression pattern that contributes to sugarcane bud propagation induced by indole-3-butyric acid. Front. Plant Sci. 13. doi: 10.3389/fpls.2022.852886
Xu, C., Liu, X., Mao, J., Liu, H., Lin, X., Lu, X., et al. (2020). Construction of the core germplasm bank of kuoshoumi based on SSR molecular marker data. J. Hunan Agric. Univ. 46, 657–663. doi: 10.13331/j.cnki.jhau.2020.06.004
Xu, C., Su, H., Liu, H., Lu, X., Li, X., Li, C., et al. (2017). An assessment of genetic diversity of yield-related traits of Saccharum spontaneum from Yunnan Province, China. Sugar Tech. 19, 458–468. doi: 10.1007/s12355-016-0505-3
Yamaguchi-Shinozaki, K., Shinozaki, K. (2006). Transcriptional regulatory networks in cellular responses and tolerance to dehydration and cold stresses. Annu. Rev. Plant Biol. 57, 781–803. doi: 10.1146/annurev.arplant.57.032905.105444
Yang, Y., Gao, S., Su, Y., Lin, Z., Guo, J., Li, M., et al. (2019). Transcripts and low nitrogen tolerance: regulatory and metabolic pathways in sugarcane under low nitrogen stress. Environ. Exp. Bot. 163, 97–111. doi: 10.1016/j.envexpbot.2019.04.010
Yoo, H., Widhalm, J. R., Qian, Y., Maeda, H., Cooper, B. R., Jannasch, A. S., et al. (2013). An alternative pathway contributes to phenylalanine biosynthesis in plants via cytosolic tyrosine: Phenylpyruvate aminotransferase. Nat. Commun. 4, 2833. doi: 10.1038/ncomms3833
Yu, H. X., Tian, C. Y., Jing, Y. F., An, R. D., Lang, R. B., Bian, X., et al. (2019). Principal component clustering analysis and evaluation of the innovative germplasm F2 generation from Yunan Saccharum spontaneum L innovation germplasm. J. Plant Genet. Resour. 20, 624–633. doi: 10.13430/j.cnki.jpgr.20180924002
Zhang, J., Gao, F., Jia, H., Hu, J., Feng, Z. (2019). Molecular response of poplar to single and combined ozone and drought. Sci. Total Environ. 655, 1364–1375. doi: 10.1016/j.scitotenv.2018.11.195
Zhang, G. M., Li, Y. R., He, W. Z., He, H., Liu, X. H., Song, H. Z., et al. (2010). Analysis of the genetic diversity in Saccharum spontaneum l. accessions from Guangxi Province of China with RAPD-PCR. Sugar Tech. 12, 31–35. doi: 10.1007/s12355-010-0007-7
Keywords: gene, transcriptome, signal transduction, drought stress, Saccharum spontaneum
Citation: Wu K-C, Huang C-M, Verma KK, Deng Z-N, Huang H-R, Pang T, Cao H-Q, Luo H-B, Jiang S-L and Xu L (2022) Transcriptomic responses of Saccharum spontaneum roots in response to polyethylene glycol – 6000 stimulated drought stress. Front. Plant Sci. 13:992755. doi: 10.3389/fpls.2022.992755
Received: 14 July 2022; Accepted: 28 September 2022;
Published: 24 October 2022.
Edited by:
Nobuhiro Suzuki, Sophia University, JapanReviewed by:
Sangeeta Srivastava, Indian Institute of Sugarcane Research (ICAR), IndiaKhurram Bashir, Lahore University of Management Sciences, Pakistan
Copyright © 2022 Wu, Huang, Verma, Deng, Huang, Pang, Cao, Luo, Jiang and Xu. This is an open-access article distributed under the terms of the Creative Commons Attribution License (CC BY). The use, distribution or reproduction in other forums is permitted, provided the original author(s) and the copyright owner(s) are credited and that the original publication in this journal is cited, in accordance with accepted academic practice. No use, distribution or reproduction is permitted which does not comply with these terms.
*Correspondence: Lin Xu, eHVsaW4xMTA1QDEyNi5jb20=
†These authors have contributed equally to this work