 Chaoqun Xu
 Xiang Liu
 Guoan Shen
 Xuelan Fan
 Yue Zhang
 Chao Sun
- Key Laboratory of Bioactive Substances and Resources Utilization of Chinese Herbal Medicines, Ministry of Education & National Engineering Laboratory for Breeding of Endangered Medicinal Materials, Institute of Medicinal Plant Development, Peking Union Medical College and Chinese Academy of Medical Sciences, Beijing, China
Herba Epimedii (Epimedium) leaves are rich in prenylated flavonol glycosides (PFGs) with high medicinal value. However, the dynamics and regulatory network of PFG biosynthesis remain largely unclear. Here, we combined metabolite profiling (targeted to PFGs) and a high-temporal-resolution transcriptome to elucidate PFGs’ regulatory network in Epimedium pubescens and identified key candidate structural genes and transcription factors (TFs) involved in PFG accumulation. Chemical profile analysis revealed that PFG content was quite different between buds and leaves and displayed a continuous decline with leaf development. The structural genes are the determinant reasons, and they are strictly regulated by TFs under temporal cues. We further constructed seven time-ordered gene co-expression networks (TO-GCNs) of PFG biosynthesis genes (including EpPAL2, EpC4H, EpCHS2, EpCHI2, EpF3H, EpFLS3, and EpPT8), and three flavonol biosynthesis routines were then predicted. The TFs involved in TO-GCNs were further confirmed by WGCNA analysis. Fourteen hub genes, comprising 5 MYBs, 1 bHLH, 1 WD40, 2 bZIPs, 1 BES1, 1 C2H2, 1 Trihelix, 1 HD-ZIP, and 1 GATA were identified as candidate key TFs. The results were further validated by TF binding site (TFBS) analysis and qRT-PCR. Overall, these findings provide valuable information for understanding the molecular regulatory mechanism of PFGs biosynthesis, enriching the gene resources, which will guide further research on PFG accumulation in Epimedium.
Introduction
Epimedium herb (yin-yang-huo), a well-known traditional Chinese medicine (TCM), is recognized as a prominent prenyl-flavonol glycoside producer with high medicinal value. To date, only Epimedium and Vancouveria (sister genus of Epimedium, distributed in North America) have a high content of these prenylated flavonol glycosides (PFGs). Pharmacological evidence suggested that PFGs are the major active ingredients, and four of these (Epimedin A, Epimedin B, Epimedin C, and icariin) are used as important bioactive markers for quality control (Xie et al., 2010; Ma et al., 2011). PFGs possess superior capability in being neuro- and cardio-protective (Wang et al., 2007) and have also been used for enhancing reproductive function and anti-aging (Kang et al., 2012). In 2022, icaritin, an aglycone of all PFGs, was approved as a new drug to inhibit hepatocellular carcinoma (HCC) initiation and malignant growth (Zhu et al., 2011; Zhao et al., 2015). Epimedium species was predicted as an important and promising medicinal plant with broad market demand, but wild resources of medicinal Epimedium species have declined dramatically in recent years due to over-harvesting and habitat destruction (Zhang et al., 2009).
Epimedium is a leafy herbal medicinal plant. The information regarding PFG accumulation dynamics and regulation is scarce. The total PFG content, especially at harvest, is usually what is referred to in traditional use. A systematic understanding of PFG content dynamics could explore the genetic mechanisms and guide the harvesting practice. Huang et al. (2015) reported a study on the dynamic changes of PFGs in leaf developmental process of E. sagittatum and suggested that the total content (sum of the content of Epimedin A, B, C and icariin) peaked at folded young leaf with erected petiole stage and then sequentially decreased. Epimedin C constituted the main component and showed a similar trend.
To date, the majority of structural genes of PFGs biosynthesis pathway have been identified in Epimedium (Zeng et al., 2013a; Zeng et al., 2013b; Huang et al., 2015; Pan et al., 2017; Feng et al., 2018; Feng et al., 2019; Lyu, 2020; Yang X et al., 2020; Liu Y et al., 2021; Wang et al., 2021; Shen et al., 2022). Of these, four flavonoid skeleton genes, EwPAL, Ew4CL1, EwCHS1, and EwCHI1 (Liu Y et al., 2021), one EpsFLS gene (Pan, unpublished), modification enzyme genes including two PTs, EsPT2, and EpPT8 (Wang et al., 2021; Shen et al., 2022), prenylated flavonoid glycosides with a kind of glycosylation at the 7-OH position of the A-ring, EpsGT8, EsGT1,and Ep7GT (Feng et al., 2019; Yang X et al., 2020; Yao et al., 2022a), glycosylation at the 3-OH position of the C-ring, EpsGT8, EsGT1,Ep7GT, Ek3RT, and Eps3RT (Feng et al., 2018; Lyu, 2020), glycosylation at the 3-O-rhamnoside position, EpF3R2″XylT (Yao et al., 2022b), and one OMT gene, EkOMT1 (Zhou J, 2021), have been functionally verified. The available public gene resources can be of great help in exploring the regulation of PFGs biosynthesis.
There have been few studies on TFs that focused on the regulation of the structural genes of flavonoids in Epimedium. Some TFs acted in a manner of MYB-bHLH-WD40 (MBW) complex. EsAN2 (Huang et al., 2016b) and EsMYBA1 (Huang et al., 2013) were reported to be involved in anthocyanin biosynthesis pathways and significantly enhanced the anthocyanin accumulation. EsAN2 can significantly upregulate the expression of CHS, CHI, and ANS, while EsMYBA1 regulated CHS, CHI, F3H, DFR, and ANS. In addition, EsMYB7 and EsMYB10 (Huang et al., 2012) were reported to regulate the PA biosynthesis, EsTT8 or EsGL3 (bHLH) and EsTTG1 (WD40) may be the co-factors (Huang et al., 2015). Another type worked only by MYB, such as EsMYBF1 (highly homologous with SG7), and positively regulated flavonol accumulation in a leaf-specific manner by strongly activating the expression of EsF3H and EsFLS (Huang et al., 2016a). EsMYB12 and EsMYB1, belonging to SG4, have been implicated as transcriptional repressors and negatively regulated anthocyanin biosynthesis in all tissues and the biosynthesis of flavonoids in root, respectively (Huang et al., 2012). However, whether more TFs were involved in transcriptional regulation network remain unknown.
Chang et al. (2019) predicted a regulatory cascade of Kranz anatomy development, which is a structure crucial for the high efficiency of photosynthesis in C4 plants by establishing a time-ordered gene co-expression network (TO-GCNs) method that could use 3D (gene expression, condition, and time) time-series transcriptome data. The time order of TF genes in each gene co-expression network (GCN) was assigned by the breadth-first search algorithm initiated from a seed node which is monotonically increased or decreased. TO-GCNs can effectively elucidate relationships among TF vs TF and TF vs key genes during continuous development stages. Based on TO-GCNs, the potential regulators and cascade regulatory networks related to flower coloring of Rhododendron simsii and Syringa oblata were predicted (Yang F. et al., 2020; Ma et al., 2022), the UVB- and UVC-induced early physiological stress responses and the molecular mechanism were characterized in Pinus tabuliformis (Xu et al., 2021; Xu et al., 2022), and recently, poplar ‘84 K’ to salt treatment at time series was analyzed, and the physiological dynamics and the potential regulatory mechanism were solved (Zhao et al., 2023). Therefore, the application of time-series transcriptome can provide a new insight into the gene regulation network involved in PFGs.
Here, we report a comprehensive high-temporal-resolution investigation of transcriptome and metabolome (targeted to PFGs) of leaves at six development stages in E. pubescens. This study highlighted the regulatory mechanism underlying PFGs biosynthesis. We constructed seven TO-GCNs of TFs regulating structural genes in PFG pathways, and a regulation mechanism model was finally proposed. This study provides a road map for understanding the molecular regulatory mechanism of PFGs biosynthesis, which will facilitate further research on PFGs accumulation in Epimedium.
Materials and methods
Plant materials
Plant material E. pubescens was obtained from cultivation bases, Leshan, Sichuan province (43°50′9.66″N, 81°10′21.73″E), during spring to autumn (from 26 March to 26 August) of 2021. Analysis of the PFG content of the mature leaves of seven plants was conducted (three biological replicates for each plant, each repetition has six leaves) prior to the experiment, and three individuals with the closest content were used. The leaf width was preliminarily used as the criterion for determining different developmental stages. Leaf width of 0.5 ± 0.2 ~ 5 ± 0.2 cm with increments of 0.5 cm were collected. Samples were collected at 10:00~11:30 am of a sunny day and were respectively categorized into two parts used for PFG extraction and transcriptome. Each was treated with liquid nitrogen immediately after grafting, stored with dry ice, and quickly transported to Beijing for -80°C conservation under ultralow temperature and further used for RNA extraction and chemical component identification. In total, 42 samples were collected, including a terminal bud as well as 13 leaf sampling points, each with three replicates. Thirty-nine samples were finally used for transcriptome and metabolome determination (leaf width of 4.5 cm was not employed). Due to requirements of sequencing library construction and amount of extraction, 6 and 7 samples are missed, respectively. Finally, 33 and 32 samples were used, respectively, for transcriptome and metabolome analysis. Based on the PCA results of expression levels and PFG contents, the developmental stages were divided, and the sample numbers for each stage were reassigned, as detailed in Supplemental Table 1 and Supplemental Table 2.
PFGs identification and quantification
PFGs were extracted with 99.8% methanol and detected by ultra-high-performance liquid chromatography (UHPLC). Briefly, approximately 0.1 g of each sample was extracted using 1 ml of extraction solution by vortexing at 4°C and subsequent sonification in ultrasonic bath (RK100, Bandelin, Berlin, Germany) for 20 min, then the samples were centrifuged at 12,000 rpm for 10 min, and the supernatants were filtered through a 0.22 μm membrane. Chromatographic separations of compounds in methanol extracts were performed using a Waters ACQUITY I-Class UHPLC system coupled with photo-diode array and quadrupole time-of-flight mass spectrometry (UHPLC-PDA-Q-TOF/MSE) (Waters, Manchester, the United Kingdom). UHPLC-Q-TOF/MSE combined with the UNIFI data analysis platform were adopted to identify the PFGs. UHPLC-PDA was used to determine the relative content of PFGs. Chromatographic settings were as follows: the separation medium was performed on a Waters ACQUITY™ HSS T3 C18 column (100 mm × 2.1 mm) with 1.8 μm particle size (Waters, Ireland) at 40°C. The binary gradient elution system consisted of 0.1% formic acid-water (A) and acetonitrile (B) with a flow rate of 0.6 mL/min, and the absorbance was monitored at 270 nm. Separation was achieved using the following gradient: 0~1.5 min (21% B), 1.5~3 min (24% B), 3~4 min (25% B), 4~6.5 min (29% B), 6.5~7 min (32% B), 7~8 min (44% B), 8~9 min (45% B), 9~11 min (46% B) and 11~20 min (95% B). The injection volume was set to 2 μL. The mass spectrometer (MS) conditions were as follows: electronic impact ion source temperature, 110°C; auxiliary gas (N2) flow rate and temperature, 850 L/h and 450°C, respectively; negative and positive ionization mode were operated, and the capillary voltage was 2.5 and 3 kV, respectively; high and low scanning energy was 30-50 and 4 eV, respectively; the taper hole voltage, 50 V; the scanning range of molecular weight, 100-1,600 Da; and leucineenk ephalin solution was used to correct the accurate mass number.
Masslynx (version: 4.1) was used to analyze the chromatograms and mass spectra. Target compounds were identified by referring to Zhou M. et al. (2021). Peak area was utilized for quantification of all the target compounds. The PFGs standards used were homemade, including Hexandraside F, Epimedin A, Epimedin B, Epimedin C, icariin, 3’’’-carbonyl-2’’-β-L-quinovosyl-icariin, Ikarisoside B, 2’’-O-rhamnopyranosyl Ikarisoside A, Ikarisoside A, Sagittatoside A, Sagittatoside B, icariside I, 2’’-O-rhamnopyranosyl icariside II, icariside II and icaritin. The purity is more than 98%. Three independent experiments were performed, and the mean value was used for further analysis. Principal component analysis (PCA) was provided by R package factoextra. Log transformed and normalized PFGs were used as the inputs. Detailed scripts can be seen in Supplemental File 1.
RNA exaction, library construction, and sequencing
Total RNA was extracted using TRIZOL reagent (Invitrogen, Life Technologies, USA) according to the manufacture’s protocol. NanoDrop ND 1000 (Nanodrop technologies) was initially used to detect the protein contamination, the ratio of OD260/OD280 was strictly controlled at 1.9~2.1, and then the RNA Integrity Number (RIN) was assessed by Agilent Technologies 2100 bioanalyzer (Agilent, Santa Clara,CA). Only when RIN > 8 and 28S/18S ≥ 0.7 was sequencing performed. 39 sequence libraries were constructed and sequenced on Illumina HiSeq 2500 platform in BioMED (https://www.biomedi.com.cn/).
Transcriptome analysis
Trimmomatic (version: 0.36) was utilized to make quality control, raw reads were trimmed via removing adapters, low quality sequences or bases, and contaminations or overrepresented sequences. The clean data were mapped to the E. pubescens genome (Shen et al., 2022) by using HISAT2 (Kim et al., 2015), and hisat2-build and hisat2 were employed to build the index and make alignments, respectively. R package Rsubread (Liao et al., 2019) was adopted to perform gene expression quantification. Gene expression levels were calculated and normalized to transcripts per million (TPM) reads. Differentially expressed genes (DEGs) between each stage were identified with DESeq2 (Love et al., 2014). Genes with Benjamini-Yekutieli false discovery rate (FDR) < 0.05 and |log2(fold change)| >1 were considered to be DEGs. DEGs were subjected to enrichment analysis through gene ontology (GO) and Kyoto Encyclopedia of Genes and Genomes (KEGG) by using the R package clusterProfiler (version: 3.6.0) (Yu G et al., 2012). PCA was provided by R package PCAtools (Blighe and Lun, 2019). Log transformed and normalized gene expression data was used as the inputs. Detailed scripts can be seen in Supplemental File 1.
TF prediction and PFG biosynthetic candidate gene identification
PlantTFDB database (http://planttfdb.gao-lab.org/index.php) and iTAK software (Zheng et al., 2016) were utilized for TF identification. PlantRegMap database (http://plantregmap.gao-lab.org/) was used to identify the WD40 family by homology to Arabidopsis thaliana. PFGs biosynthetic candidate genes were retrieved by using blast or the Hidden Markov Model (HMM) method embedded in HMMER (version: 3.0) (http://hmmer.org/). ClustalW2 (Larkin et al., 2007) and IQ-TREE (Minh et al., 2020) were used for sequence alignment and phylogenetic tree construction, and trees were visualized and modified using iTOL (https://itol.embl.de/) (Letunic and Bork, 2019).
TO-GCNs construction
Three major steps were included for TO-GCNs (Chang et al., 2019): 1) Co-expression cutoffs determination, 2) gene co-expression network (GCN) construction, 3) Time-order of TF gene expression determination. TO-GCNs inputs were the expression profile for each expressed gene (with average TPM > 0.5), which consists of four time points (S1~S4). Pearson correlation coefficient (PCC) values for TFs and gene pairs were calculated, and the cutoff of positive co-expression PCC ≥ 0.85 (p < 0.01) was determined. TFs amounting to 1,020 and genes amounting to 20,966 above PCC ≥ 0.85 in “C1 + C2 +” GCN were constructed. MFSelector (Wong et al., 2020) was applied to identify the seed genes with ascending or descending monotonic patterns. A TF gene FAR1 (Ebr04G048560) with the strongest ascending monotonic pattern was selected as the initial node to generate all time-ordered levels of nodes in the TO-GCNs by breath-first search algorithm. TO-GCNs were visualized by Cytoscape (version: 3.6.1) (Shannon et al., 2003). Detailed scripts can be seen in Supplemental File 1.
Candidate PFGs genes regulatory network inference and TFBS analysis
TO-GCNs was firstly used to predict the candidate direct regulators, which should be co-expressed at the same level as or at one level earlier than the structural gene. Similarly, the second-, third-, and fourth-order candidate TFs were inferred, respectively. Secondly, TFBS analysis of each regulatory network of PFGs biosynthesis genes were predicted by extracting the 5’ upstream 2 Kb sequences and queried against PlantRegMap database. Thirdly, the presence of the TFBS in the promoter region of each network node were further checked.
WGCNA analysis
All expressed genes (with average TPM > 0.5) were applied. Four major steps were included: 1) Co-expression modules were constructed by using the automatic network construction function blockwiseModules with parameters “soft thresholding power = 9”, “mergeCutHeight = 0.25”, and “minModuleSize = 50”; 2) An adjacency matrix and a subsequently topological overlap matrix (TOM) were constructed and converted, respectively; 3) Eigengene for each module was calculated and was used to correlate to PFG content. The networks were visualized by Cytoscape (version: 3.6.1) (Shannon et al., 2003). Detailed scripts can be seen in Supplemental File 1.
qRT-PCR analysis
The pre-extracted RNA was reverse transcribed into cDNA using a HiScript II Reverse Transcriptase-based two-step qPCR kit (Vazyme Biotech Co. Ltd., Nanjing, China). Nine gene pairs were selected for validation. beta-Actin-1 was selected as the internal reference gene. Primer 5.0 software was used for primer design. The amplification system was constructed using a LineGene 9600 Plus quantitative real-time PCR detection system (Bioer, Hangzhou, China) and placed in CFX Connect (Bio-Rad Laboratories Inc. Hercules, CA, USA). Three technical replicates were used for each gene, and three biological replicates were used for samples of each developmental stage. The relative expression of genes was calculated using the 2−ΔΔCt method. Origin (version: 2019) was used for correlation analysis to verify the credibility of transcriptome.
Results
Characterization and identification of PFGs in leaves of E. pubescens
The PFGs were identified as reported previously (Zhou M. et al., 2021). Here, a case for identifying Epimedin A [Supplemental Figure 1, the peak visible at retention time (Rt) of 4.11 min] were illustrated. In high collision energy (CE) of ESI- mode, the peak eluting at Rt = 4.11 produced a fragment ion at m/z 367 [M+HCOO-2Glc-Rha]-, in combination with the evidence of a fragment ion at m/z 313 [M+H-2Glc-Rha-C4H8]+ in high CE of ESI+, the peak eluting at Rt = 4.11 was deduced to be a flavonoid of Type I (Supplemental Figure 2). Then, based on the fragment ion at m/z 883 [M + HCOO]- in low CE of ESI- or at m/z 839 [M+H]+ in low CE of ESI+, the molecular mass was confirmed. Then the glycosyl chain at the C-3 site was inferred from the presence of m/z 839 [M+H]+ and m/z 677 [M+H-Glc]+ in low CE of ESI+, and a loss of 162 Da means the glycosyl ligand connected here is a glucose. The glycosyl chain at the C-7 site was evidenced by m/z 883 [M + HCOO]- and m/z 675 [M+HCOO-Glc]- in low CE of ESI-, and m/z 677 [M+H-glc]+ and m/z 531 [M+H-Glc-Rha]+ in low CE of ESI+, which suggested one glucose and rhamnose moiety, according to the database matching by UNIFI and literature reported (Zhao et al., 2008).Taken together, the peak eluting at Rt = 4.11 min was tentatively identified as Epimedin A (Supplemental Figure 3C). Detailed mass spectrogram of chromatographic for all identified PFGs can be seen in Supplemental Figure 3. Finally, a database was built based on the identified PFGs by UHPLC-Q-TOF/MS and PDA chemometric data, wherein only the commonly observed peaks in PDA chemometric data were used as the marker compounds. As a result, 14 types of PFGs were identified (Table 1 and Supplemental Figure 1). Two backbone types of PFGs, belonging to anhydroicaritin (Type I, C-4′ linked methoxy) and demethylanhydroicaritin (Type II, C-4′ linked hydroxyl), were identified in all samplings (Supplemental Figure 2), with ten and four PFGs included, respectively (Table 1). Detailed major aglycone types, sugarmoieties, and substituent groups in leaves of E. pubescens are summarized in Table 1.
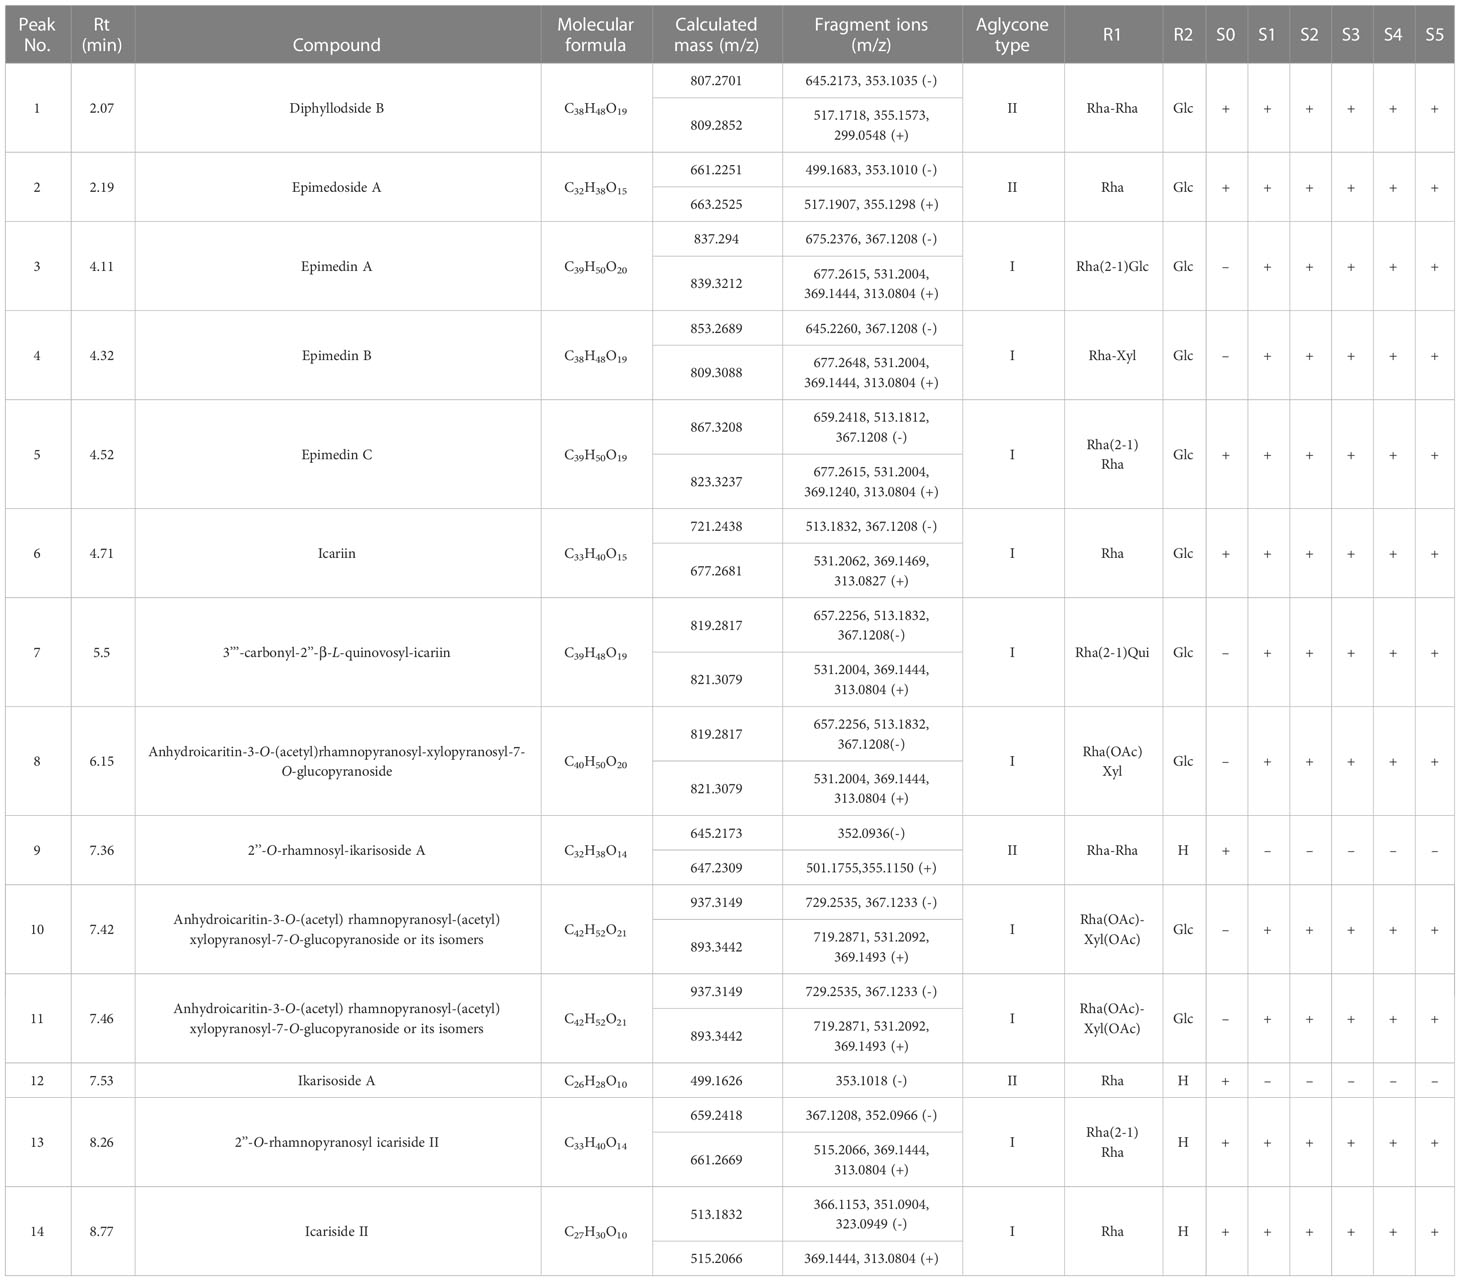
Table 1 UHPLC-Q-TOF/MS metabolic fingerprinting of methanol extracts of E. pubescens buds (S0) and leaves of five developmental stages (S1~S5).
Division of leaf development stages
The development stages were defined based on the integration of PCA analyses against the metabolome (targeted to PFGs) (Supplemental Table 1) and transcriptome Supplemental Table 2) data, respectively. PCA of metabolome data (Figure 1A) showed that the first two PCs cumulatively accounted for ~70% of the total variance. PC1 revealed a clear separation among samples of 1~4 (leaf width of 0.5~1 cm), 5~9 (leaf width of 1.5~2 cm), and 10~30 (leaf width of 2.5~5 cm). These groupings were arranged in a clear time-series manner (from left to right), but samples of 28~30 (old leaf with highly leathery) displayed a different characteristic with samples of 10~27 (leaf width of 2.5~4 cm with middle leathery) in PC2 (Supplemental Table 1). PCA of transcriptome data (expressed genes, defined as average TPM > 0.5) exhibited a similar trend (Figure 1B). PC1 showed dynamic changes over the time-series (from left to right). Samples of 4~10 (leaf width of 0.5~1 cm) and 9~14 (leaf width of 1.5~2 cm) revealed significantly different characteristics and were distinguished from 15~33 (leaf width of 2.5~5 cm), which showed a different characteristic in PC2. Notably, samples of 1~3 (bud stage) was with significantly different characteristics Supplemental Table 2). To sum up, the leaf development can be segregated into six stages: 1) Stage 0 (S0), bud stage; 2) Stage 1 (S1), leaf width is 0.5~1 cm, with low-degree of leathery; 3) Stage 2 (S2), leaf width is 1.5~2 cm, with low-degree of leathery; 4) Stage 3 (S3), leaf width is 2~4 cm, with low-degree of leathery; 5) Stage 4 (S4), leaf width is 5 cm, with middle-degree of leathery; 6) Stage 5 (S5), leaf width is 5 cm, with high-degree of leathery (Figure 2A).
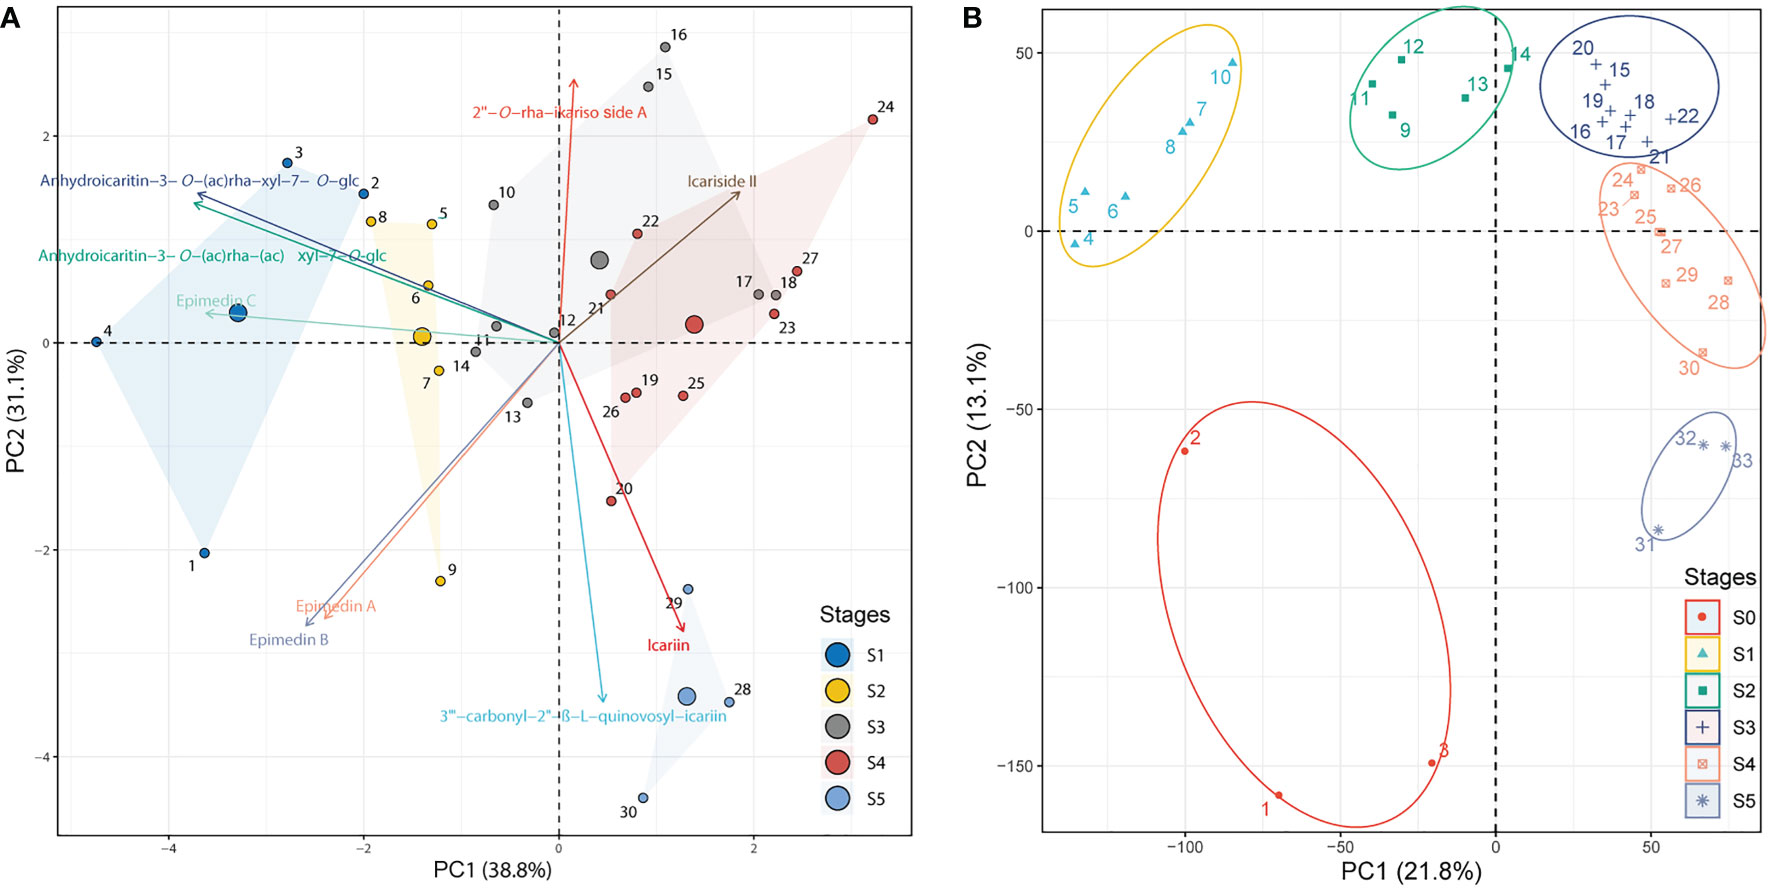
Figure 1 PCA of identified PFGs and gene expression levels. (A) PCA of the content of identified PFGs in all collected samples from S1~S5. The PCA biplot shows both the PC scores of zero-centered and unit-scaled compound quantity data (the dots represented the sampling individuals) and the loadings of variables (the vectors represented the identified PFGs). Seven individuals are not displayed because the insufficient samplings could not meet the extraction requirements. See Supplemental Table 1 for the numerical symbols. (B) PCA of gene expression levels in S0~S5. All expressed genes (average TPM > 0.5) for all collected samples except for six ambiguous individuals were displayed. See Supplemental Table 2 for the numerical symbols.
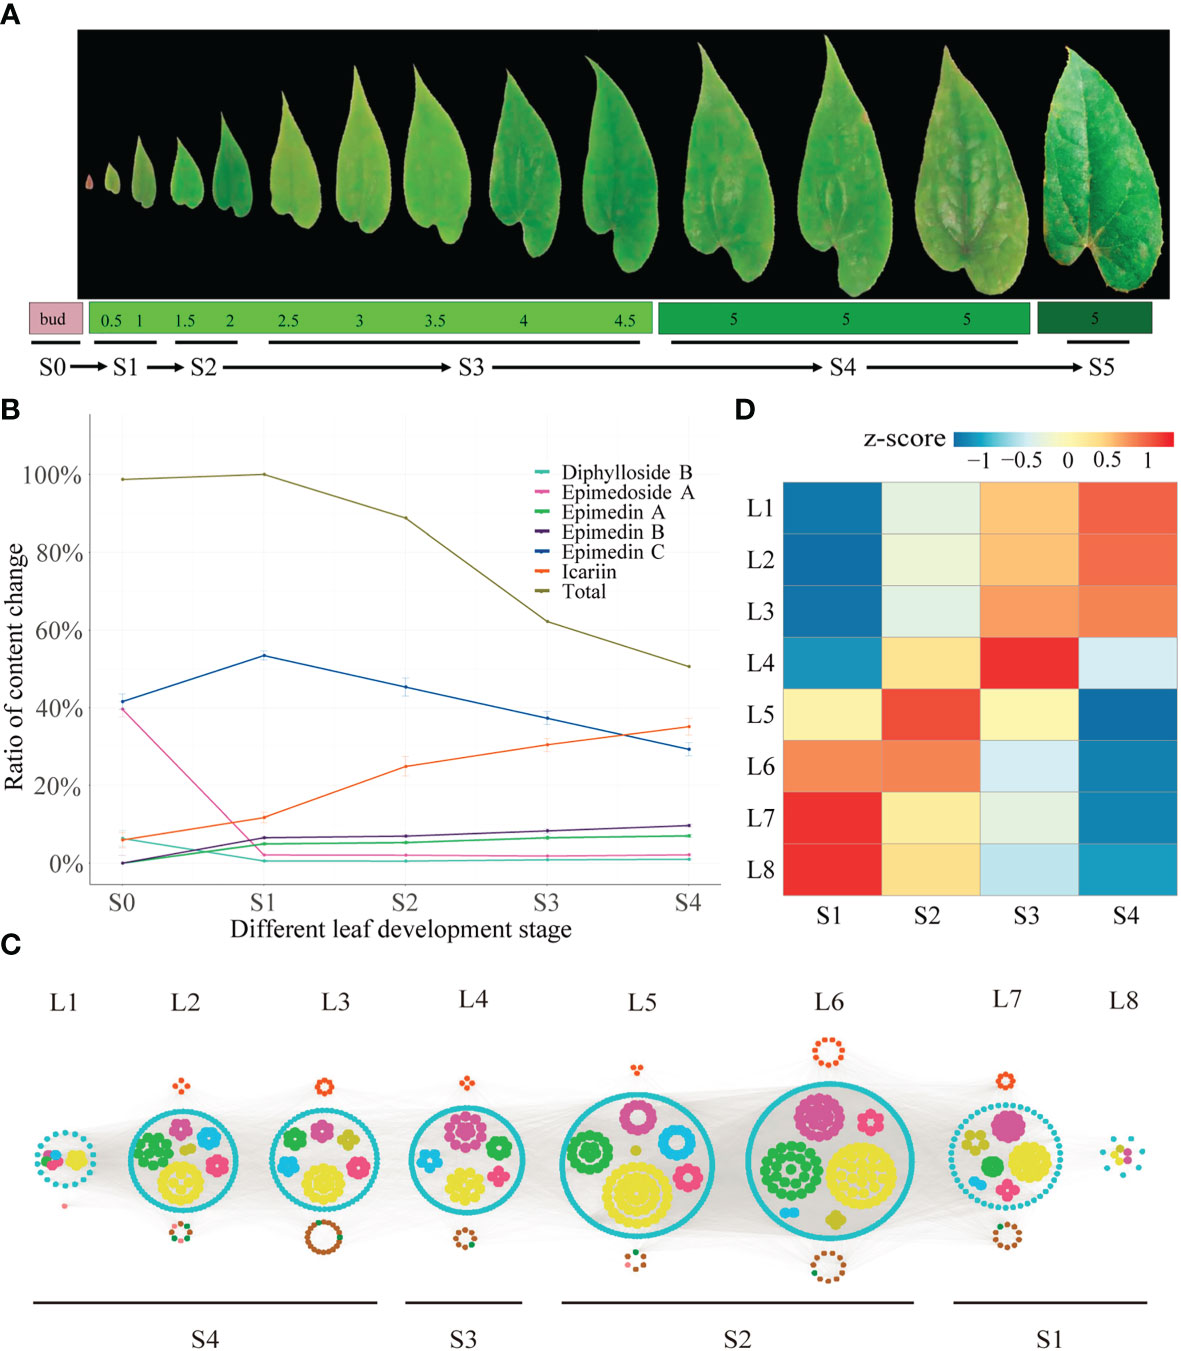
Figure 2 Time-ordered gene co-expression network related to leaf development in E. pubescens. (A) Schematic representation of the design for samplings of E pubescens. Leaf width was preliminarily taken as the division of leaf development stages, 42 samples from 14 sampling points, each with three replicates, were collected for metabolic profiling and RNA-seq. Six stages were defined: 1) Stage 0 (S0, bud stage), 2) Stage 1 (S1, leaf width of 0.5~1 cm), 3) Stage 2 (S2, leaf width of 1.5~2 cm), 4) Stage 3 (S3, leaf width of 2~4 cm), 5) Stage 4 (S4, leaf width of 5 cm with middle degree of leathery), and 6) Stage 5 (S5, leaf width of 5 cm with high degree of leathery); (B) Proportion of content for the main PFGs in S1~S5 of E pubescens. Gray line: total PFGs, blue line: Epimedin C, orange line: icariin, purple line: Epimedin B, green line: Epimedin A, cyan line: Diphylloside B, pink line: Epimedoside A; (C) Predicted regulatory network and the connection among TFs and the structural genes involved in PFGs biosynthesis pathway. Inside the cyan circles, purple nodes represented MYB genes, green nodes represented bHLH genes, yellow nodes represented WD40 genes, brown nodes represented bZIP genes, light-blue nodes represented WRKY genes, light-green nodes represented ARF genes. Outside cyan circles, red nodes, locating on the top, represented PAL, C4H, 4CL, CHS, CHI, F3H, and FLS genes, and green, brown, and pink nodes on the bottom represented PT, UGT, and OMT genes, respectively; (D) The heatmaps of average normalized TPM (z-score) at S1~S4 stages at each level were identified in the time-ordered gene co-expression network. Four stages of leaf with different types of flavonoids accumulation were identified, S1 (L8 and L7), S2 (L6 and L5), S3 (L4), and S4 (L3, L2 and L1) based on the expression profile. The bar represents the expression level of each gene (z-score). Low to high expression is indicated by a change in color from blue to red.
Dynamic changes of PFGs with leaf development
The dynamic changes of PFGs were further revealed. Firstly, bud stage (S0) showed the exclusivity of chemical composition and content accumulation. Ikarisoside A and Rhamnose-ikarisoside A were observed as marker components, but they were not detected at leaf stages (S1~S4), Epimedin A and B were almost non-existent in bud stage (S0), with a very low proportion in leaf stages and were almost unchanged (4.97~7.03% for Epimedin A, 6.56~9.69% for Epimedin B) with leaf development (S1~S4). In addition, Epimedoside A and Diphylloside B showed higher contents in bud stage (S0), which was much lower at leaf stages (~39.60% in S0 and ~2.0% in S1~S4 for Epimedoside A; ~6.37% in S0 and ~0.70% in S1~S4 for Diphylloside B). Secondly, leaf stages (S1~S4) showed similar performance in chemical compositions but with significant changes in content accumulation. Total PFGs content were almost unchanged from S0 to S1 (~1.30% increased) and peaked at S1 (the highest accumulation) and then decreased rapidly, followed by 11.23%, 37.81% and 49.43% decreases from S1 to S2, S1 to S3, and S1 to S4, respectively. Similarly, Epimedin C showed the largest proportion of S1 (~53.41% of the total PFGs) and with changes similar to total PFG content, with an ~11.87% increase from S0 to S1, followed by continuous decrease, with an ~8.11%, ~16.14%, and ~24.15% decrease from S1 to S2, S1 to S3, and S1 to S4, respectively. However, the content of icariin was gradually increased, with amplification of ~5.76%, ~13.11%, ~18.71%, and ~23.36% in S0 to S1, S1 to S2, S1 to S3, and S1 to S4, respectively (Figure 2B, Table 1 and Supplemental Table 3).
Transcriptome profiles at different development stages of E. pubescens
We generated 5.62~9.04 Gb clean bases per library and a total of 923 Mb clean pair-end reads after filtering and removing the adapter sequences. Q20, Q30, and GC content were higher than 97, 93, and 44%, respectively Supplemental Table 4). The clean reads were mapped to the E. pubescens reference genome with an average alignment rate of 87.90% Supplemental Table 5), and 21,345 genes were found to be expressed in at least one sample (Supplemental Table 2).
By comparing the overrepresented GO categories among the DEGs, the biological processes of each stage were outlined. Compared with S0, it was notable that S1 showed an upregulation of basic energy metabolism and antioxidant capacity (Supplemental Figure 4 and Supplemental Table 6). Compared with S1, the up-regulated genes at S2 mostly have function in processes relevant to “cell wall organization or biogenesis (GO:0071555, GO:0042546)”, indicating a shift to plant protection, and this change lasted until S3. Multiple enzyme-encoding genes, for example, chitinase, laccase, peroxidase and pectin esterase, were involved. Notably, the PFG content revealed a rapid decline between S2 and S3, and further analysis showed that ‘‘secondary metabolic process (GO:0019748)” was overrepresented in the S2 vs S3 up-regulated gene set. This GO term included 6 genes, and 3 genes (Ebr03G037830, Ebr03G037820, and Ebr02G014470) were Glutathione S-transferase (GST), which may affect the accumulation of PFG content (Supplemental Table 6). Compared with S3, GO terms related to “abscisic acid-activated signaling pathway” emerged at up-regulated gene set of S4 vs S3, however, biological processes relevant to “cell wall organization or biogenesis”, “lignin catabolic process”, and “hormone-mediated signaling pathway”, especially “ethylene-mediated signaling pathway” were overrepresented in the down-regulated gene set of S4 vs S3 (Supplemental Figure 4 and Supplemental Table 6). This observation indicates that ABA and ethylene signal transduction tend to play a major role in regulating leaf development or functional transition. To test this hypothesis, we further explored the gene expression pattern from S1 to S4, which reflected the largest variation of PFG content. The results of GO (Supplemental Figure 5) and KEGG enrichment (Supplemental Figure 6) of up-regulated gene set of S1 vs S4 were in line with the above-mentioned studies (Supplemental Table 6).
Mining of PFGs biosynthetic genes and TFs
PFGs biosynthetic genes and TFs needed to be mined before constructing TO-GCNs. A total of 259 PFGs biosynthetic genes including 7 PALs (EpPAL1~EpPAL7) (Xu et al. unpublished), 1 C4H (EpC4H), 14 4CLs (Ep4CL1~Ep4CL14), 12 CHSs (EpCHS1~EpCHS12) (Shen et al. unpublished), 2 CHIs (EpCHI1~EpCHI2) (Fan et al. unpublished), 1 F3H (EpF3H), 3 FLSs (EpFLS1~EpFLS3), 19 PTs (EpPT1~EpPT19) (Shen et al., 2022), 183 UGTs (Yao et al., 2022a) and 17 OMTs (EpOMT1~EpOMT17) (Shen et al. unpublished) were identified. Through blast results with the activity verification reported genes (Supplemental Table 7), the matching between expression level with PFGs content during leaf development and the mutation analysis of key sites (including substrate-binding site, active site or phosphorylation site) Supplemental Table 8), 9 genes [including EpPAL2 (Ebr04G040710), EpC4H (Ebr01G074580), Ep4CL2 (Ebr04G003020), EpCHS2 (Ebr05G049130), EpCHI2 (Ebr06G004160), EpCHIL (Ebr01G073610), EpF3H (Ebr04G062950), EpFLS3 (Ebr04G051790) and EpPT8 (Ebr02G069700)] were selected as the candidate genes that participated in the PFGs biosynthesis of E. pubescens (Figure 3, Supplemental Figure 7, Supplemental Table 8). A total of 2,249 TFs were detected in E. pubescens genome, which were classified into 59 families according to the PlantTFDB database (Supplemental Table 9). A total of 1,208 TF genes were expressed (average TPM > 0.5) in S1~S4. WD40, MYB, bHLH, ERF, and C2H2 families accounted for the largest portion, comprising 195, 97, 94, 80, and 52 members, respectively (Supplemental Table 10).
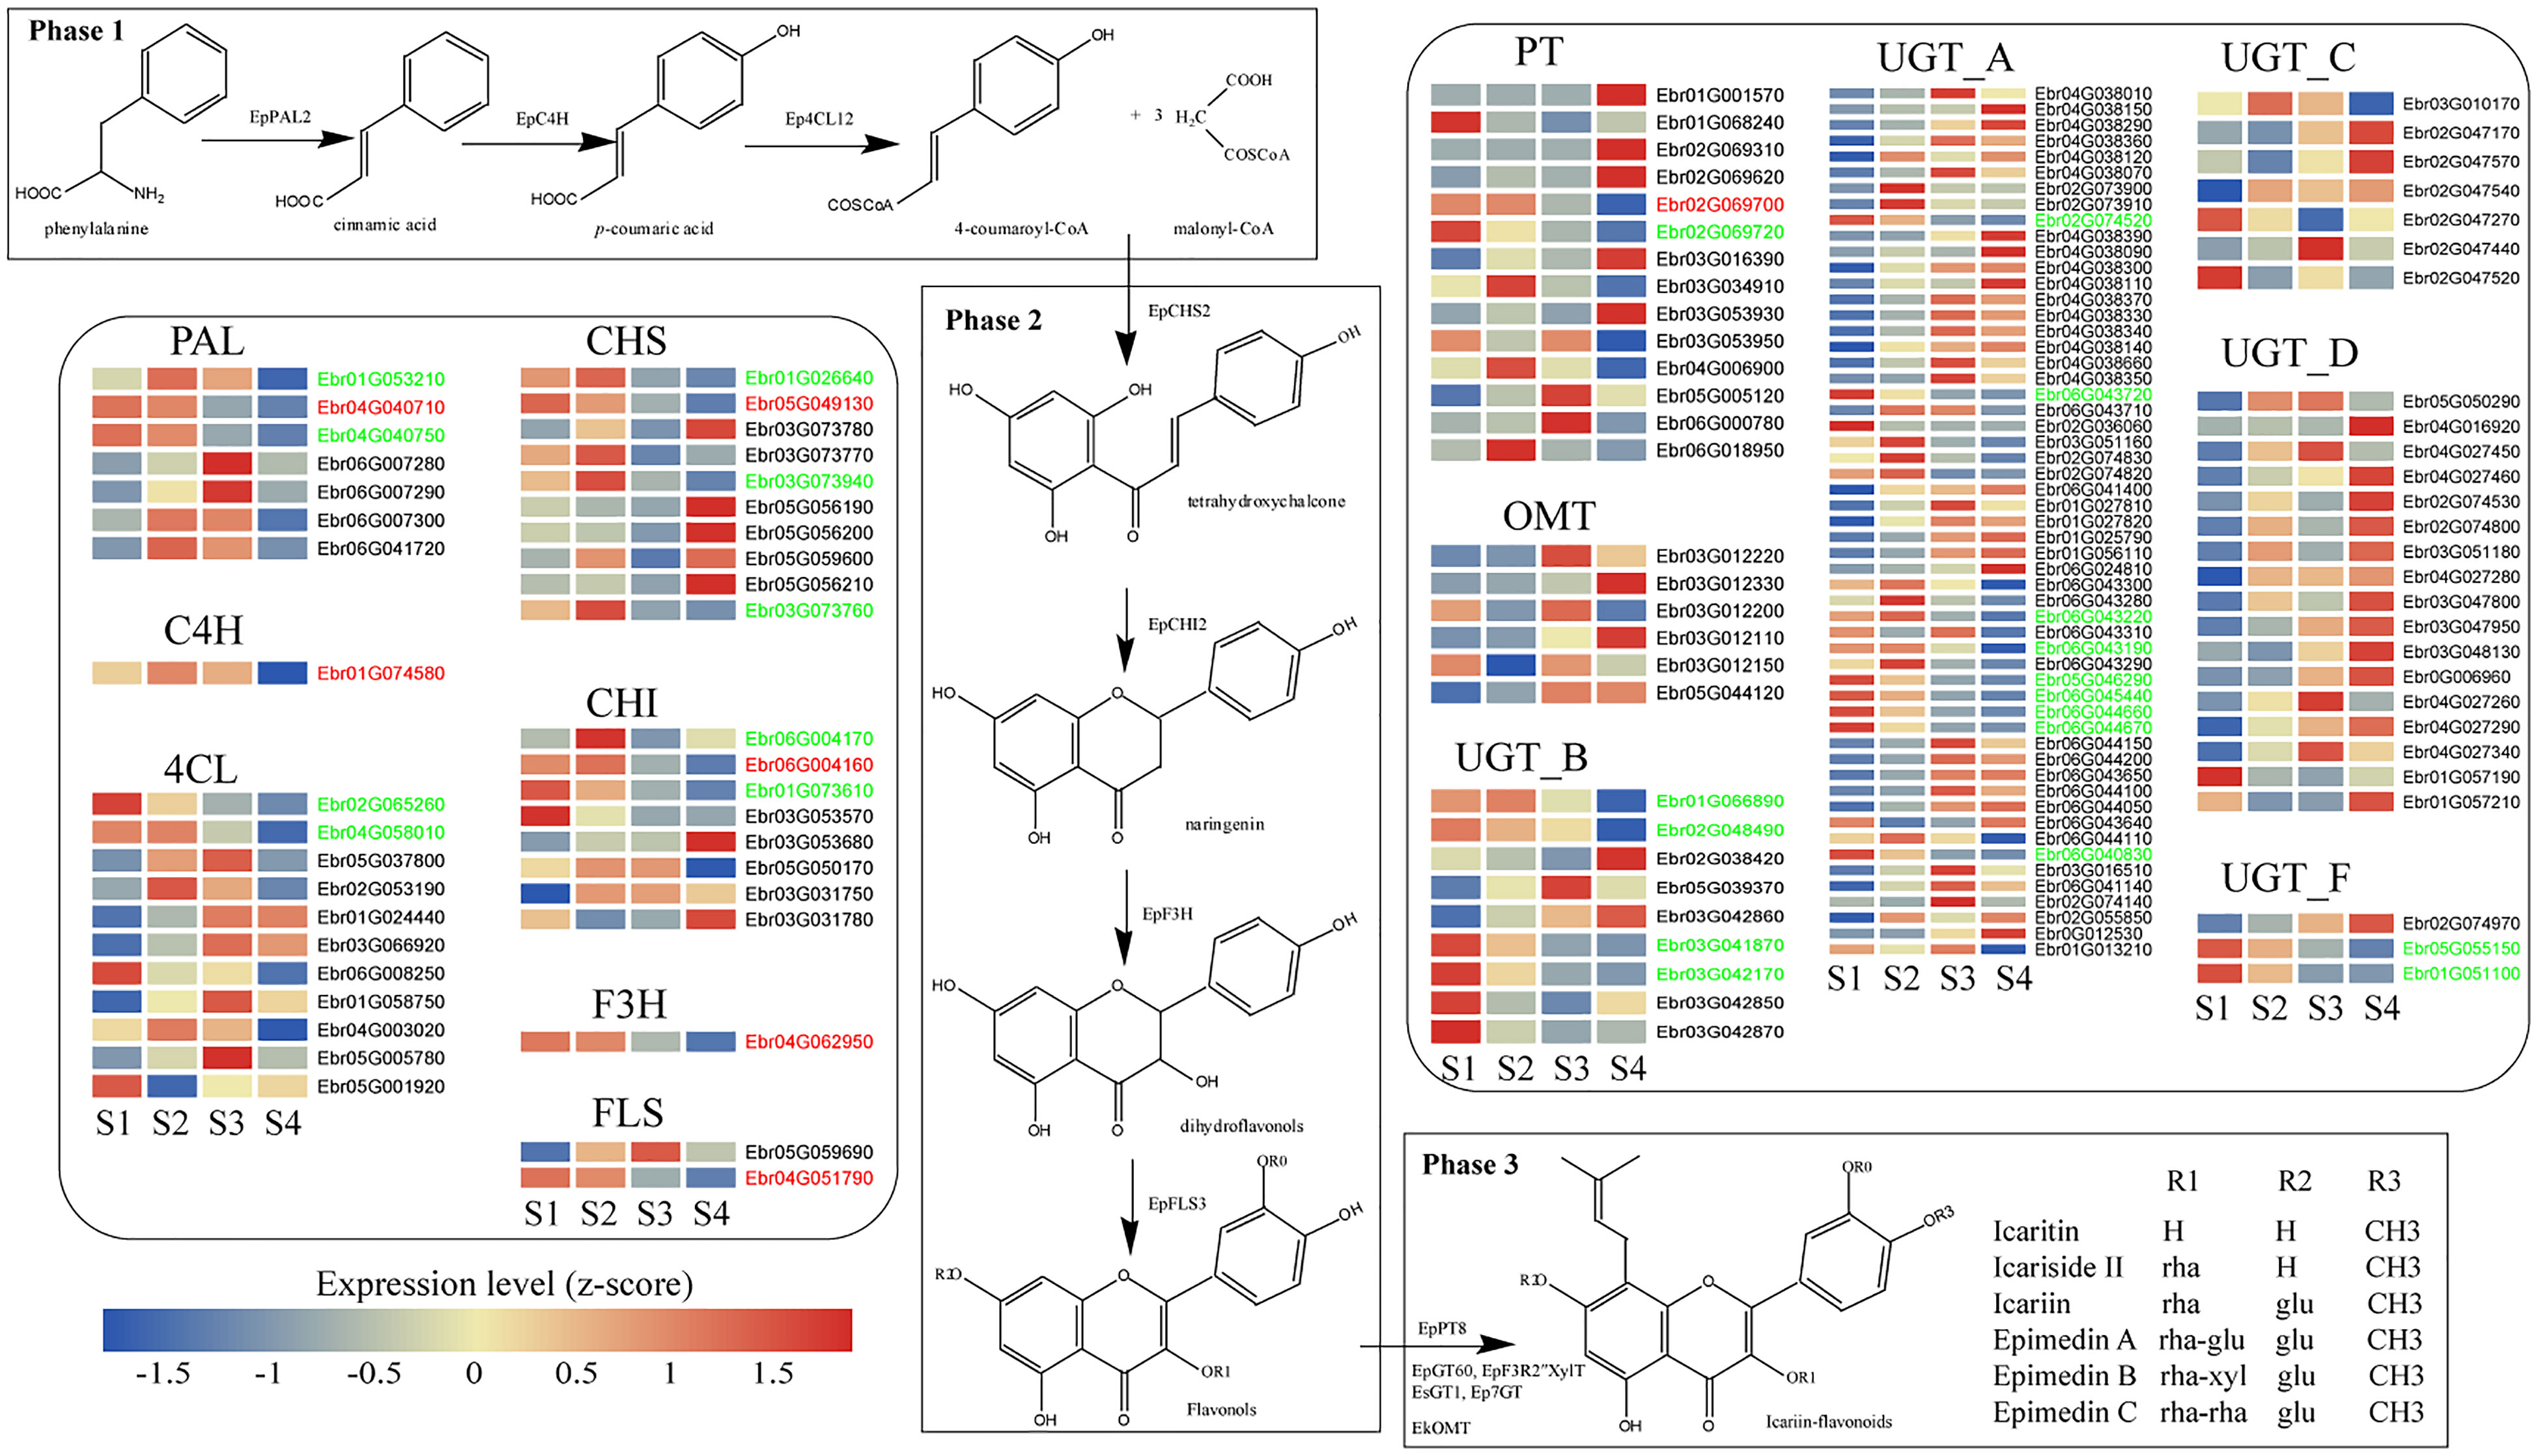
Figure 3 The biosynthesis pathway of PFGs in E. pubescens. The PFG biosynthesis pathway was divided into three phases. Phase 1: the common phenylpropanoid metabolism, including PAL: phenylalanine ammonia-lyase, C4H: cinnamate-4-hydroxylase, and 4CL: 4-coumarate CoA ligase; Phase 2: core pathway, including CHS: chalcone synthase, CHI: chalcone isomerase, F3H: flavanone 3-hydroxylase, and FLS: flavonol synthase; Phase 3: further enzymatic modification, including PT: prenyltransferase, UGT: UDP-glycosyltransferase, and OMT: O-methyltransferase; this study showed genes related to flavonoid biosynthesis (group A, B, C, D and F of UGT gene family, referring to Yao et al., 2022a). Gene expression profiles (in normalized TPMs) in different stages (here S1~S4, from left to right in each heatmap panel) are presented in the heatmap alongside the gene names. Gene names marked in red color represent genes with functional verification, genes marked in green color represent genes consistent with content change during leaf development. The bar represents the expression level of each gene (z-score). Low to high expression is indicated by a change in color from blue to red.
TO-GCNs regulatory network construction
Between any two leaf developmental stages (S1~S4), 20,943 genes (1,208 TFs and 19,735 structural genes) were expressed (average TPM > 0.5). A TF gene FAR1 (Ebr04G048560), expressing in a low level at S1 and monotonically increasing until S4, was selected as the initial node to build a TO-GCNs network. Eight time-series expression levels (L1~L8, nodes > 10) centering on TFs were finally constructed using the suggested positive/negative cutoff values (0.85; -0.61). Finally, 1,124 genes including 1,022 TFs and 102 PFGs biosynthesis genes made up the TO-GCNs specific to PFGs biosynthetic pathway (Figure 2C). These eight levels were corresponded to the average expression levels at the four developmental stages (S1~S4), as shown by the red squares (high expression levels) along the diagonal in the heatmap, which formed the basis for the inference of upstream and downstream genes/metabolites regulatory relationships (Figure 2D).
With regard to the established TO-GCNs, the major PFGs biosynthetic genes were mainly expressed at the earlier stages (S1~S2) (Supplemental Table 11). There were 18 and 31 PFGs biosynthetic genes expressed in S1 and S2, respectively. The co-expression genes of S1 and S2 reflected a higher expression in early time, and a lower expression in lateral time, and this was in line with PFGs content changes. EpPT8 (Ebr02G069700), EpPAL2 (Ebr04G040710), and EpFLS3 (Ebr04G051790) were presented in L7. Ep4CL12 (Ebr04G003020), EpC4H (Ebr01G074580), EpCHS2 (Ebr05G049130), EpCHI2 (Ebr06G004160), EpCHIL (Ebr01G073610), and EpF3H (Ebr04G062950) were found in L6. Very few causal genes of PFGs biosynthesis could be detected in L1~L4.
Regulatory network prediction of PFG biosynthetic genes
The regulatory network of seven candidate genes (EpPAL2, EpC4H, EpCHS2, EpCHI2, EpF3H, EpFLS3, and EpPT8) were predicted, and the TFBS results of each regulatory network are shown in Supplemental Table 12. Take EpFLS3 for example (Figure 4). We suggest that EpFLS3 may be regulated in a hierarchical order by three routines: 1) WRKY (Ebr03G071730) acted as the fourth regulator. It directly regulated the third regulator MYB (Ebr02G010220), then regulated MYB (Ebr05G056880), then regulated MYB (Ebr05G057070), and finally regulated EpFLS3. 2) WRKY (Ebr02G071190) acted as the fourth regulator, either C3H (Ebr06G026230) or C2H2 (Ebr01G055910) acted as the third regulators, both may regulate Trihelix (Ebr01G020500), which acted as second regulator and regulated MYB (Ebr05G057070), and MYB (Ebr05G057070) served as the direct regulator of EpFLS3; on the other hand, C2H2 (Ebr01G055910) could also regulate MYB (Ebr05G057070) and then regulated EpFLS3. 3) MYB (Ebr04G060880) acted as the second regulator, regulated MYB (Ebr0G003750), then regulated EpFLS3. The routines of 1 and 3 were the most likely regulatory pathways, as MYB (Ebr02G010220) and MYB (Ebr0G003750) have been proven to participate in flavonol biosynthesis, which were homologous genes with A. thaliana MYB genes AtMYB111, AtMYB11, and AtMYB12. MYB (Ebr02G010220), MYB (Ebr0G003750), and MYB (Ebr05G057070) may act as the core regulated genes for EpFLS3 regulation.
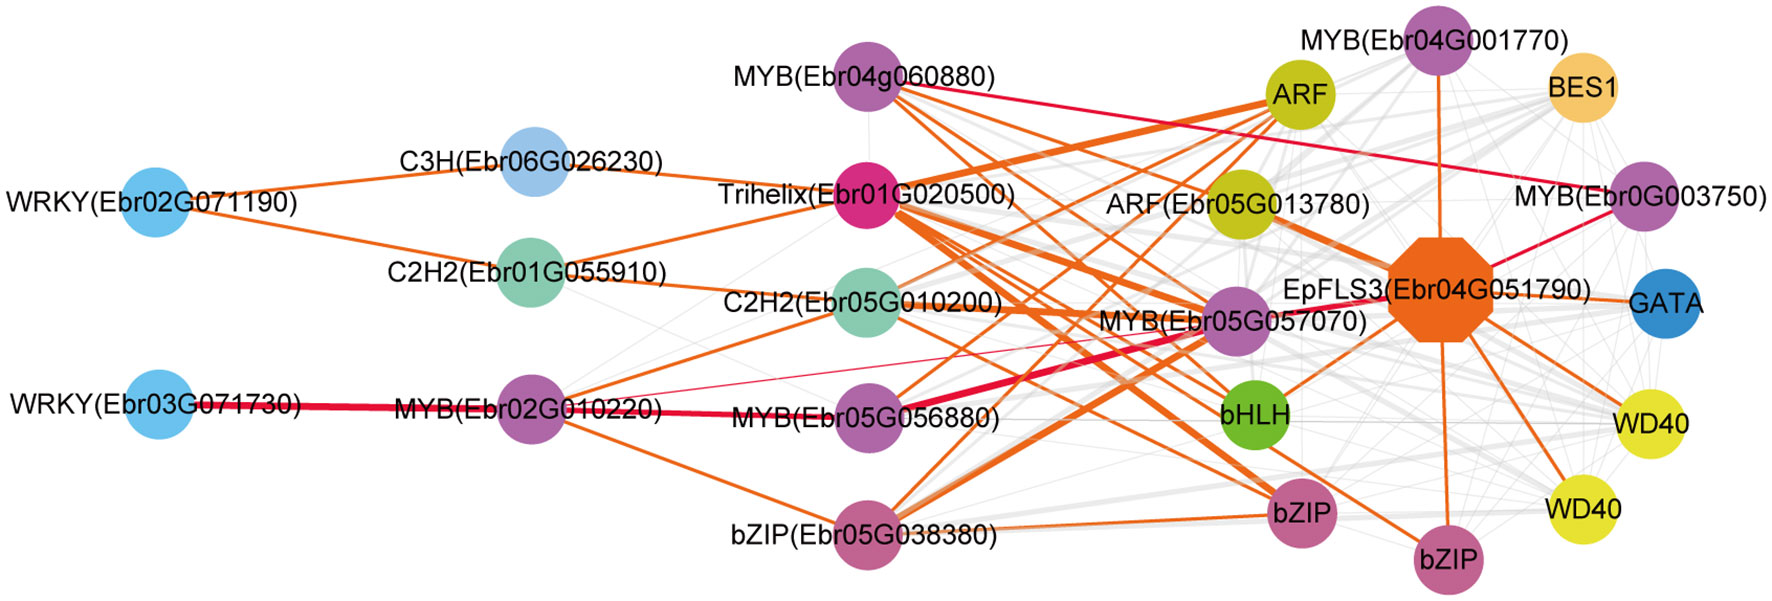
Figure 4 Resolved hierarchical regulation for EpFLS3. Thickness of the edges in any gene pair represent the strength of co-expression relationships. Thick red and orange edges mean a strong correlation (> 0.8), thin red and orange edges, a middle correlation (0.7~0.8), and gray edges, a weak correlation (0.66~0.7). Red edges represented the most probable pathway related to PFGs biosynthesis.
Both EpPAL2 and EpCHS2 showed more complex regulatory networks than other PFGs biosynthetic genes. In brief, the direct regulators of EpPAL2 with correlation level over 0.8 were six genes except WD40. These genes [MYB (Ebr05G057070), C2H2 (Ebr0G014410), HD-ZIP (Ebr0G012350), MYB (Ebr0G003750), GATA (Ebr02G046010), and bHLH (Ebr05G004010)] were further regulated by the second regulators with different correlation levels, and finally, the core regulatory networks of EpPAL2 were predicted. 1) WRKY (Ebr03G071730) -> MYB (Ebr02G010220) -> MYB (Ebr05G056880) -> MYB (Ebr05G057070) -> EpPAL2. 2) WRKY (Ebr03G071730) -> MYB (Ebr02G010220) -> MYB (Ebr05G057060) -> MYB (Ebr05G057070) -> EpPAL2 (Figure 5). Similarly, the most probably regulatory routines of EpCHS2 were as follows: 1) WRKY (Ebr03G071730) -> MYB (Ebr02G010220) -> MYB (Ebr05G056880) -> EpCHS2. 2) WRKY (Ebr03G071730) -> MYB (Ebr02G010220) -> bZIP (Ebr05G038380) -> EpCHS2. In addition, WRKY (Ebr03G071730) -> MYB (Ebr02G010220) -> MYB (Ebr02G055930) -> EpCHS2, MYB-related (Ebr03G041510) -> C3H (Ebr05G000930) -> MYB (Ebr02G055930) -> EpCHS2, MYB-related (Ebr03G041510) -> bHLH (Ebr06G000830) -> MYB (Ebr02G055930) -> EpCHS2 may also be possible candidate routines, as MYB (Ebr02G055930) is involved in flavonol biosynthesis (Figure 6). By further analysis of the regulatory network of EpC4H (Supplemental Figure 8), EpCHI2 (Supplemental Figure 9), and EpF3H (Supplemental Figure 10), it was found that those genes harbored similar regulatory relationships to EpPAL2, EpCHS2, and EpFLS3. Our research suggests that a set or several sets of TFs, acting in a collaborative manner, regulated the biosynthesis pathway of PFGs.
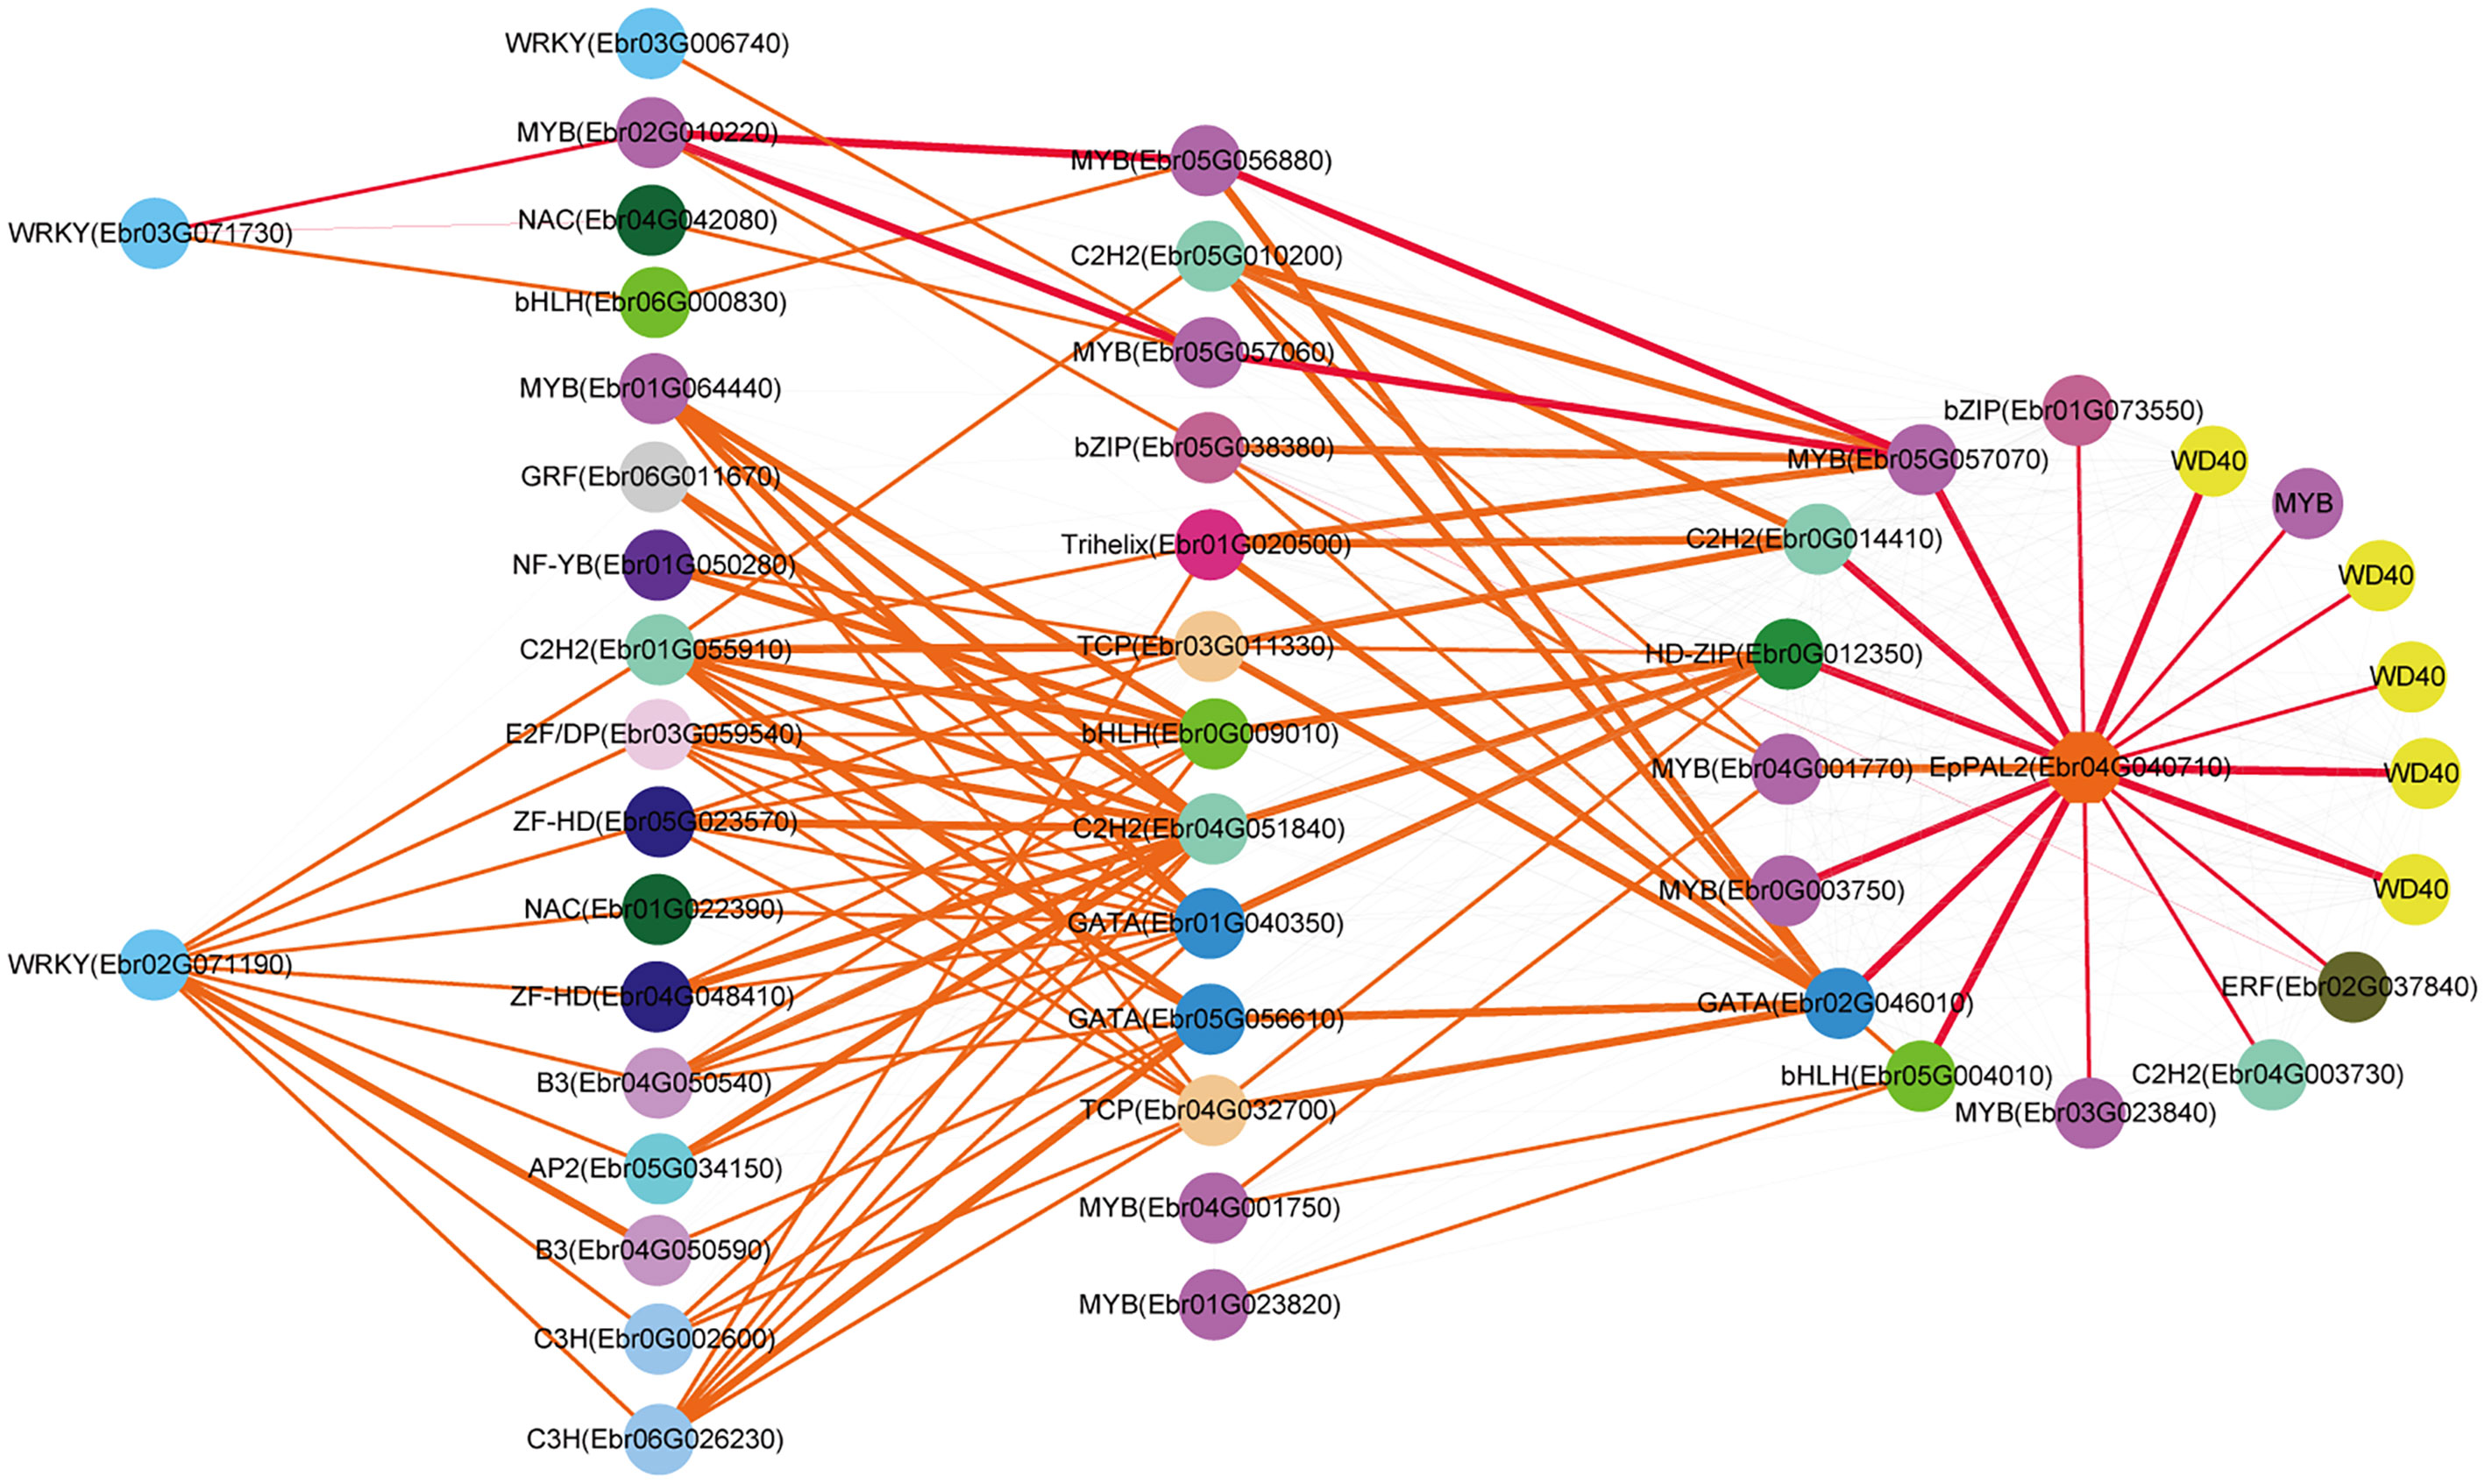
Figure 5 Resolved hierarchical regulation for EpPAL2. The notion is the same as Figure 4.
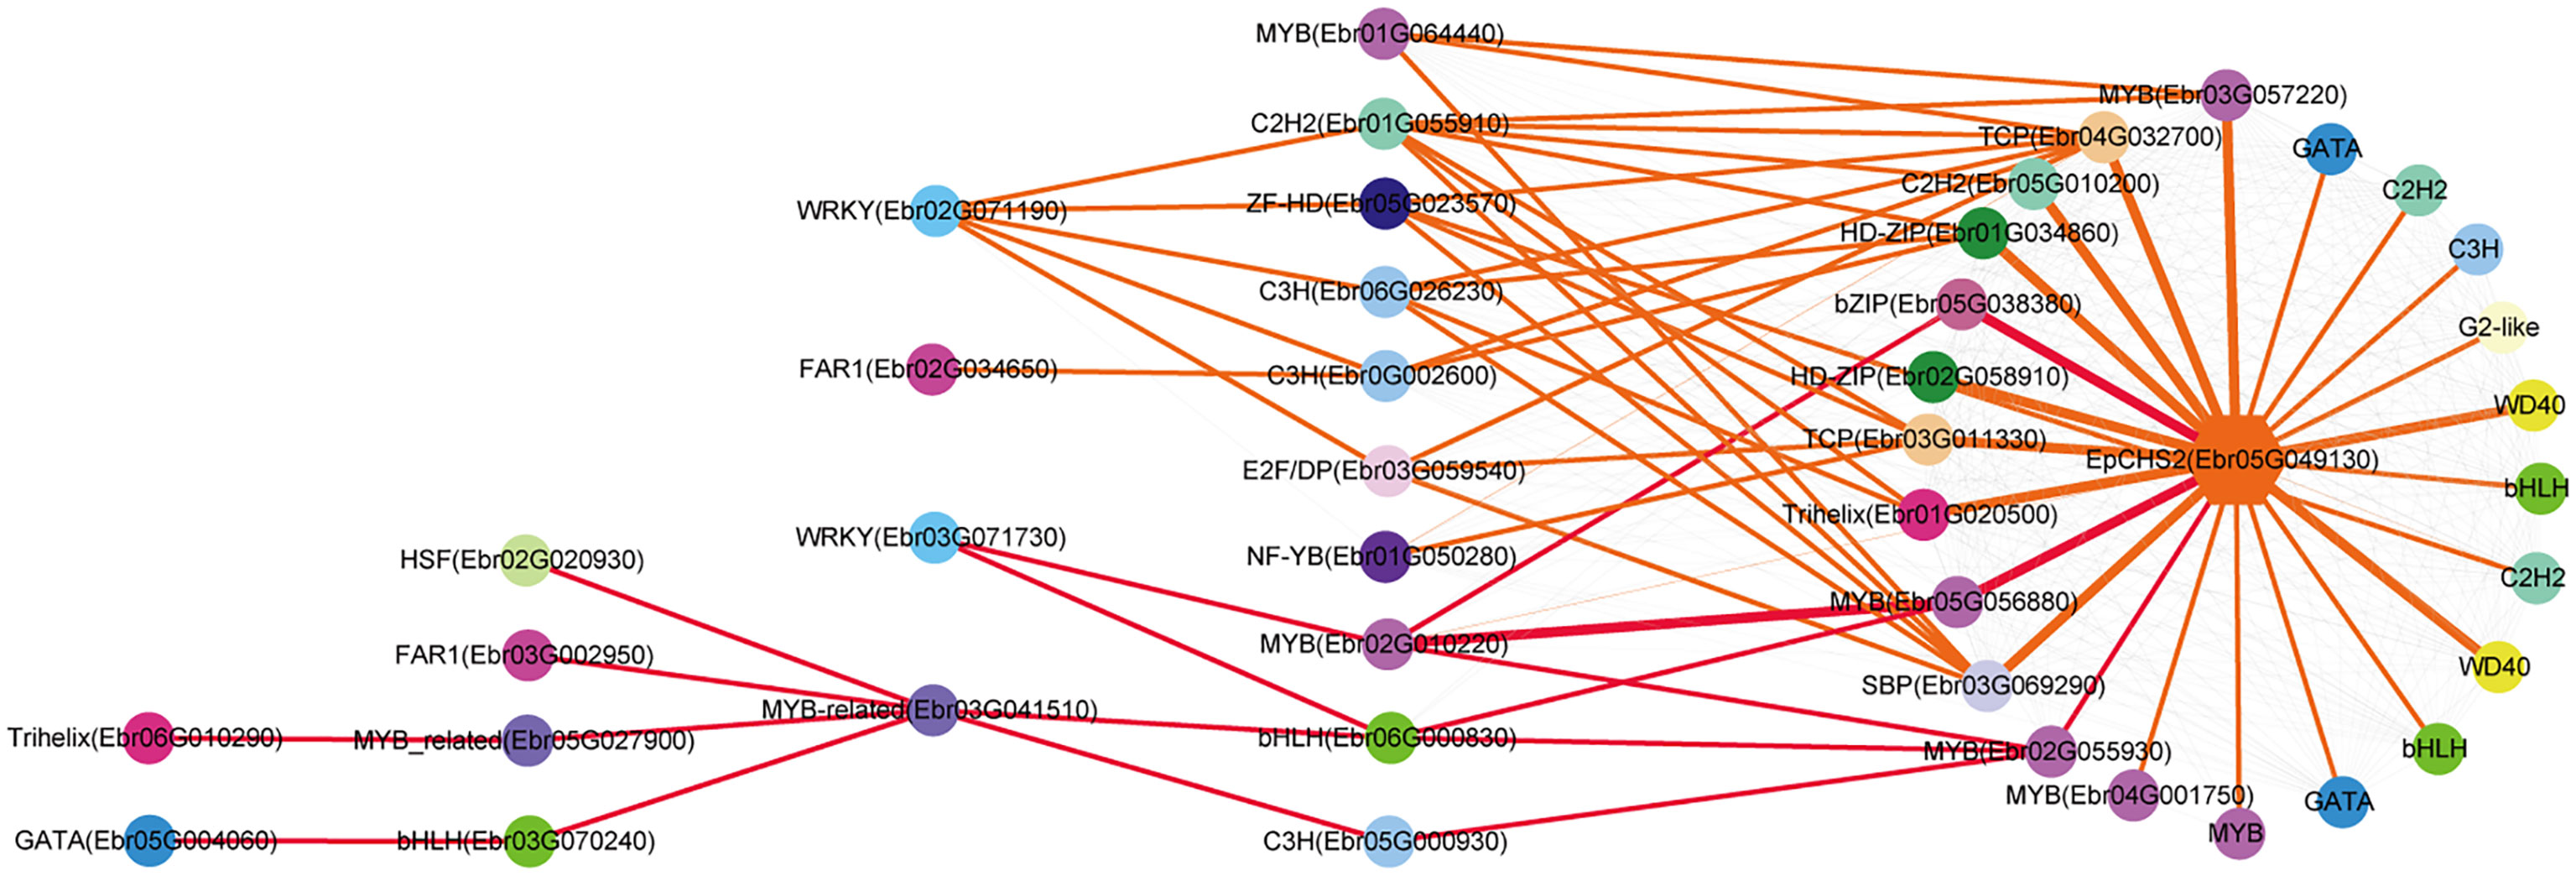
Figure 6 Resolved hierarchical regulation for EpCHS2. The notion is the same as Figure 4.
We further predicted the regulatory network of EpPT8, which was the important gene for the formation of active ingredients of Epimedium. MYB (Ebr05G057070), MYB (Ebr0G003750), C2H2 (Ebr0G014410), ARF (Ebr05G013780), and MYB (Ebr04G001770) were predicted to be the direct regulators. Trihelix (Ebr01G020500), C2H2 (Ebr05G010200), bZIP (Ebr05G038380), and TCP (Ebr03G011330) acted as the secondary regulators. The predicted regulatory routines may be as follows: 1) WRKY (Ebr03G071730) -> MYB (Ebr02G010220) -> C2H2 (Ebr05G010200) -> MYB (Ebr05G057070) -> EpPT8; 2) WRKY (Ebr03G071730) -> MYB (Ebr02G010220) -> bZIP (Ebr05G038380) -> MYB (Ebr05G057070) -> EpPT8; and 3) WRKY (Ebr03G071730) -> MYB (Ebr02G010220) -> MYB (Ebr04G060880) -> MYB (Ebr0G003750) -> EpPT8 (Figure 7).
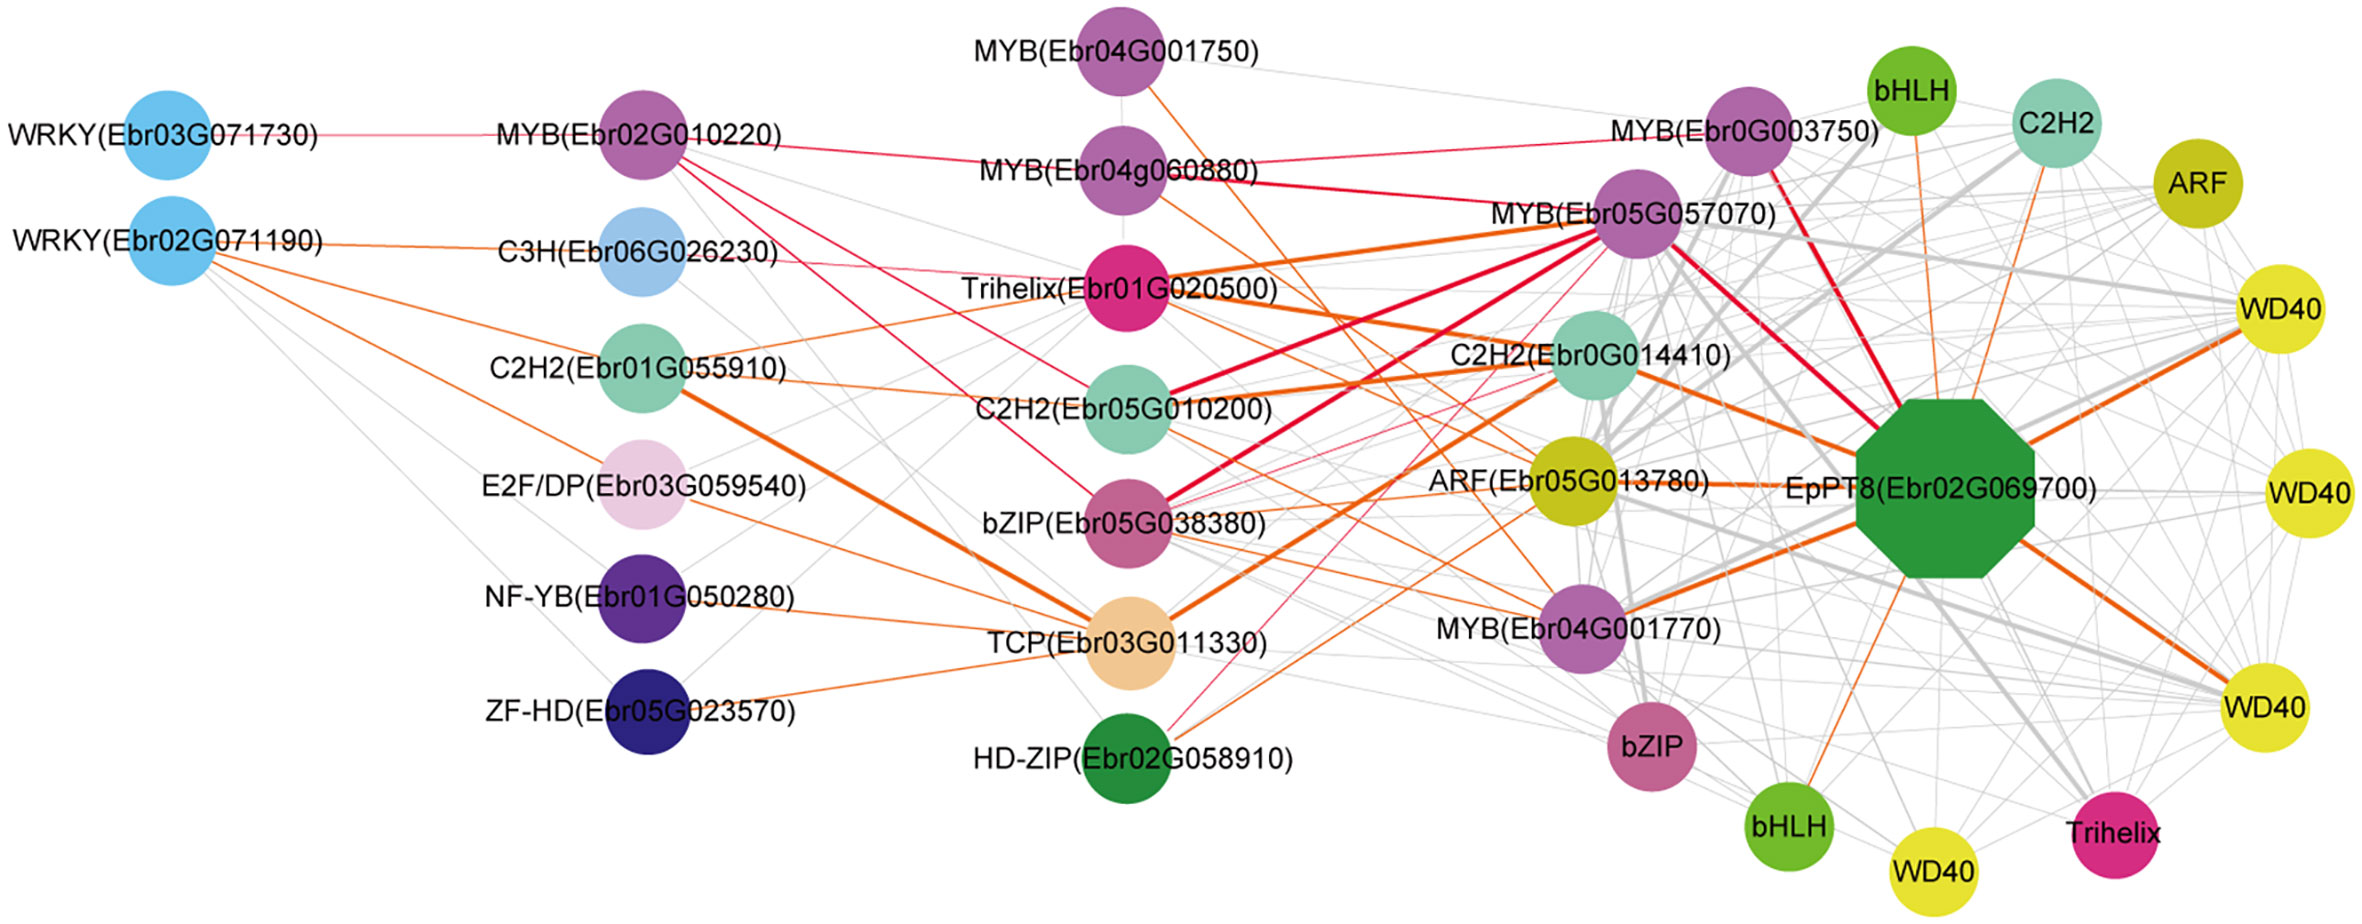
Figure 7 Resolved hierarchical regulation for EpPT8. The notion is the same as Figure 4.
Exploring TFs involved in PFG accumulation based on WGCNA analysis
WGCNA analysis was employed to construct the co-expression network to further test whether the predicted TFs were involved in PFGs accumulation. A total of 21,345 expressed genes (average TPM > 0.5) were clustered into 18 modules comprising 146~2,240 genes, and each module harbored TFs varying from 3 to 199 (Figure 8A, Supplemental Table 13). Based on the correlation analysis between the module eigengene and the abundance of four PFGs (Epimedin A, Epimedin B, Epimedin C, and icariin) and total PFG content, the blue and brown module was significantly positively and negatively correlated with Epimedin C and total PFGs content, respectively (Figure 8A). We selected blue module (containing 2,240 genes) for further analysis given that most genes relevant to PFGs biosynthesis came from this module.
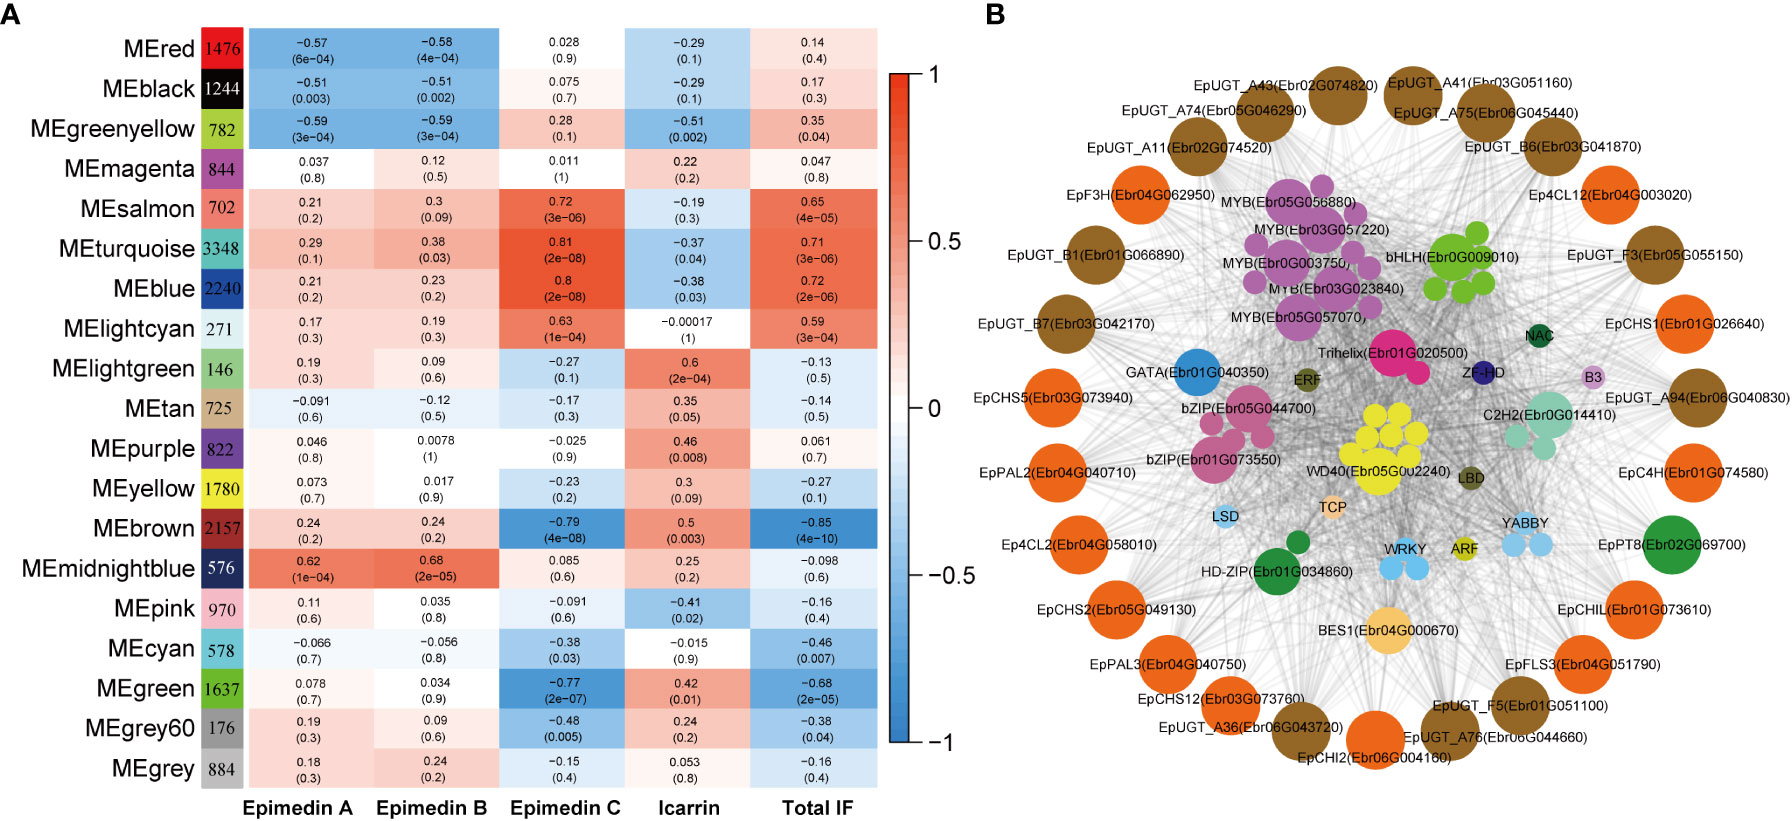
Figure 8 WGCNA of all expressed genes. (A) Module-PFGs relationship. Each row represented a module, which consists of genes with similar expression pattern. Each column represented the specific PFGs compound content, including Epimedin A, B, C, and icariin, and the sum of all PFGs. The value in each cell at the row-column intersection represents the correlation coefficient between the module and the specific compound content and is displayed according to the color scale on the right. The value in parentheses in each cell represents the P value. (B) Regulatory network of PFG biosynthesis in E pubescens. The outside circle with different colors indicates different families of structural genes associated with Epimedin C or total PFGs biosynthesis in the blue module. The inside circles with different colors indicate different families of TFs characterized in the same module whose transcripts are highly correlated with the expression of structural genes.
In the blue module, we firstly extracted a subnetwork comprising of 1,898 genes, and identified 126 TFs and 37 PFGs biosynthesis genes, and then we filtered by TOM value or weight (threshold: 0.24), at which value, the maximum PFGs biosynthesis genes can be retained. The subnetwork (containing 650 genes) was further filtered by threshold of |MM| > 0.8 and |GS| > 0.2 (MM: module membership or eigengene-based connectivity, GS: gene significance). Finally, we completed network construction related to Epimedin C or total PFG accumulation and hub gene identification (Figure 8B).
The core co-expression network contained 52 TFs, which belonged to 18 families, typified by MYB (12 genes), bHLH (6 genes), WD40 (8 genes), and bZIP (5 genes). Hub genes were those with higher intramodular connectivity, which have been visualized as larger circles (Figure 8B), including 5 MYBs, 1 bHLH, 1 WD40, 2 bZIPs, 1 BES1, 1 C2H2, 1 Trihelix, 1 HD-ZIP, and 1 GATA. Further examinations revealed almost all of the TFs existed in the 7 TO-GCNs of PFGs biosynthesis genes (Figures 4–7, Supplemental Figures 8–10), which confirmed that these TFs affect PFG content accumulation by participating in the regulation of target PFGs biosynthesis genes. In addition, almost all of the nine causal PFGs biosynthesis genes were included in this core network (Figure 8B, Supplemental Table 8). This confirmed the reliability of the established TO-CNs network.
Verification of gene regulatory relationships by qRT-PCR
Nine gene pairs including TFs and their predicted target genes were verified by qRT-PCR (see the primers in Supplemental Table 14). These gene pairs included MYB (Ebr05G057070) and EpPT8; MYB (Ebr0G003750) and EpPAL2; bZIP (Ebr05G038380) and EpCHS2; MYB (Ebr0G003750) and EpFLS3; MYB (Ebr02G010220) and EpF3H; bZIP (Ebr05G038380) and EpC4H; MYB (Ebr02G010220) and MYB (Ebr05G056880); WRKY (Ebr03G071730) and MYB (Ebr02G010220); and MYB (Ebr01G039680) and MYB (Ebr01G039880). The results showed that the gene pairs investigated exhibited strong correlations (Pearson correlation coefficient > 0.7), which further verified the reliability of the regulatory network (Figure 9).
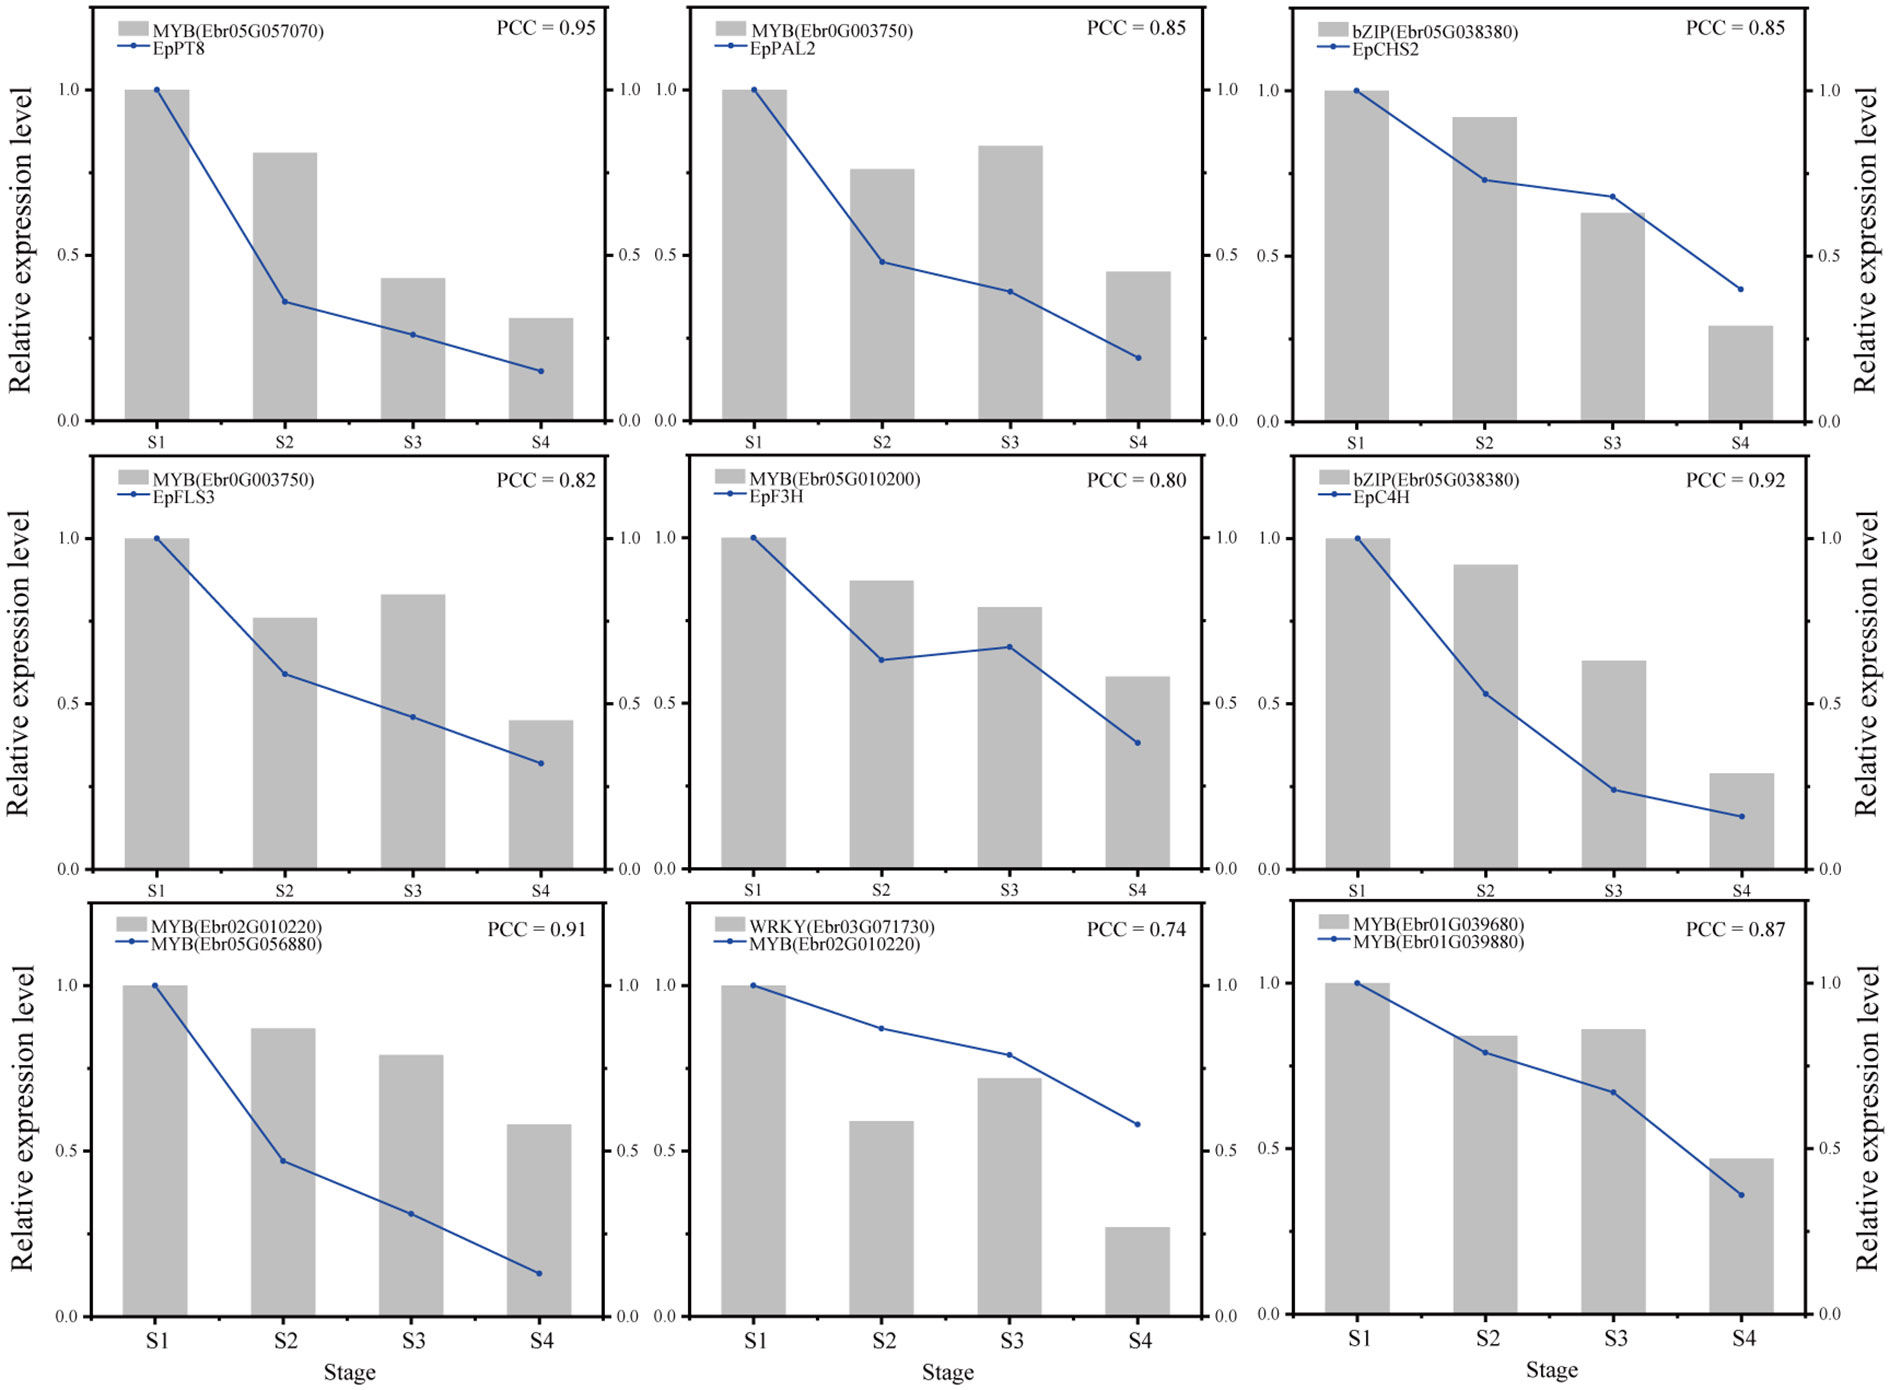
Figure 9 Verification of genes expression and regulatory relationships by qRT-PCR.
Discussion
Epimedium herb has been widely used as important medicine due to its rare content of PFGs, which are known for their outstanding role in inhibiting hepatocellular carcinoma initiation and malignant growth. However, the biosynthesis and regulation mechanism of PFGs have not been systematically summarized and discussed with regard to Epimedium. Through high-temporal-resolution transcriptome and metabolome (targeted to PFGs) analysis during early leaf development, the molecular mechanism of PFGs accumulation and its regulation can be unraveled.
Metabolic profiling differences of PFGs between buds and leaves in Epimedium
Epimedium species are herbaceous perennials grown from woody rhizomes, in which the meristem of buds triggered the emergence of leaves and flowers. A few studies have conducted the metabolic profiling on leaves, stems, and rhizomes (Xu et al., 2007; Yu J et al., 2012; Zhou M et al., 2021). However, there are no reports on buds. In this study, a significantly different metabolic profiling of PFGs was detected between buds and leaves (Table 1). The main PFG in buds was Epimedoside A (demethylanhydroicaritin backbone, C-4′ linked hydroxyl), which was apparently higher than that in leaves; this is similar to the stem and rhizome reported by Zhou M et al. (2021). Ikarisoside A and 2′-O-rhamnosyl-Ikarisoside A (backbone of Type II) were only detected in buds. The main PFGs in leaves were dominant by Epimedin C and icariin (anhydroicaritin backbone, C-4′ linked methoxy) (Table 1, Supplemental Table 1). Different O-methylation modification constituted the chemical diversity between buds and leaves. The higher enzyme activity of 4′-OMT in leaves may be the possible molecular basis, which can provide an explanation of the spatial distributions of metabolites and their chemical structures. Similar studies, e.g. the differential distribution of compounds in aerial and underground Scutellaria baicalensis (Zhao et al., 2016) and biosynthesis-based spatial metabolome of Salvia miltiorrhiza, have been in-depth discussed in depth (Tong et al., 2022).
Possible reasons for the decrease of PFGs contents
Flavonoids have a strong antioxidant capacity and play an important role in promoting growth and development, which function at cellular-level processes, including cell division, membrane integrity, and ROS scavenging (Yadav et al., 2018). The significant metabolic flow transition for different stages of leaf development (S1~S4) (Supplemental Figure 5, Supplemental Table 6) suggested that the declined tendency of PFGs may be closely related to the demand for antioxidant ability and plant protection in young leaves. Studies of flavonoids in leaves of Amygdalus pedunculata (He et al., 2021), Cistus ladanifer (Valares Masa et al., 2016), and Ginkgo biloba (Wang et al., 2022) provide further evidence. In addition to S1, many biological processes towards “cell wall biosynthesis” were enriched in S2~S4, therefore, we deduced that with leaves aged, the increase in cell wall flavonoids may be paralleled by a decrease in soluble flavonoids in Epimedium. Since flavonoids are synthesized via a multienzyme complex localized in the endoplasmic reticulum (Zhu et al., 2016), the flavonoid transport deliver system in S1 may experience an efficient transport to each membrane-limited compartments, including nucleus and chloroplast. S2~S4 may occur vacuolar efflux of these soluble flavonoids and deposited in the cell wall (Zhao and Dixon, 2010). Further experiment with confocal laser scanning microscopy can provide more direct evidence.
PFGs biosynthesis genes constitute the direct reason for PFG contents variation. Transcriptome analysis showed that these genes, including EpPAL2, EpCHS2, EpCHI2, EpF3H, EpFLS3, and EpPT8, had expressions which were down-regulated gradually with leaf maturity (Figure 3), which are in agreement with the metabolomics data, showing the highest PFG levels in S1 Epimedium leaves and its decrease during further leaf development. Similar results were observed in leaves of E. sagitattum (Huang et al., 2015), A. pedunculata (He et al., 2021), C. ladanifer (Valares Masa et al., 2016), and G. biloba (Wang et al., 2022).
In view of the collaborative expression of the PFGs biosynthetic genes, it could be presumed that these genes have been strictly regulated by TFs under temporal cues. This was in line with previous studies (Stracke et al., 2010; Naik et al., 2022). To explain the regulatory background of Epimedium PFGs metabolism during leaf development, we obtained 14 candidate TFs through WGCNA analysis (Figure 8). It has been well established that SG7 MYB TFs contain SG7 motif ([K/R][R/x][R/K]xGRT[S/x][R/G]xx[M/x]K) and SG7-2 motif ([W/x][L/x]LS) at their C-termini, such as AtMYB11, AtMYB12, and AtMYB111, which function was direct activators to affect flavonol biosynthesis (Mehrtens et al., 2005; Stracke et al., 2007). The homologous genes have been investigated in E. sagittatum (Huang et al., 2015), grape (Czemmel et al., 2009), Fagopyrum tataricum (Yao et al., 2020), Nicotiana tabacum (Song et al., 2020), and pear (Zhai et al., 2019). Within the 14 TFs, one MYB Ebr0G003750, which was identified as one of the hub genes in co-expression network of Epimedin C or total PFGs, was the homolog of EsMYBF1 identified in E. sagittatum (with 91.86% identity), which may be one of the direct activators involving in the regulating of PFG content. The consistency of the expression pattern of MYB Ebr0G003750 with metabolomic data further verified this point. Other candidate MYB hub genes like MYB Ebr05G057070 and Ebr05G056880 (belonging to SG1, involved in environmental stress), and MYB Ebr03G057220 (belonging to SG15, involving in epidermal cells) may involve indirect ways. MYB Ebr03G023840 belongs to SG6 (involving in anthocyanin biosynthesis), and this gene may regulate both anthocyanin and flavonol biosynthesis pathways simultaneously. This type of gene has been reported in Gerbera hybrida, which is involved in the regulation of both flavonoids, as they share the same subcellular localization and common biosynthetic substrates, which may compete for substrates (Zhong et al., 2020).
TO-GCN is conductive to discover new TF genes
We present here a TO-GCN approach to provide regulatory dynamics during leaf development. Compared to other time-series analysis method like Mfuzz (Kumar and Futschik, 2007), maSigPro (Conesa et al., 2006), and ImpulseDE2 (Fischer et al., 2018), TO-GCNs could predict upstream regulators of any genes in the GCNs (Chang et al., 2019). Given the important role of TFs as major drivers of genetic variation (Wallace et al., 2014), to understand which TFs control which sets of PFG biosynthesis genes, it is important for the rational metabolic engineering of plants with altered metabolites.
In general, it is much more difficult to predict an upstream regulator than a downstream target one. In this study, we revealed the cascade regulations of seven PFGs biosynthesis genes. Similar examples related to cascade regulation have been reported (Zhou et al., 2015; Li et al., 2020; Zhao et al., 2021). More than 1,022 TFs are assigned to the leaf development TO-GCN, providing a global picture of all gene regulatory relationships, and ~50 TFs were specially extracted through all 7 TO-GCNs related to PFG biosynthesis pathways (Figure 4–7, Supplemental Figures 8-10). This enriched our genetic resources with PFG regulation. In contrast, only one TF (EsMYBF1) (Huang et al., 2016a), two TFs (EsAN2 and EsMYBA1) (Huang et al., 2012; Huang et al., 2013), and two TFs (EsMYB7 and EsMYB10) (Huang et al., 2012) were identified as being involved in regulating flavonol, anthocyanin, and PAs biosynthesis in previous studies of Epimedium.
The TFs involved in flavonoid regulation have been reviewed (Li, 2014; Xu et al., 2015; Liu W et al., 2021). Besides the deeply studied MYB11, MYB12, and MYB111, which are functionally redundant and control the flavonol biosynthesis via activating the early biosynthetic genes such as CHS, CHI, F3H, F3’H, and FLS, many new TFs have been revealed, including activators TCP3 (bHLH) (Li and Zachgo, 2013), CsbZIP1 (Zhao et al., 2021), VvibZIPc22 (Malacarne et al., 2016), and AtWRKY23 (Grunewald et al., 2012), and repressors CsPIF3 (Zhao et al., 2021), FaMYB1 (Aharoni et al., 2001), and BES1 (Liang et al., 2020). Based on TO-GCNs, we identified some unconfirmed TFs, which may be potential regulatory genes for flavonol synthesis. Li et al. (2021) reported that C2H2 and Trihelix indirectly promoted the synthesis of flavonoids by regulating abscisic acid (ABA) levels. The homolog genes of C2H2-type zinc finger (Ebr0G014410) and Trihelix DNA-binding factors (Ebr01G020500) were included in the TO-GCN of EpFLS3, and both genes positively correlated with the expression of EpFLS3, which may promote flavonol synthesis by reducing the inhibition of ABA on EpFLS3 expression. Similarly, BES1 (Liang et al., 2020) and CsbZIP1 (Zhao et al., 2021) were recently reported, and these genes were included in the established TO-GCNs. It is reported that BES1 served as a positive regulator in brassinosteroid signaling, inhibiting the transcription of MYB11, MYB12, and MYB111, thereby decreasing flavonol biosynthesis (Liang et al., 2020). In the tea plant, UV-B irradiation-mediated bZIP1 upregulation leads to the promotion of flavonol biosynthesis by binding to the promoters of MYB12, FLS, and UGT and activating their expression (Zhao et al., 2021).
Complex regulation mechanisms of PFGs biosynthesis were revealed in Epimedium
In this study, the interactivity of TFs with structural genes were highly complex, especially for genes like EpPAL2 (49 TFs were predicted) and EpCHS2 (43 TFs were predicted) (Figures 5, 6), which served as a control point of metabolic flow. Their cis-elements, including Silencer, H-box, ACE elements, AT-rich element, Box I and Box II, were regulated by many TFs and environmental factors (Liu et al., 2011; Pant and Huang, 2022). Genes like EpPAL2, EpFLS3, EpC4H, EpCHS2, EpCHI2, EpF3H, and EpPT8 interacted with 11 or more regulatory partners, and expression of most of these genes was activated at S1~S2 or even before that (Figures 4–7, Supplemental Figures 7–9 and Supplemental Table 11). Our data suggested that gene interactions were at their highest complexity at the initiation of leaf, as has been described in petal color regulation in R. simsii (Yang F et al., 2020) and S. oblata (Ma et al., 2022).
We found almost all the PFG biosynthesis genes are co-regulated by a set of commonly shared TFs; this was evidenced in CsMYBF1 (Liu et al., 2016), GtMYBP3, and GtMYBP4 (Nakatsuka et al., 2012). Grotewold (2008) reported that the control of secondary metabolism is often carried out by TFs that are specialized in controlling particular branches of a pathway, often by activating or repressing the expression of a few genes encoding metabolic enzymes. The shared TFs in 7 TO-GCNs related to PFG biosynthesis pathways might the key regulators, including MYB (Ebr02G010200), bZIP (Ebr05G038380), C2H2 (Ebr05G010200), MYB (Ebr05G057070), MYB (Ebr0G003750), MYB (Ebr02G055930), MYB (Ebr01G039880), and WRKY (Ebr03G071730) (Figures 4–7, Supplemental Figure 7–9). SG7 group MYBs, Ebr0G003750, Ebr02G055930, and Ebr02G010200 can serve as the marker genes, which allowed us to find possible candidate pathways controlling flavonol pathway in Epimedium.
Based on the aforementioned description, a model is proposed to elucidate the PFG accumulation pattern and how the aforementioned fine-tuners control flavonoid biosynthesis (Figure 10). Although partial important TF and TF pairs or TF and biosynthesis genes relationships have been tested by qRT-PCR (Figure 9), the regulatory relationships between more TFs need to be further confirmed.
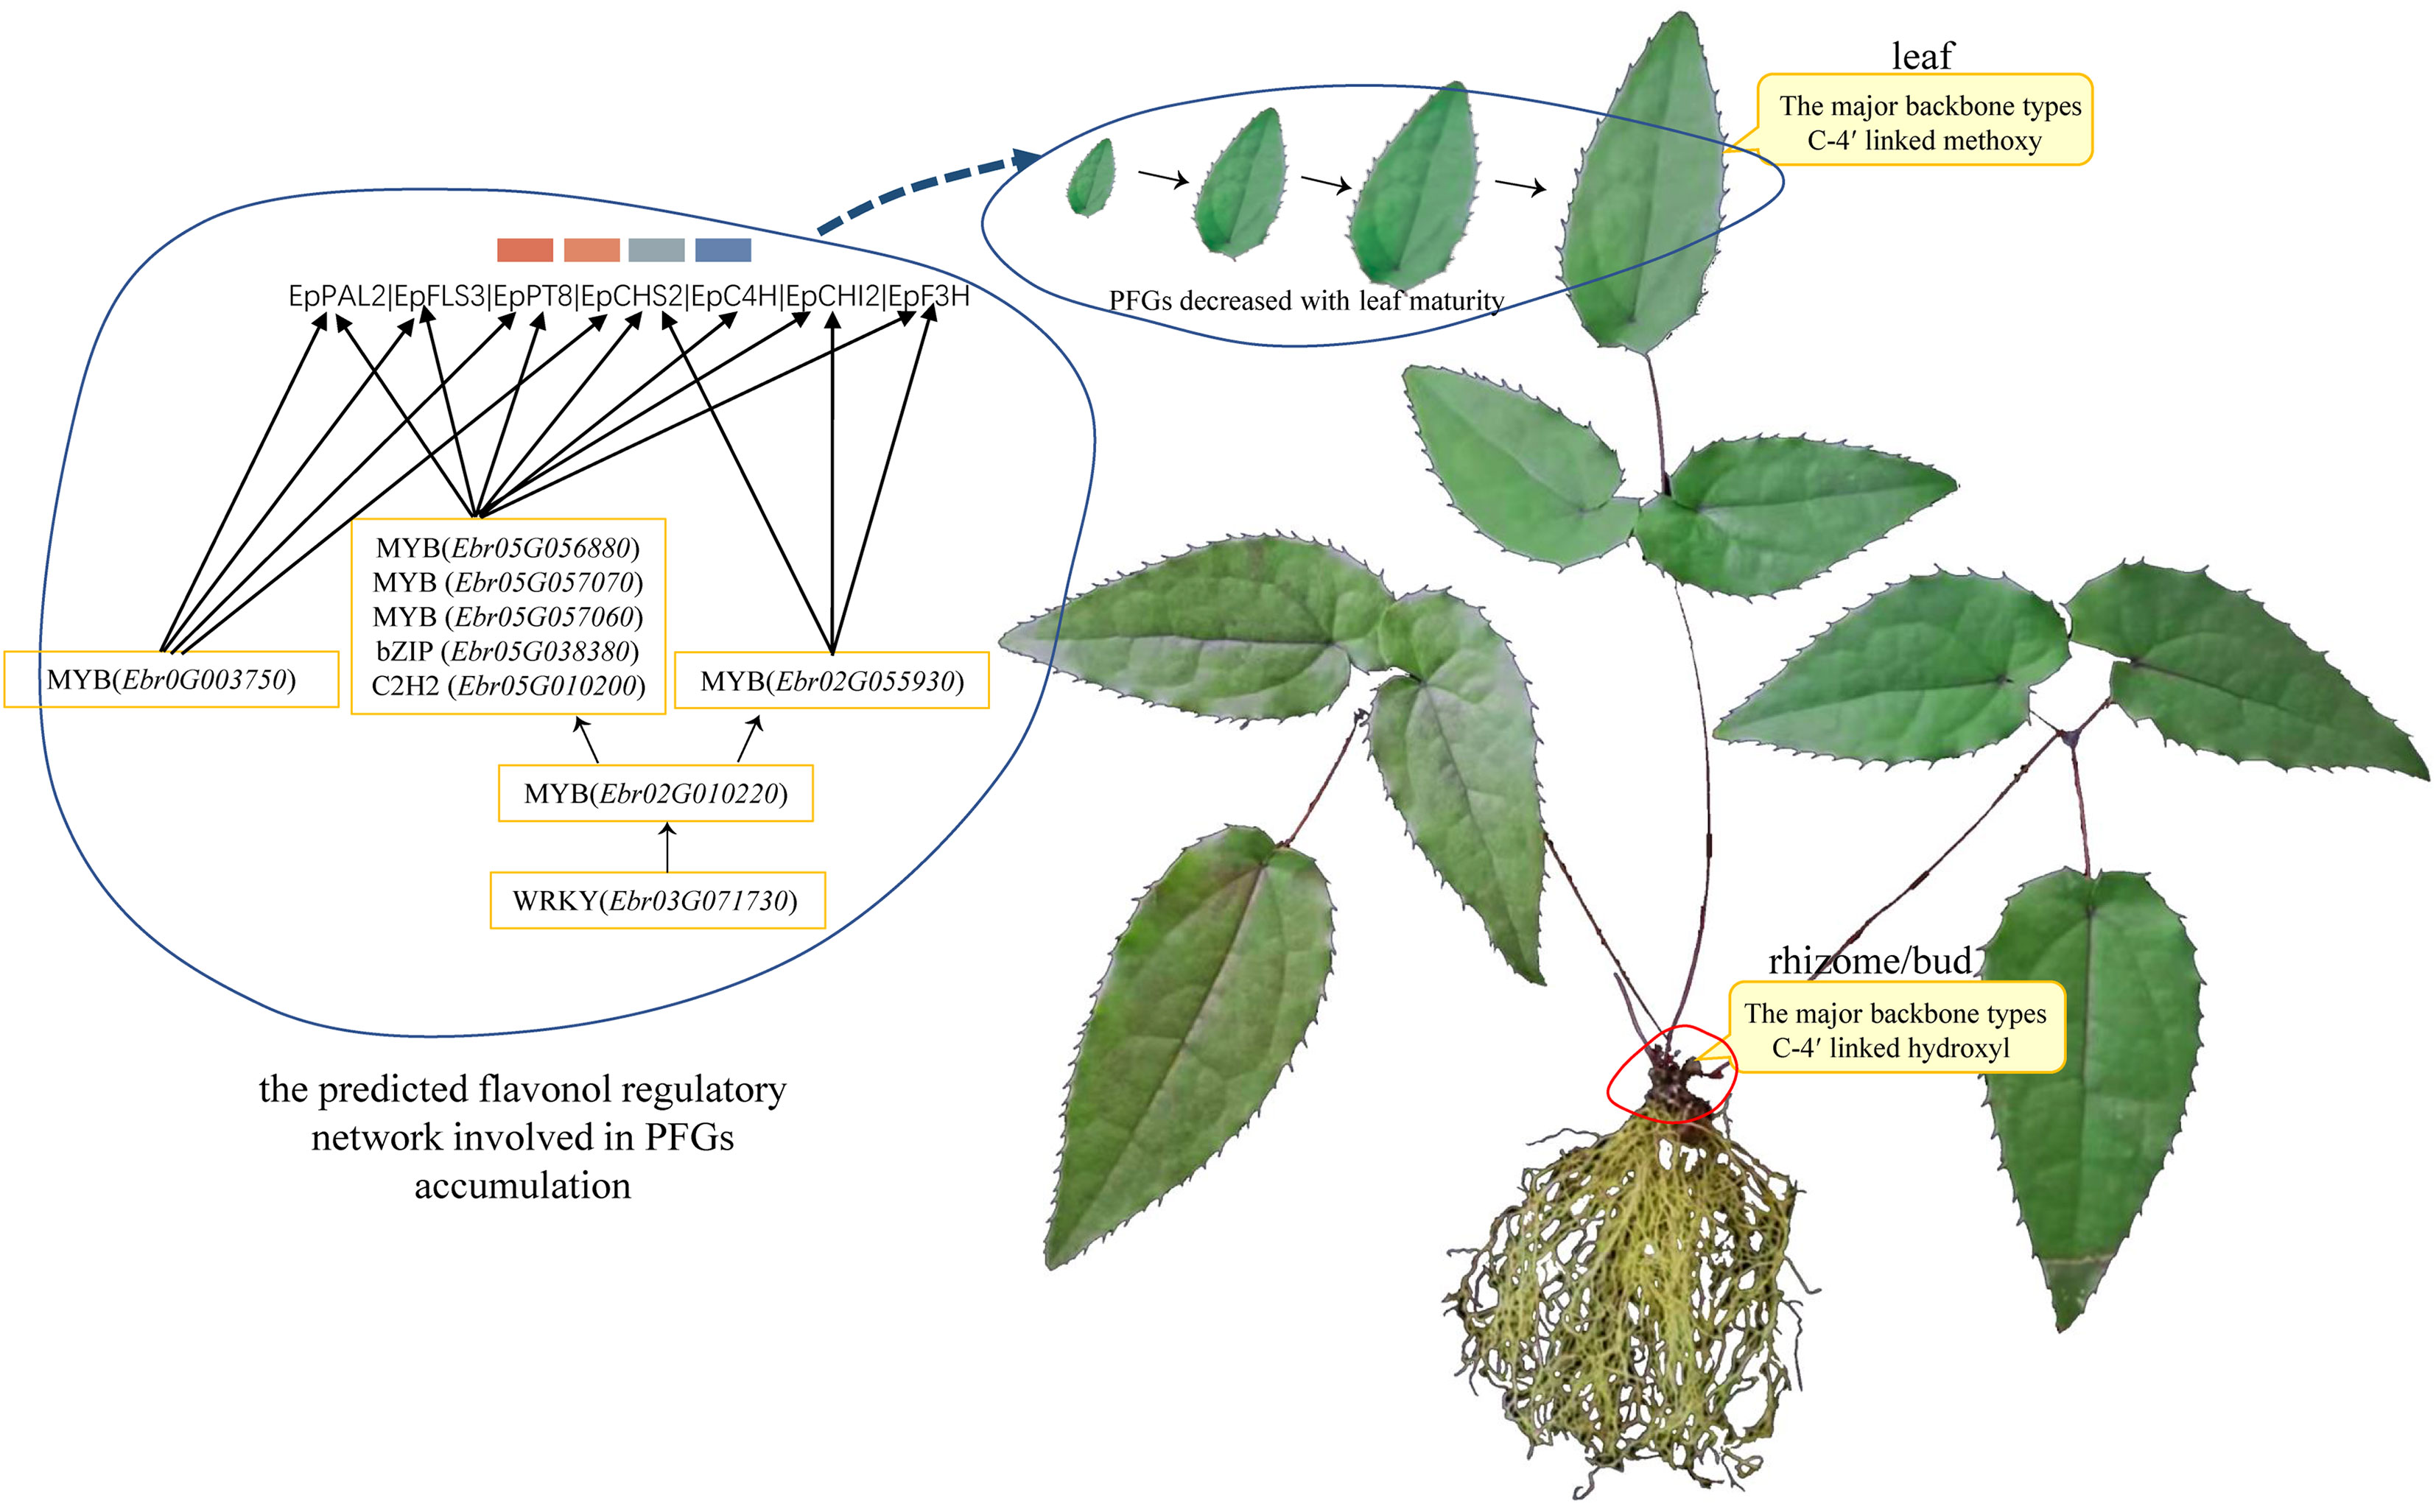
Figure 10 Possible model for this study.
Conclusion
By performing a combined analysis of metabolite profiling (targeted to prenylated flavonol glycosides) and a high-temporal-resolution transcriptome analysis in E. pubescens, the overall decline pattern of PFGs accumulation was clarified. Based on TO-GCNs, a TF gene homologous to EsMYBF1 was found, multiple new TFs were predicted, and cascade regulatory networks related to prenylated flavonol glycosides were established. Partial TFs have been validated by WGCNA analysis and qRT-PCR. This is the first time that high-temporal-resolution transcriptome was performed to explore the cascade regulation of structural genes related to active ingredients accumulation in medicinal plants, which provide guidance for further studies on the role of TFs involved in PFGs biosynthesis and breeding programs. Although the TO-GCN results suggest the potential regulatory relationship between TFs and TFs, and between TFs and structural genes, further studies are needed in order to confirm the connections. In future work, molecular biology experiments such as subcellular localization and genetic transformation of hairy roots and yeast one-hybrid could be utilized to further verify the candidate TF activity in regulating the prenylated flavonol glycoside content and the binding ability to target gene promoters.
Data availability statement
The datasets presented in this study can be found in online repositories. The names of the repository/repositories and accession number(s) can be found in the article/Supplementary material.
Author contributions
BG and CX conceived and designed the study; CX, YZ, and XL prepared the materials, conducted the experiments, and analyzed all data; CX wrote the manuscript; XF, FS, GS, CS, BG, and CX were involved in data interpretation and finalizing the manuscript draft. All authors read and approved the final draft.
Funding
This work was financially supported by the CAMS Innovation Fund for Medical Sciences (CIFMS) (2021-I2M-1-031).
Acknowledgments
We are grateful to traditional Chinese medicine professional technical cooperative of Changhong for help in sample collection.
Conflict of interest
The authors declare that the research was conducted in the absence of any commercial or financial relationships that could be construed as a potential conflict of interest.
Publisher’s note
All claims expressed in this article are solely those of the authors and do not necessarily represent those of their affiliated organizations, or those of the publisher, the editors and the reviewers. Any product that may be evaluated in this article, or claim that may be made by its manufacturer, is not guaranteed or endorsed by the publisher.
Supplementary material
The Supplementary Material for this article can be found online at: https://www.frontiersin.org/articles/10.3389/fpls.2023.1183481/full#supplementary-material
Supplementary Figure 1 | Different UPLC-PDA fingerprint characteristics in different leaf development stages (S0~S5) of E. pubescens. (Rt=2.07 min) Diphyllodside B; (Rt=2.19 min) Epimedoside A; (Rt=4.11 min) Epimedin A; (Rt=4.32 min) Epimedin B; (Rt=4.52 min) Epimedin C; (Rt=4.71 min) icariin; (Rt=5.50 min) 3’’’-carbonyl-2’’-β-L-quinovosyl-icariin; (Rt=6.15 min) Anhydroicaritin-3-O-(acetyl) rhamnopyranosyl-xylopyranosyl-7-O-glucopyranoside; (Rt=7.36 min) 2’’-O-rhamnosyl-ikarisoside A; (Rt=7.42 min and Rt=7.46 min) Anhydroicaritin-3-O-(acetyl) rhamnopyranosyl-(acetyl)xylopyranosyl-7-O-glucopyranoside or its isomers; (Rt=7.53 min) Ikarisoside A; and (Rt=8.26 min) 2’’-O-rhamnopyranosyl icariside II; (Rt=8.77 min) icariside II.
Supplementary Figure 2 | Mass spectrogram of chromatographic notable peak. Each PFG was identified under negative- and positive ion mode. (A) Diphyllodside B; (B) Epimedoside A; (C) Epimedin A; (D) Epimedin B; (E) Epimedin C; (F) icariin; (G) 3’’’-carbonyl-2’’-β-L-quinovosyl-icariin; (H) Anhydroicaritin-3-O-(acetyl)rhamnopyranosyl-xylopyranosyl-7-O-glucopyranoside; (I) 2’’-O-rhamnosyl-ikarisoside A; (J) Anhydroicaritin-3-O-(acetyl) rhamnopyranosyl-(acetyl)xylopyranosyl-7-O-glucopyranoside or its isomers; (K) Ikarisoside A; (L) 2’’-O-rhamnopyranosyl icariside II; (M) icariside II.
Supplementary Figure 3 | Mother nucleus structure of PFGs in all stages of E. pubescens leaves.
Supplementary Figure 4 | Comparative analysis of biological processes by GO enrichment in multiple leaf development stages.
Supplementary Figure 5 | GO enrichment of S1 vs S4 up-regulated genes.
Supplementary Figure 6 | KEGG enrichment of S1 vs S4 up-regulated genes.
Supplementary Figure 7 | Classification of 4CL genes of E. pubescens determined by the classification system of A. thaliana.
Supplementary Figure 8 | Resolved hierarchical regulation for EpC4H. The notion is the same as .
Supplementary Figure 9 | Resolved hierarchical regulation for EpCHI2. The notion is the same as .
Supplementary Figure 10 | Resolved hierarchical regulation for EpF3H. The notion is the same as.
References
Aharoni, A., De Vos, C. R., Wein, M., Sun, Z., Greco, R., Kroon, A., et al. (2001). The strawberry FaMYB1 transcription factor suppresses anthocyanin and flavonol accumulation in transgenic tobacco. Plant J. 28 (3), 319–332. doi: 10.1046/j.1365-313X.2001.01154.x
Blighe, K., Lun, A. (2019). PCAtools: everything principal components analysis. r package version 2.0. https://github.com/kevinblighe/PCAtools
Chang, Y. M., Lin, H. H., Liu, W. Y., Yu, C. P., Chen, H. J., Wartini, P. P., et al. (2019). Comparative transcriptomics method to infer gene coexpression networks and its applications to maize and rice leaf transcriptomes. Proc. Natl. Acad. Sci. 116, 3091–3099. doi: 10.1073/pnas.1817621116
Conesa, A., Nueda, M. J., Ferrer, A., Talón, M. (2006). maSigPro: a method to identify significantly differential expression profiles in time-course microarray experiments. Bioinformatics 22 (9), 1096–1102. doi: 10.1093/bioinformatics/btl056
Czemmel, S., Stracke, R., Weisshaar, B., Cordon, N., Harris, N. N., Walker, A. R., et al. (2009). The grapevine R2R3-MYB transcription factor VvMYBF1 regulates flavonol synthesis in developing grape berries. Plant Physiol. 151 (3), 1513–1530. doi: 10.1104/pp.109.142059
Feng, K., Chen, R., Xie, K., Chen, D., Guo, B., Liu, X., et al. (2018). A regiospecific rhamnosyltransferase from Epimedium pseudowushanense catalyzes the 3-O-rhamnosylation of prenylflavonols. Org. Biomol. Chem. 16, 452–458. doi: 10.1039/C7OB02763J
Feng, K., Chen, R., Xie, K., Chen, D., Liu, J., Du, W., et al. (2019). Ep7GT, a glycosyltransferase with sugar donor flexibility from Epimedium pseudowushanense, catalyzes the 7-O-glycosylation of baohuoside. Org. Biomol. Chem. 17, 8106–8114. doi: 10.1039/C9OB01352K
Fischer, D. S., Theis, F. J., Yosef, N. (2018). Impulse model-based differential expression analysis of time course sequencing data. Nucleic Acids Res. 46 (20), e119–e119. doi: 10.1093/nar/gky675
Grotewold, E. (2008). Transcription factors for predictive plant metabolic engineering: are we there yet? Curr. Opin. Biotechnol. 19, 138–144. doi: 10.1016/j.copbio.2008.02.002
Grunewald, W., De Smet, I., Lewis, D. R., Löfke, C., Jansen, L., Goeminne, G., et al. (2012). Transcription factor WRKY23 assists auxin distribution patterns during arabidopsis root development through local control on flavonol biosynthesis. Proc. Natl. Acad. Sci. 109 (5), 1554–1559. doi: 10.1073/pnas.1121134109
He, Y., Pan, L., Yang, T., Wang, W., Li, C., Chen, B., et al. (2021). Metabolomic and confocal laser scanning microscopy (clsm) analyses reveal the important function of flavonoids in amygdalus pedunculata pall leaves with temporal changes. Front. Plant Sci. 12, 648277. doi: 10.3389/fpls.2021.648277
Huang, W., Khaldun, A., Chen, J., Zhang, C., Lv, H., Yuan, L., et al. (2016a). A R2R3-MYB transcription factor regulates the flavonol biosynthetic pathway in a traditional Chinese medicinal plant, Epimedium sagittatum. Front. Plant Sci. 7, 1089. doi: 10.3389/fpls.2016.01089
Huang, W., Khaldun, A., Lv, H., Du, L., Zhang, C., Wang, Y. (2016b). Isolation and functional characterization of a R2R3-MYB regulator of the anthocyanin biosynthetic pathway from Epimedium sagittatum. Plant Cell Rep. 35, 883–894. doi: 10.1007/s00299-015-1929-z
Huang, W., Sun, W., Lv, H., Luo, M., Zeng, S., Pattanaik, S., et al. (2013). A R2R3-MYB transcription factor from Epimedium sagittatum regulates the flavonoid biosynthetic pathway. PloS One 8, e70778. doi: 10.1371/journal.pone.0070778
Huang, W., Sun, W., Lv, H., Xiao, G., Zeng, S., Wang, Y. (2012). Isolation and molecular characterization of thirteen R2R3-MYB transcription factors from Epimedium sagittatum. Int. J. Mol. Sci. 14, 594–610. doi: 10.3390/ijms14010594
Huang, W., Zeng, S., Xiao, G., Wei, G., Liao, S., Chen, J., et al. (2015). Elucidating the biosynthetic and regulatory mechanisms of flavonoid-derived bioactive components in Epimedium sagittatum. Front. Plant Sci. 6, 689. doi: 10.3389/fpls.2015.00689
Kang, H. K., Choi, Y. H., Kwon, H., Lee, S. B., Kim, D. H., Sung, C. K., et al. (2012). Estrogenic/antiestrogenic activities of a Epimedium koreanum extract and its major components: in vitro and in vivo studies. Food Chem. Toxicol. 50, 2751–2759. doi: 10.1016/j.fct.2012.05.017
Kim, D., Langmead, B., Salzberg, S. L. (2015). HISAT: a fast spliced aligner with low memory requirements. Nat. Methods 12, 357–360. doi: 10.1038/nmeth.3317
Kumar, L., Futschik, M. E. (2007). Mfuzz: a software package for soft clustering of microarray data. Bioinformation 2 (1), 5. doi: 10.6026/97320630002005
Larkin, M. A., Blackshields, G., Brown, N. P., Chenna, R., Mcgettigan, P. A., Mcwilliam, H., et al. (2007). Clustal W and clustal X version 2.0. Bioinformatics 23, 2947–2948. doi: 10.1093/bioinformatics/btm404
Letunic, I., Bork, P. (2019). Interactive tree of life (iTOL) v4: recent updates and new developments. Nuc. Acids Res. 47, 256–259. doi: 10.1093/nar/gkz239
Li, S. (2014). Transcriptional control of flavonoid biosynthesis: fine-tuning of the MYB-bHLH-WD40 (MBW) complex. Plant Signaling Behav. 9 (1), e27522. doi: 10.4161/psb.27522
Li, C., Wu, J., Hu, K. D., Wei, S. W., Sun, H. Y., Hu, L. Y., et al. (2020). PyWRKY26 and PybHLH3 cotargeted the PyMYB114 promoter to regulate anthocyanin biosynthesis and transport in red-skinned pears. Hortic. Res. 7, 37–48. doi: 10.1038/s41438-020-0254-z
Li, S., Zachgo, S. (2013). TCP3 interacts with R2R3-MYB proteins, promotes flavonoid biosynthesis and negatively regulates the auxin response in Arabidopsis thaliana. Plant J. 76 (6), 901–913. doi: 10.1111/tpj.12348
Li, C., Zhang, L., Niu, D., Nan, S., Miao, X., Hu, X., et al. (2021). Investigation of flavonoid expression and metabolite content patterns during seed formation of Artemisia sphaerocephala krasch. Seed Sci. Res. 31 (2), 136–148. doi: 10.1017/S096025852100012X
Liang, T., Shi, C., Peng, Y., Tan, H., Xin, P., Yang, Y., et al. (2020). Brassinosteroid-activated BRI1-EMS-SUPPRESSOR 1 inhibits flavonoid biosynthesis and coordinates growth and UV-b stress responses in plants. Plant Cell 32, 3224–3239. doi: 10.1105/tpc.20.00048
Liao, Y., Smyth, G. K., Shi, W. (2019). The r package rsubread is easier, faster, cheaper and better for alignment and quantification of RNA sequencing reads. Nuc. Acids Res. 47 (8), e47. doi: 10.1093/nar/gkz114
Liu, W., Feng, Y., Yu, S., Fan, Z., Li, X., Li, J., et al. (2021). The flavonoid biosynthesis network in plants. Int. J. Mol. Sci. 22 (23), 12824. doi: 10.3390/ijms222312824
Liu, C., Long, J., Zhu, K., Liu, L., Yang, W., Zhang, H., et al. (2016). Characterization of a citrus R2R3-MYB transcription factor that regulates the flavonol and hydroxycinnamic acid biosynthesis. Sci. Rep. 6 (1), 1–16. doi: 10.1038/srep25352
Liu, Y., Lou, Q., Xu, W., Xin, Y., Bassett, C., Wang, Y. (2011). Characterization of a chalcone synthase (CHS) flower-specific promoter from Lilium orential ‘Sorbonne’. Plant Cell Rep. 30, 2187–2194. doi: 10.1007/s00299-011-1124-9
Liu, Y., Wu, L., Deng, Z., Yu, Y. (2021). Two putative parallel pathways for naringenin biosynthesis in Epimedium wushanense. RSC Adv. 11, 13919–13927. doi: 10.1039/D1RA00866H
Love, M. I., Huber, W., Anders, S. (2014). Moderated estimation of fold change and dispersion for RNA-seq data with DESeq2. Genome Biol. 15 (12), 550. doi: 10.1186/s13059-014-0550-8
Lyu, Y. (2020). Identification and characterization of three flavonoid 3-O-glycosyltransferases from Epimedium koreanum nakai. Bioc. Engi. J. 163, 107759. doi: 10.1016/j.bej.2020.107759
Ma, H., He, X., Yang, Y., Li, M., Hao, D., Jia, Z. (2011). The genus epimedium: an ethnopharmacological and phytochemical review. J. Ethno. 134, 519–541. doi: 10.1016/j.jep.2011.01.001
Ma, B., Wu, J., Shi, T. L., Yang, Y. Y., Wang, W. B., Zheng, Y., et al. (2022). Lilac (Syringa oblata) genome provides insights into its evolution and molecular mechanism of petal color change. Commun. Biol. 5 (1), 686. doi: 10.1038/s42003-022-03646-9
Malacarne, G., Coller, E., Czemmel, S., Vrhovsek, U., Engelen, K., Goremykin, V., et al. (2016). The grapevine VvibZIPC22 transcription factor is involved in the regulation of flavonoid biosynthesis. J. Exp. Bot. 67 (11), 3509–3522. doi: 10.1093/jxb/erw181
Mehrtens, F., Kranz, H., Bednarek, P., Weisshaar, B. (2005). The arabidopsis transcription factor MYB12 is a flavonol-specific regulator of phenylpropanoid biosynthesis. Plant Physiol. 138 (2), 1083–1096. doi: 10.1104/pp.104.058032
Minh, B. Q., Schmidt, H. A., Chernomor, O., Schrempf, D., Woodhams, M. D., Von Haeseler, A., et al. (2020). IQ-TREE 2: new models and efficient methods for phylogenetic inference in the genomic era. Mol. Biol. Evol. 37, 1530–1534. doi: 10.1093/molbev/msaa015
Naik, J., Misra, P., Trivedi, P. K., Pandey, A. (2022). Molecular components associated with the regulation of flavonoid biosynthesis. Plant Sci. 317, 111196. doi: 10.1016/j.plantsci.2022.111196
Nakatsuka, T., Saito, M., Yamada, E., Fujita, K., Kakizaki, Y., Nishihara, M. (2012). Isolation and characterization of GtMYBP3 and GtMYBP4, orthologues of R2R3-MYB transcription factors that regulate early flavonoid biosynthesis, in gentian flowers. J. Exp. Bot. 63 (18), 6505–6517. doi: 10.1093/jxb/ers306
Pan, J., Chen, H., Guo, B., Liu, C. (2017). Understanding the molecular mechanisms underlying the effects of light intensity on flavonoid production by RNA-seq analysis in Epimedium pseudowushanense BL guo. PloS One 12, e0182348. doi: 10.1371/journal.pone.0182348
Pant, S., Huang, Y. (2022). Genome-wide studies of PAL genes in sorghum and their responses to aphid infestation. Sci. Rep. 12 (1), 22537. doi: 10.1038/s41598-022-25214-1
Shannon, P., Markiel, A., Ozier, O., Baliga, N. S., Wang, J. T., Ramage, D., et al. (2003). Cytoscape: a software environment for integrated models of biomolecular interaction networks. Genome Res. 13, 2498–2504. doi: 10.1101/gr.1239303
Shen, G., Luo, Y., Yao, Y., Meng, G., Zhang, Y., Wang, Y., et al. (2022). The discovery of a key prenyltransferase gene assisted by a chromosome-level Epimedium pubescens genome. Front. Plant Sci. 13. doi: 10.3389/fpls.2022.1034943
Song, Z., Luo, Y., Wang, W., Fan, N., Wang, D., Yang, C., et al. (2020). NtMYB12 positively regulates flavonol biosynthesis and enhances tolerance to low pi stress in Nicotiana tabacum. Front. Plant Sci. 101683. doi: 10.3389/fpls.2019.01683
Stracke, R., Ishihara, H., Huep, G., Barsch, A., Mehrtens, F., Niehaus, K., et al. (2007). Differential regulation of closely related R2R3-MYB transcription factors controls flavonol accumulation in different parts of the Arabidopsis thaliana seedling. Plant J. 50 (4), 660–677. doi: 10.1111/j.1365-313X.2007.03078.x
Stracke, R., Jahns, O., Keck, M., Tohge, T., Niehaus, K., Fernie, A. R., et al. (2010). Analysis of PRODUCTION OF FLAVONOL GLYCOSIDES-dependent flavonol glycoside accumulation in Arabidopsis thaliana plants reveals MYB11-, MYB12- and MYB111-independent flavonol glycoside accumulation. New Phytol. 188 (4), 985–1000. doi: 10.1111/j.1469-8137.2010.03421.x
Tong, Q., Zhang, C., Tu, Y., Chen, J., Li, Q., Zeng, Z., et al. (2022). Biosynthesis-based spatial metabolome of Salvia miltiorrhiza bunge by combining metabolomics approaches with mass spectrometry-imaging. Talanta 238, 123045. doi: 10.1016/j.talanta.2021.123045
Valares Masa, C., Sosa Díaz, T., Alías Gallego, J. C., Chaves Lobón, N. (2016). Quantitative variation of flavonoids and diterpenes in leaves and stems of Cistus ladanifer l. at different ages. Molecules 21, 275. doi: 10.3390/molecules21030275
Wallace, J., Larsson, S., Buckler, E. (2014). Entering the second century of maize quantitative genetics. Heredity 112, 30–38. doi: 10.1038/hdy.2013.6
Wang, Q., Jiang, Y., Mao, X., Yu, W., Lu, J., Wang, L. (2022). Integration of morphological, physiological, cytological, metabolome and transcriptome analyses reveal age inhibited accumulation of flavonoid biosynthesis in Ginkgo biloba leaves. Ind. Crops. Prod. 187, 115405. doi: 10.1016/j.indcrop.2022.115405
Wang, P., Li, C., Li, X., Huang, W., Wang, Y., Wang, J., et al. (2021). Complete biosynthesis of the potential medicine icaritin by engineered Saccharomyces cerevisiae and Escherichia coli. Sci. Bull. 66, 1906–1916. doi: 10.1016/j.scib.2021.03.002
Wang, Z., Zhang, X., Wang, H., Qi, L., Lou, Y. (2007). Neuroprotective effects of icaritin against beta amyloid-induced neurotoxicity in primary cultured rat neuronal cells via estrogen-dependent pathway. Neuroscience 145, 911–922. doi: 10.1016/j.neuroscience.2006.12.059
Wong, C. Y., Chang, Y. M., Tsai, Y. S., Ng, W. V., Cheong, S. K., Chang, T. Y., et al. (2020). Decoding the differentiation of mesenchymal stem cells into mesangial cells at the transcriptomic level. BMC Genomics 21, 1–14. doi: 10.1186/s12864-020-06868-5
Xie, P. S., Yan, Y. Z., Guo, B. L., Lam, C., Chui, S., Yu, Q. (2010). Chemical pattern-aided classification to simplify the intricacy of morphological taxonomy of epimedium species using chromatographic fingerprinting. J. Pharm. Biomed. Anal. 52, 452–460. doi: 10.1016/j.jpba.2010.01.025
Xu, W., Dubos, C., Lepiniec, L. (2015). Transcriptional control of flavonoid biosynthesis by MYB-bHLH-WDR complexes. Trends Plant Sci. 20 (3), 176–185. doi: 10.1016/j.tplants.2014.12.001
Xu, W., He, S., Huang, M., Wang, Y. (2007). Determination of icariin contents indifferent plant parts of epimedium plants in guizhou by HPLC. Chin. J. Exp. Tradit. Med. Form. 13 (5), 1–3.
Xu, J., Luo, H., Zhou, S. S., Jiao, S. Q., Jia, K. H., Nie, S., et al. (2022). UV-B and UV-c radiation trigger both common and distinctive signal perceptions and transmissions in Pinus tabuliformis Carr. Tree Physiol. 42 (8), 1587–1600. doi: 10.1093/treephys/tpac021
Xu, J., Nie, S., Xu, C. Q., Liu, H., Jia, K. H., Zhou, S. S., et al. (2021). UV-B-induced molecular mechanisms of stress physiology responses in the major northern Chinese conifer Pinus tabuliformis Carr. Tree Physiol. 41 (7), 1247–1263. doi: 10.1093/treephys/tpaa180
Yadav, S. K., Kumar, V., Singh, S. P. (2018). Recent trends and techniques in plant metabolic engineering (Singapore: Springer Nature Singapore Pte). doi: 10.1007/978-981-13-2251-8
Yang, X., Chen, J., Huang, W., Zhang, Y., Yan, X., Zhou, Z., et al. (2020). Synthesis of icariin in tobacco leaf by overexpression of a glucosyltransferase gene from Epimedium sagittatum. Ind. Crops. Prod. 156, 112841. doi: 10.1016/j.indcrop.2020.112841
Yang, F. S., Nie, S., Liu, H., Shi, T. L., Tian, X. C., Zhou, S. S., et al. (2020). Chromosome-level genome assembly of a parent species of widely cultivated azaleas. Nat. Commun. 11 (1), 5269. doi: 10.1038/s41467-020-18771-4
Yao, Y., Gu, J., Luo, Y., Wang, Y., Pang, Y., Shen, G., et al. (2022a). Genome-wide analysis of UGT gene family identified key gene for the biosynthesis of bioactive flavonol glycosides in Epimedium pubescens maxim. Synth. Syst. Biotechnol. 7, 1095–1107. doi: 10.1016/j.synbio.2022.07.003
Yao, Y., Gu, J., Luo, Y., Zhang, Y., Wang, Y., Pang, Y., et al. (2022b). A novel 3-O-rhamnoside: 2’’-O-xylosyltransferase responsible for terminal modification of prenylflavonol glycosides in Epimedium pubescens maxim. Int. J. Mol. Sci. 23, 16050. doi: 10.3390/ijms232416050
Yao, P., Huang, Y., Dong, Q., Wan, M., Wang, A., Chen, Y., et al. (2020). FtMYB6, a light-induced SG7 R2R3-MYB transcription factor, promotes flavonol biosynthesis in tartary buckwheat (Fagopyrum tataricum). J. Agric. Food Chem. 68 (47), 13685–13696. doi: 10.1021/acs.jafc.0c03037
Yu, J., Jiang, Q., Sun, R., Lv, H. (2012). Determination of the effective components in different parts and harvest time of Epimedium koreanum. Chin. J. Exp. Tradit. Med. Form. 18, 92–95.
Yu, G., Wang, L. G., Han, Y., He, Q. (2012). clusterProfiler: an r package for comparing biological themes among gene clusters. J. Integr. Biol. 16, 284–287. doi: 10.1089/omi.2011.0118
Zeng, S., Liu, Y., Hu, W., Liu, Y., Shen, X., Wang, Y. (2013a). Integrated transcriptional and phytochemical analyses of the flavonoid biosynthesis pathway in epimedium. Plant Cell Tiss. Organ Cult. 115, 355–365. doi: 10.1007/s11240-013-0367-2
Zeng, S., Liu, Y., Zou, C., Huang, W., Wang, Y. (2013b). Cloning and characterization of phenylalanine ammonia-lyase in medicinal epimedium species. Plant Cell Tiss. Organ. Cult. 113, 257–267. doi: 10.1007/s11240-012-0265-z
Zhai, R., Zhao, Y., Wu, M., Yang, J., Li, X., Liu, H., et al. (2019). The MYB transcription factor PbMYB12b positively regulates flavonol biosynthesis in pear fruit. BMC Plant Biol. 19 (1), 1–11. doi: 10.1186/s12870-019-1687-0
Zhang, H., Yang, X., Guo, Y., Wang, Y. (2009). Sustainable use of epimedium resources: current status and prospects. Chin. Bull. Bot. 44, 363. doi: 10.3969/j.issn.1674-3466.2009.03.014
Zhao, J., Dixon, R. (2010). The ‘ins’ and ‘outs’ of flavonoid transport. Trends Plant Sci. 15, 72–80. doi: 10.1016/j.tplants.2009.11.006
Zhao, H., Guo, Y., Li, S., Han, R., Ying, J., Zhu, H., et al. (2015). A novel anti-cancer agent icaritin suppresses hepatocellular carcinoma initiation and malignant growth through the IL-6/Jak2/Stat3 pathway. Oncotarget 6, 31927. doi: 10.18632/oncotarget.5578
Zhao, Y., Jia, K., Tian, Y., Han, K., El-Kassaby, Y. A., Yang, H., et al. (2023). Time-course transcriptomics analysis reveals key responses of populus to salt stress. Ind. Crops Prod. 194, 116278. doi: 10.1016/j.indcrop.2023.116278
Zhao, H. Y., Sun, J. H., Fan, M. X., Fan, L., Zhou, L., Li, Z., et al. (2008). Analysis of phenolic compounds in epimedium plants using liquid chromatography coupled with electrospray ionization mass spectrometry. J. @ Chrom. A 1190, 157–181. doi: 10.1016/j.chroma.2008.02.109
Zhao, X., Zeng, X., Lin, N., Yu, S., Fernie, A. R., Zhao, J. (2021). CsbZIP1-CsMYB12 mediates the production of bitter-tasting flavonols in tea plants (Camellia sinensis) through a coordinated activator–repressor network. Hortic. Res. 8, 110. doi: 10.1038/s41438-021-00545-8
Zhao, Q., Zhang, Y., Wang, G., Hill, L., Weng, J. K., Chen, X. Y., et al. (2016). A specialized flavone biosynthetic pathway has evolved in the medicinal plant, Scutellaria baicalensis. Sci. Adv. 2 (4), e1501780. doi: 10.1126/sciadv.1501780
Zheng, Y., Jiao, C., Sun, H., Rosli, H. G., Pombo, M. A., Zhang, P., et al. (2016). iTAK: a program for genome-wide prediction and classification of plant transcription factors, transcriptional regulators, and protein kinases. Mol. Plant 9, 1667–1670. doi: 10.1016/j.molp.2016.09.014
Zhou, J., Gao, S., Chen, J., Zeng, W., Yu, S. (2021). A flavonoid 4’-o-methyltransferase from epimedium koreanum and its application. China Patent No ZL202111098372.9. (China: State Intellectual Property Office, China).
Zhong, C., Tang, Y., Pang, B., Li, X., Yang, X., Deng, Y., et al. (2020). The R2R3-MYB transcription factor GhMYB1a regulates flavonol and anthocyanin accumulation in Gerbera hybrida. Hortic. Res. 7, 78. doi: 110.1038/s41438-020-0296-2
Zhou, H., Wang, K., Wang, H., Gu, C., Dare, A., Espley, R., et al. (2015). Molecular genetics of blood-fleshed peach reveals activation of anthocyanin biosynthesis by NAC transcription factors. Plant J. 82, 105–121. doi: 10.1111/tpj.12792
Zhou, M., Zheng, W., Sun, X., Yuan, M., Zhang, J., Chen, X., et al. (2021). Comparative analysis of chemical components in different parts of epimedium herb. J. Pharm. Biomed. Anal. 198, 113984. doi: 10.1016/j.jpba.2021.113984
Zhu, J. H., Li, H. L., Guo, D., Wang, Y., Dai, H. F., Mei, W. L., et al. (2016). Transcriptome-wide identification and expression analysis of glutathione s-transferase genes involved in flavonoids accumulation in Dracaena cambodiana. Plant Physiol. Biochem. 104, 304–311. doi: 10.1016/j.plaphy.2016.05.012
Keywords: Epimedium pubescens, prenylated flavonol glycosides, time-series transcriptome, gene regulatory network, transcription factor
Citation: Xu C, Liu X, Shen G, Fan X, Zhang Y, Sun C, Suo F and Guo B (2023) Time-series transcriptome provides insights into the gene regulation network involved in the icariin-flavonoid metabolism during the leaf development of Epimedium pubescens. Front. Plant Sci. 14:1183481. doi: 10.3389/fpls.2023.1183481
Received: 10 March 2023; Accepted: 11 May 2023;
Published: 12 June 2023.
Edited by:
Kai-Hua Jia, Shandong Academy of Agricultural Sciences, ChinaReviewed by:
Xian-Ge Hu, Zhejiang Agriculture and Forestry University, ChinaYingyue Li, Beijing Forestry University, China
Juan Guo, Chinese Academy of Medical Sciences and Peking Union Medical College, China
Copyright © 2023 Xu, Liu, Shen, Fan, Zhang, Sun, Suo and Guo. This is an open-access article distributed under the terms of the Creative Commons Attribution License (CC BY). The use, distribution or reproduction in other forums is permitted, provided the original author(s) and the copyright owner(s) are credited and that the original publication in this journal is cited, in accordance with accepted academic practice. No use, distribution or reproduction is permitted which does not comply with these terms.
*Correspondence: Baolin Guo, YmxndW9AaW1wbGFkLmFjLmNu