 Leonardo C. J. Corvalán1
 Mariane B. Sobreiro1Larissa R. Carvalho1
 Renata O. Dias1Ramilla S. Braga-Ferreira1,2Cintia P. Targueta1Carlos M. e Silva-Neto3
 Bianca W. Berton4Ana Maria S. Pereira4José A. F. Diniz-filho5
 Mariana P. C. Telles1,6
 Rhewter Nunes1,3*
- 1Laboratório de Genética & Biodiversidade, Universidade Federal de Goiás, Goiânia, Brazil
- 2Instituto de Ciências Exatas e Naturais, Universidade Federal de Rondonópolis, Rondonópolis, Brazil
- 3Instituto Federal de Goiás, Goiás, Brazil
- 4Universidade de Ribeirão Preto, Ribeirão Preto, Brazil
- 5Laboratório de Ecologia Teórica e Síntese, Universidade Federal de Goiás, Goiânia, Brazil
- 6Escola de Ciências Médicas e da Vida, Pontifícia Universidade Católica de Goiás, Goiânia, Brazil
Serjania erecta Raldk is an essential genetic resource due to its anti-inflammatory, gastric protection, and anti-Alzheimer properties. However, the genetic and evolutionary aspects of the species remain poorly known. Here, we sequenced and assembled the complete chloroplast genome of S. erecta and used it in a comparative analysis within the Sapindaceae family. S. erecta has a chloroplast genome (cpDNA) of 159,297 bp, divided into a Large Single Copy region (LSC) of 84,556 bp and a Small Single Copy region (SSC) of 18,057 bp that are surrounded by two Inverted Repeat regions (IRa and IRb) of 28,342 bp. Among the 12 species used in the comparative analysis, S. erecta has the fewest long and microsatellite repeats. The genome structure of Sapindaceae species is relatively conserved; the number of genes varies from 128 to 132 genes, and this variation is associated with three main factors: (1) Expansion and retraction events in the size of the IRs, resulting in variations in the number of rpl22, rps19, and rps3 genes; (2) Pseudogenization of the rps2 gene; and (3) Loss or duplication of genes encoding tRNAs, associated with the duplication of trnH-GUG in X. sorbifolium and the absence of trnT-CGU in the Dodonaeoideae subfamily. We identified 10 and 11 mutational hotspots for Sapindaceae and Sapindoideae, respectively, and identified six highly diverse regions (tRNA-Lys — rps16, ndhC – tRNA-Val, petA – psbJ, ndhF, rpl32 – ccsA, and ycf1) are found in both groups, which show potential for the development of DNA barcode markers for molecular taxonomic identification of Serjania. We identified that the psaI gene evolves under neutrality in Sapindaceae, while all other chloroplast genes are under strong negative selection. However, local positive selection exists in the ndhF, rpoC2, ycf1, and ycf2 genes. The genes ndhF and ycf1 also present high nucleotide diversity and local positive selection, demonstrating significant potential as markers. Our findings include providing the first chloroplast genome of a member of the Paullinieae tribe. Furthermore, we identified patterns in variations in the number of genes and selection in genes possibly associated with the family’s evolutionary history.
1 Introduction
Chloroplasts are organelles that play an essential role in photosynthesis, which, due to their origin by endosymbiosis between cyanobacteria and primitive eukaryotic cells, have their own DNA, named cpDNA or chloroplast genome (Margulis and Bermudes, 1985; Rodríguez-Ezpeleta et al., 2005; Sato, 2020). In spermatophytes, a quadripartite circular genome pattern is generally observed with two Inverted Repeat regions (IRa and IRb) separated by a Small Single Copy region (SSC) and a Large Single Copy region (LSC) (Jansen and Ruhlman, 2012; Xiao-Ming et al., 2017). Chloroplast genomes are generally used to investigate the evolutionary history between species, evaluate patterns of genetic diversity and demographic history of populations, develop DNA barcode markers for molecular taxonomic identification, and as targets for genetic transformation and production of organisms genetically modified (OGMs) (Leebens-Mack et al., 2005; CBOL Plant Working Group, 2009; Moore et al., 2010; Kang et al., 2021).
In land plants, the number of genes usually varies from 100 to 140, and in some families, such as Sapindaceae, Poaceae, Leguminosae, and Cactaceae, IR expansion and retraction events significantly influence the total number of genes (Wang et al., 2017; Xiao-Ming et al., 2017; Souza et al., 2019; Köhler et al., 2020; Dong et al., 2021). Although there is some variation in the number, the gene order generally seems to have a phylogenetic pattern of conservation in Angiosperms, showing potential to be used in comparative studies to test evolutionary hypotheses related to collinearity and synteny of plastid genes (Wicke et al., 2011). The chloroplast genome contains protein-coding and functional RNA-coding genes such as tRNAs (trn) and rRNAs (rrn). Most of the protein-coding genes are associated with cell replication mechanisms, such as the genes encoding the large subunit of ribosomal proteins (rpl) and the small subunit of ribosomal proteins (rps), photosystem proteins such as psa and psb genes, and the genes encoding NADH dehydrogenase proteins (ndh) (Allen et al., 2011; Jansen and Ruhlman, 2012).
The Sapindaceae family, also known as the soapberry family, comprises about 1900 species of 144 genera, with approximately 80% of its biodiversity contained in tropical and subtropical regions of the Southern Hemisphere (Acevedo-Rodríguez et al., 2010; Muellner-Riehl et al., 2016; Acevedo-Rodríguez et al., 2017; Buerki et al., 2021). Sapindaceae includes plants of different habits, such as trees, shrubs, lianas (woody climbing plants), and herbaceous climbing plants. It also presents species of high economic importance due to their timber, fruit, and medicinal uses (Ferrucci and Acevedo-Rodríguez, 2005; Buerki et al., 2009; Acevedo-Rodríguez et al., 2010; Muellner-Riehl et al., 2016; Dong et al., 2021). More than 50% of the tribes of the Sapindaceae family do not have a representative with a sequenced chloroplast genome, and only 17 genera contain at least one sequenced chloroplast genome (National Center for Biotechnology Information, July 7th, 2023).
The Sapindaceae family emerged at the beginning of the Upper Cretaceous (105 My) and began diversifying approximately 87 My ago in Eurasia. It later diversified throughout the Southern Hemisphere during the Paleocene. Nowadays, this family is subdivided into four subfamilies: (1) Xanthoceroideae, endemic to China; (2) Hippocastanoideae, predominantly occurring in temperate regions; (3) Dodonaeoideae, distributed in tropical and subtropical regions; and (4) Sapindoideae, with wide distribution in tropical and subtropical regions, and it is the most diverse among the four subfamilies (Buerki et al., 2009). The clades that form tribes in this family are still debated. The most recent botanical revision used proposes 20 tribes, of which 16 belong to the subfamily Sapindoideae, two tribes to the subfamily Dodonaeoideae, two tribes to the subfamily Hippocastanoideae, and in the subfamily Xanthoceratoideae no tribes were classified (Buerki et al., 2021). Although molecular studies of the group have been carried out using classical markers and next-generation sequencing, evolutionary perspectives of chloroplast genomes across tribes have yet to be evaluated.
In Sapindaceae, the genus Serjania Mill. has approximately 230 species distributed from the United States to Argentina. The phylogenetic relationships between species of the genus need to be better defined, presenting extensive polytomies. Serjania is the unique liana genus in the Sapindaceae family, and other genera of Sapindaceae are trees, shrubs, or herbs. Furthermore, it is considered the most diverse liana genus in the tropics (Acevedo-Rodriguez, 1990; Acevedo-Rodríguez et al., 2017; Buerki et al., 2021). All Serjania species with known karyotypes are diploid (2n=24) (Urdampilleta et al., 2012), and their genomic data are scarce, with no nuclear draft genomes or organellar genomes available in public databases. In our work, Serjania erecta Raldk (subfamily Sapindoideae; tribe Paullinieae) is the first liana species to have its chloroplast genome assembled and the second species of the Sapindaceae family from the Americas (the first one is Dodonaea viscosa) (Saina et al., 2018). Serjania erecta is a plant traditionally used to treat ulcers and hypertension with potential use in the treatment of Alzheimer’s disease, gastric diseases, and anti-inflammatory use (Gomig et al., 2008; Buerki et al., 2009; Hiruma-Lima et al., 2009).
Here, we assembled the chloroplast genome of Serjania erecta, the first one of the Paullinieae tribe (Sapindaceae), and used it in comparative analysis with species of the Sapindaceae family to elucidate evolutionary aspects that occurred in these genomes. The comparative analysis had as its main aims to identify: (1) Variations in the number of genes in plastomes of the family Sapindaceae; (2) Selection pressure on genes in chloroplast genomes of the Sapindaceae family; and (3) Regions with potential use as markers for the genus Serjania.
2 Materials and methods
2.1 DNA extraction and sequencing
We collected leaves from an individual of Serjania erecta in the Ecocerrado Brasil Private Heritage Reserve in Araxá, Minas Gerais, Brazil (19°36’47.1” S 47°08’20.9” W altitude 939 m) for DNA extraction. The species was determined using the botanical identification key for the genus (Somner et al., 2015). Plant material was identified by Dr. Inês Cordeiro (Instituto Botânico, São Paulo, São Paulo, Brazil), and a voucher specimen was deposited in the Herbarium of Medicinal Plants at UNAERP with voucher number HPMU-835.
Total DNA was extracted using the CTAB protocol (Doyle and Doyle, 1987) and quantified using horizontal agarose gel electrophoresis (1%). The library for sequencing was constructed using the SureSelectQXT kit (catalog number 5500-0120, Agilent Technologies), and the library quality validation was performed using the Bioanalyzer 2100 (Agilent). Subsequently, the library was sequenced on the MiSeq platform (Illumina) in paired-end mode (2x300) using the MiSeq v3 600 cycles kit (Illumina). All the wet laboratory steps were conducted at the Laboratory of Genetics & Biodiversity – LGBio, at the Federal University of Goiás, in Goiânia (GO) – Brazil.
2.2 Chloroplast genome assembly and annotation
Assembly of the S. erecta genome was carried out using the Serjania polyphylla rbcL gene (NCBI accession: GU935455.1) as a seed and 8,814,456 paired-end Illumina reads in the NOVOPlasty v3.2 program (Dierckxsens et al., 2017). Serjania erecta cpDNA annotation was conducted using the GeSeq webserver software (Tillich et al., 2017). In this program, the prediction of protein-coding genes and ribosomal RNAs (rRNAs) was performed using the HMMER profile Search (Wheeler and Eddy, 2013) and BLAT search (Kent, 2002) programs, and the prediction of transporter RNAs (tRNAs) using ARAGORN v1.2.38 (Laslett and Canback, 2004). Next, annotation problems were manually cured based on annotating other chloroplast genomes from the NCBI Genome as references using the Ugene v44.0 program (Okonechnikov et al., 2012). The graphical map of the chloroplast genome was made using Organelle Genome Draw (OGDRAW) version 1.3.1 (Lohse et al., 2013). The frequency of each codon was identified using the Sequence Manipulation Suite webserver: codon usage (https://www.bioinformatics.org/sms2/codon_usage).
2.3 Comparative genomic analysis among Sapindaceae cpDNAs
The chloroplast genome of S. erecta was compared to 11 species belonging to the Sapindaceae family (Table 1). These genomes were obtained from the Genome database (RefSeq) of the National Center for Biotechnology Information (NCBI) and represent all Sapindaceae genera deposited in this database (NCBI accession numbers in Supplementary Table S1, accessed on July 7, 2023). Subsequently, all genomes were annotated using the same protocol for S. erecta.
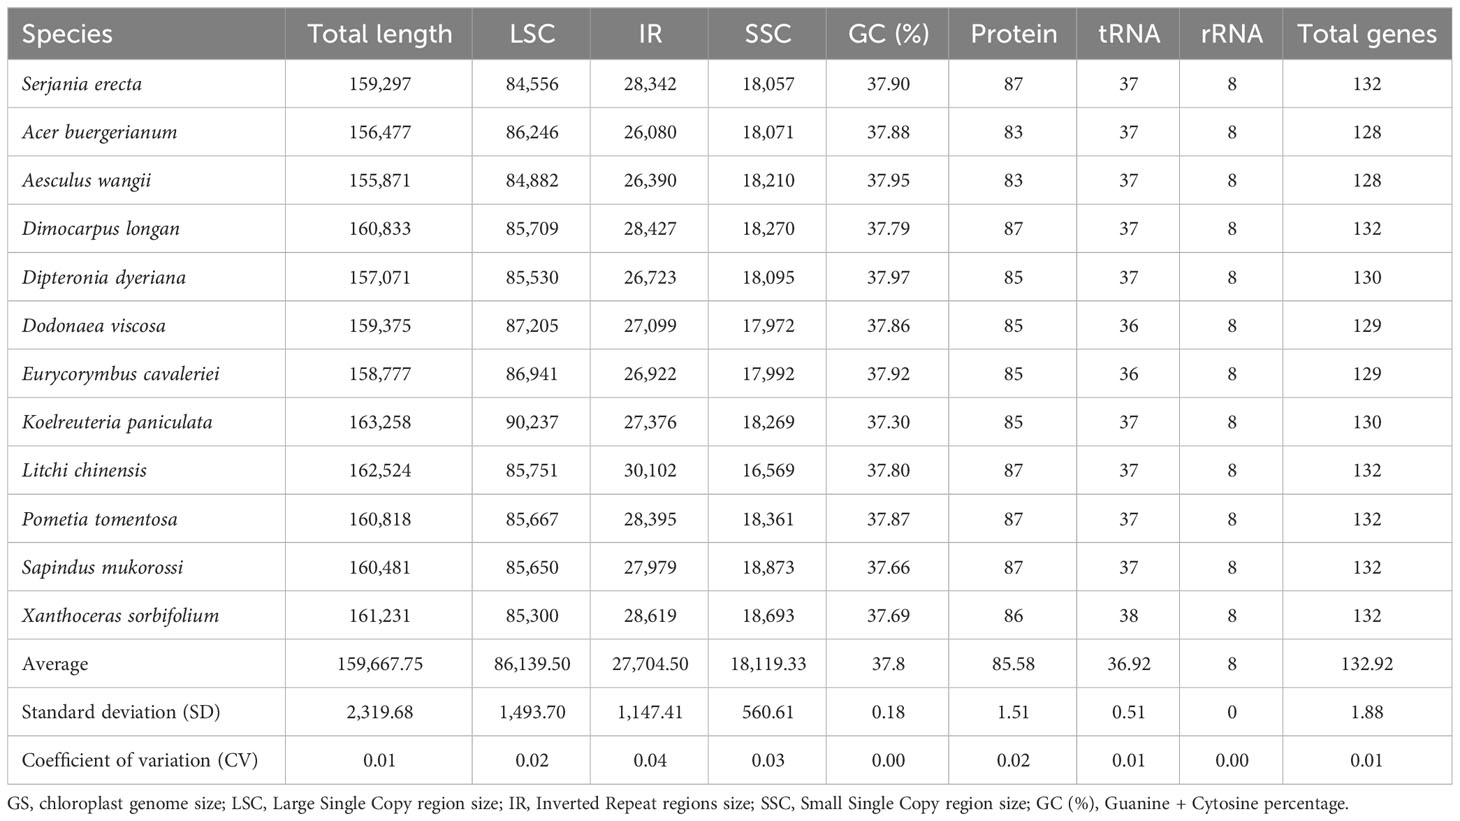
Table 1 Description of twelve chloroplast genomes of the family Sapindaceae in a comparative genomic analysis.
To identify the size of each region of the chloroplast genomes (Small Single Copy, Large Single Copy, and Inverted Repeats) and the genes located at their ends, Geneious Prime v. 2022.2.2 was used (Kearse et al., 2012). Identifying possible rearrangement and inversion events in chloroplast genomes was performed using the Mauve v. 2.4.0 program (Darling et al., 2004).
Identification of large genomic repeat structures (forward, reverse, palindromic, and complement) was conducted in the REPuter online version program (Kurtz et al., 2001), setting the minimum repeat size to 30 bp and a Hamming distance of 3 bp. Microsatellite regions (SSR) were identified using the MISA v2.1 web tool (Beier et al., 2017). For this, the minimum repeat numbers 10, 5, 4, 3, 3, and 3 were defined for the mononucleotide, dinucleotide, trinucleotide, tetranucleotide, pentanucleotide, and hexanucleotide repeats, respectively.
2.4 Phylogenetic analysis
We performed three phylogenetic reconstructions: One for the Sapindaceae family to understand the phylogenetic relationship of S. erecta with other chloroplast genomes of the family; the other two phylogenies aimed to test whether the available molecular markers of chloroplast genomes together with the currently available S. erecta data are capable of clarifying the phylogenetic relationships of the genus Serjania.
For the phylogenetic reconstruction of the chloroplast genomes of the family Sapindaceae, 23 species were selected (Supplementary Table S1), of which 22 species belonged to the order Sapindales and one species of the order Malvales (Gossypium hirsutum), used as an outgroup (external group) in rooting from the tree. Among the species of the order Sapindales, 16 belong to the Sapindaceae family (Serjania erecta, Acer buergerianum, Acer truncatum, Acer longipes, Aesculus chinensis, Aesculus wangii, Dimocarpus longan, Dipteronia sinensis, Dipteronia dyeriana, Dodonaea viscosa, Eurycorymbus cavaleriei, Koelreuteria paniculata, Litchi chinensis, Pometia tomentosa, Sapindus mukorossi, and Xanthoceras sorbifolium), two species belonging to the Meliaceae family (Khaya senegalensis and Cedrela odorata), two species of the Rutaceae family (Citrus sinensis and Ruta graveolens). Mangifera indica and Boswellia sacra were selected for the Anacardiaceae and Burseraceae families, respectively. The CDS of these species were obtained from GenBank. Seventy-four orthologous CDS were analyzed, retaining only one copy for each duplicated gene and excluding the rpl22, rps2, rps11, and rps19 genes.
The CDS were aligned using MAFFT v.7 (Katoh and Standley, 2013) and concatenated using Sequence Matrix v.1.7.8 (Vaidya et al., 2011). The most informative regions for molecular phylogeny were selected using the Gblocks webserver (Talavera and Castresana, 2007). Phylogenetic reconstruction was performed using the maximum likelihood (ML) method in the IQ-TREE v.1.6.12 program (Nguyen et al., 2015). In the construction of the phylogenetic tree, 63979 bp were used, and the best model was selected using the ModelFinder (Kalyaanamoorthy et al., 2017) implemented in the IQ-TREE (Nguyen et al., 2015). The GTR+F+R3 model was selected, and the tree node support values were evaluated using the bootstrapping method with 1000 replicates.
The other two phylogenetic trees for the genus Serjania were constructed based on previously published marker data (Buerki et al., 2009; Buerki et al., 2010; Acevedo-Rodríguez et al., 2017). These two phylogenies were predicted using the following data: the first using data from the matK, rpoB, trnD-trnT, trnK-matK, trnL(intron), and trnL-trnF markers and the second other information only from trnL (intron) (Supplementary Table S2). For S. erecta, such regions were extracted from the chloroplast genome. In these phylogenies, we followed the same pipeline used in the ML tree of the CDS of chloroplast genomes. The best evolutionary model of nucleotide substitution for both trees was K3Pu+F.
2.5 Nucleotide diversity and molecular evolution in Sapindaceae cpDNAs
In the analysis of nucleotide diversity, the same twelve species used in the comparative analyzes were used (Table 1), separating them into two groups: (1) formed by the 12 species of the Sapindaceae family and (2) a subgroup of 6 species belonging to the Sapindoideae subfamily. The genomes of the two groups were aligned using the MAFFT program (Katoh and Standley, 2013), and subsequently, the calculation of nucleotide diversity (π) was performed using the DnaSP v6 program defining windows of 600 bp and steps of 200 bp, (Rozas et al., 2017).
To understand the process of evolution of chloroplast genes, we calculated the ratios between non-synonymous and synonymous mutations (ka/ks). When higher than 1.0, this ratio suggests a positive selection process; when less than 1, it suggests a negative selection process; when equal to 1.0, it indicates the absence of selection (Nei and Kumar, 2000). The calculation was performed using the 77 CDS in common between the chloroplast genomes of the 12 species of Sapindaceae aligned in the MAFFT program (Katoh and Standley, 2013). The value of ka/ks was estimated considering two neutral models, one considering a phylogenetic tree (runmode = 0; model = 0; NSsites = 0) and the other only the pairwise relationship (runmode = -2; model = 0; NSsites = 0) and establishing a minimum number of four synonymous mutations, through the PAML v.4.9 program (Yang, 2007).
The presence of local positive selection (ka/ks > 1) in all 77 genes was investigated, using the contrast between selection models and neutral models: (1) M2a (positive selection model) x M1a (model neutral); (2) M8 (positive selection model with beta distribution) x M7 (neutral model with beta distribution); (3) M8 (positive selection model with beta distribution) x M8a (null hypothesis model). To test the significance of the contracts, we calculated Likelihood Ratio Tests (LRT) and the False Discovery Rate (FDR), both in R language (R Core Team, 2020).
3 Results
3.1 The chloroplast genome of Serjania erecta
We generated 8.8 million paired-end reads to assemble the complete chloroplast genome sequence of S. erecta. This species has a chloroplast genome size of 159,297 bp (871x of average coverage) and a guanine + cytosine content (GC%) of 37.9% (Figure 1 and Table 1). Furthermore, the S. erecta cpDNA has the typical quadripartite structure of Embryophyte chloroplasts with a Large Single Copy (LSC) region of 84,556 bp, a Small Single Copy (SSC) region of 18,057 bp, and two Inverted Repeat regions (IRa and IRb) of 28,342 bp separating the SSC and LSC regions (Figure 1 and Table 1).
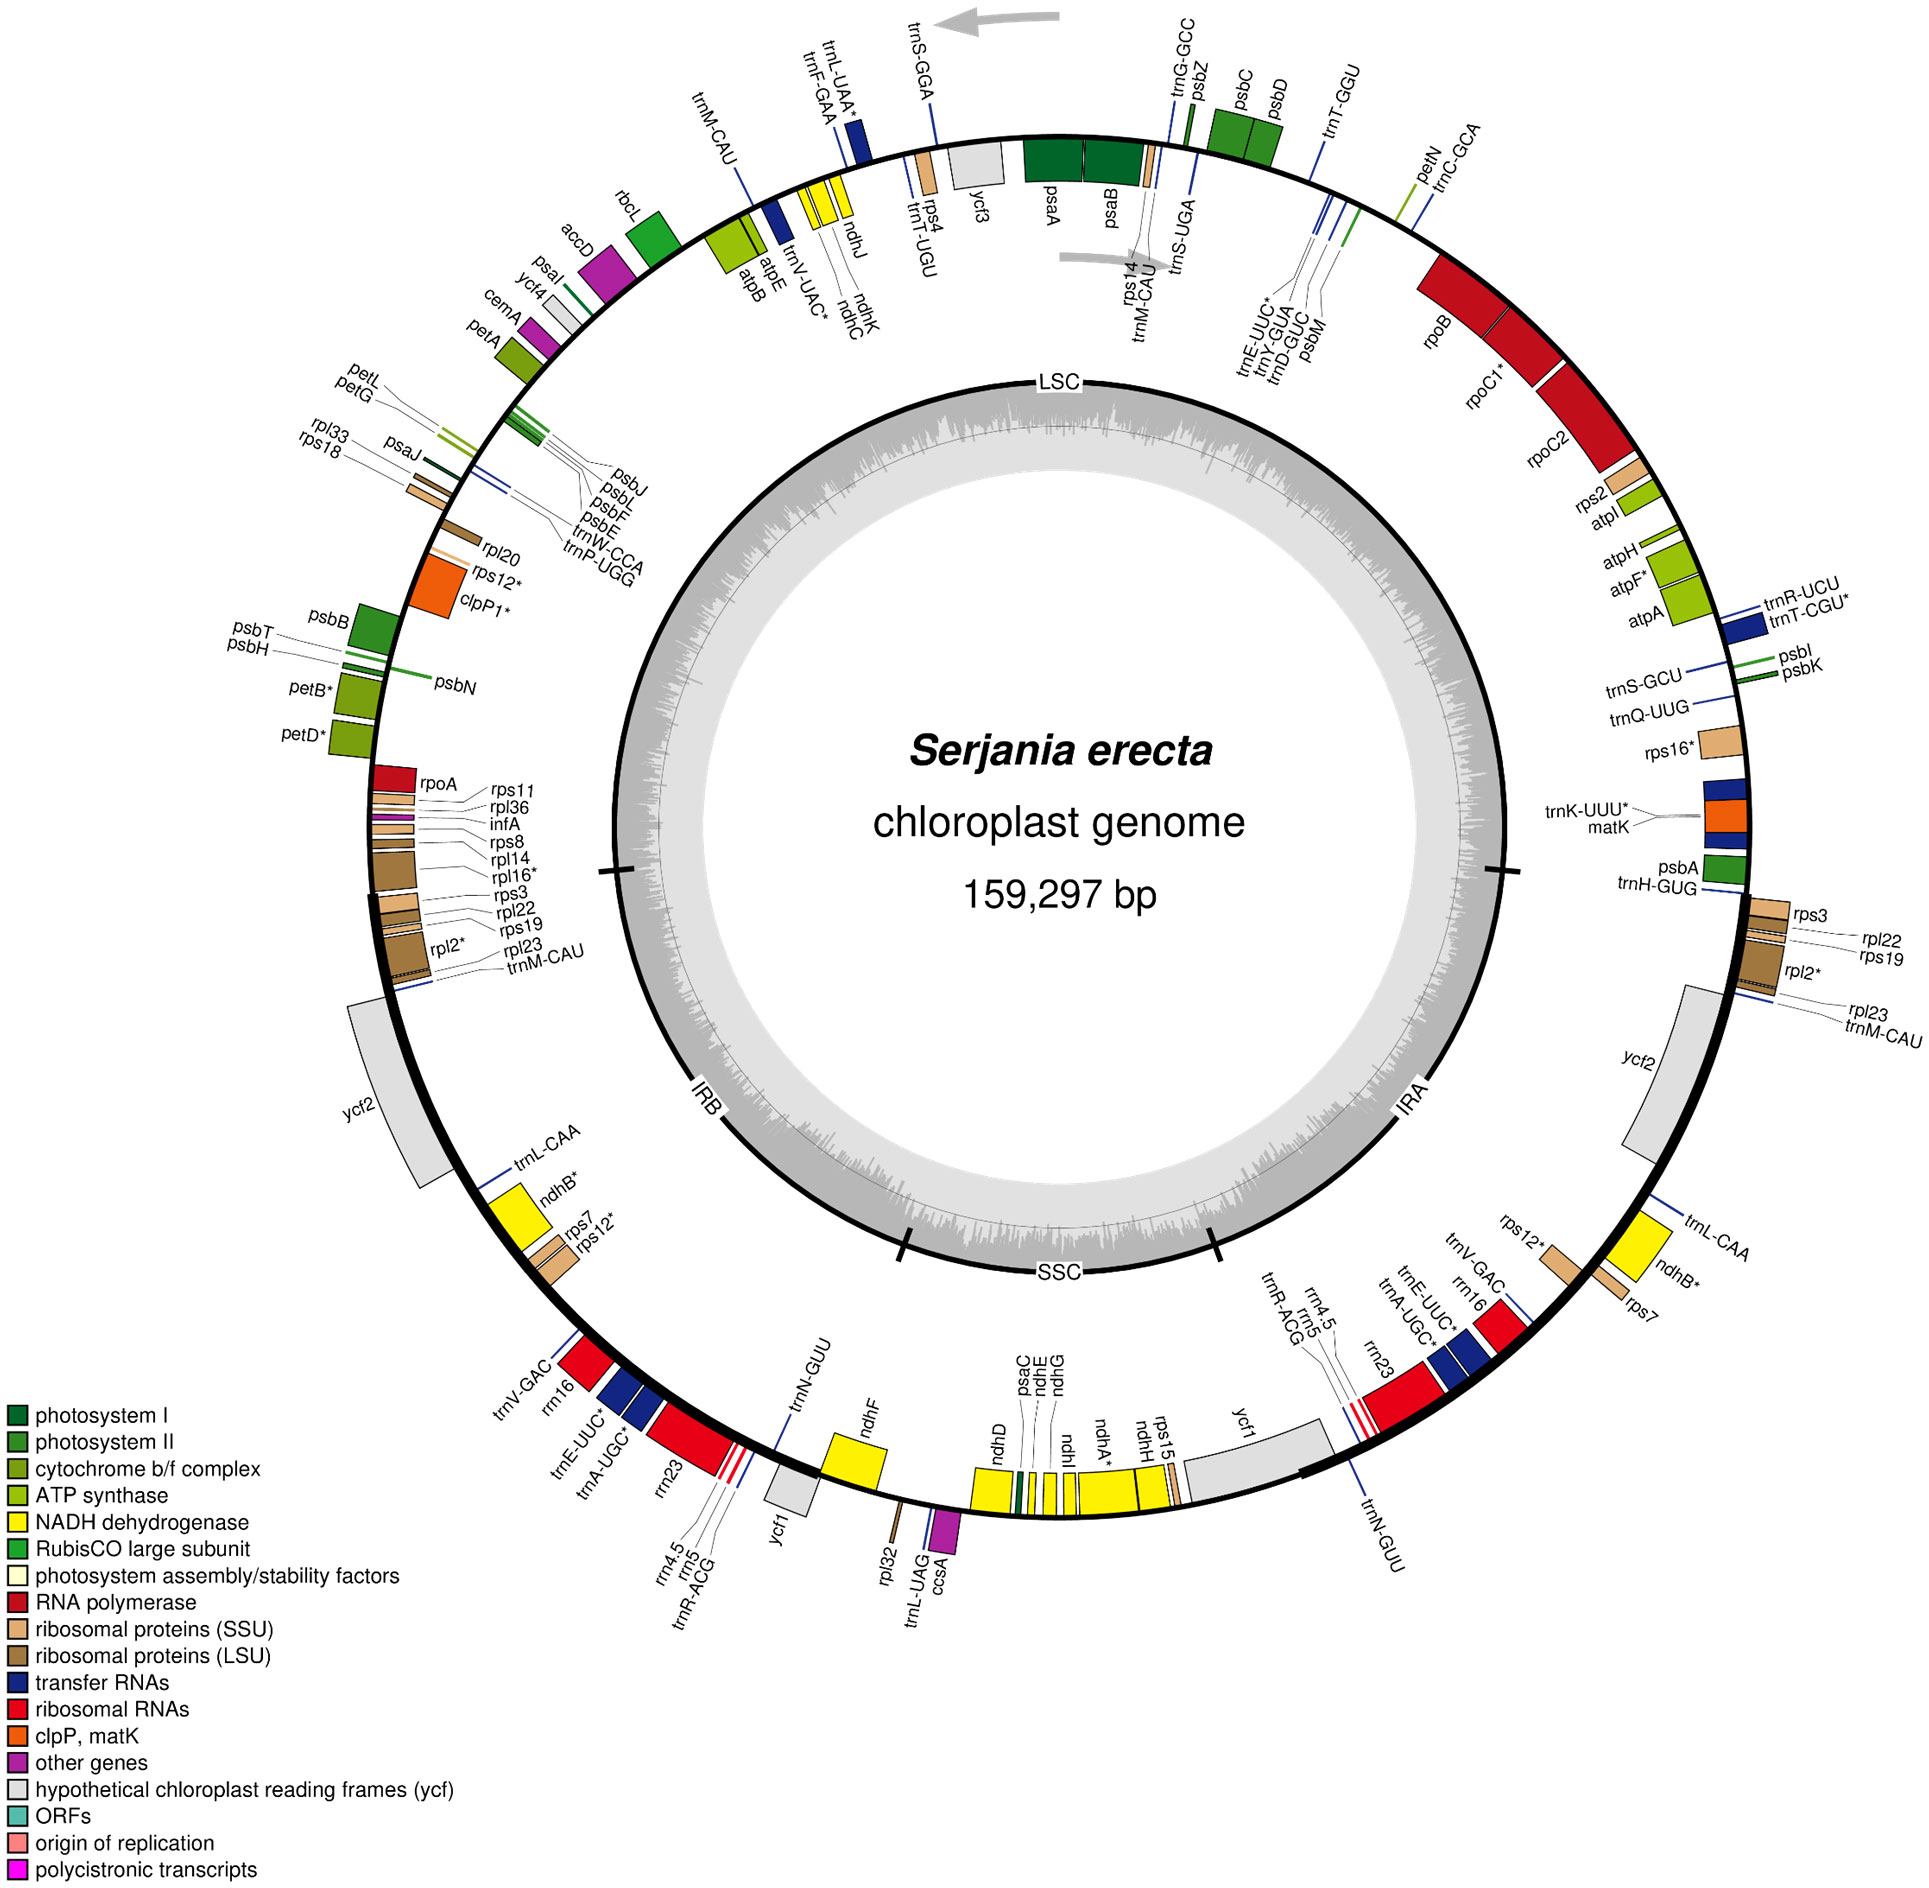
Figure 1 Chloroplast genomic map of Serjania erecta Radlk (Sapindaceae: Sapindoideae). The genes colored according to the functional group are represented in the outermost circle, the genes external to the circumference are transcribed in a counterclockwise direction, and the internal genes are transcribed in a clockwise direction (the gray arrows indicate the beginning). The inner circle represents Inverted Repeat regions (IRa and IRb), Large Single Copy (LSC), and Small Single Copy (SSC) regions. The bar graph corresponds to the GC content. The asterisk highlights genes with introns.
We annotated 132 genes and two pseudogenes (infA and ycf1) in the chloroplast genome of S. erecta, 87 protein-coding genes, and 45 functional RNAs (Table 1 and Supplementary Table S3). Among the protein-coding genes, nine genes are duplicated in the IR regions (rpl2, rpl22, rpl23, rps3, rps7, rps12, rps19, ndhB, and ycf2), nine genes have an intron (atpF, rpl2, rps12, rpl16, rps16, rpoC1, ndhA, ndhB, petB, and petD) and three genes have two introns (clpP, and ycf3) (Supplementary Table S1). We also identified 37 tRNA genes and eight rRNA genes. Considering the tRNA genes, trnM-CAU has four copies, and trnA-UGC, trnE-UUC, trnL-CAA, trnN-GUU, trnR-ACG, and trnV-GAC have two copies each. Five tRNA genes contain an intron (trnA-UGC, trnK-UUU, trnL-UAA, trnT-CGU, and trnV-UAC). There are four types of rRNA genes in the S. erecta cpDNA (rrn4.5, rrn5, rrn16, and rrn23), and they are all located in the IR regions and are therefore duplicated (Supplementary Table S3).
We identified 26,991 codons in the S. erecta chloroplast genome (Supplementary Table S4). The most used were AAA (Lys) and ATT (Ile), representing 1,136 (4.20%) and 1,131 (4.19%) of the total codons, respectively. Among amino acids, the most frequent is leucine (Leu), with 2,835 amino acids (10.32% of total amino acids), followed by isoleucine (Ile) and Serine (Ser), with 2,280 amino acids (8.45% of total amino acids) and 2,068 amino acids (7.66% of total amino acids), respectively.
3.2 Sapindaceae chloroplastidial genome structure
We performed a comparative analysis with the chloroplast genomes of S. erecta and 11 other cpDNAs from species of the Sapindaceae family. The chloroplast genome of S. erecta has a structure and genomic size similar to that of other Sapindaceae species (Table 1), standing out only as the species with the smallest LSC size, with 84,556 bp, which ranged up to a maximum length of 90,237 bp (Koelreuteria paniculata). The total size of chloroplast genomes ranged from 163,258 bp (K. paniculata) to 155,871 bp (Aesculus wangii). The mean GC content among the twelve Sapindaceae is 37.80%, with a standard deviation of 0.18 (Table 1).
The total number of genes in the chloroplast genomes of the family Sapindaceae ranges from 128 to 132. The most significant number of genes is described in five of the six species belonging to the subfamily Sapindoideae (Dimocarpus longan, Litchi chinensis, Pometia tomentosa, Sapindus mukorossi, and S. erecta) and in the species Xanthoceras sorbifolium (subfamily Xanthoceratoideae). The smallest number of genes was observed in the Acer buergerianum and A. wangii, both species belonging to the subfamily Hippocastanoideae (Figure 2). Chloroplast genomes with fewer genes also had smaller IR sizes (Table 1), which ranged from 26,080 bp in A. buergerianum species to 30,102 bp in Litchi chinensis.
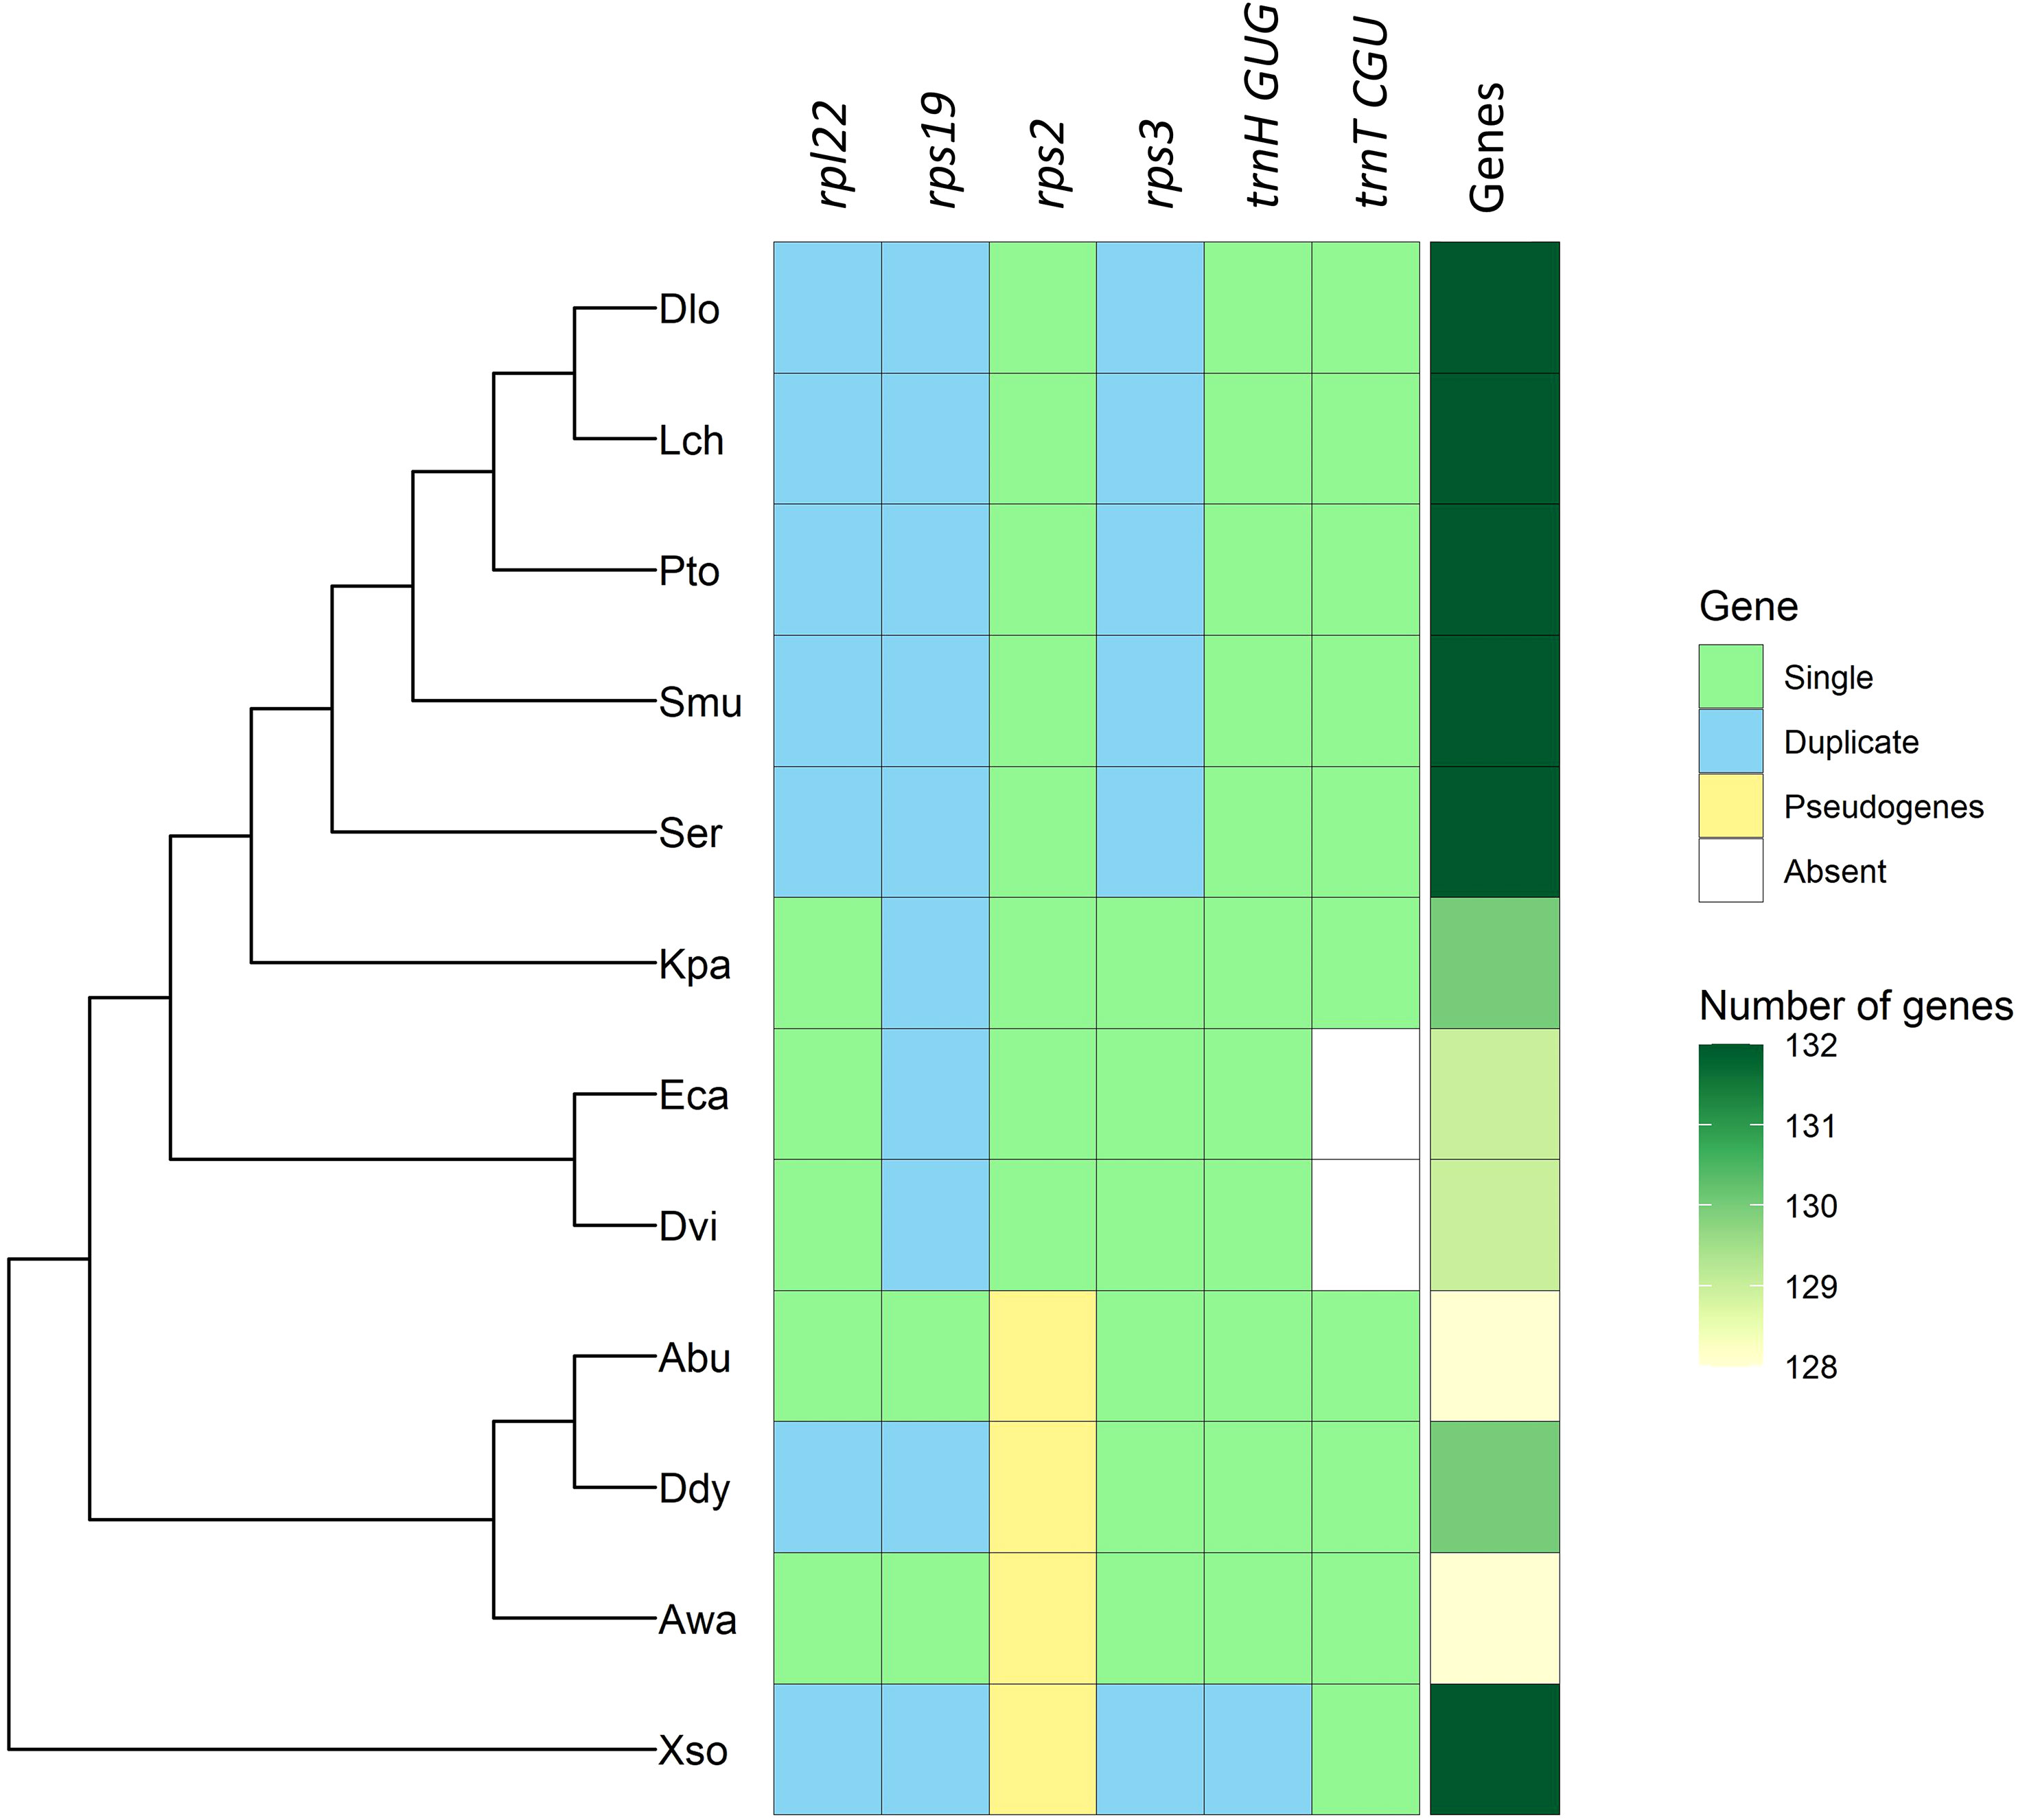
Figure 2 Variation in the number of genes in chloroplast genomes of the Sapindaceae family ordered by phylogeny. Acer buergerianum (Abu), Aesculus wangii (Awa), Dimocarpus longan (Dlo), Dipter dyeoniariana (Ddy), Dodonaea viscosa (Dvi), Eurycorymbus cavaleriei (Eca), Koelreuteria paniculata (Kpa), Litchi chinensis (Lch), Pometia tomentosa (Pto), Sapindus mukorossi (Smu), Serjania erecta (Ser), and Xanthoceras sorbifolium (Xso).
All Sapindaceae species analyzed showed the same four rRNA genes (rrn4.5, rrn5, rrn16, and rrn23) duplicated in the IRa and IRb regions. The tRNA genes ranged from 38 genes in X. sorbifolium to 36 genes identified in the two species of the subfamily Dodonaeoideae (Dodonaea viscosa and Eurycorymbus cavaleriei). Furthermore, it is possible to observe specific genomic patterns in the analyzed genomes, such as the duplication of the trnH-GUG gene in the X. sorbifolium genome and the deletion of the trnT-CGU gene in the Dodonaeoideae subfamily (Figure 2). There were no differences regarding the number of introns in the genes of the 12 species of the Sapindaceae family (Supplementary Table S5).
The genes that flank the borders of the chloroplast genome regions were identified to observe patterns related to the presence and position of genes (Figure 3). Four distinct patterns appear in the border region between LSC and IRb: i) Patterns 1 - LSC-IRb flanked by the rpl16 and rps3 genes, in the species D. longan, L. chinensis, P. tomentosa, S. mukorossi, S. erecta, and X. sorbifolium; ii) Patterns 2 - LSC-IRb flanked by the rp122 and rps19 genes, was identified in the species D. viscosa, E. cavaleriei, and K. paniculatai; iii) Patterns 3 - LSC-IRb flanked by the rps19 and rpl2 genes, was identified in A. buergerianum and A. wangii; and iv)Patterns 4 - LSC-IRb in a single D. dyeriana species, flanked by the rps3 and rpl22 genes.
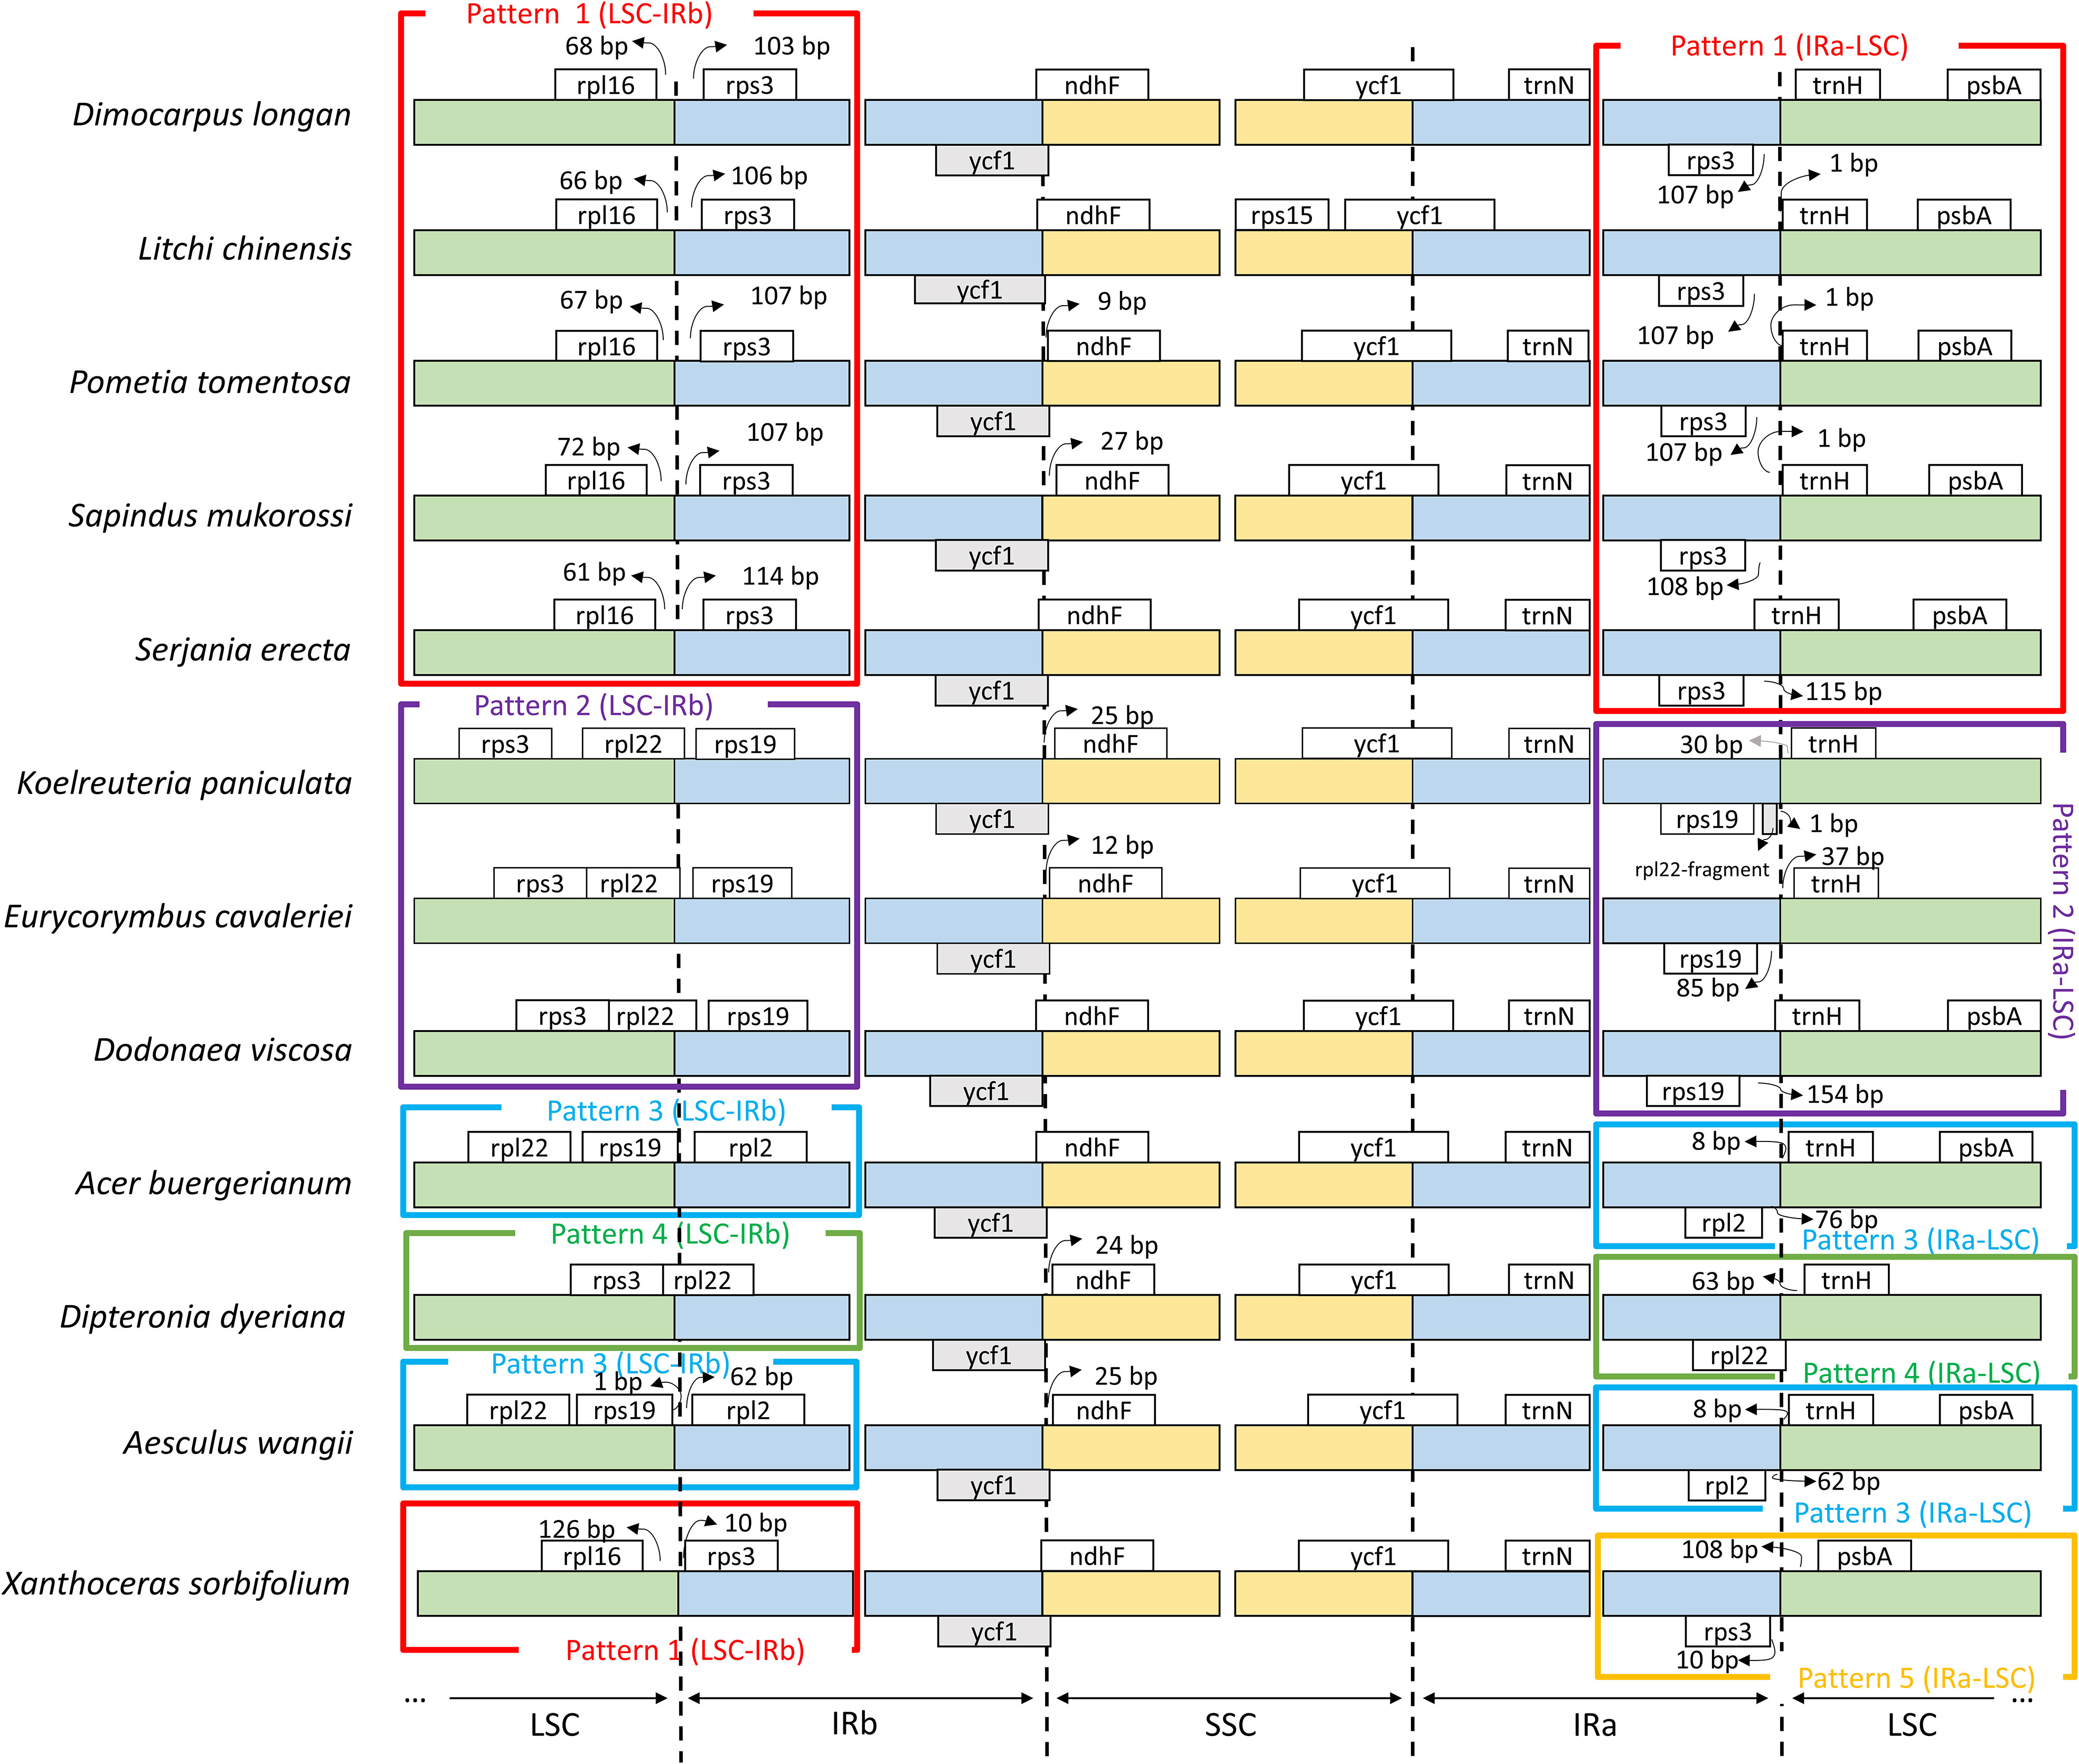
Figure 3 Comparison between the borders of the regions that delimit the chloroplast genomes of species from the Sapindaceae family. Inverted repeat regions (IRa and IRb) are represented in blue, the large single-copy region (LSC) in green, and the small single-copy region (SSC) in yellow. The white boxes above the bars represent counterclockwise transcribed genes, and those below represent clockwise transcribed genes. The gray boxes represent pseudogenes.
Five distinct patterns were identified in the border region between IRa and LSC. In Standard 1, the LSC-IRa region is flanked by rps3 and trnH in the species D. longan, L. chinensis, P. tomentosa, S. mukorossi, and S. erecta. The X. sorbifolium species is the only one where the IRa-LSC region is flanked by rps3 and psbA, being the pattern 5 (IRa-LSC). pattern 2 (trnH and rps19), pattern 3 (trnH and rpl2), and patterns 4 (trnH and rpl22) (Figure 3). The same genes in all species flanked the transition regions between IR and SSC: between IRb and SSC by pseudogenized ycf1 and ndhF and between SSC and IRa by the ycf1 gene (Figure 3).
We identified only one chloroplast genome rearrangement event for the twelve Sapindaceae species analyzed, which resulted in the unique genomic organization of the cpDNA of K. paniculata (Supplementary Figure S1). In total, we identified three syntenic blocks that are divided due to a region located in the IRa of K. paniculata, which is in the reverse complementary orientation compared to the other species (block in green, Supplementary Figure S1).
3.3 Repetitive portions of the chloroplastidial genome of Sapindaceae
The number of large repeats among the 12 species in the comparative analysis ranged from 24 in S. erecta to 119 in K. aniculate (Figure 4A). In the Sapindaceae family, it was possible to find the four types of large repeats (forward, reverse, complement, and palindromic) in only four species, and the most frequent types were forward and palindromic. The large repeats are generally found in the LSC regions, followed by the IR, and less often in the SSC region in all species but D. viscosa (Figure 4B).
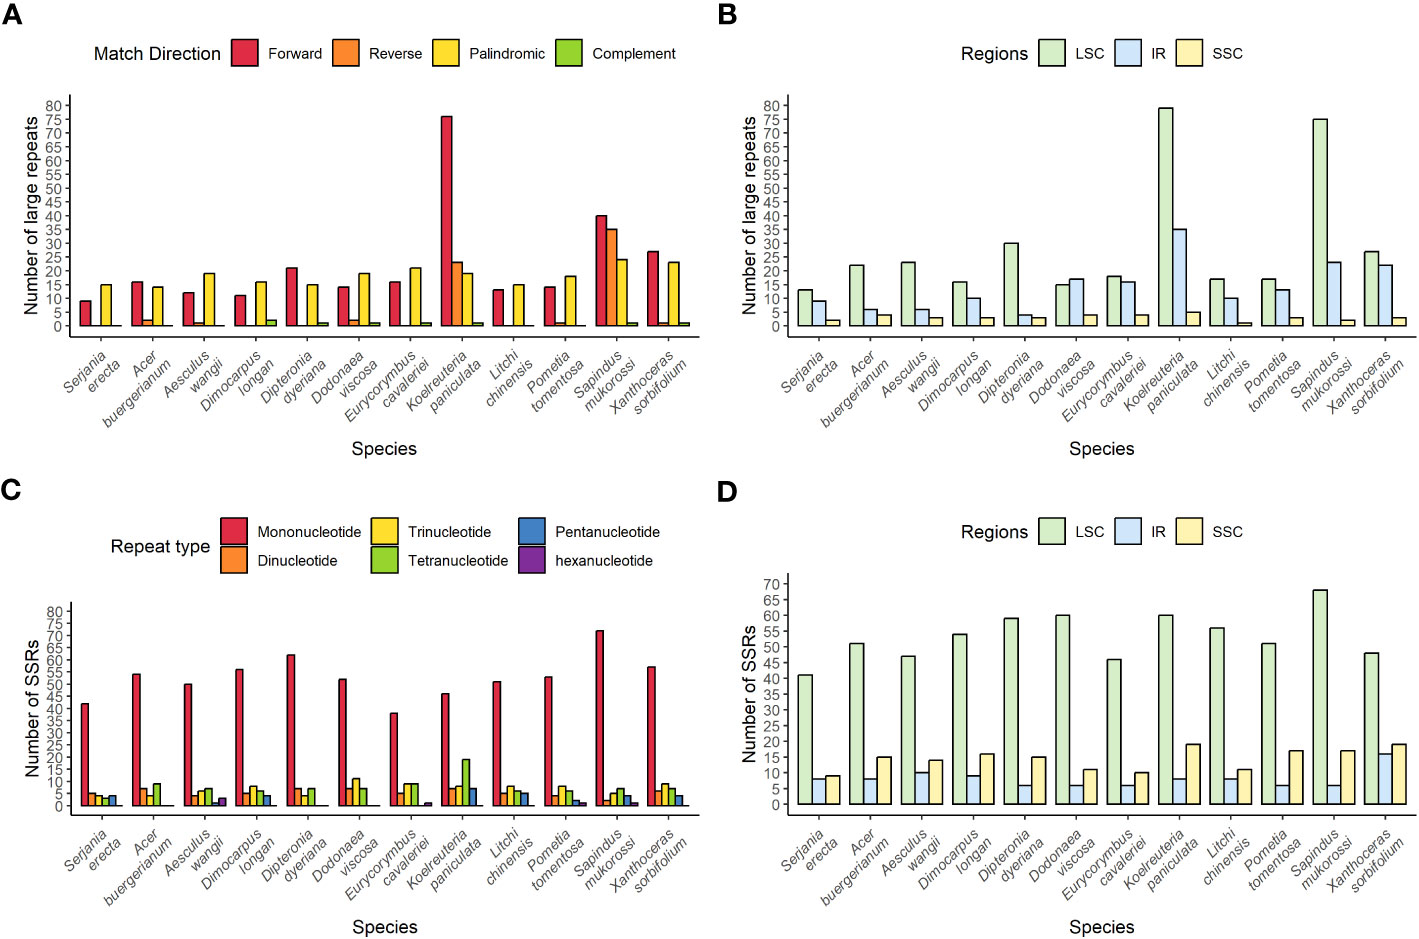
Figure 4 Distribution of repeats in the chloroplast genomes of twelve species of the Sapindaceae family. (A) Distribution of large repeats by type. (B) Distribution of large repeats according to their region in the chloroplast genome. (C) Distribution of SSRs according to repetition motif. (D) Distribution of SSRs according to their region in the chloroplast genome.
S. erecta has the lowest number of SSRs, and Sapindus mukorossi has the highest number among all the analyzed Sapindaceae species, with 58 and 91 SSR repeats, respectively (Figure 4C). Mononucleotide SSR repeats were the most abundant in all species. The SSRs are mainly located in the LSC and less frequently in the IR in all species (Figure 4D).
3.4 Molecular evolution in chloroplast genomes of Sapindaceae
We reconstructed a phylogenetic tree of the Sapindaceae family using a 68,917 bp hypermatrix composed of nucleotides of 74 orthologue protein-coding genes in the chloroplast genomes of the 23 species analyzed. The phylogenetic analysis resulted in a tree with high support values for the nodes, except for the branching between the family Sapindaceae and the clade formed by the families Rutaceae and Meliaceae (bootstrap support value = 50) (Figure 5). In the Sapindaceae family, it was possible to identify the four monophyletic clades formed by the four subfamilies: Sapindoideae, Dodonaeoideae, Hippocastanoideae, and Xanthoceroideae, in agreement with the topologies proposed by Bueki et al. (2009); Bueki et al. (2021); Acevedo-rodríguez et al. (2017), and Angiosperm Phylogeny Group (APG) IV (Chase et al., 2016). The phylogeny for the genus Serjania also presented itself as a monophyletic clade, concordant with the taxonomic changes that suggested the inclusion of different genera as Serjania, proposed by Acevedo-Rodríguez et al. (2017) (e.g., Balsas guerrerensis as Serjania guerrerensis (Cruz Durán & K.Vega) Acev.-Rodr.; Houssayanthus biternatus as Serjania biternata (Weath.) Acev.-Rodr.; Houssayanthus incanus as Serjania incana Radlk.) (Supplementary Figure S2). Our phylogenetic tree is also similar to the reconstruction obtained by Steinmann et al. (2022), which was based on nuclear ITS and chloroplast trnL-F sequences (Supplementary Figures S2A, B).
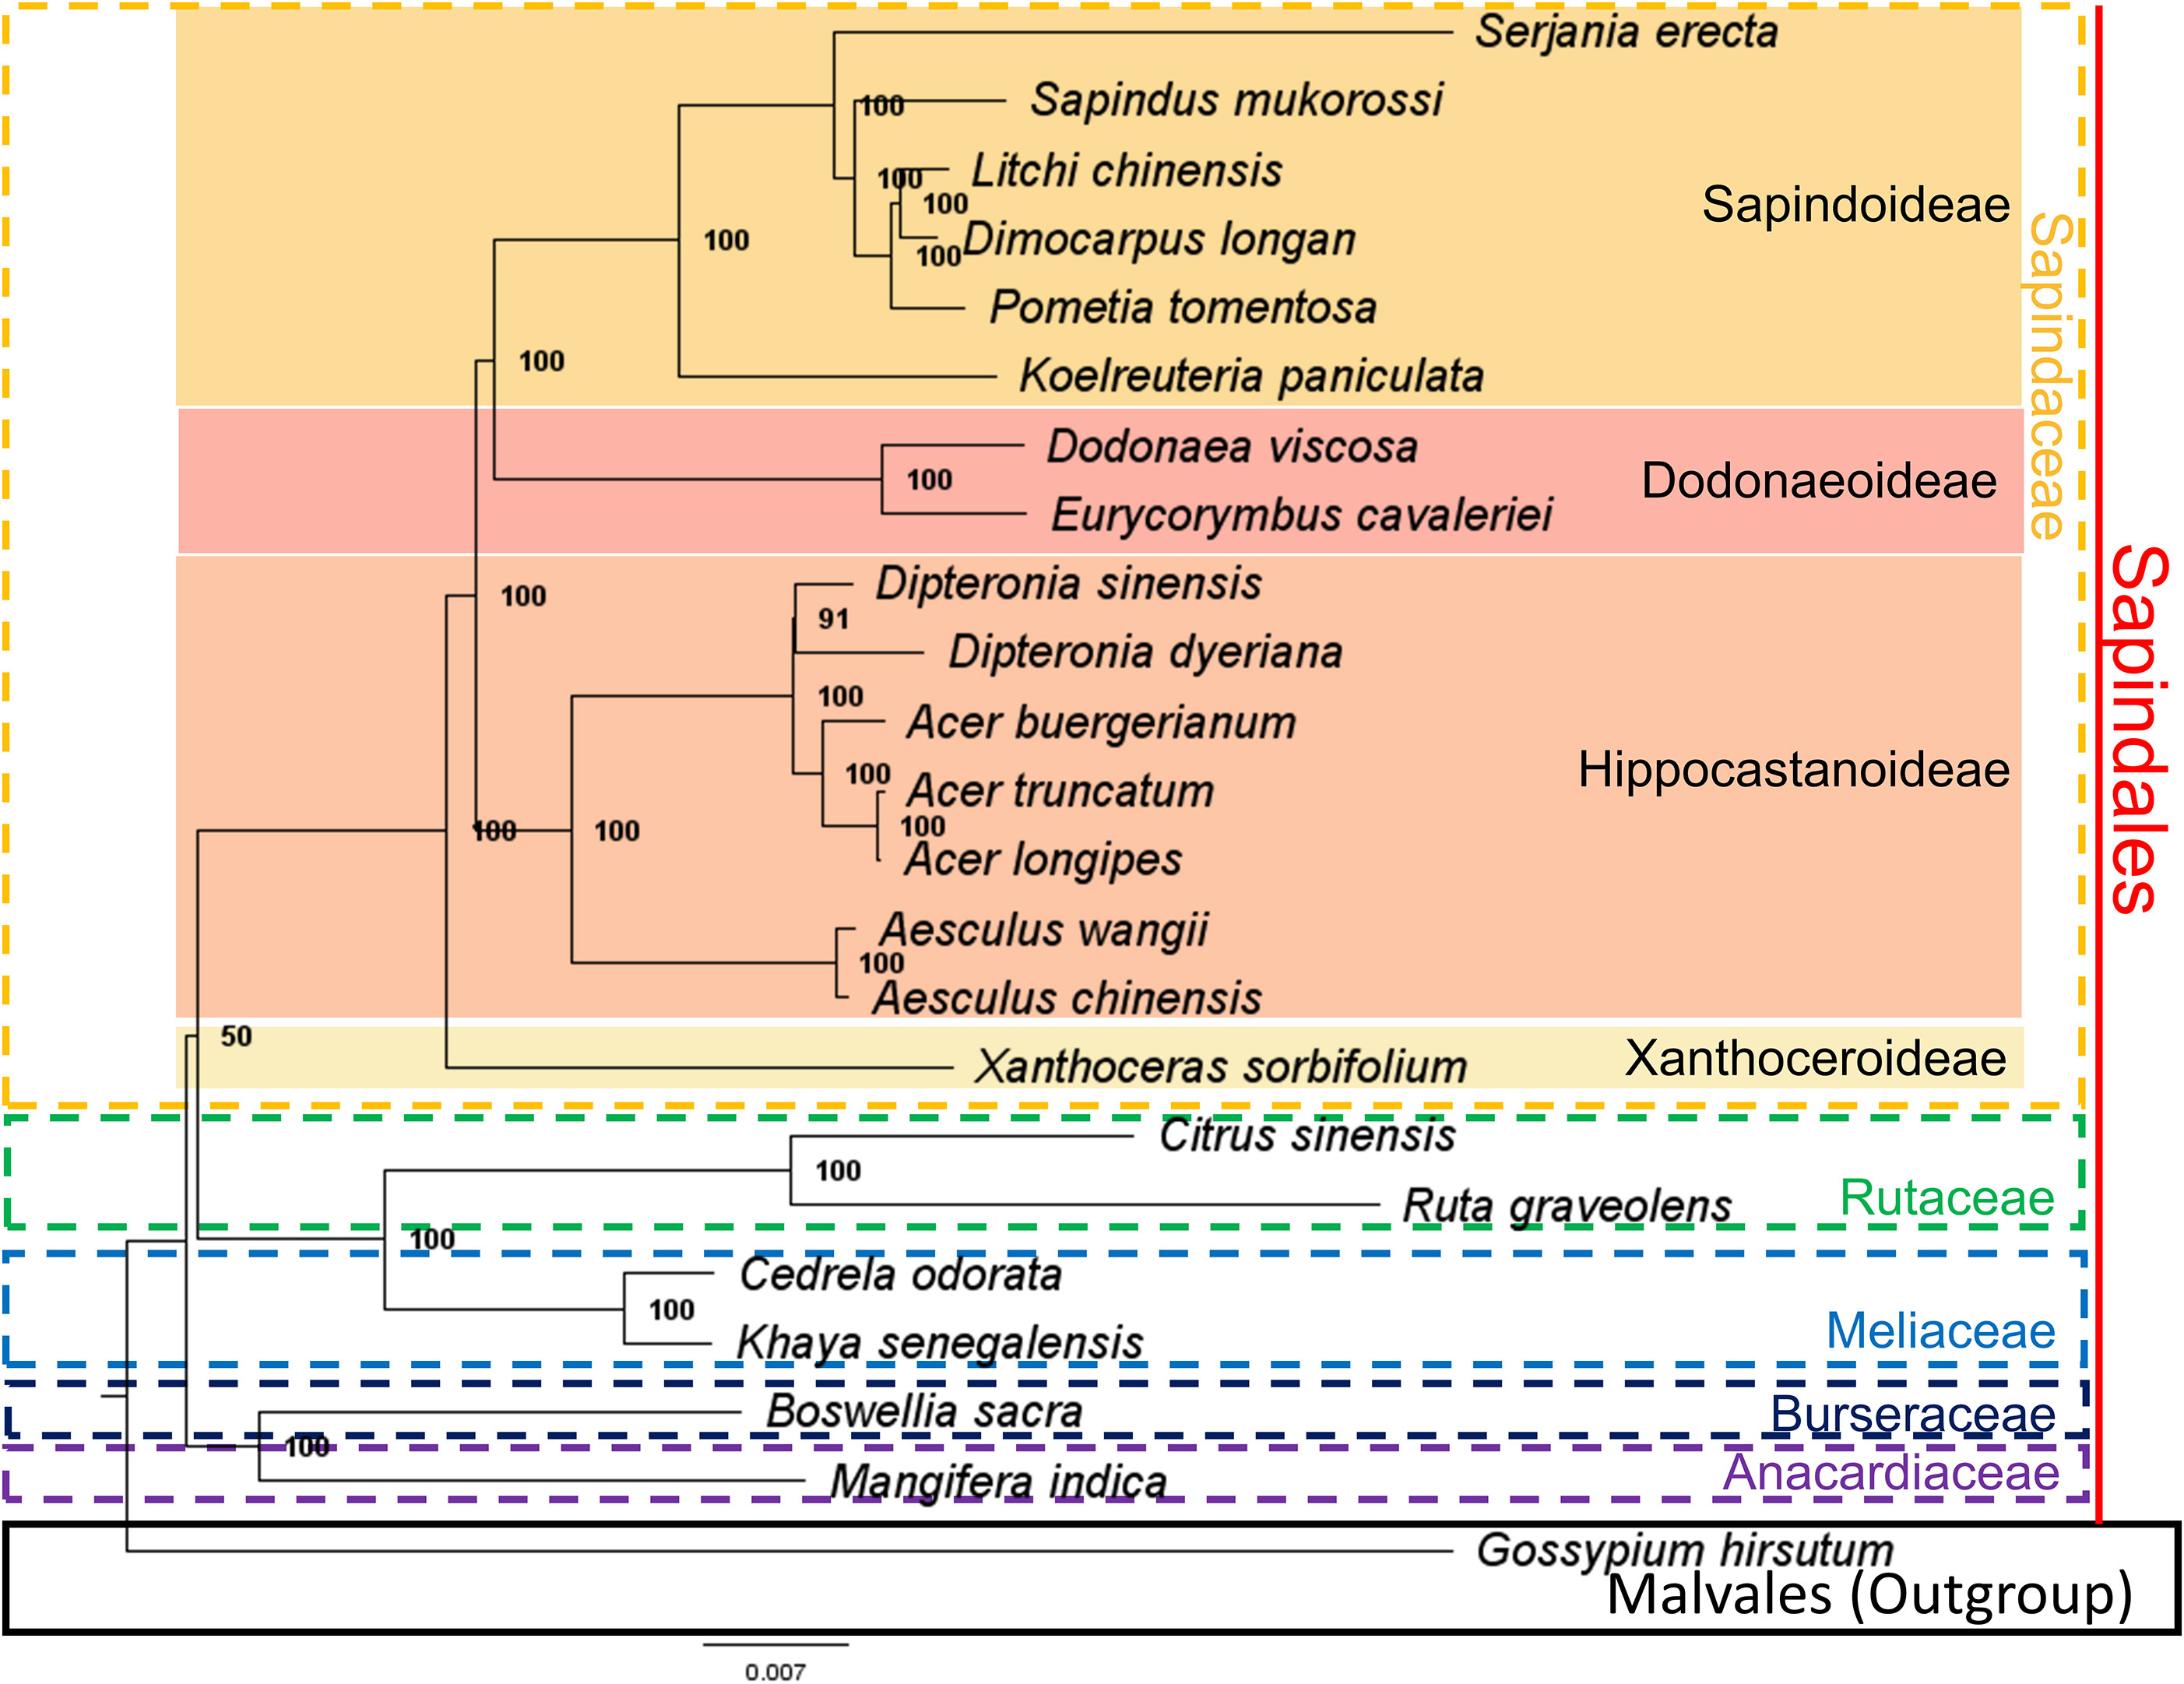
Figure 5 The phylogenetic tree of the Sapindaceae family was obtained by the maximum likelihood (ML) method and proposed using 74 protein-coding genes and nucleotide sequences from the chloroplast genomes of 23 species. Numbers on the nodes represent the Bootstrap values obtained from 1000 replicates. Additionally, species from Rutaceae, Meliaceae, Burseraceae, and Anacardiaceae were added. Malvales order were used as outgroups.
The nucleotide diversity (π) ranged from 0.0008 to 0.1473 for the Sapindaceae family, with a median of 0.0357 (Figure 6A and Supplementary Table S6). For the subfamily Sapindoideae, the variation of nucleotide diversity was from 0 to 0.0974, with a median of 0.0227 (Figure 6B and Supplementary Table S7). Nucleotide diversity hotspots were defined as sites with values above twice the median. For the Sapindaceae family we identified ten nucleotide diversity hotspots (tRNA-Lys – rps16, atpI – rps2, rpoB – tRNA-Asp, tRNA-Tyr – psbD, psbZ, ndhC – tRNA-Val, petA – psbJ, ndhF, rpl32 – cssA, and ycf1) (Figure 6A), and for the Sapindoideae subfamily we identified 11 nucleotide diversity hotspots (tRNA-Lys – rps16, rps16 – tRNA-Gln, tRNA-Ser – tRNA-Gly, tRNA-Cys – psbM, ndhC – tRNA-Val, ycf4 – cemA, petA – psbJ, psbE – petL, ndhF, rpl32 – cssA, and ycf1) (Figure 6B). tRNA-Lys — rps16, ndhC – tRNA-Val, petA – psbJ, ndhF, rpl32 – ccsA, and ycf1 are hotspots for both Sapindaceae family and Sapindoideae subfamily.
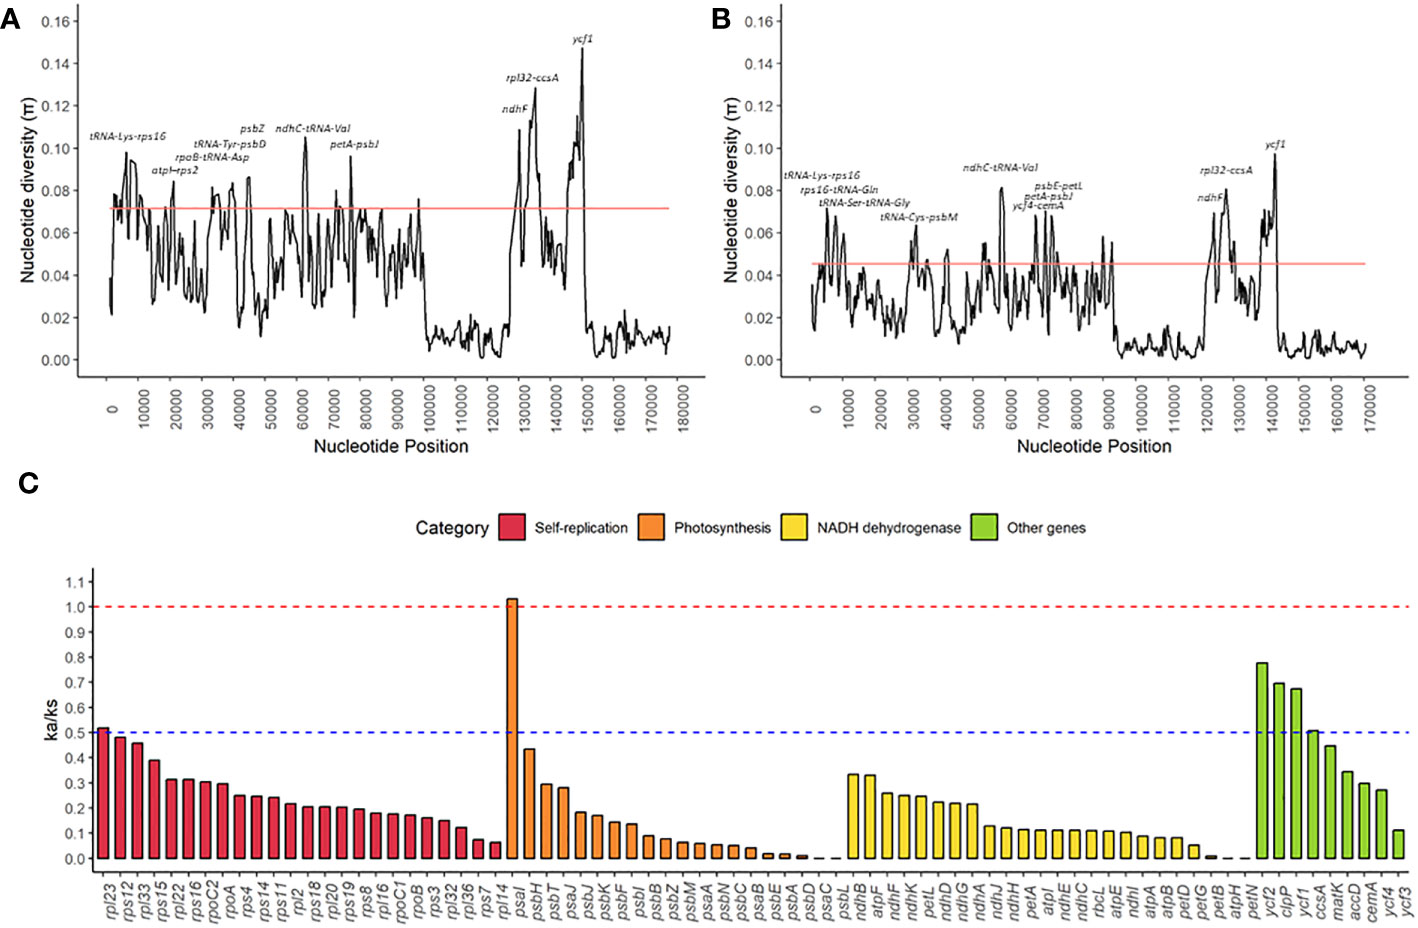
Figure 6 Nucleotide and mutational variation in chloroplast genomes of Sapindaceae family: (A) Distribution of nucleotide diversity along the chloroplast genomes of twelve species of the Sapindaceae family. (B) Distribution of nucleotide diversity along the chloroplast genomes of six species of the subfamily Sapindoideae. (C) Relation of non-synonymous mutations and synonymous mutations (ka/ks) for the 77 protein-coding genes found in all chloroplast genomes from the twelve species of the Sapindaceae family. The solid red line in graphs (A) and (B) indicates twice the chloroplast genome’s median nucleotide diversity (π) values. The dashed red line indicates the value at which the ka/ks ratio equals 1.0, and the dashed blue line indicates the value at which the ka/ks ratio equals 0.5.
The mean values of the ratios of non-synonymous mutations and synonymous mutations (ka/ks) were 0.2160 (SD = 0.19), ranging from 0.001 for the atpH, petN, psaC, and psbL genes to 1.032 for the psaI gene (Figure 6C). We did not identify any gene with ka/ks values significantly greater than 1.0. Only the psaI gene showed a ratio close to 1, demonstrating that of the 77 common genes of chloroplast genomes, 76 genes are under strong negative selection.
To understand how natural selection works in different species in pair-by-pair comparisons, the genes with the highest ka/ks values in each of the functional groups of genes were selected (Figure 7). For the rpl23 and psaI genes (Figures 7A, B), outliers (NA) were identified, that is, genes in which the ka/ks ratios did not show the defined minimum number of synonymous mutations. The ndhB and ycf2 genes (Figure 6C) showed the highest values of ka/ks ratio for the categories of NADH dehydrogenase and “other genes”, respectively, showing punctual, positive selection relationships (Figures 7C, D). In particular, S. erecta displayed the psaI gene with ka/ks values greater than 1 for 7 of the 11 species that were pairwise compared (Figure 7B).
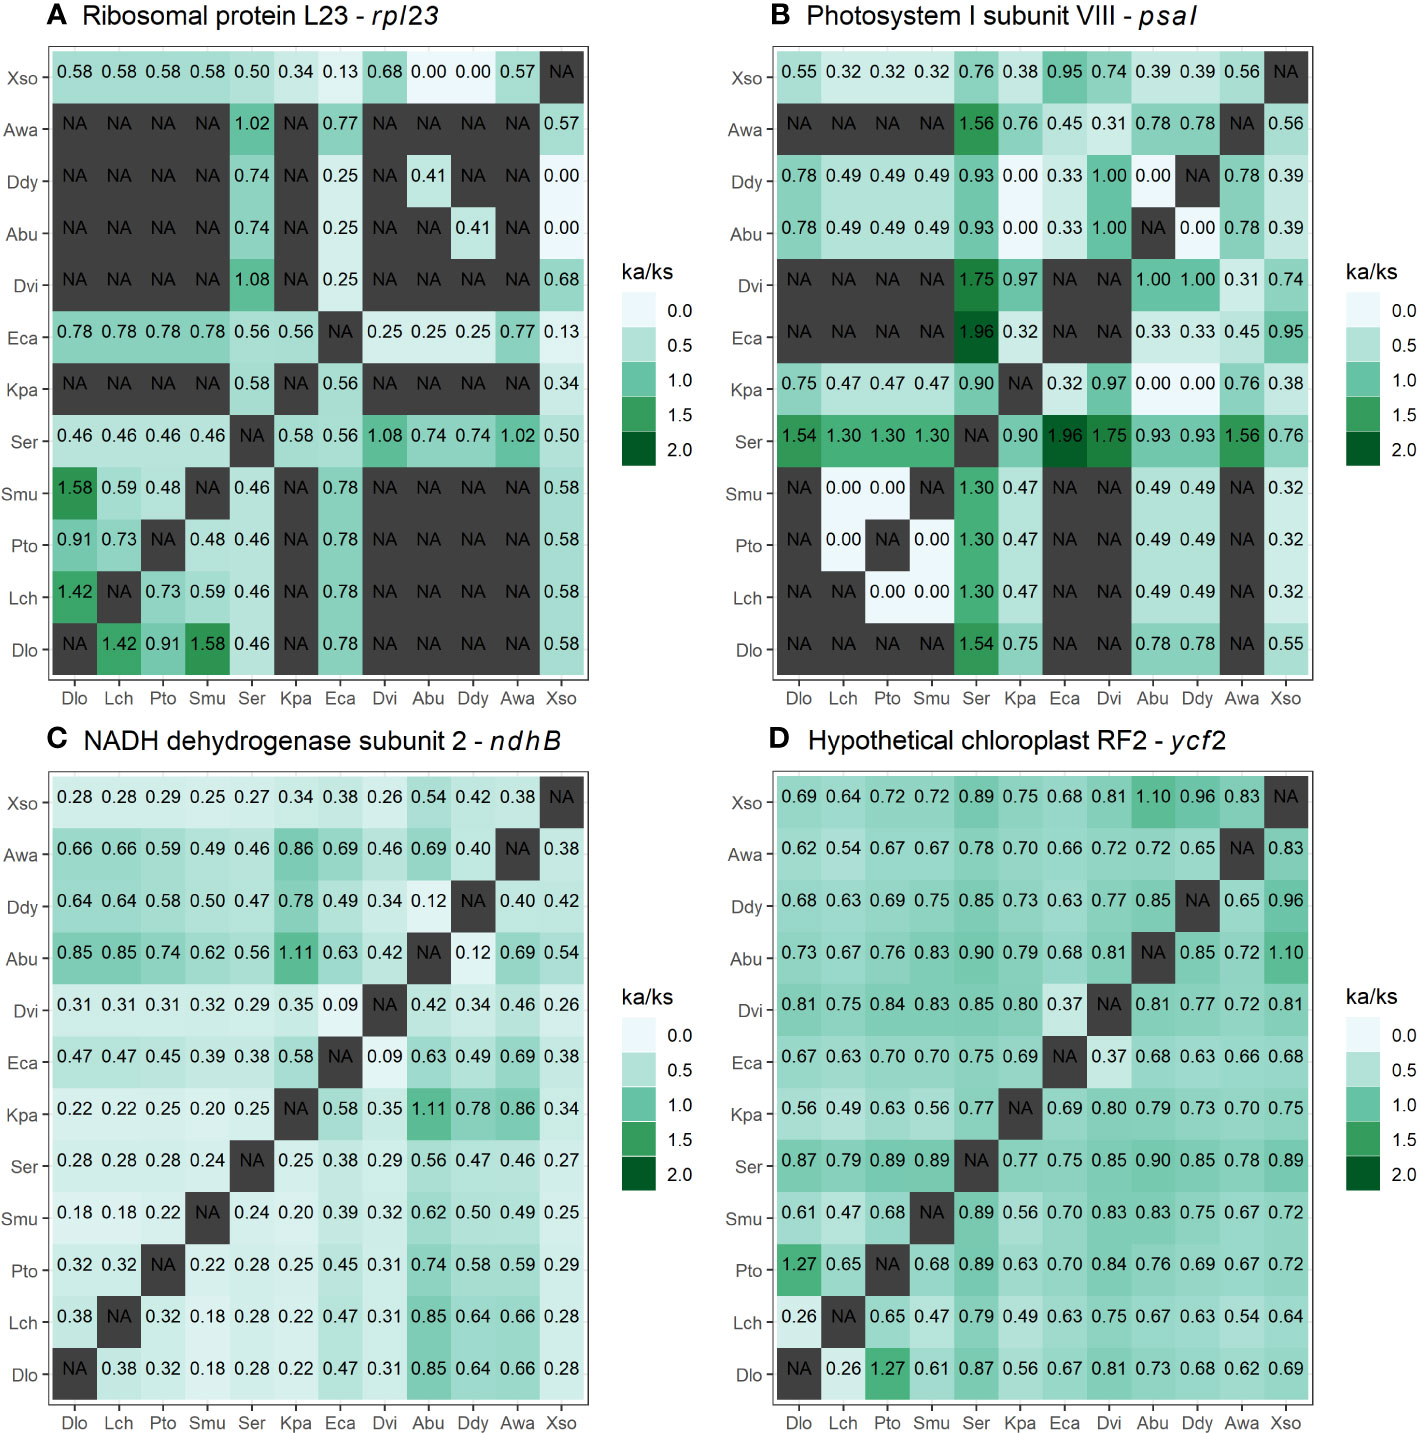
Figure 7 Relationships between pairwise non-synonymous and synonymous (ka/ks) mutations, considering the chloroplast protein-coding genes of 12 species of Sapindaceae. (A) Heatmap for the rpl23 gene (Self-replication). (B) Heatmap for the psaI gene (photosynthesis). (C) Heatmap for the ndhB gene (NADH dehydrogenase). (D) Heatmap for the ycf2 gene (other genes). Values equal to NA represent outliers, genes with fewer synonymous mutations than necessary for calculating ka/ks. Acer buergerianum (Abu), Aesculus wangii (Awa), Dimocarpus longan (Dlo), Dipter dyeoniariana (Ddy), Dodonaea viscosa (Dvi), Eurycorymbus cavaleriei (Eca), Koelreuteria paniculata (Kpa), Litchi chinensis (Lch), Pometia tomentosa (Pto), Sapindus mukorossi (Smu), Serjania erecta (Ser), and Xanthoceras sorbifolium (Xso).
We identified local positive selection signals for the three tested contrasts evidenced based on LTR and FDR (M2a x M1a; (2) M8 x M7; and (3) M8 x M8a) (Supplementary Table S8). Among these, the contrast between the M8 x M7 models showed the highest number of genes under local positive selection with 12 genes (atpA, clpP, matK, ndhA, ndhF, petD, psaB, rpl32, rpoB, rpoC2, ycf1, and ycf2). As for the contrasts between the M2a x M1a and M8 x M8a models, we identified positive local selection for four genes (ndhF, rpoC2, ycf1, and ycf2). The psaI gene was the only one that showed neutral evolution (ka/ks≅1) and showed significant positive selection for the LTR test.
4 Discussion
The chloroplast genomes of the family Sapindaceae have a relatively conserved structure for the twelve species studied (Table 1). They show slight variation in genome size and GC content. Among the regions of the plastid genomes, the IRs showed the highest variation, with variation in the genes that flank the transition between the LSC and IR regions being associated with gene abundance (Table 1; Figure 3). These results suggest that IR expansion and retraction events are an essential source of variation in the number of genes in the Sapindaceae family, with a possible phylogenetic relationship. The S. erecta cpDNA has genomic size, structure, number of genes, and GC content within the range expected for chloroplast genomes of the family Sapindaceae (Table 1). The GC content value for this species is most similar to that described for Dodonaea viscosa and Acer buergerianum. Among the twelve species analyzed, the GC content was highly conserved, as described so far for the Sapindaceae family (Saina et al., 2018; Ma et al., 2019; Dong et al., 2021)
A slight variation in the size of the four regions of the chloroplast genomes (LSC, SSC, IRa, and IRb) was observed, considering the coefficient of variation (CV), the sizes of the IRs (CV=0.04) and SSC (CV=0.03) varied more than the LSC (CV=0.01), which is an expected pattern for land plants (Table 1). (Xiao-Ming et al., 2017). This variation is related to expansion and retraction events in the size of IRs, events already described in members of the Sapindaceae family and other angiosperms as an essential evolutionary mechanism in land plants (Dugas et al., 2015; Li et al., 2017; Saina et al., 2018; Wang et al., 2018; Ma et al., 2019; Dong et al., 2021).
The number of genes in the chloroplast genomes of the Sapindaceae family is consistent with previously published studies (Dong et al., 2021), suggesting that this variability in the number of genes is due to three factors: the expansion and retraction in the size of the IRs, the process of pseudogenization of the rps2 gene, and the mobility of the tRNA genes (Figure 2). The evidence of expansion and retraction processes in the IR regions comes from the gene colinearity in the transition of the IR regions with the LSC and SSC regions (Li et al., 2017). Thus, the identified patterns provide evidence for a possible phylogenetic relationship between the IR expansion and contraction events with the number of genes. The genes rpl22, rps19, and rps3, located in the IR in the subfamily Sapindoideae, except for the most basal species Koelreuteria paniculata (Figure 2), are part of a set of genes encoding ribosomal proteins (Christopher et al., 1988). Among these three genes, the rps19 gene is commonly found in the IR in dicotyledons, although in other families, such as Euphorbiaceae, this gene can be found in both the IR and LSC regions (Li et al., 2017). The rpl22 gene, found in the chloroplast genomes of angiosperms except for the Fabaceae family, is located in the IR of the Rutaceae family (order Sapindales), indicating IR expansion events (Gantt et al., 1991; Bausher et al., 2006). Previous studies for the Sapindaceae family also showed expansion and retraction processes in the LSC-IRb region, occurring even within genera of the Sapindaceae family, highlighting that the IR expansion and retraction events are an essential source of variability in the number of genes in the Sapindaceae (Li et al., 2017; Xiao-Ming et al., 2017; Saina et al., 2018; Ma et al., 2019; Köhler et al., 2020).
The rps2 gene produces the 2S ribosomal protein and is pseudogenized in Hippocastanoideae and Xanthoceratoideae subfamilies (Zhou et al., 2016; Chen et al., 2019). This gene is often under positive selection in other angiosperm families and is located near a nucleotide diversity hotspot (atpI-rps2). Therefore, the accumulation of nonsynonymous mutations may have led to the pseudogenization of this gene (Wu et al., 2018; Li et al., 2020a; Li et al., 2020b; Sobreiro et al., 2020). The trnH-GUG gene is located exclusively in internal regions of the IRs in X. sorbifolium, so this duplication may not be associated with IR expansion events (Figure 2). Furthermore, other variations in genes encoding tRNAs have been identified, as the absence of trnT-CGU genes in Eurycorymbus cavariei has already been described (Dong et al., 2021). The chloroplasts of D. viscosa show the same absence, perhaps indicating a synapomorphy of the subfamily Dodonaeoideae (Dong et al., 2021). The trnT-CGU gene is not the only gene encoding threonine transporter RNAs, and its absence may be supplied by the other two threonine transporter RNAs in the subfamily Dodonaeoideae.
There is a high level of gene conservation in the cpDNAs of the Sapindaceae family, all of which have the same number of introns. The clpP, rps12, and ycf3 genes have two introns and were observed in all annotated species, unlike some annotations that did not identify the rps12 gene (Supplementary Table S5). The rps12 gene has two 3’ exons in the IR and one 5’ exon in the LSC and is a trans-spliced gene. The trans-spliced rps12 gene has been reported in several Viridiplantae. In some taxonomic groups, such as ferns, one intron of rps12 has been lost (Hildebrand et al., 1988; Ma et al., 2019; Sobreiro et al., 2020). We identified two pseudogenes (infA and one of the ycf1 copies) in all Sapindaceae species. The infA gene is a mobile gene that has undergone several transfer events from the chloroplast to the nucleus, mainly in lineages of the Rosid clade (Millen et al., 2001). Pseudogenization of one of the ycf1 copies is common in angiosperm chloroplast genomes and occurs due to its location in the transition zone between the IR and SSC regions (Figure 3) (Li et al., 2017).
Among the species we identified repetitive regions, K. paniculata and S. erecta had the highest and lowest amounts of wide repeats, respectively. Sapindus mukorossi and S. erecta are the species with the highest and lowest amounts of microsatellite repeats (Figure 4), respectively, confirming a previous study highlighting that S. mukorossi has large numbers of repetitive regions in its chloroplast (Dong et al., 2021). Such repetitive regions are highly informative about genetic diversity within species and are commonly used as molecular markers in studies of biogeography and population genetics (Varshney et al., 2005).
Leucine and cysteine are the most and least abundant amino acids constituting the proteins of the S. erecta chloroplast genome (Supplementary Table S5), as previously described in other species of Sapindaceae and angiosperms (Muellner-Riehl et al., 2016; Ma et al., 2019). The predominant use of some amino acids in chloroplasts may be related to the conservation of genes encoding tRNAs since the composition and number of tRNAs affect the codon composition (Novoa et al., 2012).
The ka/ks ratio is a valuable analysis for understanding the evolutionary process within genes, so values greater than 1 (Ka/Ks > 1) indicate positive selection, values equal to 1 (Ka/Ks = 1) indicate neutrality and values less than 1 (Ka/Ks < 1) indicate negative selection (Nei and Kumar, 2000). We found no evidence of positive selection for any of the cpDNA protein-coding genes (ka/ks > 1) (Figure 6C). Only the psaI gene is under neutrality, indicating a high conservation of amino acid sequences produced by chloroplast protein-coding genes in Sapindales. The psaI gene makes up subunit VIII of the photosystem I reaction center and showed evidence of local positive selection in other studies (Plöchinger et al., 2016; Schöttler et al., 2017). Previous tests in Nicotiana tabacum, inducing mutations in this gene, did not cause changes in plant growth and only responded to high light and cold stress during leaf senescence (Schöttler et al., 2017). Although psaI is the only gene under neutral evolution, several of the ka/ks relationships did not show synonymous mutations (ka), and the highest values of the relationships are primarily associated with S. erecta genes (Figure 7B). A pairwise comparison of S. erecta with the other species for the psaI gene shows an accumulation of non-synonymous mutations in this species, indicating possible positive selection. This heterogeneous speciation process in the psaI gene may be associated with evolutionary factors of the tribe or species. The S. erecta is the unique Sapindaceae liana with data available; positive selection for psaI may be linked to this habit, as this gene is associated with responses to light and cold. We suggest that comparisons of this gene with orthologous genes from species closer to S. erecta are needed to assess the evolutionary impact of these non-synonymous mutations.
The contrasts between the M8 x M7 models identified 12 genes (atpA, clpP, matK, ndhA, ndhF, petD, psaB, rpl32, rpoB, rpoC2, ycf1, and ycf2) under local positive selection (Supplementary Table S8), among these genes one is an ATP subunit (atpA), one encodes a protease (clpP), one encodes maturase (matK), two encodes NADH dehydrogenase subunits (ndhA and ndhF), one composes the Cytochrome b/f complex (petD), one encodes a Photosystem I subunit (psaB), one encode a ribosomal protein subunit (rpl32), two encode DNA-directed RNA polymerase subunits (rpoB and rpoC2), and two encode protein translocons on the inner chloroplast membrane (ycf1 and ycf2) (Allen et al., 2011). The M2a x M1a and M8 x M8a contrasts, which are more rigorous in identification and identified four genes (ndhF, rpoC2, ycf1, and ycf2) under local positive selection (Supplementary Table S8) (Yang and Swanson, 2002; Swanson et al., 2003). The ndhF gene encodes NADH dehydrogenase F and is present in most vascular plants. Positive selection of this gene is associated with adaptation to greater light incidence at high altitudes in Silene vulgaris (Caryophyllaceae) and salt stress in species of the genus Limonium (Plumbaginaceae), suggesting that these loci under positive selection may be related to adaptation in Sapindaceae (Krüger et al., 2019; Darshetkar et al., 2021). The gene rpoC2 is a crucial gene for the transcription of photosynthesis genes, and mutations in these genes can confer the albino phenotype(Park et al., 2023). The ycf1 and ycf2 are essential plant genes for photosynthetic protein import and plant survival (Kikuchi et al., 2013; Kikuchi et al., 2018). Previous studies also showed local positive selection in the ycf1 and ycf2 genes, both in angiosperm and gimonosperm, related to adaptation to environmental changes (Fan et al., 2018; Zeb et al., 2019). In addition, previous studies without considering the phylogeny indicated positive selection of the ycf2 gene and may, in addition to having loci on positive selection, present clades with a more significant amount of non-synonymous mutations (Saina et al., 2018; Dong et al., 2021).
Previous phylogenies reported for the genus Serjania using data from molecular markers (ITS and trnL intron) indicated the formation of a paraphyletic genus with the inclusion of species from the genera Balsas, Chimborazoa and Houssayanthus (Acevedo-Rodríguez et al., 2017). Thus, using molecular information as support, Acevedo-Rodríguez et al. (2017) suggest that the group has changed to include the genera Balsas, Chimborazoa, and Houssayanthus in Serjania, forming a monophyletic group. Speciation events within the genus have probably occurred during the Neogene, resulting in over 230 species distributed throughout the Neotropics. The high level of diversification may be related to the ability to disperse seeds by wind (Muellner-Riehl et al., 2016; Acevedo-Rodríguez et al., 2017; Buerki et al., 2021) and the emergence of climbing species on lianas. South American Sapindaceae species, especially lianas, show a distribution across Antarctica that occurred during the Middle Eocene (about 44 million years ago) (Buerki et al., 2021) and diversified about 18.5-19 million years ago (Jud et al., 2021).
Investigation of nucleotide diversity among families and subfamilies allowed the identification of hotspots of genetic diversity, which can be used as molecular markers to resolve intraspecific relationships and as barcoding markers. In general, intergenic spaces show higher nucleotide diversity, while gene regions are more conserved in species, results like those found by the Percentage of variable characters in embryophytes (Zhang et al., 2011; Fan et al., 2018; Zeb et al., 2019). Our results indicate 10 and 11 nucleotide diversity hotspots for Sapindaceae and Sapindoideae; among these six hotspots (tRNA-Lys — rps16, ndhC – tRNA-Val, petA – psbJ, ndhF, rpl32 – ccsA, and ycf1) are in common for both tribe and family (Figures 6A, B). Other studies evaluating nucleotide diversity also indicate the petA-psbJ, rpl32-cssA, ndhF, and ycf1 regions as highly diverse regions, so we strongly suggest using these regions as molecular markers of the group (Zhou et al., 2016; Ma et al., 2019; Dong et al., 2021). Only the ndhF and ycf1 genes showed high nucleotide diversity, genes in which local positive selection was also found (Figures 6A, B, and Supplementary Table S8), which have already been described and used as molecular markers capable of distinguishing angiosperm and gymnosperm species, with great potential for the family of this study (Dong et al., 2015; Fan et al., 2018; Zeb et al., 2019; Amar, 2020; Ramírez-Barahona et al., 2020; Dong et al., 2021).
The availability of data from chloroplast genomes for the Serjania genus can help develop future molecular markers specific to this genus, which can be applied to the definition of interspecific relationships in the genus. However, a more significant number of genomes from phylogenetically close species is required. Although only one chloroplast genome of the genus Serjania has been described, the two gene regions have the potential as markers for phylogenetic studies. They can be used to clarify evolutionary issues of the genus. These include modifying vegetational habits associated with the diversification of the group in lianas and fruit shape (Jud et al., 2021). In addition, they have the potential to be used as markers and DNA barcodes in the molecular taxonomic identification of species, providing very useful tools in the certification of natural medicines, as is the case with species of the genus Serjania.
5 Conclusion
Our study provides the first assembly and annotation of a chloroplast genome of a species from the tribe Paullinieae (Sapindaceae), Serjania erecta. Three factors are associated with variation in the number of genes in the chloroplast genomes of sapindaceae: (1) expansion events in the IR, (2) pseudogenization of the rps2 gene, and (3) absence and duplication of genes of tRNAs. Protein-coding genes are highly conserved in the Sapindaceae family, and only the psaI gene is evolving under neutrality. We recommend six regions (tRNA-Lys — rps16, ndhC – tRNA-Val, petA – psbJ, ndhF, rpl32 – ccsA, and ycf1) with potential used as a marker for both Sapidaceae and Sapindoideae. The genes ycf1 and ndhF, in addition to showing high nucleotide diversity, also show positive local selection. Our work provides evidence that the ycf1 and ndhF genes may be the most suitable markers for phylogenetic studies of the subfamily Sapindoideae and may contribute to the resolution of taxonomic uncertainties in this group.
Data availability statement
The datasets presented in this study can be found in online repositories. The names of the repository/repositories and accession number(s) can be found below: https://www.ncbi.nlm.nih.gov/, SRX18977468, https://www.ncbi.nlm.nih.gov/, NC_072944.1.
Author contributions
LCJC: Data curation, Formal Analysis, Investigation, Methodology, Visualization, Writing – original draft, Writing – review & editing. MS: Formal Analysis, Methodology, Software, Writing – review & editing. LRC: Formal Analysis, Investigation, Software, Writing – review & editing. RD: Formal Analysis, Software, Visualization, Writing – review & editing. RB-F: Formal Analysis, Investigation, Writing – review & editing. CT: Formal Analysis, Writing – review & editing. CS-N: Data curation, Formal Analysis, Investigation, Resources, Writing – review & editing. BB: Investigation, Resources, Writing – review & editing. AS: Resources, Writing – review & editing. JD-f: Conceptualization, Supervision, Writing – review & editing. MT: Conceptualization, Funding acquisition, Project administration, Supervision, Writing – review & editing. RN: Conceptualization, Data curation, Project administration, Supervision, Writing – original draft, Writing – review & editing.
Funding
The authors declare financial support was received for the research, authorship, and/or publication of this article. This work was developed in the context of Instituto Nacional de Ciência e Tecnologia em Ecologia, Evolução e Conservação da Biodiversidade (INCT – EECBio), supported by Conselho Nacional de Desenvolvimento Científico e Tecnológico (CNPq – process 465610/20145) and Fundação de Amparo à Pesquisa do Estado de Goiás (FAPEG – process 201810267000023). We are also thankful for the support from PPGS Coordenação de Aperfeiçoamento de Pessoal de Nível Superior (CAPES)/FAPEG (#08/2014) and CNPq (MCTIC/CNPq #28/2018, 435477/2018-8). RN was supported by a PDCTR fellowship from FAPEG/CNPq (#202110267000863). RB-F was supported by a DTI fellowship from CNPq. A PNPD scholarship from CAPES supported CT. A productivity grant from CNPq has continuously supported MT, CS-N, and JD-f.
Acknowledgments
Reserva Particular Patrimônio Natural (RPPN) Ecocerrado Brasil team, we are grateful for the work carried out to conserve Brazilian medicinal species.
Conflict of interest
The authors declare that the research was conducted in the absence of any commercial or financial relationships that could be construed as a potential conflict of interest.
Publisher’s note
All claims expressed in this article are solely those of the authors and do not necessarily represent those of their affiliated organizations, or those of the publisher, the editors and the reviewers. Any product that may be evaluated in this article, or claim that may be made by its manufacturer, is not guaranteed or endorsed by the publisher.
Supplementary material
The Supplementary Material for this article can be found online at: https://www.frontiersin.org/articles/10.3389/fpls.2023.1258794/full#supplementary-material
References
Acevedo-Rodriguez, P. (1990). Distributional patterns in Brazilian serjania (Sapindaceae). Acta Bot. Brasilica 4, 69–82. doi: 10.1590/s0102-33061990000100005
Acevedo-Rodríguez, P., Welzen, P. C., Van, Adema, F., van der Ham, R. W. J. M. (2010). Sapindaceae. Kubitzki, K. (eds) Flowering Plants. Eudicots. The Families and Genera of Vascular Plants. 10, 357–407. doi: 10.1007/978-3-642-14397-7_17
Acevedo-Rodríguez, P., Wurdack, K. J., Ferrucci, M. S., Johnson, G., Dias, P., Coelho, R. G., et al. (2017). Generic relationships and classification of tribe paullinieae (Sapindaceae) with a new concept of supertribe paulliniodae. Syst. Bot. 42, 96–114. doi: 10.1600/036364417X694926
Allen, J. F., de Paula, W. B. M., Puthiyaveetil, S., Nield, J. (2011). A structural phylogenetic map for chloroplast photosynthesis. Trends Plant Sci. 16, 645–655. doi: 10.1016/j.tplants.2011.10.004
Amar, M. H. (2020). ycf1-ndhF genes, the most promising plastid genomic barcode, sheds light on phylogeny at low taxonomic levels in Prunus persica. J. Genet. Eng. Biotechnol. 18, 1–10. doi: 10.1186/s43141-020-00057-3
Bausher, M. G., Singh, N. D., Lee, S. B., Jansen, R. K., Daniell, H. (2006). The complete chloroplast genome sequence of Citrus sinensis (L.) Osbeck var “Ridge Pineapple”: Organization and phylogenetic relationships to other angiosperms. BMC Plant Biol. 6, 1–12. doi: 10.1186/1471-2229-6-21
Beier, S., Thiel, T., Münch, T., Scholz, U., Mascher, M. (2017). MISA-web: A web server for microsatellite prediction. Bioinformatics 33, 2583–2585. doi: 10.1093/bioinformatics/btx198
Buerki, S., Callmander, M. W., Acevedo-Rodriguez, P., Lowry, P. P., Munzinger, J., Bailey, P., et al. (2021). An updated infra-familial classification of Sapindaceae based on targeted enrichment data. Am. J. Bot. 108, 1234–1251. doi: 10.1002/ajb2.1693
Buerki, S., Forest, F., Acevedo-Rodríguez, P., Callmander, M. W., Nylander, J. A. A., Harrington, M., et al. (2009). Plastid and nuclear DNA markers reveal intricate relationships at subfamilial and tribal levels in the soapberry family (Sapindaceae). Mol. Phylogenet. Evol. 51, 238–258. doi: 10.1016/j.ympev.2009.01.012
Buerki, S., Lowry, P. P., Alvarez, N., Razafimandimbison, S. G., Küpfer, P., Callmander, M. W. (2010). Phylogeny and circumscription of Sapindaceae revisited: Molecular sequence data, morphology and biogeography support recognition of a new family, Xanthoceraceae. Plant Ecol. Evol. 143, 148–159. doi: 10.5091/plecevo.2010.437
CBOL Plant Working Group (2009). A DNA barcode for land plants. Proc. Natl. Acad. Sci. U.S.A. 106, 12794–12797. doi: 10.1073/pnas.0905845106
Chase, M. W., Christenhusz, M. J. M., Fay, M. F., Byng, J. W., Judd, W. S., Soltis, D. E., et al. (2016). An update of the Angiosperm Phylogeny Group classification for the orders and families of flowering plants: APG IV. Botanical J. Linn. Soc. 181, 1–20. doi: 10.1111/boj.12385
Chen, M., Zhang, H., Jiang, M. (2019). The complete chloroplast genome sequence of Acer cinnamomifolium (Aceraceae), a plant species endemic to China. Mitochondrial DNA B Resour. 4, 3450–3451. doi: 10.1080/23802359.2019.1674211
Christopher, D. A., Cushman, J. C., Price, C. A., Hallick, R. B. (1988). Organization of ribosomal protein genes rp123, rpl2, rpsl9, rpl22 and rps3 on the Euglena gracilis chloroplast genome. Curr. Genet. 14, 275–285. doi: 10.1007/BF00376748
Darling, A. C. E., Mau, B., Blattner, F. R., Perna, N. T. (2004). Mauve: Multiple alignment of conserved genomic sequence with rearrangements. Genome Res. 14, 1394–1403. doi: 10.1101/gr.2289704
Darshetkar, A. M., Maurya, S., Lee, C., Bazarragchaa, B., Batdelger, G., Janchiv, A., et al. (2021). Plastome analysis unveils Inverted Repeat (IR) expansion and positive selection in Sea Lavenders (Limonium, Plumbaginaceae, Limonioideae, Limonieae). PhytoKeys 175, 89–107. doi: 10.3897/phytokeys.175.61054
Dierckxsens, N., Mardulyn, P., Smits, G. (2017). NOVOPlasty: De novo assembly of organelle genomes from whole genome data. Nucleic Acids Res. 45, 1–9. doi: 10.1093/nar/gkw955
Dong, F., Lin, Z., Lin, J., Ming, R., Zhang, W. (2021). Chloroplast genome of rambutan and comparative analyses in sapindaceae. Plants 10, 1–15. doi: 10.3390/plants10020283
Dong, W., Xu, C., Li, C., Sun, J., Zuo, Y., Shi, S., et al. (2015). ycf1, the most promising plastid DNA barcode of land plants. Sci. Rep. 58348, 1–5. doi: 10.1038/srep08348
Doyle, J. J., Doyle, J. L. (1987). A rapid DNA isolation procedure for small quantities of fresh leaf tissue. Phytochem. Bull. 19, 11–15.
Dugas, D. V., Hernandez, D., Koenen, E. J. M., Schwarz, E., Straub, S., Hughes, C. E., et al. (2015). Mimosoid legume plastome evolution: IR expansion, tandem repeat expansions, and accelerated rate of evolution in clpP. Sci. Rep. 5, 1–13. doi: 10.1038/srep16958
Fan, W. B., Wu, Y., Yang, J., Shahzad, K., Li, Z. H. (2018). Comparative chloroplast genomics of dipsacales species: Insights into sequence variation, adaptive evolution, and phylogenetic relationships. Front. Plant Sci. 9. doi: 10.3389/fpls.2018.00689
Ferrucci, M. S., Acevedo-Rodríguez, P. (2005). Three new species of Serjania (Sapindaceae) from south America. Syst. Bot. 30, 153–162. doi: 10.1600/0363644053661904
Gantt, J. S., Baldauf, S. L., Calie, P. J., Weeden, N. F., Palmer, J. D. (1991). Transfer of rpl22 to the nucleus greatly preceded its loss from the chloroplast and involved the gain of an intron. EMBO J. 10, 3073–3078. doi: 10.1002/j.1460-2075.1991.tb07859.x
Gomig, F., Pietrovski, E. F., Guedes, A., Dalmarco, E. M., Calderari, M. T., Guimarães, C. L., et al. (2008). Topical anti-inflammatory activity of Serjania erecta Radlk (Sapindaceae) extracts. J. Ethnopharmacol. 118, 220–224. doi: 10.1016/j.jep.2008.03.017
Hildebrand, M., Hallick, R. B., Passavant, C. W., Bourque, D. P. (1988). Trans-splicing in chloroplasts: The rpsl2 loci of Nicotiana tabacum. Proc. Natl. Acad. Sci. U.S.A. 85, 372–376. doi: 10.1073/pnas.85.2.372
Hiruma-Lima, C. A., Castelo, A. P. C., Arruda, B. N., Coelho, R. G., Honda, N. K., Ferrazoli, C., et al. (2009). Gastroprotective effect of Serjania erecta Radlk (Sapindaceae): Involvement of sensory neurons, endogenous nonprotein sulfhydryls, and nitric oxide. J. Med. Food 12, 1411–1415. doi: 10.1089/jmf.2008.0269
Jansen, R. K., Ruhlman, T. A. (2012). Plastid genomes of seed plants. Genomics of Chloroplasts and Mitochondria, Advances in Photosynthesis and Respiration. 35, 103–126. doi: 10.1007/978-94-007-2920-9_5
Jud, N. A., Allen, S. E., Nelson, C. W., Bastos, C. L., Chery, J. G. (2021). Climbing since the early Miocene: The fossil record of Paullinieae (Sapindaceae). PloS One 16, 1–22. doi: 10.1371/journal.pone.0248369
Kalyaanamoorthy, S., Minh, B. Q., Wong, T. K. F., Von Haeseler, A., Jermiin, L. S. (2017). ModelFinder: Fast model selection for accurate phylogenetic estimates. Nat. Methods 14, 587–589. doi: 10.1038/nmeth.4285
Kang, B. C., Bae, S. J., Lee, S., Lee, J. S., Kim, A., Lee, H., et al. (2021). Chloroplast and mitochondrial DNA editing in plants. Nat. Plants 7, 899–905. doi: 10.1038/s41477-021-00943-9
Katoh, K., Standley, D. M. (2013). MAFFT multiple sequence alignment software version 7: Improvements in performance and usability. Mol. Biol. Evol. 30, 772–780. doi: 10.1093/molbev/mst010
Kearse, M., Moir, R., Wilson, A., Stones-Havas, S., Cheung, M., Sturrock, S., et al. (2012). Geneious Basic: An integrated and extendable desktop software platform for the organization and analysis of sequence data. Bioinformatics 28, 1647–1649. doi: 10.1093/bioinformatics/bts199
Kent, W. J. (2002). BLAT —The BLAST -like alignment tool. Genome Res. 12, 656–664. doi: 10.1101/gr.229202
Kikuchi, S., Asakura, Y., Imai, M., Nakahira, Y., Kotani, Y., Hashiguchi, Y., et al. (2018). A Ycf2-FtsHi heteromeric AAA-ATPase complex is required for chloroplast protein import. Plant Cell 30, 2677–2703. doi: 10.1105/tpc.18.00357
Kikuchi, S., Bédard, J., Hirano, M., Hirabayashi, Y., Oishi, M., Imai, M., et al. (2013). Uncovering the protein translocon at the chloroplast inner envelope membrane. Sci. (1979) 339, 571–574.
Köhler, M., Reginato, M., Souza-Chies, T. T., Majure, L. C. (2020). Insights into chloroplast genome evolution across opuntioideae (Cactaceae) reveals robust yet sometimes conflicting phylogenetic topologies. Front. Plant Sci. 11. doi: 10.3389/fpls.2020.00729
Krüger, M., Abeyawardana, O. A. J., Juříček, M., Krüger, C., Štorchová, H. (2019). Variation in plastid genomes in the gynodioecious species Silene vulgaris. BMC Plant Biol. 19, 1–15. doi: 10.1186/s12870-019-2193-0
Kurtz, S., Choudhuri, J. V., Ohlebusch, E., Schleiermacher, C., Stoye, J., Giegerich, R. (2001). REPuter: the manifold applications of repeat analysis on a genomic scale. Nucleic Acids Res. 29, 4633–4642. doi: 10.1093/nar/29.22.4633
Laslett, D., Canback, B. (2004). ARAGORN, a program to detect tRNA genes and tmRNA genes in nucleotide sequences. Nucleic Acids Res. 32, 11–16. doi: 10.1093/nar/gkh152
Leebens-Mack, J., Raubeson, L. A., Cui, L., Kuehl, J. V., Fourcade, M. H., Chumley, T. W., et al. (2005). Identifying the basal angiosperm node in chloroplast genome phylogenies: Sampling one’s way out of the Felsenstein zone. Mol. Biol. Evol. 22, 1948–1963. doi: 10.1093/molbev/msi191
Li, Z., Long, H., Zhang, L., Liu, Z., Cao, H., Shi, M., et al. (2017). The complete chloroplast genome sequence of tung tree (Vernicia fordii): Organization and phylogenetic relationships with other angiosperms. Sci. Rep. 7, 1–11. doi: 10.1038/s41598-017-02076-6
Li, P., Lou, G., Cai, X., Zhang, B., Cheng, Y., Wang, H. (2020b). Comparison of the complete plastomes and the phylogenetic analysis of Paulownia species. Sci. Rep. 10, 1–9. doi: 10.1038/s41598-020-59204-y
Li, C., Zhao, Y., Xu, Z., Yang, G., Peng, J., Peng, X. (2020a). Initial characterization of the chloroplast genome of vicia sepium, an important wild resource plant, and related inferences about its evolution. Front. Genet. 11. doi: 10.3389/fgene.2020.00073
Lohse, M., Drechsel, O., Kahlau, S., Bock, R. (2013). OrganellarGenomeDRAW–a suite of tools for generating physical maps of plastid and mitochondrial genomes and visualizing expression data sets. Nucleic Acids Res. 41, W575–W581. doi: 10.1093/nar/gkt289
Ma, Q., Wang, Y., Zhu, L., Bi, C., Li, S., Li, S., et al. (2019). Characterization of the complete chloroplast genome of acer truncatum bunge (Sapindales: Aceraceae): A new woody oil tree species producing nervonic acid. BioMed. Res. Int. 2019, 1–13. doi: 10.1155/2019/7417239
Margulis, L., Bermudes, D. (1985). Symbiosis as a mechanism of evolution: status of cell symbiosis theory. Symbiosis 1, 101–124.
Millen, R. S., Olmstead, R. G., Adams, K. L., Palmer, J. D., Lao, N. T., Heggie, L., et al. (2001) Many Parallel Losses of infA from Chloroplast DNA during Angiosperm Evolution with Multiple Independent Transfers to the Nucleus. Available at: www.plantcell.org.
Moore, M. J., Soltis, P. S., Bell, C. D., Burleigh, J. G., Soltis, D. E. (2010). Phylogenetic analysis of 83 plastid genes further resolves the early diversification of eudicots. Proc. Natl. Acad. Sci. U.S.A. 107, 4623–4628. doi: 10.1073/pnas.0907801107
Muellner-Riehl, A. N., Weeks, A., Clayton, J. W., Buerki, S., Nauheimer, L., Chiang, Y. C., et al. (2016). Molecular phylogenetics and molecular clock dating of Sapindales based on plastid rbcL, atpB and trnL-trnF DNA sequences. Taxon 65, 1019–1036. doi: 10.12705/655.5
Nei, M., Kumar, S. (2000). Molecular evolution and phylogenetics (New York, New York, USA: Oxford University Press).
Nguyen, L. T., Schmidt, H. A., Von Haeseler, A., Minh, B. Q. (2015). IQ-TREE: A fast and effective stochastic algorithm for estimating maximum-likelihood phylogenies. Mol. Biol. Evol. 32, 268–274. doi: 10.1093/molbev/msu300
Novoa, E. M., Pavon-Eternod, M., Pan, T., Ribas De Pouplana, L. (2012). A role for tRNA modifications in genome structure and codon usage. Cell 149, 202–213. doi: 10.1016/j.cell.2012.01.050
Okonechnikov, K., Golosova, O., Fursov, M., Varlamov, A., Vaskin, Y., Efremov, I., et al. (2012). Unipro UGENE: A unified bioinformatics toolkit. Bioinformatics 28, 1166–1167. doi: 10.1093/bioinformatics/bts091
Park, H. S., Jeon, J. H., Cho, W., Lee, Y., Park, J. Y., Kim, J., et al. (2023). High-throughput discovery of plastid genes causing albino phenotypes in ornamental chimeric plants. Hortic. Res. 10, 1–11. doi: 10.1093/hr/uhac246
Plöchinger, M., Torabi, S., Rantala, M., Tikkanen, M., Suorsa, M., Jensen, P. E., et al. (2016). The low molecular weight protein psai stabilizes the light-harvesting complex II docking site of photosystem I. Plant Physiol. 172, 450–463. doi: 10.1104/pp.16.00647
Ramírez-Barahona, S., Sauquet, H., Magallón, S. (2020). The delayed and geographically heterogeneous diversification of flowering plant families. Nat. Ecol. Evol. 4, 1232–1238. doi: 10.1038/s41559-020-1241-3
R Core Team (2020). R: A language and environment for statistical computing (Vienna, Austria: R Foundation for Statistical Computing).
Rodríguez-Ezpeleta, N., Brinkmann, H., Burey, S. C., Roure, B., Burger, G., Löffelhardt, W., et al. (2005). Monophyly of primary photosynthetic eukaryotes: Green plants, red algae, and glaucophytes. Curr. Biol. 15, 1325–1330. doi: 10.1016/j.cub.2005.06.040
Rozas, J., Ferrer-Mata, A., Sanchez-DelBarrio, J. C., Guirao-Rico, S., Librado, P., Ramos-Onsins, S. E., et al. (2017). DnaSP 6: DNA sequence polymorphism analysis of large data sets. Mol. Biol. Evol. 34, 3299–3302. doi: 10.1093/molbev/msx248
Saina, J. K., Gichira, A. W., Li, Z. Z., Hu, G. W., Wang, Q. F., Liao, K. (2018). The complete chloroplast genome sequence of Dodonaea viscosa: comparative and phylogenetic analyses. Genetica 146, 101–113. doi: 10.1007/s10709-017-0003-x
Sato, N. (2020). Complex origins of chloroplast membranes with photosynthetic machineries: multiple transfers of genes from divergent organisms at different times or a single endosymbiotic event? J. Plant Res. 133, 15–33. doi: 10.1007/s10265-019-01157-z
Schöttler, M. A., Thiele, W., Belkius, K., Bergner, S. V., Flügel, C., Wittenberg, G., et al. (2017). The plastid-encoded PsaI subunit stabilizes photosystem i during leaf senescence in tobacco. J. Exp. Bot. 68, 1137–1155. doi: 10.1093/jxb/erx009
Sobreiro, M. B., Vieira, L. D., Nunes, R., Novaes, E., Coissac, E., Silva-Junior, O. B., et al. (2020). Chloroplast genome assembly of Handroanthus impetiginosus: comparative analysis and molecular evolution in Bignoniaceae. Planta 252, 1–16. doi: 10.1007/s00425-020-03498-9
Somner, G. V., Ferrucci, M. S., Acevedo-Rodríguez, P. (2015). Serjania in Lista de Espécies da Flora do Brasil. Jardim Botânico do Rio Janeiro. Available at: https://floradobrasil.jbrj.gov.br/F (Accessed March 19, 2023).
Souza, U. J. B. d., Nunes, R., Targueta, C. P., Diniz-Filho, J. A. F., Telles, M. P. d. C. (2019). The complete chloroplast genome of Stryphnodendron adstringens (Leguminosae - Caesalpinioideae): comparative analysis with related Mimosoid species. Sci. Rep. 9, 1–12. doi: 10.1038/s41598-019-50620-3
Steinmann, V. W., Ferrucci, M. S., Maya-Lastra, C. A. (2022). Phylogenetics of Serjania (Sapindaceae-Paullinieae), with emphasis on fruit evolution and the description of a new species from Michoacán, Mexico. Syst. Biodivers. 20, 1–21. doi: 10.1080/14772000.2022.2030425
Swanson, W. J., Nielsen, R., Yang, Q. (2003). Pervasive adaptive evolution in mammalian fertilization proteins. Mol. Biol. Evol. 20, 18–20. doi: 10.1093/oxfordjournals.molbev.a004233
Talavera, G., Castresana, J. (2007). Improvement of phylogenies after removing divergent and ambiguously aligned blocks from protein sequence alignments. Syst. Biol. 56, 564–577. doi: 10.1080/10635150701472164
Tillich, M., Lehwark, P., Pellizzer, T., Ulbricht-Jones, E. S., Fischer, A., Bock, R., et al. (2017). GeSeq - Versatile and accurate annotation of organelle genomes. Nucleic Acids Res. 45, W6–W11. doi: 10.1093/nar/gkx391
Urdampilleta, J. D., Ferrucci, M. S., Vanzela, A. L. L. (2012). Cytogenetic studies in South American species of Serjania (Sapindaceae: Paullinieae). Plant Biosyst. 146, 835–846. doi: 10.1080/11263504.2012.705349
Vaidya, G., Lohman, D. J., Meier, R. (2011). SequenceMatrix: Concatenation software for the fast assembly of multi-gene datasets with character set and codon information. Cladistics 27, 171–180. doi: 10.1111/j.1096-0031.2010.00329.x
Varshney, R. K., Graner, A., Sorrells, M. E. (2005). Genic microsatellite markers in plants: Features and applications. Trends Biotechnol. 23, 48–55. doi: 10.1016/j.tibtech.2004.11.005
Wang, W., Chen, S., Zhang, X. (2018). Whole-Genome comparison reveals divergent IR borders and mutation hotspots in chloroplast genomes of herbaceous bamboos (Bambusoideae: Olyreae). Molecules 23, 1–20. doi: 10.3390/molecules23071537
Wang, Y. H., Qu, X. J., Chen, S. Y., Li, D. Z., Yi, T. S. (2017). Plastomes of Mimosoideae: structural and size variation, sequence divergence, and phylogenetic implication. Tree Genet. Genomes 13, 1–18. doi: 10.1007/s11295-017-1124-1
Wheeler, T. J., Eddy, S. R. (2013). Nhmmer: DNA homology search with profile HMMs. Bioinformatics 29, 2487–2489. doi: 10.1093/bioinformatics/btt403
Wicke, S., Schneeweiss, G. M., dePamphilis, C. W., Müller, K. F., Quandt, D. (2011). The evolution of the plastid chromosome in land plants: Gene content, gene order, gene function. Plant Mol. Biol. 76, 273–297. doi: 10.1007/s11103-011-9762-4
Wu, Y., Liu, F., Yang, D. G., Li, W., Zhou, X. J., Pei, X. Y., et al. (2018). Comparative chloroplast genomics of Gossypium species: Insights into repeat sequence variations and phylogeny. Front. Plant Sci. 9. doi: 10.3389/fpls.2018.00376
Xiao-Ming, Z., Junrui, W., Li, F., Sha, L., Hongbo, P., Lan, Q., et al. (2017). Inferring the evolutionary mechanism of the chloroplast genome size by comparing whole-chloroplast genome sequences in seed plants. Sci. Rep. 7, 1–10. doi: 10.1038/s41598-017-01518-5
Yang, Z. (2007). PAML 4: Phylogenetic analysis by maximum likelihood. Mol. Biol. Evol. 24, 1586–1591. doi: 10.1093/molbev/msm088
Yang, Z., Swanson, W. J. (2002). Codon-substitution models to detect adaptive evolution that account for heterogeneous selective pressures among site classes. Mol. Biol. Evol. 19, 49–57. doi: 10.1093/oxfordjournals.molbev.a003981
Zeb, U., Dong, W.-L., Zhang, T.-T., Wang, R.-N., Shahzad, K., Ma, X.-F., et al. (2019). Comparative plastid genomics of Pinus species: Insights into sequence variations and phylogenetic relationships. JSE J. Syst. Evol. 00, 1–15. doi: 10.1002/jse.12492
Zhang, Y. J., Ma, P. F., Li, D. Z. (2011). High-throughput sequencing of six bamboo chloroplast genomes: Phylogenetic implications for temperate woody bamboos (Poaceae: Bambusoideae). PloS One 6, 1–16. doi: 10.1371/journal.pone.0020596
Keywords: cpDNA, molecular evolution, negative selection, organellar genome, plastome
Citation: Corvalán LCJ, Sobreiro MB, Carvalho LR, Dias RO, Braga-Ferreira RS, Targueta CP, Silva-Neto CMe, Berton BW, Pereira AMS, Diniz-filho JAF, Telles MPC and Nunes R (2023) Chloroplast genome assembly of Serjania erecta Raldk: comparative analysis reveals gene number variation and selection in protein-coding plastid genes of Sapindaceae. Front. Plant Sci. 14:1258794. doi: 10.3389/fpls.2023.1258794
Received: 14 July 2023; Accepted: 06 September 2023;
Published: 26 September 2023.
Edited by:
George Popescu, Mississippi State University, United StatesReviewed by:
Khurram Shahzad, Chinese Academy of Sciences (CAS), ChinaEric Wade Linton, Central Michigan University, United States
Copyright © 2023 Corvalán, Sobreiro, Carvalho, Dias, Braga-Ferreira, Targueta, Silva-Neto, Berton, Pereira, Diniz-filho, Telles and Nunes. This is an open-access article distributed under the terms of the Creative Commons Attribution License (CC BY). The use, distribution or reproduction in other forums is permitted, provided the original author(s) and the copyright owner(s) are credited and that the original publication in this journal is cited, in accordance with accepted academic practice. No use, distribution or reproduction is permitted which does not comply with these terms.
*Correspondence: Rhewter Nunes, cmhld3RlckBnbWFpbC5jb20=