 Weiyue Sun
 Zuoying Wei
 Yuefeng Gu
 Ting Wang
 Baodong Liu1,2*
 Yuehong Yan
- 1Key Laboratory of Plant Biology, College of Heilongjiang Province, Harbin Normal University, Harbin, China
- 2Key Laboratory of National Forestry and Grassland Administration for Orehid Conservation and Utilization, the Orchid Conservation & Research Center of Shenzhen, Shenzhen, China
- 3Key Laboratory of Plant Resources Conservation and Sustainable Utilization, South China Botanical Garden, Guangzhou, China
Equisetum is one of the oldest extant group vascular plants and is considered to be the key to understanding vascular plant evolution. Equisetum is distributed almost all over the world and has a high degree of adaptability to different environments. Despite the fossil record of horsetails (Equisetum, Equisetaceae) dating back to the Carboniferous, the phylogenetic relationship of this genus is not well, and the chloroplast evolution in Equisetum remains poorly understood. In order to fill this gap, we sequenced, assembled, and annotated the chloroplast genomes of 12 species of Equisetum, and compared them to 13 previously published vascular plants chloroplast genomes to deeply examine the plastome evolutionary dynamics of Equisetum. The chloroplast genomes have a highly conserved quadripartite structure across the genus, but these chloroplast genomes have a lower GC content than other ferns. The size of Equisetum plastomes ranges from 130,773 bp to 133,684 bp and they encode 130 genes. Contraction/expansion of IR regions and the number of simple sequences repeat regions underlie large genomic variations in size among them. Comparative analysis revealed we also identified 13 divergence hotspot regions. Additionally, the genes accD and ycf1 can be used as potential DNA barcodes for the identification and phylogeny of the genus Equisetum. Twelve photosynthesis-related genes were specifically selected in Equisetum. Comparative genomic analyses implied divergent evolutionary patterns between Equisetum and other ferns. Phylogenomic analyses and molecular dating revealed a relatively distant phylogenetic relationship between Equisetum and other ferns, supporting the division of pteridophyte into Lycophytes, Equisetaceae and ferns. The results show that the chloroplast genome can be used to solve phylogenetic problems within or between Equisetum species, and also provide genomic resources for the study of Equisetum systematics and evolution.
1 Introduction
Horsetails are considered an enigmatic group among terrestrial plants. While they consist solely of the genus Equisetum, they are tracing back to the Triassic period believed to be one of the oldest surviving genus within vascular plants (Hauke, 1963, 1979; Husby et al., 2011). Scientists have long been intrigued by this genus, recognizing its significance in unraveling the evolution of vascular plants (Hauke, 1979). Although its morphology and anatomy have been well documented (Bierhorst, 1958; Stein, 1993), the position of the genus in the plant life tree has puzzled researchers since the beginning of the 20th century (Scott, 1900; Browne, 1908; Eames, 1936; Rothwell, 1999; Pryer et al., 2001; Karol et al., 2010; Rothfels et al., 2015). The phylogeny position of Equisetum has traditionally been determined using morphological characters, as well as various chloroplast segments and the nuclear ribosomal ITS markers (Des Marais et al., 2003; Guillon, 2007; Grewe et al., 2013; Christenhusz et al., 2019). However, previous studies have faced challenges in establishing conclusive relationships of Equisetum, particularly when relying on a limited number of samples. Chloroplasts genome play a key role in the adaptation and evolution of plants (Wicke et al., 2011; Yin et al., 2018; Gao et al., 2019; Thode and Lohmann, 2019). The chloroplast genomes are self-replicating and evolve slowly (Parks et al., 2012; Li et al., 2019). Chloroplast genomes which have conserved structures and stable gene compositions, are among the smallest genomes in plant cells (Parks et al., 2009; Ruhlman and Jansen, 2014; Sun et al., 2017; Yan et al., 2018). They also provide easily accessible full sequences. Consequently, they have been widely applied in reconstructing the Tree of Life of plants, especially concerning lower taxonomic levels and peripheral categories (Jansen et al., 2007; Moore et al., 2007; Ruhfel et al., 2014; Gitzendanner et al., 2018; Shen et al., 2018; Li et al., 2019). Particularly, comparative analysis based on chloroplast genome data can provide insight into species evolution and phylogeny (Ruhfel et al., 2014).
The study of comparative genomics using chloroplast genome has mainly focused on structural variations, such as IR contractions and expansions (Guisinger et al., 2011; Zhu et al., 2016; Weng et al., 2017) and genomic rearrangements (Knox, 2014; Sun et al., 2017; Rabah et al., 2019). In addition to discovering sequence variation, comparative chloroplast genome can also identifying mutational hotspot regions. For species identification and population genetics, mutational hotspot regions and SSRs can be effective molecular markers (Dong et al., 2012). Chloroplast genomes can also provide a window into the process of adaptation, as many chloroplast genes are under strong selection of one kind or another. An example demonstrating significant implications for the adaptation of the Ostreobium quekettii to exceedingly low light levels was the discovery of prominent purifying selection instead of the anticipated positive selection in its chloroplast genome (R Marcelino et al., 2016). However, there have been no reports on the comparison of chloroplast genomes in the study of vascular plant Equisetum. This research significantly contributed to enhancing our comprehension regarding the adaptive evolution of plants.
The main objective of this research was to gain a thorough understanding of the evolutionary patterns exhibited by the chloroplast genomes among various Equisetum species. We sequenced, spliced, assembled, and annotated the chloroplasts from a total of 12 Equisetum species. To further analysis, we compared these genomes with 13 available chloroplast genomes of other vascular plants found in the GenBank database. The aims of this research were to exhibit the initial chloroplast genome information for 7 Equisetum species, and utilize all accessible Equisetum chloroplast genome sequences to elucidate their phylogenetic relationships, compare the genome structure and diversity for chloroplast genomes, explore single-sequence repeats and hotspot regions sequences for Equisetum species recognition and phylogenetic, and detect genes that have undergone positive selection and potential indications of adaptive evolution in the genus.
2 Manuscript formatting
2.1 Plant materials and sequencing
The identification of the species investigated in this study was determined by consulting the Flora of China database. Supplementary Table 1 contains the sample data, which includes eleven recently sequenced species and fourteen species obtained from the National Center for Biotechnology Information (NCBI). We gathered fresh leaves and then desiccated them using silica gel for future DNA isolation. Novogene (Beijing, China) utilized the NovaSeq 6000 platform with 2 × 150 bp sequencing to analyze the isolated DNA using short reads.
2.2 Genome annotation and assembly
To ensure the removal of low-quality sequences and junctions, Trimmomatic (v0.39) was employed for quality control on the obtained raw reads from sequencing (Bolger et al., 2014). We conducted the assembly of the filtered reads by employing GetOrganelle (v1.6.2) the kmers were set to 21, 45, 65, 85, and 105 (Jin et al., 2020). Next, we finalized the assembly process using Bandage (v0.8.1) (Wick et al., 2015). Published E. arvense (JN968380.1), E. hyemale (NC_020146.1) and E. ramosissimum (MW074919.1) chloroplast genome was used as references. The annotation of the chloroplast genome was performed using PGA (Qu et al., 2019) and then reviewed and edited manually in Geneious v11.0.4 (Kearse et al., 2012). Ultimately, using Chloroplot to visualize the circular genome maps of the Equisetum species (Lohse et al., 2013).
2.3 Repeats analysis and variation detection
We utilized the Repter software to identify scattered repetitive sequences, having a min length of 3 bp and allowing a max of 30 bp nucleotide mismatches (Zheng, 2020). Retrieve repeated sequences using four methods: forward, backward, completion, and palindrome. The size of gaps between repeat sequences is limited to a maximum length of 3 kb. Use online MISA software (https://webblast.ipk-gatersleben.de/misa) to detect SSR (Thiel et al., 2008). In the scientific analysis, MISA was utilized for the anticipation of SSRs utilizing the subsequent parameters: monomer (n ≥8), dimer (n ≥4), trimer (n ≥4), tetramer (n ≥3), pentamer (n ≥3), hexamer (n ≥3). An SSR was defined as a combination of SSRs that were spaced apart by a max distance of 100 bp. To determine the types and amounts of substitution and indel mutations in the LSC, SSC, and IR regions of Equisetum, the software Dnasp (v5.10) was utilized. Manual counting and identification are necessary for inversion mutations (Librado and Rozas, 2009).
2.4 Chloroplast genome alignment
To analyze the IR boundary characteristics in the chloroplast genomes of Equisetum species, the utilization of IRscope facilitated the creation of the IR boundary map (Amiryousefi et al., 2018). To identify rearrangements and inverse evolutionary events, we employed the Mauve Contig Mover (MCM) alignment algorithm in Geneious (Darling et al., 2004). Using the shuffle-Lagan model, we utilized the mVISTA program to perform a comparison of the chloroplast genome sequences of all species (Frazer et al., 2004), used the E. xylochaetum as reference. Afterwards, DnaSP v5.10.01 was employed to calculate the nucleotide diversity (Pi) (Rozas et al., 2017). For this analysis, a window length of 600 bp and a step size of 200 bp were utilized.
2.5 Codon usage pattern
To avoid bias in the sampling process, we examined every protein coding gene (CDS) within the chloroplast genome. We ensured that each gene was complete, and both the start and stop codons were correctly present. Codon usage calculations excluded any CDS less than 300 base pairs in length to maintain accuracy. In order to evaluate the consistency of codon usage among synonymous codon, the ENc value was utilized. The evaluation of gene codon usage was conducted using the CodonW (v1.4.4) software, which provided us with three crucial indices: the Neutrality plot, GC3s, and ENc (Peden, 2000; Rosenberg et al., 2003).
2.6 Evolutionary selection pressure analysis
This study sequenced and annotated the chloroplast whole genome sequences of 12 species of the Equisetum, combined with the chloroplast gene sequences of 6 species ferns published in NCBI for a total of 18 species, to explore the role of selection pressure and adaptive evolution between the Equisetum and ferns, as well as the subgenus Hippochaete and Equisetum. In order to detect the sites under selection in the protein-coding genes in Equisetum plastid genomes, the nonsynonymous (Ka) and synonymous (Ks) nucleotide substitution rates and their ratio (ω=Ka/Ks) were calculated using the Codeml program in the PAML4.7 package (options were set to seqtype = 1, model = 0, NSsites = 0,1,2,3,7,8 in the codeml. ctl file) (Yang and Nielsen, 2002; Yang et al., 2005). PAML analyses were conducted in the “user tree” mode. The maximum likelihood (ML) phylogenetic evolutionary tree was obtained based on the complete chloroplast genomes using RA x ML (Stamatakis, 2006). We employed site specific models to analyze the selection pressure on 78 common protein-coding genes shared by all of the genomes. This model allowed the ω ratio to vary among sites with a fixed ω ratio in all the evolutionary branches. Other parameters in the CODEML control file were left at default settings. Two likelihood ratio tests were performed to check for the presence of positively selected sites: M1 (neutral) vs. M2 (positive selection), and M7 (beta) vs.M8 (beta and ω), which were compared using site-specific models (Yang and Nielsen, 2002; Yang et al., 2005).
2.7 Phylogenetic analysis
A total of 28 chloroplast genomes were selected to construct phylogenetic trees, with species Anthoceros punctatus, Marchantia polymorpha and Physcomitrella patens selected as the outgroups.. The involved the extract chloroplast whole genome, Genes, CDS, and chloroplast genome Noncoding sequences separately and use the four data sets phylogenetic analyses and utilization of MAFFT software to identify homologous sequences within the chloroplast genome of the 28 selected species. IQtree was used to construct ML tree, and 1000 bootstrap tests were run under the best nucleic acid replacement model. After the ML tree is obtained, the branch results are evaluated by bootstrap (BS), BS ≥ 70%. The jModelTest software was used to select the substitution model of nucleic acid sequence after alignment, and the BIC was used. Bayesian information criterion is the standard to select the best model; Phylosuite software is used to generate the.nex format file needed to construct the BI tree. Then use MrBayes to build the BI tree, the parameters selected in the Mrbayes program: Generations selected 2,000,000 times, and the Sampling Freq was set to 100, that is, running 2,000,000 generations for testing, and collecting evolutionary trees every 100 generations. If the value of Average standard deviation of split frequencies is less than 0.01 after the set program is run, assuming the convergence of MCMC chain, the input command no is stopped according to the prompt, otherwise the input command yes continues to run until its ASDF value is less than 0.01, and the tree building command is MrBayes > execute example.nex. After the BI tree is obtained, Bayesian posterior probabilities (pp) are used to evaluate the branch results, and pp ≥ 0.95 indicates that the results are reliable. Due to the lack of high homology in chloroplast genome Noncoding sequences, we selected ASTRAL software was used to merge the gene trees constructed by Genes, CDSs and chloroplast genome sequences to reconstruct the corresponding species tree (Yin et al., 2019).
2.8 Divergence time estimates using fossil calibrations
In order to obtain the stem and crown age of the genus Equisetum, we performed divergence time estimation using the concatenated chloroplast whole genome, CDSs and Gene dataset in BEAST2 v2.6.3 (Bouckaert et al., 2019). The geological age of each fossil was utilized to assign age correction points through a lognormal distribution approach. The estimation of absolute divergence times was conducted by employing the BEAST software (v1.8.4) and implementing the Bayesian lognormal relaxation clock method (Rambaut et al., 2018). The GTR + F + I model for the combined data set was applied with a speciation tree and a relaxed clock log normal clock model after. In order to assess the impact of individual calibration points, we conducted multiple runs of BEAST, omitting a different fossil in each iteration. Three secondary correction points were set according to the results of Christenhusz et al. (2021): (a) the crown age of all Equisetum was 152-164 Ma (Channing et al., 2011), (b) The crown age of Subgenus Hippochaete is 66-72 Ma (Reed, 1971), (c) The crown age of E variegatum and E ramosissimum is 37.8–47.8 Ma (Brown, 1975). We ran Markov Chain Monte Carlo (MCMC) for 800 million generations with sampling every 1,000 cycles. The first 10% of samples were discarded as burn-in. We examined the outputs using Tracer v1.7 to confirm convergence based on ESS >200 (Rambaut et al., 2018).
3 Results
3.1 Chloroplast genome sequencing and characteristics analysis
A total of 85.1 Gb clean data were obtained from the 12 Equisetum species, with genome sizes ranging from 130,773 bp (E. hyemale) to 133,684 bp (E. arvense) (Figure 1A). All of the 12 complete chloroplast genomes exhibited a characteristic structure consisting of four parts, which included a duo of IR regions (9,828 - 10,252 bp), LSC regions (91,524 - 93,536 bp), and SSC regions (18,941 - 19,855 bp). Compared with the outgroups, the Equisetum chloroplast genomes had lower GC content. The analysis of base composition suggests that the IR regions had higher GC content (46.7%) than LSC (33.1%) and SSC (30.7%) regions (Figure 1C). The gene annotations and raw data have already been submitted to NCBI Gen-Bank (Figure 2).
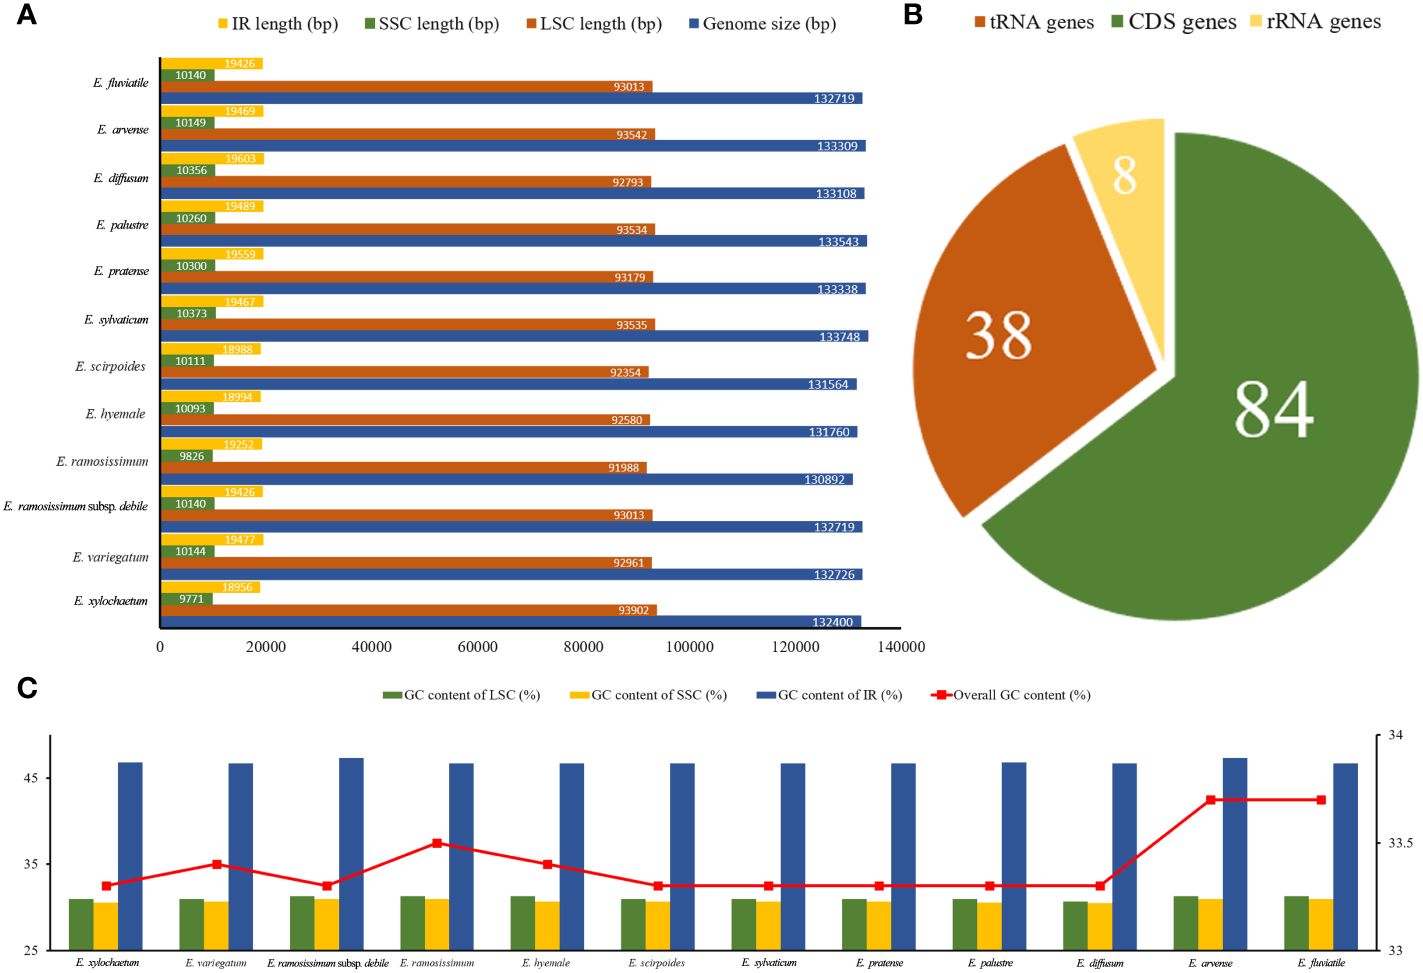
Figure 1 Summary data on the assembly of chloroplast genomes in Equisetum. (A) Size (bp). (B) Number of genes. (C) GC content (%).
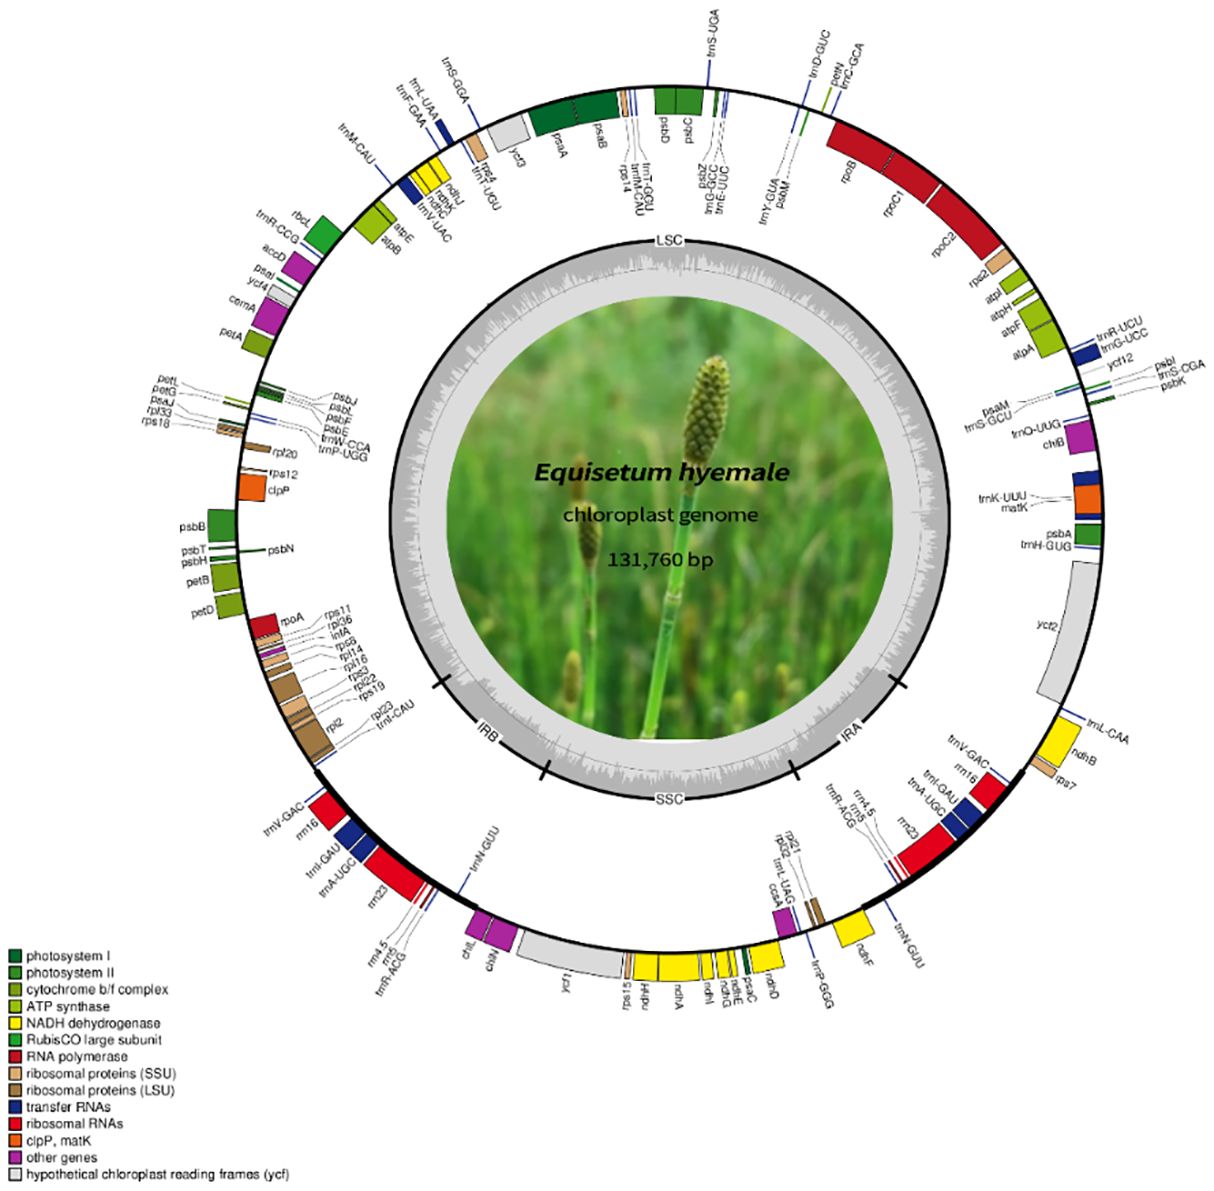
Figure 2 The comprehensive arrangement of the chloroplast genome in Equisetum. The large (LSC) and small (SSC) single copy regions are separated by the inverted repeats (IRa, IRb), represented by bold black lines on the inner circle. Genes located outside the circle undergo transcription in a counter-clockwise fashion, while those inside undergo transcription in a clockwise direction.
A sum of 130 annotated genes was identified within the chloroplast genomes of Equisetum species, encompassing 84 protein-coding genes, 8 rRNA genes, and 38 tRNA genes (Figure 1B). Gene expression regulation is significantly influenced by introns. According to Supplementary Table 2, there were duplicated copies of a combined total of 18 genes present in the Equisetum chloroplast genomes. This includes four rRNA genes (rrn5, rrn4.5, rrn23, rrn16) and five tRNA genes (trnV-GAC, trnI-GAU, trnA-UGC, trnR-ACG, trnN-GUU), each duplicated twice.
3.2 Phylogenetic relationships
To ascertain the phylogenetic connection between Equisetum species, we employed the total chloroplast genomes of 25 various species to reconstruct phylogenetic trees. Physcomitrella patens, Anthoceros punctatus and Marchantia polymorpha were used as outgroups in this analysis. Supplementary Figures 4–6 shows the phylogenetic reconstruction obtained using BI and ML for the chloroplast genome, CDSs, and Gene dataset. Topologies of BI and ML were consistent in reconstruction of similar relationships with strong support in all analyses. The species tree obtained through ASTRAL shows the same topological structure with robust support (Figure 3). Equisetum, with strong support (PP =1.00, BP =100), formed a clade that was further divided into two prominent sub clades, supported by morphological features.
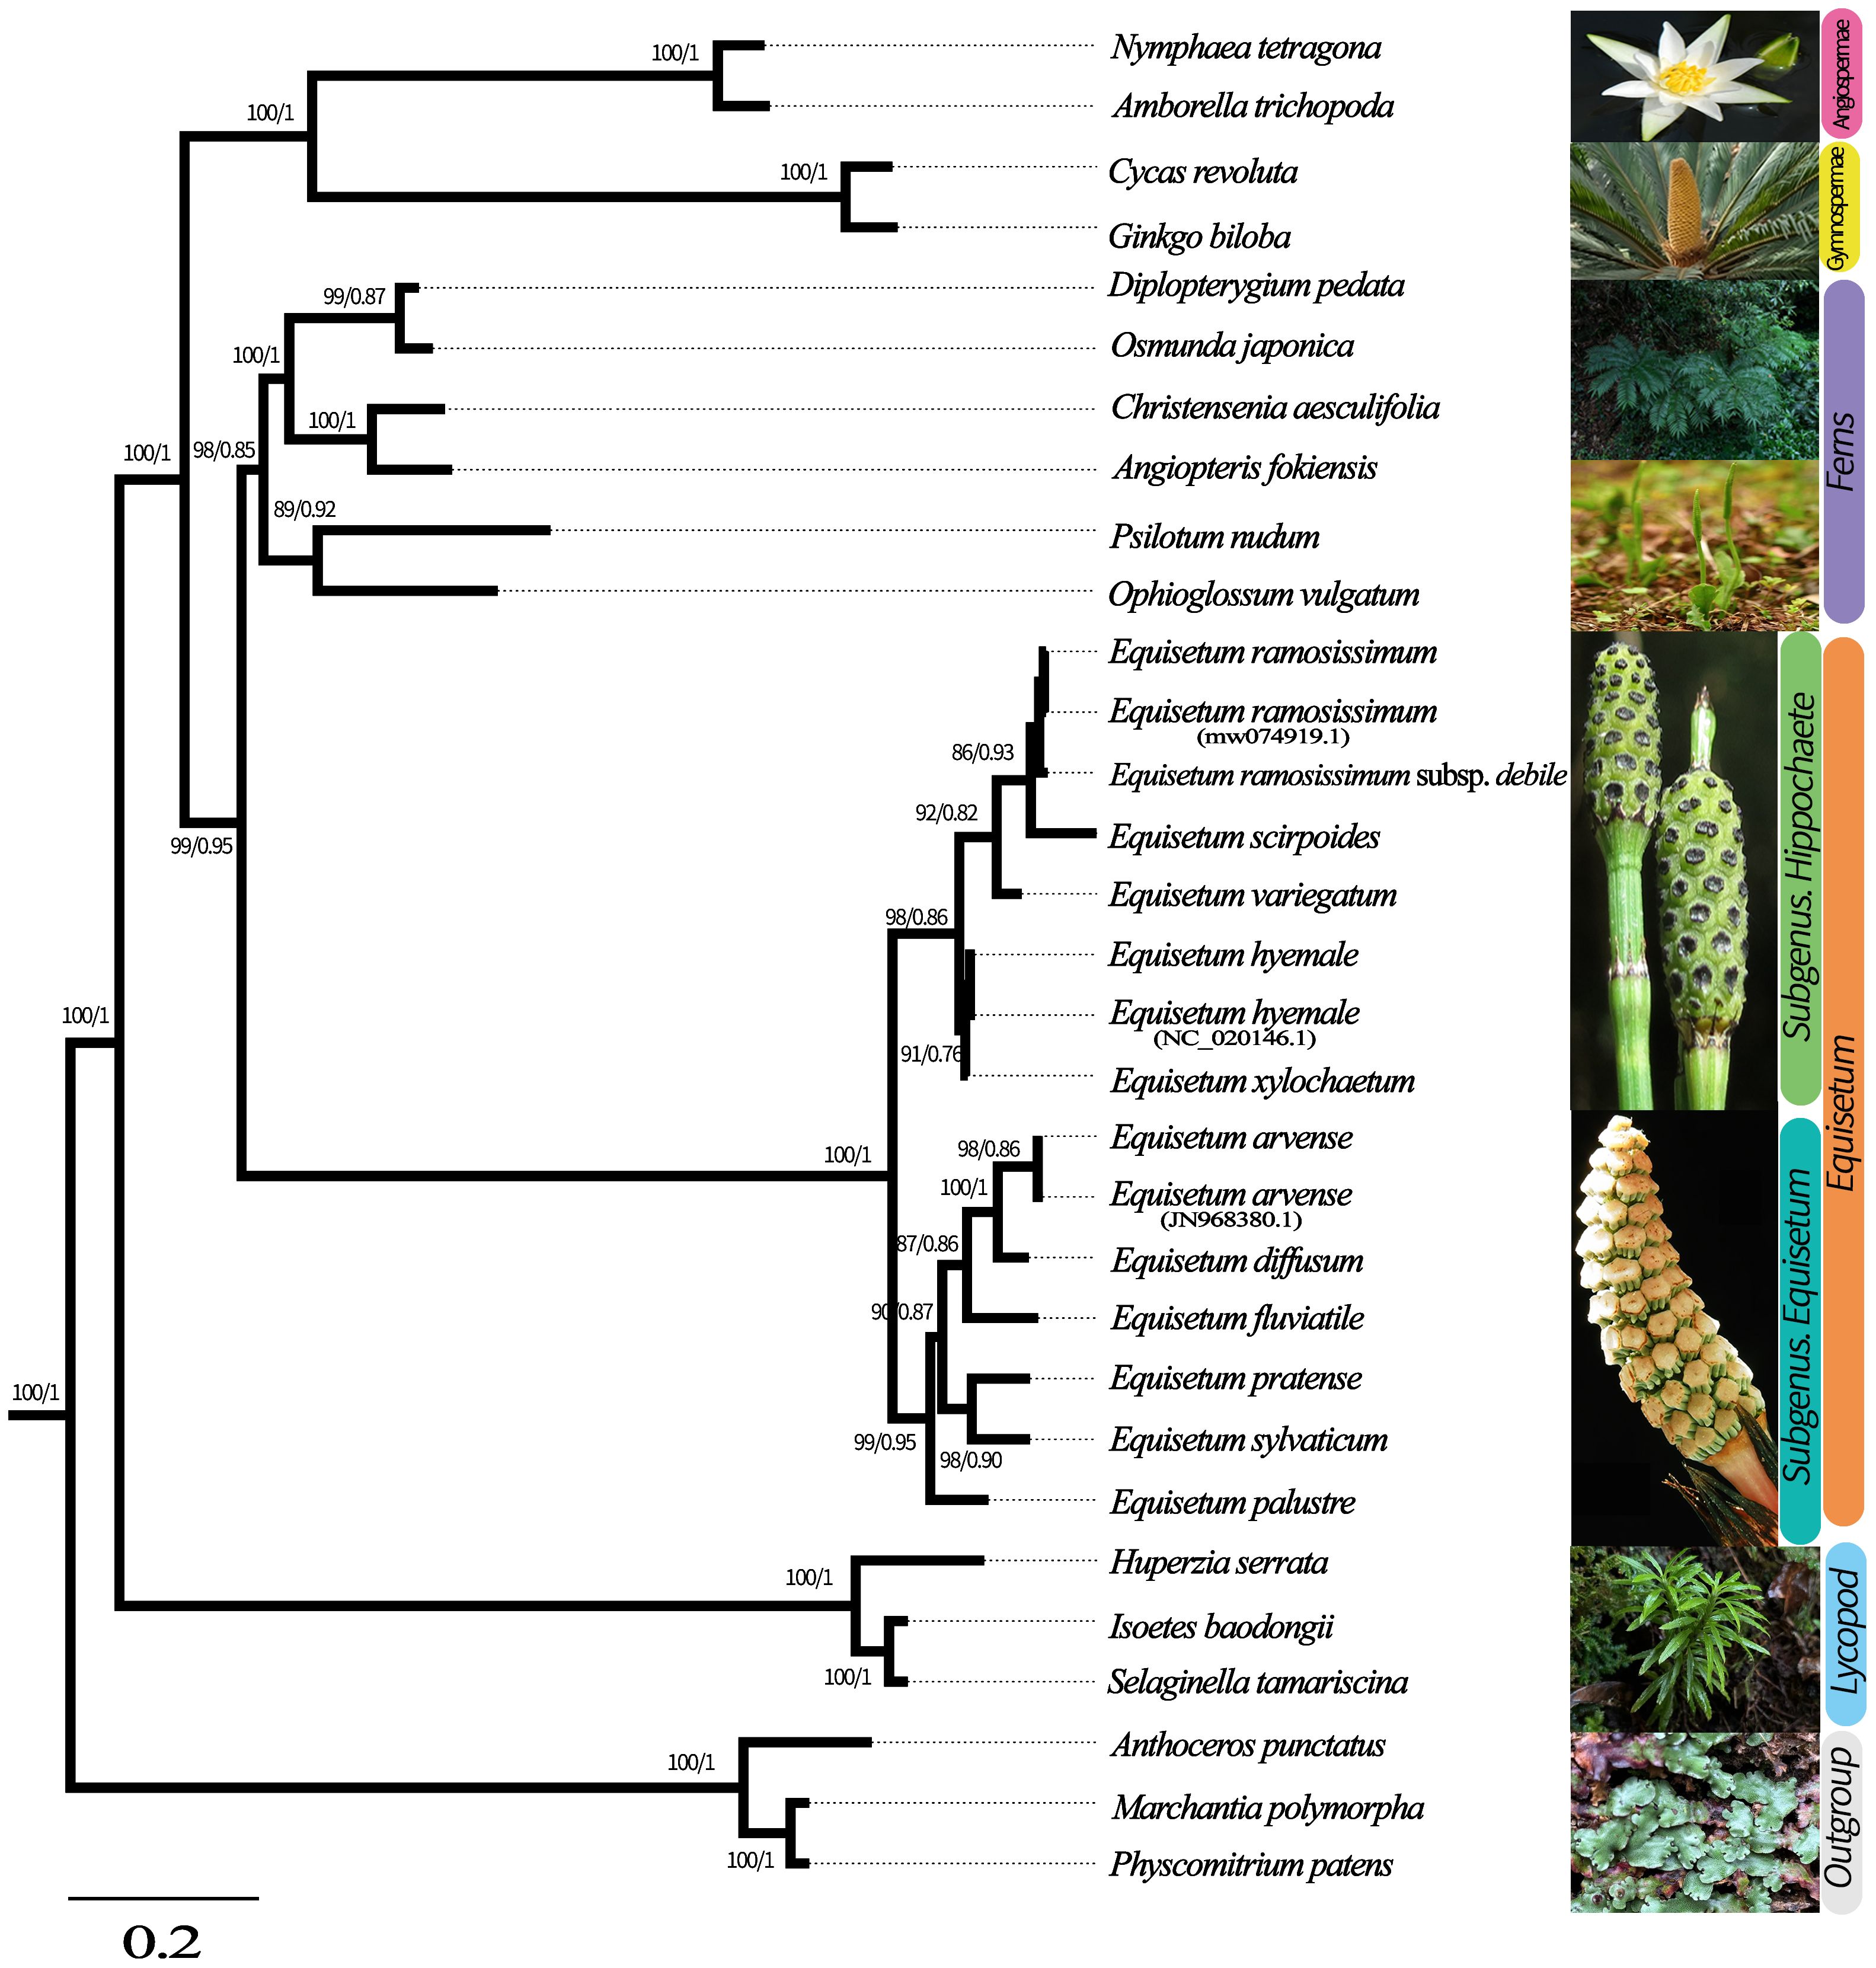
Figure 3 Phylogenetic tree based on Genes, CDSs and whole chloroplast genome concatenated analyses sequences from 28 species. The construction of phylogenetic trees was accomplished by employing both Bayesian inference (BI) and maximum likelihood (ML) methodologies. To present the level of support above the branches, we showcase Bayesian posterior probabilities (PP) and bootstrap percentages obtained from maximum likelihood analyses (BP).
In the subgenus Equisetum, a clear distinction can be observed between E. palustre (supported by robust evidence, BP = 98, PP = 0.90) and the other species in the subgenus Equisetum (supported by strong evidence, BP = 100, PP = 1.00). Throughout the analyses, the relationship as sister species between E. diffusum and E. arvense consistently emerged, albeit with limited support (BP = 90, PP = 0.87), whereas the in E. pratense and E. sylvaticum formed a highly supported cluster (BP = 98, PP = 0.86). In subgenus Hippochaete, the subsequent clade exhibits E. xylochaetum and E. hyemale as sister species with robust support (BP =92, PP = 0.82). E. ramosissimum subsp. debile exhibits ambiguity in distinguishing it from E. ramosissimum.
3.3 Molecular clock analysis
According to the findings from BEAST analyses (Figure 4). The separation between Lycopods and ingroup Ferns most likely happened around 425 million years ago during the Devonian period (with a 95% highest posterior density of 323.6–426.8 million years ago). On the other hand, the separation between Ophioglossaceae, Psilotaceae, and Equisetum probably occurred around 324 million years ago during the Viséan age, which is part of the Middle Mississippian period in the Early Carboniferous era. During the Early Cretaceous period, the age at which all the existing Equisetum species originated was approximately 137 million years ago (Mya). This coincided with the common ancestor separation of subgenus Hippochaete and Equisetum. The coronal nodes of each subgenus are estimated to have formed during the Late Cretaceous period: around 80 Mya (ranging from 62.8 to 128.1 Mya) for subgenera Equisetum and about 72 Mya (ranging from 66.2 to 87.3 Mya) for subgenus Hippochaete. It was found that subgenus Equisetum exhibited earlier divergences among its major clades compared to subgenus Hippochaete. In particular, Equisetum underwent two splits before the Eocene era, while the primary divergences in Hippochaete took place from the Eocene to Miocene intervals. Nonetheless, it is likely that the most of variations among current Equisetum taxa originated quite recently, throughout the Middle to Late Miocene and extending into the Pliocene period.
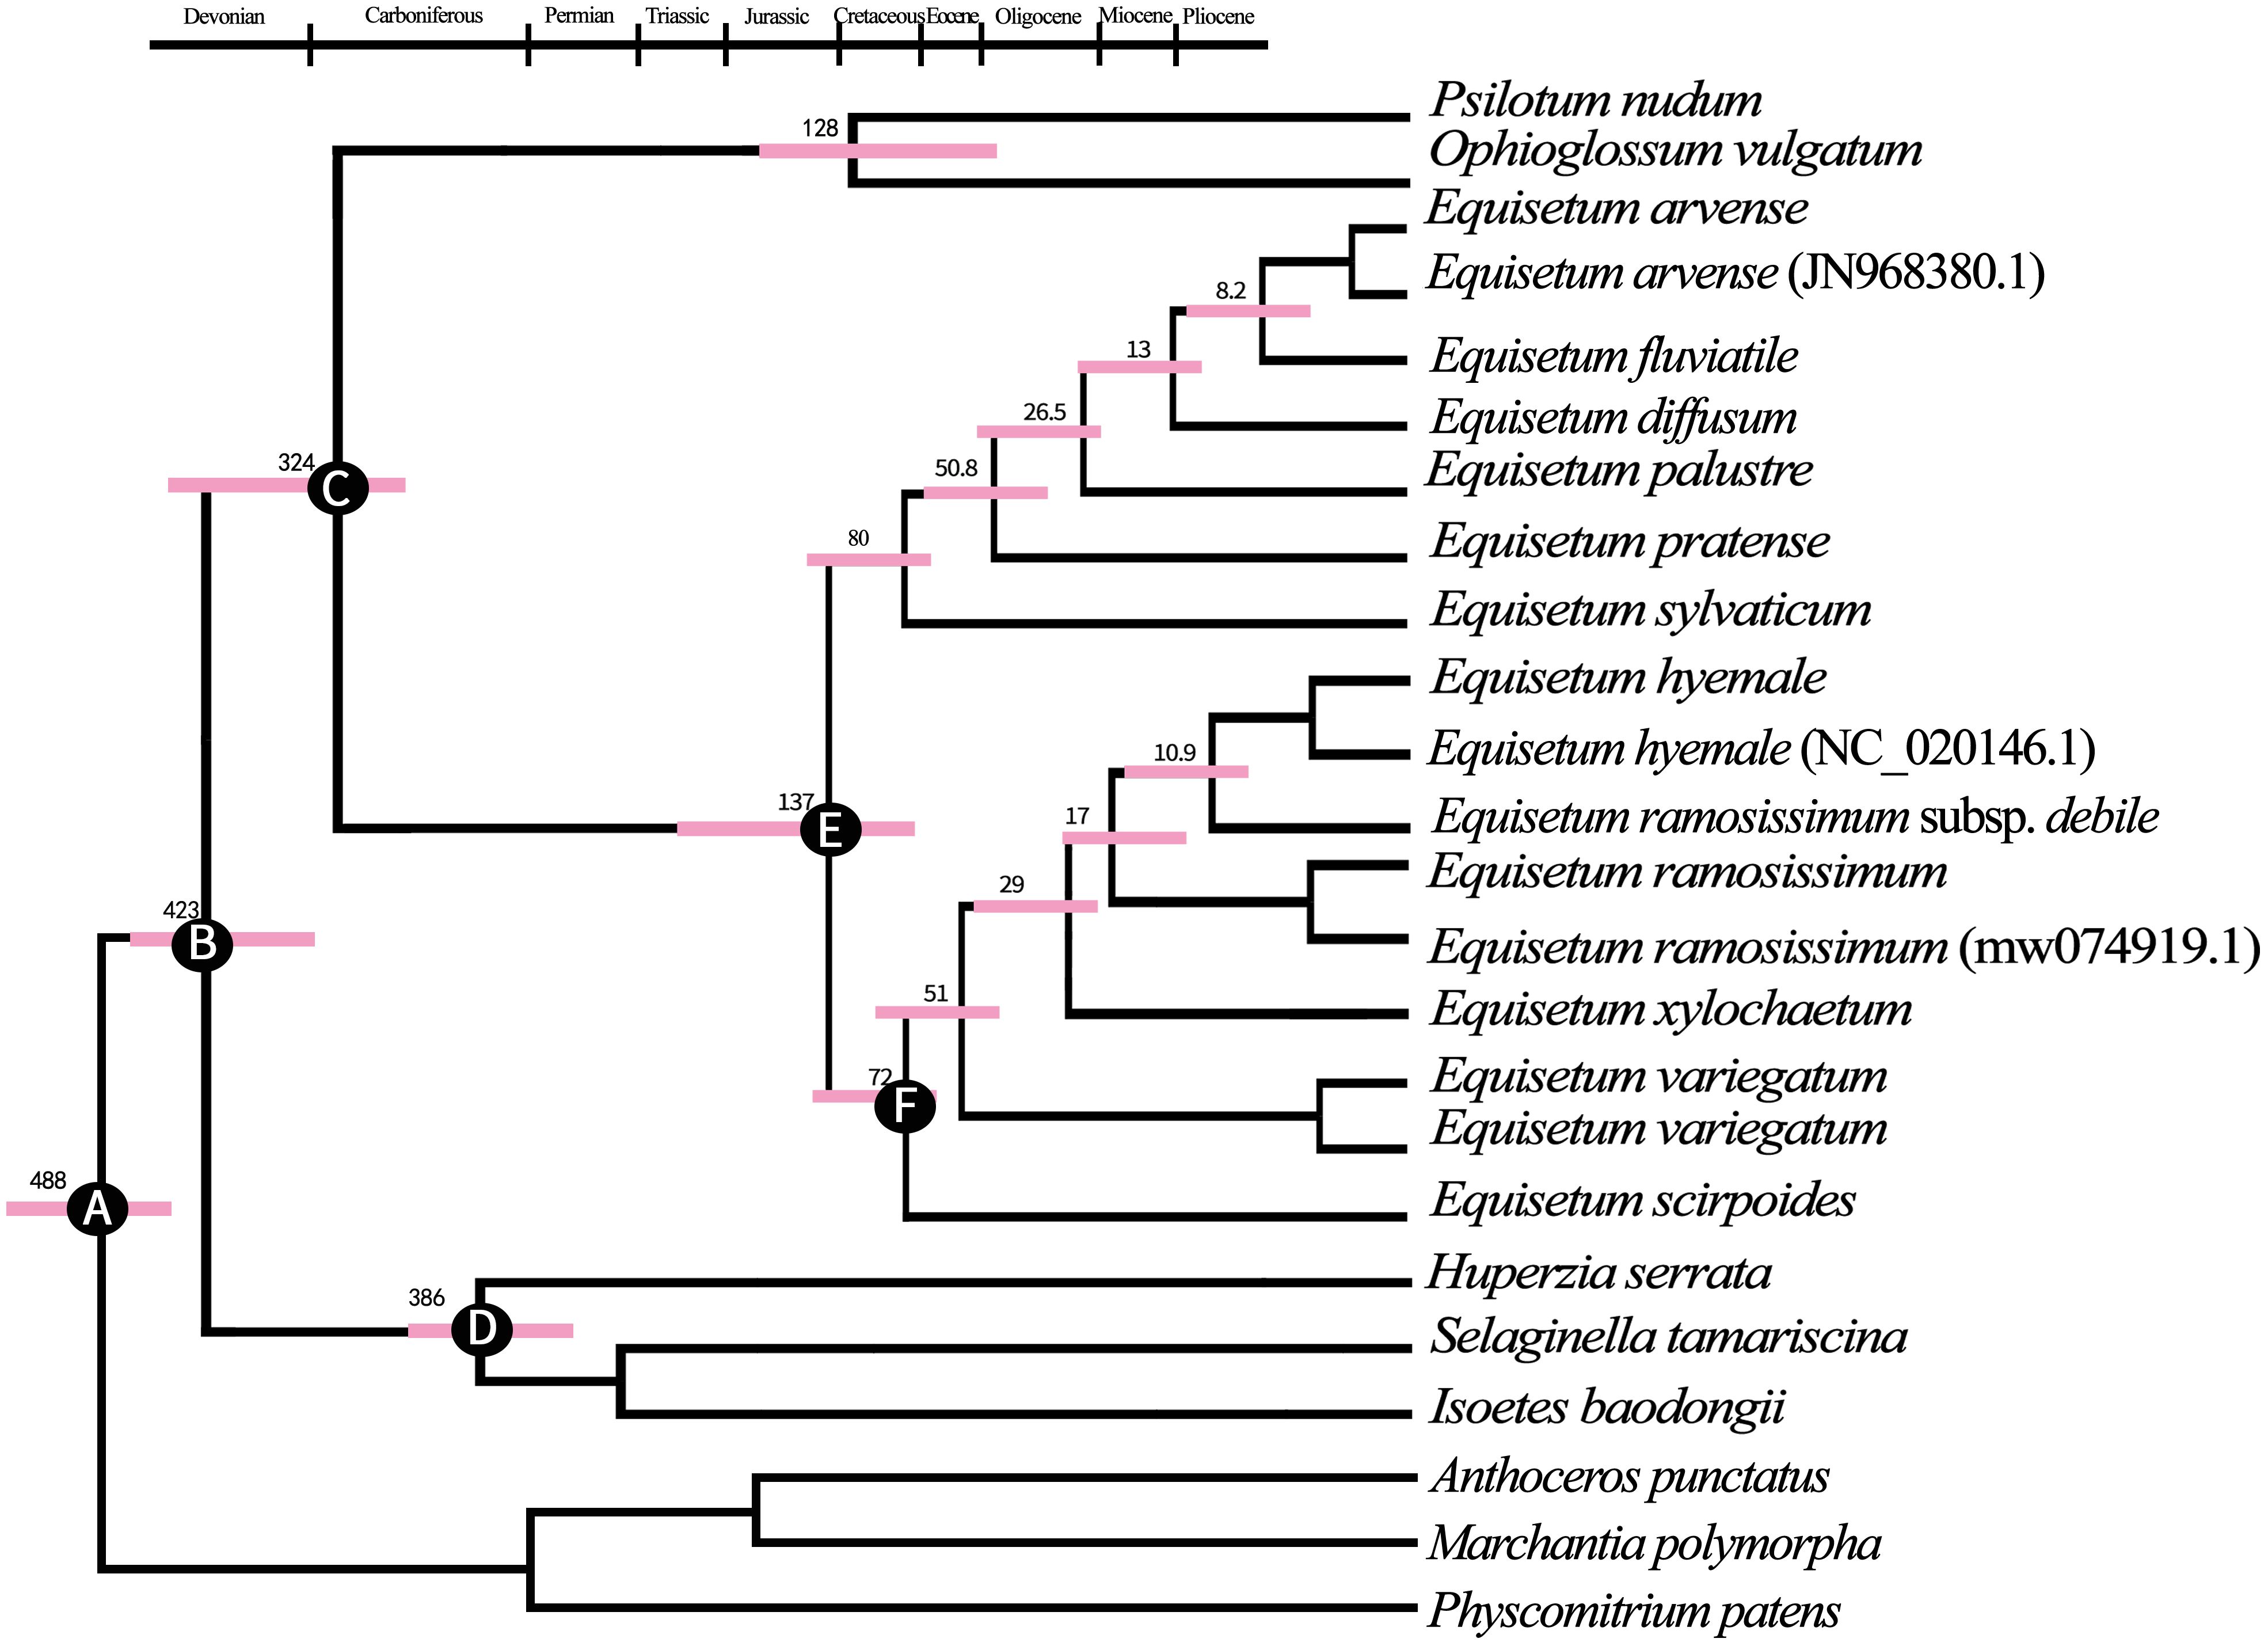
Figure 4 The maximum clade credibility tree of Equisetum was constructed using the BEAST method, based on the chloroplast genome sequences. This tree provided information on the mean ages and 95% highest posterior density (HPD) intervals for the node ages. (A) Secondary calibration 488.0 Mya (B) Fossil calibration 429.0 Mya (C) Fossil calibration 325.0 Mya (D) Fossil calibration 386.0 Mya (E) Fossil calibration 136.5 Mya (F) Fossil calibration 72 Mya.
3.4 Repeat sequence analysis and simple sequence repeats (SSRs)
In the chloroplast genomes, all anticipated lengthy patterns were retrieved, comprising 757 repeats as forward direction, 241 as reverse direction, 95 as complementary repeats, and 868 as palindromic repeats (Figure 5A). Among these patterns, A. trichopoda demonstrated the greatest count of long repeats, totaling to 90. In contrast, E. hyemale had the fewest long repeat sequences, with a count of 64. In order to explore the obvious genetic changes among Equisetum species, we conducted SSR analysis. Using the GMATA analysis, a comprehensive examination revealed that chloroplast genomes harbored a total of 2704 SSRs. As depicted in Figure 5B, the SSRs were primarily found in the LSC and SSC regions. Notably, with the number of SSRs in an individual species ranging from 67 (E. hyemale) to 134 (N. tetragona), with an average of 108 (Figure 5C). The significance of gene variation could potentially rely more on single nucleotide repeats compared to other forms of SSRs. Furthermore, only E. ramosissimum and E. ramosissimum subsp. debile chloroplast genomes revealed the presence of pentanucleotide and hexanucleotide repeats. The dominant SSRs in these genomes were single nucleotide repeats, indicating a bias towards A/T bases in the composition of SSRs.
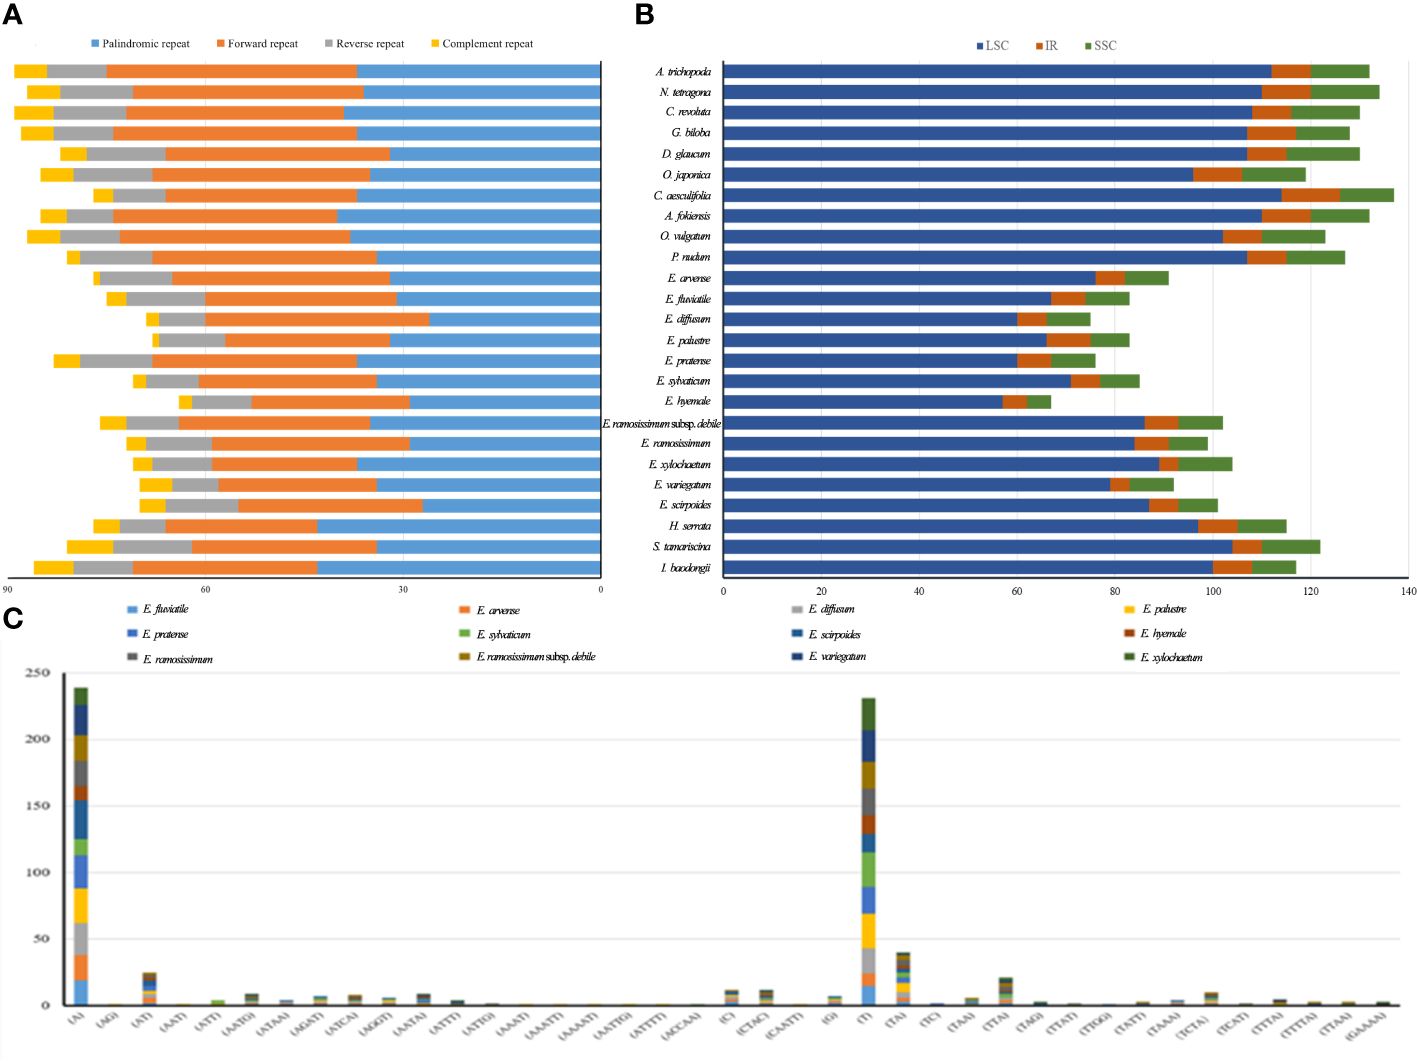
Figure 5 The classification and distribution of SSRs in the chloroplast genomes of Equisetum. (A) The difference of repeated sequence in chloroplast genomes. (B) Occurrence rate of SSRs. (C) Count of identified SSR motifs across various types of repeat classes.
3.5 The types of chloroplast genome mutations
Dnasp v5.10 was employed to enumerate the frequencies of substitution, insertion/deletion, and inversion mutations that transpire in the chloroplast genome, of a dozen Equisetum species. The analysis disclosed a total of 6,492 occurrences of mutations within the chloroplast genome sequence of Equisetum. Among these, there were 1,953 instances of insertion/deletion, 49 occurrences of inversion, and 4,490 instances of substitution. The extent of the indels varied from 1 to 347 bp. Predominantly, the indels took place in IGS regions (constituting 68% of the events), while 24% occurred in CDS regions, and a mere 8% were observed in Intron regions (Figure 6A). A total of 4,985 mutations were found in the LSC region, including 1,523 insertion/deletion events, 36 inversion events and 3,426 substitution events. The mutation rate in the LSC region was 5.50%. A total of 646 mutations occurred in the IR region, including 196 insertion/deletion events, 8 inversion events and 442 substitution events. The mutation rate of the IR region was 1.32%. A total of 861 mutations occurred in the SSC region, including 234 insertion/deletion events, 5 inversion events and 622 substitution events. The mutation rate in the SSC region was 7.23% (Figure 6B).
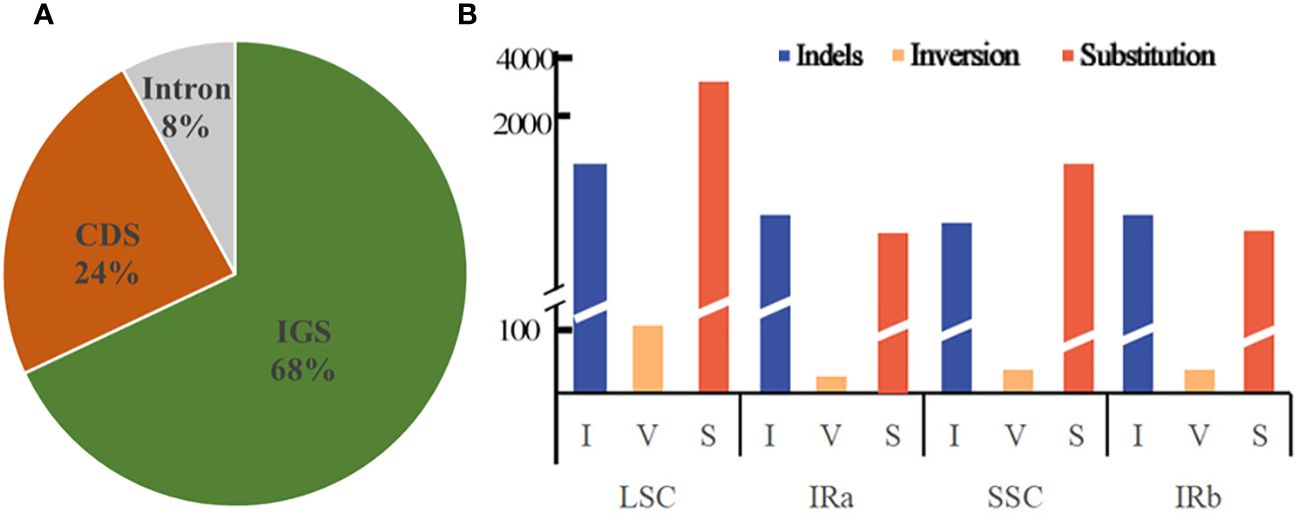
Figure 6 Forms of mutation in the Equisetum chloroplast genomes. (A) Location of the all indels from 12 species. (B) Number of indel, inversion and substitution sequences in the chloroplast genomes.
3.6 IR contraction and expansion
In this study, the variation of LSC, SSC and IR region boundaries of 25 chloroplast genomes was compared and analyzed with Huperzia serrata as a reference (Figure 7). Although the chloroplast genome size and structure of Equisetum species were highly conserved, the IR/SC boundary showed some differences among species due to the contraction/expansion of IR. The LSC/IRb boundary was slightly contracted. Excluding E. xylosechaetum, were found to have the N4K5 and rpl23 genes located at the junction of LSC/IRb. Additionally, the trnL gene was situated at a distance of 65-100 bp from the LSC/IRb boundary. In all species, the LSC/IRb of the chloroplast genome of E. variegatum exhibited the presence of the rpl2 gene. The ndhF gene, with varying lengths from 1,507 to 2,232 bp, contained the IRb/SSC in all species. The truncation length of IRb was between 127 and 725 bp. In all Equisetum the chlL was found at the SSC region, precisely at the junction of SSC/IRa, with a distance of 1-18 bp from the SSC/IRa. But the rpl21 was present in the SSC region of Huperzia serrata, it was absent in Equisetum. At the IRa/LSC of all Equisetum, the rps7 was located at 464-565 bp of LSC.
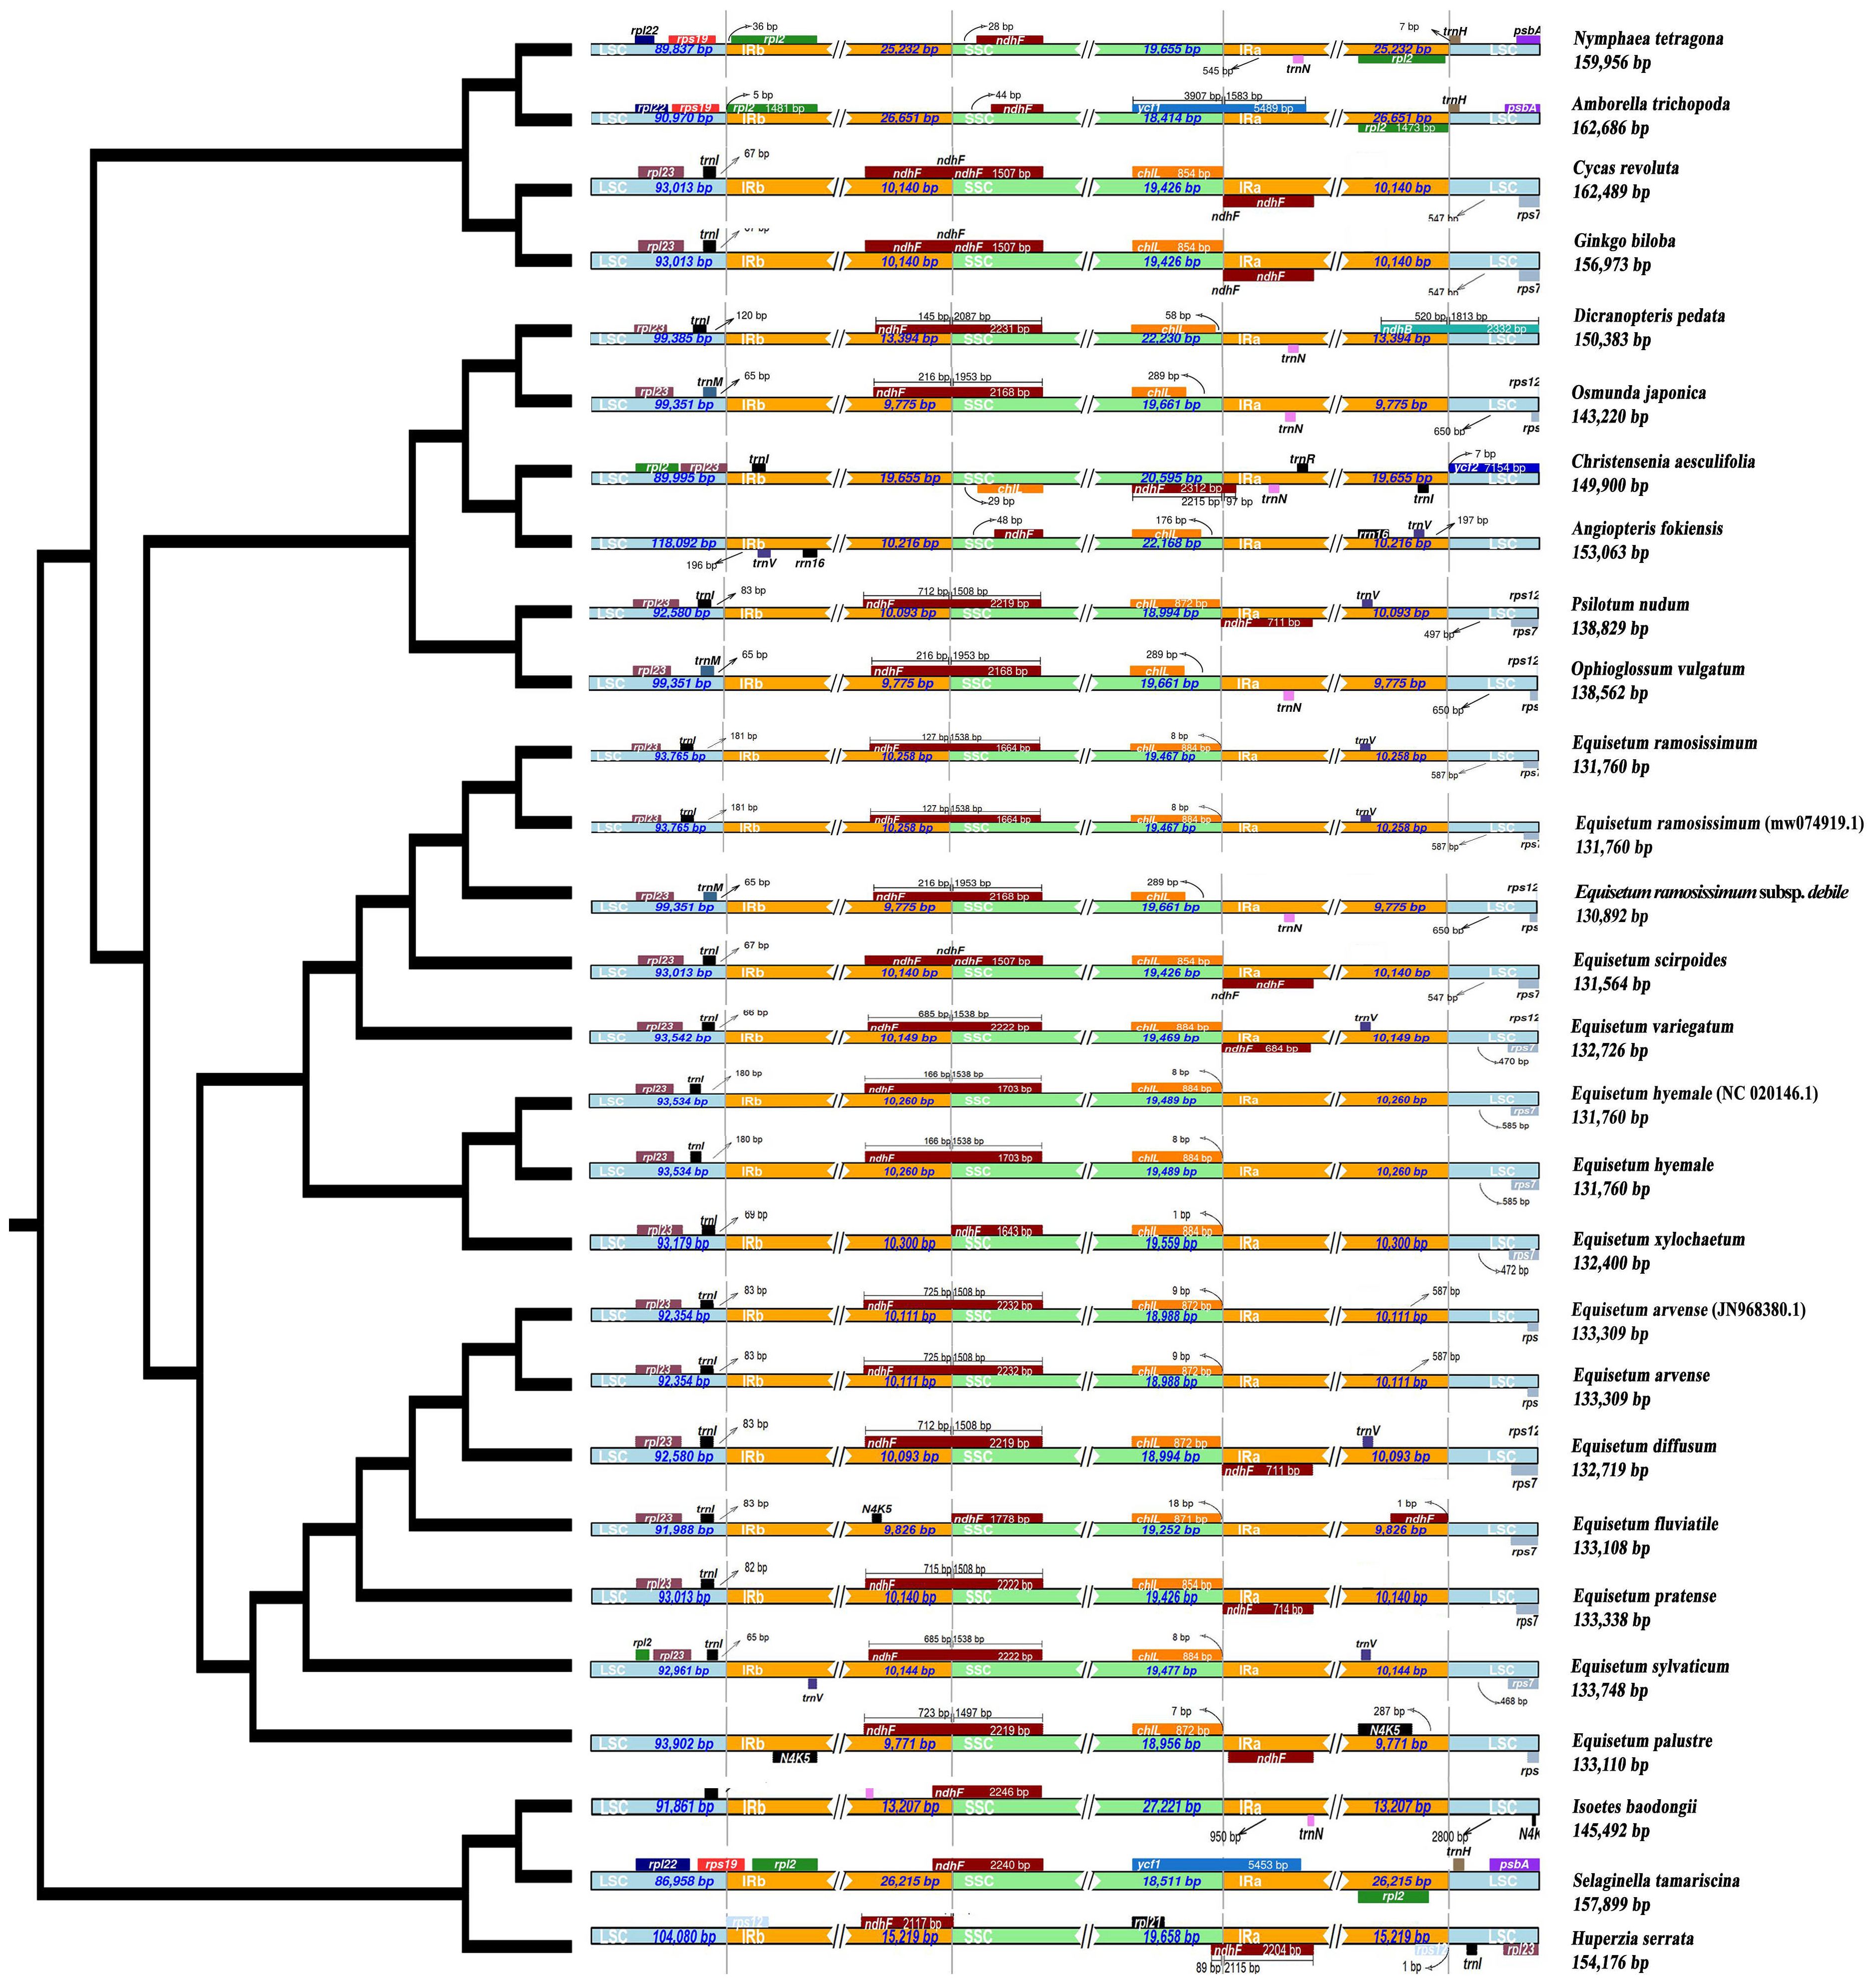
Figure 7 Depicts the comparison among the border regions of 25 distinct species chloroplast genomes. Compare the boundaries of large orders (LSC), small single copies (SSC), and the border between the reverse repetition (IR) region.
3.7 Identification of variability hotspots
By analyzing the chloroplast genomes of 12 distinct species, the mVISTA tool was utilized to identify regions of high variability, referencing E. xylochaetum as a reference. The findings revealed that while the gene order of the 12 Equisetum species remained largely consistent, there were significant differences in sequence composition among various regions including ycf2, psbA, matK, rpoc2, rps14, ycf3, ndhK, ycf4, ndhF, ycf1, atpH-atpL, rbcL-accD, trnY(GUA)-trnT(GGU), ndhF-rpl32, trnY-trnE, and ndhC-trnV(UAC). Notably, the non-coding sections displayed more pronounced dissimilarity in contrast to the protein-coding sections. The rRNA gene was highly conserved and there was almost no variation in it. In addition, compared with subgenus Hippochaete, subgenus Equisetum has more mutation sites, and the regions with relatively large variation are more likely to be distributed in the intergenic region. (Figure 8B).
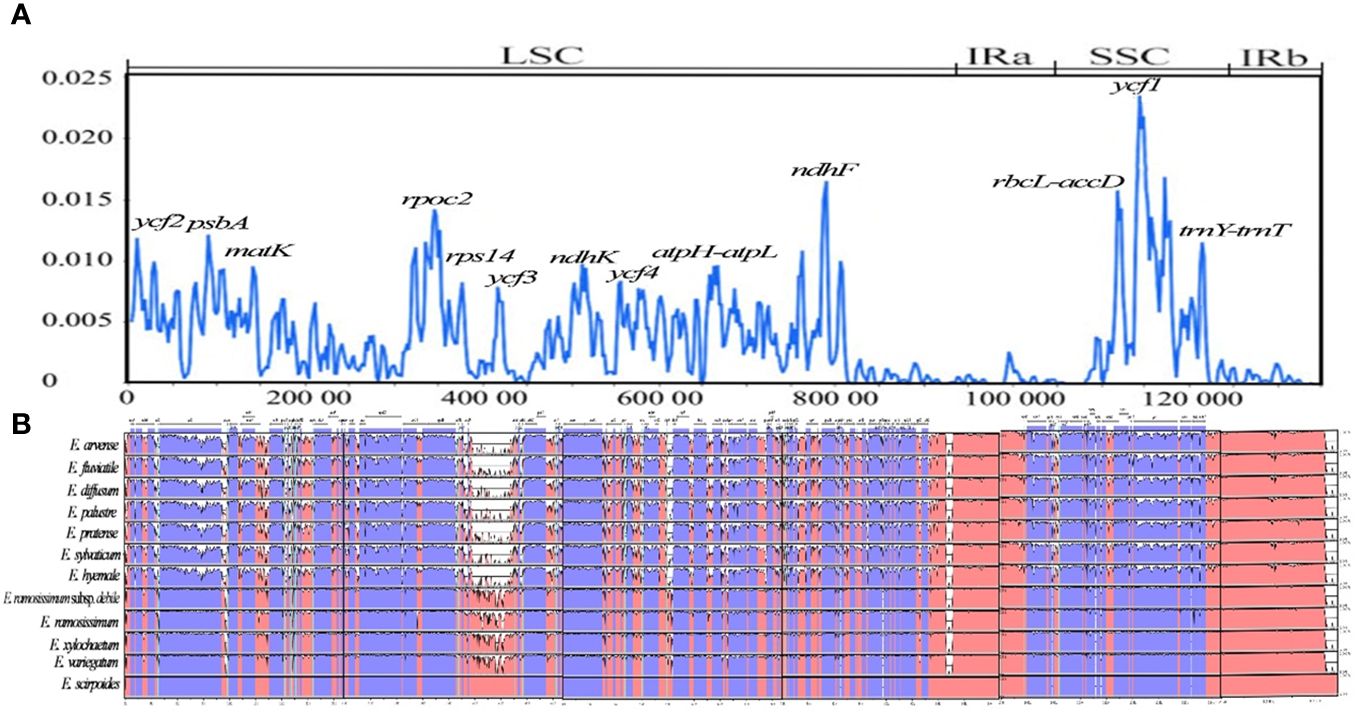
Figure 8 Visualization of comparison of Equisetum chloroplast genome sequences. (A) Assessment of nucleotide variability (Pi) within the chloroplast genome among 12 Equisetum species. (B) Color-coded representation to indicate genomic regions encompassing protein-coding sequences, rRNA, tRNA coding sequences, and conserved noncoding sequences (CNS). The vertical axis presents the percentage similarity, spanning from 50% to 100%.
In our investigation, we have assessed the average divergence of sequences between the 12 chloroplast genomes. The analysis conducted clearly demonstrates the extent of nucleotide variability (Pi) in these specific areas, ranging from 0.1% (rpl32) to 0.23% (trnY-trnE). By utilizing sliding window analysis, we have identified specific locations where mutations occur frequently. These mutational hotspots encompass ycf2, psbA, matK, rpoc2, rps14, ycf3, ndhK, ycf4, ndhF, ycf1, atpH-atpL, rbcL-accD, and trnY (GUA)-trnT (GGU). Notably, these regions display higher Pi (>0.01) within the LSC and SSC. However, it is important to note that no single mutational hotspot was observed in the IR. The difference between the SSC and LSC areas exhibited a significant disparity in comparison to the IR regions, with the π value of the latter being notably reduced and showing a mirror-symmetrical pattern with the SSC at its core (Figure 8A).
3.8 Codon usage analyses
The investigation of the primary factors that influence the development of codon usage inclinations is exhibited (Figure 9; Supplementary Figure 2). The real value of ENC for the majority of genes is below the anticipated value, signifying that the codon usage predisposition of protein coding genes in Equisetum is chiefly influenced by selective pressure, while only a few genes are affected by mutation. The assessment of bias in codon bases can mirror the disparity in the occurrence of A, T, C, and G bases. In the PR2-plot was generated distribution of genes in the four regions is not uniform vertically, with the majority of genes positioned below the midline. Horizontally, there is a higher number of genes on the right side of the midline compared to the left side (Figure 9B). This shows that in the third base the frequency of G position of chloroplast genome codon of Equisetum is greater than that of C, and the frequency of T is greater than that of A, which further indicates that most protein-coding genes in of Equisetum chloroplasts are affected by selection. Neutral mapping can be seen (Figure 9C) in that the distribution range of GC3 value is small (10% - 30%), the distribution range of GC12 value is large (20% - 60%), and Only a few genes are distributed along the line. The linear regression coefficients were between 0.28 and 0.46, indicating that mutation had the largest effect on codon usage preference. Therefore, codon usage bias in Equisetum chloroplasts is mainly affected by selection. The RSCU and △ RSCU values of plants in the Equisetum were calculated, and the results are shown in Supplementary Figure 3. The codons that exhibit high frequency and high expression were defined as the optimal codons for the chloroplast genome of the Equisetum. The optimal codons of plants in the Equisetum mostly end with A and U, with only one codon ending with G.
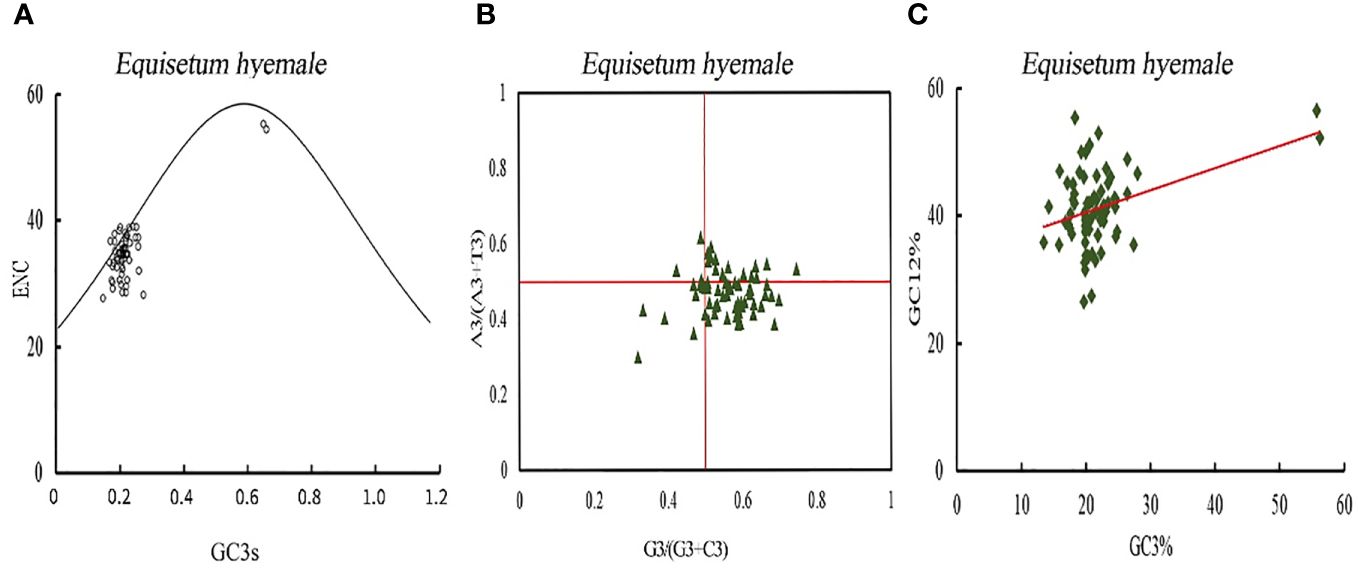
Figure 9 Codon bias analysis of chloroplast genomes of Equisetum. (A) ENC-plot analysis. (B) PR2-plot analysis. (C) Neutrality plot analysis.
3.9 Selective pressure analysis
To gain a deeper comprehension of the progression of plastid genes coding for proteins, an investigation was conducted employing Equisetum as the foreground branches while considering other ferns as the backdrop branches. The examination was specifically aimed at identifying the traces of natural selection using 78 protein coding genes. Notably, the Ka/Ks ratios were found to revolve around 0.2 in Equisetum species. Such outcomes imply that, in terms of the entirety of chloroplast proteins, Equisetum species have experienced more rigorous purifying selection compared to the background branches. Nine of the 78 genes were under selection (>1) (Figure 10; Supplementary Table 3), namely, 2 self-replication genes. The rbcL gene exhibits the highest number of loci that were positively selected. To differentiate, we employed subgenus Equisetum plants as our foreground branches, while subgenus Hippochaete served as the background branches. Among the five genes analyzed (psaM, rps18, rbcL, matK, and ycf2), exclusive sites showing positive selection occurred solely within the subgenus Hippochaete. We also performed the reverse analysis, using subgenus Hippochaete as foreground branches and subgenus Equisetum as background branches. Seven genes (matK, psbD, rbcL, accD, psbH, ndhF and rps18) contained positively selected sites unique within subgenus Hippochaete.
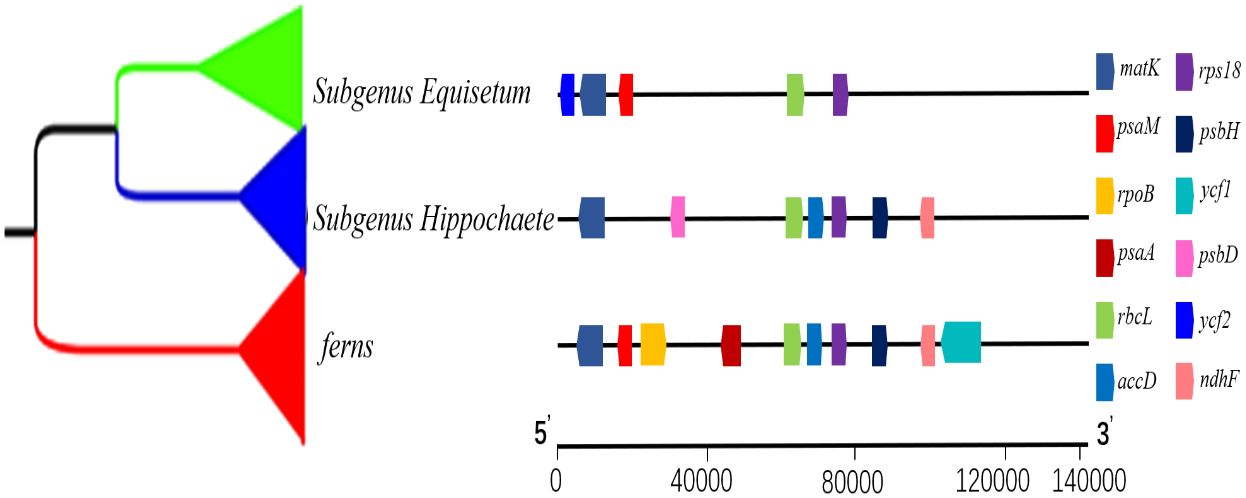
Figure 10 A Pairwise Ka/Ks ratios 12 Equisetum species. The genes of Ka/Ks > 1 from 12 chloroplast genome of Equisetum..
4 Discussion
4.1 Mutational dynamics and genetic diversity of Equisetum chloroplast genome
Equisetum chloroplast genomes displayed remarkable similarity of genome structure, genome order, genome content, and GC content. To gain a deeper understanding of sequence variation in Equisetum, this study identified crucial types of genetic variation in chloroplast genomes, such as nucleotide substitutions, repeats, and indels. Alongside nucleotide substitutions, a total of 2, 704 SSRs, 868 long repeats, and 248 indels were also detected. Plants commonly experience the enlargement and reduction of their chloroplast genome as part of their evolutionary process. The IR regions of E. xylochaetum were discovered to possess the smallest size among all Equisetum chloroplast genomes. Moreover, an extensive analysis revealed that the SC/IR regions of E. xylochaetum exhibited the highest frequency of sequence deletions, implying a potential link between deletions and IR region contraction. Conversely, the LSC region of E. xylochaetum exhibited remarkable elongation in comparison to other regions. Notably, our investigation uncovered a substantial presence of repetitive sequences in the LSC/IR area, underscoring the impact of repeats on the overall size of the chloroplast genome. Hence, it can be deduced that the smaller of the Equisetum chloroplast genome, as compared to ferns, is a result of the influence exerted by repeats and indels on its structural configuration.
Mutation events in the plastid genome are generally randomly distributed. Both eukaryotic and prokaryotic genomes share a remarkable characteristic, which is the simultaneous existence of nucleotide substitutions and indel mutations (Ahmed et al., 2012). Repeat sequences and indel sequences were found to be closely associated with the regions in Equisetum chloroplast genomes that displayed discrepancies. Meaningful correlations were observed in the comparisons made among the three mutation categories, further supporting the theories proposing that mutations are caused by indels and repeats. According to the hypothesis concerning indel-induced mutations, DNA repair is initiated in response to indels, ultimately leading to genetic alterations (Tian et al., 2008). Contrary to this, the hypothesis of repeat-induced mutation proposes that mutations arise from the presence of repetitive sequences instead of indels alone. These repetitive sequences facilitate the halt of replication-fork, leading to the enlistment of error-prone polymerases. As a consequence, this gives rise to the emergence of indels and nucleotide substitution (McDonald et al., 2011). According to our findings the model of indels and substitutions showed the strongest correlation and highest level of statistical significance (Supplementary Table 3). Therefore, we believe that these two hypotheses are not mutually exclusive in the evolution of the Equisetum chloroplast genome, but rather interact to jointly promote the evolution of the Equisetum chloroplast genome. Additionally, the findings implied that through the identification of distributed repetitive or inserted sequences, it might become feasible to anticipate regions characterized by substantial mutation frequencies and ascertain particular sequences conducive to genetic analysis, contingent upon their relative locations.
4.2 Signature of positive selection on chloroplast genome driving adaptation evolution
Notably, in our analysis of the GC content in chloroplast genomes of Equisetum species in comparison to fern species, we observed that Equisetum had the lowest total GC content (<33.9%) (Supplementary Figure 1). G/C base pairs have three hydrogen bonds, which are more stable compared to the two hydrogen bonds of A/T base pairs (Jia et al., 2010). The tRNA and rRNA sequences were considerably rich in GC bases; as a consequence, the IR regions rich in rRNA and tRNA appear to have had higher GC content than the other regions; high GC content in the IR regions rich in rRNA and tRNA appear may drive its stability compared to the LSC and SSC regions. Significant variations in GC content are observed by analyzing the chloroplast genomes of closely related species inhabiting diverse environments. This variability directly affects the amino acid composition of proteins in their specific habitats (Foerstner et al., 2005). Thus, we propose the hypothesis that genes exhibiting lower GC content are more susceptible to transcription compared to those with higher GC content. Equisetum has a lower GC content might be explained by the high level of RNA editing in the organelles (Smith, 2009). It has been reported that fern chloroplast genomes have evolved a higher number of RNA editing events than spermatophyte chloroplast genomes. It has been reported that the high number of C-to-U conversions developed in the early stages of vascular plant evolution (Koichiro et al., 2008). Consequentially, this phenomenon can potentially be elucidated by natural selection it can be inferred that the selective pressure exerted by the distinctive environment inhabited by Equisetum species (damp and dark) has contributed to the overall decrease in GC content within their chloroplast genomes.
The bias of the codon usage in the plant cp genome was an important evolutionary feature for the studies regarding mRNA translation, new gene discovery, and molecular biology (Yang et al., 2014). Previous studies have confirmed that genes tend to choose preferred synonymous codons for specific amino acids rather than randomly distributions (Sorimachi, 2010; Li et al., 2019). Our study showed that genes of Equisetum prefer codons with A/T in the third position, which was consistent with previous studies. There is a certain difference between the actual value of ENC and the expected value of ENC, indicating that natural selection has a significant impact on codons: the uneven distribution of coding genes is used with frequencies T>A, G>C; The main factor affecting the formation of codon preference is natural selection, which is similar to the results of Arabidopsis thaliana and Oryza sativa (Jia and Xue, 2009). It is inferred that the codon preference characteristics of the chloroplast genome of the Equisetum genus are more affected by natural selection pressure than other factors. The greater the positive selection and mutation pressure, the more optimal codons are formed in the genome; On the contrary, the greater the negative selection effect, the less optimal codons there are. Based on the RSCU values of the codons in the chloroplast genome of the Equisetum genus, this study identified only 13 common optimal codons, suggesting that their chloroplast genome codon usage preferences are within the range of purification selection. In the process of protein translation, the optimal codon can effectively improve its speed and accuracy, and the preference for the optimal number of codons is mainly influenced by strong positive selection (Paul and Malakar, 2018; Li et al., 2021).
Equisetum are present in widely distributed around the world and within heterogeneous ecological niches (Harrison, 2005). This suggests the occurrence of adaptive radiation, which may have left a selection footprint on the chloroplast genome. During our analysis were subjected to positive selection of 12 plastid genes (rpoB, ycf1, psaA, psaM, psbH, psbD, rbcL, ndhF, matK, accD, rps18 and ycf2), indicating that they may have contributed to environmental adaptation in Equisetum. Remarkably, the photosynthesis-related gene rbcL encoding the RuBisco’s large subunit, which displayed particularly pronounced indications, is commonly under positive selection in terrestrial plants but not in water plant (Li et al., 2022), possibly due to more unstable thermal regimes on land (Kapralov and Filatov, 2007). In this study, we collected Equisetum from habitats with diverse sunlight exposure, and thus rbcL may be probably in response to adaptive evolution associated with sunlight and thermal conditions. An extremely significant positive selection site at the loci in matK of Equisetum. The gene matK is transcribed from the sole intact plastid group intron ORF localized, matK has lost do mains assigned to a reverse transcriptase and endonuclease function (Liere and Link, 1995; Wicke et al., 2011). The ndhF gene has been proposed to regulate the redox state, thereby maintaining or enhancing the photosynthetic efficiency of certain crops when subjected to extreme temperatures and changes in light intensity (Martín et al., 1787). Consequently, positive selection acting upon this gene may have contributed to the acclimatization to various environmental stressors (like reduced levels of CO2 partial pressure) and shifts in climate conditions that Equisetum has experienced (Hermida-Carrera et al., 2017; Jiang et al., 2018; Yao et al., 2019). Due to the extremely high Ka/Ks value of ycf2 gene, it is a valuable resource for future research on the adaptive evolution of Equisetum. The ycf2 has become a useful gene for asses sing sequence variation and evolution in plants (Huang et al., 2010). Psa and psb genes are primary members of photosystem which may evolve rapidly in some Equisetum species. Additionally, there is proof indicating that certain subgenus Equisetum species have varying levels of transpiration, with E. fluviatile, the most water-loving species, exhibiting the greatest rates of transpiration (Spatz et al., 1998). In the subgenus Equisetum, stomata are located at the identical level as the epidermal surface, whereas in the subgenus Hippochaete, stomata are positioned beneath the epidermal surface. Considering the close correlation between hydraulic conductivity and stomatal conductance (Marsh et al., 2000), it is probable that hydraulic “bottlenecks” exist at the nodes of Equisetum stems. These bottlenecks restrict water transport, ultimately leading to a decrease in stomatal conductance. The positive selection genes also play crucial roles in chloroplast protein synthesis, energy transformation and regulation, and photosynthesis. These results indicate the diverse adaptive evolution in plastid genes of Equisetum. Among the photosynthesis related genes (ndhF, rbcL, ycf1, and ycf2) contained positively selected sites unique in most vascular plants. In addition, accD, ycf1 and ycf2 had the most accelerated rates as detected in plastomes of Dryopteris goeringiana and Dryopteris crassirhizoma (Fan et al., 2021). The positive selection in the five genes probably help Equisetum efficiently capture light energy to produce adequate nutrition to adapt to their growth and development under extreme and variable environmental conditions.
4.3 The divergence hotspot regions and candidate DNA barcoding of Equisetum
The universal DNA barcodes have lower divergence and poor discriminatory power. The mutation events in the chloroplast genome are not universally randomly distributed within the sequence and are concentrated in certain regions forming the “hotspot” regions (Dong et al., 2012). Divergence hotpots in chloroplast genomes have been widely utilized for delimitation of closely related species of plants (Bi et al., 2018; Dong et al., 2021). The highly variable hotspots regions identified have potential as candidate markers or DNA barcodes for inferring the phylogeny of Equisetum. The cp genomes of Equisetum species are generally consistent in overall gene content and arrangement. However, comparative genome analysis using mVISTA and nucleotide variability (Pi) revealed relatively conserved sequences among Equisetum species. Notably, the variability observed in the IR exhibited considerably less disparity compared to that in the SSC and LSC within the Equisetum chloroplast genome. All regions were found in the single-copy and intergenic regions. As observed in other vascular plant, the IR and coding regions exhibited lower levels of divergence than the single copy and non-coding regions (Lu et al., 2016; Yin et al., 2018; Wu et al., 2021). This result was consistent with that in fern plastomes (Wei et al., 2017).
This study identified divergence hotspot regions (ycf2, psbA, matK, rpoc2, rps14, ycf3, ndhK, ycf4, ndhF, ycf1, atpH, atpL, rbcL, accD, and trnY (GUA)-trnT (GGU)) within the chloroplast genome of Equisetum. MatK is a useful biomarker for phylogenetic analysis in plant classification because its sequence evolution is faster than that of other chloroplast genes (Selvaraj et al., 2008). AccD IGS and ycf1 CDS stood out as the most distinct areas when considering their uniqueness. These two regions encompassed the largest tandem repeats (TRs) and served as the hypervariable regions and arrangement endpoints of Equisetum. We examined the characteristics of the ycf1 gene across species of Equisetum. The ycf1 genes exhibited a remarkable increase in length, with widespread insertions of TRs. Potential rearrangement endpoints were also their location. The accD gene and the surrounding sequences exhibited significant expansion as a result of TR insertion. Furthermore, in Equisetum the arrangement of its surrounding genes and the insertion position of TR on accD exhibited significant dissimilarities. Consequently, it would be more appropriate to employ the ycf1 and accD gene region as promising candidates for the DNA barcodes used in the classification and phylogeny analysis of the Equisetum. The highly mutable accD gene sequence, which was also utilized as a potential DNA barcode of Quercus (Liu et al., 2019), and the ycf1 gene, reportedly serving as a potential DNA barcode in the Papaveraceae (Parks et al., 2018), were identified. Additionally, Liu et al. (2017) discovered that ycf1 can as a distinctive DNA barcode for Equisetum. However, this marker was not extensively used in plant phylogeny and DNA barcoding.
4.4 Phylogenetic analysis and divergence time in Equisetum
Previous research investigating the phylogeny of the Equisetum genus, with the utilization of a limited number of markers derived from nuclear and plastid DNA, have reported instances where the relationships among species within certain clades of the Equisetum genus diverge between chloroplast and nuclear gene markers (Kenrick and Crane, 1997). The insufficiency of the phylogenetic method’s limited number of markers in determining Equisetum relationships necessitates the inclusion of more plastid genomes and additional molecular information from other genetic compartments. This study is the first to provide the phylogenetic backbone for Equisetum using chloroplast genomes. The presented phylogenetic relationships here validate the monophyly of Equisetum and demonstrate a distinct division of the genus into subgenera (Equisetum and Hippochaete). This finding aligns with previous investigations on morphology and molecular analyses employing the supermatrix comprising of four plastid markers (Christenhusz et al., 2019). Among published analyses to date, Equisetum has been inconsistent in position. However, given that Equisetum has been shown to be sister to all other ferns in some analyses (Testo and Sundue, 2016; Shen et al., 2018). This is consistent with our research findings Equisetum based on four datasets (chloroplast whole genome, chloroplast genome shared CDSs dataset, Gene and chloroplast whole genome, CDSs and Gene concatenated analysis). Intended to explore and compare the effects of molecular markers based on different genetic backgrounds on phylogenetic structures, in order to explore more authentic and comprehensive interspecific relationships. The phylogenetic trees constructed in all datasets have clearly displayed the phylogenetic relationships, with consistent topological structures across the larger evolutionary branches and high support rates. According to the topological structures, the generalized pteridophyte can be divided into Lycophytes, Equisetaceae and ferns. The Equisetum can be clearly divided into two large evolutionary branches subgenus Hippochaete and Equisetum, and is supported by morphological features.
Here, the comparative genomic analyses have revealed that Equisetum contained diverse genomic variations. The phylogenomic study showed that Equisetaceae was monophyletic. Our molecular clock estimates of divergence place the origin of the Equisetum lineage in the Early Carboniferous (~342 Mya). Equisetum is clearly one of the most evolutionarily isolated and possibly the oldest extant vascular plant genus (Husby, 2013; Vanneste et al., 2015). Molecular dating indicated that the emergence of Equisetum occurred around 137 million years ago (Mya), as supported by a 95% highest posterior density (HPD) interval ranging from 95.8 to 177.0 Mya. The ferns originated approximately 128 Mya, and molecular dating confirmed that Equisetum is sister all ferns. Shen et al. (2018) conducted an extensive analysis using transcriptome sequencing data, which yielded results that are overall consistent with our findings. The subgenera of Equisetum, despite being sister taxa, exhibit considerable genetic divergence (Figure 3; Supplementary Figures 4–6). Moreover, distinctive dissimilarities in both morphology and ecological preferences exist, underscoring their recognition at the subgenus level. The crown group age of subgenus Equisetum was approximately 80 Mya (95% HPD, 62.8-128.1 Mya) and that for subgenus Hippochaete was approximately 72 Mya (95% HPD, 66.2-87.3 Mya) (Figure 4). The timing obtained for the division of the main clades closely corresponds to the results of Zamaloa et al. (2022), who solely relied on the ages of the fossil species incorporated to ascertain the time of divergence.
The results support that Equisetaceae and ferns are sister groups, and the chloroplast genomes of Equisetaceae and ferns have very low similarity with the chloroplast genomes of ferns. Through comparison, it is found that the similarity of chloroplast genomes of Equisetaceae and ferns is as low as about 57%, and the chloroplast genomes of the two are significantly different in terms of gene number and gene order, indicating that the chloroplast genomes of the two have different evolutionary patterns. Combined with the phylogenetic analysis of chloroplast genomes, it is supported that Equisetaceae and ferns are sister groups.
5 Conclusions
Twelve different Equisetum species and thirteen other vascular plants species analyzed in this study. Based on the findings, it was observed that Equisetum chloroplast genomes exhibited analogous fundamental structure, size, gene number, order, and functional arrangement. However, it is worth noting that Equisetum chloroplast genomes demonstrated a comparatively lower GC content in contrast to its fern counterparts. Additionally, we observed the identification of highly variable nucleotide hotspots within mutational regions, indicating the potential use of the ycf1 and accD genes as species identification and taxonomy markers. The presence of inverted repeat regions and simple sequence repeats regions contributes to significant variations in genome size among divergent genes. In addition to the presence of highly diverse genes, repeat and indel-induced mutations contribute significantly to the diversity of Eqiusetum chloroplast genomes. Utilizing the complete cp genomes dataset, we constructed an evolutionary tree and conducted molecular dating analyses. These evaluations not only emphasized the considerable phylogenetic divergence between Equisetum and ferns but also provided robust evidence supporting the designation of the pteridophyte are divided into Lycophytes, Equisetaceae and ferns. In summary, our investigation presents a novel framework that enhances comprehension of species delimitation, genome evolution, and phylogenetic associations within Equisetum.
Data availability statement
The data presented in the study are deposited in the GenBank repository, accession number PP501410-PP501411.
Author contributions
WS: Data curation, Formal analysis, Software, Validation, Visualization, Writing – original draft, Writing – review & editing. ZW: Validation, Visualization, Writing – review & editing. YG: Investigation, Writing – review & editing. TW: Investigation, Writing – review & editing. BL: Project administration, Supervision, Writing – review & editing. YY: Funding acquisition, Project administration, Supervision, Validation, Writing – review & editing.
Funding
The author(s) declare financial support was received for the research, authorship, and/or publication of this article. This work was supported by Biodiversity Survey and Assessment Project of the Ministry of Ecology and Environment (2019HJ2096001006). National Natural Science Foundation of China (31800450), and Strategic Pilot Science and Technology Project of Chinese Academy of Sciences (XDA19050404).
Acknowledgments
We thank all individuals who participated in this study. We would like to thank Dr. Daniel Petticord at the University of Cornell for his assistance with English language and grammatical editing of the manuscript.
Conflict of interest
The authors declare that the research was conducted in the absence of any commercial or financial relationships that could be construed as a potential conflict of interest.
Publisher’s note
All claims expressed in this article are solely those of the authors and do not necessarily represent those of their affiliated organizations, or those of the publisher, the editors and the reviewers. Any product that may be evaluated in this article, or claim that may be made by its manufacturer, is not guaranteed or endorsed by the publisher.
Supplementary material
The Supplementary Material for this article can be found online at: https://www.frontiersin.org/articles/10.3389/fpls.2024.1328080/full#supplementary-material
References
Ahmed, I., Biggs, P. J., Matthews, P. J. (2012). Mutational dynamics of aroid chloroplast genomes. Genome Biol. Evol. 4, 1316–1323. doi: 10.1093/gbe/evs110
Amiryousefi, A., Hyvönen, J., Poczai, P. (2018). IRscope: an online program to visualize the junction sites of chloroplast genomes. Bioinformatics 34, 3030–3031. doi: 10.1093/bioinformatics/bty220
Bi, Y., Zhang, M. F., Xue, J., Dong, R., Du, Y. P., Zhang, X. H. (2018). Chloroplast genomic resources for phylogeny and DNA barcoding: A case studyon Fritillaria. Sci. Rep. 8, 1184. doi: 10.1038/s41598-018-19591-9
Bolger, A. M., Lohse, M., Usadel, B. (2014). Trimmomatic: a flexible trimmer for Illumina sequence data. Bioinformatics 30, 2114–2120. doi: 10.1093/bioinformatics/btu170
Bouckaert, R., Vaughan, , Barido-Sottani, J., Duchêne, S., Fourment, M., Gavryushkina, A., et al. (2019). BEAST 2.5: An advanced software platform for Bayesian evolutionary analysis. PLoS Comput. Biol. 15 (4), e1006650. doi: 10.1371/journalpcbi.1006650
Brown, T. M. (1975). Equisetum clarnoi, a new species based on petrifications from the Eocene of Oregon. Am. J. Bot. 62, 410–415. doi: 10.1002/j.1537-2197.1975.tb14064.x
Browne, I. (1908). The phylogeny and inter-relationships of the Pteridophyta. II. Equisetales. New Phytol. 7, 103–113. doi: 10.1111/j.1469-8137.1909.tb05501.x
Channing, A., Zamuner, A., Edwards, D., Guido, D. (2011). Equisetum thermale sp. nov. (Equisetales) from the Jurassic San Agustín hot spring deposit, Patagonia: anatomy, paleoecology, and inferred paleoecophysiology. Am. J. Bot. 98, 680–697. doi: 10.3732/ajb.1000211
Christenhusz, M. J. M., Bangiolo, L., Chase, M. W. (2019). Phylogenetics, classification and typification of extant horsetails (Equisetum, Equisetaceae). Bot. J. Linn. Soc. 189, 311–352. doi: 10.1093/botlinnean/boz002
Christenhusz, M. J. M., Chase, M. W., Fay, M. F., Hidalgo, O., Leitch, I. J., Pellicer, J., et al. (2021). Biogeography and genome size evolution of the oldest extant vascular plant genus, Equisetum (Equisetaceae). Ann. Bot. 127(5), 681–695. doi: 10.1093/aob/mcab005
Darling, A. C. E., Mau, B., Blattner, F. R. (2004). Mauve: multiple alignment of conserved genomic sequence with rearrangements. Genome Res. 14, 1394–1403. doi: 10.1101/gr.2289704
Des Marais, D. L., Smith, A. R., Britton, D. M. (2003). Phylogenetic relationships and evolution of extant horsetails, Equisetum, based on chloroplast DNA sequence data (rbcL and trnLF). Int. J. Plant Sci. 164, 737–751. doi: 10.1086/376817
Dong, S., Ying, Z., Yu, S., Wang, Q., Liao, G., Ge, Y., et al. (2021). Complete chloroplast genome of Stephania tetrandra (Menispermaceae) from Zhejiang Province: Insights into molecular structures, comparative genome analysis, mutational hotspots and phylogenetic relationships. BMC Genomics 22, 880. doi: 10.1186/s12864-021-08193-x
Dong, W., Liu, J., Yu, J., Wang, L., Zhou, S. (2012). Highly variable chloroplast markers for evaluating plant phylogeny at low taxonomic levels and for DNA barcoding. Public Library Sci. One 7, e35071. doi: 10.1371/journal.pone.0035071
Eames, A. J. (1936). Morphology of vascular plants: lower groups (Psilophytales to Filicales) (NY. USA: McGraw Hill).
Fan, R., Ma, W., Liu, S., et al. (2021). Integrated analysis of three newly sequenced fern chloroplast genomes: Genome structure and comparative analysis. Ecol. Evol. 11, 4550–4563. doi: 10.1002/ece3.7350
Foerstner, K. U., Von Mering, C., Hooper, S. D. (2005). Environments shape the nucleotide composition of genomes. Eur. Mol. Biol. Organ. Rep. 6, 1208–1213. doi: 10.1038/sj.embor.7400538
Frazer, K. A., Pachter, L., Poliakov, A. (2004). VISTA: Computational tools for comparative genomics. Nucleic Acids Res. 32, W273–W279. doi: 10.1093/nar/gkh458
Gao, L. Z., Liu, Y. L., Zhang, D. (2019). Evolution of Oryza chloroplast genomes promoted adaptation to diverse ecological habitats. Commun. Biol. 2, 278. doi: 10.1038/s42003-019-0531-2
Gitzendanner, M. A., Soltis, P. S., Wong, G. K. S., Ruhfel (2018). Plastid phylogenomic analysis of green plants: a billion years of evolutionary history. Am. J. Bot. 105, 291–301. doi: 10.1002/ajb2.1048
Grewe, F., Guo, W., Gubbels, E. A. (2013). Complete plastid genomes from Ophioglossum californicum, Psilotum nudum, and Equisetum hyemale reveal an ancestral land plant genome structure and resolve the position of Equisetales among monilophytes. BMC Evol. Biol. 13, 1–16. doi: 10.1186/1471-2148-13-8
Guillon, J. M. (2007). Molecular phylogeny of horsetails (Equisetum) including chloroplast atpB sequences. J. Plant Res. 120, 569–574. doi: 10.1007/s10265-007-0088-x
Guisinger, M. M., Kuehl, J. V., Boore, J. L. (2011). Extreme reconfiguration of plastid genomes in the angiosperm family Geraniaceae: rearrangements, repeats, and codon usage. Mol. Biol. Evol. 28, 583–600. doi: 10.1093/molbev/msq229
Harrison, R. D. (2005). Figs and the diversity of tropical rainforests. BioScience 55, 1053–1064. doi: 10.1641/0006-35682005055
Hauke, R. L. (1963). A taxonomic monograph of Equisetum subgenus Hippochaete. Univ. Michigan. 8, 1–123. doi: 10.1127/nova.hedwigia/30/1979/385
Hauke, R. L. (1979). A taxonomic monograph of Equisetum subgenus Equisetum. Nova Hedwigia, 385–456. doi: 10.1127/nova.hedwigia/30/1979/385
Hermida-Carrera, C., Fares, M. A., Fernández, Á. (2017). Correction: Positively selected amino acid replacements within the RuBisCO enzyme of oak trees are associated with ecological adaptations. Public Library Sci. One 12, e0183970. doi: 10.1371/journal.pone.0188984
Huang, J., Sun, G., Zhang, D. (2010). Molecular evolution and phylogeny of the angiosperm ycf2 gene. J. Syst. Evol. 48, 240–248. doi: 10.1111/i.1759-6831.2010.00080.X
Husby, C. (2013). Biology and functional ecology of Equisetum with emphasis on the giant horsetails. Bot. Rev. 79, 147–177. doi: 10.1007/s12229-012-9113-4
Husby, C. E., Delatorre, J., Oreste, V. (2011). Salinity tolerance ecophysiology of Equisetum giganteum in South America: a study of 11 sites providing a natural gradient of salinity stress. AoB Plants. 04, 22. doi: 10.1093/aobpla/plr022
Jansen, R. K., Cai, Z., Raubeson, L. A. (2007). Analysis of 81 genes from 64 plastid genomes resolves relationships in angiosperms and identifies genome-scale evolutionary patterns. Proc. Natl. Acad. Sci. 104, 19369–19374. doi: 10.1073/pnas.0709121104
Jia, Q., Wu, H. T., Zhou, X. J. A. (2010). “GC-rich” method for mammalian gene expression: A dominant role of non-coding DNA GC content in regulation of mammalian gene expression. Sci. China Life Sci. 53, 94–100. doi: 10.26226/morressier.5ebd45acffea6f735881b039
Jia, J., Xue, Q. Z. (2009). Codon usage biases of transposable element sand host nuclear genes in Arabidopsis thaliana and Oryza sativa. Genom. Proteomics &. Bioinf. 7, 175–184. doi: 10.1016/S1672-0229(08)60047-9
Jiang, P., Shi, F. X., Li, M. R. (2018). Positive selection driving cytoplasmic genome evolution of the medicinally important ginseng plant genus Panax. Front. Plant Sci. 9. doi: 10.3389/fpls.2018.00359
Jin, J. J., Yu, W. B., Yang, J. B. (2020). GetOrganelle: a fast and versatile toolkit for accurate de novo assembly of organelle genomes. Genome Biol. 21, 1–31. doi: 10.1101/256479
Kapralov, M. V., Filatov, D. A. (2007). Widespread positive selection in thephotosynthetic Rubisco enzyme. BMC Evol. Biol. 7, 73. doi: 10.1186/1471-2148-7-73
Karol, K. G., Arumuganathan, K., Boore, J. L. (2010). Complete plastome sequences of Equisetum arvense and Isoetes flaccida: implications for phylogeny and plastid genome evolution of early land plant lineages. BMC Evol. Biol. 10, 1–16. doi: 10.1186/1471-2148-10-321
Kearse, M., Moir, R., Wilson, A. (2012). Geneious Basic: an integrated and extendable desktop software platform for the organization and analysis of sequence data. Bioinformatics 28, 1647–1649. doi: 10.1093/bioinformatics/bts199
Kenrick, P., Crane, P. R. (1997). The origin and early evolution of plants on land. Nature 389, 33–39. doi: 10.1038/37918
Knox, E. B. (2014). The dynamic history of plastid genomes in the Campanulaceae sensu lato is unique among angiosperms. Proc. Natl. Acad. Sci. 111, 11097–11102. doi: 10.1073/pnas.1403363111
Koichiro, T., Yoshihiro, M., Yukiko, Y., Yasunari, O. (2008). Evolutionary dynamics of wheat mitochondrial gene structure with special remarks on the origin and effects of RNA editing in cereals. Genes Genet. Syst. 83, 301–320. doi: 10.1266/ggs.83.301
Li, C., Liu, Y., Lin, F., Zheng, Y., Huang, P. (2022). Characterization of the complete chloroplast genome sequences of six Dalbergia species and its comparative analysis in the subfamily of Papilionoideae (Fabaceae). Peer J. 10, e13570. doi: 10.7717/peerj.13570
Li, W., Zhang, C., Guo, X., Liu, Q., Wang, K. (2019). Complete chloroplast genome of Camellia japonica genome structures, comparative and phylogenetic analysis. PloS One 14, e0216645. doi: 10.1371/journal.pone.0216645
Li, G., Zhang, L., Xue, P. (2021). Codon usage pattern and genetic diversity in chloroplast genomes of Panicum species. Gene 802, 145866. doi: 10.1016/j.gene.2021.145866
Librado, P., Rozas, J. (2009). DnaSP v5: a software for comprehensive analysis of DNA polymorphism data. Bioinformatics 25, 1451–1452. doi: 10.1093/bioinformatics/btp187
Liere, K., Link, G. (1995). RNA-binding activity of the matK protein encodecd by the chloroplast trnk intron from mustard (Sinapis alba L.). Nucleic Acids Res. 23, 917–921. doi: 10.1093/nar/23.6.917
Liu, X., Chang, E. M., Liu, J. F. (2019). Complete chloroplast genome sequence and phylogenetic analysis of Quercus acutissima. Int. J. Mol. Sci. 10, 587. doi: 10.3390/f10070587
Liu, Y. J., Wu, Y. S., Xing, D. (2017). Core DNA barcoding screening of Equisetum plants. Shi Zhenguo Med. 28, 1662–1665.
Lohse, M., Drechsel, O., Kahlau, S., Bock, R. (2013). Organellar Genome DRAW—a suite of tools for generating physical maps of plastid and mitochondrial genomes and visualizing expression data sets. Nucleic Acids Res. 41, W575–W581. doi: 10.1093/nar/gkt289
Lu, R. S., Li, P., Qiu, Y. X. (2016). The complete chloroplast genomes of three cardiocrinum (Liliaceae) species: comparative genomic and phylogenetic analyses. Front. Plant Sci. 7. doi: 10.3389/fpls.2016.02054
Marsh, A. S., Arnone, III. J.A., Bormann, B. T. (2000). The role of Equisetum in nutrient cycling in an Alaskan shrub wetland. J. Ecol. 88, 999–1011. doi: 10.1046/j.1365-2745.2000.00520.x
Martín, M., Funk, H. T., Serrot, P. H. (1787). Functional characterization of the thylakoid Ndh complex phosphorylation by site-directed mutations in the ndhF gene. Biochim. Biophys. Acta (BBA) Bioenergetics 7), 920–928. doi: 10.1016/j.bbabio.2009.03.001
McDonald, M. J., Wang, W. C., Huang, H. D. (2011). Clusters of nucleotide substitutions and insertion/deletion mutations are associated with repeat sequences. PloS Biol. 9, e1000622. doi: 10.1371/journal.pbio.1000622
Moore, M. J., Bell, C. D., Soltis, P. S. (2007). Using plastid genome-scale data to resolve enigmatic relationships among basal angiosperms. Proc. Natl. Acad. Sci. 104, 19363–19368. doi: 10.1073/pnas.0708072104
Parks, M., Cronn, R., Liston, A. (2009). Increasing phylogenetic resolution at low taxonomic levels using massively parallel sequencing of chloroplast genomes. BMC Biol. 7, 1–17. doi: 10.1186/1741-7007-7-84
Parks, M., Cronn, R., Liston, A. (2012). Separating the wheat from the chaff: mitigating the effects of noise in a plastome phylogenomic data set from Pinus L.(Pinaceae). BMC Evol. Biol. 12, 1–17. doi: 10.1186/1471-2148-12-100
Parks, M. B., Nakov, T., Ruck, E. C., Wickett, N. J., Alverson, A. J. (2018). Phylogenomics reveals an extensive history of genome duplication in diatoms (Bacillariophyta). Am. J. Bot. 105 (3), 330–347. doi: 10.1101/181115
Paul, P., Malakar, A. K. (2018). Chakraborty S. Codon usage andamino acid usage influence genes expression level. Genetica 146, 53–63. doi: 10.1007/s10709-017-9996-4
Pryer, K. M., Schneider, H., Smith, A. R. (2001). Horsetails and ferns are a monophyletic group and the closest living relatives to seed plants. Nature 409, 618–622. doi: 10.1038/35054555
Qu, X., Moore, M. J., Li, D. (2019). PGA: a software package for rapid, accurate, and flexible batch annotation of plastomes. Plant Methods 15, 1–12. doi: 10.1186/s13007-019-0435-7
Rabah, S. O., Shrestha, B., Hajrah, N. H., Sabir, M. J., Alharby, H. F., Sabir, M. J., et al. (2019). Passiflora plastome sequencing reveals widespread genomic rearrangements. J. Syst. Evol. 57 (1), 1–14. doi: 10.1111/jse.12425
Rambaut, A., Drummond, A. J., Xie, D. (2018). Posterior Summarization in Bayesian phylogenetics using Tracer 1.7. Syst. Biol. 67, 901–904. doi: 10.1093/sysbio/syy032
Reed, C. F. (1971). “Index to equisetophyta. Part 1: fossiles. Part II: extantes,” in Contributions of the Reed Herbarium XIX (PM Harrod, Baltimore).
R Marcelino, V., Cremen, M. C. M., Jackson, C. J., Larkum, A. A., Verbruggen, H. (2016). Evolutionary dynamics of chloroplast genomes in low light: a case study of the endolithic green alga Ostreobium quekettii. Genome Biol. Evol. 8, 2939–2951. doi: 10.3410/f.726682871.793535021
Rosenberg, M. S., Subramanian, S., Kumar, S. (2003). Patterns of transitional mutation biases within and among mammalian genomes. Mol. Biol. Evol. 20, 988–993. doi: 10.1093/molbev/msg113
Rothfels, C. J., Li, F. W., Sigel, E. M. (2015). The evolutionary history of ferns inferred from 25 low-copy nuclear genes. Am. J. Bot. 102, 1089–1107. doi: 10.3732/ajb.1500089
Rothwell, G. W. (1999). Fossils and ferns in the resolution of land plant phylogeny. Bot. Rev. 65, 188–218. doi: 10.1007/bf02857629
Rozas, J., Ferrer-Mata, A., Sánchez-DelBarrio, J. C. (2017). DnaSP 6: DNA sequence polymorphism analysis of large data sets. Mol. Biol. Evol. 34, 3299–3302. doi: 10.1093/molbev/msx248
Ruhfel, B. R., Gitzendanner, M. A., Soltis, P. S. (2014). From algae to angiosperms–inferring the phylogeny of green plants (Viridiplantae) from 360 plastid genomes. BMC Evol. Biol. 14, 1–27. doi: 10.1186/1471-2148-14-23
Ruhlman, T. A., Jansen, R. K. (2014). "The plastid genomes of flowering plants". In: Maliga P, editor. Chloroplast biotechnology: methods and protocols. Methods in molecular biology. New York: Springer. Humana Press. p. 3–38.
Scott, D. H. (1900). Studies in fossil botany (London. UK: Adam and Charles Black). doi: 10.5962/bhl.title.57419
Selvaraj, D., Sarma, R. K., Sathishkumar, R. (2008). Phylogenetic analysis of chloroplast matK gene from Zingiberaceae for plant DNA barcoding. Bioinformation 3, 24. doi: 10.6026/97320630003024
Shen, H., Jin, D. M., Shu, J. P. (2018). Large-scale phylogenomic analysis resolves a backbone phylogeny in ferns. GigaScience 7, 116. doi: 10.1093/gigascience/gix116
Smith, D. R. (2009). Unparalleled GC content in the plastid DNA of Selaginella. Plant Mol. Biol. 71, 627. doi: 10.1007/s11103-009-9545-3
Sorimachi, K. (2010). Codon evolution in double-stranded organelle DNA: Strong regulation of homonucleotides and their analog alternations. Nat. Sci. 2, 846–854. doi: 10.4236/ns.2010.28106
Spatz, H. C., Köhler, L., Speck, T. (1998). Biomechanics and functional anatomy of hollow-stemmed sphenopsids. I. Equisetum giganteum (Equisetaceae). Am. J. Bot. 85, 305–314. doi: 10.2307/2446321
Stamatakis, A. (2006). RAxML-VI-HPC: maximum likelihood-based phylogenetic analyses with thousands of taxa and mixed models. Bioinformatics 22, 2688–2690. doi: 10.1093/bioinformatics/btl446
Stein, W. (1993). Modeling the evolution of stelar architecture in vascular plants. Int. J. Plant Sci. 154, 229–263. doi: 10.1086/297106
Sun, Y., Moore, M. J., Lin, N., Adelalu, K. F., Meng, A., Jian, S., et al. (2017). Complete plastome sequencing of both living species of Circaeasteraceae (Ranunculales) reveals unusual rearrangements and the loss of the ndh gene family. BMC Genomics 18, 592. doi: 10.1186/s12864-017-3956-3
Testo, W., Sundue, M. A. (2016). A 4000-species dataset provides new insights into the evolution of ferns. Mol. Phylogenet. Evol. 105, 200–211. doi: 10.1016/j.ympev.2016.09.003
Thiel, T., Michalek, W., Varshney, R., Graner, A. (2003). Exploiting EST databases for the development and characterization of gene-derived SSR-markers in barley (Hordeum vulgare L.). Theor. Appl. Genet. 106, 411–422. doi: 10.1007/s00122-002-1031-0
Thode, V. A., Lohmann, L. G. (2019). Comparative chloroplast genomics at low taxonomic levels: A case study using Amphilophium (Bignonieae. Bignoniaceae). Front. Plant Sci. 07. doi: 10.3389/fpls.2019.00796
Tian, D., Qiang, W., Zhang, P. (2008). Single-nucleotide mutation rate increases close to insertions/deletions in eukaryotes. Nature 455, 105–108. doi: 10.1038/nature07175
Vanneste, K., Sterck, L., Myburg, A. A., Van, de, Peer, Y., Mizrachi, E. (2015). Horsetails are ancient polyploids: evidence from Equisetum giganteum. Plant Cell. 27, 1567–1578. doi: 10.1105/tpc.15.00157
Wei, R., Yan, Y. H., Harris, A. J., Kang, J. S., Shen, H., Xiang, Q. P., et al. (2017). Plastid phylogenomics resolve deep relationships among eupolypod II ferns with rapid radiation and rate heterogeneity. Genome Biol. Evol. 9, 1646. doi: 10.1093/gbe/evx107
Weng, M. L., Ruhlman, T. A., Jansen, R. K. (2017). Expansion of inverted repeat does not decrease substitution rates in Pelargonium plastid genomes. New Phytol. 214, 842–851. doi: 10.1111/nph.14375
Wick, R. R., Schultz, M. B., Zobel, J., Holt, K. E. (2015). Bandage: Interactive visualization of de novo genome assemblies. Bioinformatics 31, 3350–3352. doi: 10.1093/bioinformatics/btv383
Wicke, S., Schneeweiss, G. M., Depamphilis, C. W., Muller, K. F., Quandt, D. (2011). The evolution of the plastid chromosome in land plants: Gene content, gene order, gene function. Plant Mol. Biol. 76, 273–297. doi: 10.1007/s11103-011-9762-4
Wu, L., Cui, Y., Wang, Q., Xu, Z., Wang, Y., Lin, Y., et al. (2021). Identification and phylogenetic analysis of five Crataegus species (Rosaceae)based on complete chloroplast genomes. Planta 254, 14. doi: 10.1007/s00425-021-03667-4
Yan, M., Fritsch, P. W., Moore, M. J., Feng, T., Meng, A., Yang, J., et al. (2018). Plastid phylogenomics resolves infrafamilial relationships of the Styracaceae and sheds light on the backbone relationships of the Ericales. Mol. Phylogenet. Evol. 121, 198–211. doi: 10.1016/j.ympev.2018.01.004
Yang, X., Luo, X., Cai, X. (2014). Analysis of codon usage pattern in Taenia saginata based on a transcriptome dataset. Parasites Vectors 7, 527. doi: 10.1186/s13071-014-0527-1
Yang, Z., Nielsen, R. (2002). Codon-Substitution models for detecting molecular adaptation at individual sites along specific lineages. Mol. Biol. Evol. 19, 908–917. doi: 10.1093/oxfordjournals.molbev.a004148
Yang, Z. H., Wong, W. S. W., Nielsen, R. (2005). Bayes empirical bayes inference of amino acid sites under positive selection. Mol. Biol. Evol. 22, 1107–1118. doi: 10.1093/molbev/msi097
Yao, X., Tan, Y. H., Yang, J. B., Wang, Y., Corlett, R. T., Manen, J. F. (2019). Exceptionally high rates of positive selection on the rbcL gene in the genus Ilex (Aquifoliaceae). BMC Evol. Biol. 19, 192. doi: 10.1186/s12862-019-1521-1
Yin, K., Zhang, Y., Li, Y., Du, F. K. (2018). Different natural selection pressures on the atpF gene in evergreen sclerophyllous and deciduous oak species: Evidence from comparative analysis of the complete chloroplast genome of Quercus aquifolioides with other oak species. Int. J. Mol. Sci. 19, 1042. doi: 10.3390/ijms19041042
Yin, J., Zhang, C., Mirarab, S. (2019). ASTRAL-MP: scaling ASTRAL to very large datasets using randomization and parallelization. Bioinformatics 35, 3961–3969. doi: 10.1093/bioinformatics/btz211
Zamaloa, M. C., Cornou, E., Martínez, M., et al. (2022). The first fossil record of a giant horsetail (Equisetum, Equisetaceae) is from the Miocene of Patagonia, Argentina. Andean Geol. 49, 273–287. doi: 10.5027/andgeov49n1-3417
Zheng, S. (2020). Chloroplot: An online program for the versatile plotting of organelle genomes. Front. Genet. 11. doi: 10.3389/fgene.2020.576124
Keywords: phylogenomics, divergent hotspot, evolutionary, sequence characteristic, pteridophytes
Citation: Sun W, Wei Z, Gu Y, Wang T, Liu B and Yan Y (2024) Chloroplast genome structure analysis of Equisetum unveils phylogenetic relationships to ferns and mutational hotspot region. Front. Plant Sci. 15:1328080. doi: 10.3389/fpls.2024.1328080
Received: 26 October 2023; Accepted: 02 February 2024;
Published: 11 April 2024.
Edited by:
Xiaohua Jin, Chinese Academy of Sciences (CAS), ChinaCopyright © 2024 Sun, Wei, Gu, Wang, Liu and Yan. This is an open-access article distributed under the terms of the Creative Commons Attribution License (CC BY). The use, distribution or reproduction in other forums is permitted, provided the original author(s) and the copyright owner(s) are credited and that the original publication in this journal is cited, in accordance with accepted academic practice. No use, distribution or reproduction is permitted which does not comply with these terms.
*Correspondence: Baodong Liu, YmQ5OUAxNjMuY29t; Yuehong Yan, eWh5YW5Ac2licy5hYy5jbg==