 Liangqi Zhang1†Yuqi Luo1†Xiao Zhong2Guoyun Jia1Hao Chen1
 Yuqi Wang1Jianian Zhou1Chunhua Ma1
 Xin Li1Kebing Huang1
 Suizhuang Yang1
 Jianfeng Wang3Dejun Han3
 Yong Ren4Lin Cai5*
 Xinli Zhou1*
- 1Wheat Research Institute, School of Life Sciences and Engineering, Southwest University of Science and Technology, Mianyang, Sichuan, China
- 2Chongqing Banan District Agricultural Technology Promoting Station, Chongqing, China
- 3State Key Laboratory of Crop Stress Biology for Arid Areas, College of Plant Protection, Northwest A&F University, Yangling, Shanxi, China
- 4Crop Characteristic Resources Creation and Utilization Key Laboratory of Sichuan Province, Mianyang Institute of Agricultural Science, Mianyang, Sichuan, China
- 5College of Tobacco Science of Guizhou University, Key Laboratory of Plant Resource Conservation and Germplasm Innovation in Mountainous Region (Ministry of Education), Guizhou Key Lab of Agro-Bioengineering, Guiyang, China
Introduction: Agronomic traits are key components of wheat yield. Exploitation of the major underlying quantitative trait loci (QTLs) can improve the yield potential in wheat breeding.
Methods: In this study, we constructed a recombinant inbred line (RIL) population from Mingxian 169 (MX169) and Pindong 34 (PD34) to determine the QTLs for grain length (GL), grain width (GW), grain length-to-width ratio (LWR), plant height (PH), spike length (SL), grain number per spike (GNS), and the thousand grain weight (TGW) across four environments using wheat 90K SNP array.
Results: A QTL associated with TGW, i.e., QTGWpd.swust-6BS, was identified on chromosome 6B, which explained approximately 14.1%–16.2% of the phenotypic variation. In addition, eight QTLs associated with GL were detected across six chromosomes in four different test environments. These were QGLpd.swust-1BL, QGLpd.swust-2BL, QGLpd.swust-3BL.1, QGLpd.swust-3BL.2, QGLpd.swust-5DL, QGLpd.swust-6AL, QGLpd.swust-6DL.1, and QGLpd.swust-6DL.2. They accounted for 9.0%–21.3% of the phenotypic variation. Two QTLs, namely, QGWpd.swust-3BS and QGWpd.swust-6DL, were detected for GW on chromosomes 3B and 6D, respectively. These QTLs explained 12.8%–14.6% and 10.8%–15.2% of the phenotypic variation, respectively. In addition, two QTLs, i.e., QLWRpd.swust-7AS.1 and QLWRpd.swust-7AS.2, were detected on chromosome 7A for the grain LWR, which explained 10.9%–11.6% and 11.6%–11.2% of the phenotypic variation, respectively. Another QTL, named QGNSpd-swust-6DS, was discovered on chromosome 6D, which determines the GNS and which accounted for 11.4%–13.8% of the phenotypic variation. Furthermore, five QTLs associated with PH were mapped on chromosomes 2D, 3A, 5A, 6B, and 7B. These QTLs were QPHpd.swust-2DL, QPHpd.swust-3AL, QPHpd.swust-5AL, QPHpd.swust-6BL, and QPHpd.swust-7BS, which accounted for 11.3%–19.3% of the phenotypic variation. Lastly, a QTL named QSLpd.swust-3AL, conferring SL, was detected on chromosome 3A and explained 16.1%–17.6% of the phenotypic variation. All of these QTLs were defined within the physical interval of the Chinese spring reference genome.
Discussion: The findings of this study have significant implications for the development of fine genetic maps, for genomic breeding, and for marker-assisted selection to enhance wheat grain yield.
1 Introduction
Wheat is one of the most important food crops in the world, producing approximately 700 million tons of wheat annually and providing nearly 20% of the energy source for the global population (https://www.fao.org/faostat/en) (Shewry, 2009; Juliana et al., 2019). With the continuous growth of the global population and the improvement of living standards, the demand for wheat is gradually increasing. However, the current yield level of wheat cannot meet the projected future demand. Wheat production will need to increase by almost 70% by 2050 in order to maintain food security and accommodate the heightened demand resulting from the expanding global population (Ray et al., 2013). Wheat yield is mainly determined by the grain number per spike (GNS), the spike number, and the thousand grain weight (TGW) (Cristina et al., 2021). Furthermore, various agronomic traits exert influence on wheat yield. Previous studies have indicated that plant height (PH) can impact the dry matter accumulation and lodging resistance, while panicle traits including the spike length (SL) and GNS, among others, and the grain characteristics such as grain length (GL), grain width (GW), and TGW, among others, exhibit positive correlations with yield (Elouafi and Nachit, 2004; Griffiths et al., 2012; Simmonds et al., 2014). Therefore, it is of great significance to understand the genes or quantitative trait loci (QTLs) associated with the agronomic traits related to wheat yield composition in wheat breeding (Yan et al., 2019).
Identification of the QTLs associated with important traits is one of the first steps in the development of wheat cultivars using molecular marker-assisted selection (MAS) (Collard and Mackill, 2007). The grain traits mainly include the TGW, GL, GW, and the grain length-to-width ratio (LWR), among others. Of these, TGW is a composite trait, while GL, GW, and LWR are its constituent elements (Campbell et al., 1999). The level of TGW in wheat is not only directly related to yield but also affects the flour milling and processing quality of wheat, as well as the vigor of wheat seedlings (Wiersma et al., 2001; Breseghello and Sorrells, 2006). Therefore, identification of the QTLs important for agronomical traits, such as PH and TGW, provides critical information beneficial to food security (Xiao et al., 2022). To date, 25 Rht genes (Rht1–Rht25) have been identified in wheat, with Rht-B1, Rht-D1, and Rht8 being widely utilized dwarfing genes in contemporary breeding programs (Hedden, 2003; Chai et al., 2022). Dwarf or semi-dwarf varieties, compared with the tall phenotypes, exhibit enhanced allocation of photoassimilates toward spike development, leading to alterations in the spike morphology and to increased GNS. Previous studies have identified several QTLs associated with SL and GW (Sun et al., 2009; Williams et al., 2013; Tyagi et al., 2015; Kumar et al., 2016). However, studies on QTLs related to grain LWR remain limited (Li et al., 2015; Kumar et al., 2016; Kumari et al., 2018).
In the 1990s, the first genetic map of wheat was successfully constructed using restriction fragment length polymorphism (RFLP) markers (Devos et al., 1993). Subsequently, molecular markers such as random amplified polymorphic DNA (RAPD), amplified fragment length polymorphism (AFLP), and simple sequence repeat (SSR), based on PCR amplification technology, have emerged as the primary tools for genetic mapping. However, these markers exhibited limited genetic diversity, and the process of marker development was time-consuming and labor-intensive. Furthermore, the resulting maps lacked the required density for precise gene localization and cloning. Single nucleotide polymorphisms (SNPs) represent the most abundant and ubiquitous form of genetic variation within genomes (Kwok, 2001). SNPs offer superior value over other markers for high-density genetic mapping, fine-mapping of target genes, and gene cloning efforts (Rafalski, 2002). In recent decades, there has been significant interest in SNP research and development in both animals and plants, including wheat. Substantial progress has been achieved in the development and application of SNP markers in wheat. Genome-wide association studies (GWAS) have been successfully employed for polymorphism detection in both tetraploid and hexaploid wheat (Juliana et al., 2018). Currently, various SNP arrays, such as the 35K, 55K, 90K, and 660K SNP arrays, have been developed for wheat and utilized in QTL mapping experiments and in GWAS. For example, Zhou et al. utilized the 90K SNP array to map the loci associated with adult plant resistance (APR) to stripe rust in the common wheat cultivar Pindong 34 and the durum wheat Svevo (Zhou et al., 2021, 2022).
Pindong 34 (PD34) is a winter wheat cultivar bred in 1990 by the Institute of Crop Variety Resources, Chinese Academy of Agricultural Sciences. It exhibits a high level of resistance to stripe rust and most other wheat diseases and insect pests (Zhou et al., 2022). A total of 12 QTLs for APR, as well as three QTLs for all-stage resistance (including Yr61), were identified in PD34 using the 90K SNP-Chip array in the recombinant inbred line (RIL) population consisting of 119 lines (Zhou et al., 2022). Identification of the QTLs influencing grain yield and its related traits is necessary to more precisely define their inheritance. The objectives of this study were: 1) to dissect the QTLs affecting grain yield in the RIL population from a cross between Mingxian 169 (MX169) and PD34; 2) to determine the chromosome locations and phenotypic effects of these yield-related QTLs across environments and identify the molecular markers associated with these traits; and 3) to determine the physical position of each QTL in the Chinese spring (CS) reference genome (IWGSC Ref Seq v1.0; https://plants.ensembl.org/Triticum_aestivum/Info/Index) and compare these with the reported QTLs.
2 Materials and methods
2.1 Plant materials
The mapping population used in this study was derived from a cross of MX169 and PD34. It was advanced to the F6:10 generation using the single seed descent method and included 119 RILs (Zhou et al., 2022). PD34 was selected from the cross [(Yan7578/81/128)//176(15)9-26/Dongda 2], which has the characteristics of high TGW, large grains, and low PH (80 cm) (Zhou et al., 2014). MX169 is an ancient Chinese winter wheat variety with a high PH, a shorter GL, and a narrower GW than the PD34 variety.
2.2 Field experiments and investigation of agronomic traits
The experiment was conducted in four different environments. Phenotypic evaluations of the agronomic traits of the RILs and the two parents were conducted in the field at Yangling, Shanxi Province (34°17′ N, 108°04′ E, 519 m altitude), and Mianyang, Sichuan Province (31°33′ N, 104°55′ E, 485 m altitude), over two successive years (2019 and 2020). The experiment was conducted in a randomized block design with two replicates. The plots were 1 m in length and 30 cm apart. Approximately 20–30 seeds were planted in a row. At maturity, half-row plants were randomly selected from each line for the measurements of PH, SL, and GNS. PH was measured at harvest maturity from the ground level to the tip of the spike, excluding awns, using a 100-cm ruler. SL was measured from the base to the tip, excluding awns, using a 15-cm ruler. GNS measured the total number of grains on the spike of wheat determined from the mean of five random spikes. After manual threshing, the grain was air-dried to measure the grain traits. The GL, GW, TGW, and LWR were determined from the mean of five random spikes in a line using the Wanshen SC-G automatic seed test analyzer. The specific measurement results are shown in Table 1. Field management was the same as commonly practiced in wheat production, and all agronomic trait data were obtained under conditions without disease control.
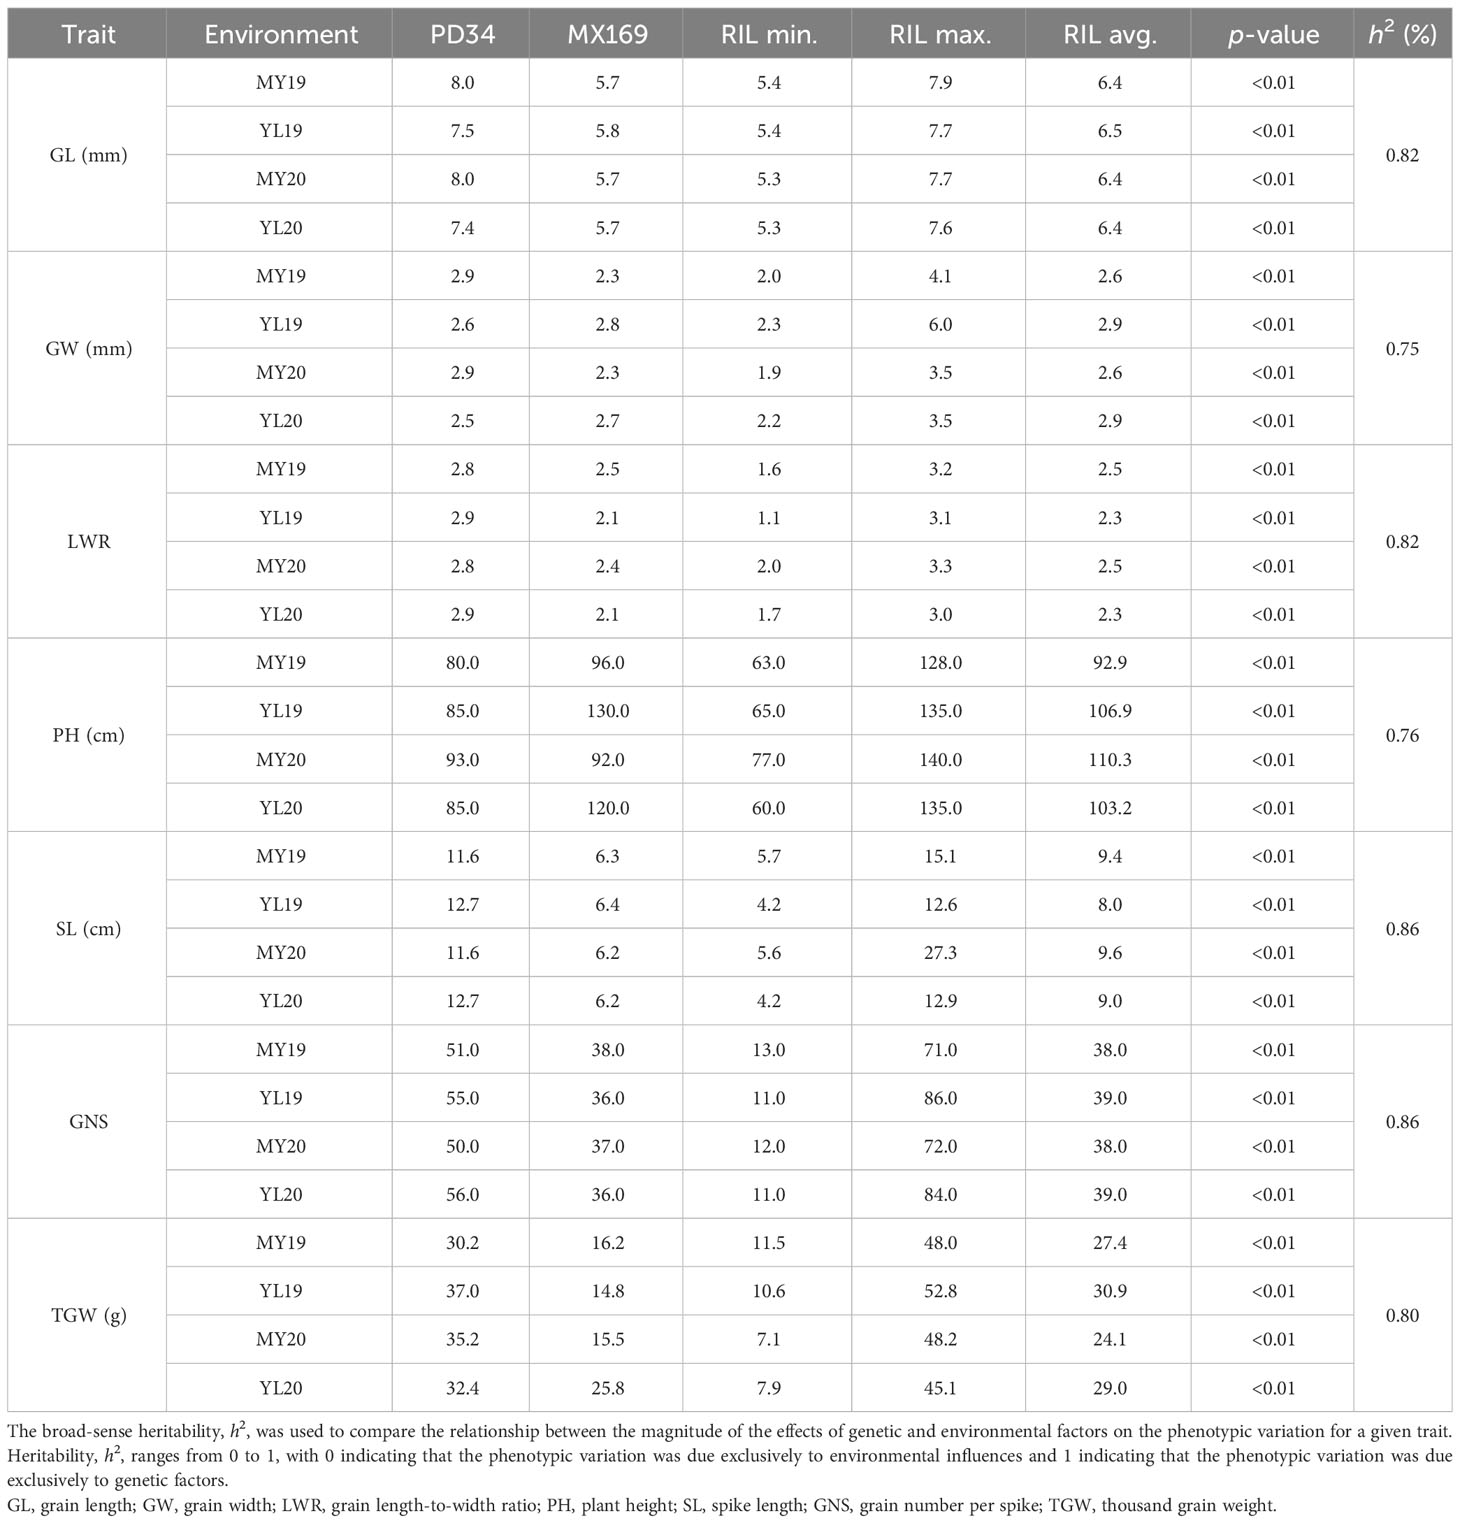
Table 1 Statistical analysis for the phenotype data of the agronomic traits in the Mingxian 169 (MX169) × Pindong 34 (PD34) recombinant inbred line (RIL) populations from 2019 to 2020.
2.3 Statistical analysis
The average phenotypic values of each trait in each line from both sites were used to calculate the variance of each trait in individual environmental analysis. IciMapping v4.1 (http://www.isbreeding.net/) was used in the software analysis of variance function to analyze variance (ANOVA) in the phenotype data and to calculate the generalized heritability. The broad-sense heritability () of the phenotypic traits was estimated using the formula , where is the genotype (line) variance; is the genotype × environment interaction variance; is the residual error variance; e is the number of replicates; and r is the number of environments. Pearson’s correlations between traits were calculated using SPSS.20 (https://www.ibm.com/cn-zh/spss).
2.4 Linkage map construction and QTL analysis
The mapping population comprised genetic data from 119 RILs genotyped using a 90K SNP-Chip genetic map, as reported by Zhou et al. (2022). The genetic map comprised a total of 11,346 markers, which were subsequently reduced to only 4,200 markers across 21 chromosomes by utilizing the “BIN” function in IciMapping v4.1 (Meng et al., 2015). The map had a genetic distance of 18,228.5 cM, with an average genetic distance of 868.0 cM. The GL, GW, LWR, PH, SL, GNS, and TGW data in each environment were used for QTL analysis with walking speed of 1 cM, value p for input variables (PIN) of 0.0001, logarithm of odds (LOD) of 2.5, and a window size of 5 cM. Moreover, possible QTLs were detected. When the LOD value was greater than 2.5, a QTL was identified explaining the phenotypic variation and an additive effect value for each QTL was calculated.
3 Results
3.1 Phenotypic variation and correlation analysis
In four different environments, PD34 exhibited a GL ranging from 7.4 to 8.0 mm, whereas MX169 displayed a GL range of 5.7–5.8 mm. The RIL population demonstrated GL variations from 5.4 to 7.7 mm, with mean values ranging from 6.4 to 6.5 mm across environments. For GW, that of PD34 ranged from 2.5 to 2.9 mm, while that of MX169 ranged from 2.3 to 2.8 mm. The RIL population displayed GW variations from 2.1 to 4.3 mm, with mean values ranging from 2.6 to 2.9 mm. The LWR for PD34 ranged from 2.8 to 2.9, whereas that for MX169 ranged from 2.1 to 2.5. The RIL population exhibited LWR variations from 1.6 to 3.2, with mean values ranging from 2.3 to 2.5. The PH of PD34 ranged from 80.0 to 93.0 cm, while that for MX169 ranged from 92.0 to 130.0 cm. The RIL population displayed PH variations from 66.3 to 134.5 cm, with mean values ranging from 92.9 to 110.3 cm across environments. The SL range for PD34 was 11.6–12.7 cm compared with 6.2–6.4 cm for MX169. The RIL population exhibited PH variations from 4.9 to 17.0 cm, with an average of 9.0–9.6 cm across environments. For GNS, that of PD34 ranged from 50.0 to 56.0, while that of MX169 ranged from 36.0 to 38.0. The RIL population displayed GNS variations from 11.0 to 78.0, with an average of 38.0–39.0 across environments. Regarding TGW, the range for PD34 was from 30.2 to 37.0 g, while that for MX169 was from 14.8 to 25.8 g. The RIL population demonstrated TGW variations from 9.3 to 48.5 g, with an average of 24.1–30.9 g (Table 1). According to the phenotypic distribution of the parental and RIL populations, the GL, GW, LWR, PH, SL, GNS, and TGW were all related to environmental conditions (Figure 1; Table 1). The GL, GW, LWR, PH, SL, GNS, and TGW all had high (75%–86%), indicating that all of the traits were stable and mainly determined by genetic factors. All traits exhibited transgressive segregation in both directions beyond the parental values, indicating quantitative traits under polygenic control, thereby rendering them suitable for QTL analysis (Table 1).
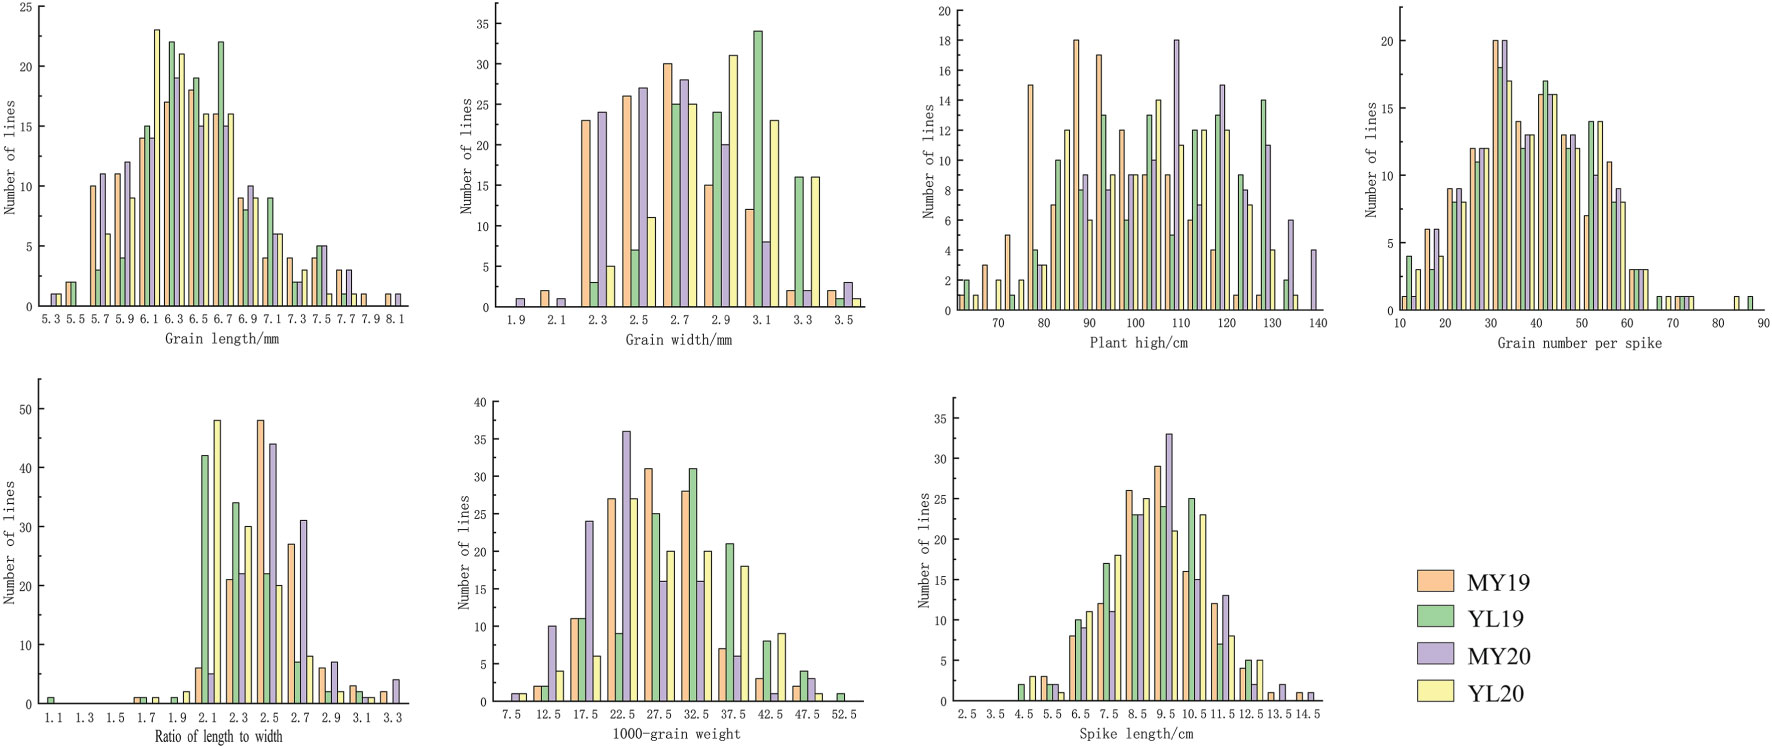
Figure 1 Frequency distributions of the mean grain length, grain width, grain length-to-width ratio, thousand grain weight, plant height, grain number per spike, and spike length, for 119 recombinant inbred lines (RILs) from the cross Mingxian 169 (MX) × Pindong 34 (PD) grown in Mianyang (MY) and Yanglin (YL) in 2019–2020.
3.2 QTL analysis
The phenotypic of the GL, GW, LWR, PH, SL, GNS, and TGW data of the 119 RILs from the four field experiments were used for the identification of QTLs. Inclusive composite interval mapping (ICIM) identified a total of 20 QTLs (one for TGW, eight for GL, two for GW, two for LWR, five for PH, one for SL, and one for GNS) distributed on 12 chromosomes (1B, 2B, 2D, 3A, 3B, 5A, 5D, 6A, 6B, 6D, 7A, and 7B) within 18 genomic regions (Figure 2; Table 2). The additive effects of these QTLs on the GL, GW, LWR, TGW, and SL were all derived from PD34, and one QTL for the regulation of GNS was located on chromosome 6DS from MX169.
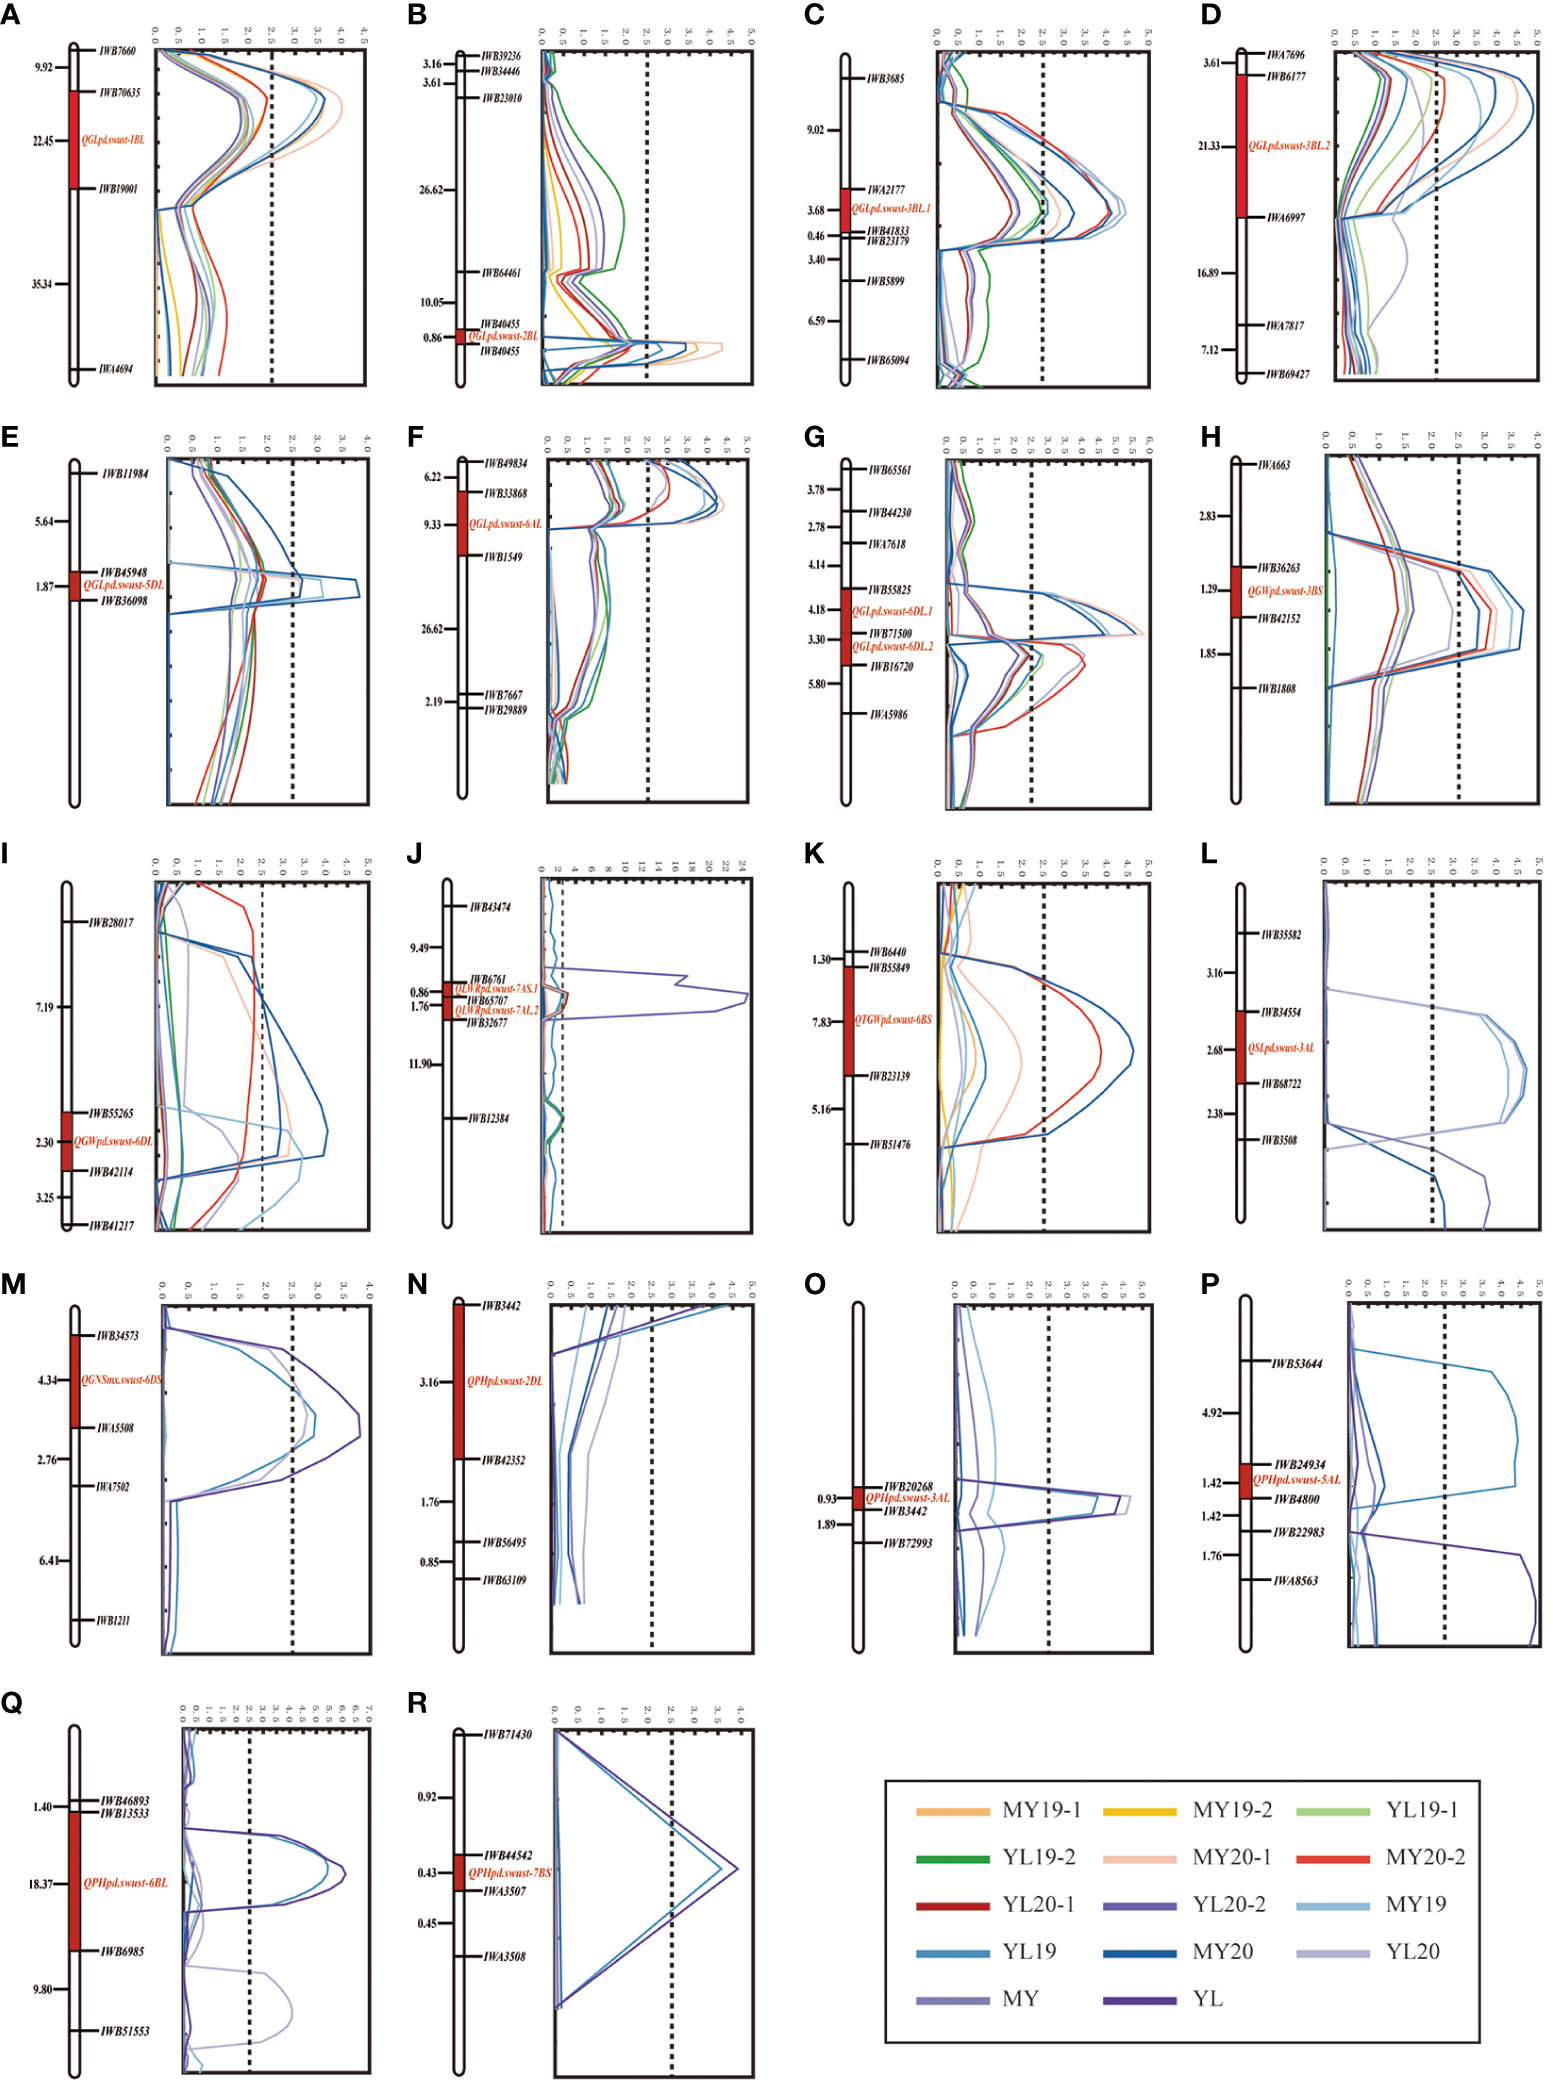
Figure 2 (A–R) Agronomic traits of the quantitative trait loci (QTLs) on the genetic map of chromosomes 1B, 2B, 2D, 3A, 3B, 5A, 5D, 6A, 6B, 6D, 7A, and 7B based on the agronomic data. The y-axis is in centimorgan (cM) distance and the x-axis indicates the logarithm of odds (LOD) scores. All LOD scores of the QTLs shown are similar. (A–G) Grain length (GL). (H, I) Grain width (GW). (J) Grain length-to-width ratio (LWR). (K) Thousand grain weight (TGW). (L) Spike length (SL). (M) Grain number per spike (GNS). (M–R) Plant height (PH).

Table 2 Summary of the 20 quantitative trait loci (QTLs) identified on the agronomic characteristics of the Mingxian 169/Pindong 34 recombinant inbred line (RIL) populations examined in Yangling and Mianyang in 2019–2020.
3.3 QTL for GL
There were eight QTLs detected for GL, and all eight were identified across all four environments, all of which originated exclusively from the parent PD34 (Figure 2). These stable QTLs were distributed on chromosomes 1B, 2B, 3B, 5D, 6A, and 6D and were named QGLpd.swust-1BL, QGLpd.swust-2BL, QGLpd.swust-3BL.1, QGLpd.swust-3BL.2, QGLpd.swust-5DL, QGLpd.swust-6AL, QGLpd.swust-6DL.1, and QGLpd.swust-6DL.2. QGLpd.swust-1BL was located between IWB19001 and IWB70635 and was mapped to the 415,215,474-bp to 565,932,179-bp region of the CS reference genome on chromosome 1BL, exhibiting phenotypic variance explained (PVE) ranging from 13.5% to 14.9% and an average LOD score of 3.7. QGLpd.swust-2BL was located between IWB40455 and IWB61115 and was mapped to the 697,550,620-bp to 775,179,574-bp region of the CS reference genome on chromosome 2BL, exhibiting PVE ranging from 11.7% to 18.1% and an average LOD score of 4.0. QGLpd.swust-3BL.1 was located between IWB41833 and IWA2177 and was mapped to the 35,322,045-bp to 35,311,024-bp region of the CS reference genome on chromosome 3BL, exhibiting PVE ranging from 9.9% to 16.0% and an average LOD score of 3.8. QGLpd.swust-3BL.2 was located between IWB6177 and IWA6997 and was mapped to the 610,751,868-bp to 633,854,986-bp region of the CS reference genome on chromosome 3B, exhibiting PVE ranging from 12.1% to 17.6% and an average LOD score of 3.9. QGLpd.swust-5DL was located between IWB45948 and IWB36098 and was mapped to the 464,068,639-bp to 465,006,570-bp region of the CS reference genome on chromosome 5D, exhibiting PVE ranging from 10.0% to 14.0% and an average LOD score of 3.1. QGLpd.swust-6AL was located between IWB1549 and IWB33868 and was mapped to the 198,366,375-bp to 530,045,849-bp region of the CS reference genome on chromosome 6A, exhibiting PVE ranging from 15.2% to 17.6% and an average LOD score of 4.7. QGLpd.swust-6DL.1 was located between IWB55825 and IWB71500 and was mapped to the 415,215,474-bp to 565,932,179-bp region of the CS reference genome on chromosome 6DL, exhibiting PVE ranging from 17.2% to 21.3% and an average LOD score of 5.2. QGLpd.swust-6DL.2 was located between IWB63232 and IWB16720 and was mapped to the 270,050,614-bp to 386,162,658-bp region of the CS reference genome on chromosome 6DL, exhibiting PVE ranging from 9.0% to 14.2% and an average LOD score of 3.2.
3.4 QTL for GW
For GW, a total of two QTLs were mapped on chromosomes 3B and 6D, which were designated as QGWpd.swust-3BS and QGWpd.swust-6DL, and were significant in three environments (MY19, YL20, and MY20) (Figure 2). QGWpd.swust-3BS was located between IWB36263 and IWB42152 and was mapped to the 36,464,898-bp to 37,256,012-bp region of the CS reference genome on chromosome 3B, exhibiting PVE ranging from 11.4% to14.6% and an average LOD score of 3.5. QGWpd.swust-6DL was located between IWB42114 and IWB55265 and was mapped to the 469,969,003-bp to 470,043,024-bp region of the CS reference genome on chromosome 6DL, exhibiting PVE ranging from 10.8% to 15.2% and an average LOD score of 3.3.
3.5 QTL for LWR
There were two QTLs for LWR on chromosome 7A, and these were designated as QLWRpd.swust-7AS.1 and QLWRpd.swust-7AL.2 (Figure 2). QLWRpd.swust-7AS.1 was identified in two environments (YL19 and YL20) and was located between IWB32677 and IWB65707. It was mapped to the 206,709,937-bp to 221,680,636-bp region of the CS reference genome on chromosome 7A, exhibiting PVE ranging from 10.9% to 11.6% and an average LOD score of 13.6. QLWRpd.swust-7AL.2 was identified in two environments (MY20 and YL20) and was located between IWB65707 and IWB6761. It was mapped to the 221,680,636-bp to 230,296,776-bp region of the CS reference genome on chromosome 7AS, exhibiting PVE ranging from 11.2% to 11.6% and an average LOD score of 2.9.
3.6 QTL for TGW
One QTL associated with TGW was detected on chromosome 6B, which was detected in two environments (MY19 and MY20) (Figure 2). QTGWpd.swust-6BS was located between IWB55849 and IWB23139 and was mapped to the 17,229,691-bp to 32,324,802-bp region of the CS reference genome on chromosome 6BS, exhibiting PVE ranging from 14.1% to 16.2% and an average LOD score of 4.2.
3.7 QTL for SL
One QTL was identified for SL and was detected in three environments (MY19, YL19, and YL20) (Figure 2). QSLpd.swust-3AL was located between IWB34554 and IWB68722 and was mapped to the 732,779,663-bp to 732,779,682-bp region of the CS reference genome on chromosome 3AL, exhibiting PVE ranging from 16.1% to 17.6% and an average LOD score of 4.5.
3.8 QTL for GNS
One QTL was identified for GNS from MX169 and was detected in two environments (YL19 and YL20). QGNSmx.swust-6DS was located between IWB34573 and IWA5508 and was mapped to the 9,470,596-bp to 13,600,725-bp region of the CS reference genome on chromosome 6DS, exhibiting PVE ranging from 11.4% to 13.8% and an average LOD score of 2.9. The negative additive effect of QGNSmx.swust-6DS suggests its involvement in the reduction of the GNS (Table 2).
3.9 QTL for PH
Five QTLs for PH were identified on chromosomes 2D, 3A, 5A, 6B, and 7B (Figure 2). The negative additive effect of these five QTLs suggests their involvement in the reduction of PH. QPHpd.swust-2DL was identified in two environments (YL19 and YL20) and was located between IWB42352 and IWB3442. It was mapped to the 570,959,528-bp to 572,786,332-bp region of the CS reference genome on chromosome 2DL, exhibiting PVE ranging from 14.8% to 17.4% and an average LOD score of 4.1. QPHpd.swust-3AL was identified in three environments (YL19, MY20, and YL20) and was located between IWB20268 and IWB52753. It was mapped to the 602,919,931-bp to 605,845,913-bp region of the CS reference genome on chromosome 3AL, exhibiting PVE ranging from 15.2% to 19.3% and an average LOD score of 4.3. QPHpd.swust-5AL was identified in two environments (YL19 and YL20) and was located between IWB24934 and IWB4800. It was mapped to the 381,761,549-bp to 382,778,448-bp region of the CS reference genome on chromosome 5AL, exhibiting PVE ranging from 11.3% to 17.2% and an average LOD score of 3.8. QPHpd.swust-6BL was identified in three environments (YL19, MY20, and YL20) and was located between IWB6985 and IWB13533. It was mapped to the 53,636,781-bp to 715,704,861-bp region of the CS reference genome on chromosome 3AL, exhibiting PVE ranging from 13.4% to 16.9% and an average LOD score of 4.1. QPHpd.swust-7BS was identified in two environments (YL19 and YL20) and was located between IWB44542 and IWA3507. It was mapped to the 48,769,162-bp to 58,250,485-bp region of the CS reference genome on chromosome 7BS, exhibiting PVE ranging from 14.1% to 15.0% and an average LOD score of 3.8. The negative additive effects of these QTLs indicate that the identified loci are involved in the reduction of wheat plant height (Table 2).
3.10 Correlation analysis among characteristics
The GL exhibited significant positive correlations with GW, LWR, SL, and TGW, with correlation coefficients of 0.43 (p ≤ 0.001), 0.29 (p ≤ 0.01), 0.45 (p ≤ 0.001), and 0.43 (p ≤ 0.001), respectively. These findings suggest that an increase in GL is advantageous for the enhancement of multiple traits. LWR was highly positively correlated with GL (r = 0.29, p ≤ 0.01) and SL (r = 0.30, p ≤ 0.001), but negatively correlated with GW (r = −0.71, p ≤ 0.001). Moreover, PH displayed negative correlations with GL, LWR, and SL, with correlation coefficients of −0.19 (p ≤ 0.05), −0.31 (p ≤ 0.001), and −0.20 (p ≤ 0.05). Furthermore, GNS was positively correlated with GL (r = 0.23, p ≤ 0.05) and SL (r = 0.67, p ≤ 0.001), suggesting that a longer GL and SL would have a lot more GNS. In addition, TGW was highly positively correlated with GL (r = 0.43, p ≤ 0.001) and GW (r = 0.82, p ≤ 0.001), but was negatively correlated with LWR (r = −0.56, p ≤ 0.001), suggesting that TGW, GL, GW, and LWR have at least some gene(s) in common (Table 3).
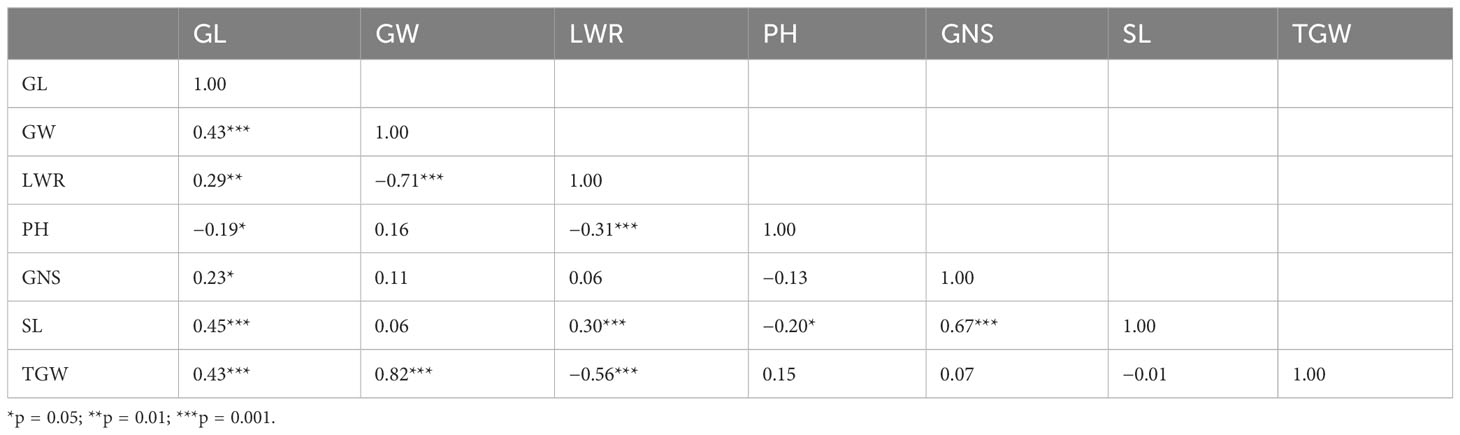
Table 3 Correlation analysis of grain length (GL), grain width (GW), grain length-to-width ratio (LWR), thousand grain weight (TGW), spike length (SL), grain number per spike (GNS), and plant height (PH) based on the mean performance of the Mingxian 169 × Pindong 34 recombinant inbred line population in the four environments (MY19, YL19, MY20, and YL20).
4 Discussion
Enhancement of the agronomic traits is crucial for increasing cereal yield. The identification and validation of the QTLs associated with traits such as PH, GL, GW, TGW, GNS, SL, and LWR significantly contributes to yield improvement. However, direct selection of these complex quantitative traits presents challenges for breeders. Genomic breeding and MAS represent indirect approaches with high-density marker coverage essential for localizing the QTLs within the wheat genome. Using 90K SNP-Chip genotyping and an RIL consisting of 119 lines, this study identified 20 QTLs associated with agronomic traits across 18 regions on 12 chromosomes.
4.1 QTL for GL
In this study, we identified eight QTLs for GL on chromosomes 1B, 1D, 2B, 3B, 4A, 5D, 6A, and 6D. Each of these QTLs originated exclusively from the parent PD34. Collectively, these QTLs explained 9.1%–18.1% of the phenotypic variation. QGLpd.swust-1BL was located between IWB19001 and IWB70635 and was mapped to the 415,215,474-bp to 565,932,179-bp region of the CS reference genome on chromosome 1BL. QKlen.caas.1B.2 (Xiao et al., 2011) is a QTL for GL that was linked to marker Xbarc61 (557,116,000–557,116,146 bp). The physical location of this marker is in proximity to QGLpd.swust-1BL, which we have localized, warranting further discussion and exploration. QGLpd.swust-2BL was located between IWB40455 and IWB61115 and was mapped to the 697,550,620-bp to 775,179,574-bp region of the CS reference genome on chromosome 2BL. Qkl.ncl.2B.1 (Ramya et al., 2010) was linked with markers Xbarc159 and Xwmc317 (644,019,331–783,892,175 bp). Based on the physical location of QGLpd.swust-2BL and Qkl.ncl.2B.1, they might be the same QTLs for GL. QGLpd.swust-3BL.1 was located between IWB41833 and IWA2177 and was mapped to the 35,322,045-bp to 35,311,024-bp region of the CS reference genome on chromosome 3BL. QGLpd.swust-3BL.2 was located between IWB11953 and IWA6997 and was mapped to the 610,751,868-bp to 633,854,986-bp region of the CS reference genome on chromosome 3B. One QTL for GL was located between Tdurum_contig6693_787 and BS00094710_51 (273,250,587–551,894,132 bp) (Russo et al., 2014). Based on the linked markers, QGLpd.swust-3BL.1 and QGLpd.swust-3BL.2 might be the new QTLs for GL. QGLpd.swust-5DL was located between IWB45948 and IWB36098 and was mapped to the 464,068,639-bp to 465,006,570-bp region of the CS reference genome on chromosome 5D. One QTL for GL, QKl.caas.5DL (Li et al., 2018), was linked to the marker IWB65830 (411,170,535 bp) due to the physical location of this marker being close to QGLpd.swust-5D, which we have localized. They might be the same QTLs for GL. QGLpd.swust-6AL was located between IWB1549 and IWB33868 and was mapped to the 198,366,375-bp to 530,045,849-bp region of the CS reference genome on chromosome 6A. The closest marker of QGl.cau.6A.2 (Zhai et al., 2018) was TA005615-0600, and the physical location of TA005615-0600 was 536,437,136–536,437,190 bp. QGLpd.swust-6AL overlapped with QGl.cau.6A.2, and further studies are needed to confirm their relationship. QGLpd.swust-6DL.1 was located between IWB55825 and IWB71500 and was mapped to the 415,215,474-bp to 565,932,179-bp region of the CS reference genome on chromosome 6D. A previous study located a QTL for GL that was located between wPT-3127 and Xcfd45 (459,178,608–460,317,289 bp) (Williams and Sorrells, 2014). QGLpd.swust-6DL.1 overlapped with the QTL located by Williams and Sorrells (2014), but further studies are needed to determine whether they are the same or are different QTLs. QGLpd.swust-6DL.2 was located between IWB63232 and IWB16720 and was mapped to the 270,050,614-bp to 386,162,658-bp region of the CS reference genome on chromosome 6D. The QTL QKl.caas.6DL (Li et al., 2018) was flanked by IWA619 (383,747,905 bp), the physical location of which is within the physical interval of the QGLpd.swust-6DL.2 locus. Consequently, it is imperative to engage in further discussions concerning the potential correlation between them. In conclusion, QGLpd.swust-3BL.1 and QGLpd.swust-3BL.2 might represent new QTLs for GL.
4.2 QTL for GW
Two QTLs were associated with GW on chromosomes 3B and 6D, explaining phenotypic variation rates ranging from 10.8% to 15.2%. The favorable alleles were all contributed by PD34. As no previous reports exist regarding the QTLs associated with GW on chromosome 3BS, it is plausible that QGWpd.swust-3BS represents a novel QTL for GW. The wheat chromosome 6D harbors the genes qKW-6D (Chen et al., 2019) and Q47 (Williams and Sorrells, 2014) for GW. qKW-6D was identified on chromosome 6D, showing close linkage to Xbarc96 (418,280,403 bp). Q47 was linked with the markers wpt-3127 and Xcfd45 (459,178,608–460,317,289 bp). These results suggest that the major QTL for GW identified in this study on chromosome 6D could be an ortholog of qKW-6D and Q47. More detailed studies focusing on this region need to be conducted to establish their relationship.
4.3 QTL for LWR
The QTL for LWR has been rarely reported in wheat. In this study, the LWR QTLs QLWRpd.swust-7AS.1 and QLWRpd.swust-7AS.2 were identified in two environments. Due to the diversity of the molecular markers, it was difficult to align and compare the QTLs detected by these studies. QLWRpd.swust-7AS.1 and QLWRpd.swust-7AS.2 might represent new QTLs for LWR.
4.4 QTL for TGW
The TGW of wheat is an important factor affecting its yield, which is mainly limited by its genetic factors and directly affected by the external living environment (Yao et al., 2019). We detected a QTL for TGW that was present in two environments. QTGWpd.swust-6BS was located between IWB55849 and IWB23139 and was mapped to the 17,229,691-bp to 32,324,802-bp region of the CS reference genome on chromosome 6BS. Elouafi and Nachit (2004) detected a QTL for TGW linked with the marker Xgwm518 (88,998,702–88,998,836 bp) around the centromeric region of chromosome 6B (Elouafi and Nachit, 2004). QTgw.wa.6BS.e2 (Wang et al., 2010) was linked with the marker Xcfd190 (90,117,178 bp). Assanga et al. (2017) also detected a QTL (i.e., QTL 15) for TGW that was associated with the marker IWB8809 (159,367,925 bp) (Assanga et al., 2017). Based on the physical location of the previously reported QTL for TGW, QTGWpd.swust-6BS might represent a new QTL for TGW.
4.5 QTL for SL
In this study, we detected one QTL for SL, QSLpd.swust-3AL, which was identified in three environments and was mapped to the 732,779,663-bp to 732,779,682-bp region of chromosome 3A. Previous studies have successfully mapped several QTLs associated with the regulation of GW, GNS, and other agronomic traits on chromosome 3A (Huang et al., 2004; Bennett et al., 2012; Jia et al., 2013; Gao et al., 2015). The majority of these QTLs are primarily located within the centromeric region (approximately 100–450 Mb), the short arm’s distal end (<25 Mb), or the long arm’s distal end (>625 Mb). Only a limited number of QTLs associated with SL have been mapped on chromosome 3A. For example, Yang et al. (2012) detected a QTL for SL, Qsl3A-4, on chromosome 3A between Xbarc356 and Xbarc314 (172,835,094–712,489,387 bp) that was derived from Triticum polonicum L (Yang et al., 2012). Based on the linked markers and its origin, QSLpd.swust-3AL is unlikely to be Qsl3A-4. In conclusion, QSLpd.swust-3AL might represent a novel QTL for SL.
4.6 QTL for GNS
We identified one QTL for GNS, QGNSmx.swust-6DS, derived from MX169 and flanked by the markers IWB34573 and IWA5508 corresponding to the 9,470,596-bp to 13,600,725-bp region of the CS reference chromosome 6DS, which exhibited PVE ranging from 11.4% to 13.8%. A minor QTL for GNS mapped on chromosome 6DS, QGne.nfcri-6D, was flanked by xcfd42 and xgdm141 and derived from Yu8679, but the physical position of its markers is unknown (Wang et al., 2009). A QTL detected on chromosome 6D for GNS was flanked by tarc0314 and tarc1355 and derived from the Japanese high-yield variety Kitahonami (Mizuno et al., 2021). However, due to the lack of data on the physical location of the markers for the earlier QTL, it was not possible to infer whether the QTLs identified in this study are located in the same location as the QTLs for GNS identified earlier.
4.7 QTL for PH
Specifically, 24 dwarfing genes (Rht1–Rht24) have been catalogued in wheat. However, only a few genes for reduced stature have been used in wheat breeding as most have shown strongly negative effects on grain yield (Chapman et al., 2006; Zhang et al., 2013). Thus, it is important to explore and utilize the new QTLs regulating PH. In this study, we identified five QTLs for PH on chromosomes 2DL, 3AL, 5AL, 6BL, and 7BS. Each of these QTLs originated exclusively from the parent PD34. Collectively, these QTLs explained 11.3%–19.3% of the phenotypic variation. QPHpd.swust-2DL was located between IWB42352 and IWB3442 and was mapped to the 570,959,528-bp to 572,786,332-bp region of the CS reference genome on chromosome 2DL, exhibiting PVE ranging from 14.8% to 17.4%. Liao reported the QTL Qph.cib-2D.3 with the tightly linked markers AX-110094567 and AX-109926918 (484,880,806–494,312,828 bp). QPht.nfcri-2D (Wang et al., 2009), flanked by Xcfd168 (580,011,701 bp) and derived from the Chinese winter cultivar Yu8679, is unlikely to be QPHpd.swust-2DL. QPHpd.swust-3AL was located between IWB20268 and IWB52753 and was mapped to the 602,919,931-bp to 605,845,913-bp region of the CS reference genome on chromosome 3AL, exhibiting PVE ranging from 15.2% to 19.3%. As there are no previous reports on QTLs associated with PH on chromosome 3AL, it is plausible that QPHpd.swust-3AL represents a novel QTL for PH. QPHpd.swust-5AL was located between IWB24934 and IWB4800 and was mapped to the 381,761,549-bp to 382,778,448-bp region of the CS reference genome on chromosome 5AL, exhibiting PVE ranging from 11.3% to 17.2%. Rht12 (Ellis et al., 2005) was mapped to a single locus that was tightly linked to the microsatellite marker WMC410. The physical position of WMC410 was 678,293,793–678,293,910 bp. Rht9 (Ellis et al., 2005) was mapped to a single locus that was tightly linked to the marker BARC151 (558,340,037 bp). QPH.caas.5AL.1 (Li et al., 2018) was mapped between IWB11226 and IWA3827 (476,659,584–524,245,503 bp). The QTL Qph.sau-MC-5A for PH was mapped to the 563,833,704-bp to 568,561,734-bp region of the CS reference genome on chromosome 5A (Guo et al., 2013). QTL Qph.cib.5A.3 was linked with the markers AX-108925104 and AX-108975089 (430,602,625–439,190,927 bp) (Liao et al., 2022). Based on its physical position, QPHpd.swust-5AL might represent a novel QTL for PH. QPHpd.swust-6BL was located between IWB6985 and IWB13533 and was mapped to the 53,636,781-bp to 715,704,861-bp region of the CS reference genome on chromosome 3AL, exhibiting PVE ranging from 13.4% to 16.9%. QPht.dms-6B.2 (Zou et al., 2017) was mapped between Kukri_c59960_211 and Ku_c59960_1939, and its physical position was 570,923,543–641,291,932 bp. QPH.caas-6BL (Li et al., 2018) was mapped between IWB41570 and IWB73837, and its physical position was 687,554,758–710,102,372 bp. QPht.dms-6B.2 and QPH.caas-6BL overlapped with QPHpd.swust-6BL, but further studies are needed to confirm their relationship and to determine their relationships with the other QTLs on chromosome 6BL. QPHpd.swust-7BS was located between IWB44542 and IWA3507 and was mapped to the 48,769,162-bp to 58,250,485-bp region of the CS reference genome on chromosome 7BS, exhibiting PVE ranging from 14.1% to 15.0%. Qph.nau-7B (Jia et al., 2013) was mapped between Xwms537 and Xmag2110. The physical position of Xwms537 was 26,803,596–26,803,806 bp. QHt-7B-1 (Liu et al., 2011) was mapped between Xcau130 and Xgwm537. The physical position of Xgwm537 was 26,803,596–26,803,806 bp. Based on the physical position, QPHpd.swust-7BS might represent a novel QTL for PH. In conclusion, QPHpd.swust-2DL, QPHpd.swust-3AL, QPHpd.swust-5AL, and QPHpd.swust-7BS might represent new QTLs for PH.
Data availability statement
The datasets presented in this study can be found in online repositories. The names of the repository/repositories and accession number(s) can be found in the article/supplementary material.
Author contributions
LZ: Writing – review & editing, Writing – original draft, Formal analysis. YL: Writing – original draft, Formal analysis. XZ: Writing – original draft, Data curation. GJ: Writing – original draft, Investigation. HC: Writing – original draft. YW: Writing – original draft, Data curation. JZ: Writing – original draft, Formal analysis. CM: Writing – original draft, Formal analysis. XL: Writing – original draft, Investigation. KH: Writing – review & editing, Investigation. SY: Writing – review & editing, Investigation. JW: Writing – review & editing, Formal analysis. DH: Writing – review & editing, Resources. YR: Writing – review & editing, Investigation. LC: Writing – review & editing, Supervision. XLZ: Writing – review & editing, Funding acquisition.
Funding
The author(s) declare financial support was received for the research, authorship, and/or publication of this article. This study was financially supported by the Key Research and Development Program of International Science and Technology Innovation Cooperation of Science and Technology Department of Sichuan Province, China (No. 2022YFH0032), and was partially funded by the National Natural Science Foundation of China (No. 32101707), Sichuan Science and Technology Program, China (2022ZDZX0014), Breakthrough in Wheat Breeding Material and Method Innovation and New Variety Breeding (Breeding Research Project, 2021YFYZ0002), PhD Foundation of Southwest University of Science and Technology (No. 19zx7116, 18zx7159), and Longshan Academic Talent Research Support Program of SWUST (No. 17LZX5).
Conflict of interest
The authors declare that the research was conducted in the absence of any commercial or financial relationships that could be construed as a potential conflict of interest.
Publisher’s note
All claims expressed in this article are solely those of the authors and do not necessarily represent those of their affiliated organizations, or those of the publisher, the editors and the reviewers. Any product that may be evaluated in this article, or claim that may be made by its manufacturer, is not guaranteed or endorsed by the publisher.
References
Assanga, S. O., Fuentealba, M., Zhang, G., Tan, C., Dhakal, S., Rudd, J. C., et al. (2017). Mapping of quantitative trait loci for grain yield and its components in a US popular winter wheat TAM 111 using 90K SNPs. PloS One 12, e0189669. doi: 10.1371/journal.pone.0189669
Bennett, D., Izanloo, A., Reynolds, M., Kuchel, H., Langridge, P., Schnurbusch, T. (2012). Genetic dissection of grain yield and physical grain quality in bread wheat (Triticum aestivum L.) under water-limited environments. Theor. Appl. Genet. 125, 255–271. doi: 10.1007/s00122-012-1831-9
Breseghello, F., Sorrells, M. E. (2006). Association mapping of kernel size and milling quality in wheat (Triticum aestivum L.) cultivars. Genetics 172, 1165–1177. doi: 10.1534/genetics.105.044586
Campbell, K. G., Bergman, C. J., Gualberto, D. G., Anderson, J. A., Giroux, M. J., Hareland, G., et al. (1999). Quantitative trait loci associated with kernel traits in a soft × Hard wheat cross. Crop Sci. 39, 1184–1195. doi: 10.2135/cropsci1999.0011183X003900040039x
Chai, L., Xin, M., Dong, C., Chen, Z., Zhai, H., Zhuang, J., et al. (2022). A natural variation in Ribonuclease H-like gene underlies Rht8 to confer "Green Revolution" trait in wheat. Mol. Plant 15, 377–380. doi: 10.1016/j.molp.2022.01.013
Chapman, S. C., Mathews, K. L., Trethowan, R. M., Singh, R. P. (2006). Relationships between height and yield in near-isogenic spring wheats that contrast for major reduced height genes. Euphytica 157, 391–397. doi: 10.1007/s10681-006-9304-3
Chen, W., Sun, D., Yan, X., Li, R., Wang, S., Shi, Y., et al. (2019). QTL analysis of wheat kernel traits, and genetic effects of qKW-6A on kernel width. Euphytica 11, 215. doi: 10.1007/s10681-018-2333-x
Collard, B. C. Y., Mackill, D. J. (2007). Marker-assisted selection: an approach for precision plant breeding in the twenty-first century. Philos. Trans. R. Soc. B: Biol. Sci. 363, 557–572. doi: 10.1098/rstb.2007.2170
Cristina, D., Ciuca, M., Mandea, V., Cornea, C.-P. (2021). Assessment of 25 genes reported to influence thousand grain weight in winter wheat germplasm. Cereal Res. Commun. 50, 237–243. doi: 10.1007/s42976-021-00170-0
Devos, K. M., Millan, T., Gale, M. D. (1993). Comparative RFLP maps of the homoeologous group-2 chromosomes of wheat, rye and barley. Theor. Appl. Genet. 85, 784–792. doi: 10.1007/BF00225020
Ellis, M. H., Rebetzke, G. J., Azanza, F., Richards, R. A., Spielmeyer, W. (2005). Molecular mapping of gibberellin-responsive dwarfing genes in bread wheat. Theor. Appl. Genet. 111, 423–430. doi: 10.1007/s00122-005-2008-6
Elouafi, I., Nachit, M. M. (2004). A genetic linkage map of the Durum × Triticum dicoccoides backcross population based on SSRs and AFLP markers, and QTL analysis for milling traits. Theor. Appl. Genet. 108, 401–413. doi: 10.1007/s00122-003-1440-8
Gao, F., Wen, W., Liu, J., Rasheed, A., Yin, G., Xia, X., et al. (2015). Genome-wide linkage mapping of QTL for yield components, plant height and yield-related physiological traits in the Chinese Wheat Cross Zhou 8425B/Chinese Spring. Front. Plant Sci. 6. doi: 10.3389/fpls.2015.01099
Griffiths, S., Simmonds, J., Leverington, M., Wang, Y., Fish, L., Sayers, L., et al. (2012). Meta-QTL analysis of the genetic control of crop height in elite European winter wheat germplasm. Mol. Breed. 29, 159–171. doi: 10.1007/s11032-010-9534-x
Guo, Y., Sun, J., Zhang, G., Wang, Y., Kong, F., Zhao, Y., et al. (2013). Haplotype, molecular marker and phenotype effects associated with mineral nutrient and grain size traits of TaGS1a in wheat. Field Crops Res. 154, 119–125. doi: 10.1016/j.fcr.2013.07.012
Hedden, P. (2003). The genes of the green revolution. Trends Genet. 19, 5–9. doi: 10.1016/s0168-9525(02)00009-4
Huang, X. Q., Kempf, H., Ganal, M. W., Roder, M. S. (2004). Advanced backcross QTL analysis in progenies derived from a cross between a German elite winter wheat variety and a synthetic wheat (Triticum aestivum L.). Theor. Appl. Genet. 109, 933–943. doi: 10.1007/s00122-004-1708-7
Jia, H., Wan, H., Yang, S., Zhang, Z., Kong, Z., Xue, S., et al. (2013). Genetic dissection of yield-related traits in a recombinant inbred line population created using a key breeding parent in China's wheat breeding. Theor. Appl. Genet. 126, 2123–2139. doi: 10.1007/s00122-013-2123-8
Juliana, P., Poland, J., Huerta-Espino, J., Shrestha, S., Singh, R. P. (2019). Improving grain yield, stress resilience and quality of bread wheat using large-scale genomics. Nat. Genet. 51, 1530–1539. doi: 10.1038/s41588-019-0496-6
Juliana, P., Singh, R. P., Singh, P. K., Poland, J. A., Bergstrom, G. C., Huerta-Espino, J., et al. (2018). Genome-wide association mapping for resistance to leaf rust, stripe rust and tan spot in wheat reveals potential candidate genes. Theor. Appl. Genet. 131, 1405–1422. doi: 10.1007/s00122-018-3086-6
Kumar, A., Mantovani, E. E., Seetan, R., Soltani, A., Echeverry-Solarte, M., Jain, S., et al. (2016). Dissection of Genetic Factors underlying Wheat Kernel Shape and Size in an Elite x Nonadapted Cross using a High Density SNP Linkage Map. Plant Genome 9, 1–22. doi: 10.3835/plantgenome2015.09.0081
Kumari, S., Jaiswal, V., Mishra, V. K., Paliwal, R., Balyan, H. S., Gupta, P. K. (2018). QTL mapping for some grain traits in bread wheat (Triticum aestivum L.). Physiol. Mol. Biol. Plants 24, 909–920. doi: 10.1007/s12298-018-0552-1
Kwok, P. Y. (2001). Methods for genotyping single nucleotide polymorphisms. Annu. Rev. Genomics Hum. Genet. 2, 235–258. doi: 10.1146/annurev.genom.2.1.235
Li, F., Wen, W., He, Z., Liu, J., Jin, H., Cao, S., et al. (2018). Genome-wide linkage mapping of yield-related traits in three Chinese bread wheat populations using high-density SNP markers. Theor. Appl. Genet. 131, 1903–1924. doi: 10.1007/s00122-018-3122-6
Li, M. X., Wang, Z. L., Liang, Z. Y., Shen, W. N., Sun, F. L., Xi, Y. J., et al. (2015). Quantitative trait loci analysis for kernel-related characteristics in common wheat (Triticum aestivum L.). Crop Sci. 55, 1485–1493. doi: 10.2135/cropsci2014.09.0616
Liao, S. M., Feng, B., Xu, Z. B., Fan, X. L., Zhou., Q., Ji, G. S., et al. (2022). Detection of QTLs for plant height in wheat based on the 55K SNP array. Chin. J. Appl. Environ. Biol. 28, 576–581. doi: 10.19675/j.cnki.1006-687x.2021.02059
Liu, G., Xu, S., Ni, Z., Xie, C., Qin, D., Li, J., et al. (2011). Molecular dissection of plant height QTLs using recombinant inbred lines from hybrids between common wheat (Triticum aestivum L.) and spelt wheat (Triticum spelta L.). Chin. Sci. Bull. 56, 1897–1903. doi: 10.1007/s11434-011-4506-z
Meng, L., Li, H., Zhang, L., Wang, J. (2015). QTL IciMapping: Integrated software for genetic linkage map construction and quantitative trait locus mapping in biparental populations. Crop J. 3, 269–283. doi: 10.1016/j.cj.2015.01.001
Mizuno, N., Ishikawa, G., Kojima, H., Tougou, M., Kiribuchi-Otobe, C., Fujita, M., et al. (2021). Genetic mechanisms determining grain number distribution along the spike and their effect on yield components in wheat. Mol. Breed. 41, 62. doi: 10.1007/s11032-021-01255-8
Rafalski, A. (2002). Applications of single nucleotide polymorphisms in crop genetics. Curr. Opin. Plant Biol. 5, 94–100. doi: 10.1016/S1369-5266(02)00240-6
Ramya, P., Chaubal, A., Kulkarni, K., Gupta, L., Kadoo, N., Dhaliwal, H. S., et al. (2010). QTL mapping of 1000-kernel weight, kernel length, and kernel width in bread wheat (Triticum aestivum L.). J. Appl. Genet. 51, 421–429. doi: 10.1007/BF03208872
Ray, D. K., Mueller, N. D., West, P. C., Foley, J. A. (2013). Yield trends are insufficient to double global crop production by 2050. PloS One 8, e66428. doi: 10.1371/journal.pone.0066428
Russo, M. A., Ficco, D. B. M., Laidò, G., Marone, D., Papa, R., Blanco, A., et al. (2014). A dense durum wheat×T. dicoccum linkage map based on SNP markers for the study of seed morphology. Mol. Breed. 34, 1579–1597. doi: 10.1007/s11032-014-0181-5
Simmonds, J., Scott, P., Leverington-Waite, M., Turner, A. S., Brinton, J., Korzun, V., et al. (2014). Identification and independent validation of a stable yield and thousand grain weight QTL on chromosome 6A of hexaploid wheat (Triticum aestivum L.). BMC Plant Biol. 14, 191. doi: 10.1186/s12870-014-0191-9
Sun, X. Y., Wu, K., Zhao, Y., Kong, F. M., Han, G. Z., Jiang, H. M., et al. (2009). QTL analysis of kernel shape and weight using recombinant inbred lines in wheat. Euphytica 165, 615–624. doi: 10.1007/s10681-008-9794-2
Tyagi, S., Mir, R. R., Balyan, H. S., Gupta, P. K. (2015). Interval mapping and meta-QTL analysis of grain traits in common wheat (Triticum aestivum L.). Euphytica 201, 367–380. doi: 10.1007/s10681-014-1217-y
Wang, R. X., Hai, L., Zhang, X. Y., You, G. X., Yan, C. S., Xiao, S. H. (2009). QTL mapping for grain filling rate and yield-related traits in RILs of the Chinese winter wheat population Heshangmai x Yu8679. Theor. Appl. Genet. 118, 313–325. doi: 10.1007/s00122-008-0901-5
Wang, J., Liu, W., Wang, H., Li, L., Wu, J., Yang, X., et al. (2010). QTL mapping of yield-related traits in the wheat germplasm 3228. Euphytica 177, 277–292. doi: 10.1007/s10681-010-0267-z
Wiersma, J. J., Busch, R. H., Fulcher, G. G., Hareland, G. A. (2001). Recurrent selection for kernel weight in spring wheat. Crop Sci. 41, 568–572. doi: 10.2135/cropsci2001.414999x
Williams, K., Munkvold, J., Sorrells, M. (2013). Comparison of digital image analysis using elliptic Fourier descriptors and major dimensions to phenotype seed shape in hexaploid wheat (Triticum aestivum L.). Euphytica 190, 99–116. doi: 10.1007/s10681-012-0783-0
Williams, K., Sorrells, M. E. (2014). Three-dimensional seed size and shape QTL in hexaploid wheat (Triticum aestivumL.) populations. Crop Sci. 54, 98–110. doi: 10.2135/cropsci2012.10.0609
Xiao, Y., He, S., Yan, J., Zhang, Y., Zhang, Y., Wu, Y., et al. (2011). Molecular mapping of quantitative trait loci for kernel morphology traits in a non-1BL.1RS×1BL.1RS wheat cross. Crop Pasture Sci. 62, 625–638. doi: 10.1071/cp11037
Xiao, J., Liu, B., Yao, Y. Y., Guo, Z. F., Jia, H. Y., Kong, L. R., et al. (2022). Wheat genomic study for genetic improvement of traits in China. Sci. China-Life Sci. 65, 1718–1775. doi: 10.1007/s11427-022-2178-7
Yan, X., Sun, D., Li, R., Wang, S., Ma, G., Cao, Y., et al. (2019). Mapping quantitative trait loci for important agronomic traits and developing potential near-isogenic lines in wheat. Int. J. Agric. Biol. 22, 20–28. doi: 10.17957/IJAB/15.1028
Yang, R., Liu, L. Z., Li, H., Zhong, H., Yang, X. S., Wang, Z. L., et al. (2012). QTL Analysis of Spike Traits in an Recombinant Inbred Lines (RILs) Population Derived from the Cross of Triticum polonicum ×T. aestivum Line Zhong 13. J. Agric. Biotechnol. 20, 506–513. doi: 10.3969/j.issn.1674-7968.2012.05.006
Yao, Y. R., Lv, L. H., Zhang, L. H., Yao, H. P., Dong, Z. Q., Zhang, J. T., et al. (2019). Genetic gains in grain yield and physiological traits of winter wheat in Hebei Province of China, from 1964 to 2007. Field Crops Res. 239, 114–123. doi: 10.1016/j.fcr.2019.03.011
Zhai, H., Feng, Z., Du, X., Song, Y., Liu, X., Qi, Z., et al. (2018). A novel allele of TaGW2-A1 is located in a finely mapped QTL that increases grain weight but decreases grain number in wheat (Triticum aestivum L.). Theor. Appl. Genet. 131, 539–553. doi: 10.1007/s00122-017-3017-y
Zhang, J., Dell, B., Biddulph, B., Drake-Brockman, F., Walker, E., Khan, N., et al. (2013). Wild-type alleles of Rht-B1 and Rht-D1 as independent determinants of thousand-grain weight and kernel number per spike in wheat. Mol. Breed. 32, 771–783. doi: 10.1007/s11032-013-9905-1
Zhou, X. L., Han, D. J., Chen, X. M., Gou, H. L., Guo, S. J., Rong, L., et al. (2014). Characterization and molecular mapping of stripe rust resistance gene Yr61 in winter wheat cultivar Pindong 34. Theor. Appl. Genet. 127, 2349–2358. doi: 10.1007/s00122-014-2381-0
Zhou, X. L., Li, X., Han, D. J., Yang, S. Z., Kang, Z. S., Ren, R. S. (2022). Genome-wide QTL mapping for stripe rust resistance in winter wheat pindong 34 using a 90K SNP array. Front. Plant Sci. 13. doi: 10.3389/fpls.2022.932762
Zhou, X. L., Zhong, X., Roter, J., Li, X., Yao, Q., Yan, J. H., et al. (2021). Genome-wide mapping of loci for adult-plant resistance to stripe rust in durum wheat svevo using the 90K SNP array. Plant Dis. 105, 879–888. doi: 10.1094/Pdis-09-20-1933-Re
Keywords: wheat, agronomic traits, wheat 90K SNP array, genetic map, QTL
Citation: Zhang L, Luo Y, Zhong X, Jia G, Chen H, Wang Y, Zhou J, Ma C, Li X, Huang K, Yang S, Wang J, Han D, Ren Y, Cai L and Zhou X (2024) Genome-wide QTL mapping for agronomic traits in the winter wheat cultivar Pindong 34 based on 90K SNP array. Front. Plant Sci. 15:1369440. doi: 10.3389/fpls.2024.1369440
Received: 12 January 2024; Accepted: 11 March 2024;
Published: 04 April 2024.
Edited by:
Fengyun Ma, The Ohio State University, United StatesReviewed by:
Jindong Liu, Chinese Academy of Agricultural Sciences, ChinaJianbo Li, The University of Sydney, Australia
Copyright © 2024 Zhang, Luo, Zhong, Jia, Chen, Wang, Zhou, Ma, Li, Huang, Yang, Wang, Han, Ren, Cai and Zhou. This is an open-access article distributed under the terms of the Creative Commons Attribution License (CC BY). The use, distribution or reproduction in other forums is permitted, provided the original author(s) and the copyright owner(s) are credited and that the original publication in this journal is cited, in accordance with accepted academic practice. No use, distribution or reproduction is permitted which does not comply with these terms.
*Correspondence: Xinli Zhou, ZWxpNjk1MUBzaW5hLmNvbQ==; Lin Cai, bGluY2FpQGd6dS5lZHUuY24=
†These authors have contributed equally to this work