 Chuangchao Zou
 Yushuai Wang
 Renchao Zhou
 Tian Tang
- State Key Laboratory of Biocontrol and Guangdong Key Laboratory of Plant Resources, School of Life Sciences, Sun Yat-sen University, Guangzhou, Guangdong, China
Understanding the genetic basis of local adaption is crucial in the context of global climate change. Mangroves, as salt-tolerant trees and shrubs in the intertidal zone of tropical and subtropical coastlines, are particularly vulnerable to climate change. Kandelia obovata, the most cold-tolerant mangrove species, has undergone ecological speciation from its cold-intolerant counterpart, Kandelia candel, with geographic separation by the South China Sea. In this study, we conducted whole-genome re-sequencing of K. obovata populations along China’s southeast coast, to elucidate the genetic basis responsible for mangrove local adaptation to climate. Our analysis revealed a strong population structure among the three K. obovata populations, with complex demographic histories involving population expansion, bottleneck, and gene flow. Genome-wide scans unveiled pronounced patterns of selective sweeps in highly differentiated regions among pairwise populations, with stronger signatures observed in the northern populations compared to the southern population. Additionally, significant genotype-environment associations for temperature-related variables were identified, while no associations were detected for precipitation. A set of 39 high-confidence candidate genes underlying local adaptation of K. obovata were identified, which are distinct from genes under selection detected by comparison between K. obovata and its cold-intolerant relative K. candel. These results significantly contribute to our understanding of the genetic underpinnings of local adaptation in K. obovata and provide valuable insights into the evolutionary processes shaping the genetic diversity of mangrove populations in response to climate change.
1 Introduction
Understanding the evolutionary processes and genetic basis of local adaptation has been a longstanding interest in evolutionary biology (Hoban et al., 2016; López-Goldar & Agrawal, 2021). Abiotic and biotic effects such as low and high temperature, drought, flooding, herbivore and pathogen stresses impose different selective pressures across habitats (Vanwallendael et al., 2019). The interactions among selection, gene flow and genetic drift shape genetic variation within and between populations, leading to evolutionary differentiation at different spatial scales (Orsini et al., 2013; von Takach, Penton, et al., 2021). Local adaptation can occur when genetic differentiation allows a single population to become better adapted in a particular set of environmental conditions within its range (Angert et al., 2020). The genomic architecture of natural populations thus provides an opportunity to reveal and link molecular mechanisms underlying species’ phenotypic diversity with diverse environments in which the species lives. This knowledge is important for informing management decisions in the context of rapid contemporary environmental changes (Isabel et al., 2020).
Climate adaptation is one of the most prevalent forms of local adaptation that has significant impact on the distribution of a species. Classical experimental approaches explore to which extent morphological, physiological and transcriptional responses are associated with changes in environmental factors, typically through transplants and common gardens (Carley et al., 2021; Oomen & Hutchings, 2022). Nevertheless, as most traits are polygenic, genes involved in ecological, physiological, or transcriptional changes may only be weakly related to fitness. With recent advance of sequencing technology, population genetic or genomic analyses are typically utilized to identify selective signatures linked to local adaptation, with allele frequencies expected to demonstrate ecological differentiation or correlation with specific environmental factors (von Takach, et al., 2021; Hu et al., 2022; Wang J. et al., 2022). As adaptation to climate change progresses, genetically distinct populations undergoing local adaptation may eventually become separate species if they no longer interbreed or exchange genes. Therefore, studying the genetic basis of climate adaptation can also provide insights into the evolutionary processes leading to the fixation of genetic differentiation and subsequent speciation (Levin, 2019; Dool et al., 2022).
Mangroves are a group of phylogenetically diverse woody plants that inhabit tropical and subtropical intertidal zones with great ecological and economical significance (Tomlinson, 1986; Sribianti et al., 2021). At the dynamic interface between sea and land, the structure and biodiversity of mangrove communities are sensitive to climate change (Jennerjahn et al., 2017). Mangrove forests have faced and survived several catastrophic climate change events since their origination during the Late Cretaceous-Early Tertiary period (Singh et al., 2022). Sea-level rise significantly influences the historical distribution of mangrove forests, leading to speciation in five common mangrove species via multiple cycles of mixing, isolation, and mixing (Lovelock et al., 2015; He et al., 2022). Meanwhile, low temperature stress governs the latitudinal range limits for contemporary mangrove flora (Lin, 1999) and plays a crucial role in mangrove afforestation and restoration (Ellison, 2000; Quisthoudt et al., 2012; Su et al., 2021; Chen et al., 2023). Given the ecological importance of mangroves and the potential impact of climate change on their habitats, further research into their adaptation to low temperatures is vital. The complex demographic histories of mangroves involving bottleneck, genetic drift, population expansion, and gene flow also provide a challenge for studying local adaptation.
Kandelia obovata, regarded as the most cold-tolerant mangrove species, is able to survive chilling temperatures as low as 4.2°C (Maxwell, 1995; Sheue et al., 2003; Zhou et al., 2007). This species can be found from the Gulf of Tonkin in the northeast to southern Japan, separated from its cold-intolerant relative, K. candel, by the South China Sea (Sheue et al., 2003), representing a good case in point for ecological speciation. Besides the clear differences in cold tolerance between Kandelia species, common garden studies have identified a greater cold tolerance in the northern populations of K. obovata compared to the southern populations (Sheue et al., 2003; Zhao et al., 2021), indicating the occurrence of local adaptation within K. obovata. Whole-genome bisulfite sequencing and RNA-seq of the K. obovata transplants suggest that modifications of DNA methylation in MADS-box genes may contribute to the adaptation to new environments, whereas the suppressed expression of lignin biosynthesis genes appears to play a role in maladaptation (Zhao et al., 2021). Additionally, the physiological and expressional analyses have highlighted several key genes and pathways that are potentially involved in cold tolerance in K. obovata, such as genes involved in calcium signaling, cell wall modification, and post-translational modifications of ubiquitination pathways (He et al., 2023). However, how genetic differentiation is maintained and whether the same genes underlying local adaptation to cold stress within species can also be responsible for between-species differences in cold tolerance remain largely unknown.
In this study, we investigated the genomic architecture of K. obovata populations along a latitudinal gradient in China using whole-genome resequencing, based on the chromosome-anchored genome assembly of K. obovata (Hu et al., 2020). Our analysis aimed to infer the demographic history and detect selective signatures within K. obovata populations, with the underlying hypothesis that local adaptation has occurred despite gene flow, driven by strong selection pressures related to temperature. We expected the signatures of local adaptation to be more pronounced in the northern population compared to the southern population. Moreover, we identified candidate genes under selection by comparing polymorphism within K. obovata with divergence between K. obovata and K. candel. We expected that the genes involved in local adaptation within K. obovata would differ from those under selection in the lineage of K. obovata since its divergence from K. candel.
2 Materials and Methods
2.1 Plant materials and population resequencing
We sampled leaves from a total of 46 K. obovata individuals, collecting plants at least 20 meters apart within each of three natural populations along the southeast coast of China (Supplementary Table S1). Specifically, we collected 14 individuals from Shacheng Harbor (Fuding, Fujian Province), 17 from Yanzao Village (Shenzhen, Guangdong Province), and 15 from Bamen Bay (Wenchang, Hainan Province). The fresh leaves were air-dried with silica gel before DNA extraction. Genomic DNA was then extracted using a modified CTAB protocol (Yang et al., 2008). Subsequently, DNA libraries were obtained using Nextera Mate Pair Sample Preparation Kit (Illumina USA), followed by whole-genome re-sequencing on an Illumina HiSeq 2500 platform (Illumina, San Diego, CA, USA) with paired-end reads of 150 bp (PE150). The average sequencing depth for each individual was approximately 40× (Supplementary Table S1).
2.2 Reads mapping, variant callings and SNP filtering
A high-quality chromosome-scaled assembly of the K. obovata genome, with a total length of 177 Mb, was published using PacBio, Illumina and Hi-C sequencing (Hu et al., 2020) and served as the reference genome for this study. Raw Illumina reads were initially processed by trimming and filtering using Trimmomatic v0.39 (Bolger et al., 2014), followed by mapping onto the K. obovata reference genome using Burrows-Wheeler-Alignment (BWA) v0.7.12-r1039 (Li & Durbin, 2009). Subsequently, sorted bam files were generated from sam files using SAMtools v1.6 (Li et al., 2009), and PCR duplicates were removed using MarkDuplicates in the Picard toolkit. Variants were called using HaplotypeCaller and genotyped using GenotypeGVCFs in Genome Analysis Tool Kit (GATK) (McKenna et al., 2010). The analysis solely focused on single nucleotide polymorphism sties (SNPs) and employed specific filtering criteria to reduce false positives: (1) SNPs with a read number less than three for each individual were removed; (2) SNPs with a minor allele frequency (MAF) less than 0.05 were discarded; (3) SNPs were further filtered using VariantFiltration with the following parameters: quality by depth (QD) < 2.0, Fisher strand (FS) > 60.0, mapping quality (MQ) < 40.0, mapping quality tank sum test (MQRankSum) > -12.5, and read pos rank sum test (ReadPosRankSum) < -8.0. Finally, SNP annotation was conducted based on the K. obovata genome using snpEff 4.3t (Cingolani et al., 2012). Following sequence alignment, removal of PCR duplicates, and SNP filtering, a set of high-quality SNPs sites were retained for the subsequent analyses.
2.3 Genetic diversity and population differentiation
The entire K. obovata genome was divided into non-overlapping 20-kb bins. Nucleotide diversity (θπ; Tajima, 1989) for each K. obovata population and fixation index (FST; Weir & Cockerham, 1984) between pairwise populations were calculated within each bin using VCFtools v0.1.15 (Danecek et al., 2011). Pairwise genetic distance (DXY; Nei & Miller, 1990) between populations were calculated within each bin using pixy v1.2.7 (Korunes & Samuk, 2021).
2.4 Population structure analysis
A principal component analysis (PCA) was performed to visualize inter-individual genetic relationships using PLINK v1.90 (Purcell et al., 2007). A phylogenetic tree based on the high-quality SNPs was constructed using IQtree (Nguyen et al., 2015) with the parameter: -m GTR+F+G4+ASC, for which the input PHYLIP file was converted using vcf2phylip.py (https://doi.org/10.5281/zenodo.1257058). The number of genetic clusters (K) was identified using ADMIXTURE v1.3.0 with default parameters (Alexander et al., 2009). Various values of K ranging from 2 to 5 were tested, and the best K was selected based on the minimum error rate of K value.
2.5 Demographic modelling
The demographic history of K. obovata was inferred based on its observed population structure through the construction of a two-dimensional joint unfolded site frequency spectrum (2D-SFS) using the easySFS tools (https://github.com/isaacovercast/easySFS#easysfs), with all SNPs and the projection number equal to the individual number (i.e. 14, 17 and 15) for each of the three populations, respectively. We considered various scenarios of divergence, bottleneck, expansion, and/or migration, which were represented by different models: (i) Models 1-4: Divergence, including one-step isolation in model 1 and three two-step isolations of the K. obovata populations in models 2-4; (ii) Model 5-7: Bottleneck, with one population experiencing the reduction of population size and then recovery; (iii) Model 8-10: Expansion, with one population experiencing exponential population changes; (iv) Model 11-14: Migration, with asymmetric gene flow and differences in occurrence between different populations; (v) Model 15: Composite model incorporating each of the estimated best scenario for divergence (Model 1), bottleneck (Model 6), expansion (Model 10), and migration (Model 14) (Supplementary Figure 1).
These demographic models were compared, and demographic parameters were inferred using a coalescent simulation-based method as implemented in fastsimcoal2.6 (Excoffier et al., 2021). The initial ranges for the parameter estimation were listed in Supplementary Table S2. The log-likelihood for a set of demographic parameters was estimated using 100,000 coalescent simulations, with 80 conditional maximum algorithm cycles in each run and global maximum likelihood estimates obtained from 100 independent runs. The maximum likelihood value of the 100 independent runs for each model was used to compare between models using the Akaike information criterion (AIC) and Akaike’s weight of evidence tests. The model with the highest Akaike’s weight value was considered as the optimal model. The parameter confidence intervals (CIs) for the optimal model were obtained from 100 parametric bootstrap samples, independently run 100 times in each bootstrap. When converting estimates to years, it was assumed that the mutation rate and the average generation interval time in K. obovata were 7.86 × 10⁻⁸ per site per generation and 20 years per generation (average time from seed germination to seed production), respectively (He et al., 2022).
2.6 Detection of positive selection
Sliding window analysis was employed to detect outlier genomic regions with strong population differentiation using pairwise fixation index (FST) and the cross-population composite likelihood ratio (XP-CLR) test (Chen et al., 2010) with a 20-kb window size and 5-kb step size. Pairwise FST estimates were calculated using VCFtools v0.1.15. The XP-CLR test was performed using the xpclr python module (https://github.com/hardingnj/xpclr) with default parameters. Outlier windows with both FST and normalized XP-CLR values at least 1.96 standard deviations (SD) above the mean (one-tailed p-value = 0.025) were identified as the highly differentiated regions (HDRs). Sliding window analysis of Fay and Wu’s H-statistic (Fay & Wu, 2000) in HDRs was conducted for each population separately, in comparison with the whole genome, using ANGSD v0.921 (Korneliussen et al., 2014) with a 20-kb window size and 5-kb step size.
To detect positively selected genes, the McDonald-Kreitman (MK) test (McDonald & Kreitman, 1991) was conducted using whole-genome resequencing data for all K. obovata individuals obtained in this study and the reference genome of K. candel (He et al., 2022) as an outgroup. BlastN (Altschul et al., 1990) was used to identify homologous genes between the two Kandelia species using an e-value threshold of < 1e-10, resulting in the identification of 16,536 one-to-one orthologous genes. The number of non-synonymous (Dn) and synonymous (Ds) substitutions were compared to the number of non-synonymous (Pn) and synonymous (Ps) polymorphisms within K. obovata for coding sequences of each Kandelia homologous gene using K. candel as an outgroup. Genes with p-value lower than 0.05 in the one side Fisher’s exact test with Benjamini-Hochberg multiple test (Benjamini & Hochberg, 1995) correction were classified as positively selected genes.
2.7 Genotype-environment associations
Redundancy analysis (RDA) was used to identify associations between SNP variations across diverse populations and environmental parameters (Forester et al., 2018). Climate data including the mean annual temperature, mean annual minimum temperature, and mean annual precipitation for the three sampling locations were obtained from the Central Meteorological Observatory (http://www.nmc.cn/). The RDA was conducted using the RDA function from the vegan package (Oksanen et al., 2007) with the input file of genotype matrix comprising all SNPs as transformed by PLINK v1.90. Genotypes at each SNP site was encoded as follows: 0 for homozygotes identical to the reference, 1 for heterozygotes, and 2 for homozygotes differing from the reference. The proportion of variance explained by the environmental variables was evaluated using the RsquareAdj function. The significance of the linear relationship between each constrained axis and the environmental variables was then assessed using the anova.cca function. In this study, two constrained axes (RDA1 and RDA2) were found to be significant. Outlier SNPs for each significant constrained axis were identified using a cutoff of 1.96 SD greater or less than mean (two-tailed p-value = 0.05) and were annotated with known genes based on the K. obovata genome.
2.8 K. obovata gene functional annotation and GO enrichment analysis
To annotate the K. obovata genes, BlastP (Altschul et al., 1990) was used to identify homologous genes between the K. obovata and Arabidopsis thaliana using an e-value threshold of < 1e-10. Gene Ontology (GO) functions of each K. obovata gene were annotated using eggNOG-mapper (Cantalapiedra et al., 2021). To evaluate potential over-representation of functional gene classes, we conducted GO enrichment analysis using the R package ClusterProfiler (Yu et al., 2012) by applying the annotation mentioned above. The statistical significance of over-represented GO terms within the input gene sets was assessed through Fisher’s exact tests, with a significance threshold set at False Discovery Rate (FDR) < 0.2.
3 Results
3.1 Genomic data and genetic diversity
A total of 0.82 Tb of data with an average sequencing depth of approximately 40× per individual were obtained for the 46 K. obovata individuals from the three populations, representing the natural distribution of K. obovata from north to south in China (Table 1; Figure 1A). After quality control and filtering, the clean reads were mapped to the reference genome of K. obovata, achieving an average mapping rate of 93.33%. The average depth of uniquely mapped reads per site was 40.23 (Supplementary Table S1). In total, we obtained 189,909 high-confidence single nucleotide polymorphism (SNP) sites, corresponding to an average density of 1.07 SNPs per kilobase in the K. obovata genome. Out of these SNPs, 25,988 (13.7%) were in protein-coding regions, including exons and introns, 27,551 (14.5%) were found in putative regulatory regions, including promoters (2kb upstream of TSS) and UTRs, and the majority (56.7%) were intergenic (Supplementary Figure 2).
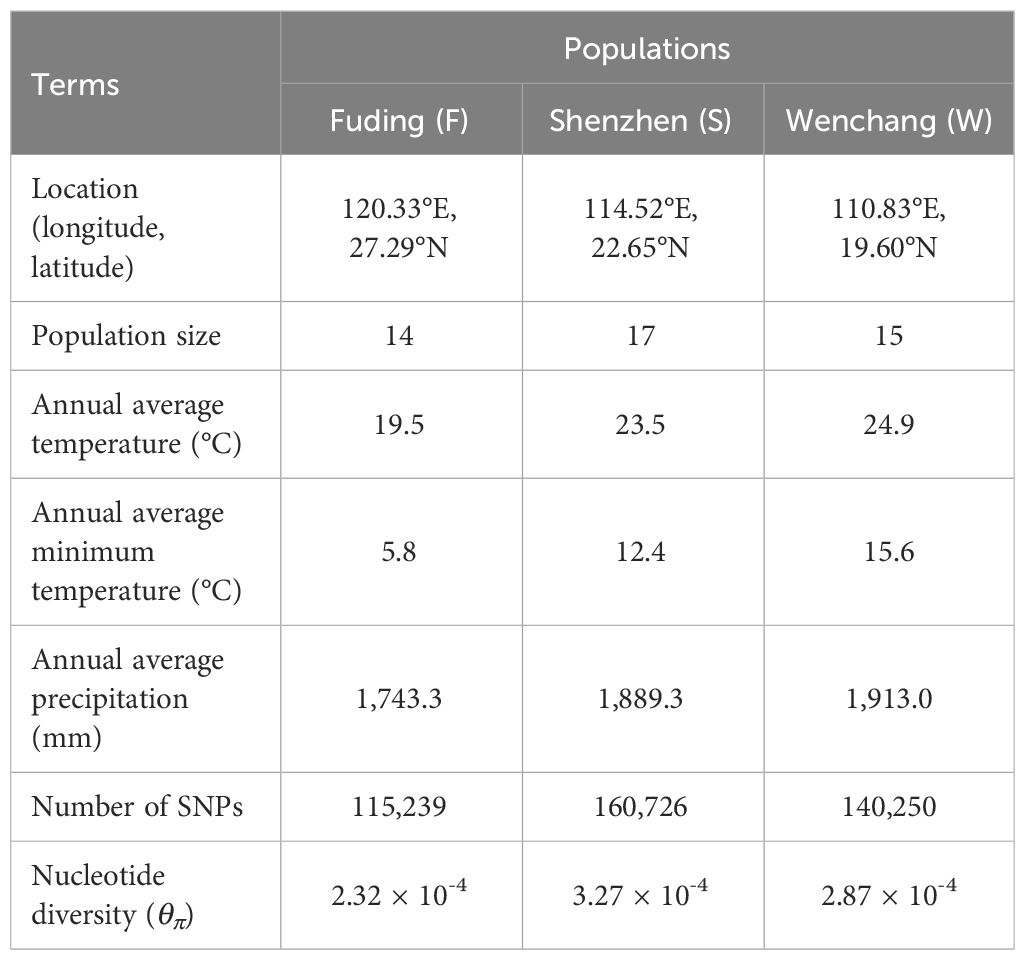
Table 1 Sampling information and genetic measures of three K. obovata populations.
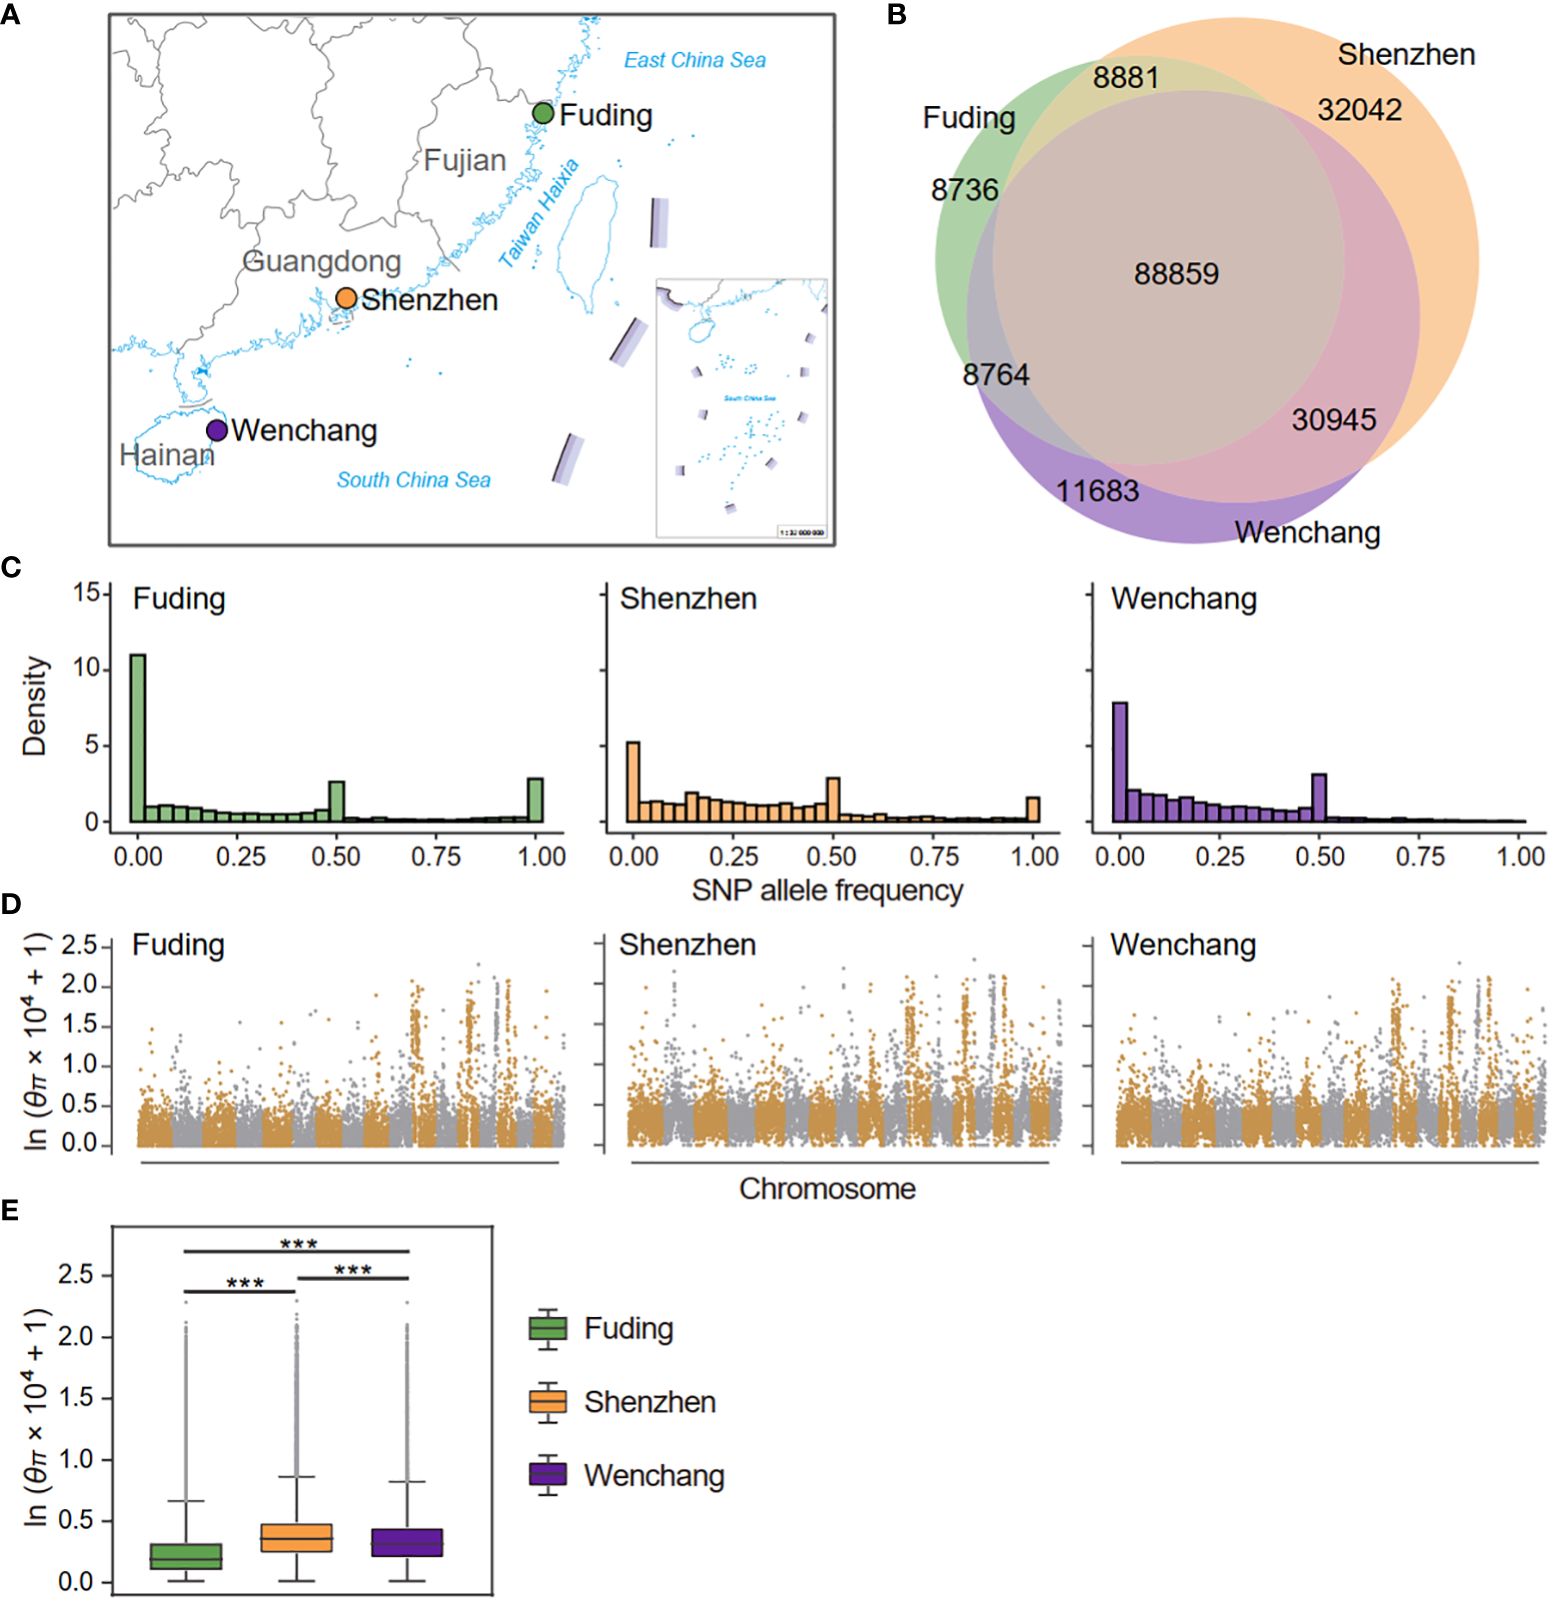
Figure 1 Sampling locations and genetic diversity of three populations of Kandelia obovata in China. (A) Map depicting the sampling locations of the Fuding (n = 14), Shenzhen (n = 17), and Wenchang (n = 15) populations in China. (B) Venn diagrams show the numbers of shared and private SNPs detected in the three K obovata populations. (C) Site frequency spectra based on 189,909 SNPs in each population. (D) Genome-wide analysis of nucleotide diversity (θπ) in each K obovata populations. θπ was calculated in nonoverlapping 20-kb bins and displayed in logarithmic scale across the K obovata genome. (E) Boxplot displaying the distribution of θπ in three K obovata populations. Asterisks indicate the significance level of Mann-Whitney U test: ***p-value < 0.001.
When comparing between populations, the number of high-confidence SNP sites was highest for the Shenzhen population (160,726), followed by the Wenchang (140,250) and Fuding (115,239) population. The number of private or population-specific SNPs were 8,736, 32,042, and 11,683 for the Fuding, Shenzhen and Wenchang populations, respectively (Figure 1B). The site frequency spectrum of individual K. obovata populations revealed that the Fuding populations had the highest proportion (16.7%) of fixed SNPs followed by the Shenzhen population (5.5%), while only 75 SNPs (0.6%) were fixed in the Wenchang population (Figure 1C). However, the Wenchang population had a higher percentage (9.4%) of rare SNPs (frequency < 0.05), than the Fuding (5.8%) and Shenzhen population (4.4%, Figure 1C). Meanwhile, all three populations possessed considerable medium-frequency SNPs, indicating a high level of heterozygosity within individuals of K. obovata (Figure 1C).
We divided the K. obovata genome into 20-kb non-overlapping bins and used Tajima’s π (θπ) as a measurement of nucleotide diversity at the individual SNP level. The average nucleotide diversity per site was calculated for each bin and compared between populations of K. obovata. Nucleotide diversity was unevenly distributed across the K. obovata genome, with the most pronounced diversity observed in chromosomes 11, 13, 14 and 15 (Figure 1D). Consistent with the observed number of high-quality SNPs, the Shenzhen population exhibited the highest nucleotide diversity averaged across the genome (mean ± SD, θπ = 3.27 × 10⁻⁴ ± 9.63 × 10⁻⁴), followed by the Wenchang population (θπ = 2.87 × 10⁻⁴ ± 8.64 × 10⁻⁴), while the Fuding population showed the lowest nucleotide diversity (θπ = 2.32 × 10⁻⁴ ± 8.87 × 10⁻⁴) (Figure 1E). The differences in nucleotide diversity between pairwise populations were all significant (Mann-Whitney U test, all p-value < 0.05; Figure 1E).
3.2 Genetic differentiation and population structure
To assessed population differentiation, the fixation index FST (Weir and Cockerham, 1984) and the average nucleotide diversity DXY (Nei & Miller, 1990) were calculated for each SNP and averaged within each bin for pairwise populations of K. obovata (Figure 2). FST values revealed substantial population differentiation, particularly evident when comparing the Fuding population with the others: Fuding vs. Shenzhen (FST = 0.30 ± 0.19) and Fuding vs. Wenchang (FST = 0.30 ± 0.16), in contrast to Shenzhen vs. Wenchang (FST = 0.24 ± 0.13) (Table 1 and Figure 2A). DXY values were similar among pairs of populations (DXY = 0.30 ± 0.15 to 0.33 ± 0.11), all supporting a high level of population differentiation in K. obovata (Figure 2B). The principal component analysis (PCA) revealed a clear clustering pattern, indicating that individuals within a population tend to group together and are distinctly separated from individuals in other populations (Figure 2C). Similarly, the structure analysis indicated that the pattern of ancestry was best represented by K = 3, which is supported by the lowest minimum K-value error rate (cross-validation error = 0.41) (Figure 2D). The three clusters that resulted from K = 3 clearly separated individuals according to their population origination. When K = 2, individuals from Fuding population formed a cohesive cluster, while individuals from Shenzhen and Wenchang clustered together. Subsequent analyses at K values of 4 and 5 revealed highly variable levels of admixture within the Shenzhen and Wenchang populations. However, there is no significant admixture within the genetic cluster in Fuding population, indicating a relatively more isolated genetic profile for this population.
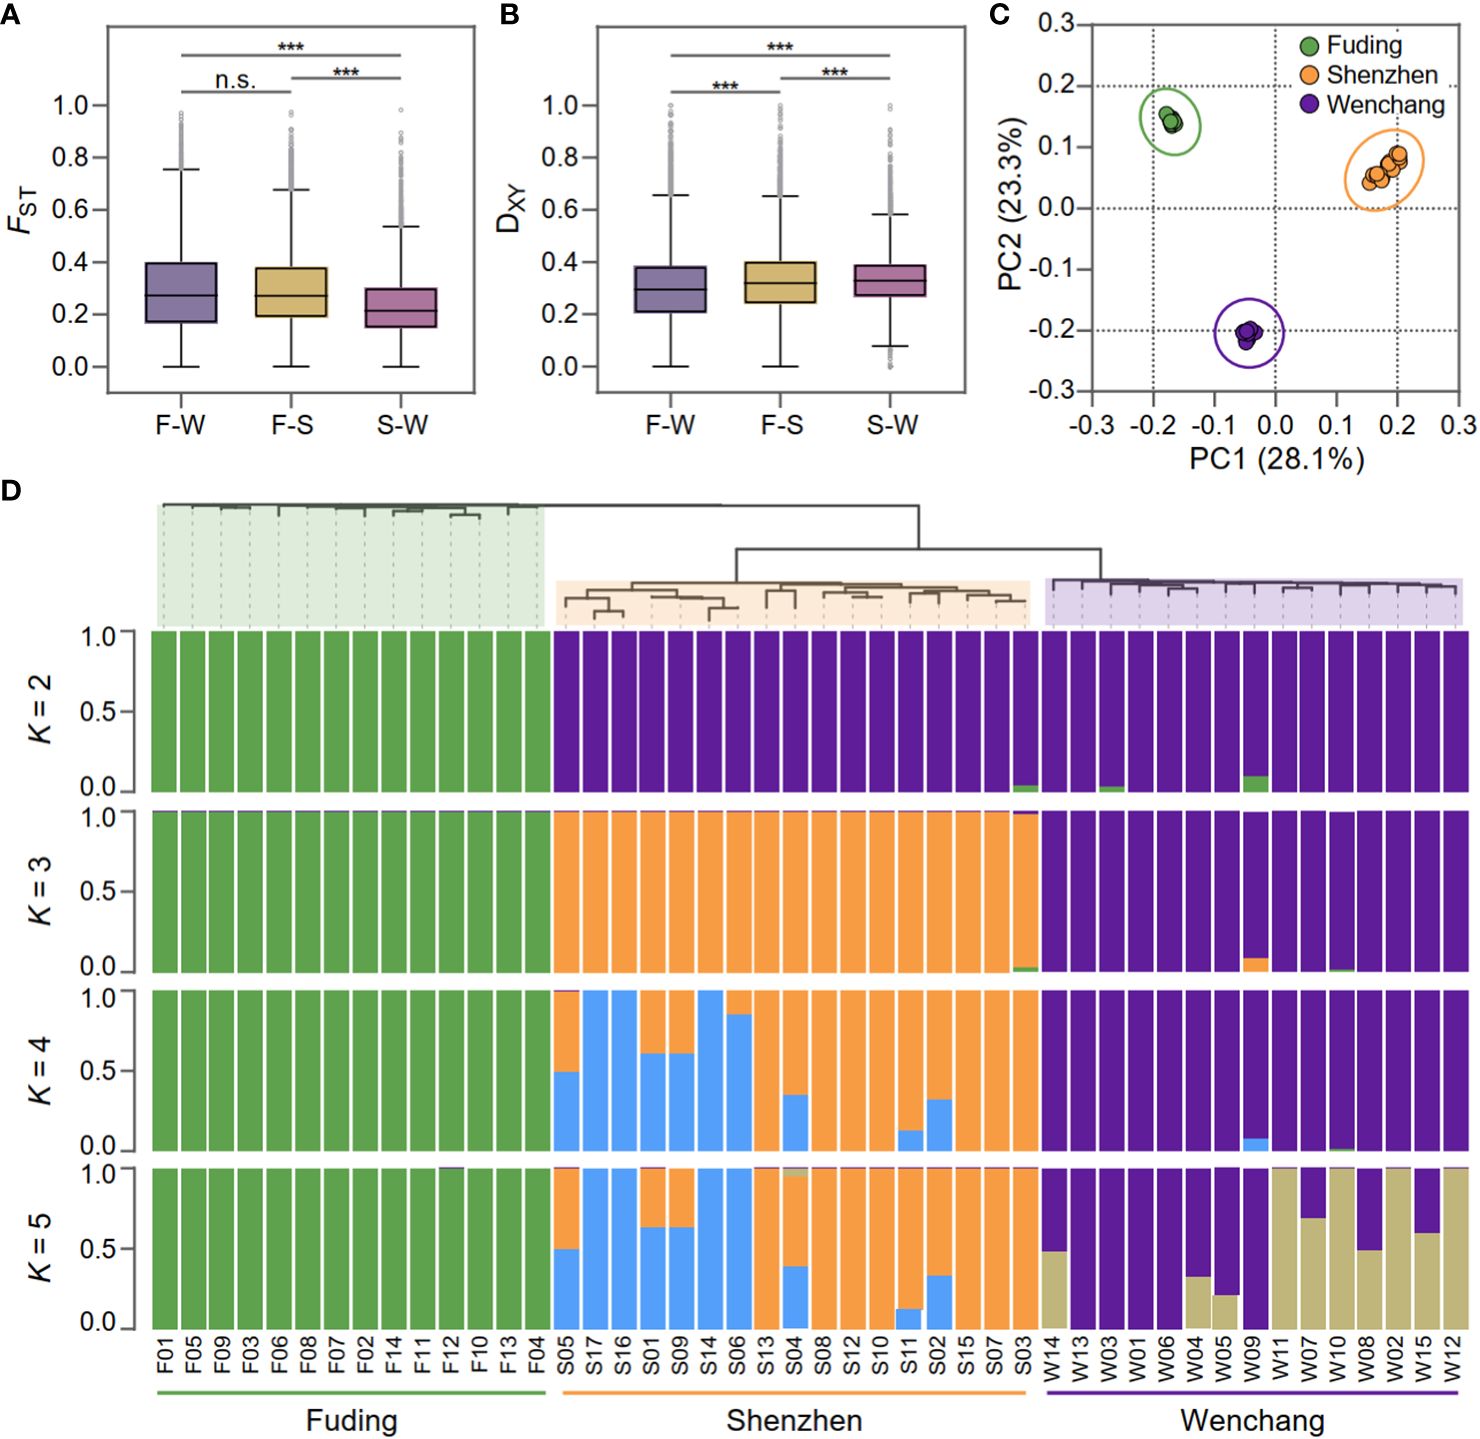
Figure 2 Population differentiation and genetic structure of Kandelia obovata. (A) Boxplot displaying the genome-wide distributions of fixed index (FST) in three pairwise populations: F-W (Fuding vs. Wenchang population), F-S (Wenchang vs. Shenzhen population), and S-W, (Wenchang vs. Shenzheng population). (B) Boxplot displaying genome-wide distributions of genetic divergence (DXY) in the same three pairwise populations. Asterisks indicate the significance level of Mann-Whitney U test: ***, p-value < 0.001; “n.s.”, non-significant. (C) Principal components analysis (PCA) based on 189,909 SNPs showing genetic separation among the 46 K. obovata samples. Principal components 1 (28.1%) and principal components 2 (23.3%) are shown. (D) Phylogenetic tree of individuals and population genetic structure. Each individual is represented by a vertical bar, which is partitioned into K (K = 2, 3, 4, and 5) colored segments reflecting the individual's probability of membership to each genetic cluster.
3.3 Inference of demographic history
The optimal demographic model (model 15; log-likelihood = -1089415.63, AIC = 2178865.27, ΔAIC = 0), as shown in Figure 3 and Supplementary Table 3, supports a composite history inclusive of divergence, bottleneck, expansion, and migration of K. obovata. With a generation time of 20 years and mutation rate of 7.86 × 10⁻⁸ per site per generation (He et al., 2022), the optimal demographic model suggests that the three K. obovata populations diverged from their ancestral population with an effective population size (Ne) of 57,833 (95% CI: [33,569, 120,531]) approximately 93,080 years ago (95% CI: [43,800, 24,175,600]). This coincides the late onset of the last glacial period, marked by highly unstable sea levels. Subsequently, the Fuding population underwent a gradual population expansion with a growth rate of 1.05e-4 (95% CI: [1.58e-7, 4.41e-4]), increasing from an Ne of 4,319 (95% CI: [265, 19,075]) to 6,142 (95% CI: [874, 40,402]). In contrast, the ancestral Shenzhen population, with an Ne of 17,072 (95% CI: [265, 19,075]), experienced a ten-thousand-year bottleneck around 45,000 years ago (95% CI: [15,320, 269,360]), coinciding with the start of the last glacial maximum. The Wenchang population maintained a consistently small value of Ne of 778 (95% CI: [564, 5,884]) over the last hundred thousand years with minimal fluctuation. Migration rates per generation between populations varied substantially, with gene flow mainly occurring from Fuding to Wenchang (mFW) at a rate of 6.35e-4 (95% CI: [3.88e-5, 1.03e-3] and from Shenzhen to Wenchang (mSW = 2.62e-4, 95% CI: [3.41e-5, 7.70e-4]) or Fuding (mSF = 1.48e-4, 95% CI: [1.63e-5, 2.47e-4]), while the others were relatively small (Figure 3).
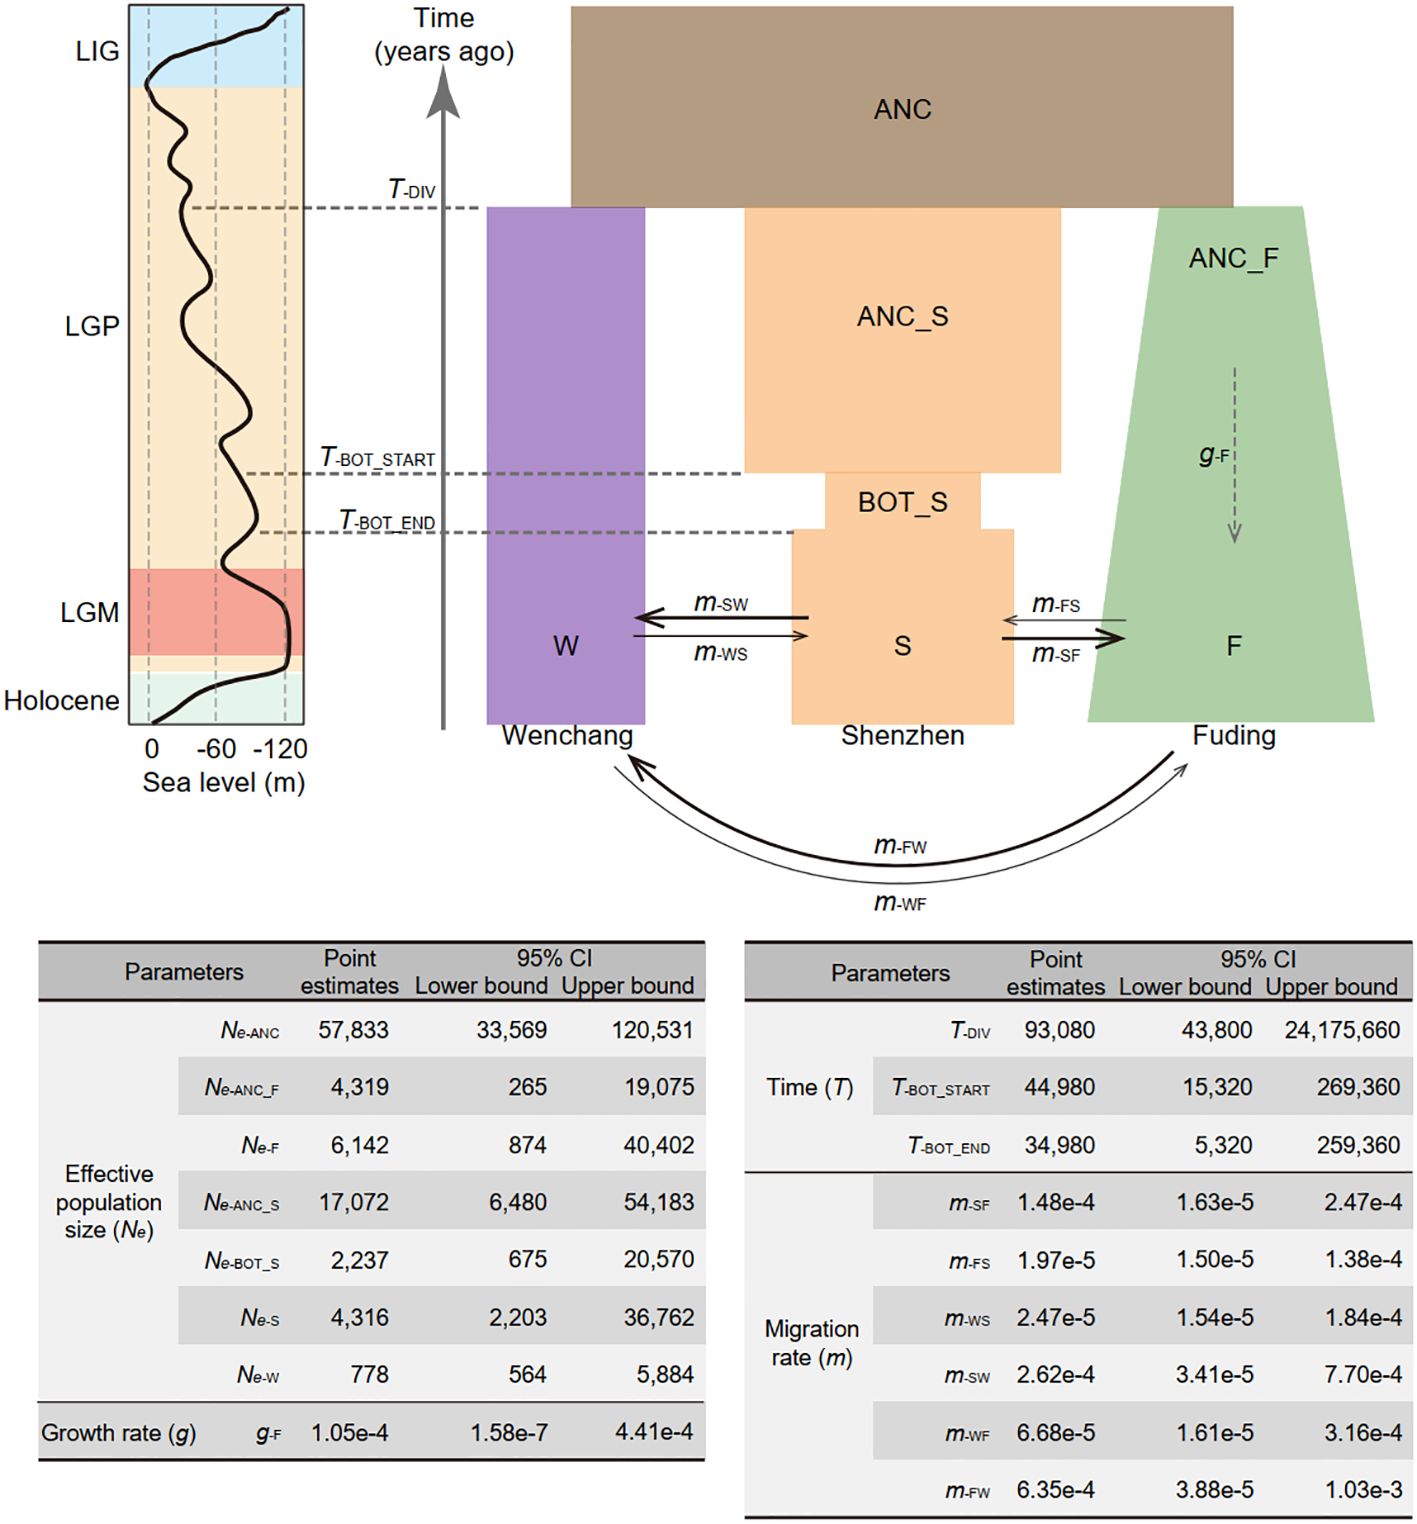
Figure 3 Demographic model depicting the population history of Kandelia obovata in China. Populations are represented by rectangles in distinct colors: ancestral population (ANC) in brown, Wenchang population (W) in purple, Shenzhen population (S) in orange, and Fuding population (F) in green. Changes in the width of each rectangle reflects changes in population size. Solid arrows denote gene flow between pairwise populations, with arrow direction indicating the direction of gene flow. The dashed arrow signifies population expansion in the Fuding population. Point estimates of demographic parameters, including effective population size (Ne), population size growth rate (g), time (T), and migration rate (m), along with their 95% confidence intervals (CI), are presented below the demographic model. The parameters were estimated using a neutral mutation rate per site per generation (µ) of 7.86 × 10⁻⁸ and a generation time of 20 years for K. obovata. The line chart on the left illustrates the relative sea levels during the last glacial period, depicting the last interglacial period (LIG), the last glacial period (LGP), and the last glacial maximum (LGM).
Notably, both the Shenzhen and Fuding populations have experienced changes in population size according to the best model. Despite high genetic diversity, a model that assumed a bottleneck occurred in the Shenzhen population (model 6; log-likelihood = -1091480.43, AIC = 2182978.86, ΔAIC = 4113.594) was more likely than one assuming a bottleneck in the Fuding population (model 7; log-likelihood = -1091661.914, AIC = 2183341.828, ΔAIC = 4476.562) (Supplementary Figure 1 and Supplementary Table 3). In contrast, although the Fuding population is marginal, a model that assumed expansion in the Fuding population (model 10; log-likelihood = -1091358.265, AIC = 2182730.53, ΔAIC = 3865.26) was more likely than in the other two populations (Supplementary Figure 1 and Supplementary Table 3).
3.4 Detection of positive selection
Sliding widow analysis of population differentiation used a cutoff of at least 1.96 SD above the mean (p < 0.025) to detect highly differentiated outliers for both FST and XP-CLR values. For the FST values, 1452, 1457, and 1494 outliers were detected for three pairwise comparisons: Fuding and Wenchang (F-W), Fuding and Shenzhen (F-S), and Shenzhen and Wenchang (S-W), respectively (Figures 4A–C). For XP-CLR values, 125, 264, and 430 outliers were detected for the same pairwise comparisons (Figures 4A–C). The regions where both methods detected outliers were considered as the highly differentiated regions (HDRs) or the candidate regions for selection. Sliding window analysis of Fay and Wu’s H-statistic (Fay & Wu, 2000), designed to detect high-frequency hitchhiking alleles associated with selective sweeps, revealed significantly lower H values in HDRs than in the whole genome for each of the three populations (Mann-Witney U test, all p-value < 0.001; Supplementary Figure 3), suggesting selective sweeps occurred in HDRs of each population. Negative H values were observed in HDRs of the Fuding (mean ± SD, H-statisic= -2.43 ± 3.22) and Shenzhen populations (H-statistic = -2.43 ± 2.12), but not in the Wenchang population (H-statistic= 0.13 ± 1.03; Supplementary Figure 3), indicating that selective signatures of HDRs are stronger in the two northern populations compared to the Wenchang population.
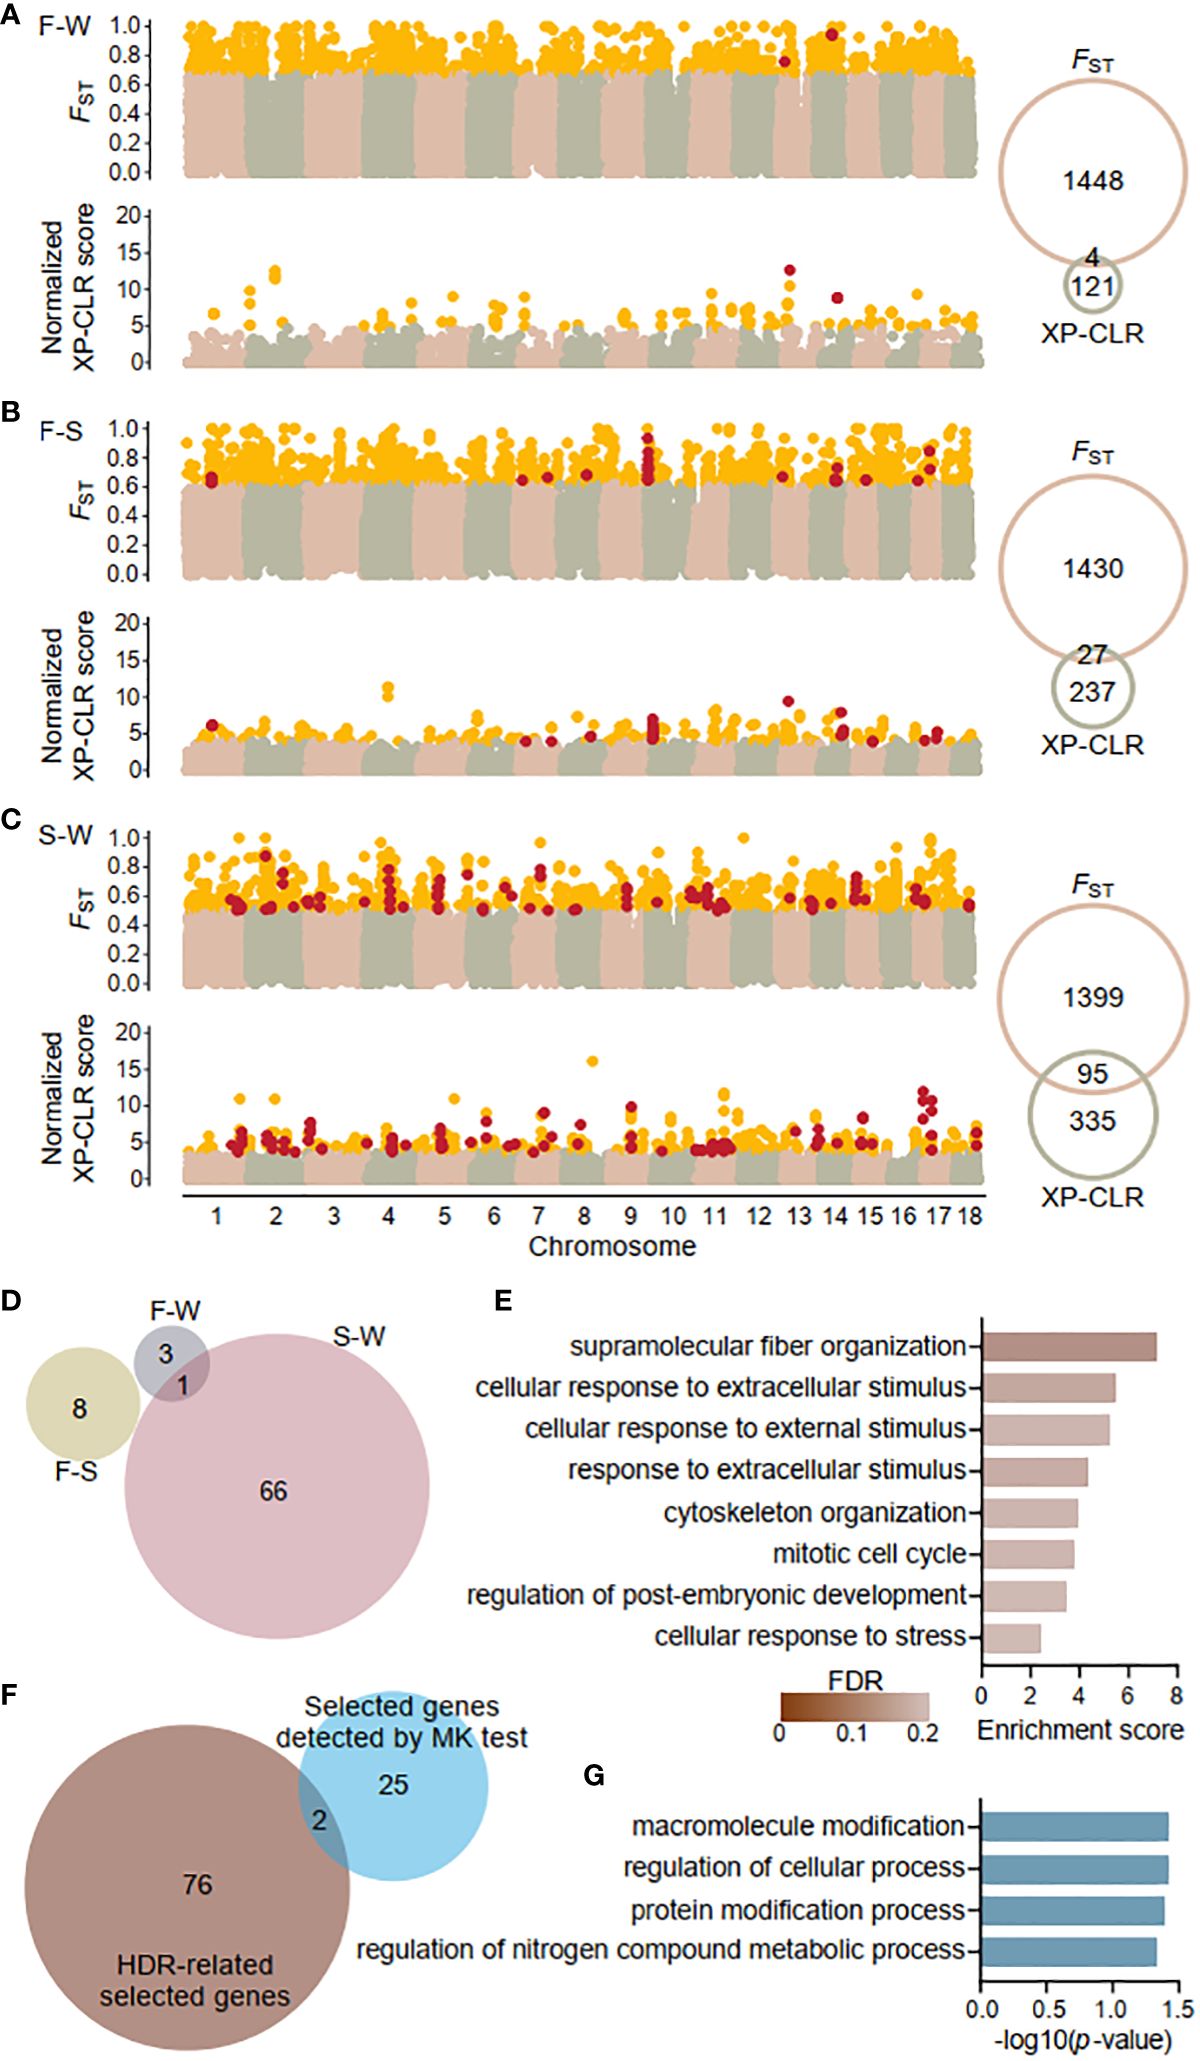
Figure 4 Genome wide signatures of selection and selected genes. Sliding window analysis of fixation index (FST) and cross-population composite likelihood ratio (XP-CLR) with 20-kb window size and 5-kp step size across the K obovata genome for pairwise populations: (A) Fuding and Wenchang population (F-W), (B) Fuding and Shenzhen population (F-S), and (C) Shenzhen and Wenchang population (S-W). Outlier values (defined as at least 1.96 SD above the mean) are indicated in gold. Venn diagrams show the number of outliers identified by each method. Windows exhibiting both FST and XP-CLR outliers were identified as highly differentiated regions (HDRs) and indicated in red. (D) Venn diagrams showing the numbers of genes residing in HDRs that were identified in the three comparison pairs. All 78 genes identified as HDR-related selected genes are listed in Supplementary Table S4. (E) Bar plot displaying the enriched Gene Ontology (GO) terms of biological process of HDR-related selected genes. (F) Venn diagrams showing the overlaps between the 78 HDR-related selected genes and the 27 selected genes identified by the McDonald-Kreitman test (MK test). Genes detected by MK test are listed in Supplementary Table S5. (G) Bar plot displaying the enriched GO terms of biological process of 27 selected genes identified by the MK test.
A total of 4, 27, and 95 HDRs were identified for the F-W, F-S, and S-W comparisons, respectively, comprising 4, 8, and 67 genes and a total of 2,868 SNPs (Figure 4D; Supplementary Table 4). Among them, 77 genes were identified in a single population pair, while one gene, Plant U-box 45 (PUB45; Maker00002595), was shared by the F-W and S-W comparisons. Notably, no genes were shared by all three comparisons, resulting in a total of 78 genes in HDRs (Figure 4D). Furthermore, Gene Ontology (GO) analysis revealed that the identified genes are enriched in functional categories of supramolecular fiber organization (GO: 0097435) and those related to response to stimuli, including cellular response to extracellular stimulus (GO: 0031668), cellular response to external stimulus (GO: 0071496), response to extracellular stimulus (GO: 0009991), and cellular response to stress (GO: 0033554). Additionally, other enriched functional categories are involved in cell cycles and the regulation of developmental process (Figure 4E).
Using K. candel as an outgroup, we also detected genes under positive selection by the McDonald-Kreitman (MK) test (McDonald & Kreitman, 1991). Applying the G test of independence described in the original MK test, we identified 27 genes with a positive selection signature at a cutoff of an adjusted p-value < 0.05 (Supplementary Table S5). Only two genes, AP2-like ethylene-responsive transcription factor 1 (AIL1; Maker00004062) participating in the ethylene-activated signaling pathway (Kim et al., 2006) and callose synthase 5 (CALS5; Maker00007136) involved in the regulation of pollen tube growth (Dong et al., 2005) were also found in the list of HDRs-related selected genes (Figure 4F). The 27 candidate genes were enriched in housekeeping functional categories including macromolecule modification (GO: 0043412), regulation of cellular process (GO: 0050794), protein modification process (GO: 0036211), and regulation of nitrogen compound metabolic process (GO: 0034641) with a significance threshold of p-value < 0.05 (Figure 4G). However, none of these overrepresentations retained significant after FDR correction, likely due to the limited size of gene list.
3.5 Genotype-environment associations
The three populations, located at different latitudes, differ in their local environments. Redundancy analysis (RDA) detected significant associations between SNPs and two environmental variables (F-statistics, both p-value < 0.001), the mean annual temperature (MAT) and the mean annual minimum temperature (MAMT), but not between SNPs and the mean annual precipitation (MAP, Supplementary Figure 4A). This suggests that temperature is the primary environmental variable shaping population differentiation. Two constrained axes (RDA1 and RDA2) explained about 29% of the total variation. Using a cutoff of 1.96 SD greater or less than mean (two-tailed p-value = 0.05), a total of 16,256 environment-associated SNPs were identified as candidate SNPs involved in local adaptation (Figure 5; Supplementary Figure 4B). The temperature-related SNPs exhibited distinct patterns of allele frequency spectrum compared to genome-wide SNPs in all three populations (Kolmogorov-Smirnov test, p-value < 2.2 × 10⁻¹⁶ for all comparisons), characterized by an elevated proportion of fixed SNPs in the Fuding and Shenzhen populations (Figure 5C). Among the 16,256 temperature-associated SNPs, 1,118 were located in the HDRs, indicating a significant enrichment of temperature-associated SNPs in HDRs compared to the whole genome (χ2 test, p-value < 2.2 × 10⁻¹⁶; Figure 5D). These temperature-related SNPs are within 1,074 genes which were enriched in a range of functional categories involved in sexual reproduction, DNA repair, cell death, cell cycle and immune response (Supplementary Table S6).
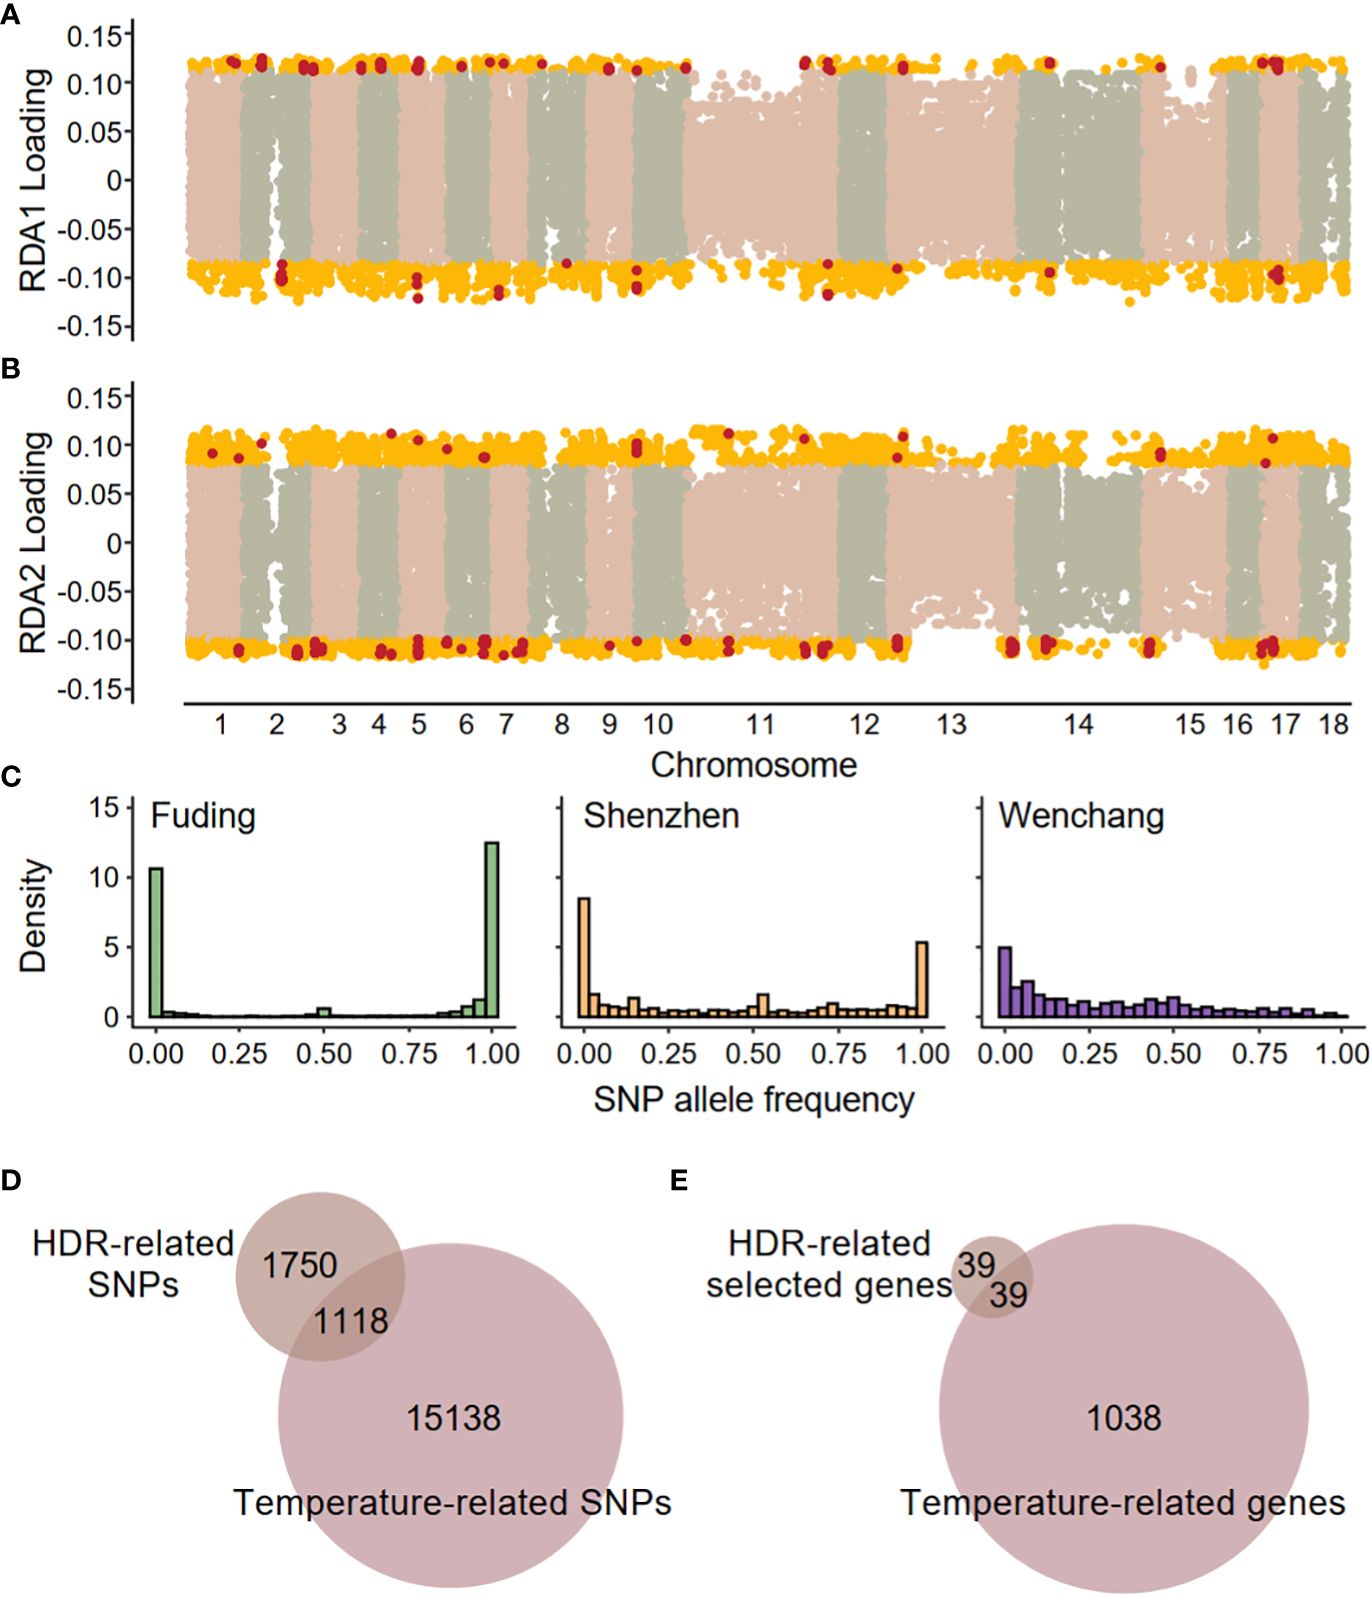
Figure 5 Genome–environment associations detected by redundancy analysis (RDA). SNP loadings on (A) the first RDA axis (RDA1) and (B) the second RDA axis (RDA2). The gold dots represent SNPs with significant associations along the RDA axes (defined as 1.96 standard deviations below or above the mean), and these SNPs are identified as temperature-related SNPs. The red dots represent SNPs located in highly differentiated regions (HDRs). (C) Site frequency spectra based on 16,256 temperature-related SNPs in each population. (D) Venn diagrams showing the overlaps between HDR-related SNPs and temperature-related SNPs. (E) Venn diagrams showing the overlaps between HDR-related selected genes and temperature-related genes. A total of 39 shared genes were identified as high-confidence candidate genes responsible for local temperature adaptation and are listed in Table 2.
A total of 39 genes containing temperature-associated SNPs within their exons and located within HDRs were finally identified (Figure 5E). These genes, consisting of 2, 6, and 32 for the F-W, F-S, and S-W comparisons, respectively, were considered as high-confidence candidates underlying local adaptation to temperature in K. obovata (Table 2). In the F-W comparison, two genes were identified, namely Plant U-box 45 (PUB45; Maker00002595) and a gene (Maker00006413) containing eight temperature-associated SNPs but no homolog in Arabidopsis (Table 2). Plant U-box 45, known for its function in protein ubiquitination and cold response (He et al., 2023), was also identified as a high-confidence candidate in the S-W comparison. Notably, the high-confidence candidates in the F-S comparison with known functions included CRY2 interacting splicing factor 1 (CIS1; Maker00002948) involved in the regulation of flowering (Zhao et al., 2022), tRNA pseudouridine synthase A 5 (TRUA5, Maker00014866) involved in RNA modification, Pol-like 5 (PLL5; Maker00017856) participating in leaf development (Song & Clark, 2005), a 2-oxoglutarate (2OG) and Fe(II)-dependent oxygenase superfamily protein (Maker00003467), and a UDP-N-acetylglucosamine (UAA) transporter family gene (Maker00018193). Meanwhile, for the S-W comparison, candidate genes were found to be responsive to cold and other stresses, such as growth-regulating factor 5 (GRF5; Maker00004032; Lantzouni et al., 2020), ATP-binding cassette G40 (ABCG40; Maker00008456; Baron et al., 2012) and Integrin-linked kinase 1 (ILK1; Maker00007966; Brauer et al., 2016), or participate in various development processes, such as cryptochrome 1 (CRY1; Maker00010750) involved in flowering (Gao et al., 2023), cotton Golgi-related 2 (CGR2; Maker00005232) involved in leaf morphogenesis (Kim et al., 2015) and lonesome highway (LHW; Maker00018105) involved in root development (Ohashi-Ito & Bergmann, 2007) (Table 2).
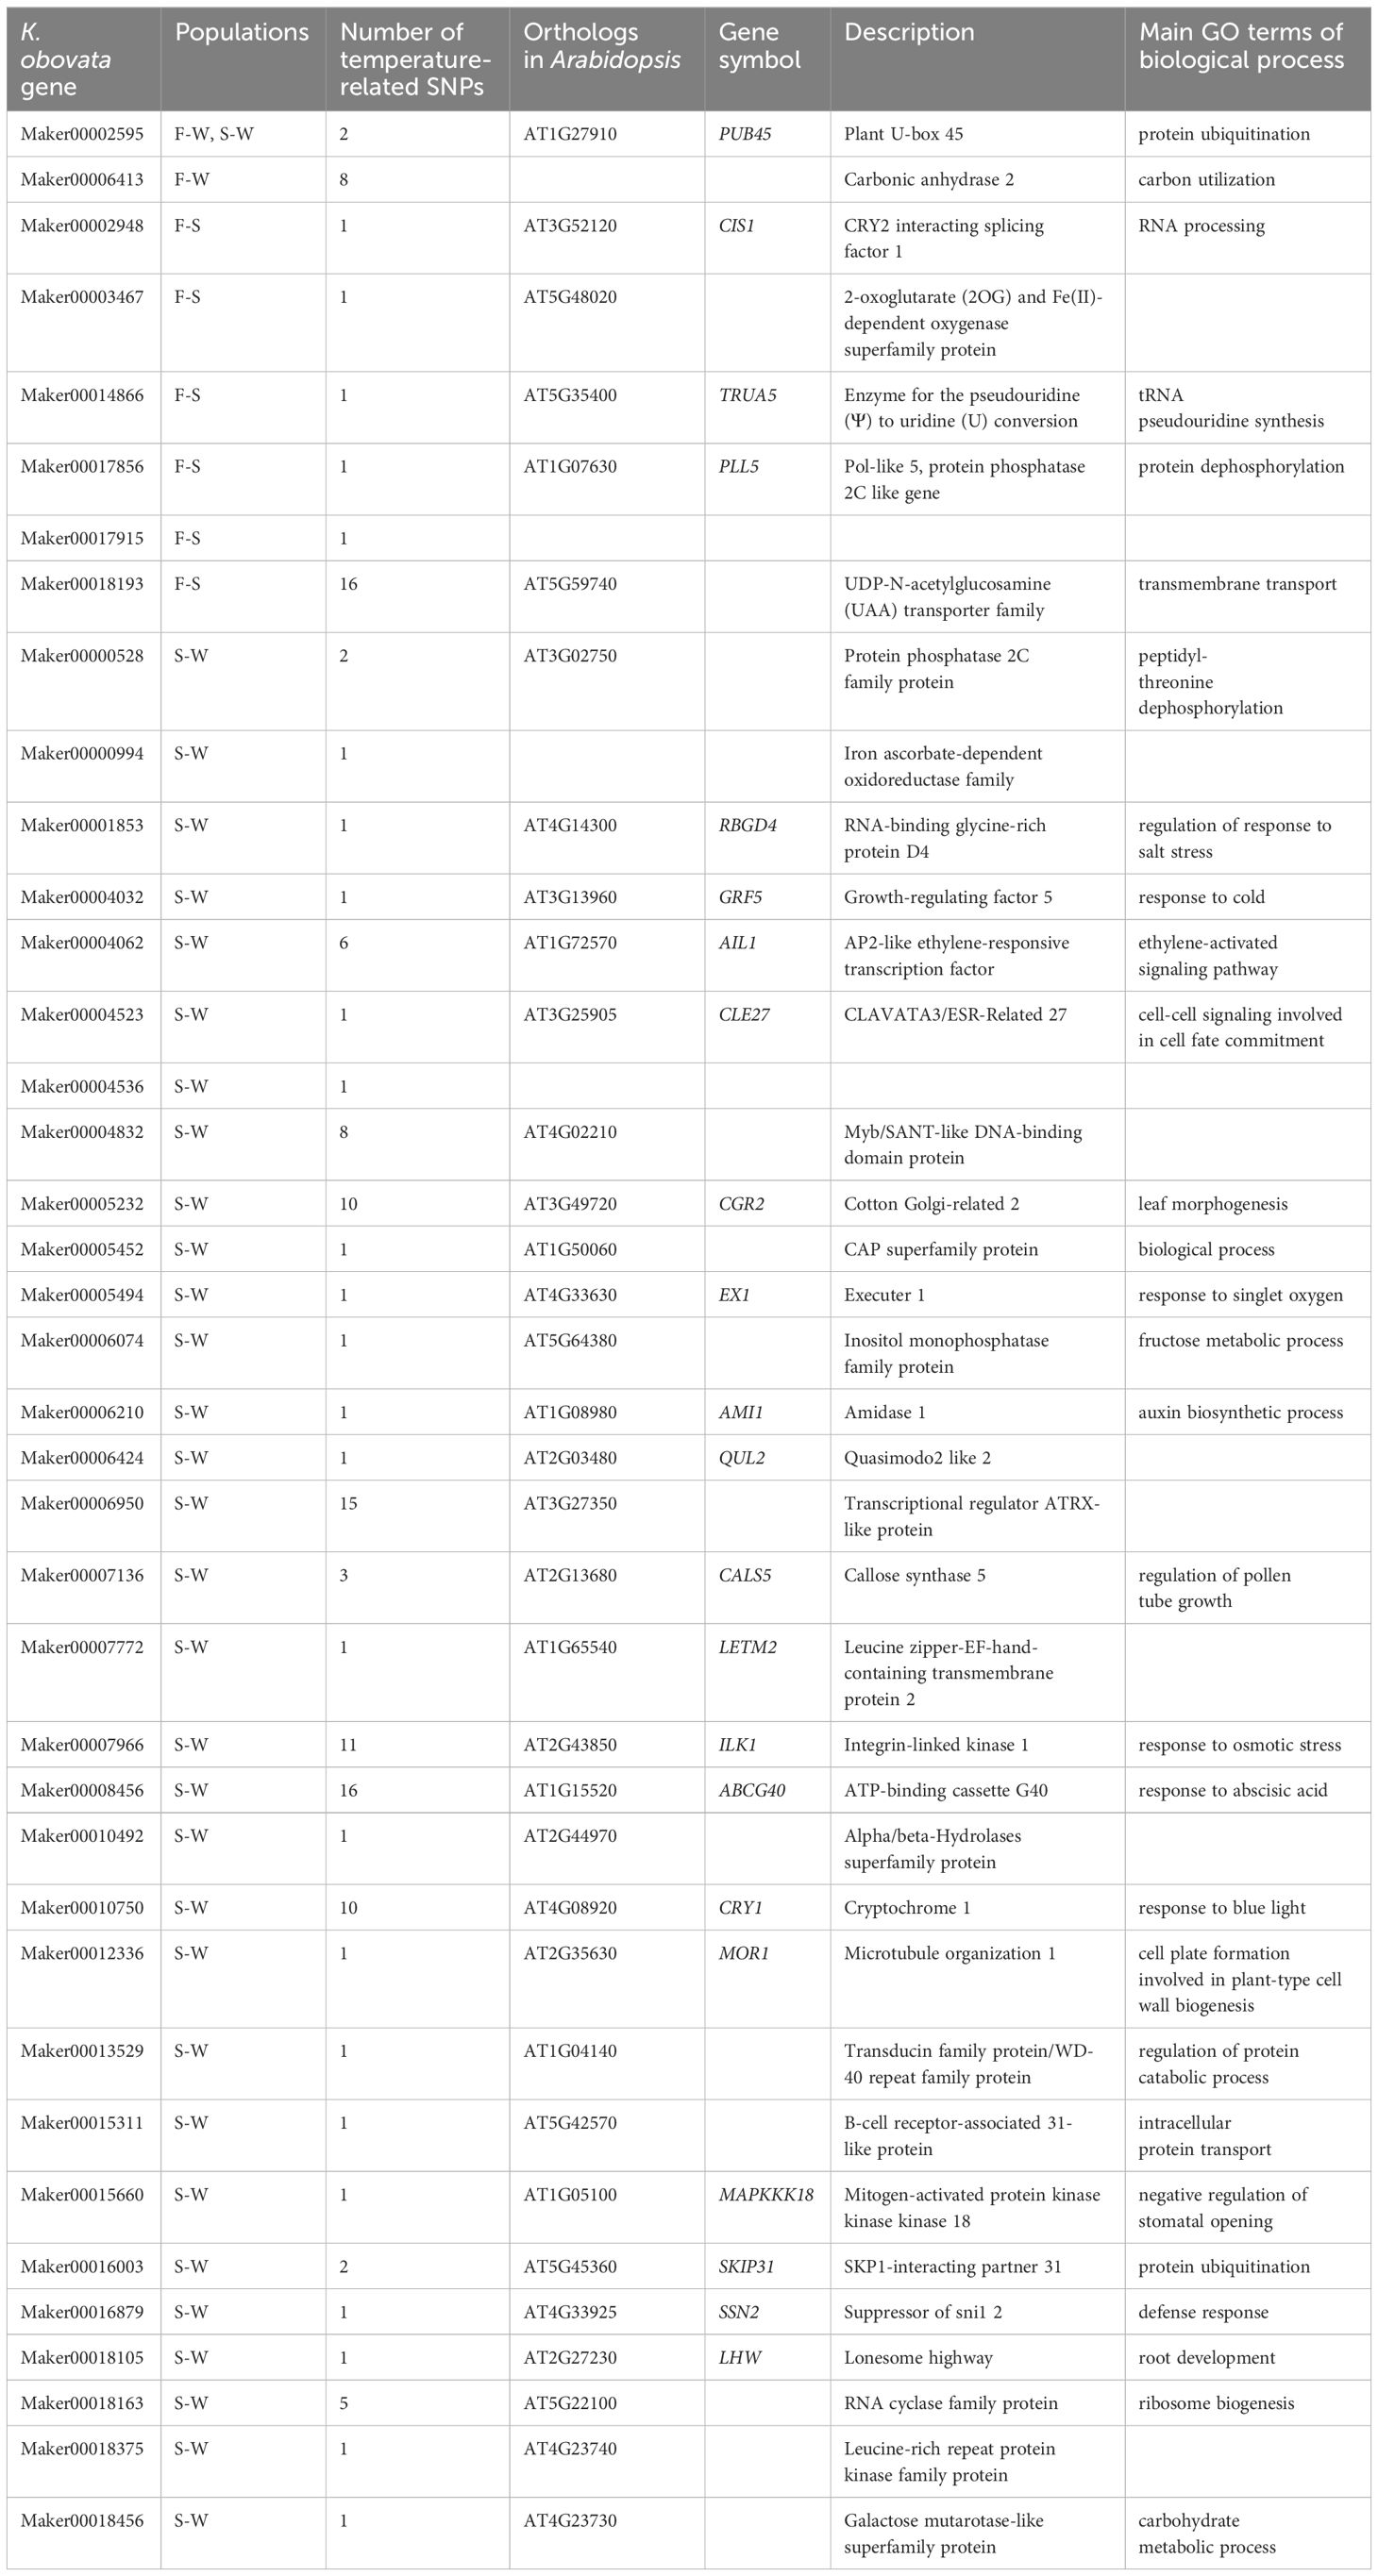
Table 2 High-confidence candidate genes underlying local adaptation in K. obovata.
4 Discussion
K. obovata offers valuable opportunities for investigating the genetic basis of local adaptation in species that have undergone ecological speciation with complex demographic histories. Here, by examining how genome-wide patterns of population structure relate to genotype-environment associations, in conjunction with inferring demographic history and detecting selection signatures, we empirically contribute to the broader understanding of how genetic variation leads to climate adaptation. Despite complex demographic history, our results demonstrate that natural selection drives local adaptation in K. obovata due to differential selective pressures related to temperature.
4.1 Complex demography and restricted gene flow
The complex demographic history of the K. obovata populations has a significant impact on their genetic diversity and population structure. The Fuding population, occurring in the northmost in China, exhibits the lowest genetic diversity and is more isolated from the other two populations. This is consistent with the expectation for marginal populations, which often show lower genetic diversity and increased genetic differentiation from more central populations (Eckert et al., 2008). However, the inference of the demographic model revealed that the Fuding population has experienced a mild population expansion, while the central population in Shenzhen underwent a population bottleneck around the start of the last glacial maximum (Figure 3). These divergent patterns of population size change may align with the cold-tolerant nature of K. obovata, with the northern population being better adapted to cold weather than the southern population (Lu et al., 2022). Additionally, these two populations exhibit distinct patterns in the site frequency spectrum compared to the Wenchang population, with the former two showing a high number of fixed SNPs while the Wenchang population has almost none (Figure 1C). These results suggest that genetic drift associated with frequent population size change in the Fuding and Shenzhen populations may have caused rapid fixation of alleles in these regions, while the southern population in Wenchang may represent the ancestor state of this species, considering that K. obovata is diverged from the cold intolerant Kandelia candel (Sheue et al., 2003). Nevertheless, it is unclear how the Wenchang population could maintain a constant population size, especially given that global cooling during the last glacial maximum is known to be a major cause of extinction for tropical woody species such as mangroves (Song et al., 2021).
It is widely acknowledged that mangroves exhibit long-distance gene flow due to the dispersal of floating propagules (Van der Stocken et al., 2022). Previous studies on K. candel have indicated substantial regional gene flow over considerable distances (Chiang et al., 2001; Geng et al., 2008). In this study, the estimated gene flow from Fuding to Wenchang (NmFW = 3.90) is much greater than that from Wenchang to Fuding (NmWF = 0.05), despite the broad confidence intervals (Figure 3). This finding is consistent with the direction of current flow in the South China Sea during early winter (Shaw & Chao, 1994), coinciding with the maturation and shedding of the hypocotyl in K. obovata in the northern regions (Khoon et al., 2004). Thus, the asymmetric migration between the Fuding and Wenchang populations provides additional evidence for the influence of ocean currents on gene flow in mangroves. However, we observed strong population structure among the three K. obovata populations in China (Figure 2D), indicating local gene flow may be insufficient to counteract genetic differentiation caused by either genetic drift or natural selection. Notably, the best-fitting demographic model (Figure 3) reveals substantial gene flow occurring only from the Fuding and Shenzhen populations to the Wenchang population (NmFW = 3.90 and NmSW = 1.13), while all other Nmestimates, ranging from 0.02 to 0.64, are relatively small. Contrastingly, a recent study on grey mangrove (Avicennia marina) populations across the Red Sea, the Arabian Sea and the Persian/Arabian Gulf revealed a moderate population genetic structure correlating with geographic distance, which supports clades both among and within the seas surrounding the Arabian Peninsula (Friis et al., 2024).
What might have caused the limited gene flow among geographically proximate K. obovata populations? One possible explanation is the impact of human activities, which have led to increased fragmentation. Human activities such as land development, urbanization, and habitat destruction can create barriers to gene flow, resulting in population isolation and reduced genetic exchange between populations (Guo et al., 2016). Moreover, the small effective population size for all populations in this study may have also played a role in limiting gene flow. With a small effective population size, genetic drift has a more pronounced effect, leading to increased genetic differentiation between populations (Song et al., 2006). This effect may be particularly significant for the Shenzhen and Fuding populations, which have experienced population bottleneck and expansion, respectively.
4.2 Local adaptation and genotype-environment associations
Local adaptation involves significant changes in allele frequency. Therefore, conducting a genome scan to identify outlier values of the allelic differentiation is the preferred method for detecting loci associated with local adaptation. It has been recognized that high neutral differentiation among populations can make it more difficult to detect high outlier loci (Pérez-Figueroa et al., 2010). This is evident in the case for K. obovata, where the average FST values are approximately 0.3 across the genome (Figure 2B). Utilizing the 1.96 SD cutoff of the empirical distribution, we discovered that the number of FST outliers was largely comparable for all three pairwise population comparisons, whereas the number of XP-CLR outliers varied substantially among comparisons (Figure 5A-C). Given that FST is the quotient of two variances, the large expected variability in FST among neutral loci, influenced by complex demography, population structure, and migration, may impact the power to discern high outlier FST values, potentially resulting in a high rate of false positive or false negative (Le Corre & Kremer, 2012). In contrast, the XP-CLR method, which is independent of window size and robust to uncertainty regarding demography history, identifies regions in the genome where the change in allele frequency at the locus occurred too quickly to be due to random drift (Chen et al., 2010). The different results between the two methods lies in the fact that the detection of FST outliers depends on neutral loci, while the XP-CLR method is sensitive to recent selective sweeps. By combining both methods, we observed an enrichment of environment-associated SNPs in highly differentiated regions (HDRs) that showed both outlier FST and outlier XP-CLR values, indicating the effectiveness of our analyses in identifying loci associated with local adaptation in the presence of high neutral differentiation among populations.
The three K. obovata populations, located at varying latitudes, are subject to differing intensities of selective pressure. Genotype-environment associations in K. obovata were detected exclusively for temperature-related variables, indicating that temperature is the primary factor driving differential selective pressures leading to local adaption. This supports the notion that winter temperature shapes mangrove distributions and assemblage composition in China (Wu et al., 2018). Local temperature has been consistently identified as significant drivers of varying selective pressures in many organisms, such as grey mangrove (Friis et al., 2024), lichen-forming fungi (Valim et al., 2023), and mountain pine (Méndez-Cea et al., 2023). In this study, the Fuding and Shenzhen populations showed a higher proportion of fixation in temperature-associated SNPs (Figure 5C) compared with genome-wide SNPs (Figure 1C), implying that natural selection has facilitated the rapid evolution of genes related to local adaptation. However, the evidence for local adaptation in the Wenchang population is weak, as reflected by the allele frequency spectra (Figure 5C) and results of Fay and Wu’s H (Supplementary Figure 3), likely due to the minimal selective pressure for temperature adaptation in this tropical region.
Gene flow may have also impacted local adaptation in the Wenchang population, which receives migrates from the Fuding and Shenzhen populations (NmFW = 3.90 and NmSW = 1.13; Figure 3). Contrary to expectations based on local adaptation gradients, many more HDRs were found between the Shenzhen and Wenchang populations than between the Fuding and Wenchang populations (Figure 4C). This inconsistency could stem from more substantial gene flow from Fuding to Wenchang compared to from Shenzhen to Wenchang (Figure 3). Both theoretical and empirical studies have shown that gene flow can either promote or counteract local adaptation depending on the extent of standing variation and the strength of natural selection (Tigano & Friesen, 2016). The scant number of selected candidate genes identified between the Wenchang and Fuding populations suggests that the weak selection in the Wenchang population is insufficient to overcome the homogenizing effect of gene flow. Nevertheless, we still identified a candidate gene under selection, PUB45, in both the comparison between the Fuding and Wenchang populations and the comparison between the Shenzhen and Wenchang populations (Figure 4D). This gene, which belongs to ubiquitin ligases enzymes, was reported to play a role in the cold acclimation of K. obovata seedlings in a previous study using transcriptome analysis (He et al., 2023). Collectively, our findings highlight the complexities involved in identifying loci responsible for local adaptation, especially in the presence of complex demographic histories, population structure, and gene flow.
4.3 Similarity and discrepancy between genes involved in local adaptation and those responsible for inter-species divergence
The question of whether the same genes responsible for local adaptation within a species also contribute to differences between species is a fundamental topic in evolutionary biology. K. obovata and its cold-intolerant relative K. candel are separated by the South China Sea, exhibiting genetic discontinuity and differential adaptation (Sheue et al., 2003). Among the 78 candidate genes within HDRs in K. obovata, only two genes, AIL1 and CALS5 overlap with those identified being under selection by the McDonald-Kreitman (MK) test when comparing K. obovata to K. candel (Figure 4F). This overlap may be due to both intra- and interspecific variations being influenced by similar selective pressures in cold environments. AIL1 has been identified as an ethylene response factor and a transcription factor responsive to cold in grape (Ma et al., 2022). CALS5 plays a crucial role in preserving the proper formation of callose walls during pollen development and responding to biotic stress (Dong et al., 2005). Evidence supporting the contribution of the same genetic variation to adaptive traits within and between species has been found in various organisms, such as antifreeze proteins in fish, indicating that the genetic mechanisms involved may be complex due to the polygenic nature of adaptive traits and the influence of gene-environment interactions (Berthelot et al., 2019).
The lack of overlap for the majority of candidate genes under selection, as identified by between-population comparisons with FST and XP-CLR and by inter-species comparison with MK test, can be explained by several factors. Firstly, intra-specific selection within K. obovata may target different genetic variations than inter-specific selection between K. obovata and K. candel. Although temperature adaptation is considered the primary force driving ecological speciation in Kandelia, the two species also differ in shoot, leaf, floral, fruit and hypocotyl characters, in addition to physiological differentiation (Sheue et al., 2003). The 27 selected genes detected by MK test are enriched in functional categories related to several protein modifications (Figure 4G). This is consistent with the notion that inter-specific selection often reflects more fundamental differences in niche occupation and overall lifestyle that have accrued over longer periods of evolutionary time (Tarjuelo et al., 2017). Second, the time scale of selection differs within and between species. Genes that were important in the initial divergence of the cold-tolerant K. obovata and cold-intolerant K. candle might not be the same genes that are currently under selection within K. obovata, which could be adapting to more recent or localized environmental changes. In line with this idea, four out of the top five enriched functional categories of the HDR candidate genes are associated with response to stimulus (Figure 4E). The discrepancies in genes identified as under selection between different methodologies may be a common issue (Balick et al., 2022; Wang X. et al., 2022; Benjelloun et al., 2023).
One limitation of this study is that only three K. obovata populations in China were surveyed. Considering the strong population structure among the surveyed populations (Figure 2D), we might capture both adaptive and neutral changes when identifying candidates under selection as high differential outliers between populations. Nevertheless, the enrichment of temperature-associated SNPs within HDRs indicates that most candidates are likely adaptive. On the other hand, the small number of populations surveyed may lead to an underestimation of genes responsible for local adaptation, as different environmental pressures might act on different gene interaction networks via gene-environment interactions (Tiffin & Ross-Ibarra, 2014). However, as temperature is the major factor shaping the evolutionary trajectories of Kandelia species, our results should capture the majority genetic variation critical for climate adaptation within and between species. A wider geographic sampling across the complete range of K. obovata and K. candel will be necessary to conduct further research on candidate functional loci associated with their ecological divergence.
5 Conclusion
Our investigation into the local adaptation of Kandelia obovata populations across China provides critical insights into the genetic dynamics and adaptive evolution of mangroves under global climate change. Through whole-genome resequencing analysis, we uncovered a strong population structure with complex demographic events such as expansion, bottlenecks, and gene flow, highlighting the intricate historical context within which local adaptation has occurred. Notably, genetic differentiation is high among the geographically close K. obovata populations, likely due to limited gene flow as a result of human activities. Genome-wide scans of population differentiation pinpointed regions under selective sweeps, with more intense signals in northern populations. Our findings emphasize the importance of temperature in driving genetic adaptations, as opposed to precipitation, which showed no discernible genotype-environment associations. The southmost Wenchang population exhibited minimal selective sweep signatures, reflecting the low selective pressure in this tropic region, potentially confounded by gene flow from other populations. We identified 39 candidate genes with high confidence responsible for local adaptation, enriched in stimulus response functions and largely different from those genes involved in the speciation of K. obovata from K. candel, which are associated with basic cellular functions. These findings set the stage for further research to explore the molecular basis of local adaptation and resilience of mangroves to environmental stress. Such knowledge is vital for conservation strategies and predictive modeling of species responses in an era of rapid climate change.
Data availability statement
The datasets presented in this study can be found in online repositories. The names of the repository/repositories and accession number(s) can be found in the article/Supplementary Material.
Author contributions
CZ: Writing – review & editing, Writing – original draft, Visualization, Software, Methodology, Investigation, Formal analysis, Data curation. YW: Writing – review & editing, Software, Methodology, Investigation, Formal analysis. RZ: Writing – review & editing, Supervision, Resources, Funding acquisition, Conceptualization. TT: Writing – review & editing, Writing – original draft, Validation, Supervision, Project administration, Funding acquisition, Conceptualization.
Funding
The author(s) declare financial support was received for the research, authorship, and/or publication of this article. This work was funded by the National Science Foundation of China (32270234, 31970245, and 32170217), Natural Science Foundation of Guangdong Province- Outstanding Youth Team Project (2023B1515040002), and Guangdong Basic and Applied Basic Research Foundation (2022A1515010571 and 2021A1515010808).
Conflict of interest
The authors declare that the research was conducted in the absence of any commercial or financial relationships that could be construed as a potential conflict of interest.
Publisher’s note
All claims expressed in this article are solely those of the authors and do not necessarily represent those of their affiliated organizations, or those of the publisher, the editors and the reviewers. Any product that may be evaluated in this article, or claim that may be made by its manufacturer, is not guaranteed or endorsed by the publisher.
Supplementary material
The Supplementary Material for this article can be found online at: https://www.frontiersin.org/articles/10.3389/fpls.2024.1385210/full#supplementary-material
References
Alexander, D. H., Novembre, J., Lange, K. (2009). Fast model-based estimation of ancestry in unrelated individuals. Genome Res. 19, 1655–1664. doi: 10.1101/gr.094052.109
Altschul, S. F., Gish, W., Miller, W., Myers, E. W., Lipman, D. J. (1990). Basic local alignment search tool. J. Mol. Biol. 215, 403–410. doi: 10.1016/S0022-2836(05)80360-2
Angert, A. L., Bontrager, M. G., Aringgren, J. (2020). What Do We Really Know about Adaptation at Range Edges? Annu. Rev. Ecol. Evol. Syst. 51, 341–361. doi: 10.1146/annurev-ecolsys-012120-091002
Balick, D. J., Jordan, D. M., Sunyaev, S., Do, R. (2022). Overcoming constraints on the detection of recessive selection in human genes from population frequency data. Am. J. Hum. Genet. 109, 33–49. doi: 10.1016/j.ajhg.2021.12.001
Baron, K. N., Schroeder, D. F., Stasolla, C. (2012). Transcriptional response of abscisic acid (ABA) metabolism and transport to cold and heat stress applied at the reproductive stage of development in Arabidopsis thaliana. Plant Sci. 188, 48–59. doi: 10.1016/j.plantsci.2012.03.001
Benjamini, Y., Hochberg, Y. (1995). Controlling the false discovery rate: A practical and powerful approach to multiple testing. J. R. Stat. Soc B. 57, 289–300. doi: 10.1111/j.2517-6161.1995.tb02031.x
Benjelloun, B., Leempoel, K., Boyer, F., Stucki, S., Streeter, I., Orozco-terWengel, P., et al. (2023). Multiple genomic solutions for local adaptation in two closely related species (sheep and goats) facing the same climatic constraints. Mol. Ecol. 00, e17257. doi: 10.1111/mec.17257
Berthelot, C., Clarke, J., Desvignes, T., William Detrich, H., Flicek, P., Peck, L. S., et al. (2019). Adaptation of proteins to the cold in Antarctic fish: A role for methionine? Genome Bio. Evol. 11, 220–231. doi: 10.1093/gbe/evy262
Bolger, A. M., Lohse, M., Usadel, B. (2014). Trimmomatic: A flexible trimmer for Illumina sequence data. Bioinformatics 30, 2114–2120. doi: 10.1093/bioinformatics/btu170
Brauer, E. K., Ahsan, N., Dale, R., Kato, N., Coluccio, A. E., Piñeros, M. A., et al. (2016). The Raf-like kinase ILK1 and the high affinity K+ transporter HAK5 are required for innate immunity and abiotic stress response. Plant Physiol. 171, 1470–1484. doi: 10.1104/pp.16.00035
Cantalapiedra, C. P., Herņandez-Plaza, A., Letunic, I., Bork, P., Huerta-Cepas, J. (2021). eggNOG-mapper v2: Functional Annotation, Orthology Assignments, and Domain Prediction at the Metagenomic Scale. Mol. Biol. Evol. 38, 5825–5829. doi: 10.1093/molbev/msab293
Carley, L. N., Mojica, J. P., Wang, B., Chen, C. Y., Lin, Y. P., Prasad, K. V. S. K., et al. (2021). Ecological factors influence balancing selection on leaf chemical profiles of a wildflower. Nat. Ecol. Evol. 5, 1135–1144. doi: 10.1038/s41559-021-01486-0
Chen, G., Gu, X., Capinha, C., Lee, S. Y., Cui, B., Yang, F., et al. (2023). Large-scale changes in macrobenthic biodiversity driven by mangrove afforestation. J. Appl. Ecol. 60, 2066–2078. doi: 10.1111/1365-2664.14462
Chen, H., Patterson, N., Reich, D. (2010). Population differentiation as a test for selective sweeps. Genome Res. 20, 393–402. doi: 10.1101/gr.100545.109
Chiang, T. Y., Chiang, Y. C., Chen, Y. J., Chou, C. H., Havanond, S., Hong, T. N., et al. (2001). Phylogeography of Kandelia candel in East Asiatic mangroves based on nucleotide variation of chloroplast and mitochondrial DNAs. Mol. Ecol. 10, 2697–2710. doi: 10.1046/j.0962-1083.2001.01399.x
Cingolani, P., Platts, A., Wang, L. L., Coon, M., Nguyen, T., Wang, L., et al. (2012). A program for annotating and predicting the effects of single nucleotide polymorphisms, SnpEff: SNPs in the genome of Drosophila melanogaster strain w1118; iso-2; iso-3. Fly 6, 80–92. doi: 10.4161/fly.19695
Danecek, P., Auton, A., Abecasis, G., Albers, C. A., Banks, E., DePristo, M. A., et al. (2011). The variant call format and VCFtools. Bioinformatics 27, 2156–2158. doi: 10.1093/bioinformatics/btr330
Dong, X., Hong, Z., Sivaramakrishnan, M., Mahfouz, M., Verma, D. P. S. (2005). Callose synthase (CalS5) is required for exine formation during microgametogenesis and for pollen viability in Arabidopsis. Plant J. 42, 315–328. doi: 10.1111/j.1365-313X.2005.02379.x
Dool, S. E., Picker, M. D., Eberhard, M. J. B. (2022). Limited dispersal and local adaptation promote allopatric speciation in a biodiversity hotspot. Mol. Ecol. 31, 279–295. doi: 10.1111/mec.16219
Eckert, C. G., Samis, K. E., Lougheed, S. C. (2008). Genetic variation across species’ geographical ranges: The central-marginal hypothesis and beyond. Mol. Ecol. 17, 1170–1188. doi: 10.1111/j.1365-294X.2007.03659.x
Ellison, A. M. (2000). Mangrove restoration: Do we know enough? Restor. Ecol. 8, 219–229. doi: 10.1046/j.1526-100x.2000.80033.x
Excoffier, L., Marchi, N., Marques, D. A., Matthey-Doret, R., Gouy, A., Sousa, V. C. (2021). Fastsimcoal2: Demographic inference under complex evolutionary scenarios. Bioinformatics 37, 4882–4885. doi: 10.1093/bioinformatics/btab468
Fay, J. C., Wu, C. I. (2000). Hitchhiking under positive Darwinian selection. Genetics 155, 1405–1413. doi: 10.1093/genetics/155.3.1405
Forester, B. R., Lasky, J. R., Wagner, H. H., Urban, D. L. (2018). Comparing methods for detecting multilocus adaptation with multivariate genotype–environment associations. Mol. Ecol. 27, 2215–2233. doi: 10.1111/mec.14584
Friis, G., Smith, E. G., Lovelock, C. E., Ortega, A., Marshell, A., Duarte, C. M., et al. (2024). Rapid diversification of grey mangroves (Avicennia marina) driven by geographic isolation and extreme environmental conditions in the Arabian Peninsula. Mol. Ecol. 33 (4), e17260. doi: 10.1111/mec.17260
Gao, J., Zhang, R., Zheng, L., Song, L., Ji, M., Li, S., et al. (2023). Blue light receptor CRY1 regulates HSFA1d nuclear localization to promote plant thermotolerance. Cell Rep. 42 (9), 113117. doi: 10.1016/j.celrep.2023.113117
Geng, Q., Lian, C., Goto, S., Tao, J., Kimura, M., Islam, M. S., et al. (2008). Mating system, pollen and propagule dispersal, and spatial genetic structure in a high-density population of the mangrove tree Kandelia candel. Mol. Ecol. 17, 4724–4739. doi: 10.1111/j.1365-294X.2008.03948.x
Guo, Z., Huang, Y., Chen, Y., Duke, N. C., Zhong, C., Shi, S. (2016). Genetic discontinuities in a dominant mangrove Rhizophora apiculata (Rhizophoraceae) in the Indo-Malesian region. J. Biogeogr. 43, 1856–1868. doi: 10.1111/jbi.12770
He, S., Wang, X., Du, Z., Liang, P., Zhong, Y., Wang, L., et al. (2023). Physiological and transcriptomic responses to cold waves of the most cold-tolerant mangrove, Kandelia obovata. Front. Plant Sci. 14. doi: 10.3389/fpls.2023.1069055
He, Z., Feng, X., Chen, Q., Li, L., Li, S., Han, K., et al. (2022). Evolution of coastal forests based on a full set of mangrove genomes. Nat. Ecol. Evol. 6, 738–749. doi: 10.1038/s41559-022-01744-9
Hoban, S., Kelley, J. L., Lotterhos, K. E., Antolin, M. F., Bradburd, G., Lowry, D. B., et al. (2016). Finding the genomic basis of local adaptation: Pitfalls, practical solutions, and future directions. Am. Nat. 188, 379–397. doi: 10.1086/688018
Hu, Y., Feng, C., Yang, L., Edger, P. P., Kang, M. (2022). Genomic population structure and local adaptation of the wild strawberry Fragaria nilgerrensis. Hortic. Res. 9, uhab059. doi: 10.1093/hr/uhab059
Hu, M. J., Sun, W. H., Tsai, W. C., Xiang, S., Lai, X. K., Chen, D. Q., et al. (2020). Chromosome-scale assembly of the Kandelia obovata genome. Hortic. Res. 7, 75. doi: 10.1038/s41438-020-0300-x
Isabel, N., Holliday, J. A., Aitken, S. N. (2020). Forest genomics: Advancing climate adaptation, forest health, productivity, and conservation. Evol. Appl. 13, 3–10. doi: 10.1111/eva.12902
Jennerjahn, T. C., Gilman, E., Krauss, K. W., Lacerda, L. D., Nordhaus, I., Wolanski, E. (2017). “Mangrove ecosystems under climate change,” in Mangrove Ecosystems: A Global Biogeographic Perspective: Structure, Function, and Services, 211–244. Eds. Rivera-Monroy, V. H., Lee, S. Y., Kristensen, E., Twilley, R. R. (Cham: Springer International Publishing). doi: 10.1007/978-3-319-62206-4_7
Khoon, G. W., Aksornkoae, S., Tri, N. H., Vongwattana, K., Fan, H., Santoso, N., et al. (2004). Mangroves in the South China Sea (UNEP/GEF/SCS Technical Publication No. 1).
Kim, S. J., Held, M. A., Zemelis, S., Wilkerson, C., Brandizzi, F. (2015). CGR2 and CGR3 have critical overlapping roles in pectin methylesterification and plant growth in Arabidopsis thaliana. Plant J. 82, 208–220. doi: 10.1111/tpj.12802
Kim, S., Soltis, P. S., Wall, K., Soltis, D. E. (2006). Phylogeny and domain evolution in the APETALA2-like gene family. Mol. Biol. Evol. 23, 107–120. doi: 10.1093/molbev/msj014
Korneliussen, T. S., Albrechtsen, A., Nielsen, R. (2014). ANGSD: analysis of next generation sequencing data. BMC Bioinf. 15, 1–13. doi: 10.1186/s12859-014-0356-4
Korunes, K. L., Samuk, K. (2021). pixy: Unbiased estimation of nucleotide diversity and divergence in the presence of missing data. Mol. Ecol. Resour. 21, 1359–1368. doi: 10.1111/1755-0998.13326
Lantzouni, O., Alkofer, A., Falter-Braun, P., Schwechheimer, C. (2020). Growth-regulating factors interact with dellas and regulate growth in cold stress. Plant Cell 32, 1018–1034. doi: 10.1105/tpc.19.00784
Le Corre, V., Kremer, A. (2012). The genetic differentiation at quantitative trait loci under local adaptation. Mol. Ecol. 21, 1548–1566. doi: 10.1111/j.1365-294X.2012.05479.x
Levin, D. A. (2019). Plant speciation in the age of climate change. Ann. Bot. 124, 769–775. doi: 10.1093/aob/mcz108
Li, H., Durbin, R. (2009). Fast and accurate short read alignment with Burrows-Wheeler transform. Bioinformatics 25, 1754–1760. doi: 10.1093/bioinformatics/btp324
Li, H., Handsaker, B., Wysoker, A., Fennell, T., Ruan, J., Homer, N., et al. (2009). The sequence alignment/map format and SAMtools. Bioinformatics 25, 2078–2079. doi: 10.1093/bioinformatics/btp352
López-Goldar, X., Agrawal, A. A. (2021). Ecological interactions, environmental gradients, and gene flow in local adaptation. Trends Plant Sci. 26, 796–809. doi: 10.1016/j.tplants.2021.03.006
Lovelock, C. E., Cahoon, D. R., Friess, D. A., Guntenspergen, G. R., Krauss, K. W., Reef, R., et al. (2015). The vulnerability of Indo-Pacific mangrove forests to sea-level rise. Nature 526, 559–563. doi: 10.1038/nature15538
Lu, W. X., Zhang, B. H., Zhang, Y. Y., Yang, S. C. (2022). Differentiation of cold tolerance in an artificial population of a mangrove species, Kandelia obovata, is associated with geographic origins. Front. Plant Sci. 12. doi: 10.3389/fpls.2021.695746
Ma, X., Zhao, F., Su, K., Lin, H., Guo, Y. (2022). Discovery of cold-resistance genes in Vitis amurensis using bud-based quantitative trait locus mapping and RNA-seq. BMC Genomics 23, 551. doi: 10.1186/s12864-022-08788-y
Maxwell, G. S. (1995). Ecogeographic variation in Kandelia candel from Brunei, Hong Kong and Thailand. Hydrobiologia 295, 59–65. doi: 10.1007/BF00029111
McDonald, J. H., Kreitman, M. (1991). Adaptive protein evolution at the Adh locus in Drosophila. Nature 351, 652–654. doi: 10.1038/351652a0
McKenna, A., Hanna, M., Banks, E., Sivachenko, A., Cibulskis, K., Kernytsky, A., et al. (2010). The genome analysis toolkit: A MapReduce framework for analyzing next-generation DNA sequencing data. Genome Res. 20, 1297–1303. doi: 10.1101/gr.107524.110
Méndez-Cea, B., García-García, I., Gazol, A., Camarero, J. J., de Andrés, E. G., Colangelo, M., et al. (2023). Weak genetic differentiation but strong climate-induced selective pressure toward the rear edge of mountain pine in north-eastern Spain. Sci. Total Environ. 858, 159778. doi: 10.1016/j.scitotenv.2022.159778
Nei, M., Miller, J. C. (1990). A simple method for estimating average number of nucleotide substitutions within and between populations from restriction data. Genetics 125, 873–879. doi: 10.1093/genetics/125.4.873
Nguyen, L. T., Schmidt, H. A., Von Haeseler, A., Minh, B. Q. (2015). IQ-TREE: A fast and effective stochastic algorithm for estimating maximum-likelihood phylogenies. Mol. Biol. Evol. 32, 268–274. doi: 10.1093/molbev/msu300
Ohashi-Ito, K., Bergmann, D. C. (2007). Regulation of the Arabidopsis root vascular initial population by Lonesome highway. Development 134 (16), 2959–2968. doi: 10.1242/dev.006296
Oksanen, J., Legendre, P., O’Hara, B., Stevens, M. H. H., Oksanen, M. J., Suggests, M. (2017). Community Ecology Package. Available at: https://CRAN.R-project.org/package=vegan.
Oomen, R. A., Hutchings, J. A. (2022). Genomic reaction norms inform predictions of plastic and adaptive responses to climate change. J. Anim. Ecol. 91, 1073–1087. doi: 10.1111/1365-2656.13707
Orsini, L., Vanoverbeke, J., Swillen, I., Mergeay, J., De Meester, L. (2013). Drivers of population genetic differentiation in the wild: Isolation by dispersal limitation, isolation by adaptation and isolation by colonization. Mol. Ecol. 22, 5983–5999. doi: 10.1111/mec.12561
Pérez-Figueroa, A., García-Pereira, M. J., Saura, M., Rolán-Alvarez, E., Caballero, A. (2010). Comparing three different methods to detect selective loci using dominant markers. J. Evol. Biol. 23, 2267–2276. doi: 10.1111/j.1420-9101.2010.02093.x
Purcell, S., Neale, B., Todd-Brown, K., Thomas, L., Ferreira, M. A. R., Bender, D., et al. (2007). PLINK: A tool set for whole-genome association and population-based linkage analyses. Am. J. Hum. Genet. 81, 559–575. doi: 10.1086/519795
Quisthoudt, K., Schmitz, N., Randin, C. F., Dahdouh-Guebas, F., Robert, E. M. R., Koedam, N. (2012). Temperature variation among mangrove latitudinal range limits worldwide. Trees-Struct. Funct. 26, 1919–1931. doi: 10.1007/s00468-012-0760-1
Shaw, P. T., Chao, S. Y. (1994). Surface circulation in the South China Sea. Deep-Sea Res. Pt. I: Oceanographic Research Papers 41 (11–12), 1663–1683. doi: 10.1016/0967-0637(94)90067-1
Sheue, C. R., Liu, H. Y., Yong, J. W. H. (2003). Kandelia obovata (Rhizophoraceae), a new mangrove species from Eastern Asia. Taxon 52, 287–294. doi: 10.2307/3647398
Singh, S., Rangarajan, S., Thattai, D. (2022). Mangroves: Sea level rise and elevation - A review. AIP Conference Proceedings. 2515 (1), 020015. doi: 10.1063/5.0102952
Song, S. K., Clark, S. E. (2005). POL and related phosphatases are dosage-sensitive regulators of meristem and organ development in Arabidopsis. Dev. Biol. 285, 272–284. doi: 10.1016/j.ydbio.2005.06.020
Song, S., Dey, D. K., Holsinger, K. E. (2006). Differentiation among populations with migration, mutation, and drift: Implications for genetic inference. Evolution 60, 1–12. doi: 10.1554/05-315.1
Song, H., Kemp, D. B., Tian, L., Chu, D., Song, H., Dai, X. (2021). Thresholds of temperature change for mass extinctions. Nat. Commun. 12, 4694. doi: 10.1038/s41467-021-25019-2
Sribianti, I., Muthmainnah, Hikmah, Kiswandi. (2021). Economic valuation of mangrove ecosystem environmental services based on green economy. IOP Conf. Series: Earth Environ. Sci. 886 (1), 012116. doi: 10.1088/1755-1315/886/1/012116
Su, J., Friess, D. A., Gasparatos, A. (2021). A meta-analysis of the ecological and economic outcomes of mangrove restoration. Nat. Commun. 12, 5050. doi: 10.1038/s41467-021-25349-1
Tajima, F. (1989). Statistical method for testing the neutral mutation hypothesis by DNA polymorphism. Genetics 123, 585–595. doi: 10.1093/genetics/123.3.585
Tarjuelo, R., Morales, M. B., Arroyo, B., Mañosa, S., Bota, G., Casas, F., et al. (2017). Intraspecific and interspecific competition induces density-dependent habitat niche shifts in an endangered steppe bird. Ecol. Evol. 7, 9720–9730. doi: 10.1002/ece3.3444
Tiffin, P., Ross-Ibarra, J. (2014). Advances and limits of using population genetics to understand local adaptation. Trends Ecol. Evol. 29, 673–680. doi: 10.1016/j.tree.2014.10.004
Tigano, A., Friesen, V. L. (2016). Genomics of local adaptation with gene flow. Mol. Ecol. 25, 2144–2164. doi: 10.1111/mec.13606
Tomlinson, P. B. (1986). The botany of mangroves. (Cambridge University Press). doi: 10.2307/4109956
Valim, H. F., Grande, F. D., Wong, E. L. Y., Schmitt, I. (2023). Circadian clock- and temperature-associated genes contribute to overall genomic differentiation along elevation in lichenized fungi. Mol. Ecol. 33 (4), e17252. doi: 10.1111/mec.17252
Van der Stocken, T., Vanschoenwinkel, B., Carroll, D., Cavanaugh, K. C., Koedam, N. (2022). Mangrove dispersal disrupted by projected changes in global seawater density. Nat. Clim. Change 12, 685–691. doi: 10.1038/s41558-022-01391-9
Vanwallendael, A., Soltani, A., Emery, N. C., Peixoto, M. M., Olsen, J., Lowry, D. B. (2019). A molecular view of plant local adaptation: incorporating stress-response networks. Annu. Rev. Plant Biol. 70, 559–583. doi: 10.1146/annurev-arplant-050718-100114
von Takach, B., Ahrens, C. W., Lindenmayer, D. B., Banks, S. C. (2021a). Scale-dependent signatures of local adaptation in a foundation tree species. Mol. Ecol. 30, 2248–2261. doi: 10.1111/mec.15894
von Takach, B., Penton, C. E., Murphy, B. P., Radford, I. J., Davies, H. F., Hill, B. M., et al. (2021b). Population genomics and conservation management of a declining tropical rodent. Heredity 126, 763–775. doi: 10.1038/s41437-021-00418-9
Wang, J., Hu, Z., Liao, X., Wang, Z., Li, W., Zhang, P., et al. (2022). Whole-genome resequencing reveals signature of local adaptation and divergence in wild soybean. Evol. Appl. 15, 1820–1833. doi: 10.1111/eva.13480
Wang, X., Hu, Y., He, W., Yu, K., Zhang, C., Li, Y., et al. (2022). Whole-genome resequencing of the wheat A subgenome progenitor Triticum urartu provides insights into its demographic history and geographic adaptation. Plant Commun. 3, 100345. doi: 10.1016/j.xplc.2022.100345
Weir, B. S., Cockerham, C. C. (1984). Estimating F-statistics for the analysis of population structure. Evolution 38 (6), 1358–1370. doi: 10.1111/j.1558-5646.1984.tb05657.x
Wu, Y., Ricklefs, R. E., Huang, Z., Zan, Q., Yu, S. (2018). Winter temperature structures mangrove species distributions and assemblage composition in China. Global Ecol. Biogeogr. 27, 1492–1506. doi: 10.1111/geb.12826
Yang, G., Zhou, R., Tang, T., Shi, S. (2008). Simple and efficient isolation of high-quality total RNA from Hibiscus tiliaceus, a mangrove associate and its relatives. Prep. Biochem. Biotech. 38, 257–264. doi: 10.1080/10826060802164991
Yu, G., Wang, L. G., Han, Y., He, Q. Y. (2012). ClusterProfiler: An R package for comparing biological themes among gene clusters. OMICS: A J. Integr. Biol. 16, 284–287. doi: 10.1089/omi.2011.0118
Zhao, Y., Zhong, Y., Ye, C., Liang, P., Pan, X., Zhang, Y. Y., et al. (2021). Multi-omics analyses on Kandelia obovata reveal its response to transplanting and genetic differentiation among populations. BMC Plant Biol. 21, 1–14. doi: 10.1186/s12870-021-03123-1
Zhao, Z., Dent, C., Liang, H., Lv, J., Shang, G., Liu, Y., et al. (2022). CRY2 interacts with CIS1 to regulate thermosensory flowering via FLM alternative splicing. Nat. Commun. 13, 7045. doi: 10.1038/s41467-022-34886-2
Keywords: local adaptation, population genomics, demographic history, selective sweeps, genome-environment association, mangroves
Citation: Zou C, Wang Y, Zhou R and Tang T (2024) Genetic basis of local adaptation in the cold-tolerant mangrove Kandelia obovata. Front. Plant Sci. 15:1385210. doi: 10.3389/fpls.2024.1385210
Received: 12 February 2024; Accepted: 09 April 2024;
Published: 24 April 2024.
Edited by:
Enrique Maguilla, Universidad Pablo de Olavide, SpainReviewed by:
Evandro Novaes, Universidade Federal de Lavras, BrazilIsabel Marques, Universidade de Lisboa, Portugal
Copyright © 2024 Zou, Wang, Zhou and Tang. This is an open-access article distributed under the terms of the Creative Commons Attribution License (CC BY). The use, distribution or reproduction in other forums is permitted, provided the original author(s) and the copyright owner(s) are credited and that the original publication in this journal is cited, in accordance with accepted academic practice. No use, distribution or reproduction is permitted which does not comply with these terms.
*Correspondence: Renchao Zhou, emhyZW5jaEBtYWlsLnN5c3UuZWR1LmNu; Tian Tang, bHNzdHRAbWFpbC5zeXN1LmVkdS5jbg==