 Zhengwen Niu
 Zi-Wu-Yin Ye2
 Qi Huang
 Chunju Peng
 Huajing Kang
- 1Wenzhou Key Laboratory of Agricultural & Forestry Carbon Sequestration and Tea Resource Development, Wenzhou Academy of Agricultural Sciences, Wenzhou, Zhejiang, China
- 2College of International Studies, Guangdong Baiyun University, Guangzhou, Guangdong, China
Introduction: Atmospheric CO2 elevation significantly impacts plant carbon metabolism, yet accurate quantification of respiratory parameters—photorespiration rate (Rp) and mitochondrial respiration rate in the light (Rd)—under varying CO2 remains challenging. Current CO2-response models exhibit limitations in estimating these parameters, hindering predictions of crop responses under future climate scenarios.
Methods: Low-oxygen treatments and gas exchange measurements, calculating CO2 recovery/inhibition ratio in of wheat (Triticum aestivum L.) and bean (Glycine max L.) were employed to elucidate the biological significance and interrelationships of Rp and Rd. Model-derived estimates of Rp and Rd were compared with measured values to assess the accuracy of three CO2-response models (biochemical, rectangular hyperbola, modified rectangular hyperbola). Furthermore, the effects of ambient CO2 concentration (0~1200 μmol·mol-1) on the measured Rp and Rd were quantified through polynomial regression.
Results: The A/Ca model achieved superior fitting performance over the A/Ci model. However, significant disparities persisted between A/Ca-derived Rp/Rd estimates and measurements (p < 0.05). CO2 concentration exhibited dose-dependent regulation of respiratory fluxes: Rp-measured ranged from 4.923 ± 0.171 to 12.307 ± 1.033 μmol (CO2) m-2 s-1 (wheat) and 4.686 ± 0.274 to 11.673 ± 2.054 μmol (CO2) m-2 s⁻ ¹ (bean), while Rd-measured varied from 0.618 ± 0.131 to 3.021 ± 0.063 μmol (CO2) m-2 s-1 (wheat) and 0.492 ± 0.069 to 2.323 ± 0.312 μmol (CO2) m-2 s-1 (bean). Polynomial regression revealed strong non-linear correlations between CO2 concentrations and respiratory parameters (R² > 0.891, p < 0.05; except bean Rp-Ca: R² = 0.797). Species-specific CO2 thresholds governed peak Rp (600 μmol·mol-1 for wheat vs. 1,000 μmol·mol-1 for bean) and Rd (400 μmol·mol-1 for wheat vs. 200 μmol·mol-1 for bean).
Discussion: These findings expose critical limitations in current respiratory parameter quantification methods and challenge linear assumptions of CO2-respiration relationships. They establish a critical framework for refining photosynthetic models by incorporating CO2-responsive respiratory mechanisms. The identified non-linear regulatory patterns and model limitations provide actionable insights for advancing carbon metabolism theory and optimizing crop carbon assimilation strategies under rising atmospheric CO2, with implications for climate-resilient agricultural practices.
1 Introduction
Atmospheric CO2 concentration has increased by 48% since the pre-industrial era, reaching 415 ppm in 2021 (IPCC, 2021). This elevation drives dual climate-ecosystem impacts: as a primary greenhouse gas contributing to global warming through radiative forcing, and as a photosynthetic substrate enhancing plant productivity via the “CO2 fertilization” effect (Easterling et al., 2000; Vaughan et al., 2003). However, the physiological mechanisms underlying plant adaptation to elevated CO2—particularly regarding respiratory metabolism—remain insufficiently quantified (Xanthopoulos et al., 2017; Jalali et al., 2020).
Photosynthesis, transpiration, and respiration are three vital processes in plant life, essential for growth and metabolism (Nilsen, 1995). Transpiration facilitates water transport across the soil-plant-atmosphere continuum (SPAC), supporting plant growth and influencing ecosystem water-heat balances (Liu and Yu, 1997). Photosynthesis allows plants to convert light energy, CO2, and water into organic matter and oxygen, directly impacting the productivity of terrestrial ecosystems and the global carbon cycle (Schimel et al., 2001). Photorespiration, however, occurs when the photosynthetic enzyme Rubisco reacts with oxygen instead of CO2—a common scenario under high temperature, drought, or intense light that limits CO2 availability. This process, universal in oxygen-producing plants and algae (Carvalho et al., 2011), shares chloroplasts as the primary site with photosynthesis and relies on light-driven reactions. Crucially, photorespiration recycles harmful byproducts generated during photosynthesis, balancing energy use and protecting plants from stress, thereby acting as a “safety valve” for photosynthetic efficiency. Mitochondrial respiration involves oxidative phosphorylation in the cells’ mitochondria to produce energy for vital activities (Vercellino and Sazanov, 2022; Huang et al., 2023). These biological processes adapt to elevated CO2 concentrations and climate warming (Luo et al., 2001), affecting carbon cycling processes in terrestrial ecosystems (Lin, 1998; Zhang et al., 2000; Wang et al., 2008). Thus, understanding how crop photorespiration and mitochondrial respiration respond to changes in atmospheric CO2 is crucial for predicting future crop productivity and growth patterns under elevated CO2 conditions.
Wheat and bean are globally significant crops, crucial to human food supply and agricultural production (Gan et al., 2015; Borrell et al., 2017). As typical C3 plants, CO2 is the main limiting factor affecting their photosynthesis (Atkin et al., 2005). Traditional theories suggest that the carbon source for photosynthesis in terrestrial plants is primarily atmospheric CO2, often neglecting CO2 released by photorespiration and dark respiration of the leaves (Stirbet et al., 2020). And related respiration parameters (photorespiration rate (RP), mitochondrial respiration rate in the light (Rd), and respiration in the light (RL)) are inconsistently applied (von Caemmerer, 2000). The chloroplast interior constitutes the primary site for photorespiratory CO2 release, where a substantial proportion of respired CO2 undergoes re-assimilation through the Calvin cycle. This CO2 recycling mechanism plays a crucial physiological role by enhancing subcellular CO2 concentration independent of diffusion limitations imposed by boundary layer resistance stomatal conductance, and mesophyll resistance (Loreto et al., 1999, 2001; Pinelli and Loreto, 2003). Quantitatively studying photorespiratory CO2 recycling in C3 plants is challenging due to the simultaneous occurrence of photorespiration, dark respiration, and photosynthetic carbon assimilation within mesophyll cells (Haupt-Herting et al., 2001). The carbon isotope method can distinguish between CO2 fixed by photosynthesis and released by photorespiration, offering a potential approach to studying CO2 recycling and reuse by plants (Ostle et al., 2000). However, this method is costly, complex, and not precise in exploring photorespiratory CO2 recycling, because this method ignores two important factors: firstly, Rubisco’s affinity for 14CO2 and 13CO2 is much lower than that of 12CO2; secondly, the measurement process inevitably involves the inhibition of photorespiration by extremely high concentrations of 12CO2 (30000 μmol mol-1) (Pärnik and Keerberg, 2007; Busch and Sage, 2017). Kang et al. (2014) used gas exchange methods to confirm that CO2 released by light and dark respiration can be reutilized by photosynthesis, though this concept is often overlooked. Therefore, accurate estimation of photorespiratory CO2 reutilization is essential for improving the accuracy of photosynthetic parameters and carbon metabolism processes.
The CO2 response curve for photosynthesis is a valuable tool for studying plant physiology and ecology, providing insights into how photosynthetic properties respond to environmental factors. This understanding can optimize CO2 concentration management in agricultural production, contributing to enhance photosynthetic efficiency and promote growth and productivity. Two types of CO2 response models exist: biochemical and empirical. The most widely used biochemical model is the Farquhar model and its modifications (von Caemmerer and Farquhar, 1981; Bernacchi et al., 2001; Long and Bernacchi, 2003; Ethier and Livingston, 2004). Empirical models include the rectangular hyperbola model (Ye, 2010), modified version (Ye and Yu, 2009), and the Michaelis-Menten model (Harley et al., 1992). However, current biochemical models do not consider the effect of mitochondrial respiration rate in the light (Rd), and empirical models overlook the effect of CO2 concentration on photorespiration rate. Quantitative studies on the effect of atmospheric CO2 concentration (Ca) on Rp and Rd are limited, making the accuracy of Rp and Rd values from current CO2 response models uncertain.
Addressing these research gaps, this study used low oxygen and gas exchange methods, with calculating CO2 recovery and inhibition ratio, aiming to: (1) elucidate the biological significance and interrelationships of photosynthetic parameters related to light and dark respiration, and accurately measure or calculate them; (2) compare Rp and Rd values between fitted and measured data to evaluate the CO2 photosynthetic response model’s accuracy, identifying a more precise estimation model (A/Ca or A/Ci); and (3) provide quantitative descriptions of Ca or Ci (depends on the accuracy of the model) effects on Rp-measured and Rd-measured, offering theoretical research insights for the practical application of photosynthetic carbon metabolism processes and the promotion of carbon metabolism.
2 Materials and methods
2.1 CO2 response models
The biochemical model can be expressed as
where Pn is the net photosynthetic rate; and wc, wj and wp are the potential rates of CO2 assimilation that can be supported by the enzymes of ribulose 1,5-bisphosphate (RuBP) carboxylase/oxygenase (Rubisco), RuBP- regeneration and triose-phosphate utilization, respectively. The photosynthetic compensation point () is the CO2 concentration at which the photorespiratory efflux of CO2 equals the rate of photosynthetic CO2 uptake. Ci is the intercellular CO2 concentration and Rd is the mitochondrial respiration rate in the light.
Empirical models include the rectangular hyperbola model, modified version, and the Michaelis-Menten model, as following:
The rectangular hyperbola model can be represented as
where Pnmax is the maximum photosynthetic rate; Rp is the photorespiration rate (in fact this parameter represents the respiration rate in the light (RL), which includes Rp and Rd. A detailed description is given in the text.); and α is the initial slope of the CO2 response curve; Ci is the same as above.
The Michaelis−Menten model can be displayed as
where Pnmax, Rp, Pn and Ci are the same as above, and K is the Michaelis-Menten constant.
The modified rectangular hyperbola model can be written as
where α, Rp, Pn and Ci are the same as above, and b and c are coefficients (mol μmol–1) (Ye, 2010) (Equations 1–4).
According to this equation, the Michaelis-Menten and the rectangular hyperbola model are essentially the same. Therefore, the fitted results for the Michaelis-Menten model were not shown in this paper.
2.2 Theoretical considerations
2.2.1 Calculation of photorespiration rates
Rp were determined through differential gas exchange measurements under contrasting O2 concentrations. Measurements were conducted using a LI-6400XT portable photosynthesis system (LI-COR Biosciences, Lincoln, NE, USA) with the following standardized conditions:
1. Ambient O2 treatment (21% O2): At ambient CO2 (0 μmol·mol−1) and saturating Photosynthetically Active Radiation (PAR) (2000 μmol·m−2·s−1), the net photosynthetic rate (Pn21%) represents combined respiratory fluxes (RL = Rp + Rd), as photorespiration proceeds normally while CO2 in photosynthesis comes from respiration.
2. Low O2 treatment (2% O2): Under identical CO2 and light conditions, complete inhibition of photorespiration in wheat and bean leaves was achieved based on our previous validation (Kang et al., 2014). The measured Pn2% thus corresponds specifically to Rd.
Rp was calculated using the respiratory partitioning equation (Erdei et al., 2001; Laisk et al., 2002; Parys et al., 2004):
where Pn2% and Pn21% are the photosynthetic rates at 2% O2 and 21% O2, respectively.
2.2.2 Calculation of CO2 recovery and inhibition ratios of photorespiration
Our prior mechanistic studies revealed concentration-dependent regulation of photorespiratory CO2 recovery. The photorespiratory CO2 recovery ratio (Rpe-i), defined as the proportion of respired CO2 re-assimilated by chloroplasts, decreased progressively with increasing ambient CO2 concentration. Beyond threshold CO2 concentrations, competitive inhibition between photorespiration and carboxylation pathways significantly suppressed photorespiratory flux (Kang et al., 2013). Rpe-i and photorespiratory inhibition index (Ii) can be quantified through Equation 6.
where and are the CO2 recovery ratio and inhibition ratio of photorespiration, Rpmax is the maximum photorespiration rate and Rp−i is the photorespiration rate at i CO2 concentrations, i represents different CO2 concentrations.
2.2.3 Calculation of the mitochondrial respiration rates in the light
Both mitochondrial respiration-derived CO2 and photorespiration-derived CO2 originate from the same cellular compartment, i.e., mitochondria. Given this shared origin, it follows that CO2 released through mitochondrial respiration undergoes similar refixation dynamics as photorespiratory CO2 under low atmospheric CO2 concentrations (Ca) and is comparably inhibited at elevated Ca. The recovery efficiency and inhibition ratio of mitochondrial respiration-derived CO2 were consequently equivalent to those observed in photorespiration. To quantify Rd, we therefore integrated the maximum mitochondrial respiration rate (Rn) with the photorespiration-associated parameters Rpe-i and Ii, using the following calculation scheme:
where and represent mitochondrial respiration rates under light and dark conditions, respectively, at a given atmospheric CO2 concentration.
2.2 Study site and plants
The experiment was conducted at the Yucheng Comprehensive Experiment Station (36°50′N, 116°34′E; 20.3 m elevation) of the Chinese Academy of Sciences, located in the lower Yellow River basin. This semi-arid region exhibits a mean annual temperature of 13.4°C and receives 567 mm of precipitation annually, with 70% occurring between June and September (1985–2009 climate normals). The soil is classified as calcaric fluvisol (FAO-UNESCO system) with silt loam texture (12% sand, 66% silt, 22% clay; USDA classification) and pH 8.6 (Hou et al., 2012).
Wheat and bean were sown on 4 October 2013 and 3 May 2014, respectively. Field-grown plants experienced maximum photosynthetic photon flux density (PPFD) of 2000 μmol m−² s−¹ during sunny days. Measurements were conducted during key phenological stages: wheat from 12 ~ 25 May (characterized by 7 sunny days, predominantly cloudy skies, no effective precipitation, and a mean temperature of 29°C) and bean from 16 ~ 25 June (marked by predominantly cloudy conditions, 95 mm rainfall, and an average temperature of 30°C) 2014. We randomly sampled vigorous plants with homogeneous growth and measured the apical leaf of the fifth compound leaf (numbered from the base upward) on each seedling.
2.3 CO2 gas exchange measurement
Leaf-level CO2 exchange was quantified using a LI-6400XT portable photosynthesis system (LI-COR Biosciences, Lincoln, NE, USA) during two daily intervals (09:00 ~ 11:30 and 14:30 ~ 17:00). For each species, the leaves were acclimated in the cuvette for 15 min to stabilize gas exchange prior to measurements. Environmental conditions were maintained at leaf temperature 30 ± 0.3°C (wheat) or 33 ± 1.7°C (bean) with 60% relative humidity. Two sets of CO2 response curves were generated by systematically exposing leaves to a sequence of 12 atmospheric CO2 concentrations (Ca: 0, 50, 80, 100, 150, 200, 380, 400, 600, 800, 1,000, and 1,200 μmol mol−¹). These experiments were conducted under two distinct oxygen conditions: ambient (21% O2) and low-oxygen (2% O2). For measurements of Rp, Rd, and other related parameters, a PAR of 2000 μmol m−² s−¹ was used. Conversely, a PAR of 0 μmol m−² s−¹ was employed to determine the mitochondrial respiration rates in the dark (Kang et al., 2014). The hypoxic gas mixture (2% O2) was supplied by Xinjian Air Plant (Yucheng, Shandong) and humidified via a 1.2 m³ buffer bag containing distilled water prior to entering the gas analyzer.
2.4 Statistics
Photosynthetic parameters were derived using Photosynthesis Assistant software (LI-COR Biosciences). Non-linear regression analyses implemented in SPSS 11.5 (IBM Corp., Armonk, NY, USA), based on Levenberg-Marquardt algorithm, including rectangular hyperbola model and Standard rectangular hyperbola model.
Treatment effects were assessed by two-way ANOVA with Tukey’s post-hoc test, while pairwise comparisons employed two-tailed Student’s t-tests (p< 0.05). All statistical visualizations were generated using GraphPad Prism 4.0c (GraphPad Software, San Diego, CA).
3 Results
3.1 Respiratory flux partitioning
At saturating irradiance (2000 μmol photons m−² s−¹), mitochondrial respiration (RL-measured) reached 6.548 ± 0.136 and 6.334 ± 0.342 μmol (CO2) m−² s−¹ in wheat and bean, respectively. Rd-measured exhibited the values of 2.036 ± 0.276 (wheat) and 1.893 ± 0.075 μmol (CO2) m−² s−¹ (bean). Rp-measured calculated via Equation 5 at zero CO2 (Rp-0-measured) showed interspecific divergence, with wheat (4.511 ± 0.412 μmol (CO2) m−² s−¹) and bean (4.686 ± 0.274 μmol (CO2) m−² s−¹), we can find that there were significantly different between RL-measured and Rp-measured (Table 1).
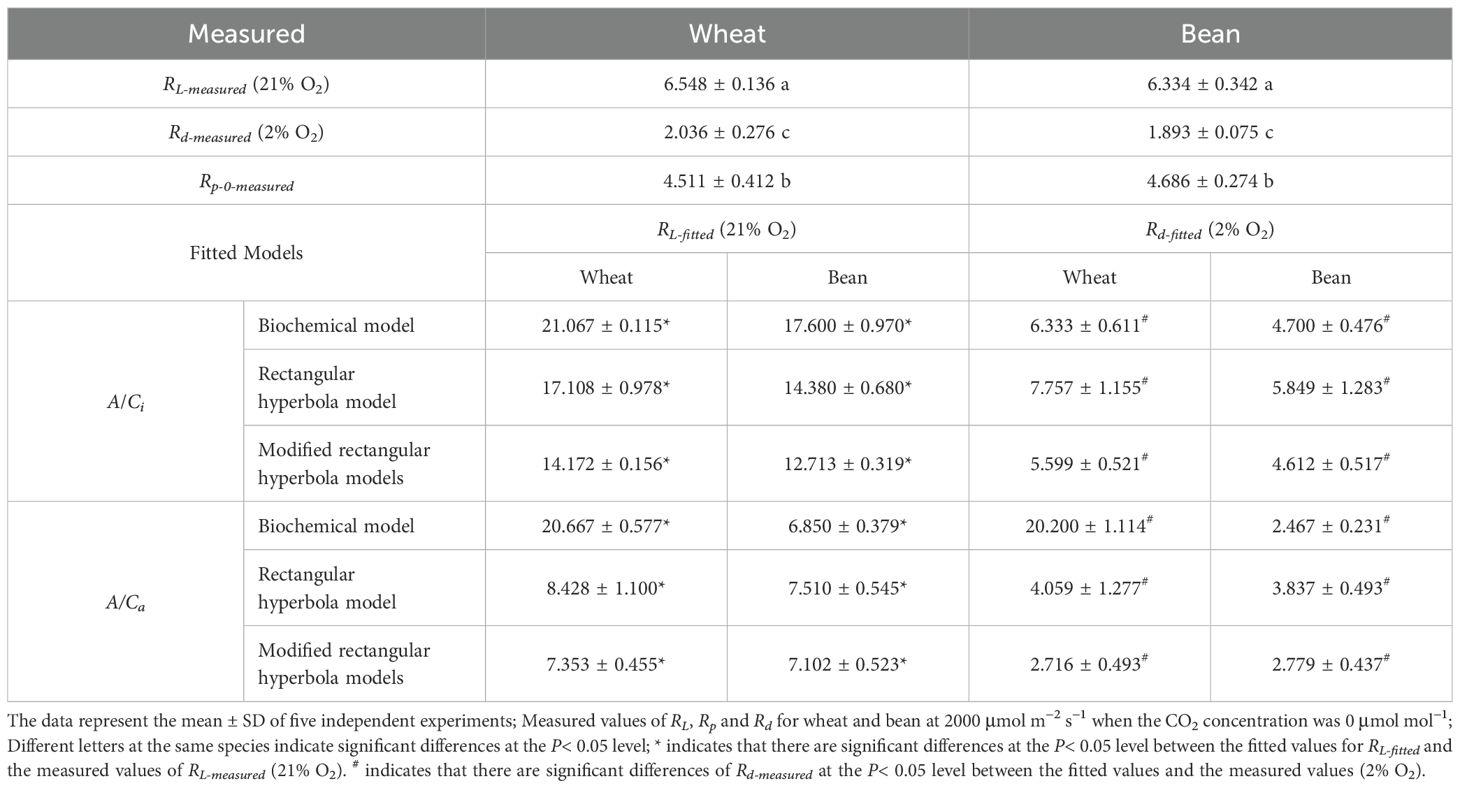
Table 1. Compared between measured and fitted values of RL, Rd, and Rp-0 for wheat and bean.
3.2 Model performance evaluation
The three CO2 response models (biochemical, rectangular hyperbola, modified rectangular hyperbola) were evaluated by comparing RL-fitted (21% O2) and Rd-fitted (2% O2) values with experimental measurements (Table 1).
Under the A/Ci framework, the modified rectangular hyperbola model showed the smallest deviations for both RL-fitted and Rd-fitted compared to biochemical and rectangular hyperbola models. For example, RL-fitted in wheat were 14.172 ± 0.156 μmol m−² s−¹ (modified model) versus 21.067 ± 0.115 (biochemical) and 17.108 ± 0.978 (rectangular), contrasting with measured values of 6.548 ± 0.136 (P< 0.05 for biochemical and rectangular models). Similar trends were observed for Rd-fitted (Table 1). Under the A/Ca framework, the modified model exhibited further accuracy improvements, particularly for Rd-fitted. For wheat, A/Ca-based Rd-fitted estimates (2.716 ± 0.493 μmol m−² s−¹) reduced deviations from measured values by 80.915% compared to A/Ci predictions (5.599 ± 0.521; Δ = 3.563 vs. 0.680 μmol m−² s−¹). In bean, A/Ca Rd-fitted errors decreased by 67.414% (Δ = 2.719 vs. 0.886 μmol m−² s−¹). RL-fitted estimations under A/Ca also approached measured values more closely than under A/Ci.
The modified rectangular hyperbola model under A/Ca framework demonstrated optimal consistency with experimental data, justifying its selection for subsequent analyses of respiratory responses to ambient CO2 (Ca).
3.3 Photorespiration rate (Rp-measured) responses to Ca
Rp-measured exhibited a unimodal relationship with ambient CO2 concentration in both wheat and bean, characterized by an initial increase followed by a decline at elevated Ca levels. The Rp-measured values ranged from 4.923 ± 0.171 to 12.307 ± 1.033 μmol (CO2) m−² s−¹ for wheat (Figure 1A) and 4.686 ± 0.274 to 11.673 ± 2.054 μmol (CO2) m−² s−¹ for bean (Figure 1B), with polynomial regression models demonstrating strong correlations (R² = 0.923 for wheat, R² = 0.797 for bean).
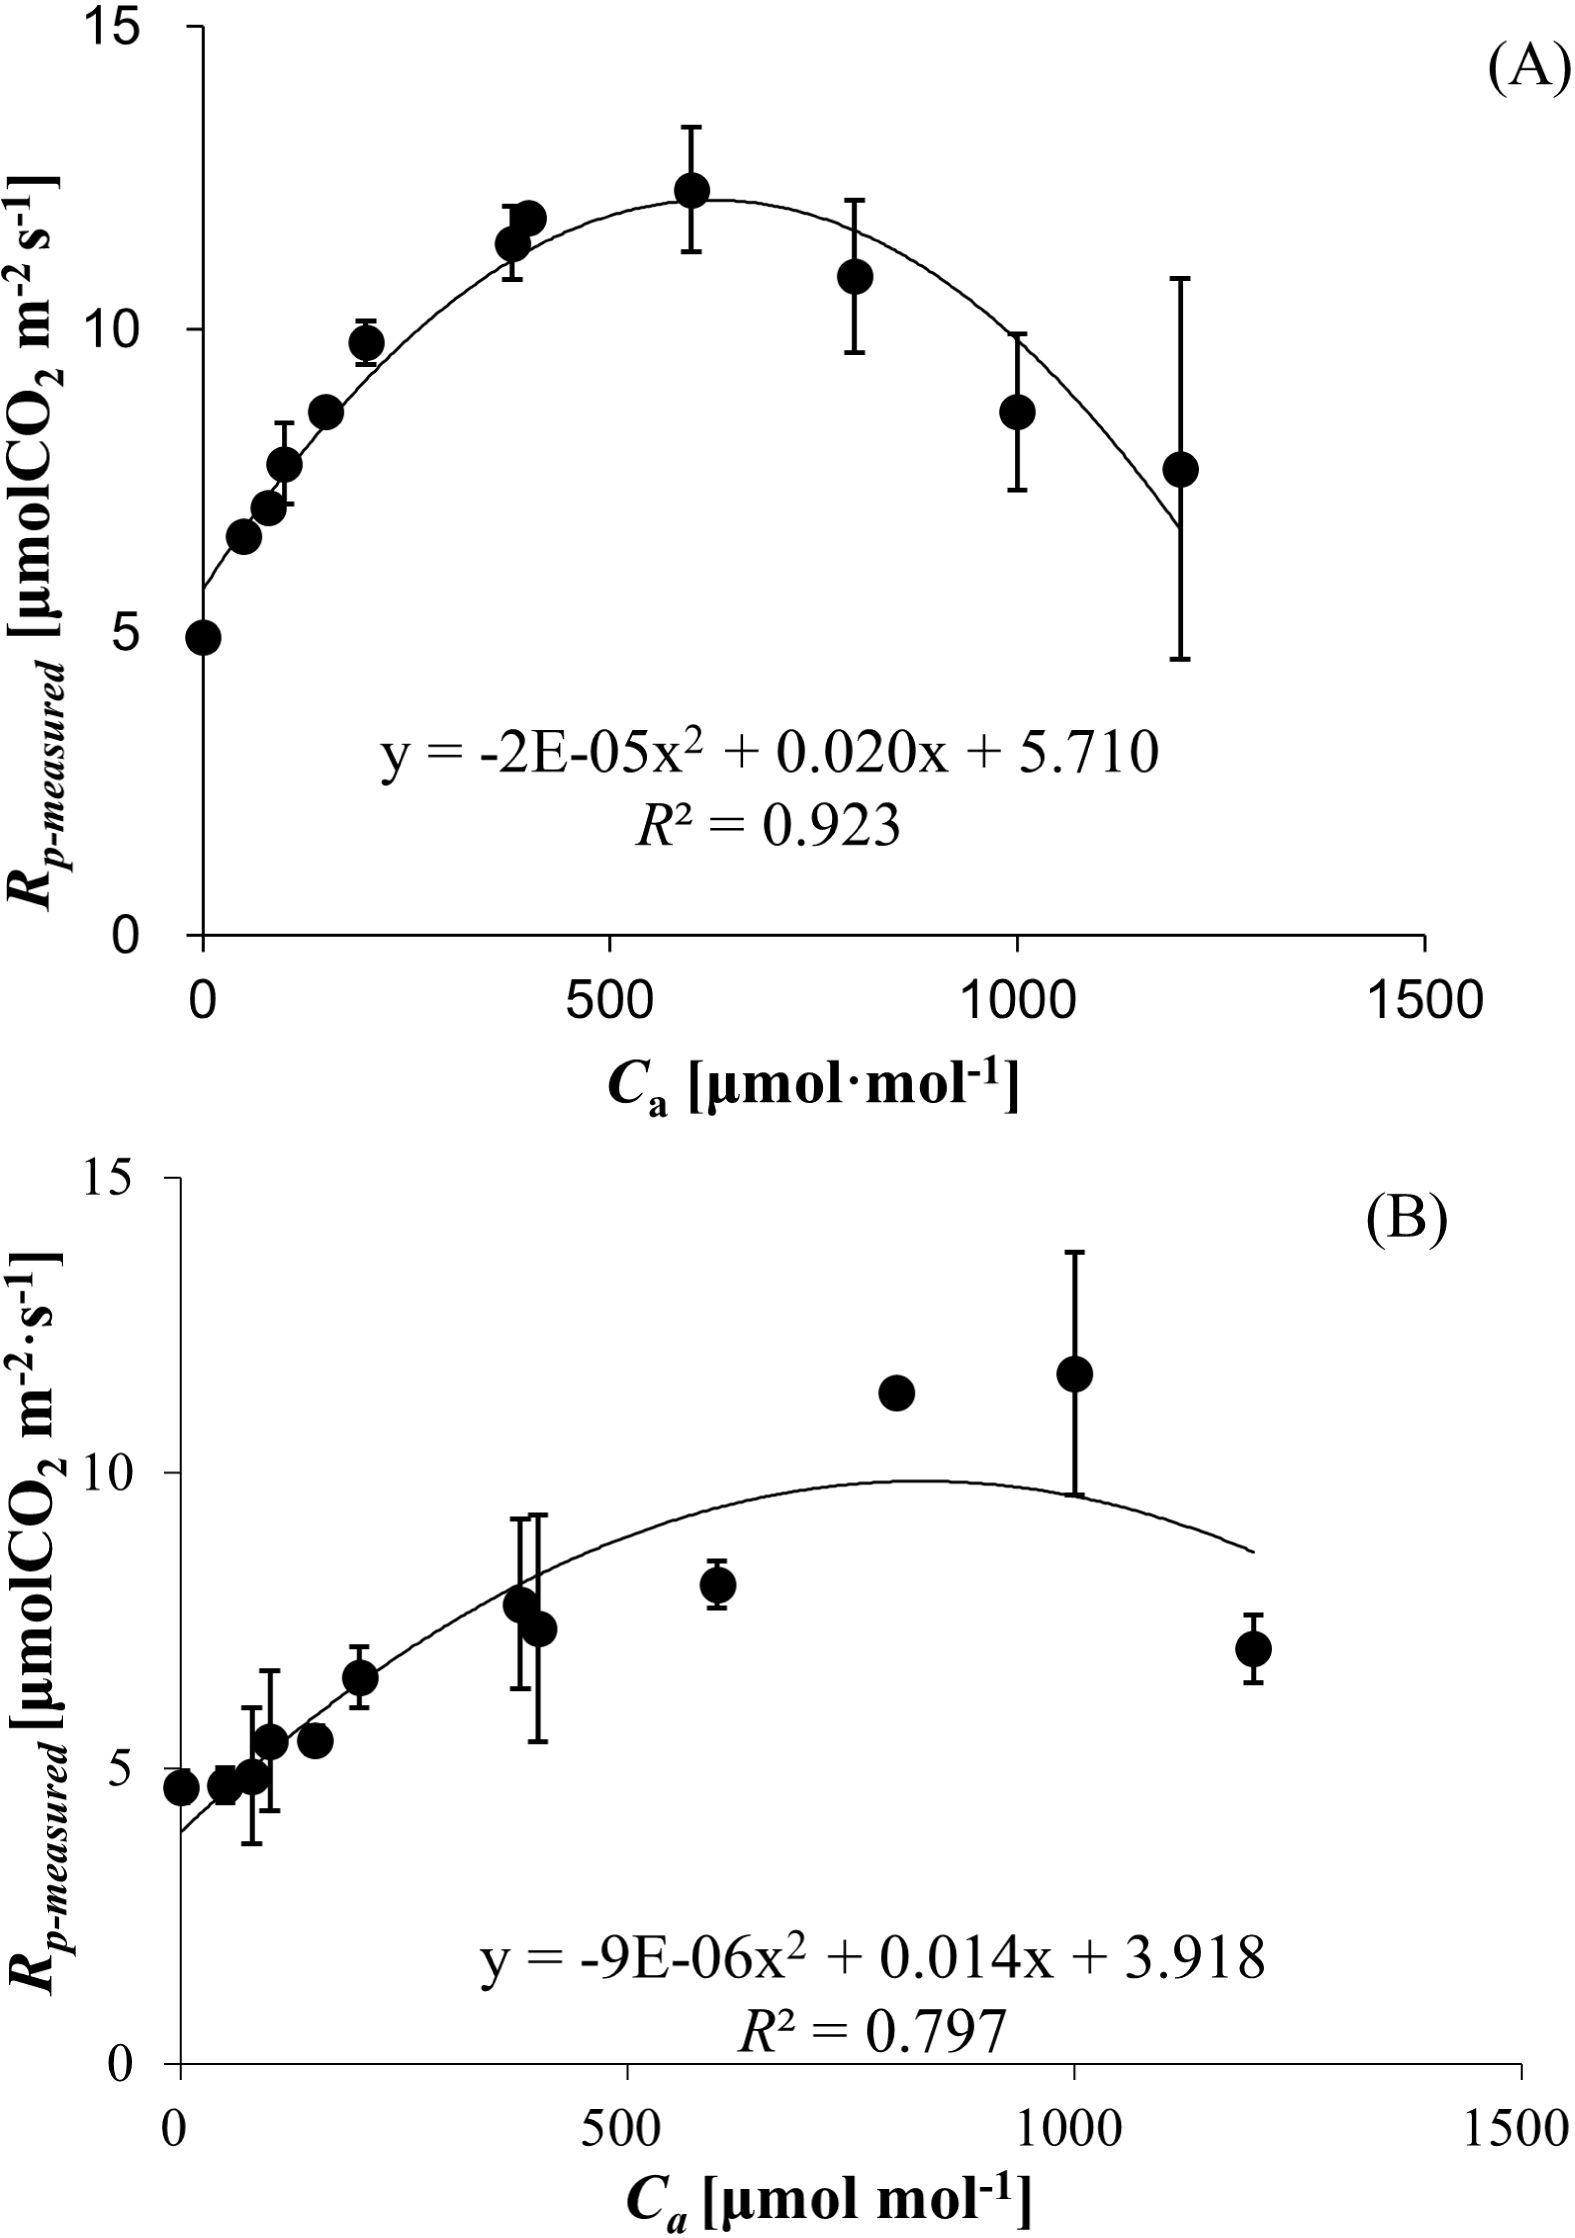
Figure 1. (A) Photorespiration rates (Rp-measured) of wheat responses to Ca. (B) Photorespiration rates (Rp-measured) of bean responses to Ca.
Crop-specific differences were evident in the Ca thresholds corresponding to peak Rp-measured. Wheat achieved maximum Rp-measured (12.307 ± 1.033 μmol (CO2) m−² s−¹) at 600 μmol mol−¹ Ca, whereas bean exhibited peak Rp-measured (11.673 ± 2.054 μmol (CO2) m−² s−¹) at 1000 μmol mol−¹ Ca (Figures 1A, B).
3.4 Mitochondrial respiration rate in the light (Rd-measured) responses to Ca
Rd-measured, derived from Equation 7, exhibited a unimodal relationship with Ca for both species. The Rd-measured values ranged from 0.618 ± 0.131 to 3.021 ± 0.063 μmol (CO2) m−² s−¹ for wheat (Figure 2A) and 0.492 ± 0.069 to 2.323 ± 0.312 μmol (CO2) m−² s−¹ for bean (Figure 2B), with polynomial regression models demonstrating strong correlations (R² = 891 for wheat, R² = 0.892 for bean). Rd-measured initially increased to peak values of 3.021 ± 0.063 μmol (CO2) m−² s−¹ (wheat) and 2.323 ± 0.312 μmol (CO2) m−² s−¹ (bean), followed by declines at elevated Ca. Polynomial regression confirmed robust correlations, reflecting Ca-dependent modulation of Rd-measured dynamics.
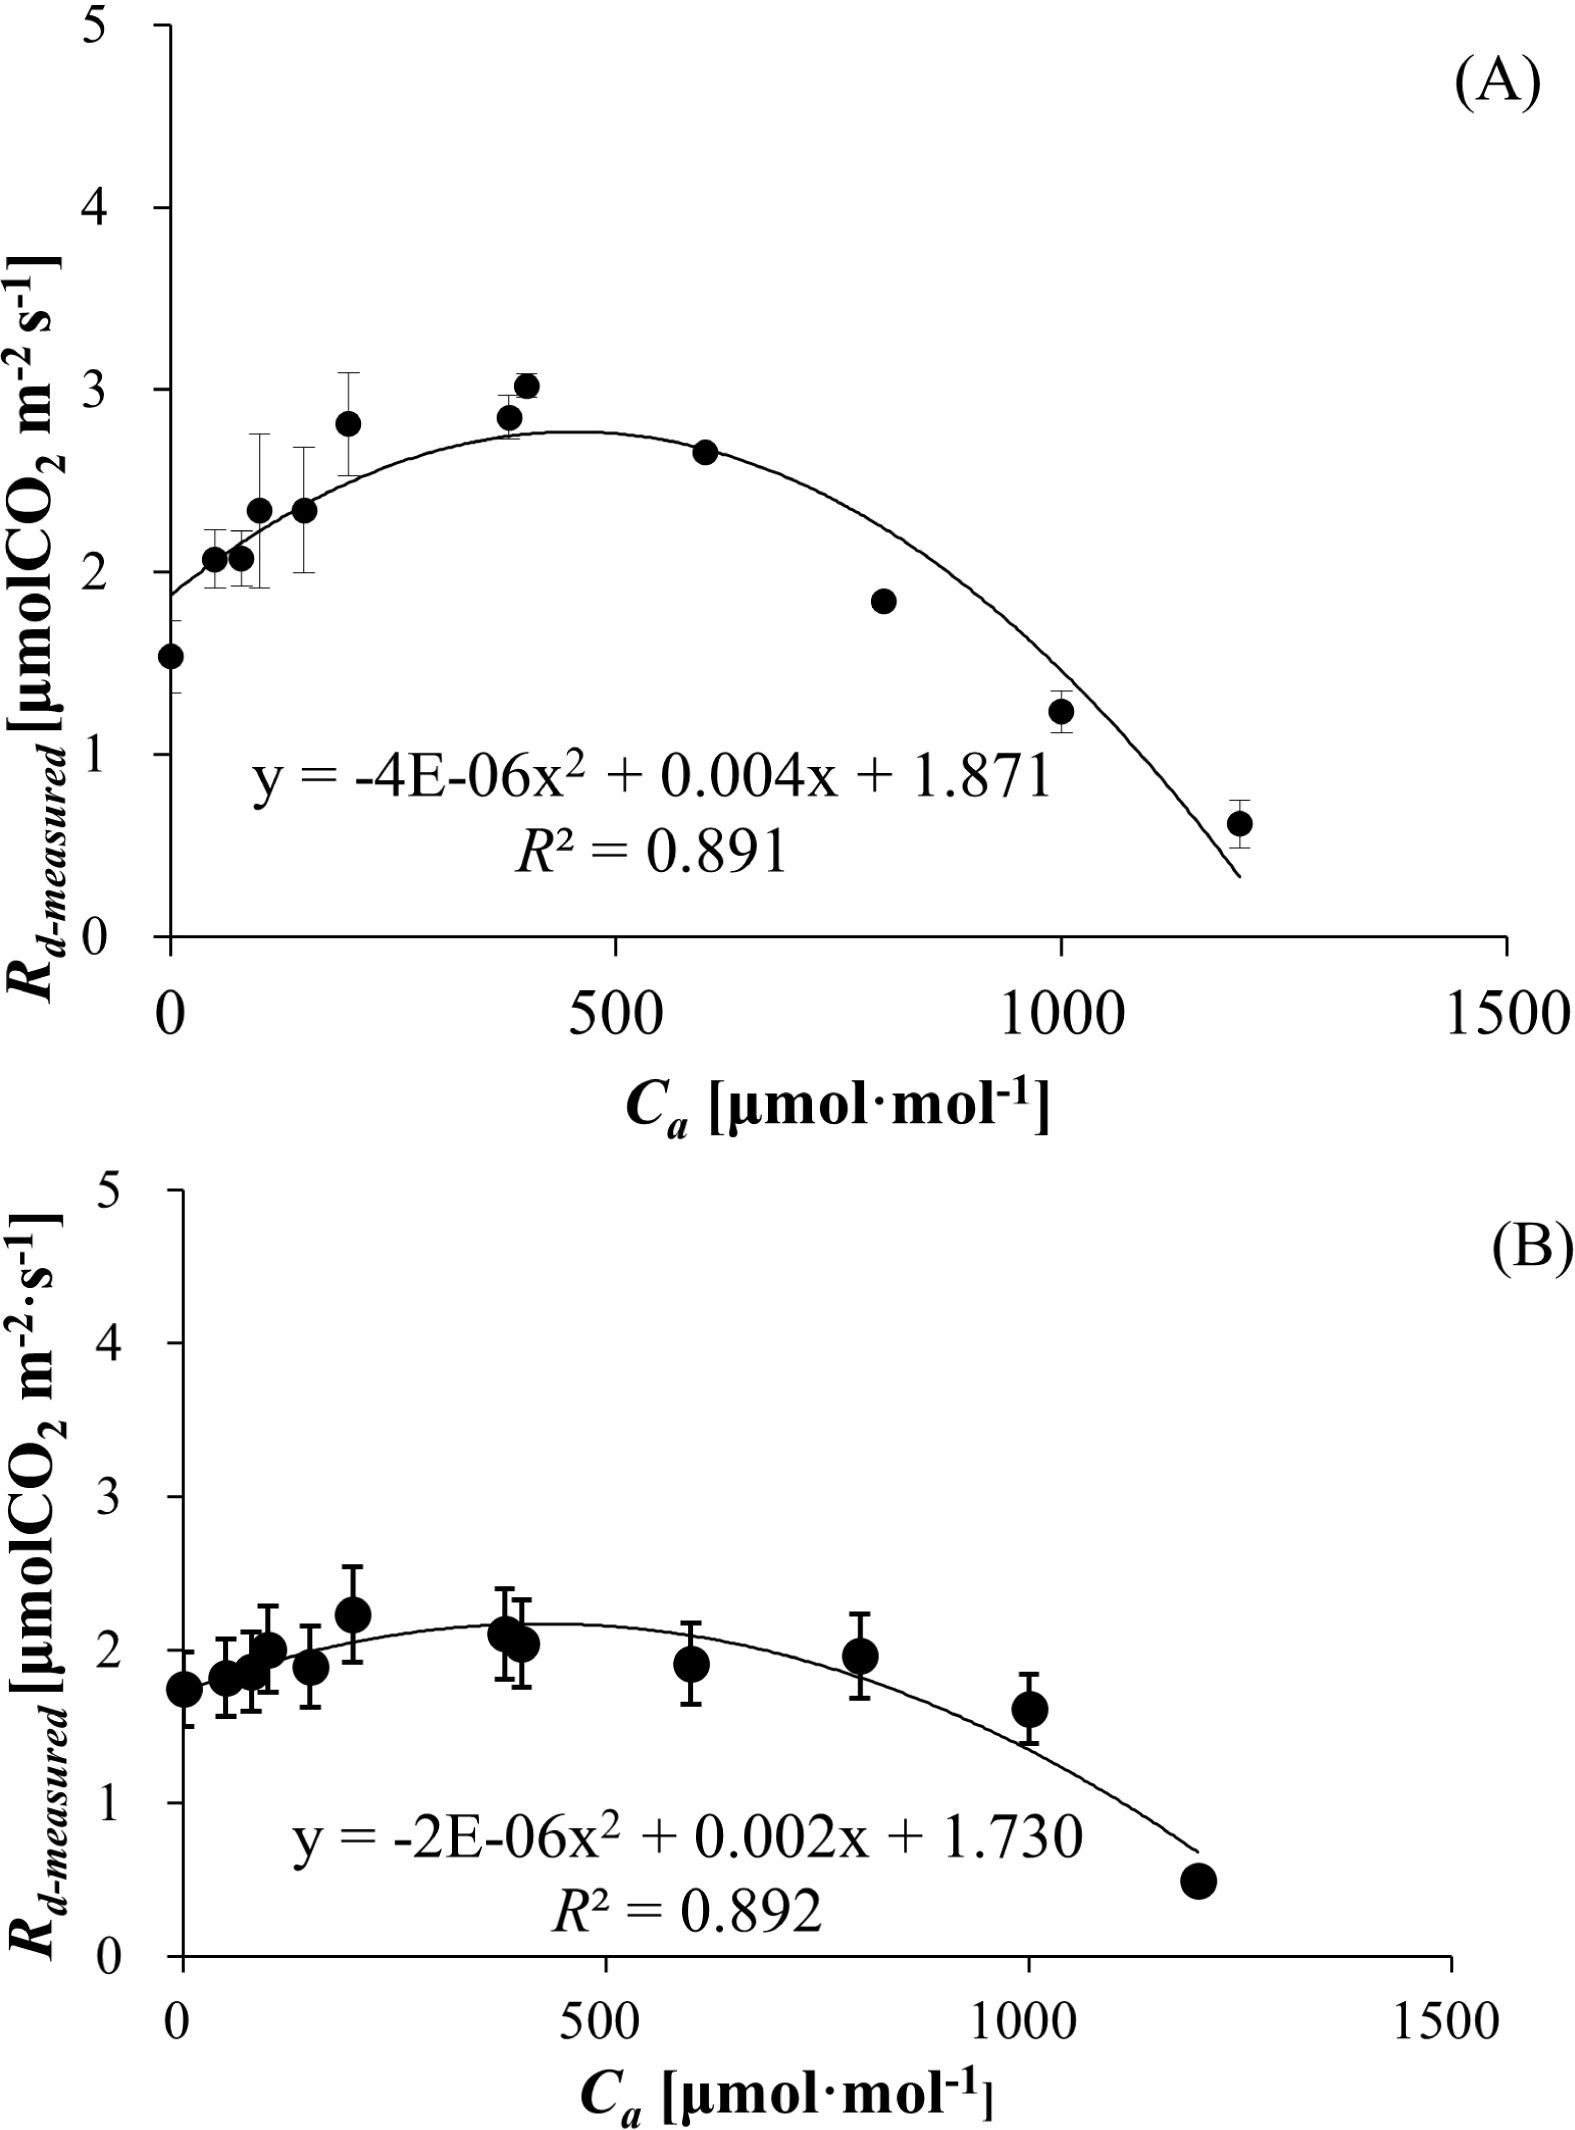
Figure 2. (A) Mitochondrial respiration rate in the light (Rn-measured) of wheat responses to Ca. (B) Mitochondrial respiration rate in the light (Rd-measured) of bean responses to Ca.
3.5 Mitochondrial respiration in the dark (Rn-measured) responses to Ca and O2 concentration
Rn-measured declined progressively with increasing Ca for both wheat and bean, independent of O2 levels (21% vs. 2%). At 21% O2, Rn spanned 1.453 ± 0.603 to 3.862 ± 0.557 μmol (CO2) m−² s−¹ (wheat, Figure 3A) and 1.210 ± 0.340 to 4.040 ± 0.167 μmol (CO2) m−² s−¹ (bean, Figure 3B). Under 2% O2, the ranges shifted to 1.512± 0.674 to 4.101 ± 0.297 (wheat) and 0.817 ± 0.607 to 3.718 ± 0.519 μmol (CO2) m−² s−¹ (bean). Strong negative correlations between Rn and Ca were observed (R² = 0.969 for wheat, R² = 0.977 for bean), with no significant O2 concentration effect (P > 0.05).
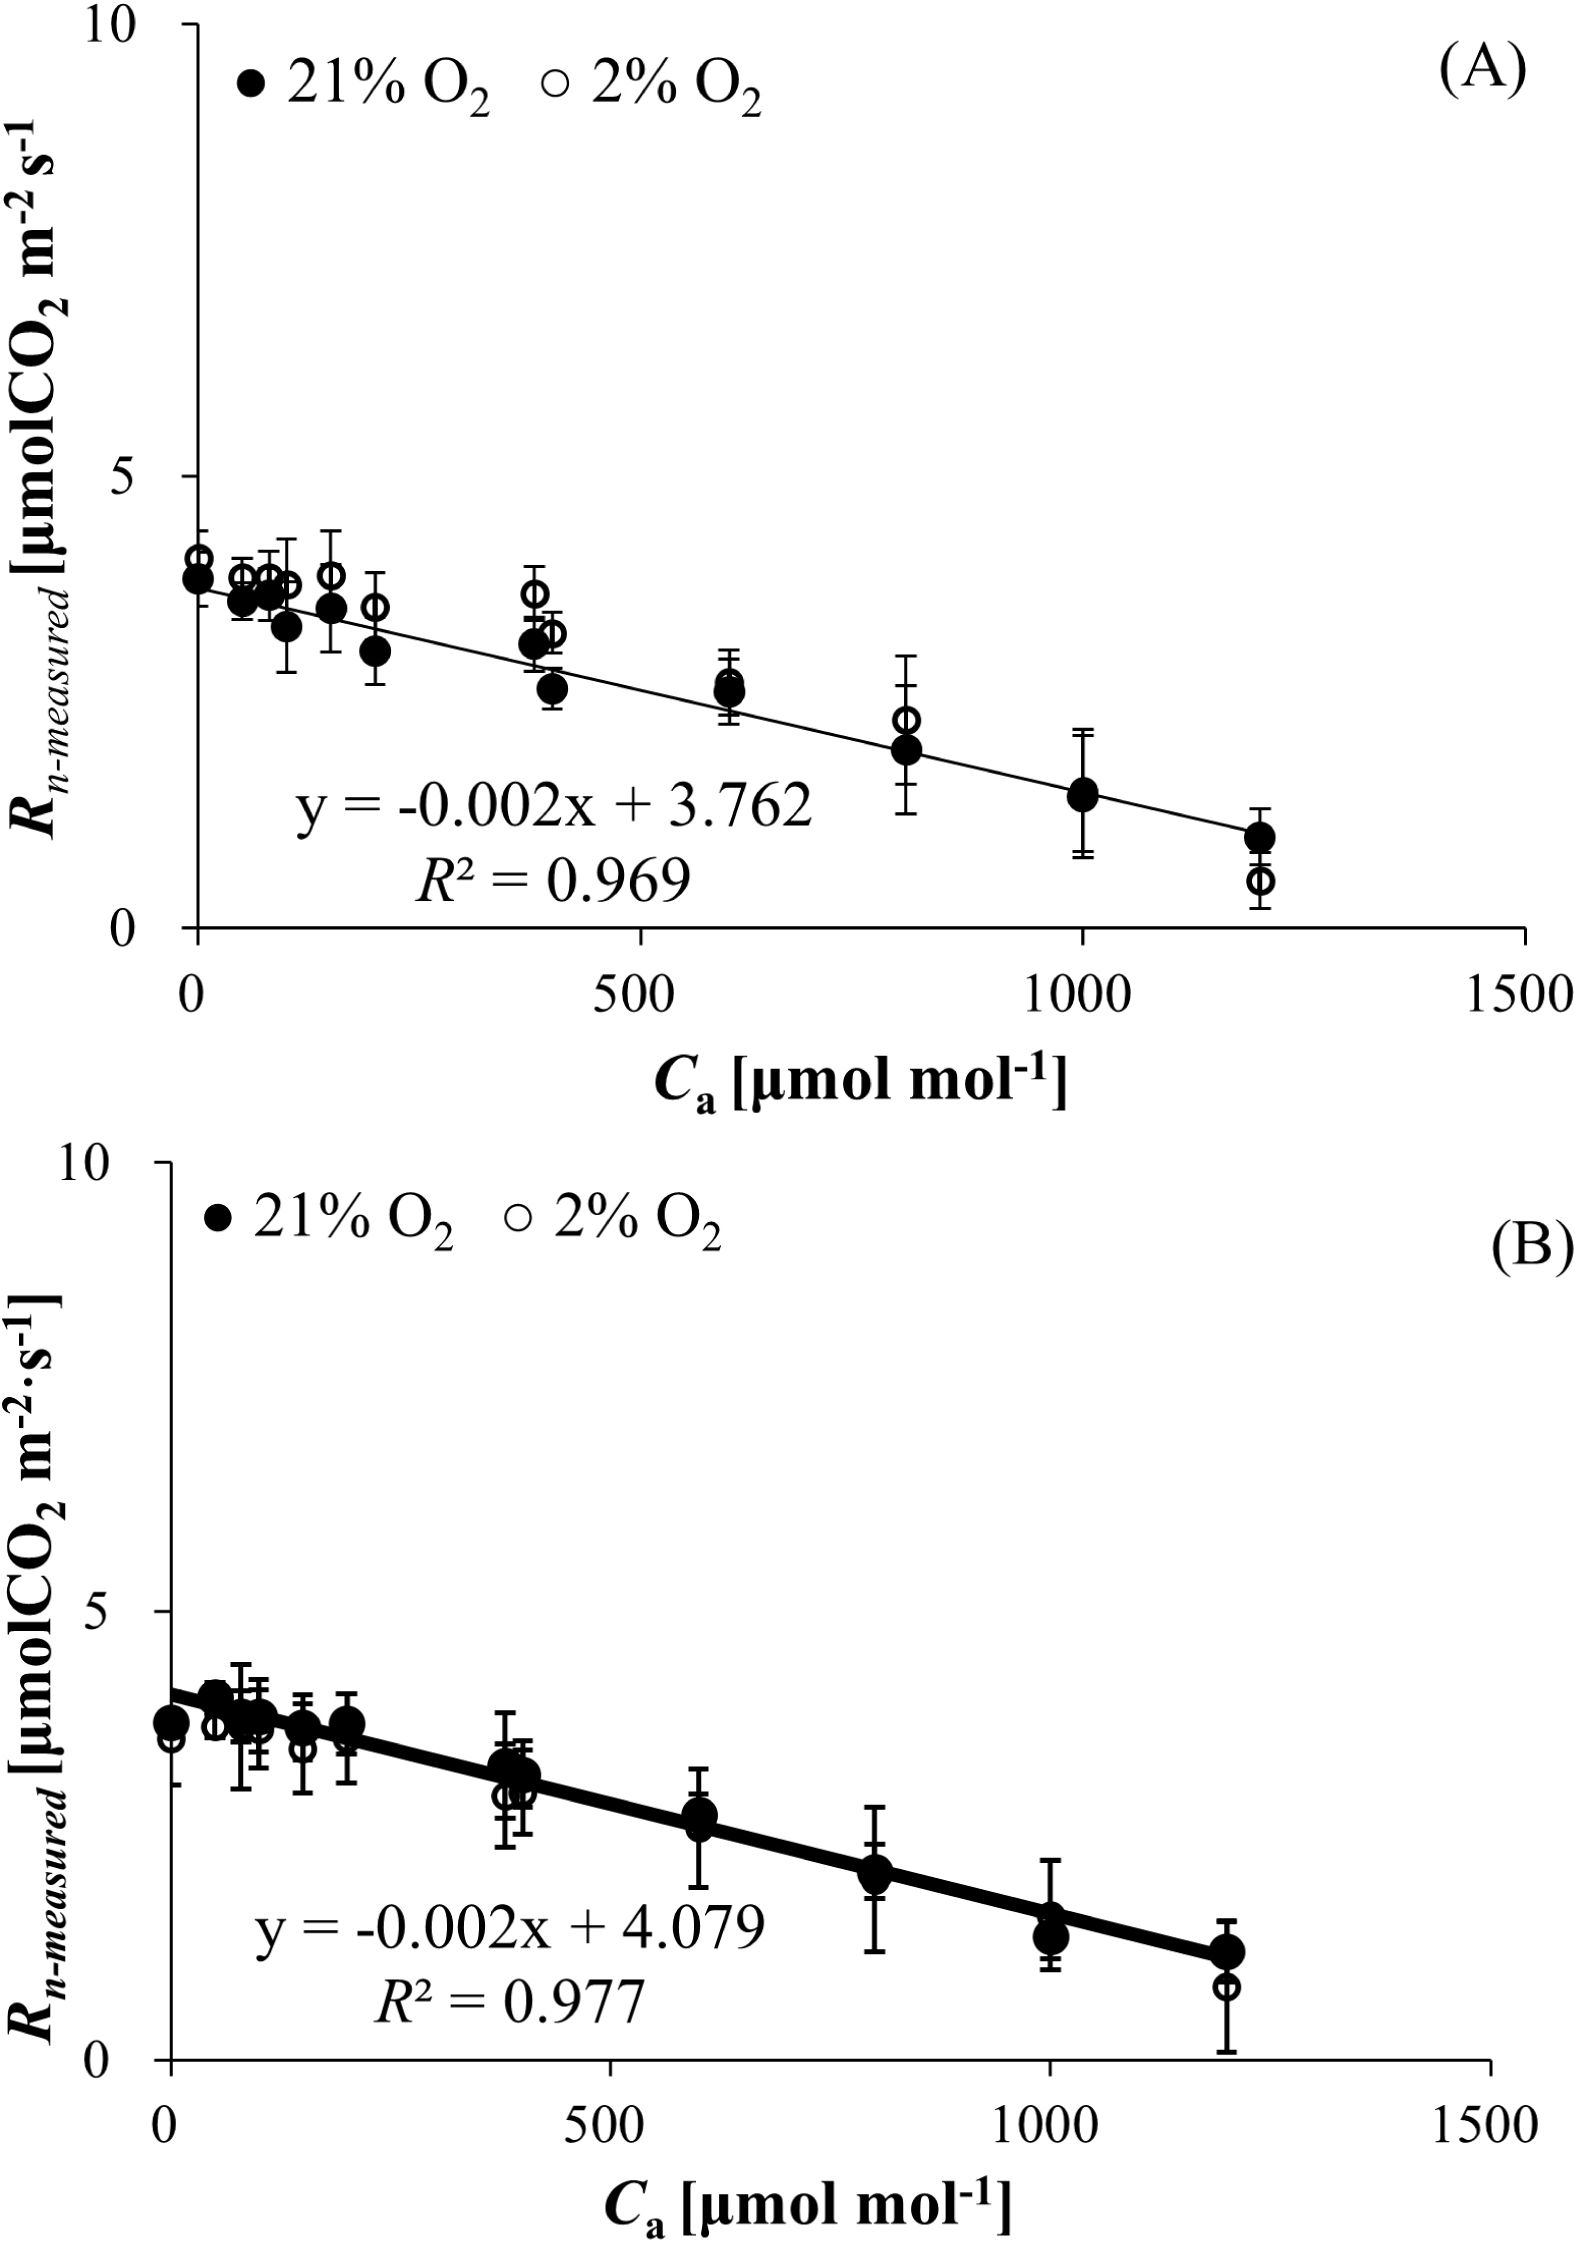
Figure 3. (A) Mitochondrial respiration rate in the dark (Rn-measured) of wheat responses to Ca and O2 concentration. (B) Mitochondrial respiration rate in the dark (Rn-measured) of bean responses to Ca and O2 concentration.
3.6 Recovery (Rpe−i) and inhibition (Ii) ratios response to Ca
As mentioned before, 12.307 ± 1.033 and 11.673 ± 2.054 μmol (CO2) m−2 s−1 were the maximum photorespiration rate values for wheat and bean, respectively. On this basis, the CO2 recovery and inhibition ratios for photorespiration at different CO2 concentrations were estimated according to Equation 6. As Ca increased, the recovery ratios decreased from 59.995% (wheat) and 66.869% (bean) to zero, respectively (Figure 4). After that, the inhibition ratios increased sharply, reaching 57.456% (wheat) and 39.845% (bean), respectively.
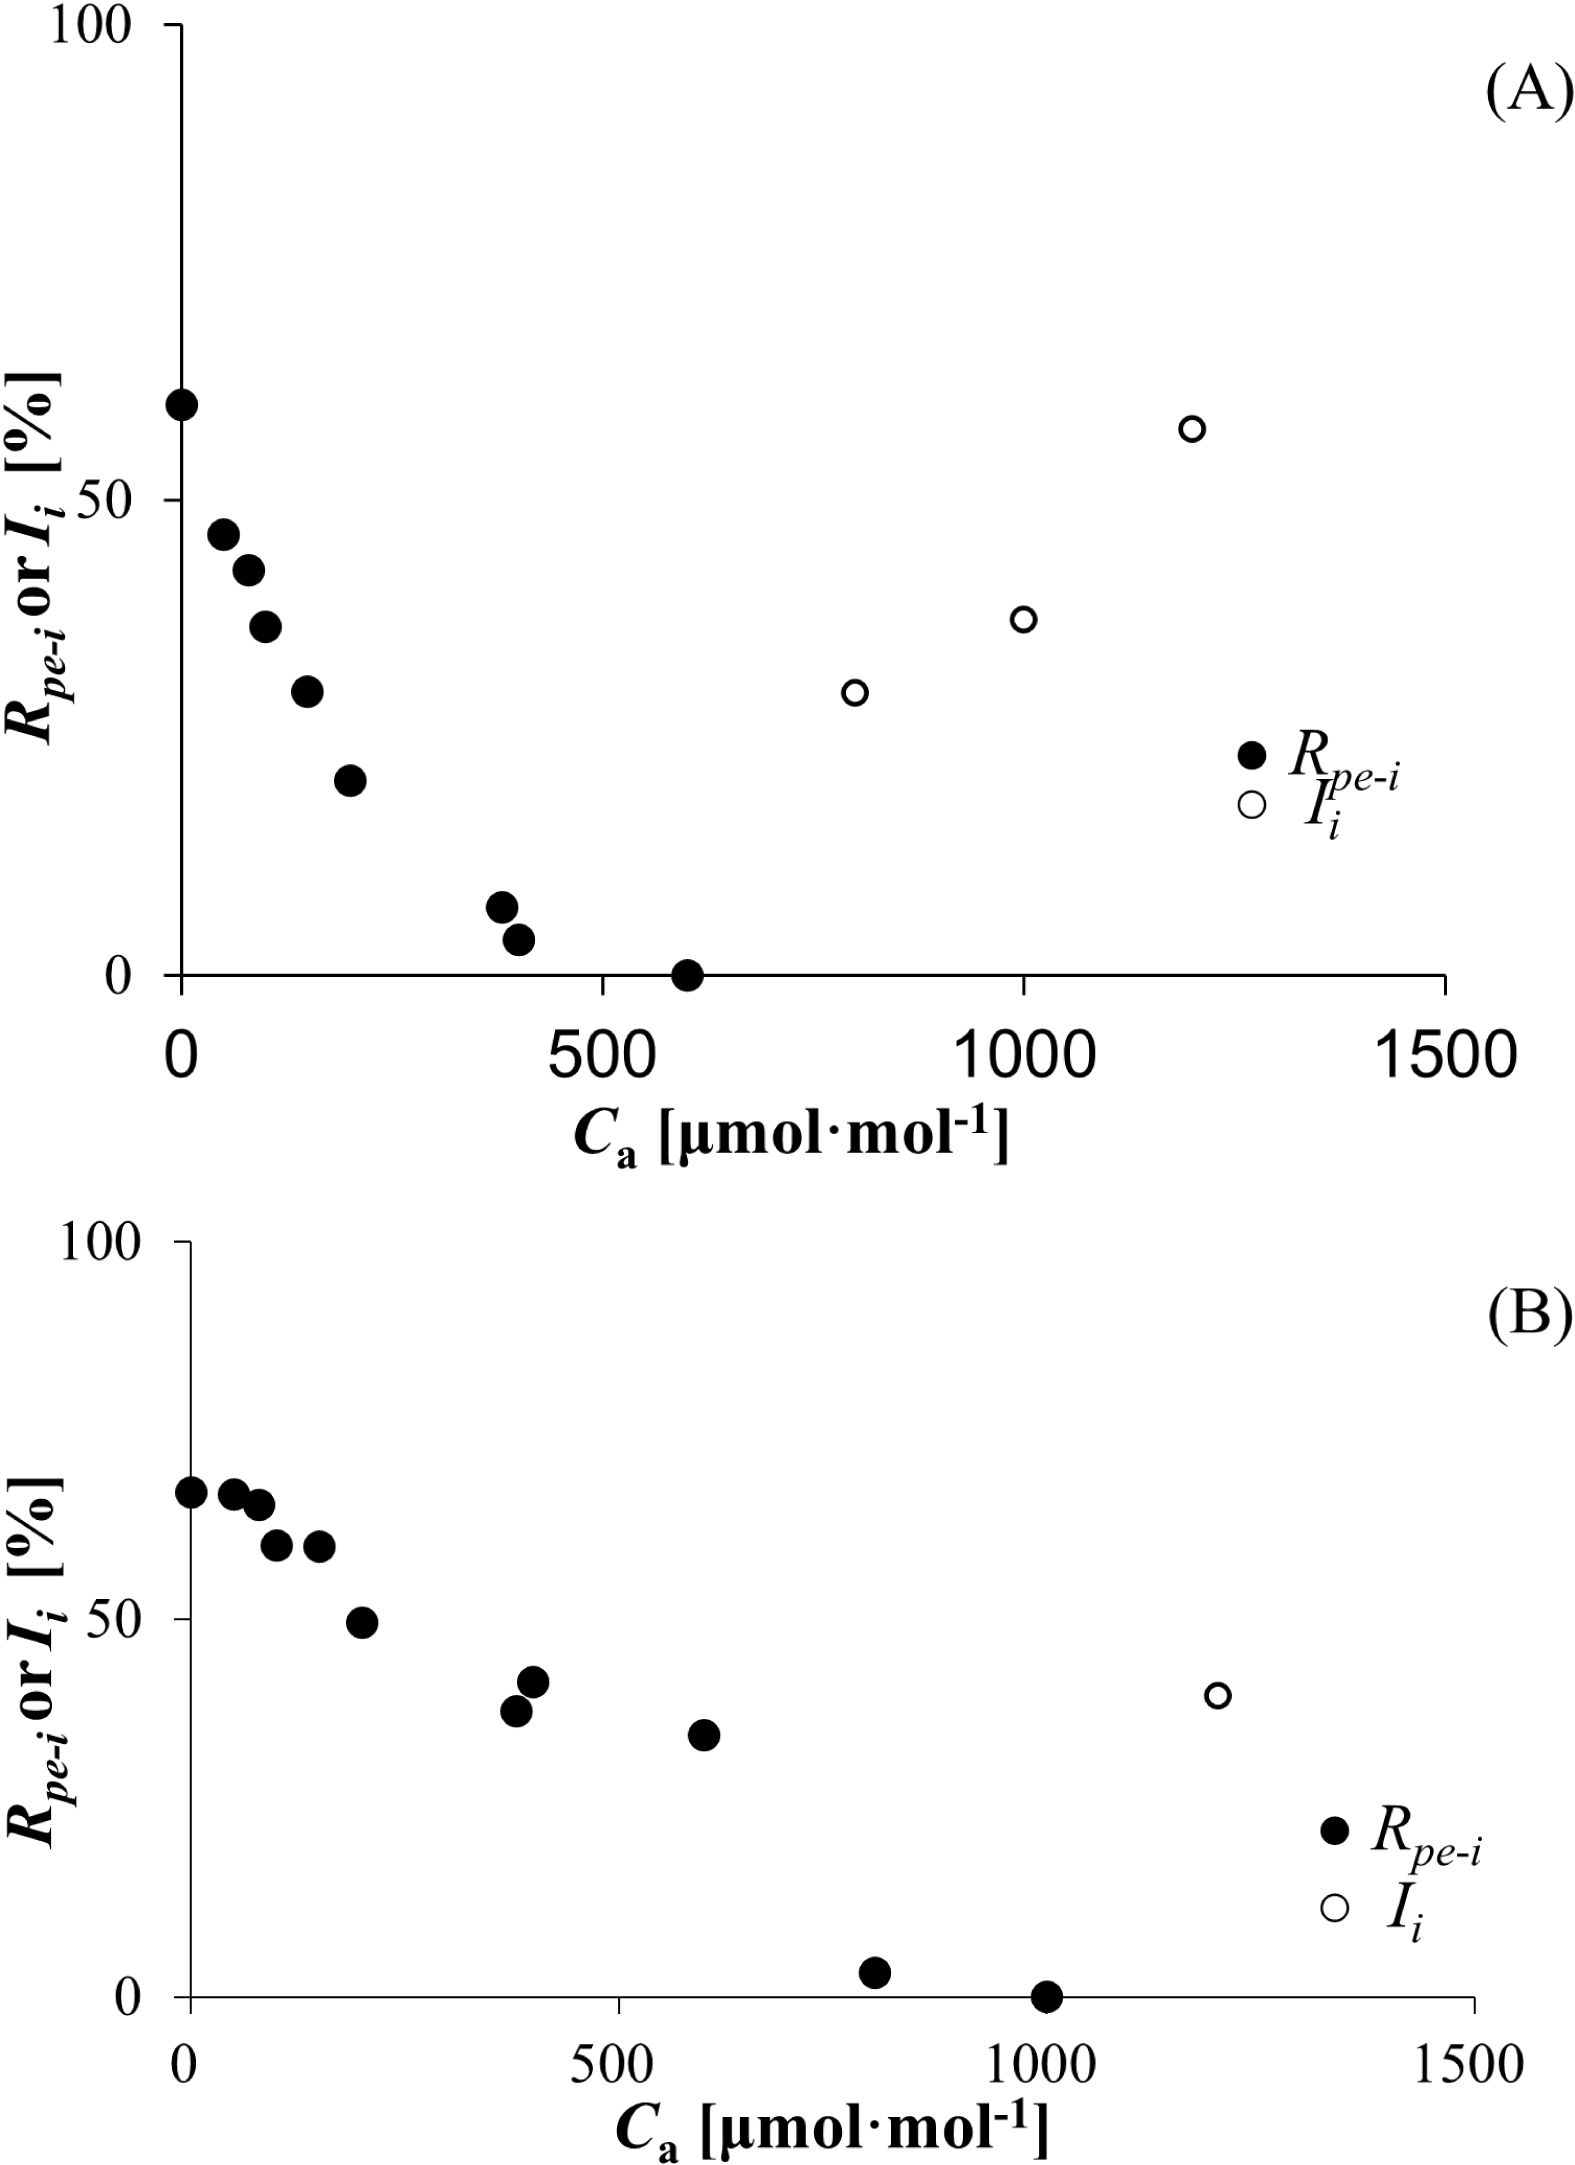
Figure 4. (A) Recovery and inhibition rates (Rpe-i and Ii) of wheat responses to Ca. (B) Recovery and inhibition rates (Rpe-i and Ii) of bean responses to Ca.
4 Discussion
4.1 Respiratory flux partitioning
In the framework of traditional models, the overall respiration rate under light conditions (RL), which aggregates the rates of photorespiration (Rp) and mitochondrial respiration in the light (Rd), has frequently been either conflated with photorespiration alone (Zelitch, 1980; Ye and Yu, 2009; von Caemmerer, 2000) or has overlooked the significance of the reutilization of CO2 released during photorespiration (Kang et al., 2014). This conflation or oversight tends to result in a marked discrepancy between the observed photorespiration rates (Rp-fitted) and their actual values. Our empirical findings, obtained under conditions of 21% O2 and atmospheric CO2 concentration of 0 μmol mol−¹, indicated that the RL-measured values for wheat and bean (6.548 ± 0.136 and 6.334 ± 0.342 μmol m−² s−¹, respectively) significantly surpassed the accurately determined photorespiration rates (Rp-0-measured = 4.511 ± 0.412 and 4.686 ± 0.274 μmol m−² s−¹ for wheat and bean, respectively), as derived through the differential method (RL-measured − Rd-measured). This discrepancy underscores the systematic bias inherent in the traditional approach, which solely attributes RL to photorespiration, thereby neglecting the distinct and crucial contribution of mitochondrial respiration under light conditions (Rd).
Our analysis sheds light on the intricate dynamics between photorespiration and mitochondrial respiration within the context of photosynthesis, challenging the conventional understanding that has, until now, inadequately accounted for the nuanced contributions of these two processes. By distinguishing between RL and its constituent components, Rp and Rd, our study provides a more nuanced understanding of plant respiratory processes in the light, highlighting the significant role of Rd. This clarification is pivotal for refining existing photosynthetic models, ensuring a more accurate representation of plant respiratory mechanisms and their implications for carbon metabolism.
4.2 Model performance evaluation
In the realm of plant physiology, accurately modeling the intricate processes of photorespiration and mitochondrial respiration under photosynthetic conditions is pivotal. Our study, by comparing measured values with the fitted values (Table 1), underscores the remarkable precision of the Modified rectangular hyperbola models, especially when employing A/Ca curves for estimating RL-fitted and Rd-fitted values. This finding aligns with the observations made by Ye and Yu (2009), who posited that the discrepancies observed in earlier models could be attributed to the misrepresentation of intercellular CO2 concentrations by the Ci values used in those models.
However, a notable divergence persists between the fitted values generated by the A/Ca model and the actual measurements. This discrepancy led to the conclusion that previous models might have overlooked the significant impact of CO2 concentration on Rd and Rp. Our analysis suggests an imperative need for further research aimed at refining these models to enhance their accuracy.
4.3 Photorespiration rate and Mitochondrial respiration rate in the light responses to Ca
This study revealed a nonlinear regulatory mechanism of CO2 concentration on photorespiration rate (Rp-measured) and mitochondrial respiration rate in the light (Rd-measured) in C3 plants: Rp-measured increased with rising CO2 concentrations when external CO2 levels were below species-specific thresholds (600 μmol mol−¹ for wheat and 1000 μmol mol−¹ for bean), whereas exceeding these thresholds triggered a significant suppression of Rp-measured. As for Rd-measured, the thresholds were 400 μmol mol−¹ for wheat and 200 μmol mol−¹ for bean. This phenomenon can be explained by the dynamic interplay between RuBisCO enzyme activity and chloroplast microenvironmental conditions. At low CO2 concentrations, although the carboxylation activity of RuBisCO is globally constrained by substrate limitation (Caemmerer and Edmondson, 1986) and RuBP regeneration becomes impaired (Badger et al., 1984), the CO2 released during photorespiration is efficiently re-assimilated by photosynthesis due to its proximity to the chloroplast inner membrane (Yadav et al., 2020). This tight coupling between photorespiratory CO2 release and photosynthetic refixation (Häusler et al., 2002; Loreto et al., 1999; Busch et al., 2013; Kang et al., 2013) partially mitigates the inhibitory effects of low CO2 on the Calvin cycle. Concurrently, enhanced photosynthesis elevates chloroplast O2 levels (Sharkey, 1988), temporarily promoting RuBisCO oxygenation activity and driving the “paradoxical” increase in Rp and Rd. However, when CO2 concentrations surpass species-specific thresholds, the chloroplast CO2/O2 ratio undergoes a fundamental reversal (Brooks and Farquhar, 1985), favoring RuBisCO carboxylation through competitive substrate inhibition of oxygenation, leading to a decrease in Rp-measured and Rd-measured. The observed threshold divergence between wheat and bean likely arises from two interconnected mechanisms: First, interspecific variations in RuBisCO kinetics (e.g., CO2 affinity) and leaf anatomical adaptations regulating CO2 diffusion resistance, consistent with the multiscale regulatory complexity of photorespiratory metabolism (Wang et al., 2020; Celebi-Ergin, 2022). Second, differential cellular metabolic demands—for example, the approximately twofold higher CO2 threshold for peak photorespiration in bean (1,000 vs. 600 μmol·mol−¹ in wheat) aligns with the hypothesis proposed by Krmer et al. (2022) that elevated photorespiratory flux in legumes supports nitrogen assimilation-coupled amino acid synthesis. These findings not only provided theoretical support for crop-specific CO2 fertilization strategies in controlled-environment agriculture but also advance our understanding of carbon-oxygen metabolic homeostasis in C3 plants.
4.4 Mitochondrial respiration rate in dark (Rn-measured) responses to Ca and O2 concentration
Accurately estimating the dark respiration rate of a plant facilitates the calculation of its maximum carboxylation rate, respiration rate in the light, electron flow partitioning, and other important photosynthetic parameters (Wang et al., 2001; Yin et al., 2011). Oxygen is essential for the respiration process in plant cells (Moseley et al., 2018). However, the results of our experiments showed that there was no significant difference in dark mitochondrial respiration rates between wheat and bean at 2% and 21% O2 (Table 1). It’s meant to be sufficient oxygen for mitochondrial respiration at 2% O2. In addition, we can notice that there is linear regulatory mechanism of CO2 concentration on Rn-measured, i.e., the Rn decreased as Ca increased (Figures 3A, B), which was different from the relationship between Rd-measured, Rp-measured, and carbon dioxide. We speculate that this may be due to the increase in CO2 concentration inhibiting the activity of certain enzymes related to dark respiration, and this effect is stronger than that of Rd-measured and Rp-measured. Reuveni and Gale (1985) also obtained the similar results that CO2 concentration has a strong effect on dark respiration rates in plants.
5 Conclusion
This study advanced our understanding of respiratory parameter estimation in C3 plants by systematically evaluating the accuracy of photorespiration (Rp) and mitochondrial respiration in the light (Rd) derived from CO2-response models. Key findings revealed that the modified rectangular hyperbola model under the A/Ca framework outperformed traditional A/Ci models in estimating Rp and Rd, yet significant discrepancies persisted between modeled and empirical values (p< 0.01), highlighting inherent limitations in current methodologies. Notably, CO2 concentration exhibited dose-dependent, non-linear regulation of respiratory parameters. Rp-measured in wheat and bean demonstrated unimodal responses to Ca, peaking at 600 and 1,000 μmol·mol−¹, respectively, before declining due to competitive inhibition of RuBisCO oxygenation. Similarly, Rd-measured displayed different thresholds between bean and wheat (400 μmol mol−¹ for wheat and 200 μmol mol−¹ for bean.). The identification of strong polynomial correlations (R² > 0.89) between Ca and respiratory fluxes challenges conventional assumptions of linear responses, emphasizing the need to integrate CO2-responsive regulatory dynamics into photosynthetic models. Furthermore, dark respiration (Rn-measured) exhibited a linear decline with rising Ca, independent of O2 concentration, suggesting distinct mechanistic controls compared to light-dependent respiration.
These findings provide critical insights for refining photosynthetic models by incorporating CO2-mediated respiratory adjustments. The empirical relationships established here offer a framework for optimizing carbon assimilation strategies in crops under rising atmospheric CO2, particularly in controlled-environment agriculture.
Data availability statement
The datasets presented in this article are not readily available because data privacy. Requests to access the datasets should be directed to a2FuZ2h1YWppbmdAMTI2LmNvbQ==.
Author contributions
HK: Conceptualization, Funding acquisition, Methodology, Supervision, Writing – review & editing. ZN: Investigation, Writing – original draft, Writing – review & editing. ZY: Data curation, Formal Analysis, Writing – review & editing. QH: Formal Analysis, Investigation, Writing – review & editing. CP: Investigation, Writing – review & editing.
Funding
The author(s) declare financial support was received for the research and/or publication of this article. This work was supported by the 863 Project under contract No. 2013AA102903, the National Key Technologies R & D Program of China No.2013BAD05B03, the Natural Science Foundation of China No. 31560069 and the Key Science and Technology Innovation Team Project of Wenzhou City No. C20150008.These funds provide expenses for data collection, measurement, and paper layout fees for this study.
Conflict of interest
The authors declare that the research was conducted in the absence of any commercial or financial relationships that could be constructed as a potential conflict of interest.
Publisher’s note
All claims expressed in this article are solely those of the authors and do not necessarily represent those of their affiliated organizations, or those of the publisher, the editors and the reviewers. Any product that may be evaluated in this article, or claim that may be made by its manufacturer, is not guaranteed or endorsed by the publisher.
References
Atkin, O. K., Bruhn, D., Hurry, V. M., and Tjoelker, M. G. (2005). Evans Review No. 2 - The hot and the cold: Unravelling the variable response of plant respiration to temperature. Funct. Plant Biol. 32, 87–105. doi: 10.1071/FP03176
Badger, M. R., Sharkey, T. D., and von Caemmerer, S. (1984). The relationship between steady-state gas exchange of bean leaves and the levels of carbon-reduction-cycle intermediates. Planta 160, 305–313. doi: 10.1007/BF00393411
Bernacchi, C. J., Singsaas, E. L., Pimentel, C., Portis, A. R., and Long, S. P. (2001). Improved temperature response functions for models of Rubisco-limited photosynthesis. Plant Cell Environ. 24, 253–259. doi: 10.1111/J.1365-3040.2001.00668.X
Borrell, A. N., Shi, Y., Gan, Y., Bainard, L. D., Germida, J. J., and Hamel, C. (2017). Fungal diversity associated with pulses and its influence on the subsequent wheat crop in the Canadian prairies. Plant Soil 414, 13–31. doi: 10.1007/s11104-016-3075-y
Brooks, A. and Farquhar, G. D. (1985). Effect of temperature on the CO2/O2 specificity of ribulose-1,5-bisphosphate carboxylase/oxygenase and the rate of respiration in the light. Planta 165, 397–406. doi: 10.1007/BF00392238
Busch, F. A. and Sage, R. F. (2017). The sensitivity of photosynthesis to O2 and CO2 concentration identifies strong Rubisco control above the thermal optimum. New Phytol. 213, 1036–1051. doi: 10.1111/nph.14258
Busch, F. A., Sage, T. L., Cousins, A. B., and Sage, R. F. (2013). C3 plants enhance rates of photosynthesis by reassimilating photorespired and respired CO2. Plant Cell Environ. 36, 200–212. doi: 10.1111/j.1365-3040.2012.02567.x
Caemmerer, S. and Edmondson, D. (1986). Relationship Between Steady-State Gas Exchange, in vivo Ribulose Bisphosphate Carboxylase Activity and Some Carbon Reduction Cycle Intermediates in Raphanus sativus. Funct. Plant Biol. 13, 669–688. doi: 10.1071/pp9860669
Carvalho, J. de F.C., Madgwic, P. J., and Powers, S. J. (2011). An engineered pathway for glyoxylate metabolism in tobacco plants aimed to avoid the release of ammonia in photorespiration. BMC Biotech. 11, 111~127. doi: 10.1186/1472-6750-11-111
Celebi-Ergin, B. (2022). Photorespiration in eelgrass (Zostera marina L.): A photoprotection mechanism for survival in a CO2-limited world. Front. Plant Sci. 13. doi: 10.3389/fpls.2022.1025416
Easterling, D. R., Evans, J. L., Groisman, P. Y., Karl, T. R., Kunkel, K. E., and Ambenje, P. (2000). Observed variability and trends in extreme climate events: A brief review. Bull. Am. Meteorol. Soc 81, 417–425. doi: 10.1175/1520-0477(2000)081<0417:OVATIE>2.3.CO;2
Erdei, L., Horváth, F., Tari, I., Pécsváradi, A., Szegletes, Z., and Dulai, S. (2001). Differences in photorespiration, glutamine synthetase and polyamines between fragmented and closed stands of Phragmites australis. Aquat. Bot. 69, 165–176. doi: 10.1016/S0304-3770(01)00136-X
Ethier, G. J. and Livingston, N. J. (2004). On the need to incorporate sensitivity to CO2 transfer conductance into the Farquhar-von Caemmerer-Berry leaf photosynthesis model. Plant Cell Environ. 27, 137–153. doi: 10.1111/j.1365-3040.2004.01140.x
Gan, Y., Hamel, C., O’Donovan, J. T., Cutforth, H., Zentner, R. P., Campbell, C. A., et al. (2015). Diversifying crop rotations with pulses enhances system productivity. Sci. Rep. 5, 14625. doi: 10.1038/srep14625
Harley, P. C., Thomas, R. B., Reynolds, J. F., and Strain, B. R. (1992). Modelling photosynthesis of cotton grown in elevated CO2. Plant Cell Environ. 15, 271–282. doi: 10.1111/j.1365-3040.1992.tb00974.x
Haupt-Herting, S., Klug, K., and Fock, H. P. A. (2001). New approach to measure gross CO2 fluxes in leaves. Gross CO2 assimilation, photorespiration, and mitochondrial respiration in the light in tomato under drought stress. Plant Physiol. 126, 388–396. doi: 10.1104/pp.126.1.388
Häusler, R. E., Hirsch, H. J., Kreuzaler, F., and Peterhänsel, C. (2002). Overexpression of C4-cycle enzymes in transgenic C3 plants: A biotechnological approach to improve C3-photosynthesis. J. Exp. Bot. 53, 591–607. doi: 10.1093/jexbot/53.369.591
Hou, R., Ouyang, Z., Li, Y., Tyler, D. D., Li, F., and Wilson, G. V. (2012). Effects of tillage and residue management on soil organic carbon and total nitrogen in the North China plain. Soil Sci. Soc Am. J. 76, 230–240. doi: 10.2136/sssaj2011.0107
Huang, D., Jing, G., and Zhu, S. (2023). Regulation of mitochondrial respiration by hydrogen sulfide. Antioxidants 12, 1644. doi: 10.3390/antiox12081644
IPCC (2021). “Climate change 2021: the physical science basis,” in Contribution of Working Group I to the Sixth Assessment Report of the Intergovernmental Panel on Climate Change (Cambridge University Press, Oxford, UK), 7–125.
Jalali, A., Linke, M., Geyer, M., and Mahajan, P. V. (2020). Shelf life prediction model for strawberry based on respiration and transpiration processes. Food Packag. Shelf Life 25, 2020. doi: 10.1016/j.fpsl.2020.100525
Kang, H., Li, H., Tao, Y., and Ouyang, Z. (2014). Photosynthetic refixing of CO2 is responsible for the apparent disparity between mitochondrial respiration in the light and in the dark (in chinese). Acta Physiol. Plant 36, 3157–3162. doi: 10.3724/SP.J.1258.2014.00130
Kang, H., Tao, Y., Quan, W., Wang, W., Yang, X., and Ouyang, Z. (2013). The response of photorespiration of C3 plant to different light intensities and CO2 concentrations (in chinese). J. Triticeae Crops 33, 1252–1257. doi: 10.7606/j.issn.1009-1041.2013.06.023
Krmer, K., Brock, J., and Heyer, A. (2022). Interaction of nitrate assimilation and photorespiration at elevated CO2. Front. Plant Sci. 13. doi: 10.3389/fpls.2022.897924
Laisk, A., Oja, V., Rasulov, B., Rämma, H., Eichelmann, H., Kasparova, I., et al. (2002). A computer-operated routine of gas exchange and optical measurements to diagnose photosynthetic apparatus in leaves. Plant Cell Environ. 25, 923–943. doi: 10.1046/j.1365-3040.2002.00873.x
Lin, W. H. (1998). Response of photosynthesis to elevated atmospheric CO2 (in chinese). Acta Ecol. Sinica 18, 529–538. doi: 10.3321/j.issn:1000-0933.1998.05.013
Liu, C. M. and Yu, H. N. (1997). The Soil-Plant-Atmosphere System Experimental Study on Moisture Movement (Beijing: Meteorological Press).
Long, S. P. and Bernacchi, C. J. (2003). Gas exchange measurements, what can they tell us about the underlying limitations to photosynthesis? Procedures and sources of error. J. Exp. Bot. 54, 2393–2401. doi: 10.1093/jxb/erg262
Loreto, F., Delfine, S., and Di Marco, G. (1999). Estimation of photorespiratory carbon dioxide recycling during photosynthesis. Aust. J. Plant Physiol. 26, 733–736. doi: 10.1071/pp99096
Loreto, F., Velikova, V., and Di Marco, G. (2001). Respiration in the light measured by 12CO2 emission in 13CO2 atmosphere in maize leaves. Aust. J. Plant Physiol. 28, 1103–1108. doi: 10.1071/pp01091
Luo, Y., Wan, S., Hui, D., and Wallace, L. L. (2001). Acclimatization of soil respiration to warming in a tall grass prairie. Nature 413, 622–625. doi: 10.1038/35098065
Moseley, R. C., Mewalal, R., Motta, F., Tuskan, G. A., Haase, S., and Yang, X. (2018). Conservation and diversification of circadian rhythmicity between a model crassulacean acid metabolism plant kalanchoë fedtschenkoi and a model C3 photosynthesis plant arabidopsis thaliana. Front. Plant Sci. 871. doi: 10.3389/fpls.2018.01757
Nilsen, E. T. (1995). Stem photosynthesis: extent, patterns, and role in plant carbon economy. Plant Stems, 223–240. doi: 10.1016/B978-012276460-8/50012-6
Ostle, N., Ineson, P., Benham, D., and Sleep, D. (2000). Carbon assimilation and turnover in grassland vegetation using an in situ13CO2 pulse labelling system. Rapid Commun. Mass Spectrom. 14, 1345–1350. doi: 10.1002/1097-0231(20000815)14:15<1345::AID-RCM22>3.0.CO;2-B
Pärnik, T. and Keerberg, O. (2007). Advanced radiogasometric method for the determination of the rates of photorespiratory and respiratory decarboxylations of primary and stored photosynthates under steady-state photosynthesis. Physiol. Plant. 129, 34–44. doi: 10.1111/j.1399-3054.2006.00824.x
Parys, E., Romanowska, E., and Siedlecka, M. (2004). Light-enhanced dark respiration in leaves and mesophyll protoplasts of pea in relation to photorespiration, respiration and some metabolites content. Acta Physiol. Plant 26, 37–46. doi: 10.1007/s11738-004-0042-7
Pinelli, P. and Loreto, F. (2003). 12CO2 emission from different metabolic pathways measured in illuminated and darkened C3 and C4 leaves at low, atmospheric and elevated CO2 concentration. J. Exp. Bot. 54, 1761–1769. doi: 10.1093/jxb/erg187
Reuveni, J. and Gale, J. (1985). The effect of high levels of carbon dioxide on dark respiration and growth of plants. Plant Cell Environ. 8, 623–638. doi: 10.1111/j.1365-3040.1985.tb01701.x
Schimel, D. S., House, J. I., Hibbard, K. A., Bousquet, P., Ciais, P., Peylin, P., et al. (2001). Recent patterns and mechanisms of carbon exchange by terrestrial ecosystems. Nature 414, 169–172. doi: 10.1038/35102500
Sharkey, T. D. (1988). Estimating the rate of photorespiration in leaves. Physiol. Plant 73, 147–152. doi: 10.1111/j.1399-3054.1988.tb09205.x
Stirbet, A., Lazár, D., Guo, Y., and Govindjee, G. (2020). Photosynthesis: Basics, history and modelling. Ann. Bot. 126, 511–537. doi: 10.1093/aob/mcz171
Vaughan, D. G., Marshall, G. J., Connolley, W. M., Parkinson, C., Mulvaney, R., Hodgson, D. A., et al. (2003). Recent rapid regional climate warming on the Antarctic Peninsula. Clim. Change 60, 243–274. doi: 10.1023/A:1026021217991
Vercellino, I. and Sazanov, L. A. (2022). The assembly, regulation and function of the mitochondrial respiratory chain. Nat. Rev. Mol. Cell Biol. 23, 141–161. doi: 10.1038/s41580-021-00415-0
von Caemmerer, S. (2000). Biochemical models of leaf photosynthesis. (CSIRO Publishing, Collingwoo). 38. doi: 10.5860/choice.38-0936
von Caemmerer, S. and Farquhar, G. D. (1981). Some relationships between the biochemistry of photosynthesis and the gas exchange of leaves. Planta 153, 376–387. doi: 10.1007/BF00384257
Wang, F., Gao, J., Yong, J. W. H., Wang, Q., Ma, J., and He, X. (2020). Higher atmospheric CO2 levels favor C3 plants over C4 plants in utilizing ammonium as a nitrogen source. Front. Plant Sci. 11. doi: 10.3389/fpls.2020.537443
Wang, X., Lewis, J. D., Tissue, D. T., Seemann, J. R., and Griffin, K. L. (2001). Effects of elevated atmospheric CO2 concentration on leaf dark respiration of Xanthium strumarium in light and in darkness. Proc. Natl. Acad. Sci. U. S. A. 98, 2479–2484. doi: 10.1073/pnas.051622998
Wang, J., Yu, G., Fang, Q., Jiang, D., Qi, H., and Wang, Q. (2008). Responses of water use efficiency of nine plant species to light and CO2 and its modeling (in chinese). Acta Ecol. Sinica 28, 525–533. doi: 10.3321/j.issn:1000-0933.2008.02.010
Xanthopoulos, G. T., Templalexis, C. G., Aleiferis, N. P., and Lentzou, D. I. (2017). The contribution of transpiration and respiration in water loss of perishable agricultural products: The case of pears. Biosyst. Eng. 158, 76–85. doi: 10.1016/j.biosystemseng.2017.03.011
Yadav, S., Rathore, M. S., and Mishra, A. (2020). The pyruvate-phosphate dikinase (C4-SmPPDK) gene from Suaeda monoica enhances photosynthesis, carbon assimilation, and abiotic stress tolerance in a C3 plant under elevated CO2 conditions. Front. Plant Sci. 11. doi: 10.3389/fpls.2020.00345
Ye, Z. (2010). A review on modeling of responses of photosynthesis to light and CO2 (in chinese). Chin. J. Plant Ecol. 34, 727–740. doi: 10.3773/j.issn.1005-264x.2010.06.012
Ye, Z. and Yu, Q. (2009). A comparison of response curves of winter wheat photosynthesis to flag leaf intercellular and air CO2 concentrations (in chinese). Chin. J. Ecol. 28, 2233–2238.
Yin, X., Sun, Z., Struik, P. C., and Gu, J. (2011). Evaluating a new method to estimate the rate of leaf respiration in the light by analysis of combined gas exchange and chlorophyll fluorescence measurements. J. Exp. Bot. 62, 3489–3499. doi: 10.1093/jxb/err038
Zelitch, I. (1980). Measurement of photorespiratory activity and the effect of inhibitors. Methods Enzymol. 69, 453–464. doi: 10.1016/S0076-6879(80)69044-2
Keywords: CO2 concentration, CO2 recovery, mitochondrial respiration rate, photorespiration, global change
Citation: Niu Z, Ye Z-W-Y, Huang Q, Peng C and Kang H (2025) Accuracy of photorespiration and mitochondrial respiration in the light fitted by CO2 response model for photosynthesis. Front. Plant Sci. 16:1455533. doi: 10.3389/fpls.2025.1455533
Received: 27 June 2024; Accepted: 01 August 2025;
Published: 26 August 2025.
Edited by:
Wilhelm Boland, Max Planck Institute for Chemical Ecology, GermanyReviewed by:
Ferit Kocacinar, Kahramanmaras Sütçü Imam University, TürkiyeMarko Kolaksazov, Institute of Forage Crops, Bulgaria
Copyright © 2025 Niu, Ye, Huang, Peng and Kang. This is an open-access article distributed under the terms of the Creative Commons Attribution License (CC BY). The use, distribution or reproduction in other forums is permitted, provided the original author(s) and the copyright owner(s) are credited and that the original publication in this journal is cited, in accordance with accepted academic practice. No use, distribution or reproduction is permitted which does not comply with these terms.
*Correspondence: Huajing Kang, a2FuZ2h1YWppbmdAMTI2LmNvbQ==