Abstract
Chinese fir (Cunninghamia lanceolata) is a key native tree species in southern China. Accurate estimation of above-ground biomass and its distribution is essential for the sustainable use of Chinese fir forests. UAV-based high-density point clouds and high-resolution spectral data provide critical remote sensing for detailed 3D tree structure analysis. This study aimed to explore the aboveground biomass allocation characteristics across the different growth stages of Chinese fir and to develop accurate biomass models. Measurements of 20,836 Chinese fir trees were used for the purpose. Through the comparative analysis of four basic models, the Power Function model was identified as the optimal one, particularly excelling in fitting the accuracy for stem and bark biomass. To further enhance the model’s fitting performance, age groups were introduced into the dummy model, categorizing the Chinese fir forests into the five distinct growth stages. Results showed age groups used as dummy variables led to an average increase in R² by 2.6%. The fitting accuracy for bark and branch biomass saw the most significant improvements, with increases in R² by 4.2% and 3.1%. To address the inconsistency between the sum of individual biomass components and total biomass, we employed a seemingly unrelated regression (SUR) model. Even though fitting accuracy for individual tree components decreased by an average of 2.5%, from a practical perspective SUR model would be more suitable for understanding the interrelationships between different components. These findings offer robust support for accurately estimating the aboveground biomass in Chinese fir forests across different growth stages.
1 Introduction
Forest ecosystems are the pillars of terrestrial ecosystems (Field and Raupach, 2012), occupying a critical role in the Earth’s ecological system and playing a significant regulatory function (Subati and Jia, 2021). As fundamental attributes of forest ecosystems, estimation of forest biomass has become key issues in forest research and forestry applications (Lieth and Whittaker, 2012). Accurate forest biomass models not only form the basis for evaluating forest carbon sequestration capacity but also provide critical scientific support for carbon trading mechanisms and climate change policy development (Ma et al., 2024; Zhang J. et al., 2019). However, current biomass estimation methods still face various technical challenges, such as difficulties in field data collection, inefficiency of traditional biomass estimation techniques, significant measurement errors, and limited generalizability of biomass models across different regions and tree species (Weiskittel et al., 2015). These challenges can lead to uncertainties in forest carbon stock estimates, subsequently affecting the accuracy of ecological management decisions (Holdaway et al., 2014). Therefore, developing more efficient and accurate biomass estimation models and improving existing technologies have become pressing priorities in forest carbon sink research (Holdaway et al., 2014).Estimating aboveground biomass, as a crucial component of forest ecosystems, holds immense importance within forest science and forestry practices. This is particularly significant for carbon cycle research, ecosystem service evaluation, and sustainable forest management (He et al., 2013). However, there is considerable uncertainty in estimating forest carbon sink, which can be mitigated by precise estimation of forest biomass (Fu et al., 2022). Therefore, accurately estimating forest biomass is of paramount importance, which can be done using direct and indirect methods. The former method is the most accurate, but time-consuming, labor-intensive, and highly destructive, whereas later method involves developing biomass models (Wang et al., 2018a). Constructing biomass models, as the primary approach for estimating forest biomass, represent an effective and relatively accurate method of investigation. With the advancement of mathematical modeling techniques, the methods for developing tree branch biomass models have evolved from simple least squares regression to more sophisticated and precise modeling, including constructing compatible models that account for measurement errors (Zeng and Tang, 2010b; Zhang et al., 2016). The advanced modeling encompasses seemingly unrelated regression models (SUR), linear or nonlinear joint estimation models (Tang et al., 2000), dummy variable models (Zeng et al., 2011), and mixed-effects models (Fu et al., 2012, 2013, 2016). These models, when applied to tree-scale data, better reflect the biomass distribution across different parts of the tree, providing scientific support for carbon storage and growth analysis at the individual tree level.
When applied to tree-scale data, better reflects the biomass distribution across different parts of the tree, providing scientific support for carbon storage and growth analysis at the individual tree level. Given the critical importance of accurate biomass estimation, the evolution from simple regression methods to more complex and precise models underscore the need for continual refinement in this area. As forest ecosystems continue to play a vital role in global carbon cycles and ecosystem services, the development and application of these sophisticated biomass models are essential for advancing our understanding and management of forest resources. However, traditional manual survey techniques for obtaining individual tree biomass parameters are time-consuming, labor-intensive, inefficient, and lack timeliness, making them increasingly inadequate for the precise monitoring of digitized forest resources under new conditions (Wan et al., 2021). In contrast to conventional remote sensing, Unmanned Aerial Vehicle Light Detection and Ranging (UAV LiDAR) technology can penetrate forest canopies, capturing three-dimensional structural information of forests by emitting laser pulses and receiving reflected signals. This technology provides complete data from the tree top to the base, which is crucial for estimating tree volume and biomass (Wallace et al., 2012; Ghanbari Parmehr and Amati, 2021). This high-precision remote sensing technology captures detailed three-dimensional structures of both the ground surface and vegetation (Dandois and Ellis, 2010), acquiring critical details such as tree height, canopy density, and terrain-key parameters for biomass estimation (Zhang D, et al., 2019). Consequently, UAV LiDAR technology is increasingly used to accurately measure the biomass of individual trees and their branches. This study explores the use of UAV LiDAR data to construct an additive biomass model for Chinese fir forests across the full growth cycle in Guangdong. The application of this technology not only enhances the efficiency and accuracy of forestry resource surveys, but also provides reliable foundational data for forest carbon storage assessment and biodiversity conservation, thereby laying a solid foundation for long-term monitoring and sustainable management of forest ecosystems. This approach can subsequently be extended to biomass estimation across entire forest stands (Fang et al., 2015).
Chinese fir (Cunninghamia lanceolata) is recognized for its high-quality timber and significant economic value in forest management, making it one of the most important economic tree species in subtropical regions. Moreover, Chinese fir plays an indispensable role in forest ecosystems (Yu et al., 2010). Its aboveground biomass constitutes a major component of forest carbon storage, holding significant implications for global carbon cycle research and climate change mitigation. The biomass of Chinese fir not only affects the carbon storage capacity of forests but is also closely linked to biodiversity and soil quality. Therefore, studying the adaptability and biomass allocation strategies of Chinese fir across different growth stages has become a focal point in global forestry science research (Dandois and Ellis, 2010). There are notable differences in the biomass allocation strategies of Chinese fir at various growth stages (Li et al., 2022). As the growth stages advance, particularly during the young and middle-aged phases, the growth rate of Chinese fir accelerates significantly, with biomass increases primarily concentrated in the stem and branch components. The biomass growth during this stage is especially pronounced, laying a crucial foundation for subsequent carbon storage. Accurately assessing the aboveground biomass of Chinese fir at different developmental stages facilitates more precise calculations of the forest’s carbon sequestration capacity but also provides scientific evidence for forest management and ecological restoration. Analyzing the biomass structure of various branches of Chinese fir at different growth stages allows for a deeper understanding of the role of aboveground biomass in revealing the mechanisms by which plants adapt to environmental changes (Peng et al., 2017; Sun et al., 2022). Therefore, in-depth research into the biomass allocation and growth patterns of Chinese fir not only enhances the forest’s carbon storage capacity but also promotes the development of sustainable forestry, supporting the achievement of both ecological and economic benefits.
Forest biomass can be divided into aboveground and belowground biomass, with the aboveground portion further subdivided into four components: trunk, bark, branches, and leaves. Previous studies have often modeled these components independently to achieve the required precision (Jingyang et al., 2016; Lun et al., 2018). However, in forest biomass estimation, data are frequently subject to various errors, leading to discrepancies where the sum of the aboveground biomass components does not equal the total aboveground biomass. If traditional models fail to address these errors adequately, the resulting estimates may be biased, and their statistical power may diminish. In contrast, systems of simultaneous equations can effectively utilize the information within the data, optimizing statistical efficiency to address this issue. To ensure that the predicted sum of biomass components equals the total aboveground biomass (Wang et al., 2017) and to explore the growth conditions of Chinese fir forests at different developmental stages, this study employs nonlinear models, dummy variables, and systems of simultaneous equations. These models link the total aboveground biomass of Chinese fir and its components (including bark, stem, branches, and leaves) with predictive factors derived from LiDAR point cloud data, such as LiDAR tree height and LiDAR crown diameter. For each component, an equation is established, and these equations are combined into a system of simultaneous equations. This approach ensures the integration and consistency of all biomass components, providing a method for a more accurate and comprehensive assessment of forest biomass (Parresol, 1999).
This study focuses on utilizing UAV LiDAR data to obtain high-precision measured data and ground survey data of Chinese fir forests in Guangdong and establishes a systematic and robust modeling system that includes nonlinear models, dummy variable models, and systems of simultaneous equations. The aim is to accurately estimate the aboveground biomass of Chinese fir at different growth stages (including stem wood, bark, branches, and leaves), thereby improving the accuracy of forest biomass estimation and ensuring the structural consistency of biomass components. Unlike traditional biomass estimation methods that rely on destructive sampling and empirical models, this study leverages cutting-edge UAV LiDAR technology to enhance efficiency, accuracy, and scalability in biomass assessment. By integrating advanced modeling techniques with remote sensing data, our research not only provides a scientific basis for precise forest carbon estimation but also supports large-scale forest monitoring and sustainable forest management. The findings of this study are expected to contribute to climate change mitigation efforts by improving the accuracy of carbon stock assessments and providing essential data for carbon trading policies. The primary objectives of this study are: 1) to accurately estimate the biomass of individual tree components in Chinese fir forests in Guangdong using UAV LiDAR data; 2) to construct biomass models for Chinese fir at different growth stages and explore the biomass allocation characteristics across different growth cycles; 3) to ensure the consistency between the biomass of different components by constructing a compatibility model, providing a reliable basis for forest carbon assessment and sustainable management.
2 Materials and methods
2.1 Methodological framework
Figure 1 presents the flowchart of the methodology used in this study. We developed a compatibility biomass model for the aboveground branches of Chinese Fir (Cunninghamia lanceolata) using LiDAR measurement data from 133 plantation sample plots in Guangdong Province, totaling 20,836 trees. First, we used LiDAR-derived tree height and crown width as variables to establish a base model for the aboveground branch biomass and compared four basic growth functions to identify the optimal base model. Next, five age groups were introduced as dummy variables. Finally, to address the incompatibility between the biomass of individual components and total biomass in independent models, we applied the SUR method to fit the compatibility biomass model.
Figure 1
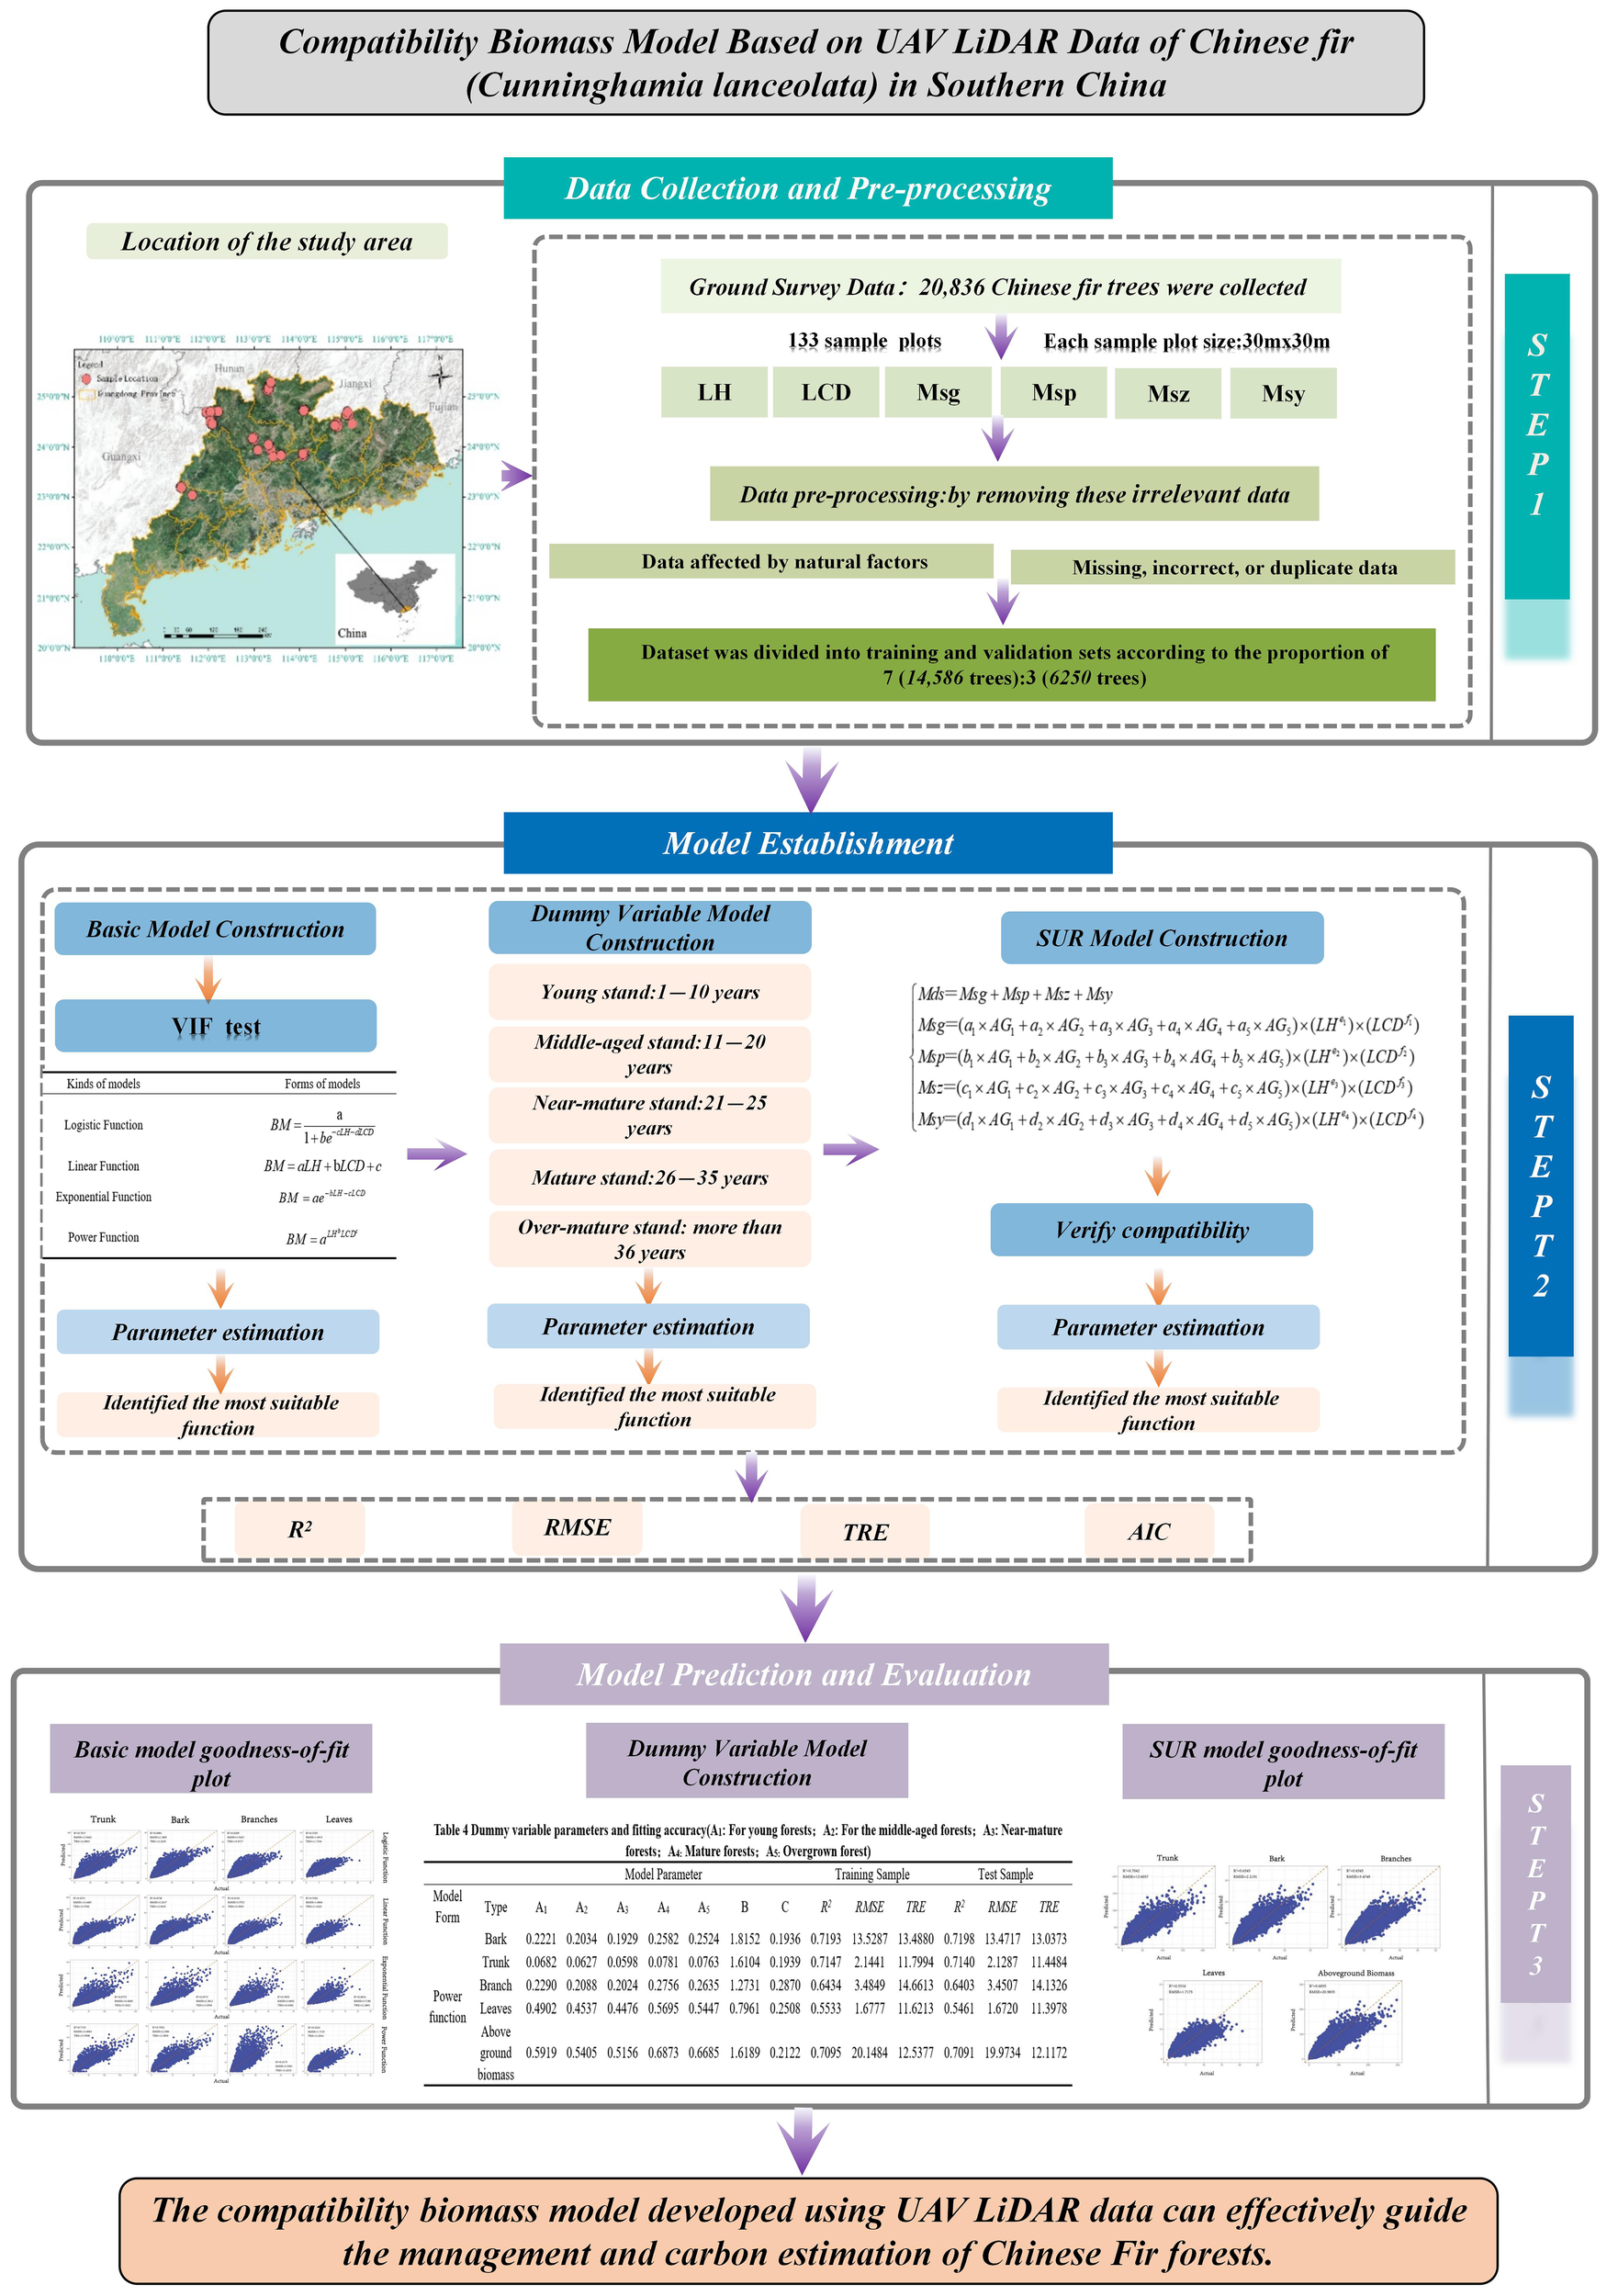
Framework.
2.2 Study area overview and sample plot distribution
Data for this study were collected from 133 sample plots located in Lechang City, Yingde City, Heping County, Lianshan County, Longshan County, Yunan County, and Shixing County in Guangdong Province, China. To ensure spatial representativeness and reliability of these sample plots, we considered factors such as forest distribution, age groups, and accessibility during the plot selection process. Specifically, we collected data covering five distinct age groups, with each group sampled in multiple counties to encompass the entire growth cycle. For example, 29 sample plots were assigned to the youngest age group (1–10 years) with 7,481 trees, while the oldest age group (>36 years) contained 24 sample plots and 1,885 trees. Guangdong Province is situated in the southernmost part of mainland China, with geographical coordinates ranging from 109°45’ to 117°20’ east and from 20°09’ to 25°31’ north. As of 2023, the province has a forested area of approximately 10.85 million hectares, accounting for 57.1% of the total land area, with forest coverage reaching about 9.6 million hectares, which corresponds to a forest coverage rate of 53.9% (Guangdong Provincial People’s Government Portal Website, n.d). This makes it one of the key ecological protection zones in southern China. The province’s topography is mainly composed of mountains, hills, plains, and water bodies, with a general trend of higher elevations in the north and lower in the south. Guangdong is characterized by a subtropical monsoon climate, with distinct seasonal variations: warm and humid in spring, hot and rainy in summer, mild and less rainy in autumn, and cool and dry in winter. There is also significant regional climatic diversity within the province. Precipitation in the region exhibits marked monsoonal characteristics, with abundant rainfall in the summer due to the influence of the southeast monsoon, and dry, low-rainfall conditions in winter under the control of cold, dry northwesterly winds (Figure 2).
Figure 2
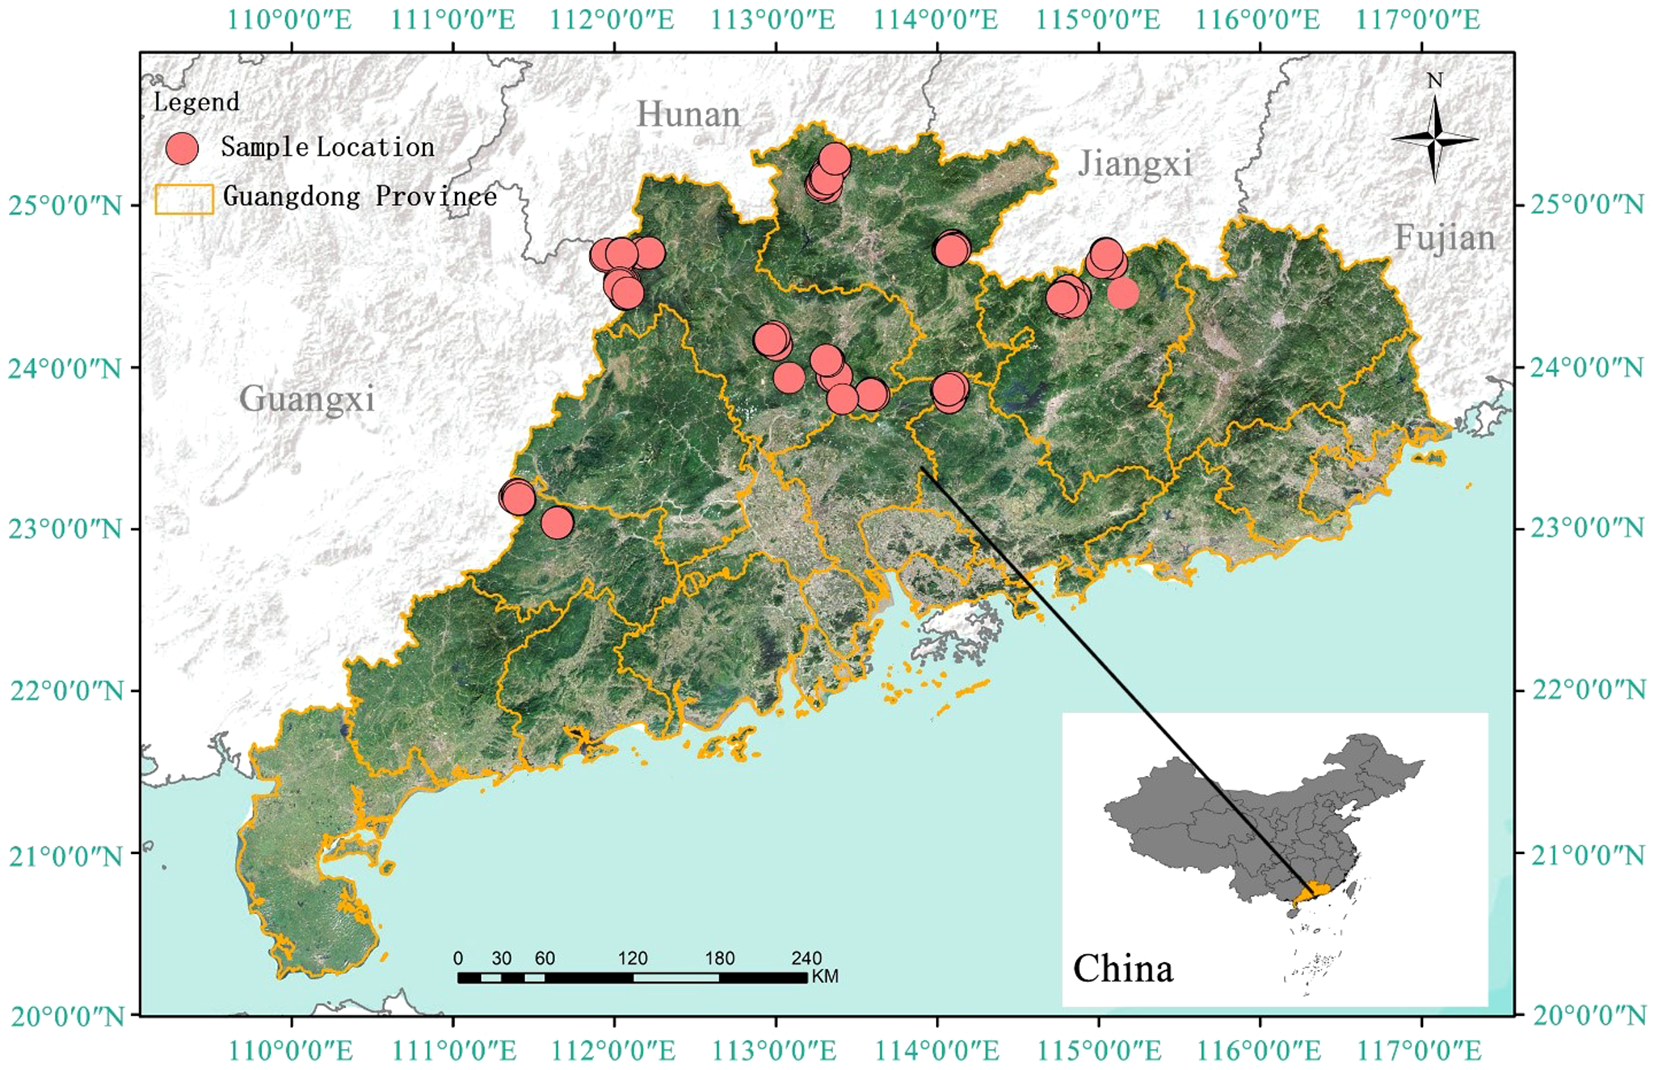
Sample point distribution map. (The locations of the sample plots are marked with red dots).
2.3 Data collection and pre-processing
2.3.1 UAV LiDAR data
The UAV LiDAR data were collected in March 2024 using a HuaCe BB4 UAV equipped with an AS-1300HL LiDAR system (Figure 3). The scanning operation utilized a Rigel VUX-1LR scanner, which operates at a wavelength of 1500 nm, with a laser pulse duration of 3.5 ns and a divergence angle of 0.5 m rad. The LiDAR’s pulse repetition frequency was set to 50 kHz, with a maximum scanning angle of 30° and a scanning frequency of 49 Hz. A crisscross flight path was employed to ensure a lateral overlap of 50% in the point cloud data. The flight altitude was maintained at 200 m, with an average flight speed of 10 m per second, resulting in an average point cloud density of 110 points per square meter over the sample plots.
Figure 3
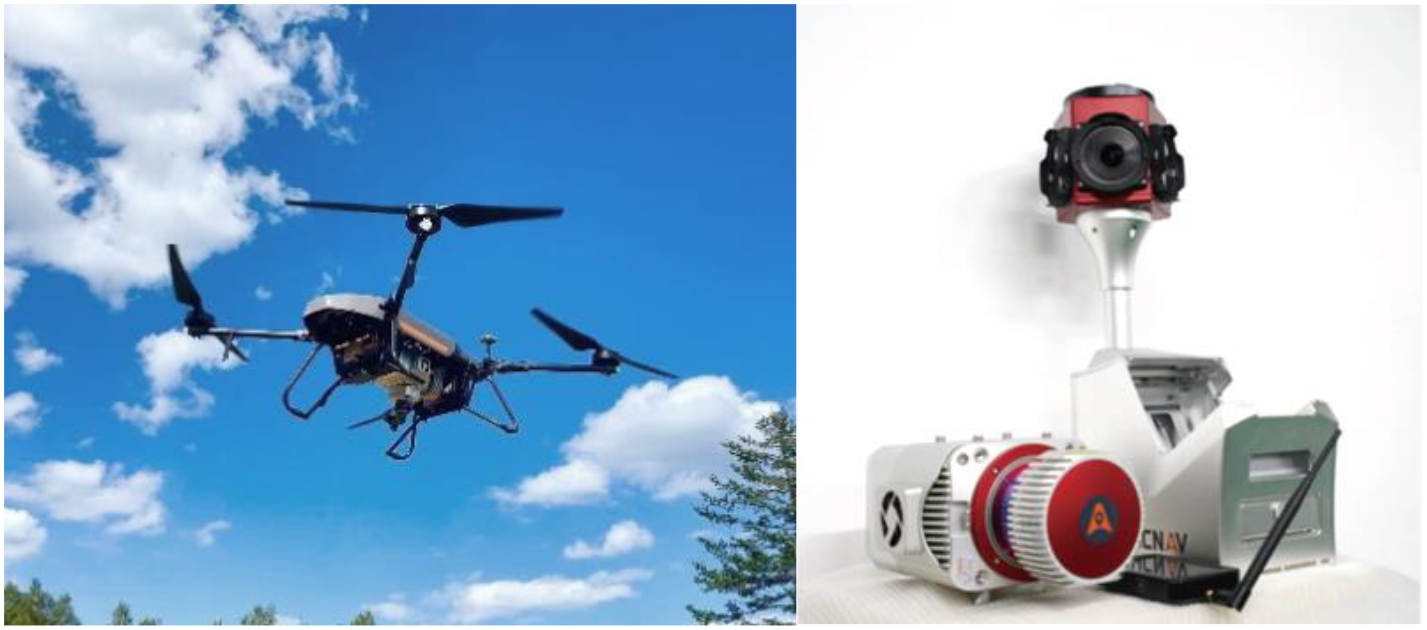
UAV Lidar system.
The raw UAV LiDAR data were first visualized and interpreted using Corepore 2.0 software, followed by further interpretation using Lidar360 software. The interpreted LiDAR point clouds were then processed using the distance-based clustering algorithm to extract the radar structural features of the trees (Li et al., 2012). The spacing threshold is a parameter used in the automatic detection of individual trees to define the minimum acceptable distance between two trees. When tree canopies are very close or partially overlap, setting an appropriate spacing threshold helps to distinguish neighboring trees, preventing them from being mistakenly identified as a single tree. The minimum spacing rule is applied during individual tree segmentation in areas with high tree density, ensuring that each tree is independently identified. This is typically achieved by establishing a “buffer zone” around the detection point of each tree, within which no new trees are recognized (as illustrated in Figure 4). This method enabled the segmentation of individual trees within the sample plots and the calculation of key parameters such as tree height, crown width, and diameter at breast height (DBH), which are critical for estimating the biomass of individual tree components.
Figure 4
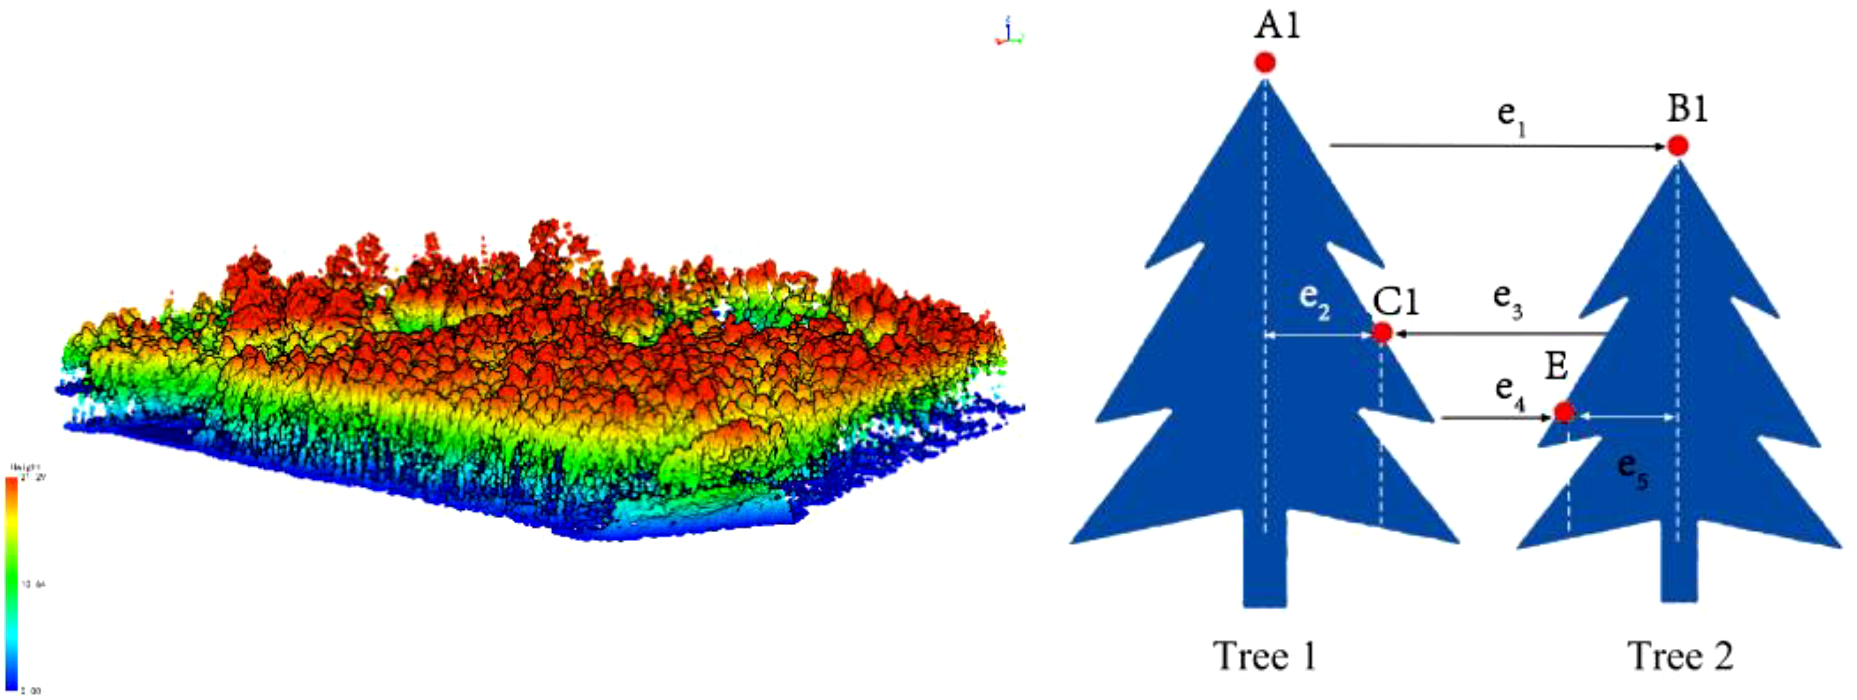
Radar-based individual tree segmentation processing.
2.3.2 Ground survey data
The field survey data for Chinese fir trees were collected simultaneously with the UAV LiDAR data in March 2024(Table 1). We conducted ground data surveys across 133 sample plots, each measuring 30 m × 30 m. The data were cleaned by removing deadfall, dead branches, undergrowth, litter, missing or incorrect measurements, and duplicate entries, resulting in a total of 20,836 Chinese fir (Cunninghamia lanceolata) trees. The survey information included species identification, DBH, tree height, height to the first branch, crown width, and growth condition. The data collection and processing strictly followed standardized field protocols to ensure accuracy as much as possible. However, given the complexity of field measurements and inherent limitations of the methods used, some natural measurement uncertainties may exist, which might be slightly amplified when handling large datasets.
Table 1
| Training sample | Test sample | ||||||||
|---|---|---|---|---|---|---|---|---|---|
| AGE | Branch | Max | Min | Average | Standard deviation | Max | Min | Average | Standard deviation |
| AG1 | Bark | 13.1381 | 0.1096 | 3.3632 | 2.1627 | 13.6484 | 0.1078 | 3.3480 | 2.1404 |
| Trunk | 82.1074 | 0.4052 | 17.8427 | 12.5648 | 82.2535 | 0.3908 | 17.7663 | 12.3915 | |
| Branch | 24.0875 | 0.1859 | 5.4190 | 3.5186 | 20.7011 | 0.1999 | 5.3753 | 3.5153 | |
| Leaves | 12.6573 | 0.2178 | 3.6598 | 1.8578 | 11.6341 | 0.3181 | 3.6286 | 1.8696 | |
| Above ground biomass | 121.232 | 1.032 | 30.285 | 19.8221 | 126.284 | 1.0660 | 30.118 | 19.63353 | |
| AG2 | Bark | 27.7597 | 0.1905 | 4.2946 | 2.6693 | 18.4729 | 0.1616 | 4.2767 | 2.7001 |
| Trunk | 114.5734 | 0.2389 | 23.7724 | 16.2536 | 117.290 | 0.664 | 23.706 | 16.5119 | |
| Branch | 27.7597 | 0.1905 | 6.3721 | 4.0636 | 26.7768 | 0.1962 | 6.3189 | 4.0678 | |
| Leaves | 13.1418 | 0.3621 | 3.9614 | 1.9822 | 12.3967 | 0.2959 | 3.9307 | 1.9809 | |
| Above ground biomass | 167.7102 | 0.9027 | 38.4005 | 24.5177 | 172.002 | 1.3180 | 38.2320 | 24.7832 | |
| AG3 | Bark | 18.203 | 0.2100 | 5.6330 | 3.1345 | 17.3344 | 0.2384 | 5.6755 | 3.2327 |
| Trunk | 119.9051 | 0.8125 | 5.6330 | 19.4172 | 119.5493 | 32.4140 | 32.4140 | 20.2089 | |
| Branch | 30.9941 | 0.3836 | 8.1419 | 4.7029 | 28.8945 | 0.3809 | 8.1836 | 4.7461 | |
| Leaves | 13.8340 | 0.5250 | 4.6920 | 2.1299 | 13.3614 | 0.5477 | 4.7083 | 2.1188 | |
| Above ground biomass | 172.8820 | 1.9910 | 50.5760 | 28.9169 | 170.803 | 2.126 | 50.9810 | 29.8144 | |
| AG4 | Bark | 30.2370 | 0.3516 | 9.6597 | 5.0867 | 29.1160 | 0.5170 | 9.6740 | 5.1307 |
| Trunk | 202.511 | 1.415 | 58.025 | 33.8275 | 202.1930 | 2.2330 | 9.6740 | 34.2114 | |
| Branch | 43.9100 | 0.6700 | 13.9670 | 7.3899 | 41.6285 | 0.5713 | 13.9616 | 7.4742 | |
| Leaves | 20.7530 | 0.8990 | 6.9680 | 2.8834 | 17.8720 | 0.6087 | 6.9545 | 2.9362 | |
| Above ground biomass | 288.847 | 3.3350 | 88.6200 | 48.1882 | 276.6640 | 4.1920 | 88.7440 | 48.6847 | |
| AG5 | Bark | 28.2904 | 0.3132 | 8.9868 | 5.1823 | 32.9320 | 0.2010 | 8.9860 | 5.1799 |
| Trunk | 196.453 | 1.1780 | 54.831 | 34.1049 | 219.7082 | 0.7777 | 53.8313 | 34.1237 | |
| Branch | 41.3550 | 0.5135 | 6.4952 | 7.3607 | 47.2662 | 0.3596 | 12.9217 | 7.4495 | |
| Leaves | 16.7751 | 0.7119 | 6.4952 | 2.8506 | 17.1669 | 0.4503 | 6.5330 | 2.9408 | |
| Above ground biomass | 279.8830 | 2.6970 | 82.1660 | 48.7637 | 316.848 | 1.891 | 82.272 | 48.8275 | |
Field-measured biomass statistics of Chinese-fir sample trees.
AG1, young forests, with stand ages ranging from 1 to 10 years; AG2, middle-aged forests, aged 11 to 20 years; AG3, near-mature forests, aged 21 to 25 years; AG4, mature forests, aged 26 to 35 years; AG5, over-mature forests, aged 36 years and above.
2.3.3 Tree branch biomass data
To analyze the differences in aboveground biomass across different developmental stages of Chinese fir, the sampled trees were first classified into five stages: young forest, middle-aged forest, near-mature forest, mature forest, and over-mature forest, based on ground survey data. Tree height, diameter at breast height (DBH), and other fundamental data were collected and recorded using consistent measurement methods. After classification, the biomass of stems, bark, branches, and leaves was calculated using the biomass equations specified in the Chinese National Standard “Biomass Models and Carbon Content Parameters for Major Tree Species” (GB/T 43648-2024). The total-tree biomass was then obtained by summing the biomass of each component, as shown in Table 2. Consequently, data for stem, bark, branches, leaves, and total aboveground biomass were obtained for 20,836 Chinese fir trees within the study area. These biomass data were subsequently used to model the relationship between the radar parameters derived from processed LiDAR data and the ground survey biomass measurements. Figure 5 shows the variation trends of biomass components across different age groups, facilitating a direct comparison of growth characteristics at various developmental stages (Equations 1, 2).
Table 2
| LiDAR data | Training sample | Test sample | ||||||
|---|---|---|---|---|---|---|---|---|
| Max | Min | Average | Standard deviation | Max | Min | Average | Standard deviation | |
| LiDAR tree height | 31.6296 | 2.9455 | 13.1114 | 4.0801 | 28.771 | 2.7577 | 13.1416 | 4.0674 |
| LiDAR crown diameter | 16.474 | 0.13624 | 2.3081 | 1.4899 | 12.046 | 0.1612 | 2.3401 | 1.5169 |
Summary of UAV-LiDAR-derived tree metrics.
Figure 5
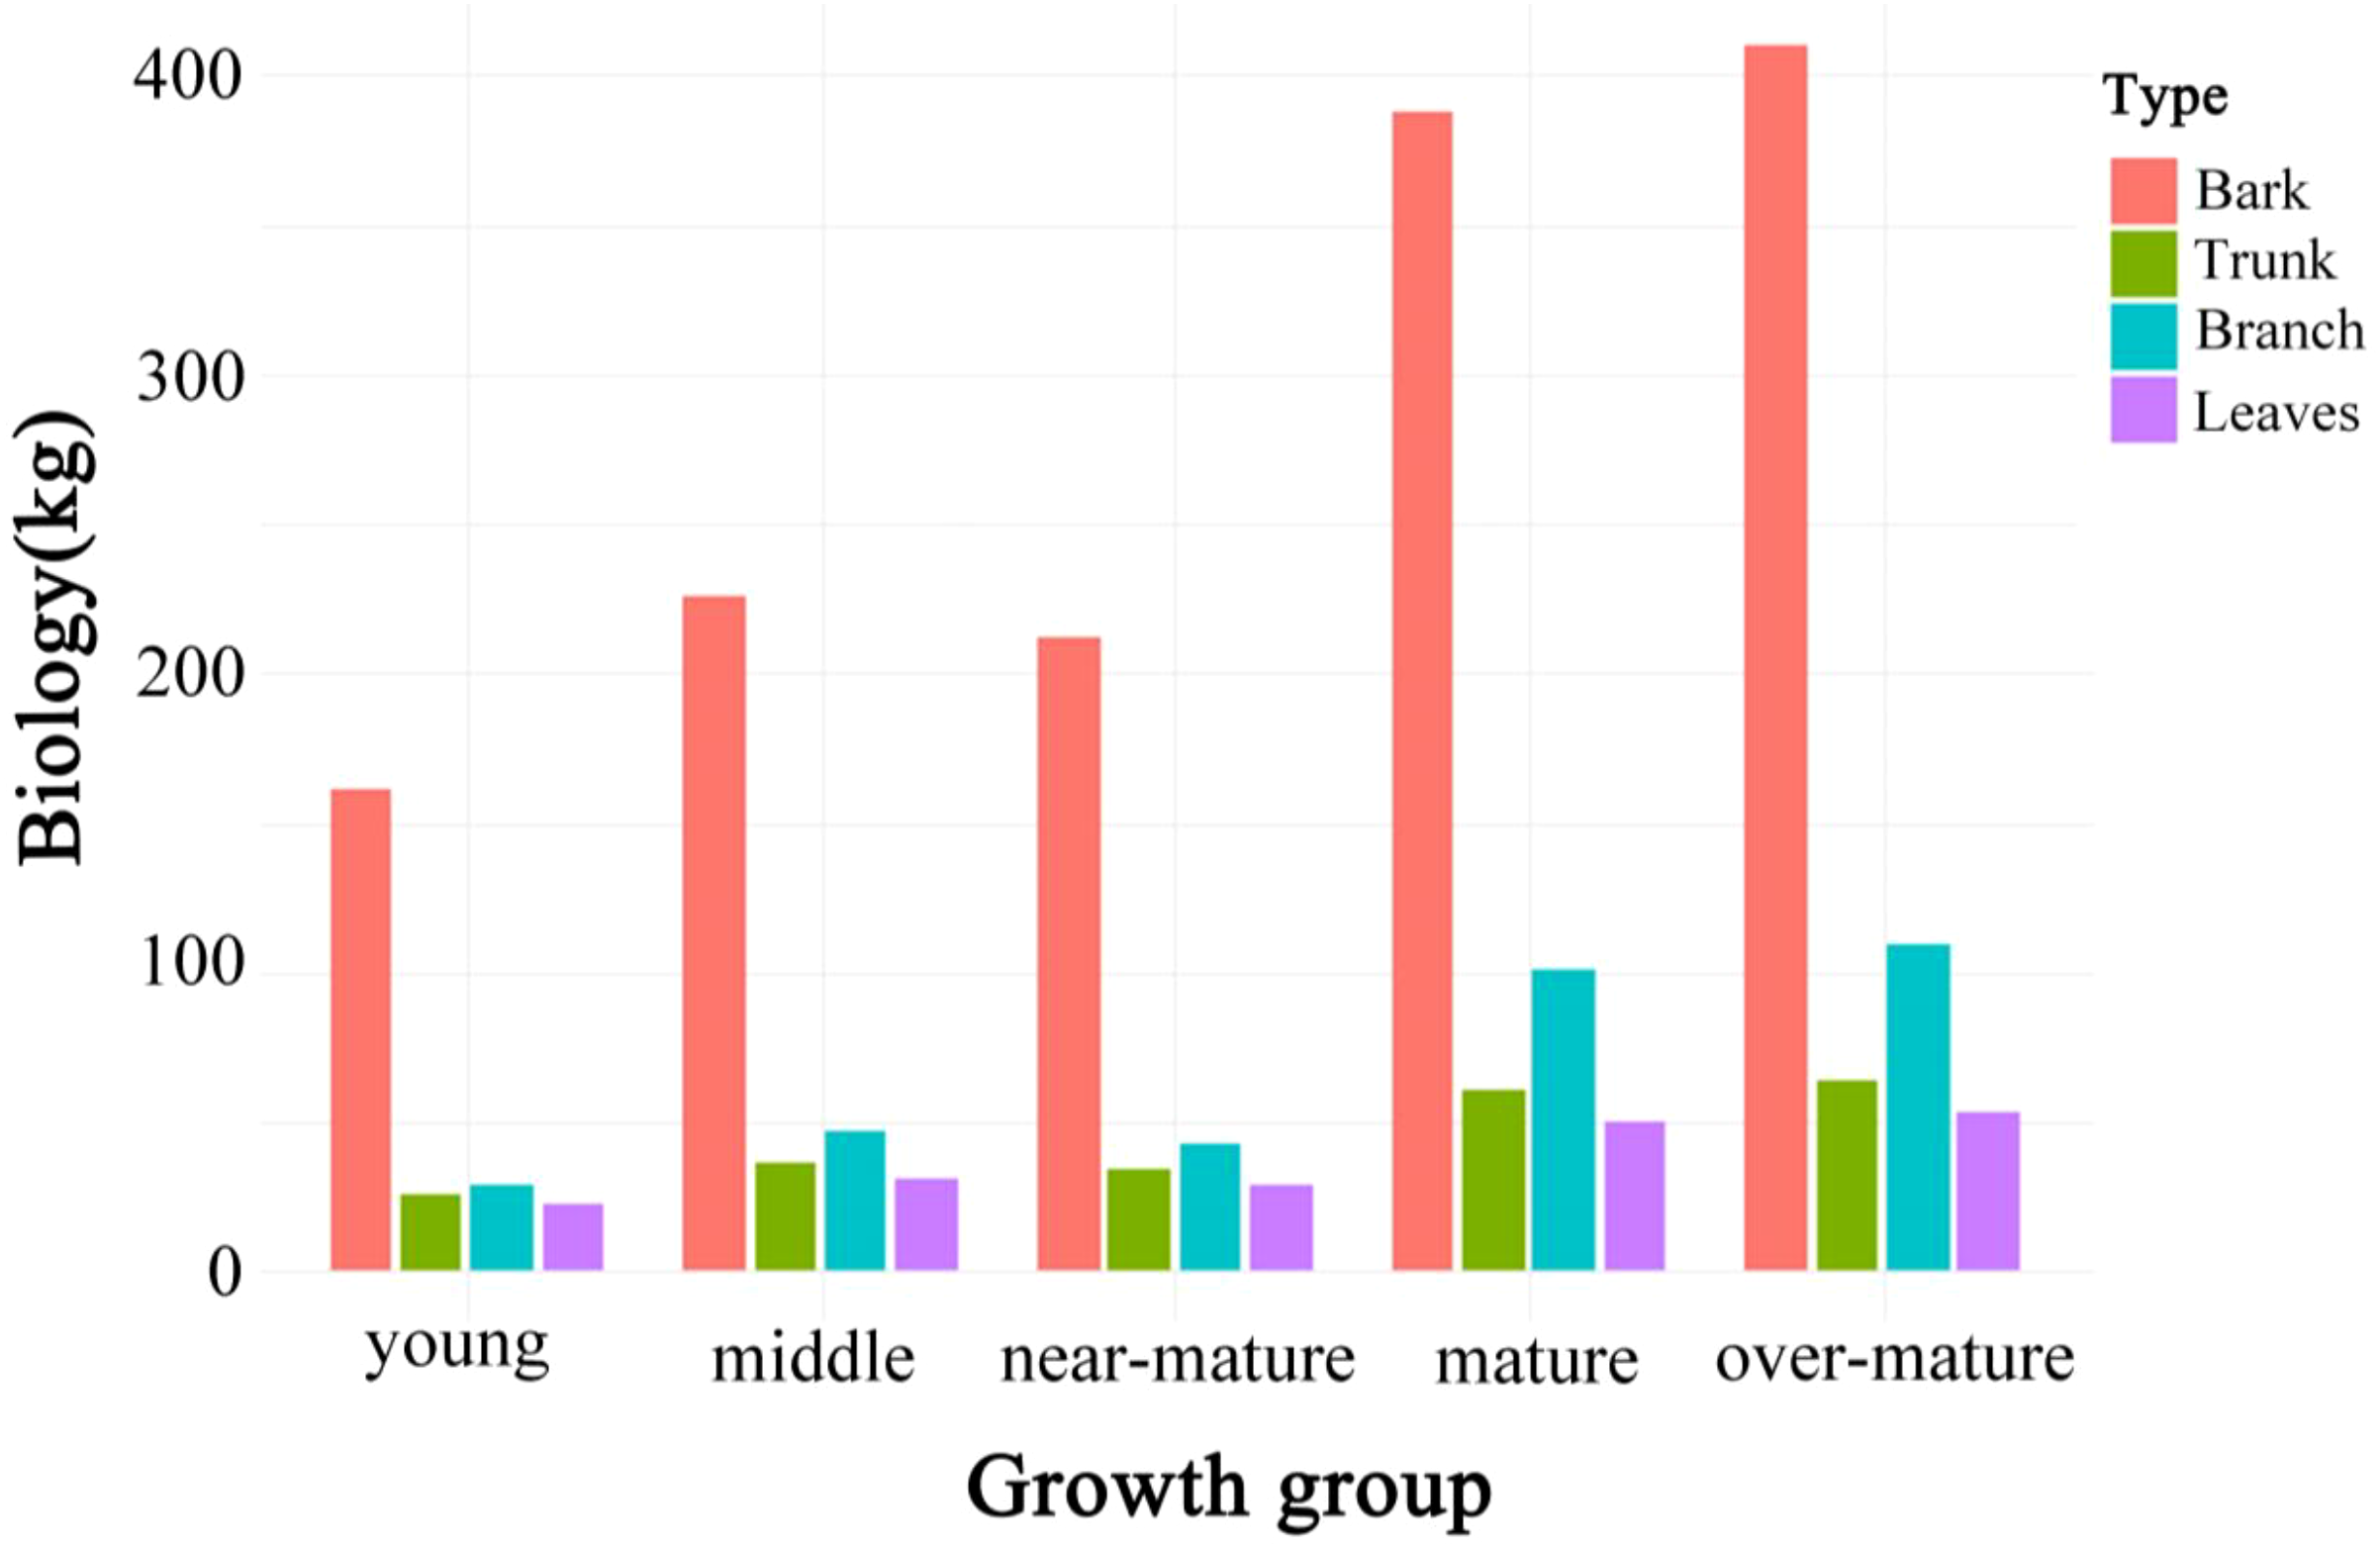
Aboveground biomass distribution across five growth stages of Chinese fir.
Where MA represents the estimated value of aboveground biomass; a0, a1, a2 are the model parameters; is the diameter at breast height (DBH); H is the tree height; M1, M2, M3, M4 represent the estimated biomass values for stem wood, bark, branches, and leaves, respectively; g1, g2, g3 represent the ratios of the biomass of bark, branches, and leaves to the biomass of stem wood, respectively.
2.4 Parametric regression model
In terms of the structure of the individual tree biomass model, the model’s structure forms the basis for model construction (Zeng and Tang, 2010a; Fu et al., 2018). Using the complete growth cycle data of individual Chinese fir trees in Guangdong, this study considered four biologically meaningful theoretical tree growth models as the base models: Logistic model, Linear model, Exponential model, and Power model (Table 3), to fit the data. The dataset was divided into training and validation sets in a 7:3 ratio, with 70% of the data used for modeling and 30% for validation. Stepwise regression was employed to select LIDAR parameter variables, and VIF collinearity tests were conducted, excluding LIDAR feature variables with VIF > 5. LIDAR tree height (LH) and LIDAR crown width (LCD) were selected as independent variables in the model to fit the biomass components.
Table 3
| Kinds of models | Forms of models |
|---|---|
| Logistic Function | |
| Linear Function | |
| Exponential Function | |
| Power Function |
Basic model formulae.
2.5 Constructing dummy variable model
Dummy Variables are important for handling categorical variables. Dummy variables convert categorical variables into binary variables, allowing them to be incorporated into regression models for analysis. By introducing the above-mentioned optimal base parameter model into dummy variables, we can better understand the impact of different developmental stages of Chinese fir on biomass, thereby analyzing the effect of different age groups on total biomass. When processing the data, we converted the categorical variable “Age Group (AG)” into dummy variables. we introduced five age groups (AG) as categorical dummy variables: young stand (1–10 years), middle-aged stand (11–20 years), near-mature stand (21–25 years), mature stand (26–35 years), and over-mature stand (>36 years). The categorical variable “Age Group 1-5 (AG1-5)” represents five categories: young forest, middle-aged forest, near-mature forest, mature forest, and over-mature forest.
When using the age group as a dummy variable, it is necessary to convert the age group variable into a quantitative variable, usually taking the value of 0 or 1 in regression analysis. When there are n categorical attributes for the independent variable, one category is typically set as a reference, so the number of dummy variables is n-1. The formula is as follows (Equations 3, 4):
where represents the dummy variables reflecting different age groups (= 1, 2,…, 5); represents the parameters for different forest types; LH represents the Lidar tree height; LCD represents the LiDAR crown width.
2.6 Compatibility models
In forestry research, accurately estimating the biomass of individual tree components is crucial, especially when assessing biomass distribution and ecological functions within forest ecosystems. When both independent and dependent variables contain errors, traditional modeling methods are no longer suitable for model fitting (Wang et al., 2018b). To ensure that the predicted value of individual tree biomass equals the sum of the predicted values of its components, we must consider the additivity or compatibility among the component biomass models (Affleck and Diéguez-Aranda, 2016). Ensuring that the sum of the components is compatible with the total is of great importance for constructing biomass model systems. Additionally, additive models can account for the intrinsic relationships between components and the total, making it necessary to establish a system of simultaneous equations to achieve model compatibility.
In this study, we employed the seemingly unrelated regression (SUR) model to independently model the biomass components of aboveground biomass for Chinese fir and to jointly estimate the model parameters. This approach ensures that the stem, bark, branches, and leaves of individual trees in Chinese fir forests adhere to the principle of compatibility, thereby resolving issues of model incompatibility (Giri et al., 2019). This method not only ensures compatibility among the biomass components but also yields more optimized parameter estimates, enhancing the stability of the model (Fu et al., 2014) (Equations 5).
where AG1-5 represents the different age group categories; a, b, c, d, e, and f are the model parameters; LH represents the Lidar tree height; LCD represents LiDAR crown width. Msg represents the Measured trunk biomass; Msp represents the Measured bark biomass; Msz represents the Measured branch biomass; Msy represents the Measured leaf biomass; Mds represents the Measured total aboveground biomass.
2.7 Model evaluation metrics
The fitting results were evaluated using four metrics: the coefficient of determination (R²), Root Mean Squared Error (RMSE), Total Relative Error (TRE), and Akaike Information Criterion (AIC). A larger R² indicates a higher fitting accuracy of the model, a smaller RMSE suggests higher precision in the model’s predictions, a smaller TRE indicates better predictive performance, and a smaller AIC represents a better model fit. The expressions are as follows (Equations 6–9):
where is the observed value of the dependent variable; is the predicted value of the dependent variable by the model; is the mean of the observed values; n is the number of observations; k is the number of parameters in the model. L is the maximum likelihood of the model.
3 Results and analysis
3.1 Optimal model selection
Based on the goodness-of-fit plot results of the 4 basic models (Figure 6), the Power model was determined to be the optimal model through comprehensive consideration of AIC, R², RMSE, and TRE. Since the Logistic model and the Power Function model had similar validation parameters, we chose the Power Function model as the optimal model due to its fewer parameters.
Figure 6
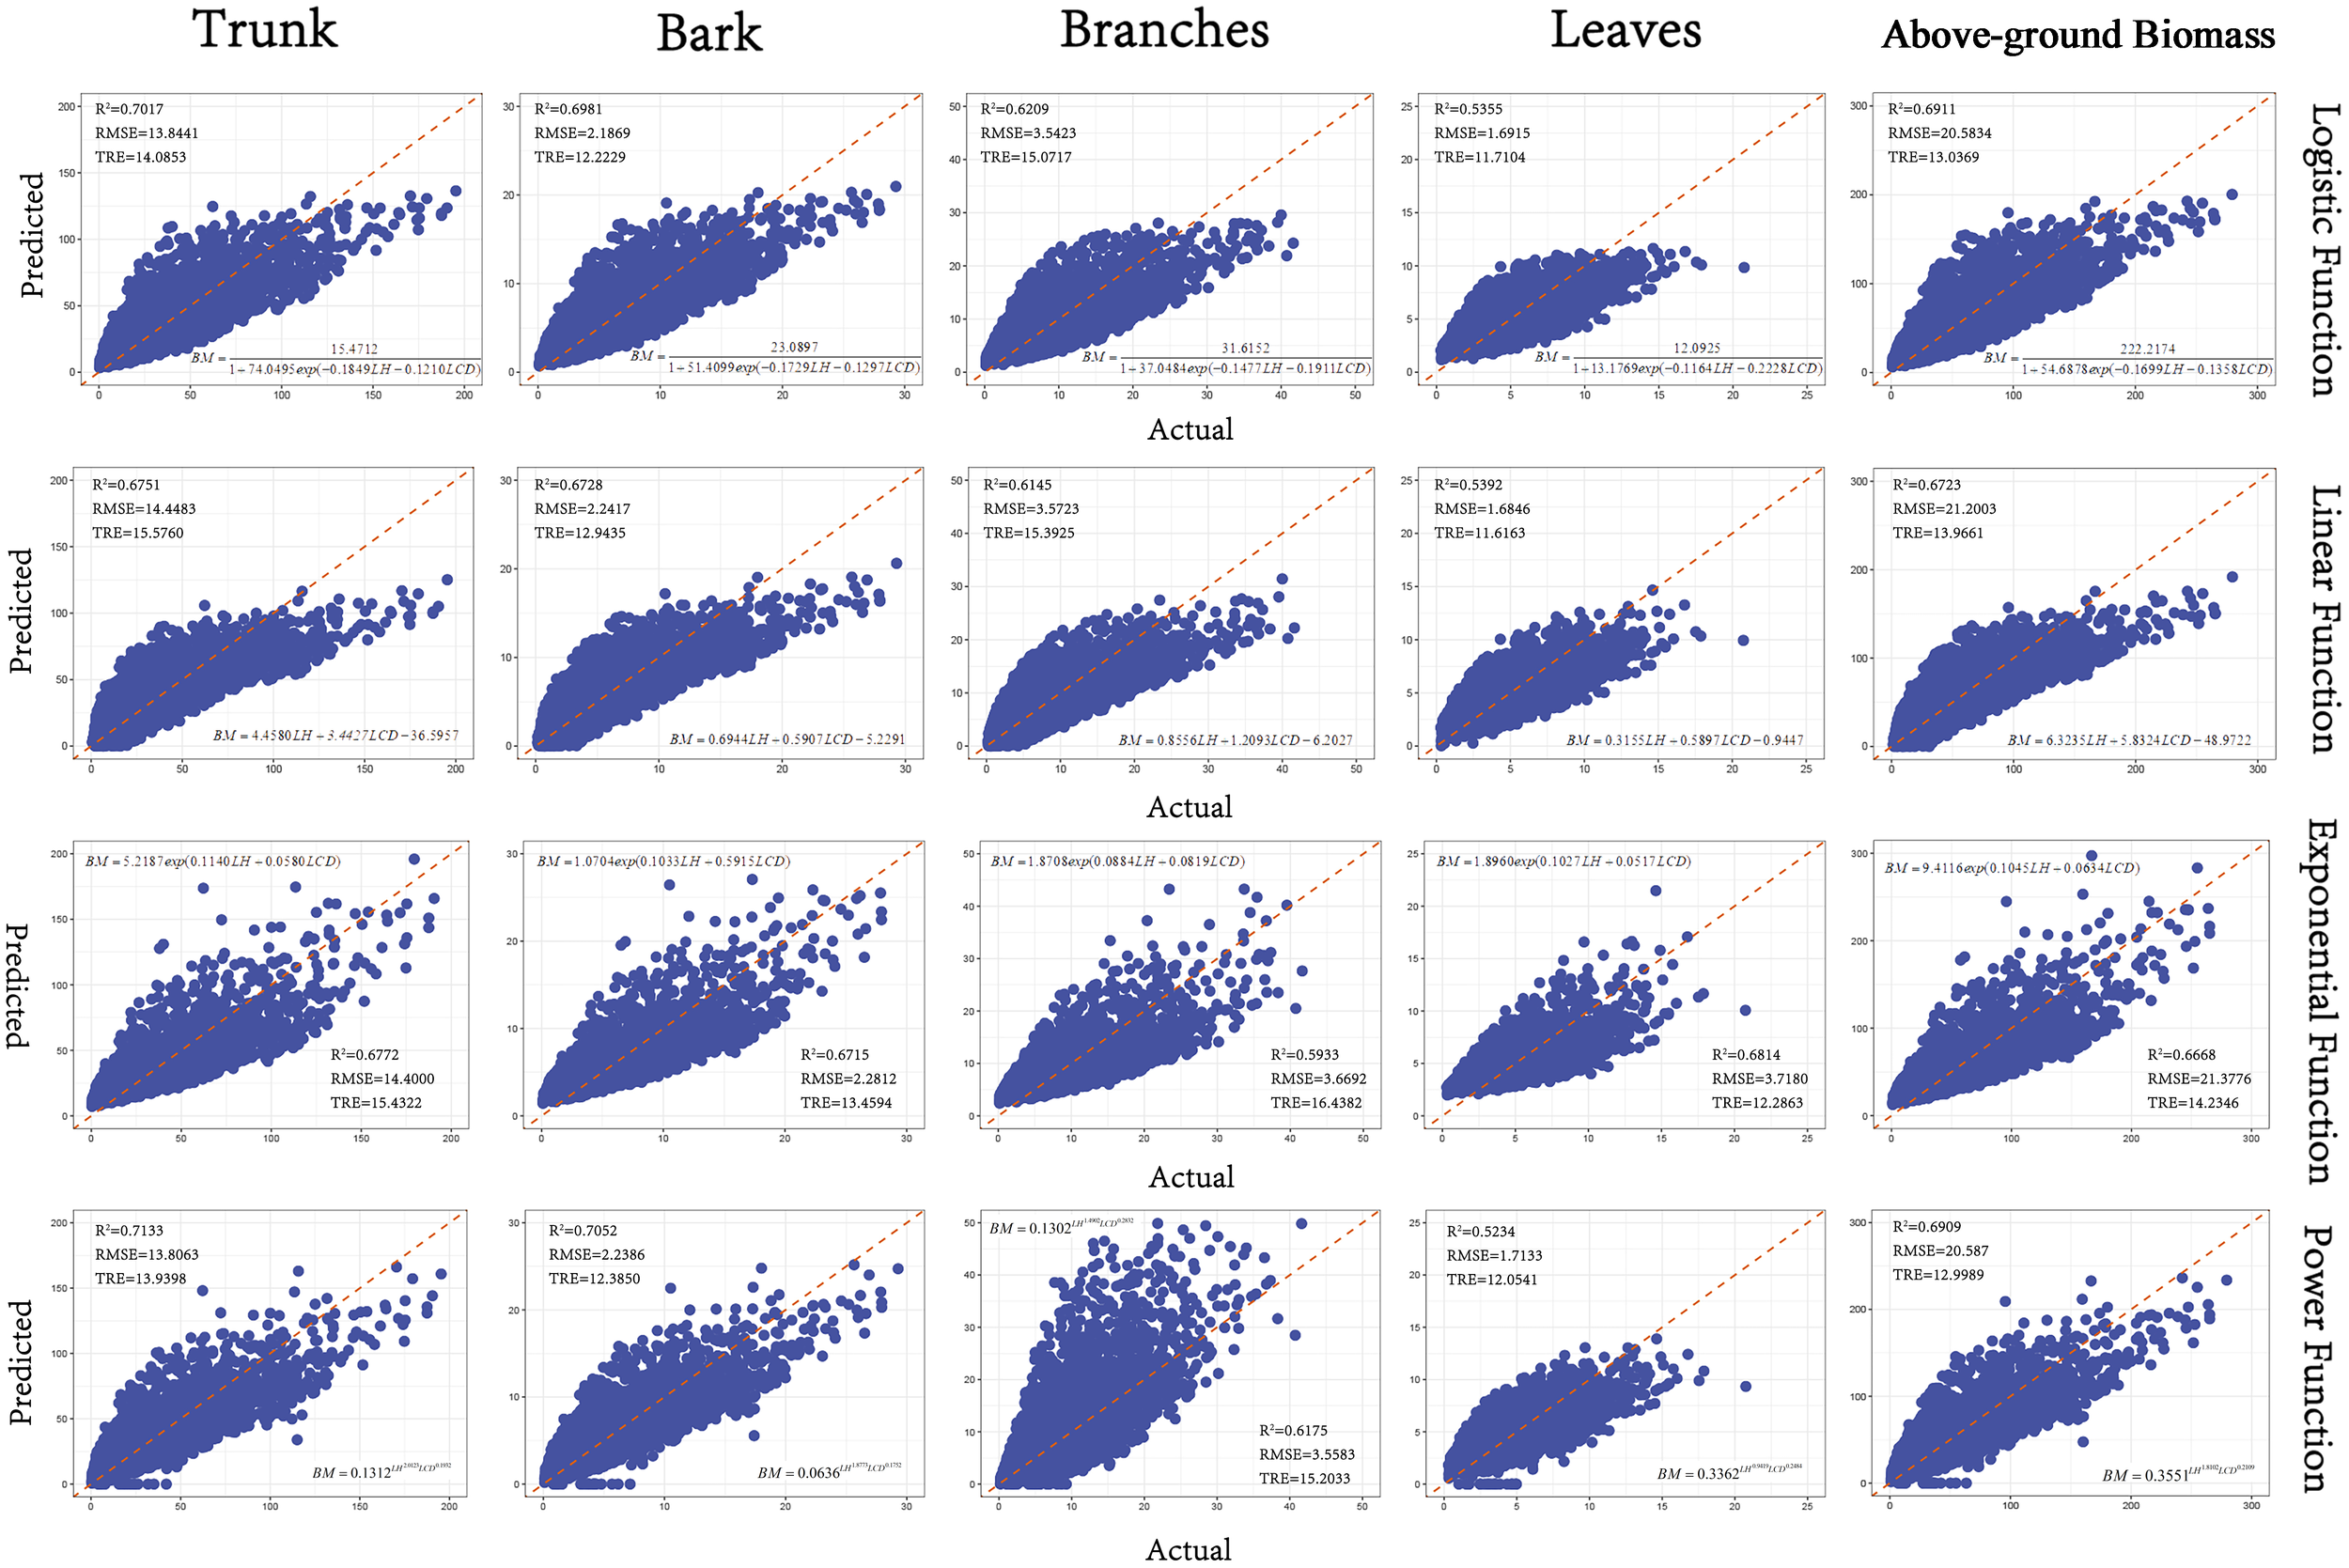
Goodness-of-fit plots of the base models.(The x-axis represents the actual values, and the y-axis represents the predicted values. The R² is the coefficient of determination, RMSE is Root Mean Squared Error, and TRE is Total Relative Error).
The Power Function Model exhibited the highest R² values, particularly for stem and bark biomass, effectively capturing allometric growth relationships but lacking adaptability to different growth stages. In terms of the fitting performance of the aboveground biomass component models, the R² values for all components except leaves and branches were above 0.7, with the fitting accuracy order being stem > bark > branches > leaves (Table 4).
Table 4
| Model form | Type | Model parameter | Training sample | Test sample | |||||||||
|---|---|---|---|---|---|---|---|---|---|---|---|---|---|
| a | b | c | d | AIC | BIC | R2 | RMSE | TRE | R2 | RMSE | TRE | ||
| Logistic Function | Bark | 152.4712 | 74.0495 | 0.1849 | 0.1210 | 118516 | 118554. | 0.6968 | 14.0616 | 14.7311 | 0.7017 | 13.8441 | 14.0853 |
| SE | 3.0908 | 1.6807 | 0.0025 | 0.0036 | |||||||||
| Trunk | 23.0897 | 51.4099 | 0.1729 | 0.1297 | 64684 | 64721 | 0.6938 | 2.2213 | 12.2229 | 0.6981 | 2.1869 | 12.2229 | |
| SE | 0.4412 | 1.0812 | 0.0024 | 0.0037 | |||||||||
| Branch | 31.6152 | 37.0484 | 0.1477 | 0.1911 | 78855 | 78893 | 0.6172 | 3.6106 | 15.9090 | 0.6209 | 3.5423 | 15.0717 | |
| SE | 0.6479 | 0.8338 | 0.0024 | 0.0048 | |||||||||
| Leaves | 12.0925 | 13.1769 | 0.1164 | 0.2228 | 57095 | 57133 | 0.5346 | 1.7125 | 12.1670 | 0.5355 | 1.6915 | 11.7104 | |
| SE | 0.2203 | 0.2831 | 0.0025 | 0.0062 | |||||||||
| Above ground biomass | 222.2174 | 54.6878 | 0.1699 | 0.1358 | 130137 | 130175 | 0.6862 | 20.9428 | 13.6838 | 0.6911 | 20.5834 | 13.0369 | |
| SE | 4.5191 | 1.1468 | 0.0023 | 0.0037 | |||||||||
| Linear Function | Bark | 4.4580 | 3.4427 | -36.5957 | 119805 | 119835 | 0.6687 | 14.6976 | 16.3161 | 0.6751 | 14.4483 | 15.5760 | |
| SE | 0.0326 | 0.0891 | 0.4069 | ||||||||||
| Trunk | 0.6944 | 0.5907 | -5.2291 | 65453 | 65483 | 0.6772 | 2.2808 | 13.5626 | 0.6728 | 2.2417 | 12.9435 | ||
| SE | 0.0051 | 0.0138 | 0.0633 | ||||||||||
| Branch | 0.8556 | 1.2093 | -6.2027 | 79155 | 79185 | 0.6092 | 3.6481 | 16.2959 | 0.6145 | 3.5723 | 15.3925 | ||
| SE | 0.0081 | 0.0221 | 0.1011 | ||||||||||
| Leaves | 0.3155 | 0.5897 | -0.9447 | 57008 | 57038 | 0.5373 | 1.7075 | 12.0880 | 0.5392 | 1.6846 | 11.6163 | ||
| SE | 0.0038 | 0.0104 | 0.0476 | ||||||||||
| Above ground biomass | 6.3235 | 5.8324 | -48.9722 | 131043 | 131073 | 0.6660 | 21.6046 | 14.6914 | 0.6723 | 21.2003 | 13.9661 | ||
| SE | 0.0479 | 0.1311 | 0.5986 | ||||||||||
| Exponential Function | Bark | 5.2187 | -0.1140 | -0.0580 | 119897 | 119927 | 0.6666 | 14.7439 | 16.4360 | 0.6772 | 14.4000 | 15.4322 | |
| SE | 0.0672 | 0.0007 | 0.0016 | ||||||||||
| Trunk | 1.0704 | -0.1033 | -0.5915 | 66102 | 66133 | 0.6624 | 2.3322 | 14.2688 | 0.6715 | 2.2812 | 13.4594 | ||
| SE | 0.0126 | 0.0007 | 0.0016 | ||||||||||
| Branch | 1.8708 | -0.0884 | -0.0819 | 80057 | 80087 | 0.5843 | 3.7627 | 17.5174 | 0.5933 | 3.6692 | 16.4382 | ||
| SE | 0.0241 | 0.0008 | 0.0017 | ||||||||||
| Leaves | 1.8960 | -0.1027 | -0.0517 | 80235 | 80266 | 0.6736 | 3.7858 | 12.9121 | 0.6814 | 3.7180 | 12.2863 | ||
| SE | 0.0178 | 0.0007 | 0.0016 | ||||||||||
| Above ground biomass | 9.4116 | -0.1045 | -0.0634 | 131449 | 131479 | 0.6566 | 21.9076 | 15.1694 | 0.6668 | 21.3776 | 14.2346 | ||
| SE | 0.1147 | 0.0008 | 0.0016 | ||||||||||
| Power Function | Bark | 0.1312 | 2.0123 | 0.1932 | 118537 | 118567 | 0.6963 | 14.0724 | 14.7571 | 0.7133 | 13.8063 | 13.9398 | |
| SE | 0.0051 | 0.0136 | 0.0051 | ||||||||||
| Trunk | 0.0636 | 1.8773 | 0.1752 | 83695 | 83726 | 0.6994 | 2.2056 | 13.0076 | 0.7052 | 2.2386 | 12.3850 | ||
| SE | 0.0015 | 0.0124 | 0.0047 | ||||||||||
| Branch | 0.1302 | 1.4902 | 0.2832 | 78998 | 79028 | 0.6134 | 3.6286 | 16.0935 | 0.6175 | 3.5583 | 15.2033 | ||
| SE | 0.0003 | 0.0191 | 0.0066 | ||||||||||
| Leaves | 0.3362 | 0.9419 | 0.2484 | 57404 | 57434 | 0.5246 | 1.7308 | 12.4618 | 0.5234 | 1.7133 | 12.0541 | ||
| SE | 0.0102 | 0.0112 | 0.0049 | ||||||||||
| Above ground biomass | 0.3551 | 1.8102 | 0.2109 | 130208 | 130238 | 0.6846 | 20.9950 | 13.7616 | 0.6909 | 20.5870 | 12.9989 | ||
| SE | 0.0129 | 0.0129 | 0.0049 | ||||||||||
Detailed parameters and fitting accuracy of the 4 types of base models.
a,b,c,d, the model parameters; AIC, Akaike Information Criterion; R2, Coeffcient Of Determination; RMSE, Root Mean Square Error; TRE, Total Relative Error; SE, Standard Error.
Table 4 includes standard errors (SE) for key parameters. Lower SE values typically indicate more stable parameter estimates, whereas higher SE values suggest potential variability or limitations in data coverage for those biomass components. These SE values help illustrate how reliably each model parameter can be estimated from the available data, thereby offering insight into the overall robustness of each model’s predictions (Equations 10–14).
where Msg represents the stem biomass; Msz represents the branch biomass; Msy represents the leaf biomass; LH stands for radar tree height; and LCD stands for radar crown width.
3.2 Dummy variables model
In this study, the qualitative factors of the five age groups—young forest, middle-aged forest, near-mature forest, mature forest, and over-mature forest—were converted into quantitative factors using the method of dummy variables. These were then introduced into the optimal models for the biomass components of Chinese fir, including stem, bark, branches, and leaves. By analyzing Chinese fir at different developmental stages, we can better understand the impact of these stages on biomass.
When comparing the dummy variable model with the previously determined optimal base models, we found that the RMSE of the model decreased by an average of 3%. Among the components, the reduction was most significant for bark, which decreased by 4.2%, followed by branches with a reduction of 3.1%. The reductions for stem and leaves were the smallest, both at 2.4%. The R² increased by an average of 2.6%, with the most notable improvements in the precision of leaves and branches, which increased by 3% and 2.8%, respectively. The remaining components showed an average improvement in precision of 2% (Table 5). This highlights the importance of considering growth stages in biomass estimation, making the dummy variable model more adaptable to complex mixed forests with coexisting age groups. This indicates that incorporating dummy variables into the base models allows for a better fit of the data and can effectively model the biomass components of individual trees across different age groups.
Table 5
| Model form | Type | Model parameter | Training sample | Test sample | ||||||||||
|---|---|---|---|---|---|---|---|---|---|---|---|---|---|---|
| a1 | a2 | a3 | a4 | a5 | b | c | R2 | RMSE | TRE | R2 | RMSE | TRE | ||
| Power function | Bark | 0.2221 | 0.2034 | 0.1929 | 0.2582 | 0.2524 | 1.8152 | 0.1936 | 0.7193 | 13.5287 | 13.4880 | 0.7198 | 13.4717 | 13.0373 |
| SE | 0.0094 | 0.0097 | 0.0093 | 0.0129 | 0.0123 | 0.0178 | 0.0049 | |||||||
| Trunk | 0.0682 | 0.0627 | 0.0598 | 0.0781 | 0.0763 | 1.6104 | 0.1939 | 0.7147 | 2.1441 | 11.7994 | 0.7140 | 2.1287 | 11.4484 | |
| SE | 0.0027 | 0.0026 | 0.0027 | 0.0036 | 0.0035 | 0.0164 | 0.0046 | |||||||
| Branch | 0.2290 | 0.2088 | 0.2024 | 0.2756 | 0.2635 | 1.2731 | 0.2870 | 0.6434 | 3.4849 | 14.6613 | 0.6403 | 3.4507 | 14.1326 | |
| SE | 0.0099 | 0.0098 | 0.0101 | 0.0141 | 0.0132 | 0.0181 | 0.0055 | |||||||
| Leaves | 0.4902 | 0.4537 | 0.4476 | 0.5695 | 0.5447 | 0.7961 | 0.2508 | 0.5533 | 1.6777 | 11.6213 | 0.5461 | 1.6720 | 11.3978 | |
| SE | 0.0176 | 0.0175 | 0.0187 | 0.0246 | 0.0231 | 0.0151 | 0.0048 | |||||||
| Above ground biomass | 0.5919 | 0.5405 | 0.5156 | 0.6873 | 0.6685 | 1.6189 | 0.2122 | 0.7095 | 20.1484 | 12.5377 | 0.7091 | 19.9734 | 12.1172 | |
| SE | 0.0241 | 0.0238 | 0.0241 | 0.0329 | 0.0314 | 0.0169 | 0.0048 | |||||||
Dummy variable parameters and fitting accuracy.
a1, a2, a3, a4, a5, b ,c the model parameters; R2, Coeffcient Of Determination; RMSE, Root Mean Square Error; TRE, Total Relative Error; SE, Standard Error.
In addition, Table 5 provides the SE of key parameters for each age group, illustrating potential uncertainties in parameter estimates. Generally, smaller SE values indicate more stable parameter estimates, whereas larger SE values may suggest data limitations or higher variability in certain developmental stages. Overall, incorporating dummy variables into the base models yields a better data fit and can effectively capture the biomass components of individual trees across different age groups.
3.3 Compatible biomass modeling
The compatibility of the aboveground biomass model is achieved by jointly modeling the biomass components of the tree, including stem, bark, branches, and leaves, and simultaneously solving the model parameters. This approach addresses the inconsistency between the component biomass and total biomass that can occur with independent models. The SUR (Seemingly Unrelated Regression) method was used to fit the additive biomass model, and the results showed that the model had a good fit (Figure 7).
Figure 7
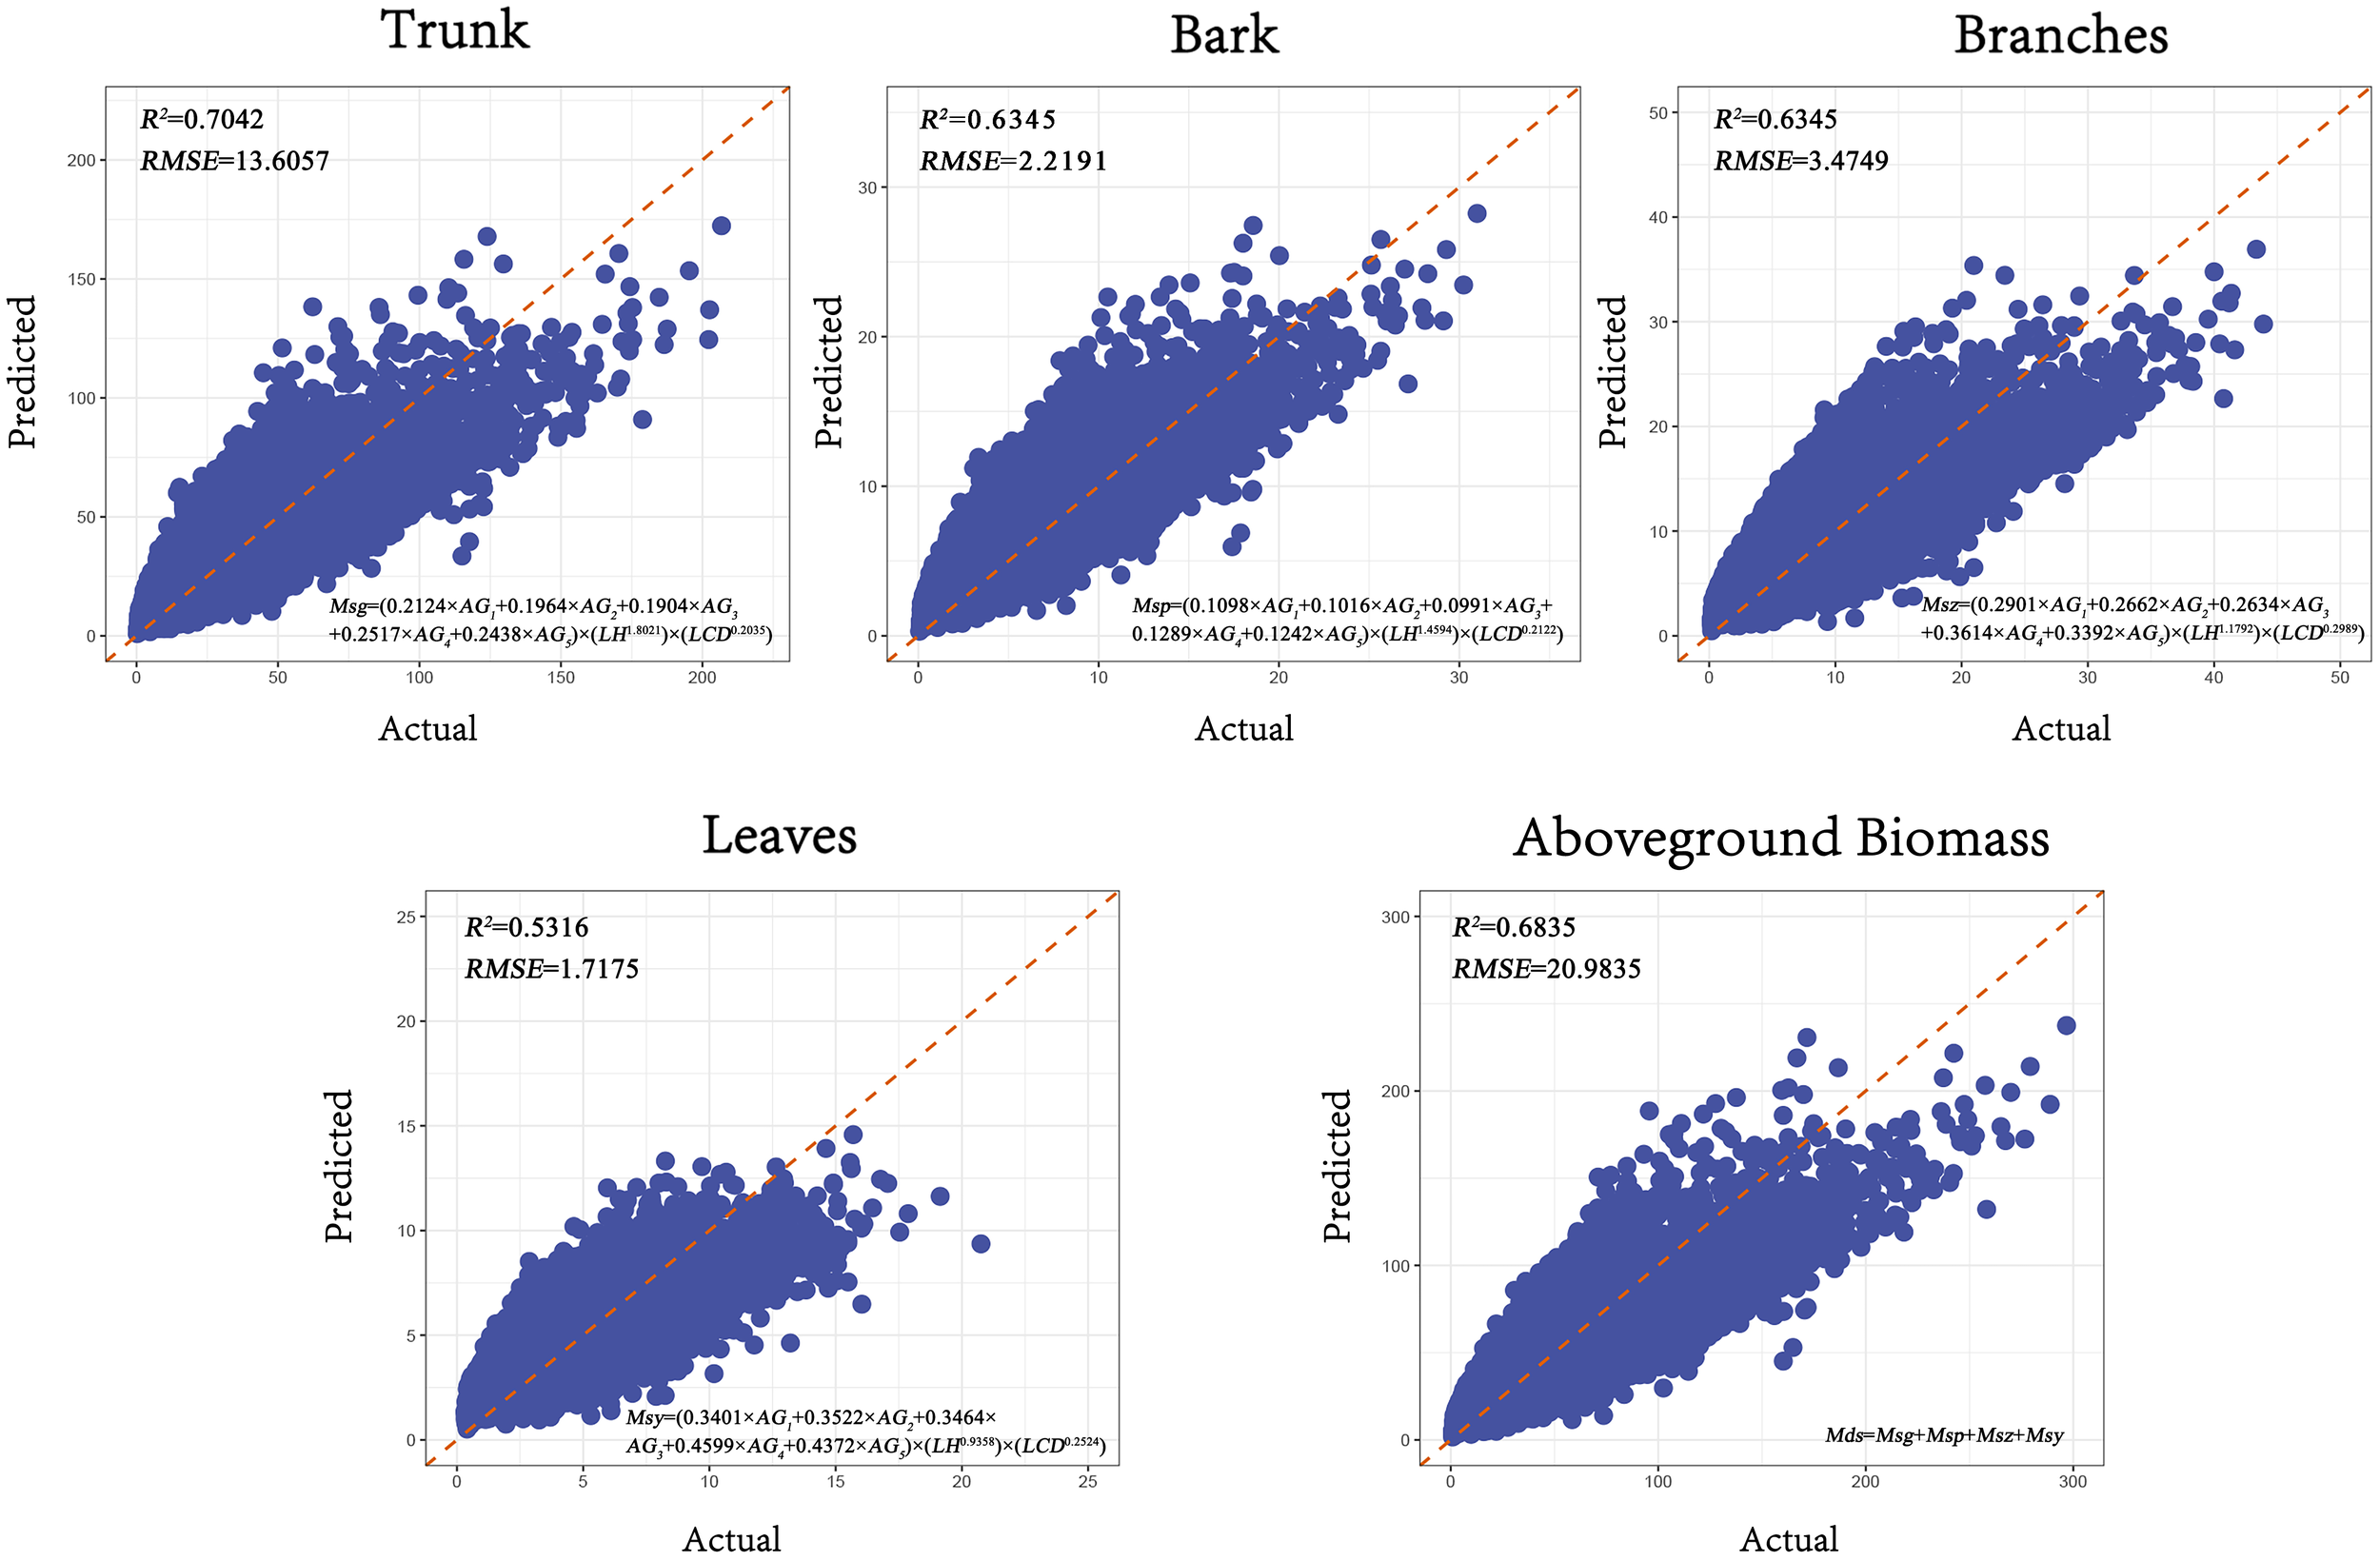
Goodness-of-fit plots of the SUR model. (The x-axis represents the actual values, and the y-axis represents the predicted values. The R² is the coefficient of determination, RMSE is Root Mean Squared Error).
As shown in Table 6, compared to the dummy variable model, the accuracy of the R² values decreased by an average of 2.5%. The Root Mean Squared Error RMSE for the biomass components—stem, bark, branches, and leaves—and the total aboveground biomass are 13.6057, 2.2191, 3.4749, 1.7175, and 20.9835, respectively. Compared to the dummy variable model, the RMSE increased by 2.6%. This reduction in predictive accuracy may be due to the constraints imposed by the simultaneous equation system to maintain consistency among biomass components. Minimizing residuals for one component might introduce slight errors in others. Additionally, the joint estimation of multiple equations may amplify estimation variance due to correlations among error terms, further affecting model performance.
Table 6
| Forms of sub-modeling | Model fitting accuracy | |
|---|---|---|
| R2 | RMSE | |
| 0.7042 | 13.6057 | |
| 0.6927 | 2.2191 | |
| 0.6345 | 3.4749 | |
| 0.5316 | 1.7175 | |
| 0.6835 | 20.9835 | |
SUR model form and fitting accuracy.
R2, Coeffcient Of Determination; RMSE, Root Mean Square Error.
4 Discussion
4.1 Main findings and patterns
Chinese fir (Cunninghamia lanceolata), as one of the main tree species in Guangdong and the entire southern region of China, plays a significant role in ecosystem services, enhancing forest carbon sequestration, climate regulation, and economic benefits (Zeng et al., 2017). With the increasing pressures of climate change and ecological environmental stress, the technological methods for acquiring and analyzing forestry data have become increasingly important. The timely and effective acquisition of biomass, carbon storage, and other forest survey data has become a focal point in forest science research (He et al., 2013; Chen et al., 2023). In this study, we utilized UAV LiDAR technology to collect data on 20,836 Chinese fir trees across 133 sample plots in Guangdong Province and calculated the biomass for each tree component. Following the initial selection of the optimal base model, we further introduced age groups as dummy variables to model the different age stages of the Chinese fir. Finally, we applied the Seemingly Unrelated Regression (SUR) model to ensure the compatibility between radar tree height (LH) and radar crown width (LCD) with the biomass of individual tree components, while also maintaining the additivity of the biomass components (Chen et al., 2023).
4.2 Model accuracy and performance
4.2.1 Applicability and limitations of base models
Establishing universal or regional relative growth equations for forest biomass has long been a goal in forestry and ecology (Brown and Lugo, 1984; Fang et al., 2001; Jenkins et al., 2003; Lehtonen et al., 2004; Guo et al., 2010). The combination of multiple models and the application of statistical models can better predict forest biomass; however, due to factors such as habitat, climate, and geography, even the same tree species may exhibit significant biomass differences in different regions (Zeng et al., 2011; Forrester et al., 2017). Moreover, the characteristics of biomass accumulation and distribution of Chinese fir vary significantly across different developmental stages, indicating that simple base models may not accurately reflect the dynamic changes in Chinese fir biomass, potentially leading to errors and uncertainties in model equations (Deng D, et al., 2023). Previous studies (Chen et al., 2016; Zhang D. et al., 2019) mainly relied on traditional ground measurement methods, which were often time-consuming, labor-intensive, and limited in data volume. In contrast, this study innovatively adopted UAV LiDAR technology, greatly improving the efficiency and quality of data collection.
4.2.2 Importance of differentiating growth stages
During the development of biomass models for Chinese fir plantations, previous studies found that incorporating age groups as dummy variables significantly improved model accuracy compared to traditional methods (e.g., Guo et al., 2016; Shen et al., 2016), consistent with our findings. However, these studies often relied on limited ground measurements, restricting coverage of the full growth cycle and spatial applicability.
This study identified significant stage-specific differences in the biomass allocation of Chinese fir across five growth stages. During the young and middle-aged stages, trees prioritize the development of photosynthetic organs to enhance competitiveness and rapidly accumulate carbon. At this stage, the biomass proportion of leaves and branches is higher, facilitating rapid canopy expansion and improving photosynthetic efficiency, which strengthens competitiveness under resource limitations (Canham et al., 1996). The higher biomass of leaves and branches also increases canopy coverage and enhances species diversity (Eriksson et al., 2006). As trees enter the mature and over-mature stages, biomass shifts toward the stem and bark (Gerrish, 1990), particularly in the mature stage, where stem biomass increases significantly, indicating that resources are primarily used to enhance structural stability and long-term carbon storage (Molina-Valero et al., 2021). Increased bark biomass improves resistance to pests and environmental stress, enhancing survival rates (Cernusak and Cheesman, 2015). Moreover, the substantial biomass in the stem strengthens mechanical support and boosts the forest’s carbon sequestration capacity (Castaño-Santamaría et al., 2013). Therefore, forest management should focus on promoting leaf and branch growth during the early stages to enhance growth vigor and ecological adaptability, while in the later stages, efforts should shift toward supporting stem and bark development to improve resilience and long-term carbon storage (Wernick and Kauppi, 2022).
4.2.3 Advantages of the dummy variable model with age groups
In contrast, our study innovatively utilized remote sensing data, enabling comprehensive coverage of all growth stages and substantially enhancing the model’s applicability and generalization across broader spatial scales. Therefore, we introduced age groups as categorical dummy variables based on the optimal base model to simulate and model Chinese fir at different developmental stages. The study demonstrated that the dummy variable model, when incorporating age group indicators, outperformed the base model in statistical metrics such as R², TRE, and RMSE, highlighting the limitations of base models in establishing large-scale biomass models for Chinese fir (Jianfeng and Jian, 2021). By introducing age groups as dummy variables into the model, it more comprehensively reflects the biomass differences across different developmental stages of Chinese fir, thereby enhancing the model’s fit. Compared to the optimal base model, the dummy variable model, after incorporating different developmental stages, showed an average R² increase of 3.2%, indicating that developmental stages have a significant impact on the accumulation and distribution of Chinese fir biomass. Therefore, adding age groups as dummy variables can improve the predictive accuracy of the biomass components, a finding that is consistent with Shen et al. (2019) (Lv and Duan, 2024). Their research also showed that incorporating age groups as dummy variables into the model significantly improved the model’s fit, with the best predictive performance observed for stem biomass, followed by branches and bark, while the predictive accuracy for leaf biomass was the lowest (Chen et al., 2023). The conclusions drawn from this study align with these findings, suggesting that the poor predictive performance for leaf biomass may be due to the relatively small proportion of leaves in the total aboveground biomass.
Even though the fitting results of the model should be kept within a reasonable expected range to ensure its effectiveness and reliability are not affected by bias (Zhang et al., 2013), in practice, the biomass of individual tree components often exhibits significant variation. This variation may stem from issues encountered during the data fitting process. In this study, through the modeling analysis of the age groups of 20,836 Chinese fir trees in Guangdong Province, we found that the ranking of aboveground biomass was: stem > bark > branches > leaves. The biomass of bark and leaves in young forests was relatively low, which suggests that in practical applications, different model types should be established according to age groups to improve the accuracy of biomass estimation results. While the dummy variable model effectively handles specific data and characteristics of different components, relying solely on the dummy variable model to process Chinese fir biomass data may still have limitations. This is because the dummy variable model, when operating independently, may not fully account for the intrinsic relationships and interactions among the different components of aboveground biomass within individual trees (Wang et al., 2008; Fu et al., 2012). Ignoring these interactions can lead to biased or inconsistent prediction results, particularly when dealing with larger datasets.
4.2.4 Compatibility and accuracy trade-off in the SUR model
The Seemingly Unrelated Regression (SUR) model integrates these independent models, ensuring that the mathematical relationships and inherent correlations between total aboveground biomass and its components are maintained, specifically the additive or compatible relationship among the different components (Fu et al., 2014). In the past, many reported biomass equations lacked additivity or compatibility, with independent equations established for each component. However, when scholars compared the fitting accuracy of additive biomass models with non-additive biomass models, they found that using non-additive methods to construct models could lead to significant discrepancies between the sum of the biomass of individual tree components and the total biomass of the tree. If these models are applied in practice, they could result in errors (Parresol, 1999; Fu et al., 2016; Dong et al., 2018). The SUR model ensures compatibility among biomass components, resolving summation inconsistencies at the cost of a slight decrease in predictive accuracy (R² decreased by 2.5%, RMSE increased by 2.6%). This decline may result from the constraints imposed by the system of simultaneous equations, which can introduce errors in other components when minimizing the residuals for one component. Additionally, the joint estimation of multiple equations in the SUR model may amplify variance due to correlations between error terms, increasing computational complexity and affecting model performance (Poudel and Temesgen, 2016; Nord-Larsen et al., 2017; Zhao et al., 2019).In contrast, the dummy variable model may not fully utilize the potential correlations between the equations (Zellner, 1962).
4.3 Limitations
Although the models developed in this study performed well for estimating Chinese fir biomass in subtropical regions, their performance may vary under different environmental conditions or for other tree species. The models were established under humid and stable subtropical climate conditions with abundant rainfall; therefore, in drier regions, trees may grow more slowly and allocate biomass differently among stems, branches, and leaves, which could reduce model accuracy. Similarly, at higher altitudes, factors such as wind exposure and shallow soil may affect tree growth patterns, requiring adjustments to the model parameters. Additionally, different tree species have distinct growth strategies. For example, broadleaf trees typically allocate more biomass to branches and leaves, while coniferous trees tend to concentrate biomass in the stem (Zhang et al., 2020). Therefore, if these models are applied to other tree species or different regions, parameter adjustments may be necessary to reflect local growth patterns better. Furthermore, due to limitations in field survey time, manpower, and resources, the sampling sites could not cover all target regions, which may affect the representativeness and applicability of the models. Also, the data used in this study were mainly collected from specific geographic and climatic conditions, which may limit the model’s generalizability to other environments or species. Future research could enhance model applicability and predictive accuracy by expanding the sampling coverage and incorporating data from different environmental conditions and tree species.
5 Conclusions
This study employed both the dummy variable model and the SUR model to develop aboveground biomass component models for Chinese fir. Introducing the age-group dummy variable increased the mean coefficient of determination (R²) from 0.69 to 0.71, an improvement of 2.6%, and reduced the total-biomass RMSE by 3%. For branch and bark biomass, R² rose by 3.1% and 4.2%, while their RMSE values fell by 3.1% and 4.2%, respectively. The SUR model ensured consistency between component and total biomass, achieving an overall R² of 0.684; its RMSE was 2.6% higher than that of the dummy-variable model but offered greater stability in managing inter-component relationships. Moreover, the integration of UAV LiDAR data with ground measurements provided robust technical support for precise biomass estimation, laying a solid foundation for long-term monitoring and sustainable management of Chinese-fir ecosystems. Moreover, the integration of UAV LiDAR technology with ground-based manual measurement data provided robust technical support for the precise estimation of Chinese fir biomass, establishing a solid foundation for the long-term monitoring and sustainable management of the Chinese fir ecosystem.
Statements
Data availability statement
The datasets presented in this article are not readily available because the data is restricted due to confidentiality issues; therefore, the dataset cannot be shared. Requests to access the datasets should be directed to Liyong Fu, fuly@ifrit.ac.cn.
Author contributions
ZW: Conceptualization, Data curation, Formal analysis, Visualization, Writing – original draft. DX: Conceptualization, Formal analysis, Methodology, Writing – review & editing. ZL: Conceptualization, Data curation, Writing – review & editing. QC: Data curation, Methodology, Writing – review & editing. QY: Conceptualization, Data curation, Writing – review & editing. JY: Resources, Software, Writing – review & editing. QW: Resources, Software, Writing – review & editing. XL: Conceptualization, Software, Writing – review & editing. YW: Conceptualization, Software, Writing – review & editing. RS: Supervision, Writing – review & editing. LF: Writing – review & editing.
Funding
The author(s) declare financial support was received for the research and/or publication of this article. This study was supported by The Fundamental Research Funds for the Central Nonprofit Research Institution of CAF (Grant No. CAFYBB2022ZB002); an airborne LiDAR-based model for estimating stand volume and aboveground biomass of major tree species in Guangdong Province (Grant No. 2021KJCX001).
Conflict of interest
The authors declare that the research was conducted in the absence of any commercial or financial relationships that could be construed as a potential conflict of interest.
Generative AI statement
The author(s) declare that no Generative AI was used in the creation of this manuscript.
Correction note
This article has been corrected with minor changes. These changes do not impact the scientific content of the article.
Publisher’s note
All claims expressed in this article are solely those of the authors and do not necessarily represent those of their affiliated organizations, or those of the publisher, the editors and the reviewers. Any product that may be evaluated in this article, or claim that may be made by its manufacturer, is not guaranteed or endorsed by the publisher.
References
1
Affleck D. L. R. Diéguez-Aranda U. (2016). Additive nonlinear biomass equations: A likelihood-based approach. For. Sci.62, 129–140. doi: 10.5849/forsci.15-126
2
Brown S. Lugo A. E. (1984). Biomass of tropical forests: A new estimate based on forest volumes. Science223, 1290–1293. doi: 10.1126/science.223.4642.1290
3
Canham C. D. Berkowitz A. R. Kelly V. R. Lovett G. M. Ollinger S. V. Schnurr J. (1996). Biomass allocation and multiple resource limitation in tree seedlings. Can. J. For. Res.26, 1521–1530. doi: 10.1139/x26-171
4
Castaño-Santamaría J. Barrio-Anta M. Álvarez-Álvarez P. (2013). Potential above ground biomass production and total tree carbon sequestration in the major forest species in NW Spain. Int. Forestry Rev.15, 273–289. doi: 10.1505/146554813807700083
5
Cernusak L. A. Cheesman A. W. (2015). The benefits of recycling: how photosynthetic bark can increase drought tolerance. New Phytol.208, 995–997. doi: 10.1111/nph.2015.208.issue-4
6
Chen Q. McRoberts R. E. Wang C. Radtke P. J. (2016). Forest aboveground biomass mapping and estimation across multiple spatial scales using model-based inference. Remote Sens. Environ.184, 350–360. doi: 10.1016/j.rse.2016.07.023
7
Chen X. Xie D. Zhang Z. Sharma R. P. Chen Q. Liu Q. et al . (2023). Compatible biomass model with measurement error using airborne liDAR data. Remote Sens.15, 3546. doi: 10.3390/rs15143546
8
Dandois J. P. Ellis E. C. (2010). Remote sensing of vegetation structure using computer vision. Remote Sens.2, 1157–1176. doi: 10.3390/rs2041157
9
Deng C. Ma F. Xu X. Zhu B. Tao J. Li Q. (2023). Allocation patterns and temporal dynamics of chinese fir biomass in Hunan Province, China. Forests14, 286. doi: 10.3390/f14020286
10
Dong L. Zhang L. Li F. (2018). Additive Biomass Equations Based on Different Dendrometric Variables for Two Dominant Species (Larix gmelini Rupr. and Betula platyphylla Suk.) in Natural Forests in the Eastern Daxing’an Mountains, Northeast China. Forests9, 261. doi: 10.3390/f9050261
11
Eriksson B. K. Rubach A. Hillebrand H. (2006). Biotic habitat complexity controls species diversity and nutrient effects on net biomass production. Ecology87, 246–254. doi: 10.1890/05-0090
12
Fang J. Chen A. Peng C. Zhao S. Ci L. (2001). Changes in forest biomass carbon storage in China between 1949 and 1998. Science292, 2320–2322. doi: 10.1126/science.1058629
13
Fang X. Zhao W. Fu B. Ding J. (2015). Landscape service capability, landscape service flow and landscape service demand: A new framework for landscape services and its use for landscape sustainability assessment. Prog. Phys. Geography: Earth Environ.39, 817–836. doi: 10.1177/0309133315613019
14
Field C. B. Raupach M. R. (2012). The Global Carbon Cycle: Integrating Humans, Climate, and the Natural World (Island Press, Washington, DC).
15
Forrester D. I. Tachauer I. H. H. Annighoefer P. Barbeito I. Pretzsch H. Ruiz-Peinado R. et al . (2017). Generalized biomass and leaf area allometric equations for European tree species incorporating stand structure, tree age and climate. For. Ecol. Manage.396, 160–175. doi: 10.1016/j.foreco.2017.04.011
16
Fu L. Lei Y. Wang G. Bi H. Tang S. Song X. (2016). Comparison of seemingly unrelated regressions with error-in-variable models for developing a system of nonlinear additive biomass equations. Trees30, 839–857. doi: 10.1007/s00468-015-1325-x
17
Fu L. Lei Y. Zeng W. S. (2014). Comparison of several compatible biomass models and estimation approache. Scientia Silvae Sinicae50, 42–54. doi: 10.11707/j.1001-7488.20140606
18
Fu L. Liu Q. Sun H. Wang Q. Li Z. Chen E. et al . (2018). Development of a system of compatible individual tree diameter and aboveground biomass prediction models using error-in-variable regression and airborne liDAR data. Remote Sens.10, 325. doi: 10.3390/rs10020325
19
Fu L. Sun H. Sharma R. P. Lei Y. Zhang H. Tang S. (2013). Nonlinear mixed-effects crown width models for individual trees of Chinese fir (Cunninghamia lanceolata) in south-central China. For. Ecol. Manage.302, 210–220. doi: 10.1016/j.foreco.2013.03.036
20
Fu L. Zeng W. Tang S. Z. Sharma R. Li H. (2012). Using linear mixed model and dummy variable model approaches to construct compatible single-tree biomass equations at different scales – A case study for Masson pine in Southern China. J. For. Sci.58, 101–115. doi: 10.17221/69/2011-JFS
21
Fu X. Zhang Y. Wang X. (2022). Prediction of forest biomass carbon pool and carbon sink potential in China before 2060. Scientia Silvae Sinicae58, 32–41. doi: 10.11707/j.1001-7488.20220204
22
Gerrish G. (1990). Relating carbon allocation patterns to tree senescence in metrosideros forests. Ecology71, 1176–1184. doi: 10.2307/1937385
23
Ghanbari Parmehr E. Amati M. (2021). Individual tree canopy parameters estimation using UAV-based photogrammetric and liDAR point clouds in an urban park. Remote Sens.13, 2062. doi: 10.3390/rs13112062
24
Giri K. Pandey R. Jayaraj R. S. C. Nainamalai R. Ashutosh S. (2019). Regression equations for estimating tree volume and biomass of important timber species in Meghalaya, India. Curr. Sci.116, 75–81. doi: 10.18520/cs/v116/i1/75-81
25
Guangdong Provincial People’s Government Portal Website . Available online at: https://www.gd.gov.cn/ (Accessed October 5, 2024).
26
Guo Z. Fang J. Pan Y. Birdsey R. (2010). Inventory-based estimates of forest biomass carbon stocks in China: A comparison of three methods. For. Ecol. Manage.259, 1225–1231. doi: 10.1016/j.foreco.2009.09.047
27
He Q. Chen E. An R. Li Y. (2013). Above-ground biomass and biomass components estimation using liDAR data in a coniferous forest. Forests4, 984–1002. doi: 10.3390/f4040984
28
Holdaway R. J. McNeill S. J. Mason N. W. H. Carswell F. E. (2014). Propagating uncertainty in plot-based estimates of forest carbon stock and carbon stock change. Ecosystems17, 627–640. doi: 10.1007/s10021-014-9749-5
29
Jenkins J. C. Chojnacky D. C. Heath L. S. Birdsey R. A. (2003). National-scale biomass estimators for United States tree species. For. Sci.49, 12–35. doi: 10.1093/forestscience/49.1.12
30
Jianfeng L. I. U. Jian N. I. (2021). Comparison of general allometric equations of biomass estimation for major tree species types in China. Quaternary Sci.41, 1169–1180. doi: 10.11928/j.issn.1001-7410.2021.04.23
31
Jingyang H. Baojun J. Kuan L. Qiannan F. Changfu L. (2016). Establishment and evaluation of biomass models of branches and leaves for larix olgensis plantation in montane region of eastern liaoning province. xnlydxxb36, 52–57. doi: 10.11929/j.issn.2095-1914.2016.05.009
32
Lehtonen A. Mäkipää R. Heikkinen J. Sievänen R. Liski J. (2004). Biomass expansion factors (BEFs) for Scots pine, Norway spruce and birch according to stand age for boreal forests. For. Ecol. Manage.188, 211–224. doi: 10.1016/j.foreco.2003.07.008
33
Li L. Deng X. Zhang T. Tian Y. Ma X. Wu P. (2022). Propagation methods decide root architecture of chinese fir: evidence from tissue culturing, rooted cutting and seed germination. Plants11, 2472. doi: 10.3390/plants11192472
34
Li W. Guo Q. Jakubowski M. K. Kelly M. (2012). A new method for segmenting individual trees from the lidar point cloud. Photogrammetric engineering &. Remote Sens.78, 75–84. doi: 10.14358/PERS.78.1.75
35
Lieth H. Whittaker R. H. (2012). Primary productivity of the biosphere. Springer Sci. Business Media.
36
Lun F. Liu Y. He L. Yang L. Liu M. Li W. (2018). Life cycle research on the carbon budget of the Larix principis-rupprechtii plantation forest ecosystem in North China. J. Cleaner Production177, 178–186. doi: 10.1016/j.jclepro.2017.12.126
37
Lv Z. Duan A. (2024). Biomass and carbon storage model of cunninghamia lanceolata in different production areas. Scientia Silvae Sinicae60, 1–11. doi: 10.11707/j.1001-7488.LYKX20220526
38
Ma T. Zhang C. Ji L. Zuo Z. Beckline M. Hu Y. et al . (2024). Development of forest aboveground biomass estimation, its problems and future solutions: A review. Ecol. Indic.159, 111653. doi: 10.1016/j.ecolind.2024.111653
39
Molina-Valero J. A. Camarero J. J. Álvarez-González J. G. Cerioni M. Hevia A. Sánchez-Salguero R. et al . (2021). Mature forests hold maximum live biomass stocks. For. Ecol. Manage.480, 118635. doi: 10.1016/j.foreco.2020.118635
40
Nord-Larsen T. Meilby H. Skovsgaard J. P. (2017). Simultaneous estimation of biomass models for 13 tree species: effects of compatible additivity requirements. Can. J. For. Res.47, 765–776. doi: 10.1139/cjfr-2016-0430
41
Parresol B. R. (1999). Assessing tree and stand biomass: A review with examples and critical comparisons. For. Sci.45, 573–593. doi: 10.1093/forestscience/45.4.573
42
Peng S. He N. Yu G. Wang Q. (2017). Aboveground biomass estimation at different scales for subtropical forests in China. Botanical Stud.58, 45. doi: 10.1186/s40529-017-0199-1
43
Poudel K. P. Temesgen H. (2016). Methods for estimating aboveground biomass and its components for Douglas-fir and lodgepole pine trees. Can. J. For. Res.46, 77–87. doi: 10.1139/cjfr-2015-0256
44
Shen J. Chen D. Sun X. Zhang S. (2019). Modeling a single-tree biomass equation by seemingly unrelated regression and dummy variables with Larix kaempferi. J. Zhejiang A&F Univ.36, 877–885. doi: 10.11833/j.issn.2095-0756.2019.05.005
45
Shen W. Li M. Huang C. Wei A. (2016). Quantifying live aboveground biomass and forest disturbance of mountainous natural and plantation forests in Northern Guangdong, China, based on multi-temporal landsat, PALSAR and field plot data. Remote Sens.8, 595. doi: 10.3390/rs8070595
46
Subati S. Jia W.-W. (2021). Construction of the additive model system for heartwood, sapwoodand bark taper of Pinus koraiensis plantation in different regions of Heilongjiang Province, China. Ying Yong Sheng Tai Xue Bao32, 3437–3447. doi: 10.13287/j.1001-9332.202110.029
47
Sun Y. Wang Y. Yan Z. He L. Ma S. Feng Y. et al . (2022). Above- and belowground biomass allocation and its regulation by plant density in six common grassland species in China. J. Plant Res.135, 41–53. doi: 10.1007/s10265-021-01353-w
48
Tang S. Zhang H. Xu H. (2000). Study on establish and estimate method of compatible biomass mode. Scientia Silvae Sinicae36, 19–27. doi: 10.3321/j.issn:1001-7488.2000.Z1.003
49
Wallace L. Lucieer A. Watson C. Turner D. (2012). Development of a UAV-liDAR system with application to forest inventory. Remote Sens.4, 1519–1543. doi: 10.3390/rs4061519
50
Wan P. Shao J. Jin S. Wang T. Yang S. Yan G. et al . (2021). A novel and efficient method for wood–leaf separation from terrestrial laser scanning point clouds at the forest plot level. Methods Ecol. Evol.12, 2473–2486. doi: 10.1111/2041-210X.13715
51
Wang M. Borders B. E. Zhao D. (2008). An empirical comparison of two subject-specific approaches to dominant heights modeling: The dummy variable method and the mixed model method. For. Ecol. Manage.255, 2659–2669. doi: 10.1016/j.foreco.2008.01.030
52
Wang J. C. Deng H. F. Huang G. S. Wang X. J. Zhang L. (2017). Compatible biomass models of natural spruce (Picea asperata). Ying Yong Sheng Tai Xue Bao28, 3189–3196. doi: 10.13287/j.1001-9332.201710.018
53
Wang J. H. Li F. R. Dong L. H. (2018a). Additive aboveground biomass equations based on different predictors for natural Tilia Linn. Ying Yong Sheng Tai Xue Bao29, 3685–3695. doi: 10.13287/j.1001-9332.201811.020
54
Wang J. Ran Q. Deng H. Huang G. Wang X. (2018b). Stand growth model for Pinus tabulaeformis using measurement error method. J. Zhejiang A&F Univ.35, 68–74. doi: 10.11833/j.issn.2095-0756.2018.01.009
55
Weiskittel A. R. MacFarlane D. W. Radtke P. J. Affleck D. L. R. Temesgen H. Woodall C. W. et al . (2015). A call to improve methods for estimating tree biomass for regional and national assessments. J. Forestry113, 414–424. doi: 10.5849/jof.14-091
56
Wernick I. K. Kauppi P. E. (2022). Storing carbon or growing forests? Land Use Policy121, 106319. doi: 10.1016/j.landusepol.2022.106319
57
Yu G. Li X. Wang Q. Li S. (2010). Carbon storage and its spatial pattern of terrestrial ecosystem in China. jore1, 97–109. doi: 10.3969/j.issn.1674-764x.2010.02.001
58
Zellner A. (1962). An efficient method of estimating seemingly unrelated regressions and tests for aggregation bias. J. Am. Stat. Assoc.57, 348–368. doi: 10.1080/01621459.1962.10480664
59
Zeng W. S. Tang S. Z. (2010a). Using mixed-effects modeling method to establish compatible national and regional single-tree biomass equations. Cent. South For. Inventory Plann.29, 1–6. doi: 10.16166/j.cnki.cn43-1095.2010.04.006
60
Zeng W. Tang S. Z. (2010b). Using measurement error modeling method to establish compatible single-tree biomass equations system. For. Res.23, 797–803. doi: 10.13275/j.cnki.lykxyj.2010.06.004
61
Zeng W. Zhang L. Chen X. Cheng Z. Ma K. Li Z. (2017). Construction of compatible and additive individual-tree biomass models for Pinus tabulaeformis in China. Can. J. For. Res.47, 467–475. doi: 10.1139/cjfr-2016-0342
62
Zeng W. S. Zhang H. R. Tang S. Z. (2011). Using the dummy variable model approach to construct compatible single-tree biomass equations at different scales — a case study for Masson pine (Pinus massoniana) in southern China. Can. J. For. Res.41, 1547–1554. doi: 10.1139/x11-068
63
Zhang L. Chen Y. Hao G. Ma K. Bongers F. Sterck F. J. (2020). Conifer and broadleaved trees differ in branch allometry but maintain similar functional balances. Tree Physiol.40, 511–519. doi: 10.1093/treephys/tpz139
64
Zhang M. Lin H. Zeng S. Li J. Shi J. Wang G. (2013). Impacts of plot location errors on accuracy of mapping and scaling up aboveground forest carbon using sample plot and landsat TM data. IEEE Geosci. Remote Sens. Lett.10, 1483–1487. doi: 10.1109/LGRS.2013.2260719
65
Zhang J. Lu C. Xu H. Wang G. (2019). Estimating aboveground biomass of Pinus densata-dominated forests using Landsat time series and permanent sample plot data. J. For. Res.30, 1689–1706. doi: 10.1007/s11676-018-0713-7
66
Zhang C. Peng D.-L. Huang G.-S. Zeng W.-S. (2016). Developing aboveground biomass equations both compatible with tree volume equations and additive systems for single-trees in poplar plantations in Jiangsu province, China. Forests7, 32. doi: 10.3390/f7020032
67
Zhao D. Westfall J. Coulston J. W. Lynch T. B. Bullock B. P. Montes C. R. (2019). Additive biomass equations for slash pine trees: comparing three modeling approaches. Can. J. For. Res.49, 27–40. doi: 10.1139/cjfr-2018-0246
Summary
Keywords
biomass model, dummy variable model, compatibility model, growth and development stage, Cunninghamia lanceolata
Citation
Wu Z, Xie D, Liu Z, Chen Q, Ye Q, Ye J, Wang Q, Liao X, Wang Y, Sharma RP and Fu L (2025) Developing compatibility biomass model based on UAV LiDAR data of Chinese fir (Cunninghamia lanceolata) in Southern China. Front. Plant Sci. 16:1520666. doi: 10.3389/fpls.2025.1520666
Received
31 October 2024
Accepted
09 July 2025
Published
26 September 2025
Corrected
30 September 2025
Volume
16 - 2025
Edited by
Zhenghong Yu, Guangdong Polytechnic of Science and Technology, China
Reviewed by
Xiangjin Shen, Chinese Academy of Sciences (CAS), China
Yuanshuo Hao, Northeast Forestry University, China
Updates
Copyright
© 2025 Wu, Xie, Liu, Chen, Ye, Ye, Wang, Liao, Wang, Sharma and Fu.
This is an open-access article distributed under the terms of the Creative Commons Attribution License (CC BY). The use, distribution or reproduction in other forums is permitted, provided the original author(s) and the copyright owner(s) are credited and that the original publication in this journal is cited, in accordance with accepted academic practice. No use, distribution or reproduction is permitted which does not comply with these terms.
*Correspondence: Liyong Fu, fuly@ifrit.ac.cn
Disclaimer
All claims expressed in this article are solely those of the authors and do not necessarily represent those of their affiliated organizations, or those of the publisher, the editors and the reviewers. Any product that may be evaluated in this article or claim that may be made by its manufacturer is not guaranteed or endorsed by the publisher.