 Delfina Barabaschi1*
 Andrea Volante2
 Primetta Faccioli1
 Alice Povesi1Ivana Tagliaferri1
 Elisabetta Mazzucotelli1
 Luigi Cattivelli1
- 1Council for Agricultural Research and Economics (CREA) - Research Centre for Genomics and Bioinformatics, Fiorenzuola d’Arda, Italy
- 2Council for Agricultural Research and Economics (CREA) - Research Centre for Vegetable and Ornamental Crops, Sanremo, Italy
Ancient subspecies of hexaploid wheat, not yet subjected to intensive selection, harbor potentially valuable alternative genetic variability for the genetic improvement of modern cultivated bread wheat. To investigate these hitherto unexplored resources, we established a panel, currently unique, consisting of 190 accessions of Triticum aestivum belonging to five different neglected subspecies, compactum, sphaerococcum, macha, spelta, and vavilovii, with few aestivum references. The panel was genotyped through the iSelect Illumina arrays (20K and 25K) and phenotyped for 25 traits related to phenology, morphology, yield, and physiology for 4 years under field conditions. We found wide variability for all traits analyzed, both within and among subspecies, demonstrating the richness contained therein. Through a genome-wide association study (GWAS), we identified a total of 126 marker–trait associations (MTAs), including 4 for years, 58 for morphological traits, 39 related to yield, and 25 for physiological traits, some of them confirming loci previously published and others being novel. Fourteen MTAs were associated with multiple traits. Among them, one on chromosome 2D at 360.2 Mb was associated with spike density, length, and shape, and thus is of particular interest because it may underlie the compactum (C) gene, until now considered difficult to clone because of its centromeric position. The physical distance defined by this MTA is considerably smaller (1.7 Mb) than what is reported so far in the literature, paving the way toward physical mapping of the C gene. A potential candidate gene has been identified for the trait grain number per spike. This is TraesCS6A03G0476500, coding for a monosaccharide-sensing protein 2, located on chromosome 6A at 233 Mb and identified through an MTA that segregates exclusively in compactum accessions. The results obtained confirm the remarkable potential present in the panel of wheat subspecies analyzed in this study, which, being characterized by a very short linkage disequilibrium (LD) decay, allowed the definition of rather narrow ranges around key traits, such as those related to yield, providing new perspectives on transferring genes across subspecies for wheat improvement.
1 Introduction
Wheat (Triticum ssp.) has been the world’s most widely cultivated food crop since the beginning of agriculture. Nowadays, there is an increasing global demand for novel varieties with improved crop yield and disease resistance to be suitable to divergent climatic conditions, and with innovative quality traits. In this context, the exploitation of the genetic resources plays a key role to support the genetic improvement of crop plants acting as sources of new favorable alleles to be introduced in the gene pool of elite cultivars. For this purpose, over 80 distinct germplasm collections holding an estimated total of more than 800,000 accessions are available (Wheat | Crops | Resources | CGIAR Genebank Platform).
Common or bread wheat (Triticum aestivum L., hexaploid genome AABBDD) is one of the most widely grown crops worldwide and the staple food for most countries (Tadesse et al., 2019). Within hexaploid wheat primary gene pool, the ancient subspecies (which include landraces, wilds, and old cultivars) can be considered “exotic” genetic materials, and hence valuable sources of new, potentially favorable alleles. Wheat ancient subspecies (ssp.) may represent a reservoir of alternative variability that have been left behind during the processes of range extension and modern breeding under intensive agricultural management (Fu, 2015). The hexaploid subspecies differ quite well from each other in spike architecture (spike shape, density, and the seed shape), which is mainly controlled by three major genes (Fan et al., 2019): the spelt factor q (speltoid spike: a spear-shaped spike with an elongated, brittle rachis, and non-free-threshing grains) and its dominant allele Q (square-headed, free-threshing grain and tough rachis) on chromosome arm 5AL (Simons et al., 2006); the gene for ear compactness on chromosome arm 2DL (C/c: compact spike/non-compact spike) with pleiotropic effects on grain size, shape, and number per spike (Johnson et al., 2008); and finally the sphaerococcum factor (S1/s1: non-spherical/spherical grains), which controls seed shape, on 3D (Faris et al., 2014).
In the present work, a germplasm collection of 190 hexaploid wheat accessions (hereafter called “Ta-ssp panel”) has been set up, originated worldwide and hence adapted to different agro-climatic zones. Besides few cultivars of T. aestivum ssp. aestivum acting as references, the panel includes a significant representation of four T. aestivum subspecies: compactum, sphaerococcum, macha, and spelta, plus one vavilovii.
About half of the collection is composed of spelt forms (macha, spelta, and vavilovii) characterized by intrinsic and high polymorphism due to several independent hybridizations involving different tetraploid forms (Kuckuck, 1964), although T. dicoccum seems to be the most favored. Macha, much more widely distributed in prehistoric ages, has nowadays a very scarce distribution; in the past, it has been proposed as the primitive hexaploid of other spelt wheat (Dorofeev, 1972). It is quite tall and characterized by laterally compressed wide fragile ears, awned or awnless; it is endemic to Georgia (Bedoshvili et al., 2021). Spelta has long lax fragile ears, awned or awnless, with tightly covered grains; it has a long cultivation tradition in southwest Germany, Austrian Alpine valleys, Switzerland, and a few other remote areas of Europe (Grausgruber, 2018). Vavilovii, probably a variant of spelta, is cultivated only in Armenia and carries branched ears, characterized by a lengthening of the spikelet axis and short awns (Dorofeev et al., 1979).
Like aestivum, sphaerococcum and compactum are both free-threshing wheat; indeed, all carry the dominant Q allele. Sphaerococcum, also known as Indian dwarf wheat, was widespread in prehistory and before the Green Revolution. It is characterized by short dense awned or awnless ears and small near-hemispherical grains with a high protein content; it is endemic to southern Pakistan and northwestern India (Szczepanek et al., 2020). Compactum, also known as club wheat, is characterized by short ears, uniformly dense, and oblong or oval, which can be awned or awnless. Cultivars of compactum are still commercially competitive in the U.S. Pacific Northwest, while their distribution is limited to a few areas in Europe, Turkey, and Australia. They also exhibit drought resistance and earliness (Johnson et al., 2008).
Spelta is currently the subspecies that attracts the most attention and interest, despite showing brittle rachis and grains tightly surrounded by tenacious glumes. Recently, the spelt market increased globally, owing to the demand for ancient wheat being less subjected to modern breeding (Chrpová et al., 2021). Its origin and relationship with the aestivum subspecies are still debated; indeed, these two subspecies are evolutionary very closely related, but still significantly divergent at the sequence level (Liu et al., 2018). In addition, spelta is differentiated into two geographical groups, coming from Europe and Asia. Hyun et al. (2020) suggested a polyphylesis for the A and B genome for the European and Asian spelt wheat, and a common ancestor for the D genome, with the latter monophylesis being already suggested by Dvorak et al. (2012) for all subspecies of T. aestivum.
European spelt wheat could be derived from an independent hybridization of domesticated emmer wheat (T. turgidum ssp. dicoccum) with Ae. tauschii (McFadden and Sears, 1946; Kerber and Rowland, 1974), or with a free-threshing hexaploid wheat (Yan et al., 2003; Blatter et al., 2004), while Asian spelt could have evolved from the ancestral T. aestivum ssp. spelta; the latter, together with T. aestivum ssp. Aestivum, could be derived from primitive hexaploid wheat. Very recently, Wang et al. (2024) refined an evolutionary model at least for European spelt by proposing interspecific hybridization and gene flow between primitive hexaploid wheat and domesticated emmer wheat. The evolutionary relationships among the above-mentioned T. aestivum subspecies are still unclear. The naked, compact, spherical-seeded forms appear to have arisen after hybridization between T. dicoccum and Ae. tauschii as the result of single mutations. Indeed, compactum, the origin of which has been discussed in the past, could be raised from a mutation at the C locus in aestivum (Johnson et al., 2008). Phylogenetic differences were also confirmed between macha and aestivum as well as between macha and spelta (Cao et al., 2000).
Such a diversified material offers unique opportunities to enrich the available bread wheat germplasm with new valuable alleles and to increase the diversity of the existing materials; a detailed genetic and agro-morphological characterization of a Ta-ssp panel is of paramount importance to provide information on this hitherto underexploited genetic resource and to set up focused approaches for breeding programs. More than 20K SNPs (single-nucleotide polymorphisms) were used in this study to describe the genetic structure of the Ta-ssp panel and to investigate the diversity between and within the subspecies. We undertook a GWAS for several phenological, morphological, physiological, and yield-related traits, and a remarkable set of novel MTAs (marker–trait associations), besides some already known, have been detected, providing the starting point for mining candidate genes underlying the traits of interest. This study represents the first comprehensive attempt to widen the knowledge of existing wheat hexaploid germplasm through the characterization of ancient subspecies.
2 Material and methods
2.1 Assembly and composition of the subspecies panel
A panel of 190 hexaploid wheat accessions (hereafter defined as the “Ta-ssp panel”), mostly obtained from the National Small Grains Collection (USDA-ARS) (Search Accessions GRIN-Global - ars-grin.gov), was evaluated in this work. The original seeds were used to produce single seed descent through one cycle of self-fertilization during field trials in Fiorenzuola d’Arda (Italy) in the 2017–2018 growing season.
The accessions belong to six different subspecies (ssp.) of T. aestivum: 15 T. a. ssp. aestivum, 58 T. a. ssp. compactum, 26 T. a. ssp. sphaerococcum, 24 T. a. ssp. macha, 66 T. a. ssp. spelta, and 1 T. a. ssp. vavilovii. This panel includes cultivars, breeding materials, landraces, and wilds (the latter are all macha, plus the vavilovii). The aestivum accessions present in the panel are representative of the genetic diversity of the modern cultivars and include two genotypes for which reference-quality genome is available: Chinese spring and Arina (Walkowiak et al., 2020, https://galaxy-web.ipk-gatersleben.de/libraries/folders/F1cd8e2f6b131e891/page/1).
The improvement status (according to GRIN) was reported when available. Most of the cultivars belong to aestivum or compactum, while 60% of spelta accessions are landraces. The genotypes originated from five continents and 40 different countries, with the most represented being USA (26), Germany (11), India (10), and Austria (10). Detailed information for each accession is given in Table 1 and Supplementary Table S1.
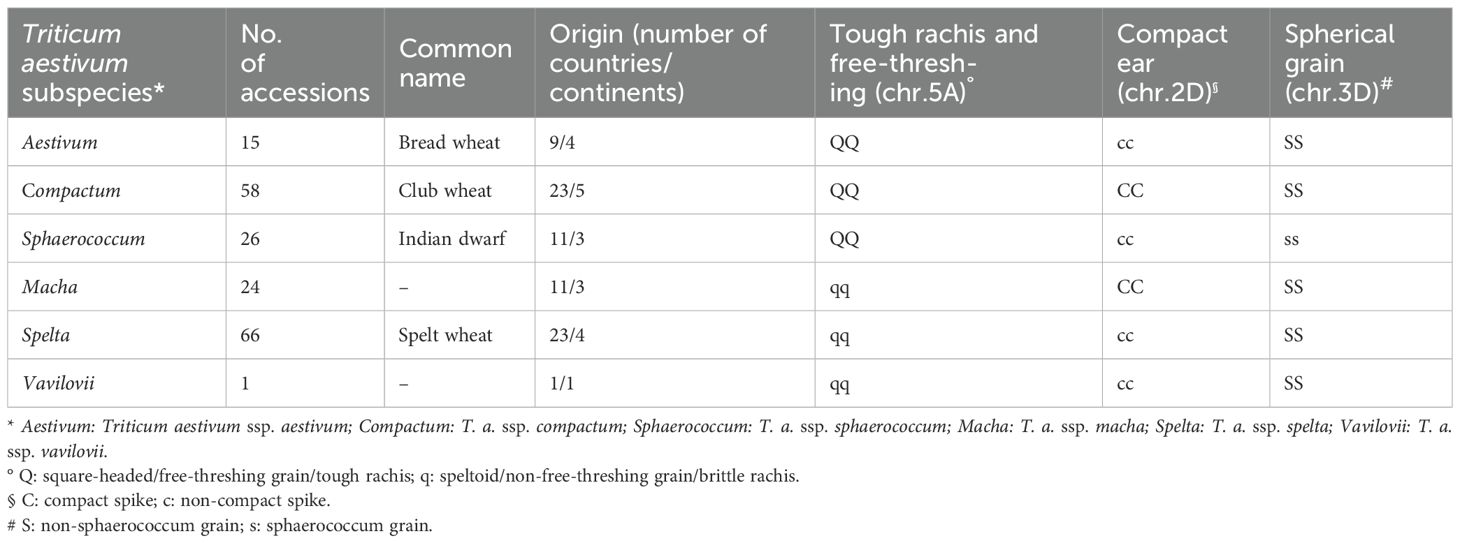
Table 1. Composition of the Ta-ssp panel: number of accession/subspecies, distribution by countries and continents, and allele combination of three major genes controlling spike architecture (the spelt factor, the gene for ear compactness, and the sphaerococcum factor).
2.2 Field trials, phenotypic trait evaluation, and statistical analysis
A field trial was set up at the experimental farm in Fiorenzuola d’Arda, Italy (44˚ 55′22″ N, 9˚ 54′36″ E) under rainfed conditions during four crop seasons: 2017–2018, 2018–2019, 2020–2021, and 2021–2022 (hereafter called only 2018, 2019, 2021, and 2022). Fields were managed for pests and diseases, and with fertilizer applications following the local agronomic practices. Genotypes were tested in a randomized complete block design in a single row (1 m long using a sowing density of 25 seeds/m) and three (in 2019) or two (in 2018, 2021, and 2022) replications per genotype. In the first year (2018), only 151 accessions out of 190 of the full Ta-ssp panel were available and hence evaluated. A total of 25 agronomic traits were evaluated across years and accessions (for details, see Supplementary Table S2).
Days to heading (DTH) was calculated as the number of days from 1 January to when spikes appeared in at least 50% of the plants. Regarding plant morphology, 10 traits were considered at suitable developmental stages. At physiological maturity, two traits were recorded: plant height (PH, cm), measured from the soil level to the tip of the spike (excluding awns), and the angle (FLANG) and elasticity (FLE) of flag leaf through a visual assessment. FLANG was scored using the following scale: 1 for erect leaves (0–30°), 2 for intermediate or horizontal leaves (31–90°), 3 for semi-pendant leaves (91–130°), and 4 for pendant leaves (131–180°), while FLE, defined as the response to a moderate pressure applied with a finger, was evaluated within a 1–4 range of elasticity: 1, very poor; 2, poor; 3, good; 4, very good. Flag leaf size was estimated by length (FLL, cm), width (FLW, cm), and area (FLA, cm2) at the milky ripe stage, on five randomly selected plants from the main tillers of each row. The leaf samples were collected, pasted on a sheet of paper, and immediately measured for FLL from leaf base to leaf tip and FLW at the widest position of flag leaf lamina with a ruler with an accuracy of 1 mm. FLA was determined from digital images acquired by an STD 10000XL scanner (Epson, Japan) and then analyzed with the package “LeafArea”, employed to run ImageJ software within R.
Awn presence (AP), glume color (GLC), and spike shape (SS) were determined post-harvesting, on five main tiller spikes of each accession. AP was assessed following this scale: 0 = awnless; 3 = awnletted (short awns); 7 = awned (conspicuous awns). GLC, observed on the outer glume, was measured within a 1–3 range: 1 = white; 2 = red to brown; 3 = purple to black; SS was assessed on a visual 1–9 scale: 1 = tapering; 3 = parallel side; 5 = semi-clavate; 7 = clavate; 9 = fusiform. Grain color (GC) was evaluated after threshing within a 1–3 scale: 1 = white; 2 = red and brown; white, 3 = purple.
Eight yield-related traits were recorded onto the same 5 spikes used for the above measurements. Spike length (SL, cm) was measured from the base of the rachis to the tip of the uppermost spikelet without awns. Then, spike weight (SW), spikelet number per spike (SNS), and among them those fertile (FSNS) were evaluated. Spike density (SD) was studied in two ways: (i) on a 1–9 scale: 1 = very lax, 3 = lax, 5 = intermediate, 7 = dense, 9 = very dense; and (ii) as dividing SNS by SL, multiplied *10 (SD^). The number of grains per spike (GNS) and their total weight (GWS) were also assessed, followed by thousand grain weight (TGW) obtained as an average weight of 100 grains × 10 (2 replicates).
Physiological traits were also recorded. Leaf chlorophyll (CHL) and epidermal flavonoids (FLV) were measured at 10 days after heading using Dualex 4 Scientific (Dx4) (FORCE‐A, Orsay, France), on five randomly selected plants from the main tillers of each row. Three readings were taken from both sides (superior and inferior) of each leaf: CHLs and CHLi, and FLVs and FLVi. The simultaneous non-destructive assessment of these two physiological traits allowed one to calculate the nitrogen balance index (NBI) as the ratio between CHL and FLA content, an indicator of C/N allocation balance (Cartelat et al., 2005).
In 2018, GC, SW, FSNS, SD, SD^, and GWS were not recorded since the panel was not yet complete; the evaluation of TGW was added only in the last 2 years (2021 and 2022) while FLANG and FLE were not recorded in 2022 due to lodging caused at the time of the survey.
All statistical analyses were performed with R packages. The phenotypic data were analyzed by fitting linear models using the lmer function of the lme4 package (Bates et al., 2015). Best Linear Unbiased Predictors (BLUPs) of each trait for each accession were calculated using the ranef function. The model fitted the data considering genotype, year, and genotype × year interaction as random factors. The model was formalized as follows:
where Yijk is the phenotypic value of the trait of interest of genotype i in year j and replication k, µ is the overall mean, Gi is the effect of genotype i, Yj is the effect of the year j, Rk(j) is the effect of replication k nested in year j, GYij is the G × Y interaction between genotype i and year j, and eijk is the residual effect associated with genotype i in year j and replication k.
An analysis of variance (ANOVA) was performed on BLUPs, using genotypes, years, and subspecies as factors. Broad-sense heritability (H2) was estimated from variance components across years according to the following equation (Nyquist, 1991):
where In these expressions, r is the number of years, and MS(G) and MS(E) are the mean sums of squares for genotype and residual error obtained from analysis of variance.
Pearson pairwise correlation among agronomic traits was computed using the BLUPs over environments with the R package corrplot (Taiyun and Simko, 2024).
2.3 DNA extraction and genotyping for known genes
Genomic DNA was isolated from plant tissue samples obtained at the three-leaf stage, according to a standard CTAB-based protocol (Stein et al., 2001). DNA integrity and quantity were checked and confirmed. Markers (simple sequence repeat—SSR, sequence-tagged site—STS, or cleaved amplified polymorphic sequences—CAPS) for specific loci, from previously published studies, affecting plant height, plant phenology, vernalization, and genes for quality traits such as hardness (Pinb-D1), grain protein content (Gcp-B1), and grain weight were analyzed by polymerase chain reaction (PCR). Detailed information for each marker, protocol, and reference is present in Supplementary Table S3.
2.4 Genotyping with high-throughput array and in silico physical mapping
Genotyping of the 190 wheat accessions was conducted at Trait Genetics, Gatersleben (Germany, https://sgs-institut-fresenius.de/en/health-nutrition/traitgenetics), by using the 20K and later 25K iSelect arrays (Illumina Inc, San Diego, USA). The 20K array contains a total of 17,267 SNPs: a combination of a subset of high-quality and predominantly haplotype-specific markers from the 90K iSelect array (Wang et al., 2014), plus a small set of candidate genes for major phenology traits such as Ppd and Rht and some quality traits from the 820K Axiom array (Winfield et al., 2016). The 25K array contains most of the markers from the previous 20K array plus additional SNPs from 135K Affymetrix wheat array and candidate genes. Samples were analyzed on Infinium ultra-HD chips carrying 24 samples each and allele calling was performed. Combining the two arrays, a total of 24,369 SNPs were available for the detection of genetic diversity. Markers with more than 10% of missing values, a minor allele frequency (MAF) lower than 5%, and individuals with more than 5% missing SNP calls were filtered out. After this QC check, 20,729 high-quality SNP markers remained for all the 190 lines.
Flanking sequences of each SNP (available in Gogna et al., 2022) were mapped against the reference wheat genome of Chinese spring produced by the International Wheat Genome Sequencing Consortium (IWGSC RefSeq v2.1; https://urgi.versailles.inra.fr/blast_iwgsc/, IWGSC, 2018) to get their putative physical location. For the blastn (run locally at https://wheat-urgi.versailles.inra.fr/Seq-Repository/Assemblies), the following parameters were used: an e-value cutoff of e−30, an identity higher than or equal to 97%, and a sum of gaps and mismatches no higher than 3 (including the SNP position). In addition, only reads that uniquely map to one of three subgenomes were retained. Among the 20,729 filtered markers, a physical position was obtained for 14,640; 58% of them had an extremely robust hit, showing a full-length alignment with the only exception of the SNP (defined as perfect match). A total of 40 markers were not assigned to any chromosomal position (unknown).
2.5 Analysis of population structure
The genetic stratification in the T. aestivum subspecies panel was inferred, using the set of physically mapped SNPs (14,680), by three independent methods: neighbor-joining (N-J) clustering method, principal coordinates analysis (PCoA), and a Bayesian model-based analysis.
The N-J tree was developed with MEGA v.7 (Kumar et al., 2016), using a total of 1,000 bootstrap replicates and Jukes–Cantor genetic distance (Simonetti et al., 2022; El-Esawi et al., 2023). The tree file was exported in Newick format to be graphically represented with iTOL version v6 (https://itol.embl.de/.), together with the information relative to different subspecies. A PCoA was performed using PAST v4.03 (Hammer et al., 2001) based on the Hamming distances. The first and second principal coordinates were used to draw the two-dimensional space graph, onto which subspecies attributions were projected.
The Bayesian model-based analysis was achieved using Structure 2.3.4 (Pritchard et al., 2000). This software determines the number of optimal clusters (K) in the panel and estimates the membership probability of each genotype in each subpopulation. All analyses were run with the ADMIXTURE model, with correlated allele frequencies, a burn-in period of 10,000 iterations, followed by 20,000 Monte Carlo Markov chain (MCMC) replications from K=1 to K=10. Five independent runs were generated for each K. The results of the analysis were used as input to the Structure Selector tool (Earl and von Holdt, 2011) to predict the best K-value based on the Evanno method (ΔK method; Evanno et al., 2005). One final run was performed, at the most probable K-value, using the same parameters listed above, but with a higher number of burn-in and MCMC iterations (100,000 and 200,000, respectively). Accessions were assigned to subpopulation if the probability of membership was greater than 70% (Volante et al., 2017); the remaining accessions were considered as admixed. The number and composition of the clusters identified were integrated into the results of the N-J analysis and the PCoA for cross-validation.
2.6 Analysis of linkage disequilibrium decay
The extent of chromosome-wise linkage disequilibrium (LD) was evaluated by calculating the pairwise LD squared allele frequency correlation coefficient (r2) for all intra-chromosomal SNP pair loci with physical positions (14,680) as described in Volante et al. (2021). The computation was done with the R package “LDcorSV v1.3.1” (Mangin et al., 2012) using as covariates the structure membership matrix and the kinship matrix calculated by Tassel v.5 (Bradbury et al., 2007). Afterwards, the r2 values were binned in 100-Kb windows and the median value of each distance class was calculated for each of the 21 linkage groups (this was used instead of the mean as LD values are not normally distributed at short and long-distance classes). The resulting values were plotted against physical distance (in Kb) and fitted to a second-degree LOESS curve using an R script (Cleveland, 1979; Marroni et al., 2011). A critical value of 0.2 was set as r2 between unlinked loci, and the LD decay rate in the panel was calculated as the physical distance corresponding to the LOESS curve value at the critical 0.2 threshold. LD decay was estimated for each chromosome and for each genome.
2.7 Genome-wide association study
The GWAS was performed using mixed linear model (MLM) implemented by Genomic Association and Prediction Integrated Tool (GAPIT) in R (Lipka et al., 2012). A K-PC model was used (Zhao et al., 2007), where kinship information together with the first three principal components (PCs) as covariates were included for GWAS, to further improve statistical power. “Optimal compression and no P3D mode” parameters were used to examine associations between SNP markers and phenotypic data. GWAS was conducted on BLUPs calculated on phenotypic data scored across years for each accession to account for the genotype × year interaction on trait variability.
To identify loci (MTAs) associated with the 25 agronomic traits evaluated in this work, association analysis was performed using the entire set of informative SNPs (20,729).
The p-value of the association to the phenotypic trait was computed for each marker. All markers with a threshold of −log10 (p-value) ≥ 3.5 were assumed to be associated with traits, highlighting those under the significance threshold of 0.05 of false discovery rate (Benjamini and Hochberg, 1995) and those above the Bonferroni threshold, considered highly associated. MTAs were visualized using Manhattan plots for each trait. To determine whether the MTAs detected in this study were in the same position as that of previously reported genes, MTAs, or QTL, the physical locations of the genomic regions were compared. All markers associated with a specific trait were assigned to the same MTA regions when distance between them was less than LD decay of the chromosome. The peak marker was defined as that with the highest −log10 (p-value) value detected in the region.
High-confidence (HC) genes located next to those MTAs associated with multiple traits were searched in JBrowse-IWGSC RefSeq (https://wheat-urgi.versailles.inra.fr/Tools/JBrowse), taking as interval the extent of LD as calculated for each chromosome on the left and right side of the MTA. The annotation of each HC gene was also retrieved from Wheat URGI repository (https://wheat-urgi.versailles.inrae.fr/Seq-Repository/Annotations) and reported. For the regions deemed most interesting, the expression patterns of HC genes in different organs and developmental stages were retrieved by wheat mRNA transcription data in the wheat expression database (Wheat eFP Browser).
3 Results
3.1 Phenotypic variation in the Ta-ssp panel
A broad variation for all measured traits was detected within and among subspecies. Means, median, minimum, maximum, and quartiles for all traits in each year were calculated for the entire panel (Supplementary Table S4A) and minimum, maximum, and mean values were also measured for each subspecies in each year (Supplementary Table S4B). The mean values of the 21 non-categorical traits analyzed in at least two growing seasons were also evaluated and reported in Supplementary Table S4C to provide a general overview of the different morphologies and behaviors among the subspecies.
The distribution of the traits among the diverse subspecies generally followed the same trend across years (Supplementary Figure S1). Sphaerococcum is the subspecies that heads the earliest and the one with the lowest plant height and narrowest leaf angle, the one that is least elastic, and the one with the overall smallest leaves (length, width, and area) and the lowest number of seeds and spikelets per spike (total and fertile), as well as the one with the lowest GWS. Macha accessions were found to be the most late in heading, the tallest, and the most elastic, and the ones with the highest spikelet number per spike (total and fertile), while spelta accessions were characterized by the widest leaf angle, the longest ears, and the highest TGW. The number and weight of seeds per spike as well as spike weight and derived density (SD^) were highest in compactum, associated with shorter spike length. The highest chlorophyll content was detected in aestivum subspecies, while the lowest was found in macha subspecies (Supplementary Table S4C). From these general comparisons, we excluded vavilovii since it was being represented by a single accession in the Ta-ssp panel.
The traits showing the lowest coefficients of variation (CVs) were FLVs and FLVi, ranging from 7.11% to 11.71% (over the 4 years), followed by CHLs and CHLi. The highest variability (between 42.44% and 51.40%) was observed for SL, except in 2019 since not all subspecies were measured (see the Material and Methods section) (Table 2). ANOVA calculated on BLUPs showed that genotypes, subspecies, and year had significant effects on phenotypic variation with the only exception of TGW, for which only year had a strong effect (Table 2). Broad-sense heritability (H2) values were very high (>85%) for DTH, PH, FLL, SL, GNS, SNS, FSNS, and SD^ and rather low for physiological traits, ranging between 57.6% (NBIi) and 62.0% (CHLi). Pearson analysis was used to highlight significant baseline correlations between different traits (Figure 1, Supplementary Table S5). Very high positive correlations (above r = 0.80) were found between DTH ad FLL (0.82), between SS and SD^ (0.86), between SW and GWS (0.94), and between GNS and GWS (0.83), while SD and SL were strongly negatively correlated (−0.86). Other moderate positive correlations (0.60 ≤ r ≤ 0.80) were observed: DTH with FLA, PH, and SL; PH with FLANG, FLL, and SL; and FLE with FLL and FLA.
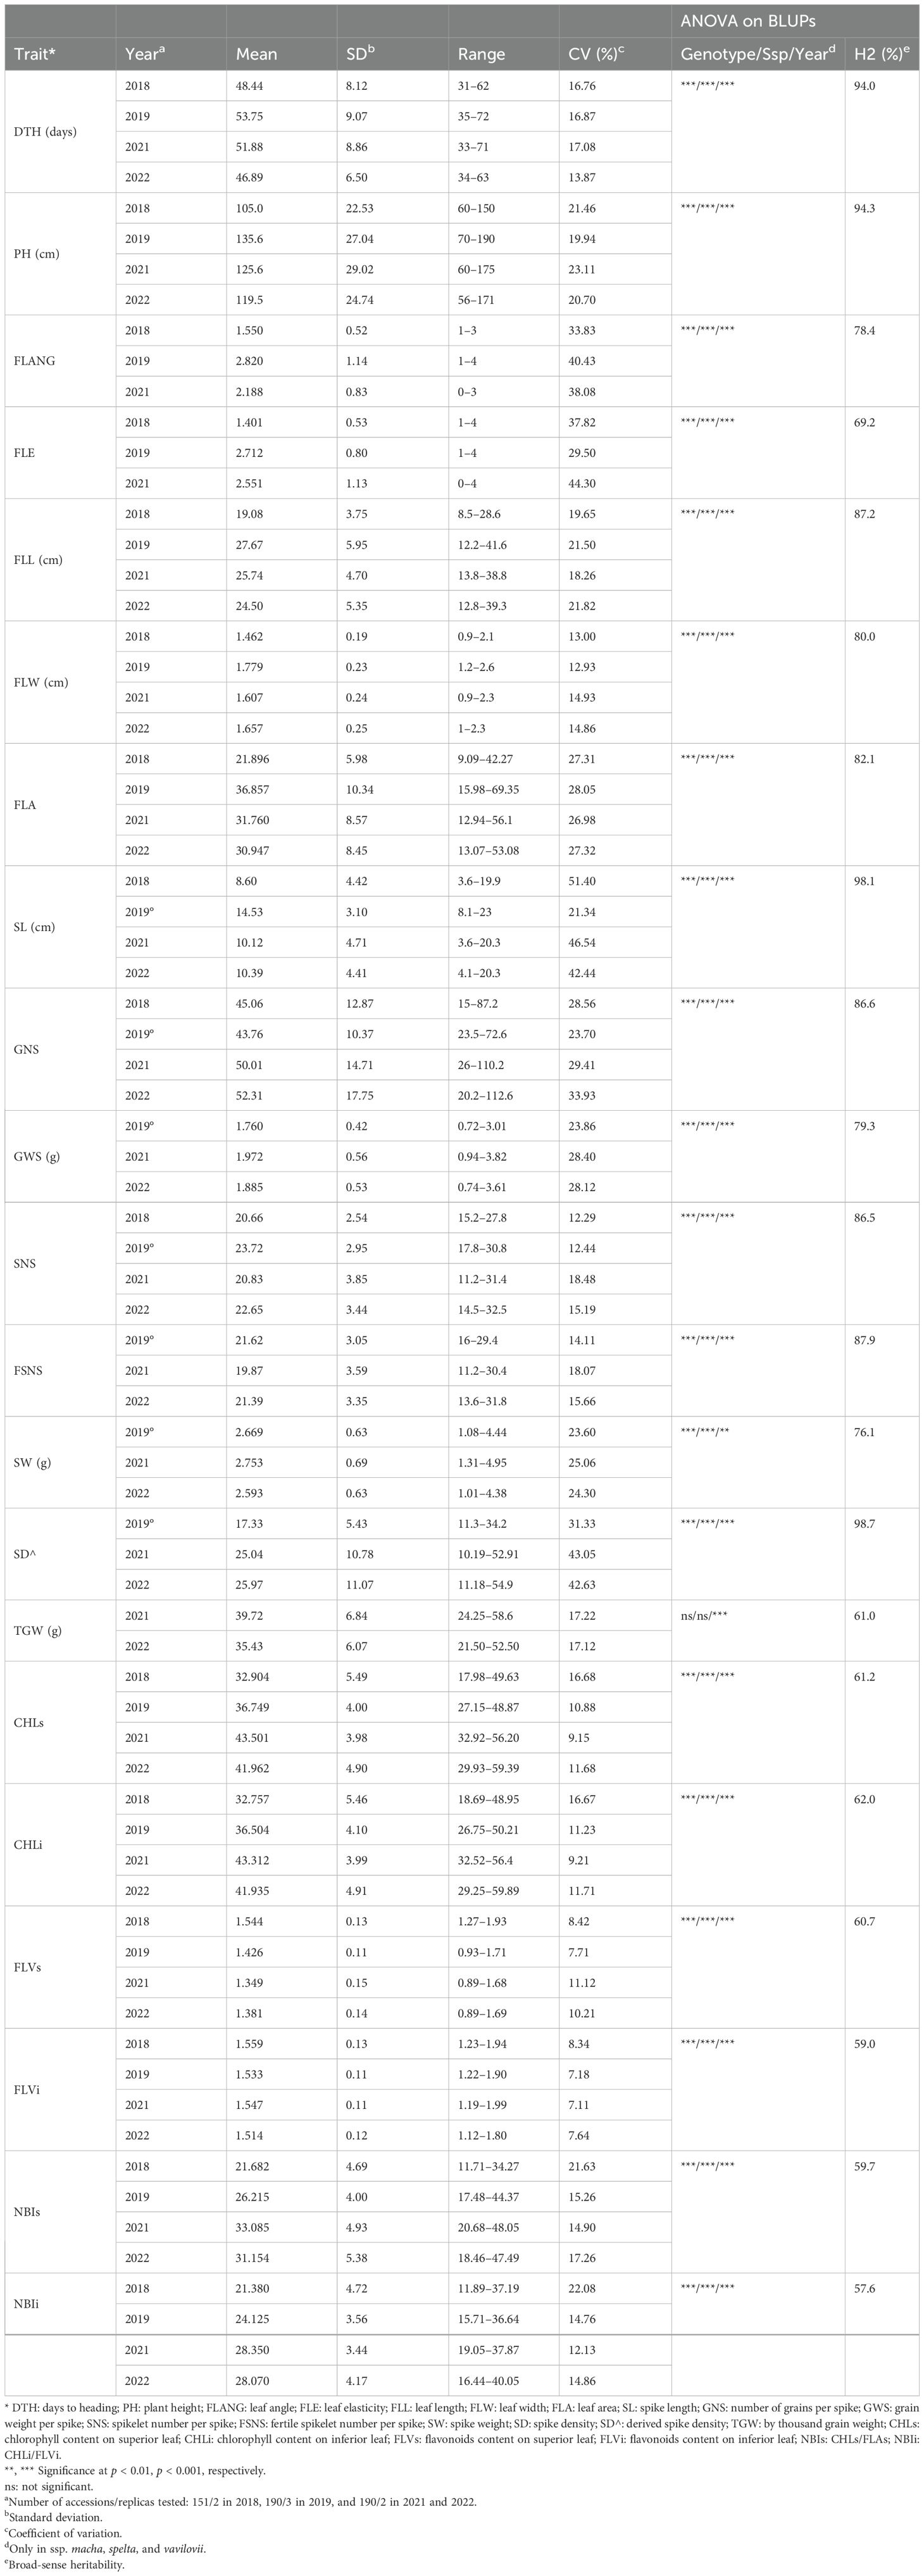
Table 2. Descriptive statistics of all quantitative traits evaluated in 4 years, and ANOVA and heritability on BLUPs.
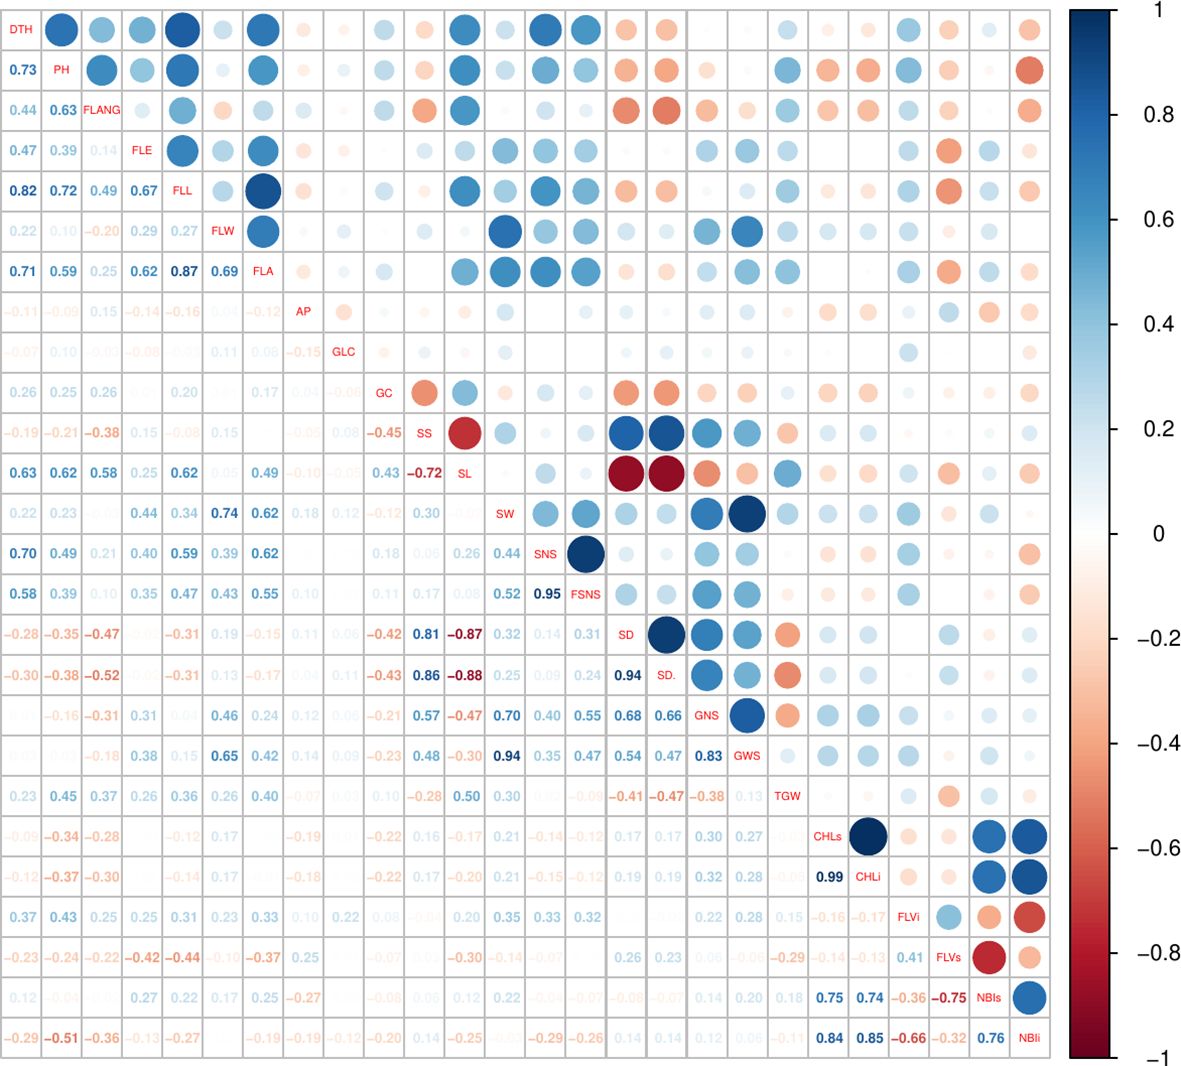
Figure 1. Pearson correlations among the phenotypic traits recorded in the Ta-ssp panel.
3.2 Genotyping for interesting loci
The allelic state at 16 known genes for plant height (Rht8 and Rht-B1a), photoperiod responsiveness (Ppd-D1a), vernalization (VRND4), and genes for quality traits such as grain protein content (Gcp-B1), hardness (Pinb-D1), and grain weight (GW2-6A, Sus1-7A, Sus1-7B, Sus2-2A, Sus2-2B, CKX6-D1, GS-D1-7D, Cwi-A1, Cwi-4A, and Cwi-5D) was assessed (Supplementary Table S3). The genotyping data at these genes across the entire Ta-ssp panel are available in Supplementary Table S6A, while graphs reporting the allelic distribution in different ssp (except for the single vavilovii accession) and in the entire panel are presented in Supplementary Table S6B.
The great majority of the accessions carry the wild-type allele for Rht8 and Rht-B1a (95.%2 and 93.1%), are photoperiod sensitive (92.9%), are soft type (92.6%), and do not have Gpc-B1 (86.8%); this latter gene is carried only by 1/3 of the spelta accessions (with few other exceptions). VRND4 was detected only in sphaerococcum at 92%, as already observed by Kippes et al. (2015) (Table 3). Eleven genes with effects on yield-related traits were tested, for some of which a significant correlation between a specific allelic variant (favorable allele) and an increase in TGW or grain number/size is known from the literature (Supplementary Table S3).
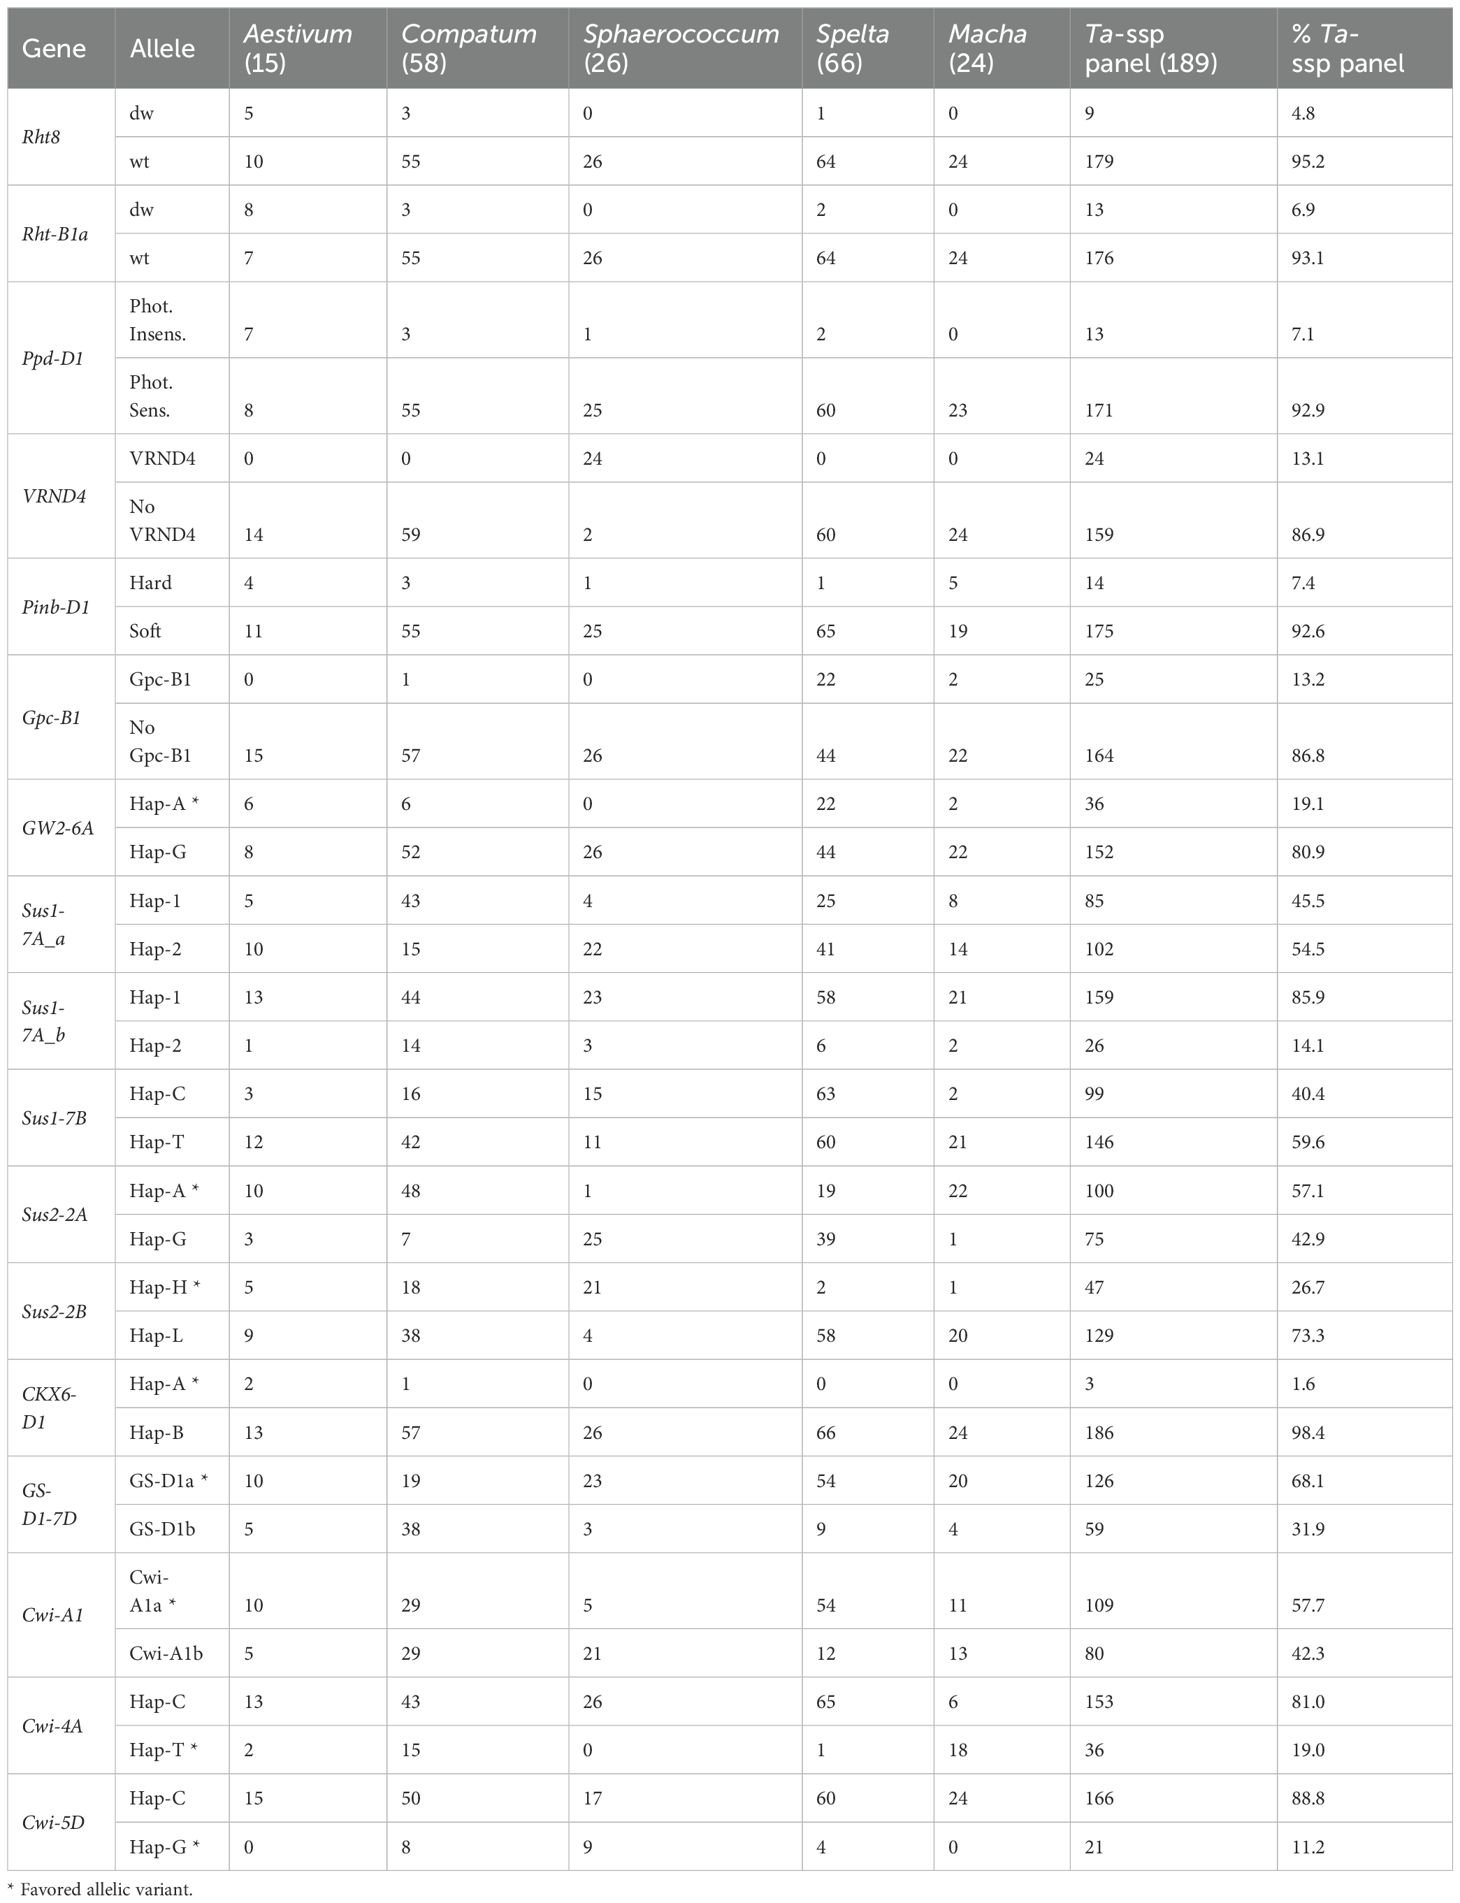
Table 3. Distribution of the alternative allelic variants at known genes among the accession intra-subspecies (ssp. vavilovii is not included) and in the Ta-ssp panel (expressed in %).
The majority of panel accessions carry the same allelic variant for many of these genes, and it is usually not the favorable one (highlighted with asterisk in Table 3) is the same for most of the panel, with only two exceptions: Sus2-2A and GS-D1-7D, for which the favorable alleles Hap-A (higher TGW) and GS-D1a (higher TGW and longer grain) are present in 57.1%, and 68.1% of the panel, respectively. The predominant allele, for each individual gene, turns out to be the same within the different subspecies as well, except for the predominance of Hap-1 for Sus1-7A in compactum, Hap-G for Sus2-2A in sphaerococcum and spelta, Hap-H for Sus2-2B in sphaerococcum, GS-D1b for GS-D1-7D in compactum, and Hap-T for Cwi-4A in macha.
3.3 SNP markers and physical coverage
Genotyping of the 190 wheat accessions with two Illumina arrays (20K and 25K) resulted in a raw dataset of 24,398 SNP markers that were filtered for MAF (≥5%) and missing data (≤10%). Moreover, those markers that failed in all genotypes were removed (461), resulting in a set of 20,729 useful SNPs. All genotypes were retained since none of them had more than 5% of the missing data.
For the analysis of genetic diversity, 6,088 other markers were excluded, owing to the absence of a hit or no unique map position according to the reference genome sequence of Chinese Spring RefSeq v2.1 (https://urgi.versailles.inra.fr/blast_iwgsc/). A total of 14,640 informative SNPs were retained (Supplementary Table S7A) distributed on the homoeologous genomes in this way: 41% on the A-genome, 46% on the B-genome, and 13% on the D-genome.
The total physical distance covered by these markers was 14,105.3 Mb (the real length of reference wheat genome is 14,462.2 Mb), with chromosome 6D having the lowest coverage (493.8 Mb on 503.6 Mb) and chromosome 3B having the highest (851.8 Mb on 866.1 Mb). Genomes A and B show 1 SNP per 0.83 Mb and 0.78 Mb, respectively, while the interval between two consecutive SNPs on genome D was higher: 1.99 Mb on average and up to 5.3 Mb on chromosome 4D. The highest number of markers was detected in chromosomes 5B, 3B, and 1B (1,158, 1,127, and 1,082 SNPs, respectively), whereas chromosomes 4D and 3D showed the lowest number of located loci (97 and 212, respectively; Supplementary Table S7B).
3.4 Population structure and linkage disequilibrium
Several methods were used to investigate the population structure of the Ta-ssp panel. The results of the N-J, PCoA, and structure analyses are shown in Figure 2. The most likely structure model assigned 181 accessions (corresponding to 95.3% of the panel) to two clusters (Supplementary Figure S2): K2, containing most of the spelta accessions (81.8%) plus the single vavilovii (red cluster), and K1, which included the other four subspecies (green cluster) (Figure 2A and Supplementary Table S1). A small percentage (4.7%) of accessions were admixed: four spelta, four compactum, and one aestivum.
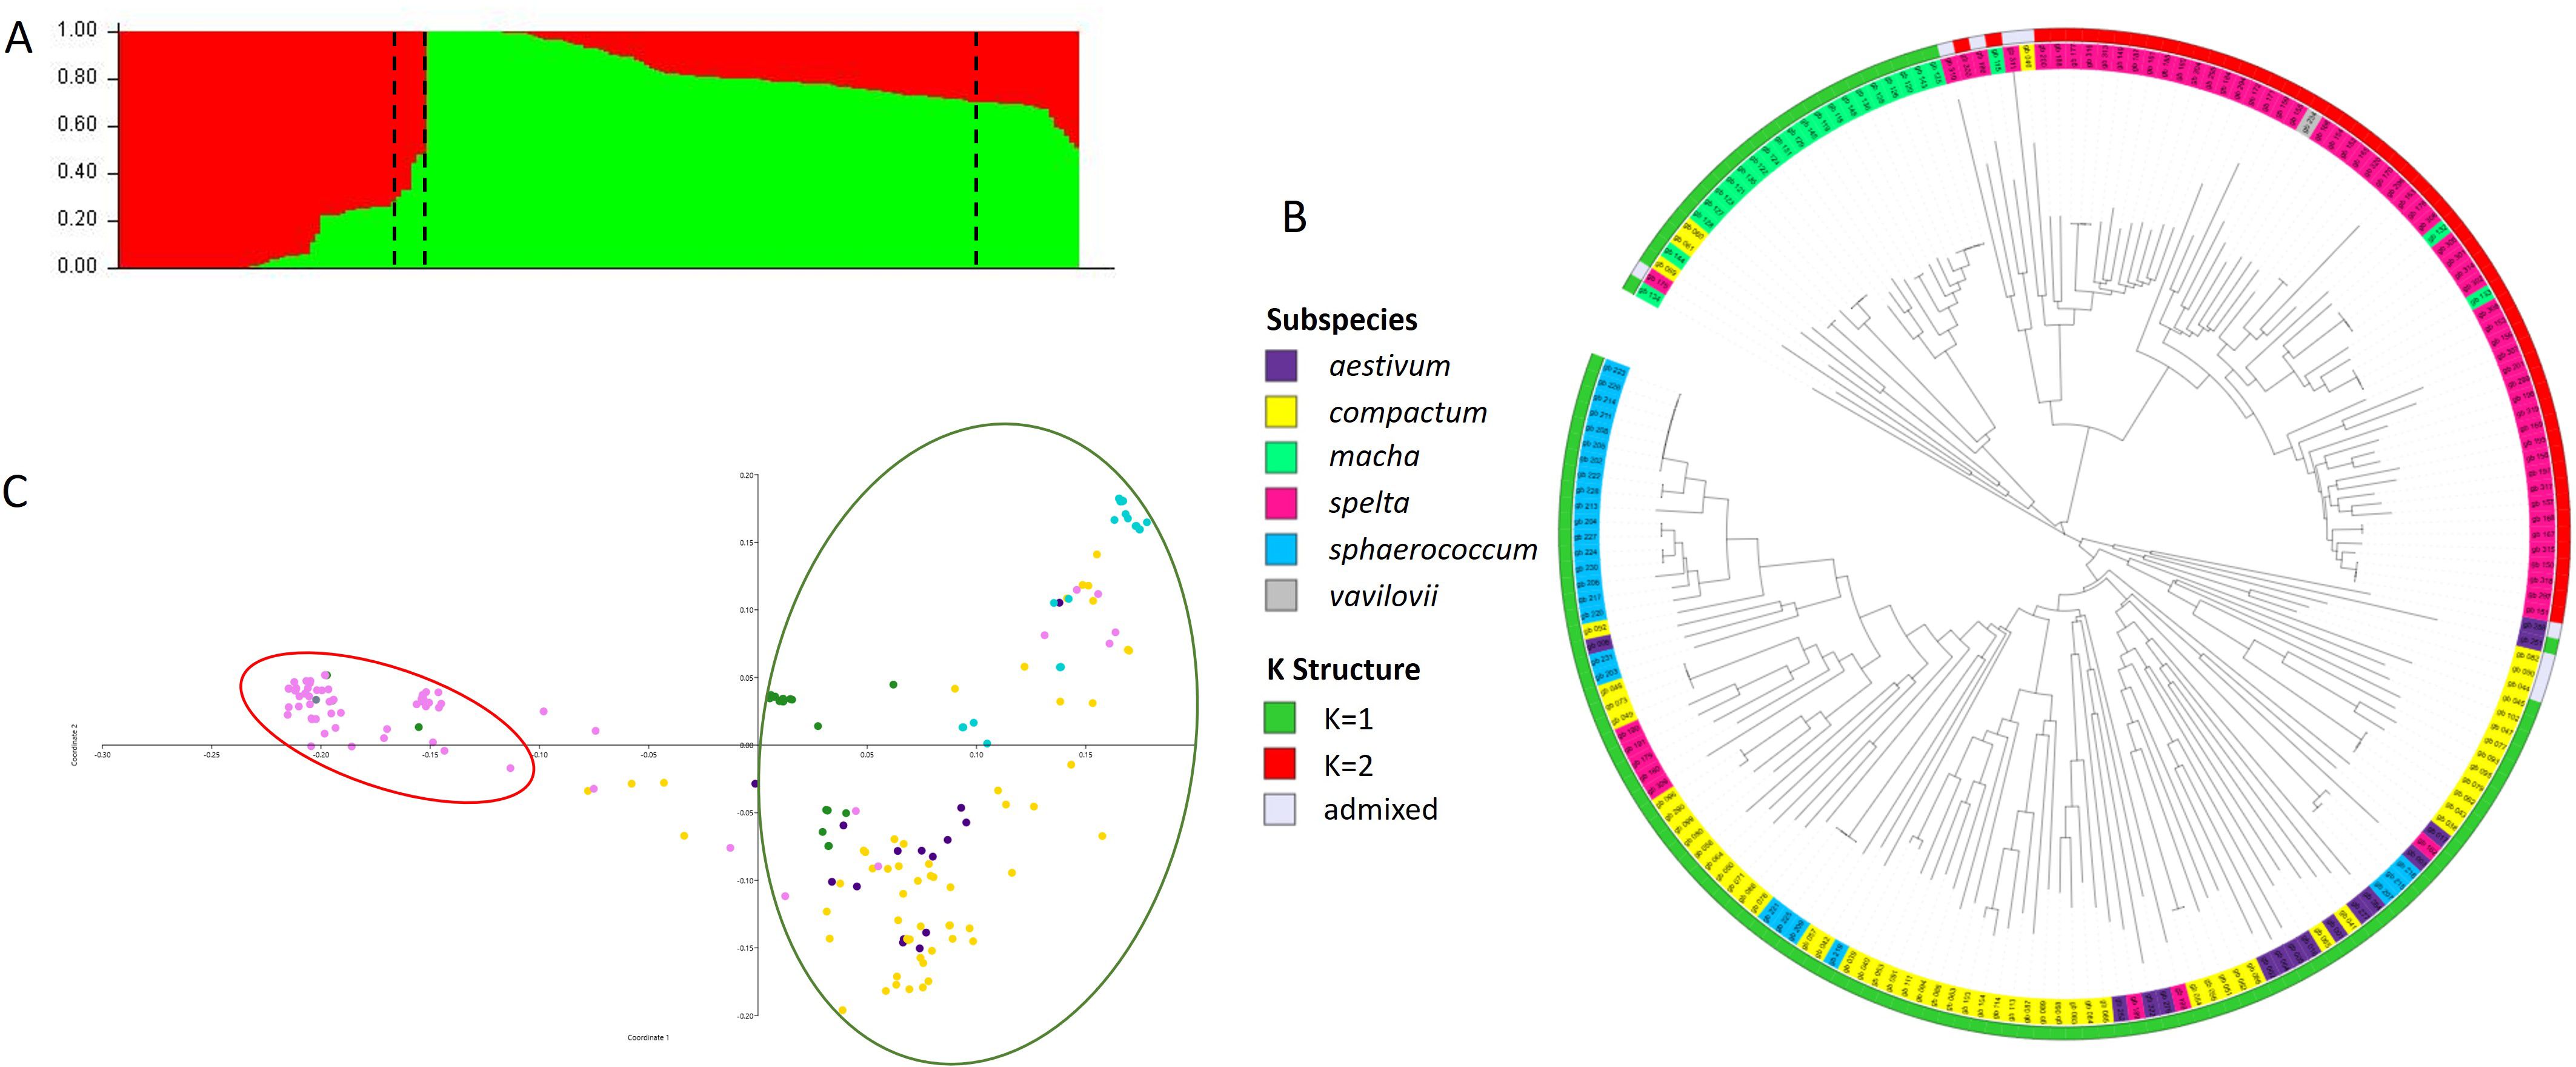
Figure 2. Analysis of population structure of the Ta-ssp panel. (A) Population structure based on STRUCTURE when K = 2. (B) Neighbor-joining tree and (C) PCoA (the clustering in the legend is based on the subspecies and the STRUCTURE analysis).
The clustering derived from the N-J tree (Figure 2B) is only partly overlapped to structure analysis. Three main roots were highlighted, one of which corresponds entirely to K2 and all spelta (except for eight accessions, the only ones of Asian origin—Afghanistan, Iran, and Tajikistan), while K1 is divided into two roots, one of which includes 87.5% of the macha accessions, plus three compactum, while the other one contains all sphaerococcum and most of the compactum along with the few remaining aestivum. As for PCoA, the first two principal coordinates accounted for 22.88% and 10.83% of the molecular variance of the panel, respectively, showing clustering consistent with that suggested by structure (Figure 2C). The extent of LD was calculated using 3,362 SNPs for subgenome A, 3,787 SNP for subgenome B, and 1,316 SNPs for subgenome D. Based on a critical threshold of r2 value of 0.2, the LD decay distance on all chromosomes in the Ta-ssp panel was approximately 378.6 Kb, which is the average value over the 21 chromosomes (Table 4, Figure 3, and Supplementary Figure S3). A heterogeneous distribution was observed among the different genomes: the highest LD decay distance of 750 Kb was found in subgenome D, while subgenomes A and D have a lower and similar LD decay distance of 178.6 and 207.1 Kb, respectively.
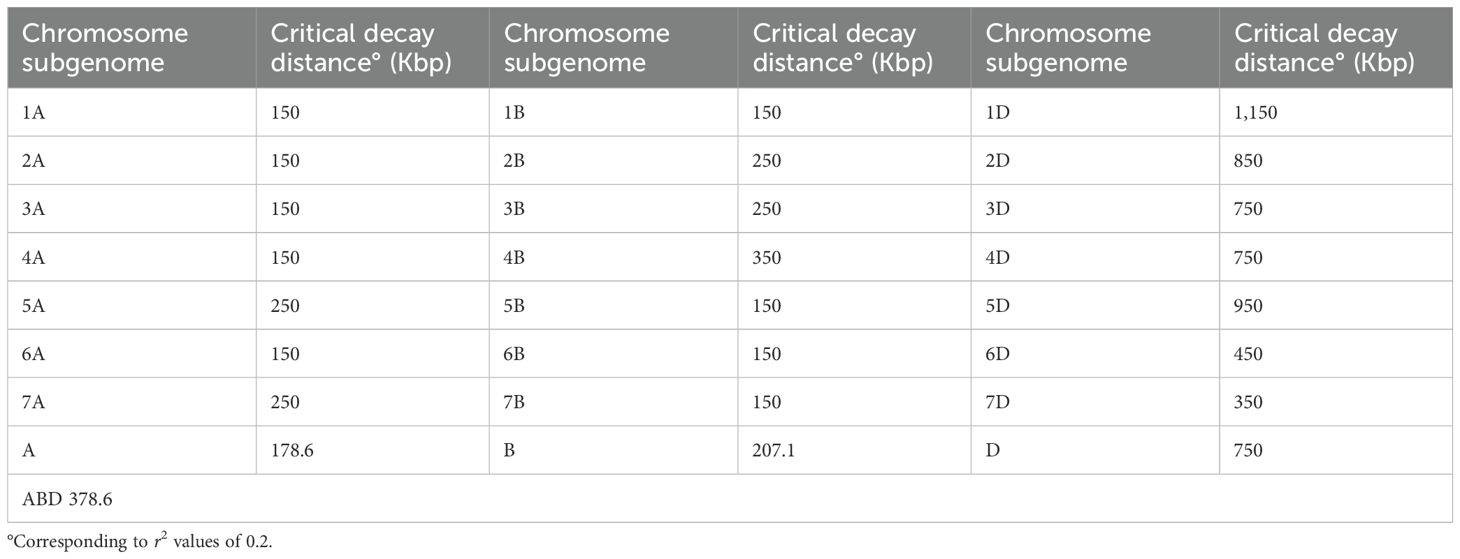
Table 4. Analysis of chromosome-wise and genome-wise LD decay.
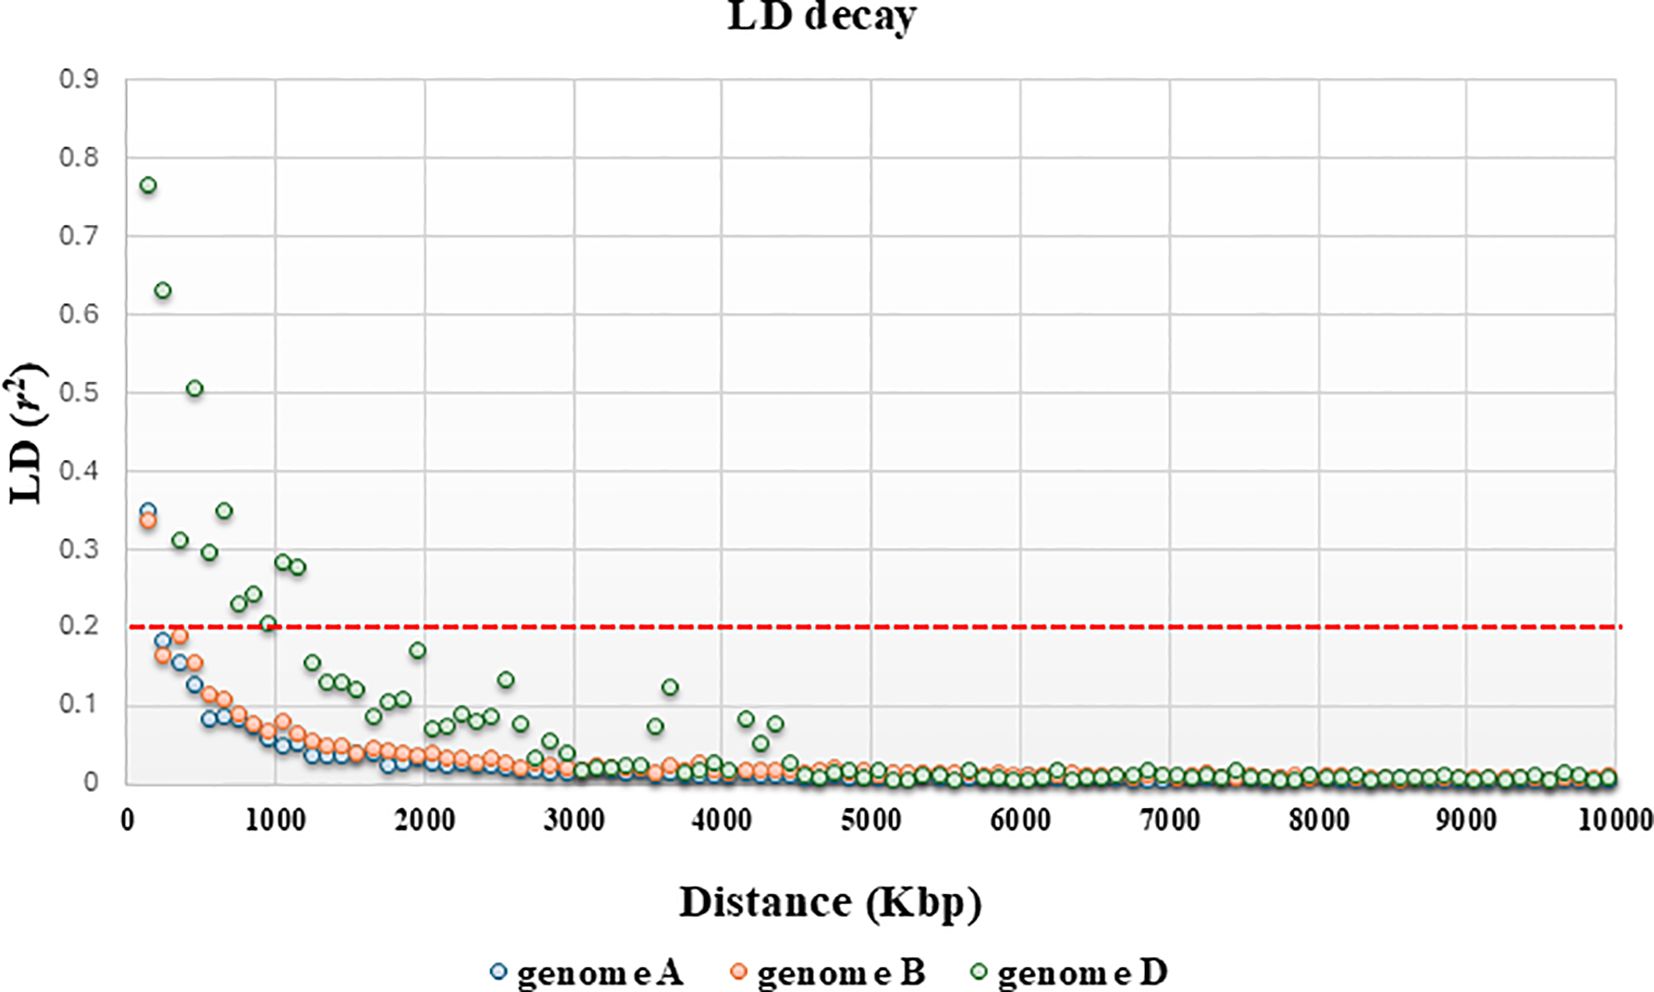
Figure 3. Genome-wide LD decay across A, B, and D subgenomes of hexaploid wheat: a focus along a distance of 10,000 bp. The Y-axis represents squared correlation coefficients (r2) and the values of X-axis depict genetic distance in Kbp. The horizontal red line shows the threshold r2 value for unlinked markers.
3.5 Association analysis
The output of GWAS was depicted in Manhattan plots for each trait in Supplementary Figure S4 and summarized in Supplementary Table S8, in which all MTAs found to be linked to a given trait with a −log10 (p-value) ≥ 3.5 were listed with those SNPs together with colocalization with MTAs, QTL (quantitative trait locus), or genes known in literature to be linked with the same traits. MTA regions were identified according to the LD decay calculated for each chromosome and are listed in Table 5, defined as trait acronym.chr number/region number. The number of MTAs included in the region was reported, besides the peak marker.
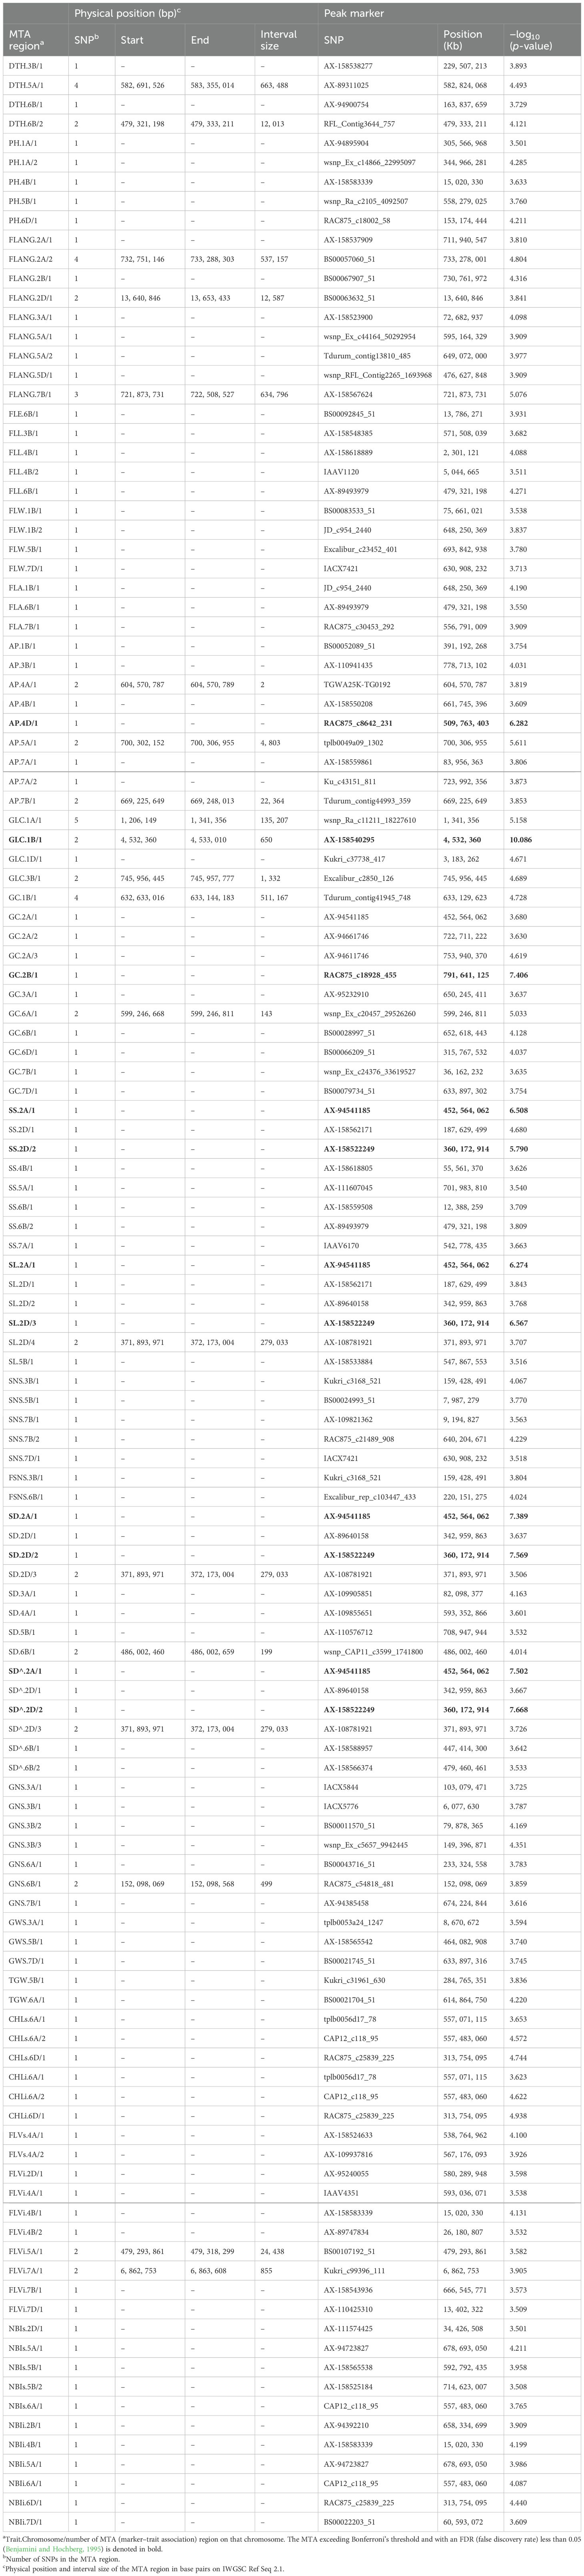
Table 5. Summary of the marker–trait association regions.
The GWAS on DTH resulted in four associated regions on three different chromosomes (3B, 5A, and 6B) with a −log10 (p-value) ranging from 3.729 to 4.493.
The GWAS detected 58 associated regions for morphology-related traits (AP, PH, FLANG, FLE, FLL, FLW, FLA GLC, GC, and SS): five MTAs resulted in being highly significant over Bonferroni threshold (in bold in Table 5).
A total of 39 MTA regions were detected for yield-related traits. Spike length and spike density (calculated by both methods, see Material and Methods) shared four MTA regions, two of them on chromosomes 2A and 2D identified by strongly associated peak markers (over Bonferroni significance): AX-94541185 and AX-158522249, respectively. The MTA associated with FSNS (at 159.4 Mb on chromosome 3B) was also detected for FSNS. Among the regions identified for spike density, measured by two different methods, there was a match between four MTA regions, two of which had a highly significant −log10 (p-value), greater than 7: that on chromosome 2A (at 452.6 Mb; AX-94541185) and that on chromosome 2D at 360.2 Mb (AX-158522249).
For physiological traits, the analysis yielded a total of 25 associated regions. CHLs and CHLi shared the same two MTA regions on chromosomes 6A and 6D, at 557.5 Mb and 313.8 Mb, respectively. Peak markers of MTA regions associated with multiple traits are summarized in Supplementary Table S9, and high-confidence (HC) genes located within the chromosome-specific LD (upstream and downstream) were identified and reported alongside their functional annotation on IWGSC RefSeq v2.1.
4 Discussion
4.1 Population structure of the subspecies collection
The hexaploid subspecies of bread wheat, apart from ssp. aestivum, have not undergone intensive selection, having been grown in isolated and not particularly attractive environments, so they can still exhibit a broad range of variation for many traits. There is a wealth of studies on GWAS in wheat, as summarized in Saini et al. (2022), but so far none has included such a significant number of accessions belonging to different hexaploid subspecies. Only Abrouk et al. (2021) investigated by association mapping a germplasm of 102 Central European spelt accessions, but only for the glume color trait. The panel set up in this study represents the first comprehensive resource of different hexaploidy subspecies, and it represents a valuable reservoir of new alleles and genes that are largely unexploited and potentially useful for wheat improvement.
The genotyping of our Ta-ssp panel resulted in the identification of 14,640 SNPs with a physical position on the Chinese Spring RefSeq v2.1 Reference genomic sequence. The distribution of these markers on the genome and among the subgenomes was consistent with previous studies (Aleksandrov et al., 2021; Balfourier et al., 2019; Leonova et al., 2020; Pang et al., 2020), as well as the lower coverage of subgenome D that is likely due to the latter’s low representation in the 25K SNP array (Rimbert et al., 2018) as a consequence of its known low polymorphism (Pont et al., 2019).
Results from the three clustering methods (N-J tree, PCoA, and structure analysis) showed the presence of two subpopulations: K2 comprising the spelta and K1 comprising the other remaining subspecies. Notably, spelta of Asian origin (a total of five accessions, from Afghanistan, Tajikistan, and Iran) were separated from all the others as previously observed by Abrouk et al. (2021) and Hyun et al. (2020) and were clustered in K1 among ssp. compactum. These strong differences between Asian and European spelt wheats had already been pointed out (Abrouk et al., 2021). In addition, the two roots in K2 divide the group spelt from the Iberian Peninsula (eight accessions) from those of Central Europe, again in agreement with Abrouk’s study (2021). Ssp. macha, the other spelt form, although found in K1, is grouped in a separate root of the N-J tree and is closer to European spelta than to other subspecies. Integration of genotyping data from the present study with those from emmer wheat and common wheat collections representative of genetic diversity could direct future sequencing projects aimed at unraveling the evolutionary dynamics existing among different hexaploid subspecies and with tetraploid genome donors. The few aestivum accessions considered in this study, which were not selected for this purpose, do not allow us to elucidate these relationships at present.
4.2 Significant associations in the GWAS and comparison with previous studies
The GWAS analysis, performed with correction for the population structure, includes all polymorphic markers (20,729) and not only those physically mapped (14,640) through a very stringent BLAST analysis.
The pairwise LD (r2) calculated for the Ta-ssp panel decayed to a value of less than 0.2 (generally assumed as an r2 value between unlinked loci) at 378.6 Kb (as the average value across all chromosomes and genomes). This very short decay is somewhat expected in such a diverse panel, composed of landraces and wilds and not or only partially subjected to breeding; it is closer to that observed in einkorn (176 Kb, Volante et al., 2021) and in wild emmer (126 Kb, Mastrangelo et al., 2023) than to that in cultivated/modern common wheat (6.6 Mb in Hu et al., 2021; 5.8 Mb in Mazumder et al., 2024).
Since different subspecies were analyzed together, considerable phenotypic variability was observed in the Ta-ssp panel, especially for DTH, PH, FLA, SL, GS, and SD^. Significant effects were found for the year factor, that is why we decided to perform a GWAS analysis with the across-year BLUPs and maintain a threshold of −log10 (p-value) at medium stringency (≥3.5) for defining the associated MTAs. The marker set employed in this study allowed the identification of many loci associated with the measured traits. MTA regions were identified based on the LD decay of each individual chromosome. The rapid decay led, in some cases, to the definitions of MTAs that were quite close to each other: to exclude the idea that the linkage between these regions had been underestimated by using the chromosome mean LD value, LD between markers of the next MTA region was inspected.
These associated regions were inspected for colocalization with MTAs/QTL/genes with a known function previously identified in common wheat. The literature survey resulted in several overlaps reported in Supplementary Table S8.
The DTH.5A/1 locus (582.7 Mb to 583.4 Mb) identified by the peak marker AX-89311025 was located near the vernalization gene Vrn-A1 (589.3 Mb).
The AP.5A/1 region on chromosome 5A (700.3–700.3 Mb) has been mapped in close proximity to the B1 locus (698.7 Mb; Li et al., 2023), one of the dominant inhibitory genes for awn development in wheat, while the AP.5 B/1 on chromosome 5B (598.5-598.6 Mb; tplb0049a09_1302) is not far from AX-95632082, a marker previously linked to the presence of awn (607.7 Mb, Sheoran et al., 2019).
In detail, the peak marker of GLC.1B/1, AX-158540295 (4.5 Mb), which is highly correlated [−log10 (p-value) ≥ 10] with glume color, maps at the same location as AX-94980178 already associated with the same trait on chromosome 1B (Sheoran et al., 2019). The SL.5B/1 region defined by the peak marker AX-158533884 at 547.9 Mb is next to BS00087043_51 at 553.5 Mb already associated with spike length by Anuarbek et al. (2020).
The MTA SNS.7B/2 at 640.2 Mb (RAC875_c21489_908) is not far from an MTA previously identified for the same trait at 645.0 Mb (Muqaddasi et al., 2019). The Excalibur_c23452_401 marker on chromosome 5B at 693.8 Mb found to be associated with FLW is very close to an MQTL identified at 670.5–690.2 Mb by Kong et al. (2023) for the same leaf trait.
The colocalization between some of the MTAs observed in this study and some reported in previous GWAS supports the reliability of our analysis; on the other hand, the fact that, for most MTAs, there is no support from literature data suggests that the panel employed carries loci that are novel and therefore of potential interest.
4.3 Genomic regions affecting multiple traits
Specific attention was dedicated to MTA regions shared by several traits (Supplementary Tables S8, S9). Along chromosome 2D, there are four distinct MTA regions associated with three components of spike morphology that are strongly related to grain yield in wheat: spike shape, density, and length (Upadhyay, 2020; Liu et al., 2022; Halder et al., 2023). At 187.7 Mb, the SNP AX-158562171 is associated with SS and SL, while AX-89640158 (343 Mb), AX-158522249 (360.2 Mb), and AX-108781921 (371.9 Mb) are associated with SL, SD, and SD^. These three latter regions are of great interest, especially the MTA defined by AX-158522249, which resulted in being highly significant (exceeding the Bonferroni threshold) for all traits, including also SS (directly related with spike density). This MTA region corresponds to the genetic location of gene C, the locus responsible for spike compactness with strong effects on other key targets, such as the shape and size of spikes and the number of grains per spike. The C gene has been initially reported to map to the centromeric interval, and this has greatly hindered its physical mapping, discouraging potential gene cloning of it. By QTL mapping, Wen et al. (2022) mapped this gene more distal from the centromeric region but still in a quite wide interval along the 2D chromosome (370.12–406.29 Mb). Our GWAS approach, thanks to the small LD of the Ta-ssp panel characterized by multiple recombination events among numerous compact and non-compact accessions, resulted in a better definition of the interval around the C gene (1.7 Mb; 359.3 Mb–361 Mb). This region is very promising as a starting point for the isolation of the C gene through a map-based cloning method.
Another MTA (AX-94541185) shared between the same traits (SS, SL, SD, and SD^) with a very high significance was detected on chromosome 2A with no correspondence with any other region already detected in literature, as far as we know. In 2022, Yu et al. performed a genetic dissection of major QTL, in a bi-parental population, for spike compactness and length on homology group 2, but none of them overlap or are in the proximity of the novel regions that we identified here.
Other interesting MTA regions are on chromosome 1B at 648.2 Mb (JD_c954_2440 640) associated with FLL and FLA; on chromosome 6B at 479.3 Mb (AX-89493979) associated with FLL, FLA, and SS; and on chromosome 7D at 631 Mb (IACX7421) associated with both spikelet number per spike and spike flag leaf width. Finally, the two MTAs identified by CHLs, CHLi, and NBI on chromosomes 6A and 6D (at 557 and 313.8 Mb, respectively) are also noteworthy.
Generally, the traits assigned to the same genomic regions are supported by significant Pearson correlation values (Supplementary Table S5: significant positive or negative correlations were highlighted in blue and red, respectively), suggesting their regulation by multiple co-effect loci.
These regions could be the results of pleiotropic effects or robust physical linkage between underlying genes and deserve further investigations, a deeper genetic dissection, and candidate gene investigation.
Among the peak markers of the identified regions, some were fixed only in one subspecies, usually macha or sphaerococcum. For instance, all sphaerococcum carry the unfavorable allelic variant at GNS.3B/2 associated with fewer seeds per spike. Given the subspecies characteristics, these apparently obvious remarks support the reliability of our analyses.
Noteworthy is the GNS.6A/1 locus that identifies a novel MTA related to the number of seeds per spike, found in both 2021 and 2022. The peak marker of this MTA, BS00043716_51, segregates exclusively in compactum accessions. The number of grains per spike is significantly higher in those compactum accessions bringing the allelic variant “C” (89.8 and 78.8 in 2021 and 2022, respectively) compared to those with “T” (62.4 and 58.8), and to all the other subspecies (44.3 and 44.8, in 2021 and 2022, respectively) with the unfavorable allele “T”. The compactum accessions carrying this favorable allele “C” for GNS also showed higher grain weight per spike (GWS) (2.8 g, 2021–2022 mean value), compared to those with “T” (2.2 g) and to all the other subspecies (1.7 g). GNS correlated positively and significantly with GWS (0.83) in this study, but we did not find any significant MTA for GWS on chromosome 6A.
We identified two potential candidate genes underlying this GNS.6A/1 locus. One is TaGW2-6A, a gene encoding a ubiquitin ligase that negatively controls controlling grain size and weight (Geng et al., 2017) located on chromosome 6A at 240 Mb, not far from the peak marker of GNS.6A/1 (BS00043716_51) that maps at 233 Mb. The second potential candidate is the gene TraesCS6A03G0476500, which includes BS00043716_51 (Raw ID: TraesCS6A02G188700, chr6A: 233 324 244–233 328 477). This gene encodes for a monosaccharide-sensing protein 2 known to act in rice as a vacuolar transporter of glucose (Cho et al., 2010) and with a pivotal role in plant growth and development. According to the Wheat eFP Browser, the expression pattern of TraesCS6A03G0476500 localizes in the shoot meristem, spike, and seed, with highest values in the endosperm. These observations point out the potential role of this gene in the determination of grain number per spike.
Taken together, these data, despite needing further investigation, confirm the potentiality hidden in the wheat subspecies for key traits related to yield potential.
5 Conclusion
The genetic and phenotypic characterization carried out in this work revealed the genetic basis underlying the hidden diversity for many agronomic traits present in wheat subspecies. A combination of favorable alleles for traits such as SL, GNS, SD, GWS, and TGW could assist the selection of accessions for pre-breeding purposes, as well as an effective deployment of new valuable genes or alleles into modern breeding varieties.
In addition, optimization of leaf shape traits, together with its spatial arrangement, and a high chlorophyll content could reduce individual response to shading and improve photosynthetic efficiency, thereby increasing yield. Further characterization of this genetic resource for resistance to biotic and abiotic stress is underway, in natural and controlled conditions, as a strategic step for efficient exploitation of this material in pre-breeding programs. Novel candidate genomic loci underlying several agronomic traits have been identified in hexaploid subspecies that, once validated, could leave alternative clues for the wheat research and breeding community. Genomic regions controlling multiple traits have also been identified that could be exploited for pyramiding favorable alleles for key traits related to yield.
Data availability statement
The datasets related on the phenotypic data of four field trials, BLUP values and the hapmap used for GWAS presented in this study available at figshare: https://doi.org/10.6084/m9.figshare.27931290.
Author contributions
DB: Conceptualization, Formal analysis, Investigation, Methodology, Writing – original draft, Writing – review & editing. AV: Formal analysis, Writing – review & editing. PF: Methodology, Writing – review & editing. AP: Formal analysis, Writing – review & editing. IT: Formal analysis, Writing – review & editing. EM: Methodology, Writing – review & editing. LC: Writing – review & editing.
Funding
The author(s) declare that financial support was received for the research and/or publication of this article. This study was supported by grants from Joint FACCE-JPI Suscrop 2022 “WheatSecurity” (Identification and sustainable deployment of wheat genetic diversity to enhance the resilience and security of the European food supply), DM.142692.
Conflict of interest
The authors declare that the research was conducted in the absence of any commercial or financial relationships that could be construed as a potential conflict of interest.
The author(s) declared that they were an editorial board member of Frontiers, at the time of submission. This had no impact on the peer review process and the final decision.
Generative AI statement
The author(s) declare that no Generative AI was used in the creation of this manuscript.
Publisher’s note
All claims expressed in this article are solely those of the authors and do not necessarily represent those of their affiliated organizations, or those of the publisher, the editors and the reviewers. Any product that may be evaluated in this article, or claim that may be made by its manufacturer, is not guaranteed or endorsed by the publisher.
Supplementary material
The Supplementary Material for this article can be found online at: https://www.frontiersin.org/articles/10.3389/fpls.2025.1536991/full#supplementary-material
References
Abrouk, M., Athiyannan, N., Müller, T., Pailles, Y., Stritt, C., Roulin, A. C., et al. (2021). Population genomics and haplotype analysis in spelt and bread wheat identifies a gene regulating glume color. Commun. Biol. 4, 375. doi: 10.1038/s42003-021-01908-6
Aleksandrov, V., Kartseva, T., Alqudah, A. M., Kocheva, K., Tasheva, K., Börner, A., et al. (2021). Genetic diversity, linkage disequilibrium and population structure of Bulgarian bread wheat assessed by genome-wide distributed SNP markers: from old germplasm to semi-dwarf cultivars. Plants 31, 1116. doi: 10.3390/plants10061116
Anuarbek, S., Abugalieva, S., Pecchioni, N., Laidò, G., Maccaferri, M., Tuberosa, R., et al. (2020). Quantitative trait loci for agronomic traits in tetraploid wheat for enhancing grain yield in Kazakhstan environment. PloS One 23, e0234863. doi: 10.1371/journal.pone.0234863
Balfourier, F., Bouchet, S., Robert, S., De Oliveira, R., Rimbert, H., Kitt, J., et al. (2019). Worldwide phylogeography and history of wheat genetic diversity. Sci. Adv. 5, eaav0536. doi: 10.1126/sciadv.aav0536
Bates, D., Mächler, M., Bolker, B., Walker, S. (2015). Fitting linear mixed-effects models using lme4. J. Stat. Software 67, 1–48. doi: 10.18637/jss.v067.i01
Bedoshvili, D., Mosulishvili, M., Chkhutiashvili, G., Maisaia, I., Ustiashvili, N., Merabishvili, M. (2021). Diversity and local use of wheat in Georgia. J. Nat. Stud. - Ann. Agrar. Sci. 19 (2). Available online at: https://journals.org.ge/index.php/aans/article/view/245.
Benjamini, Y., Hochberg, Y. (1995). Controlling the false discovery rate: A practical and powerful approach to multiple testing. J. R. Stat. Soc. Ser. B Methodol. 57, 289–300. doi: 10.1111/j.2517-6161.1995.tb02031.x
Blatter, R. H. E., Jacomet, S., Schlumbaum, A. (2004). About the origin of European spelt (Triticum spelta L.): allelic differentiation of the HMW Glutenin B1-1 and A1-2 subunit genes. Theor. Appl. Genet. 108, 360–367. doi: 10.1007/s00122-003-1441-7
Bradbury, P. J., Zhang, Z., Kroon, D. E., Casstevens, T. M., Ramdoss, Y., Buckler, E. S. (2007). TASSEL: software for 485 association mapping of complex traits in diverse samples. Bioinform 23, 2633–2635. doi: 10.1093/bioinformatics/btm308
Cao, W. G., Scoles, G., Hucl, P., Chibbar, R. N. (2000). Phylogenetic relationships of five morphological groups of hexaploid wheat (Triticum aestivum L. em Thell.) based on RAPD analysis. Genome 43, 24–727. doi: 10.1139/g00-030
Cartelat, A., Cerovic, Z. G., Goulas, Y., Meyer, S., Lelarge, C., Prioul, J.-L., et al. (2005). Optically assessed contents of leaf polyphenolics and chlorophyll as indicators of nitrogen deficiency in wheat (Triticum aestivum L.). Field Crops Res. 91, 35–49. doi: 10.1016/j.fcr.2004.05.002
Cho, J. I., Burla, B., Lee, D. W., Ryoo, N., Hong, S. K., Kim, H. B., et al. (2010). Expression analysis and functional characterization of the monosaccharide transporters, OsTMTs, involving vacuolar sugar transport in rice (Oryza sativa). New Phytol. 186, 657–668. doi: 10.1111/j.1469-8137.2010.03194.x
Chrpová, J., Grausgruber, H., Weyermann, V., Buerstmayr, M., Palicová, J., Kozová, J., et al. (2021). Resistance of Winter Spelt Wheat [Triticum aestivum subsp. spelta (L.) Thell.] to Fusarium Head Blight. Front. Plant Sci. 12. doi: 10.3389/fpls.2021.661484
Cleveland, W. S. (1979). Robust locally weighted regression and smoothing scatter plots. J. Am. Stat. Assoc. 74, 829–836. doi: 10.1080/01621459.1979.10481038
Dorofeev, V. F. (1972). Wheats of the transcaucasus. Proc. Appl. Bot. Genet. Plant Breed. 47, 3–206.
Dorofeev, V. F., Filatenko, A. A., Migushova, E. F., Udachin, R. A., Jakubtsiner, M. M. (1979). Cultivated flora of the USSR. Wheat. Leningrad Russia. 1, 7–31.
Dvorak, J., Deal, K. R., Luo, M. C., You, F. M., von Borstel, K., Dehghani, H. (2012). The origin of spelt and free-threshing hexaploid wheat. J. Hered. 103, 426–441. doi: 10.1093/jhered/esr152
Earl, D., von Holdt, B. (2011). STRUCTURE HARVESTER: a website and program for visualizing TRUCTURE output and implementing the Evanno method. Conserv. Genet. Resour. 4, 359. doi: 10.1007/s12686-011-9548-7
El-Esawi, M. A., Elashtokhy, M. M. A., Shamseldin, S. A. M., El-Ballat, E. M., Zayed, E. M., Heikal, Y. M. (2023). Analysis of genetic diversity and phylogenetic relationships of wheat (Triticum aestivum L.) genotypes using phenological, molecular and DNA barcoding markers. Genes 22, 14(1):34. doi: 10.3390/genes14010034
Evanno, G., Regnaut, S., Goudet, J. (2005). Detecting the number of clusters of individuals using the software STRUCTURE: a simulation study. Mol. Ecol. 14, 2611–2620. doi: 10.1111/j.1365-294x.2005.02553.x
Fan, X., Cui, F., Ji, J., Zhang, W., Zhao, X., Liu, J., et al. (2019). Dissection of pleiotropic QTL regions controlling wheat spike characteristics under different nitrogen treatments using traditional and conditional qtl mapping. Front. Plant Sci. 10. doi: 10.3389/fpls.2019.00187
Faris, J. D., Zhang, Z., Garvin, D. F., Xu, S. S. (2014). Molecular and comparative mapping of genes governing spike compactness from wild emmer wheat. Mol. Genet. Genomics 289, 641–651. doi: 10.1007/s00438-014-0836-2
Fu, Y.-B. (2015). Understanding crop genetic diversity under modern plant breeding. Theor. Appl. Genet. 128, 2131–2142. doi: 10.1007/s00122-015-2585-y
Geng, J., Li, L., Lv, Q., Zhao, Y., Liu, Y., Zhang, L., et al. (2017). TaGW2-6A allelic variation contributes to grain size possibly by regulating the expression of cytokinins and starch-related genes in wheat. Planta 246, 1153–1163. doi: 10.1007/s00425-017-2759-8
Gogna, A., Schulthess, A. W., Röder, M. S., Ganal, M. W., Reif, J. C. (2022). Gabi wheat a panel of European elite lines as central stock for wheat genetic research. Sci. Data 9, 538. doi: 10.1038/s41597-022-01651-5
Grausgruber, H. (2018). “Sorting the wheat from the chaff: Comments on the spelt [:wheat] discussion,” in Proceedings of a Congress. Proceedings of the 68. Tagung der Vereinigung der Pflanzenzüchter und Saatgutkaufleute Österreichs 2017. (Tulln: Universität für Bodenkultur Wien), 69–74.
Halder, J., Gill, H. S., Zhang, J., Altameemi, R., Olson, E., Turnipseed, B., et al. (2023). Genome-wide association analysis of spike and kernel traits in the U.S. hard winter wheat. Plant Genome 16, e20300. doi: 10.1002/tpg2.20300
Hammer, O., Harper, D., Ryan, P. (2001). PAST: paleontological statistics software package for education and data analysis. Palaeontol. Electron. 4, 1–9.
Hu, P., Zheng, Q., Luo, Q., Teng, W., Li, H., Li, B., et al. (2021). Genome-wide association study of yield and related traits in common wheat under salt-stress conditions. BMC Plant Biol. 21, 27. doi: 10.1186/s12870-020-02799-1
Hyun, D. Y., Sebastin, R., Lee, K. J., Lee, G. A., Shin, M. J., Kim, S. H., et al. (2020). Genotyping-by-sequencing derived single nucleotide polymorphisms provide the first well-resolved phylogeny for the genus triticum (Poaceae). Front. Plant Sci. 17. doi: 10.3389/fpls.2020.00688
Johnson, E. B., Nalam, V. J., Zemetra, R. S., Riera-Lizarazu, O. (2008). Mapping the compactum locus in wheat (Triticum aestivum L.) and its relationship to other spike morphology genes of the Triticeae. Euphytica 163, 193–201. doi: 10.1007/s10681-007-9628-7
Kerber, E. R., Rowland, G. G. (1974). Origin of the free threshing character in hexaploid wheat. Can. J. Genet. Cytol. 16, 145–154. doi: 10.1139/g74-014
Kippes, N., Debernardi, J. M., Vasquez-Gross, H. A., Akpinar, B. A., Budak, H., Kato, K., et al. (2015). Identification of the VERNALIZATION 4 gene reveals the origin of spring growth habit in ancient wheats from South Asia. Proc. Natl. Acad. Sci. 112, E5401–E5410. doi: 10.1073/pnas.1514883112
Kong, B., Ma, J., Zhang, P., Chen, T., Liu, Y., Che, Z., et al. (2023). Deciphering key genomic regions controlling flag leaf size in wheat via integration of meta-QTL and in silico transcriptome assessment. BMC Genom. 24, 33. doi: 10.1186/s12864-023-09119-52023
Kuckuck, H. (1964). Experimentelle Untersuchungen zur Entstehung der Kulturweizen, I. Die variation des Iranischen Spelzweizens und seine genetische Beziehung zu Triticum aestivum ssp. vulgare (Vill. Host) Mac Key, ssp. spelta (L.) Thell. und ssp. macha (Dek. et Men.) Mac Key mit einem Beitrag zur Genetik des Spelta-Komplexes. Z. Planzenzücht 51, 97–140.
Kumar, S., Stecher, G., Tamura, K. (2016). MEGA7: molecular evolutionary genetics analysis version 7.0 for bigger datasets. Mol. Biol. Evol. 33, 1870–1874. doi: 10.1093/molbev/msw054
Leonova, I. N., Skolotneva, E. S., Salina, E. A. (2020). Genome-wide association study of leaf rust resistance in Russian spring wheat varieties. BMC Plant Biol. 20, 135. doi: 10.1186/s12870-020-02333-3
Li, J., Xin, X., Sun, F., Zhu, Z., Xu, X., Yang, J., et al. (2023). Copy number variation of B1 controls awn length in wheat. Crop J. 11, 817–824. doi: 10.1016/j.cj.2022.10.007.2023
Lipka, A. E., Tian, F., Wang, Q., Peiffer, J., Li, M., Bradbury, P. J., et al. (2012). GAPIT: genome association and prediction integrated tool. Bioinform 28, 2397–2399. doi: 10.1093/bioinformatics/bts444
Liu, H., Shi, Z., Ma, F., Xu, Y., Han, G., Zhang, J., et al. (2022). Identification and validation of plant height, spike length and spike compactness loci in common wheat (Triticum aestivum L.). BMC Plant Biol. 22, 568. doi: 10.1186/s12870-022-03968-0
Liu, M., Zhao, Q., Qi, F., Stiller, J., Tang, S., Miao, J., et al. (2018). Sequence divergence between spelt and common wheat. Theor. Appl. Genet. 131, 1125–1132. doi: 10.1007/s00122-018-3064-z
Mangin, B., Siberchicot, A., Nicolas, S., Doligez, A., This, P., Cierco-Ayrolles, C. (2012). Novel measures of linkage disequilibrium that correct the bias due to population structure and relatedness. Heredity 108, 285–291. doi: 10.1038/hdy.2011.7
Marroni, F., Pinosio, S., Zaina, G., Fogolari, F., Felice, N., Cattonaro, F., et al. (2011). Nucleotide diversity and linkage disequilibrium in Populus nigra cinnamyl alcohol dehydrogenase (CAD4) gene. Tree Genet. Genomes 7, 1011–1023. doi: 10.1007/s11295-011-0391-5
Mastrangelo, A. M., Roncallo, P., Matny, O., Čegan, R., Steffenson, B., Echenique, V., et al. (2023). A new wild emmer wheat panel allows to map new loci associated with resistance to stem rust at seedling stage. Plant Genome 18, e20413. doi: 10.1002/tpg2.20413
Mazumder, A. K., Yadav, R., Kumar, M., Babu, P., Kumar, N., Kumar Singh, S., et al. (2024). Discovering novel genomic regions explaining adaptation of bread wheat to conservation agriculture through GWAS. Sci. Rep. 14, 16351. doi: 10.1038/s41598-024-66903-3
McFadden, E. S., Sears, E. R. (1946). The origin of Triticum spelta and its free-threshing hexaploid relatives. J. Hered. 37, 81–107. doi: 10.1093/oxfordjournals.jhered.a105590
Muqaddasi, Q. H., Brassac, J., Koppolu, R., Plieske, J., Ganal, M. W., Röder, M. S. (2019). TaAPO-A1, an ortholog of rice ABERRANT PANICLE ORGANIZATION 1, is associated with total spikelet number per spike in elite European hexaploid winter wheat (Triticum aestivum L.) varieties. Sci. Rep. 9, 1–12. doi: 10.1038/s41598-019-50331-9
Nyquist, W. E. (1991). Estimation of heritability and prediction of selec tion response in plant populations. Crit. Rev. Plant Sci. 10, 235–322. doi: 10.1080/07352689109382313
Pang, Y., Liu, C., Wang, D., St. Amand, P., Bernardo, A., Li, W., et al. (2020). High-resolution genome-wide association study identifies genomic regions and candidate genes for important agronomic traits in wheat. Mol. Plant 13, 1311–1327. doi: 10.1016/j.molp.2020.07.008
Pont, C., Leroy, T., Seidel, M., Tondelli, A., Duchemin, W., Armisen, D. (2019). Tracing the ancestry of modern bread wheats. Nat. Genet. 51, 905–911. doi: 10.1038/s41588-019-0393-z
Pritchard, J. K., Stephens, M., Donnelly, P. (2000). Inference of population structure using multi locus genotype data. Genetics 155, 945–959. doi: 10.1093/genetics/155.2.945
Rimbert, H., Darrier, B., Navarro, J., Kitt, J., Choulet, F., Leveugle, M., et al. (2018). High throughput SNP discovery and genotyping in hexaploidy wheat. PloS One 13, e0186329. doi: 10.1371/journal.pone.0186329
Saini, D. K., Chopra, Y., Singh, J., Sandhu, K. S., Kumar, A., Bazzer, S., et al. (2022). Comprehensive evaluation of mapping complex traits in wheat using genome-wide association studies. Mol. Breed. 42, 1. doi: 10.1007/s11032-021-01272-7
Sheoran, S., Jaiswal, S., Kumar, D., Raghav, N., Sharma, R., Pawar, S., et al. (2019). Uncovering genomic regions associated with 36 agro-morphological traits in Indian spring wheat using GWAS. Front. Plant Sci. 10. doi: 10.3389/fpls.2019.00527
Simonetti, E., Bosi, S., Negri, L., Baffoni, L., Masoni, A., Marotti, I., et al. (2022). Molecular phylogenetic analysis of amylase trypsin inhibitors (ATIs) from a selection of ancient and modern wheat. J. Cereal Sci. 105, 1–9. doi: 10.1016/j.jcs.2022.103441
Simons, K. J., Fellers, J. P., Trick, H. N., Zhang, Z., Tai, Y. S., Gill, B. S., et al. (2006). Molecular characterization of the major wheat domestication gene Q. Genetics 172, 547–555. doi: 10.1534/genetics.105.044727
Stein, N., Herren, G., Keller, B. (2001). A new DNA extraction method for high-throughput marker analysis in a large-genome species such as Triticum aestivum. Plant Breed. 120, 354–356. doi: 10.1046/j.1439-0523.2001.00615.x
Szczepanek, M., Lemańczyk, G., Lamparski, R., Wilczewski, E., Graczyk, R., Nowak, R., et al. (2020). Ancient Wheat Species (Triticum sphaerococcum Perc. and T. persicum Vav.) in Organic Farming: Influence of Sowing Density on Agronomic Traits, Pests and Diseases Occurrence, and Weed Infestation. Agriculture 10, 556. doi: 10.3390/agriculture10110556
Tadesse, W., Sanchez-Garcia, M., Assefa, S. G., Amri, A., Bishaw, Z., Ogbonnaya, F. C., et al. (2019). Genetic gains in wheat breeding and its role in feeding the world. Crop Breed. Genet. Genom. 1, e190005. doi: 10.20900/cbgg20190005
Taiyun, W., Simko, V. (2024). R package ‘corrplot’: Visualization of a Correlation Matrix (Version 0.95). Available online at: https://github.com/taiyun/corrplot (Accessed October 14, 2024).
The International Wheat Genome Sequencing Consortium (IWGSC) (2018). Shifting the limits in wheat research and breeding using a fully annotated reference genome. Science 361, eaar7191. doi: 10.1126/science.aar7191
Upadhyay, K. (2020). Correlation and path coefficient analysis among yield and yield attributing traits of wheat (Triticum aestivum L.) genotypes. Arch. Agric. Environ. Sci. 5, 196–199. doi: 10.26832/24566632.2020.0502017
Volante, A., Barabaschi, D., Marino, R., Brandolini, A. (2021). Genome-wide association study for morphological, phenological, quality, and yield traits in einkorn (Triticum monococcum L. subsp. monococcum). G3: Genes Genom. Genet. 11, jkab281. doi: 10.1093/g3journal/jkab281
Volante, A., Desiderio, F., Tondelli, A., Perrini, R., Orasen, G., Biselli, C., et al. (2017). Genome-Wide Analysis of japonica Rice Performance under Limited Water and Permanent Flooding Conditions. Front. Plant Sci. 8. doi: 10.3389/fpls.2017.01862
Walkowiak, S., Gao, L., Monat, C., Haberer, G., Kassa, M. T., Brinton, J., et al. (2020). Multiple wheat genomes reveal global variation in modern breeding. Nature 588, 277–283. doi: 10.1038/s41586-020-2961-x
Wang, S. C., Wong, D. B., Forrest, K., Allen, A., Chao, S. M., Huang, B. E., et al. (2014). Characterization of polyploid wheat genomic diversity using a highdensity 90,000 single nucleotide polymorphism array. Plant Biotechnol. J. 12, 787–796. doi: 10.1111/pbi.12183
Wang, Y., Wang, Z., Chen, Y., Lan, T., Wang, X., Liu, G., et al. (2024). Genomic insights into the origin and evolution of spelt (Triticum spelta L.) as a valuable gene pool for modern wheat breeding. Plant Commun. 5, 100883. doi: 10.1016/j.xplc.2024.100883
Wen, M., Su, J., Jiao, C., Zhang, X., Xu, T., Wang, T., et al. (2022). Pleiotropic effect of the compactum gene and its combined effects with other loci for spike and grain-related traits in wheat. Plants 11, 1837. doi: 10.3390/plants11141837
Winfield, M. O., Allen, A. M., Burridge, A. J., Barker, G. L. A., Benbow, H. R., Wilkinson, P. A., et al. (2016). High-density SNP genotyping array for hexaploidy wheat and its secondary and tertiary gene pool. Plant Biotechnol. J. 14, 1195–1206. doi: 10.1111/pbi.12485
Yan, Y., Hsam, S. L. K., Yu, J. Z., Jiang, Y., Ohtsuka, I., Zeller, F. J. (2003). HMW and LMW glutenin alleles among putative tetraploid and hexaploid European spelt wheat (Triticum spelta L.) Progenitors. Theor. Appl. Genet. 107, 1321–1330. doi: 10.1007/s00122-003-1315-z
Keywords: wheat, hexaploid subspecies, variability, genome-wide association study, favorable allele
Citation: Barabaschi D, Volante A, Faccioli P, Povesi A, Tagliaferri I, Mazzucotelli E and Cattivelli L (2025) Ancient diversity of Triticum aestivum subspecies as source of novel loci for bread wheat improvement. Front. Plant Sci. 16:1536991. doi: 10.3389/fpls.2025.1536991
Received: 29 November 2024; Accepted: 12 February 2025;
Published: 09 April 2025.
Edited by:
Soren K. Rasmussen, University of Copenhagen, DenmarkReviewed by:
Harsimardeep Gill, University of Minnesota Twin Cities, United StatesAna Luisa Garcia-Oliveira, Alliance Bioversity & CIAT, Colombia
Copyright © 2025 Barabaschi, Volante, Faccioli, Povesi, Tagliaferri, Mazzucotelli and Cattivelli. This is an open-access article distributed under the terms of the Creative Commons Attribution License (CC BY). The use, distribution or reproduction in other forums is permitted, provided the original author(s) and the copyright owner(s) are credited and that the original publication in this journal is cited, in accordance with accepted academic practice. No use, distribution or reproduction is permitted which does not comply with these terms.
*Correspondence: Delfina Barabaschi, ZGVsZmluYS5iYXJhYmFzY2hpQGNyZWEuZ292Lml0