 Jiazhen Xi
 Shengtao Shi
 Yizhong Rong
 Jie Liu
 Li Zhang
- 1Co-Innovation Center for Sustainable Forestry in Southern China, Bamboo Research Institute, College of Ecology and the Environment, Nanjing Forestry University, Nanjing, China
- 2School of Resources and Environment, Anhui Agricultural University, Hefei, China
Introduction: Modeling differences in biomass allocation between wheat and weeds—specifically to shoots (aboveground biomass), roots (belowground biomass), and seed mass (reproductive biomass)—enhances our understanding of sustainable weeds management. However, few studies have examined how fertilization and planting density influence biomass accumulation and allocation at both vegetative and reproductive stages within a wheat-weed community.
Methods: To address this gap, we conducted a greenhouse experiment growing wheat (Triticum aestivum L.), wild oats (Avena fatua L.), and barnyard grass (Echinochloa crusgalli (L.) P. Beauv.) under varying planting densities (4, 8, 12, and 16 individuals per pot) and fertilization treatments (1.018 g N per pot of urea). After six months of vegetative growth and one additional month at the reproductive stage, we measured aboveground and belowground biomass at both stages, and reproductive biomass during the reproductive stage.
Results and Discussion: We found that the biomass of wheat and weeds increased with fertilization but decreased with higher planting density, with no interactions between these factors. Wheat allocated more biomass to roots than shoots and more to reproductive than vegetative biomass, regardless of fertilization or planting density, following allometric allocation theory. In contrast, weeds distributed biomass similarly between shoots and roots at planting densities of 4 and 12 under fertilization or allocated more biomass to roots than to shoots at these densities. Additionally, some weeds achieved higher yields at both small and large sizes under planting densities of 12 and 16, respectively, suggesting greater phenotypic plasticity. This study provides a comprehensive analysis of biomass allocation differences between wheat and weeds throughout their life cycles, offering insights into plant adaptation strategies and practical applications for optimizing agricultural management.
1 Introduction
Wheat plays a critical role in global food security, sustaining over 40% of the world’s population, yet its yield is often reduced due to nutrient competition from weeds (FAO, 2023). Managing weeds diversity has been shown to mitigate crop yield losses (Adeux et al., 2019). Modeling differences in biomass allocation between wheat and weeds can help determine the extent to which human-assisted selection influences specific crop and weeds traits. For both wild and cultivated species, growth and reproduction are fundamental processes in plant life history (Hulshof et al., 2012; Schoen et al., 2019). Plants assimilate carbon and absorb nutrients to build biomass throughout their ontogeny, balancing biomass accumulation between vegetative and reproductive structures (Poorter et al., 2012; Shipley and Meziane, 2002; Yin et al., 2019). However, the patterns of biomass—allocation particularly how wheat and weeds adjust allocation priorities across ontogeny in response to agricultural practices such as fertilization and planting density gradients—remain poorly understood.
Biomass allocation patterns among organs are primarily explained by two major theories: allometric partitioning theory (Enquist and Niklas, 2002; Falster et al., 2015) and optimal partitioning theory (Thornley, 1972). The allometric partitioning theory proposes that the nonlinear, size-dependent distribution of biomass among plant parts remains proportionally consistent across diverse species or community types (Cheng and Niklas, 2007; Cheng et al., 2011; Enquist and Niklas, 2002; Müller et al., 2000; Niklas, 2004; Poorter et al., 2015; Westgeest et al., 2024; Zhou et al., 2014). According to allometric scaling laws, size-related traits in vascular plants follow a power-law function: Y = Y0Mb or log10Y = log10Y0 + blog10M, where Y represents a plant trait, Y0 is the trait value when M = 1, M is plant size (typically measured as biomass), and b is the scaling exponent determined by the geometric and hydrodynamic properties of vascular networks, which maximize resource uptake while minimizing transport investment (West et al., 1999). For example, allocating more biomass to vegetation rather than reproduction sustains physiological processes and growth (Brooks, 2003), and enhances competition with neighboring plants (Liu et al., 2023). Conversely, allocating more biomass to reproduction rather than growth increases crop yield and improves the fitness of wild plants (Luo et al., 2020; McCarthy and Enquist, 2007; Pallas et al., 2016; Westgeest et al., 2024; Zheng et al., 2023). The optimal partitioning theory posits that plants allocate more biomass to organs that capture the most limiting resources, thereby enhancing overall plant performance (Bloom et al., 1985).
Numerous studies have examined whether biomass allocation patterns result from optimal partitioning theory or allometric partitioning theory under variable environmental conditions (Fang et al., 2023; Liu et al., 2021; McCarthy and Enquist, 2007; Peng and Yang, 2016). For example, artemisia species adapt to environmental changes through allometric strategies rather than dynamically adjusting organ allocation (Liu et al., 2021). For wheat, significant differences among varieties have been observed in the allometric exponent (the slope of the log-log relationship) of seed versus vegetative biomass. Some varieties, such as DM31 and HST, produce higher yields when individual plants are small, while varieties like MO1 achieve greater yields as individuals grow larger (Qin et al., 2013). For weeds, changes in the shoot-root biomass ratio in response to variations in light (Dias-Filho, 1999), water (Acciaresi and Guiamet, 2010), and nutrient gradient (Ringselle et al., 2017) have been reported. For example, in nutrient poor soils, biomass is predominantly allocated to root development rather than aboveground structures to improve nutrient acquisition efficiency. After fertilization, biomass allocation shifts towards aboveground structures as nutrient availability increases for light competition (Ringselle et al., 2017). However, instead of using ratios, which typically vary with size, it has been proposed that the relationship between plant size and reproductive allocation should be analyzed allometrically (Qin et al., 2013; Weiner, 2004).
Fertilization and planting density are critical agronomic factors that exacerbate N limitation and increase or decrease plant development and reproduction accumulation (Fang et al., 1991; Frink et al., 1999; Huangfu et al., 2022; Jia et al., 2020; LeBauer and Treseder, 2008; Postma et al., 2021; Xia and Wan, 2008; Yoda, 1963). Regarding biomass allocation, wheat may allocate more biomass to reproduction regardless of variations in fertilization and planting density. This tendency could be attributed to selective pressures during domestication that favored consistent yields for this staple food crop (Brancourt-Hulmel et al., 2003). Alternatively, wheat may exhibit flexibility in biomass allocation, as significant differences among varieties have been observed (Qin et al., 2013). Weeds are characterized by their ruderal nature, may adjust their allocation patterns in response to environmental changes, displaying flexible survival and reproductive strategies in unpredictable agricultural landscapes (Grime, 1977).
To clarify ontogenetic shifts in biomass allocation in wheat and weeds across fertilization and planting density gradients, we conducted a greenhouse experiment using planting densities of 4, 8, 12 and 16 individuals per pot, with and without urea fertilization. Wheat (Triticum aestivum), wild oat (Avena fatua), and barnyard grass (Echinochloa crus-galli) were selected as target species. We specifically investigated the following three questions: (i) How do fertilization and planting density affect wheat and weeds aboveground and belowground biomass at the vegetative and reproductive stages, as well as their effects on the reproductive biomass (i.e., seed production) and vegetative biomass (i.e., non-reproductive) at the reproductive stage? (ii) How do fertilization and planting density affect allometric scaling relationships among different organs? (iii) Do the effects of fertilization and planting density on allometric scaling relationships among different organs depend on ontogenetic stage and species identity?
2 Materials and methods
2.1 Study site
This study was conducted in a greenhouse at Hefei High-tech Agricultural Park, Anhui Province, China (31° 55’N, 117° 12’E). The region experiences a typical subtropical monsoon climate, with an average annual temperature of approximately 16.1°C. The mean annual precipitation is about 1149 mm, with the majority occurring in summer.
2.2 Study species
Wheat (Triticum aestivum L.), wild oat (Avena fatua L.) and barnyard grass (Echinochloa crusgalli (L.) P. Beanv) were selected as target species. The tested wheat variety was Yannong 19. Wild oat and barnyard grass were two dominant weeds in wheat fields and accounted for 90% of the relative abundance (Zhang et al., 2019). Seeds were collected from the test site and selected for uniform plumpness, free of insect damage and mildew.
2.3 Experiment design
The experiment was divided into six groups, with three receiving urea fertilization and the three serving as controls. Each group consisted of 40 pots, incorporating two competing species pairs (i.e., T. aestivum and A. fatua, T. aestivum and E. crusgalli), four planting densities (4, 8, 12, and 16 individuals per pot) and five wheat: weeds proportional gradients at each density (0: 1, 0.25: 0.75, 0.5: 0.5, 0.75: 0.25, and 1: 0) (Zhang and van Kleunen, 2019). The planting density in wheat fields ranges from 80-400 individuals/m² (Fischer et al., 2019). The selected planting densities (4, 8, 12, and 16 individuals per pot) correspond to approximately 110, 220, 330, and 440 individuals/m2, respectively, mimicking the structure of natural wheat communities. Among the fertilized groups, two measured biomasses at the vegetative stage, while the third measured biomass at the reproductive stage. The same distribution applied to the non-fertilized groups (Supplementary Figure S1).
Seeds of wheat and weeds were soaked in a 5% H2O2 solution for ten minutes on October 25, 2021, then rinsed with sterile distilled water. The seeds were then placed on wet filter paper to germinate in a plant growth chamber at 25°C. After approximately two weeks, seedlings with similar growth were transplanted into soil pots (24.5 cm in diameter at the top, 18.5 cm at the base, 25 cm in height, 9135 cm3 volume). Before transplanting, urea dissolved in water (1.018 g N per pot) was applied to the potting soil (Zhang et al., 2019). Seedlings that died within two weeks after transplanting were replaced, and the plants were watered once every 3-5 days to maintain adequate moisture.
2.4 Biomass measurement
Biomass was collected at the individual level during the vegetative stage in May 2022 and the reproductive stage in June 2022 (Supplementary Table S1). In May, wheat and weeds seed heads were bagged to prevent seed dispersal. Plant parts were dried at 65°C for 48h and weighed to 0.0001g to determine the dry weight of aboveground, belowground, and reproductive biomass. Vegetative biomass was calculated as the sum of aboveground and belowground biomass.
2.5 Statistical analysis
To satisfy the assumption of normality, aboveground, belowground, vegetative and reproductive biomass were log-transformed before analysis. A three-way ANOVA was conducted to assess the effects of ontogenetic stage (vegetative or reproductive), fertilization, and planting density on aboveground and belowground biomass. At each ontogenetic stage, a two-way ANOVA was used to evaluate the effects of fertilization and planting density on aboveground, belowground, vegetative and reproductive biomass. Under each fertilization condition, linear models were used to assess the effects of planting density on biomass. To assess the effects of plant density and fertilization on plants biomass, we constructed linear mixed effects models, with the number of wheat and weeds individuals as fixed effects and pot nested within competing neighbors as a random effect (y ~ Nwheat + Nweeds + (1| Neighbor species/Pot)) under both fertilized and unfertilized conditions.
Standardized major axis (SMA) tests (sma function in SMATR package) were performed according to the allometric equation (Equation 1) after aboveground, belowground, vegetative and reproductive biomass log-transformed (Equation 2) to determine the scaling exponents (slope) under different fertilization and planting density (Huxley, 1972; Wang et al., 2019):
which was usually analyzed:
where X and Y are the two given biomass, and β is referred to the allometric coefficient. logβ is the intercept and α is the allometric exponent or the slope. α < 1 indicates a faster accumulation in X than Y, and α > 1 indicates a faster accumulation in Y than X. Likelihood ratio tests were used to determine whether the slopes of the SMA estimation varied across different fertilization and planting density (Wang et al., 2022). All statistical analyses were conducted in R 4.2.2 (R Core Team, 2022).
3 Results
3.1 Changes of aboveground, belowground, vegetative and reproductive biomass with fertilization and planting density
For both wheat and weeds, ontogenetic stage (Three-way ANOVA; F1,1068 = 15.939, P < 0.001; F1,1068 = 4.054, P < 0.05; F1,486 = 34.322, P < 0.001; F1,486 = 15.610, P < 0.001), fertilization (F1,1068 = 118.578, P < 0.001; F1,1068 = 49.189, P < 0.001; F1,486 = 25.813, P < 0.001; F1,486 = 9.558, P < 0.01) and planting density (F3,1068 = 148.600, P < 0.001; F3,1068 = 76.881, P < 0.001; F3,486 = 12.089, P < 0.001; F3,486 = 7.436, P < 0.001) significantly affected aboveground and belowground biomass. The interactive effects of these three factors did not significantly influence wheat and weed aboveground and belowground biomass, except for the interaction between ontogenetic stage and fertilization, which significantly affected wheat’s belowground biomass (F1,1068 = 3.881, P < 0.05) (Tables 1, 2). Specifically, fertilization significantly increased wheat aboveground, belowground, and vegetative biomass at both the vegetative and reproductive stages, as well as weeds aboveground and belowground biomass at the vegetative stage. Regardless of fertilization, aboveground, belowground, vegetative, and reproductive biomass both wheat and weeds decreased significantly with increasing planting density (Figures 1–3; Supplementary Tables S2, S3, S4), except weeds belowground biomass at the vegetative stage in the absence of fertilization (Figure 2B). Increasing wheat density significantly reduced both wheat and weeds vegetative and reproductive biomass. However, increasing weeds density only significantly reduced wheat biomass at the vegetative stage and weed reproductive biomass (Tables 3, 4).
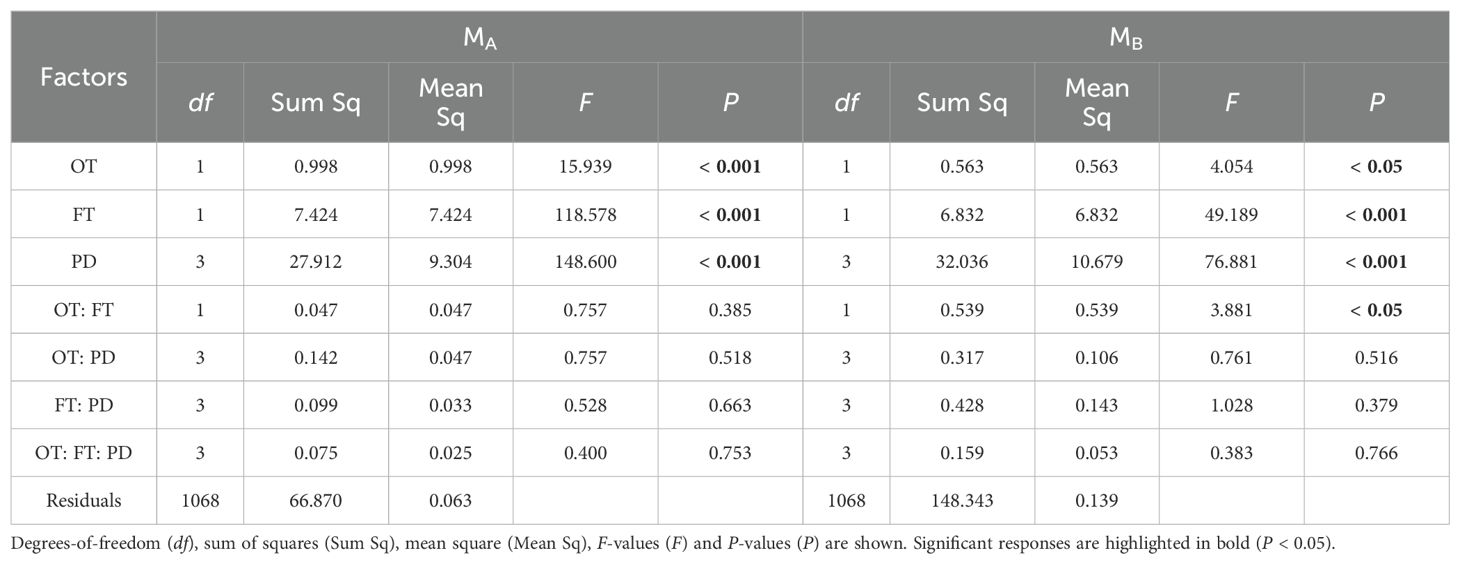
Table 1. Three-way ANOVA results for the effects of ontogeny (OT), fertilization (FT), planting density (PD) and their interactions on wheat’s MA (aboveground biomass) and MB (belowground biomass).
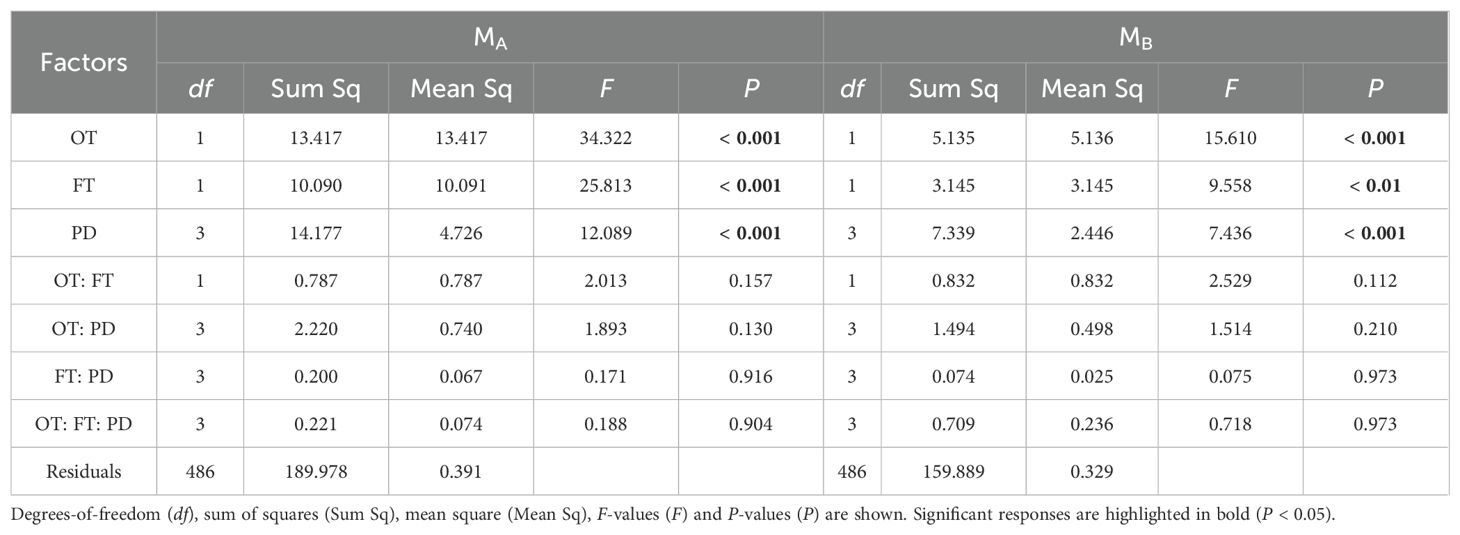
Table 2. Three-way ANOVA results for the effects of ontogeny (OT), fertilization (FT), planting density (PD) and their interactions on weeds’ MA (aboveground biomass) and MB (belowground biomass).
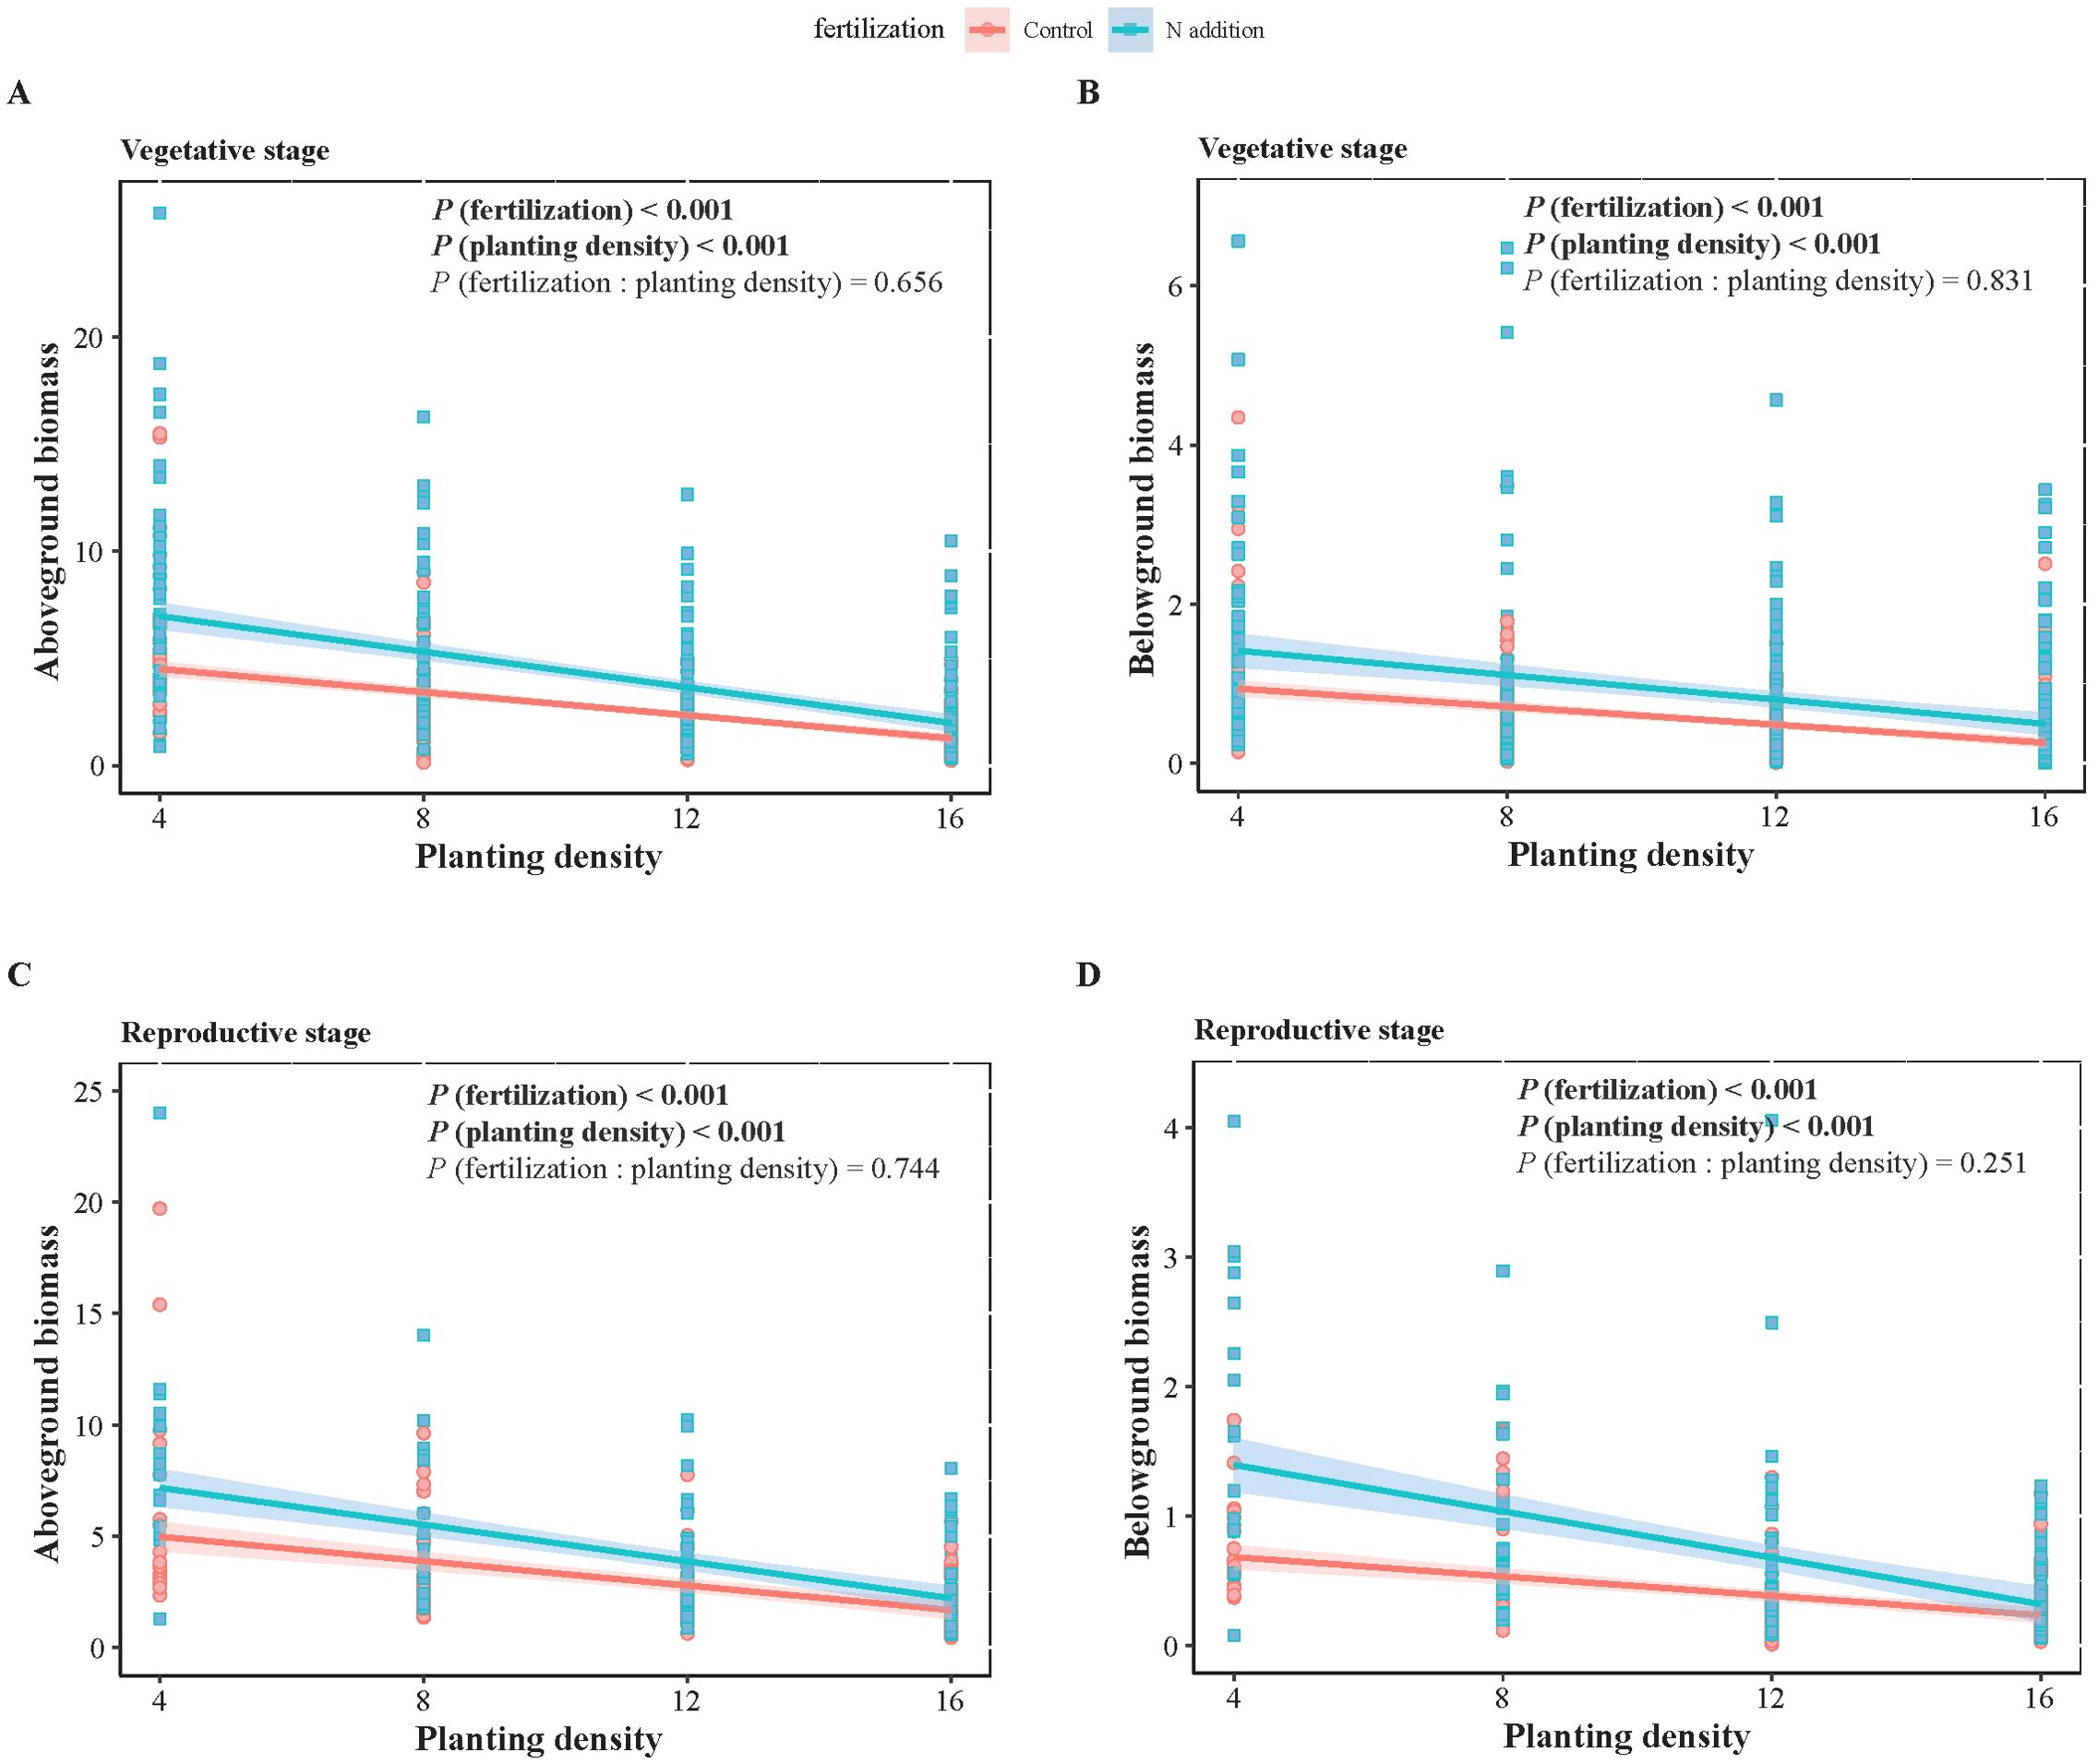
Figure 1. Two-way ANOVA results of fertilization (control and N addition treatments), planting density (4, 8, 12, 16), and their interaction (fertilization: planting density), as well as the effects of planting density under different fertilization conditions on wheat biomass at vegetative (A, B) and reproductive (C, D) stages. (A, C) represent aboveground biomass, while (B, D) represent belowground biomass. Solid lines indicate significant linear regressions (P < 0.05) with 95% confidence intervals, dashed lines indicate non-significance effect.
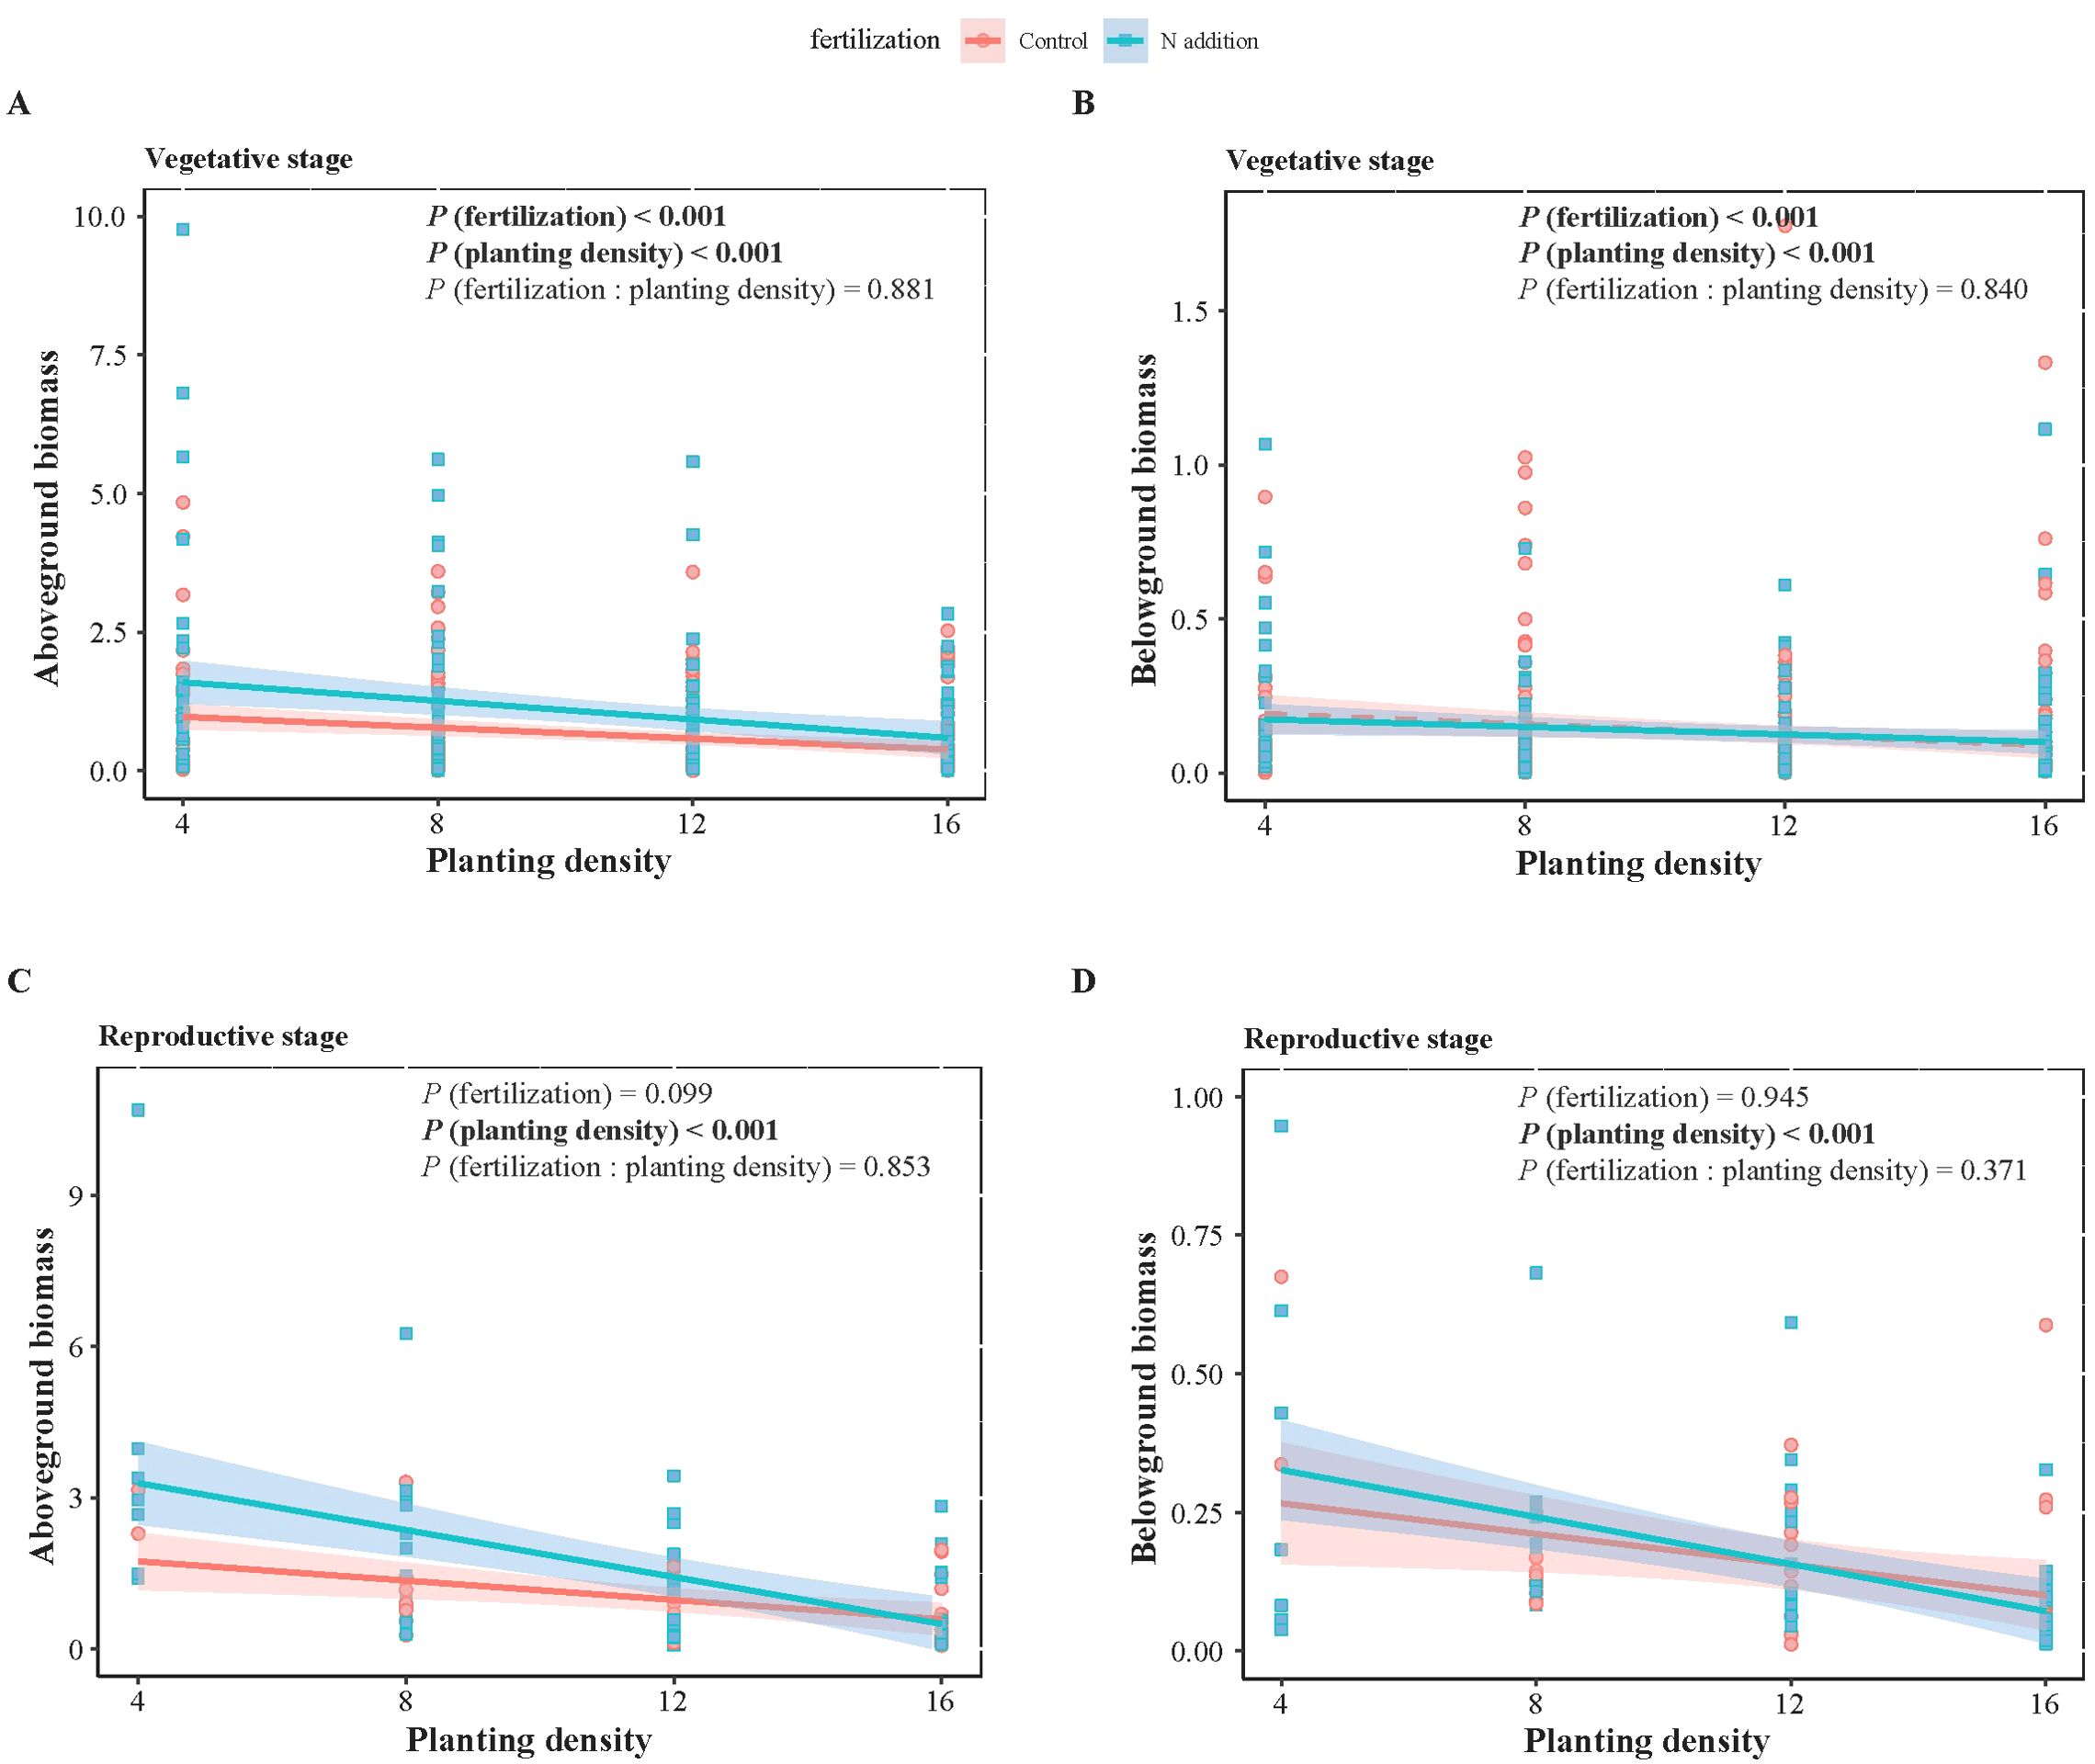
Figure 2. Two-way ANOVA results of fertilization (control and N addition treatments), planting density (4, 8, 12, 16), and their interaction (fertilization: planting density), as well as the effects of planting density under different fertilization conditions on weeds biomass at vegetative (A, B) and reproductive (C, D) stages. (A, C) represent aboveground biomass, while (B, D) represent belowground biomass. Solid lines indicate significant linear regressions (P < 0.05) with 95% confidence intervals, dashed lines indicate non-significance effect.
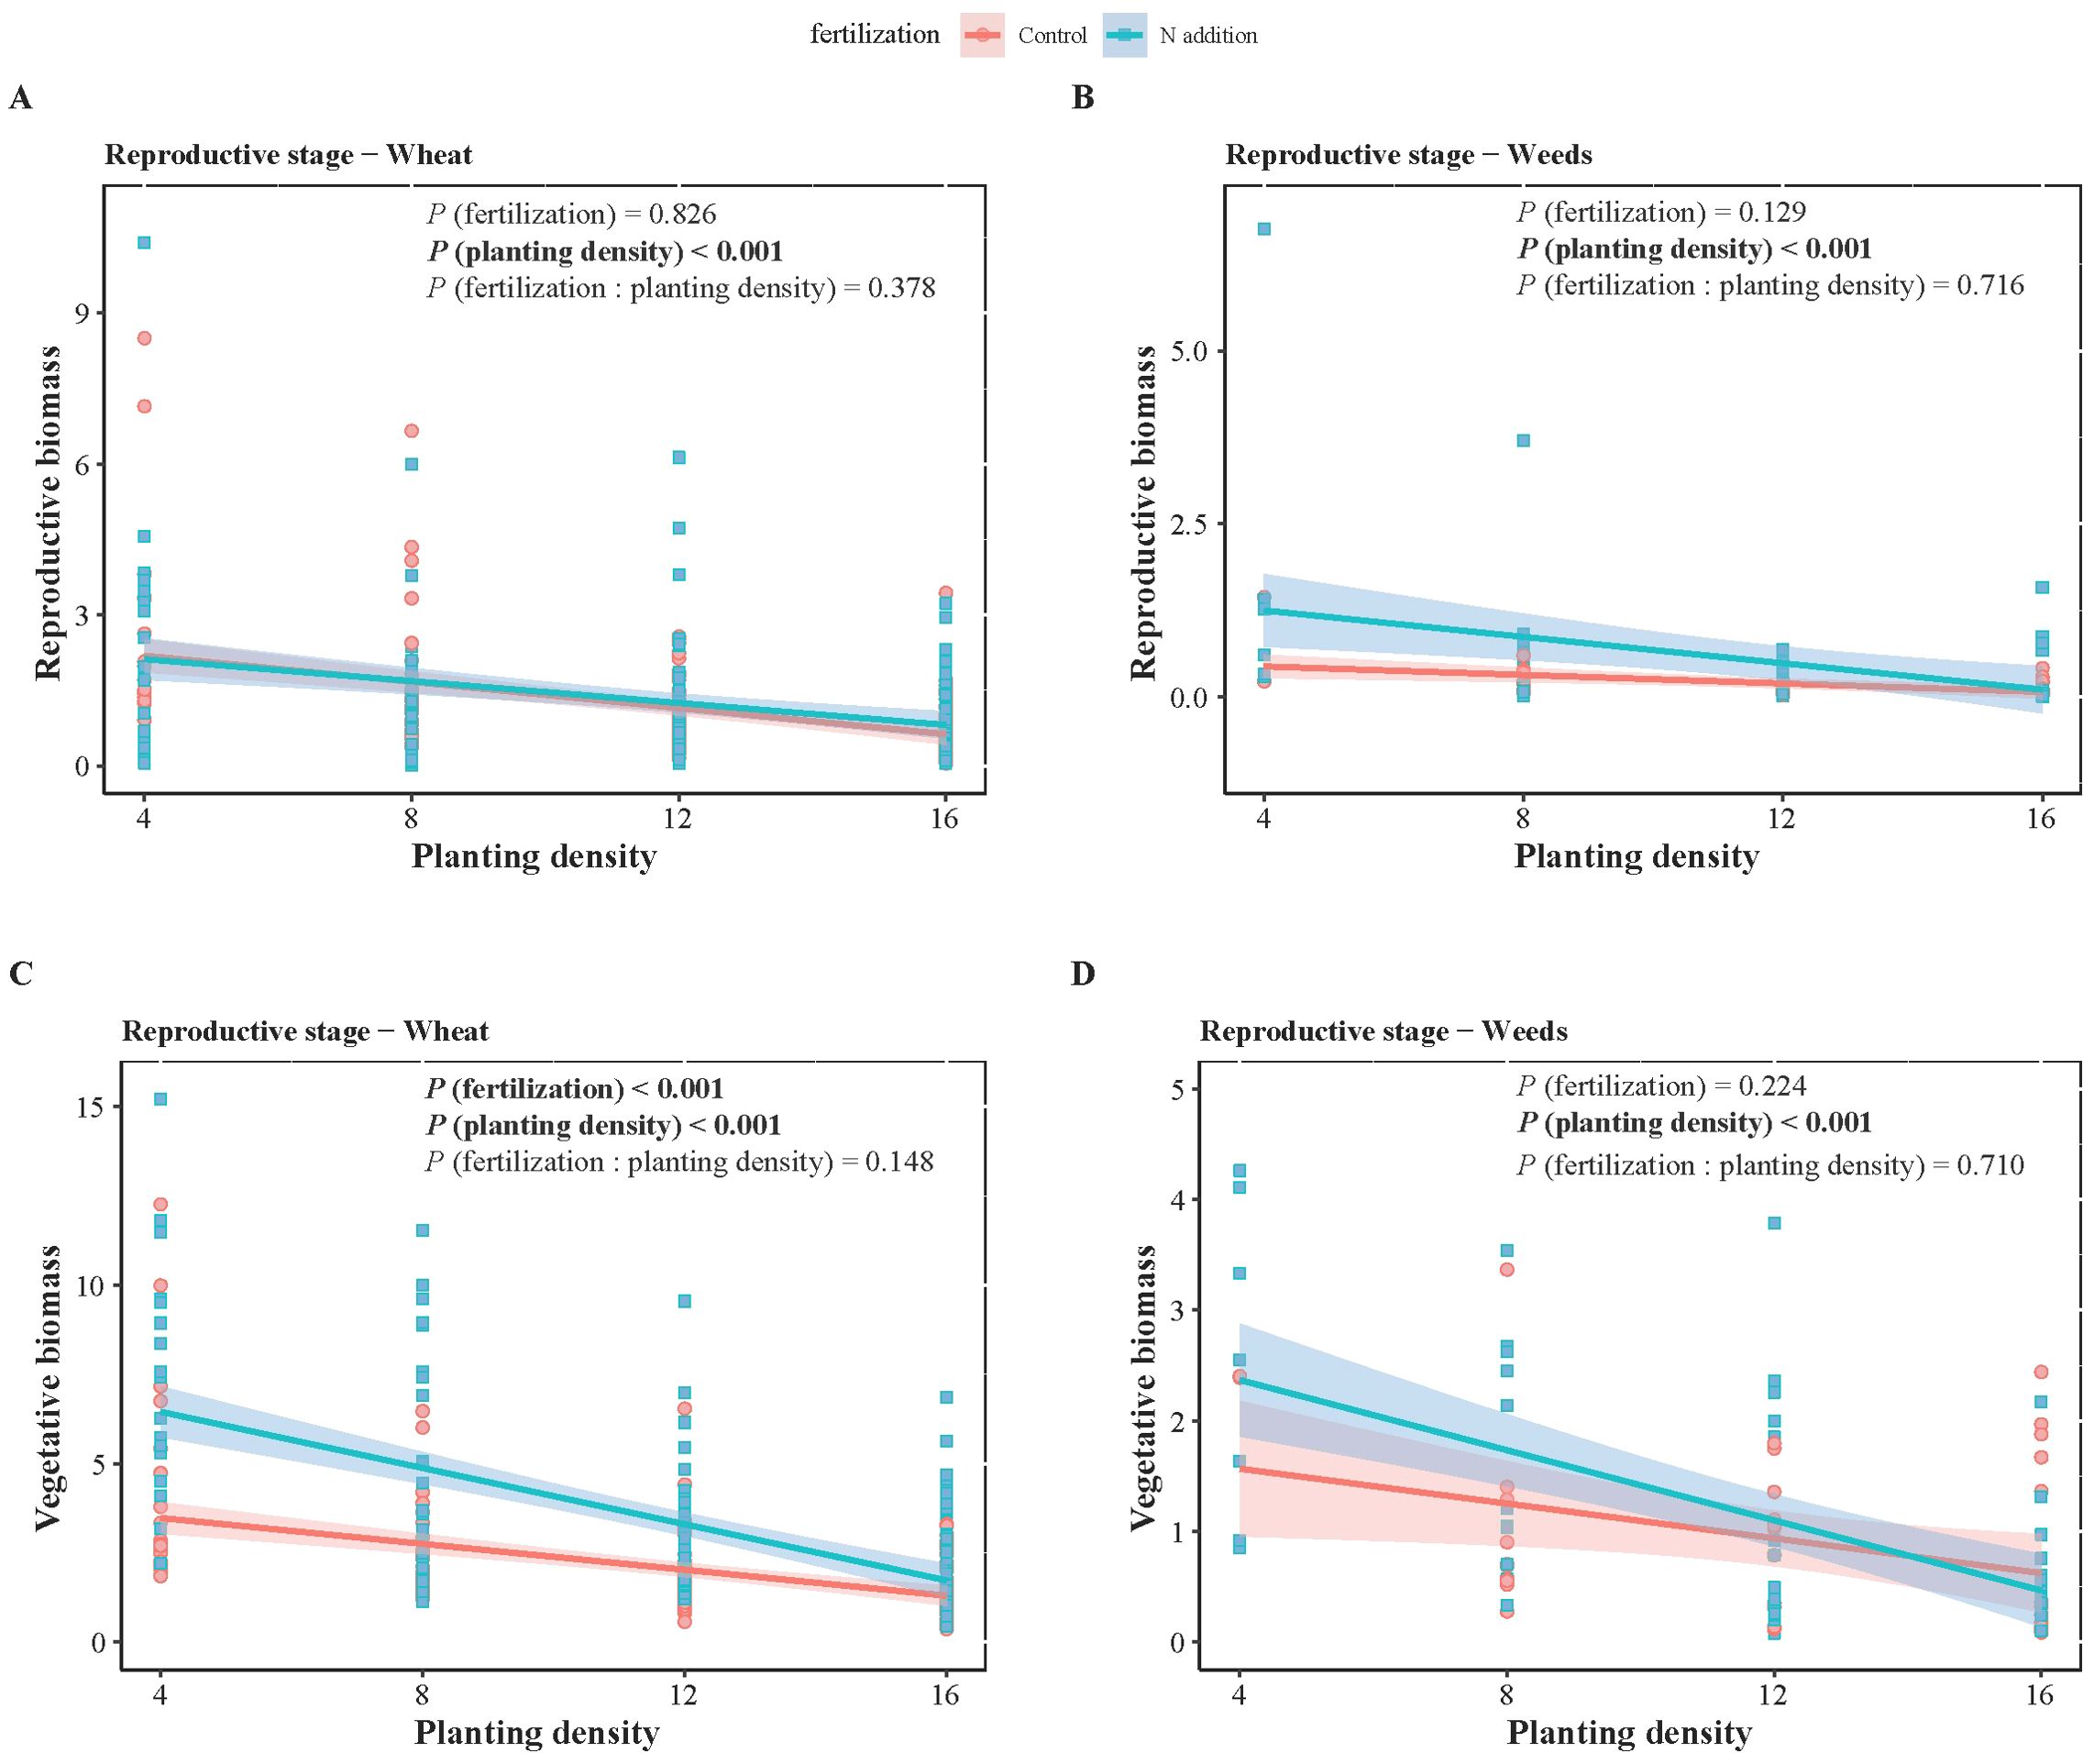
Figure 3. Two-way ANOVA results of fertilization (control and N addition treatments), planting density (4, 8, 12, 16), and their interaction (fertilization: planting density), as well as the effects of planting density under different fertilization conditions on wheat (A, C) and weeds (B, D) biomass at reproductive stages. (A, B) represent reproductive biomass, while (C, D) represent vegetative biomass. Solid lines indicate significant linear regressions (P < 0.05) with 95% confidence intervals, dashed lines indicate non-significance effect.
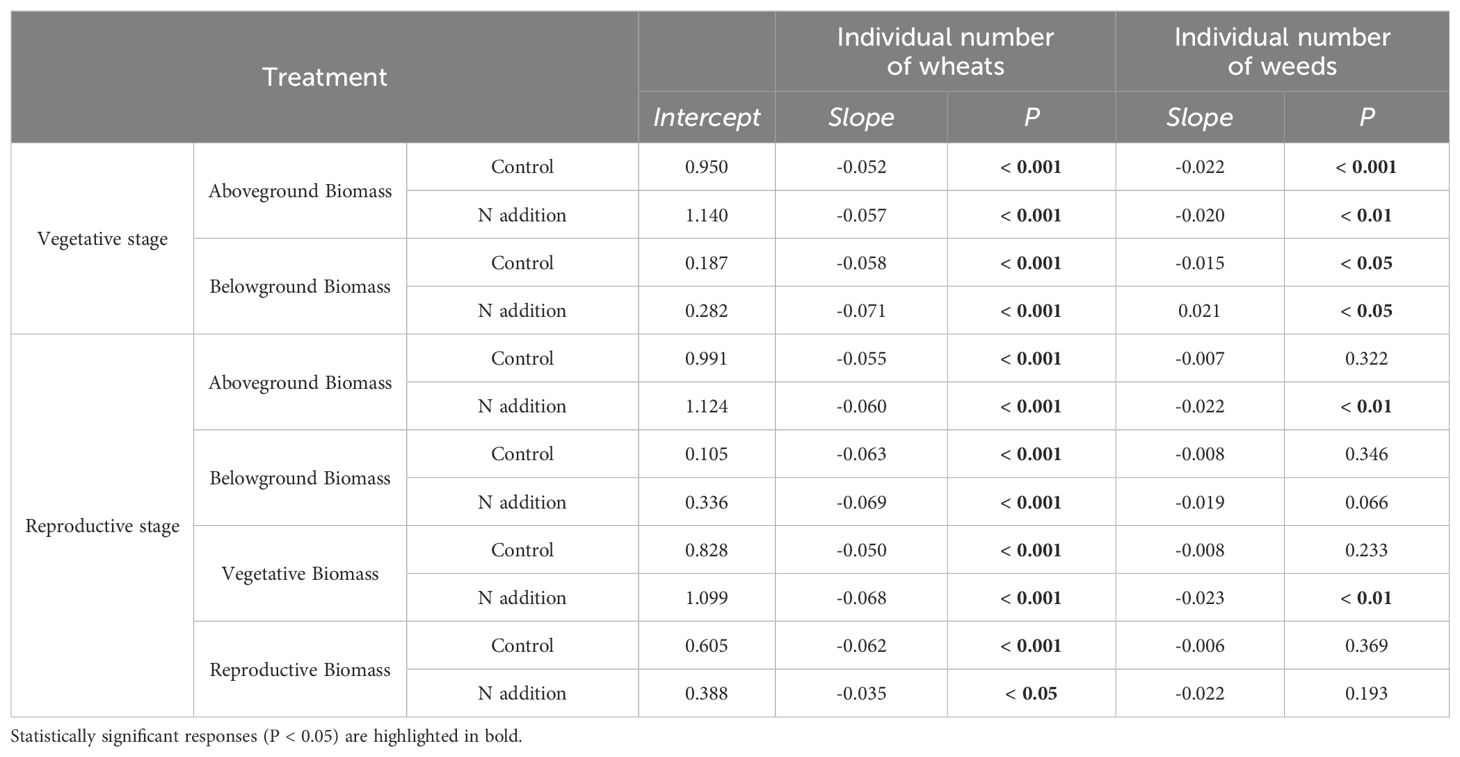
Table 3. Effects of wheat and weeds density on wheat’s aboveground, belowground, vegetative, and reproductive biomass with or without urea fertilization at vegetative and reproductive stages.
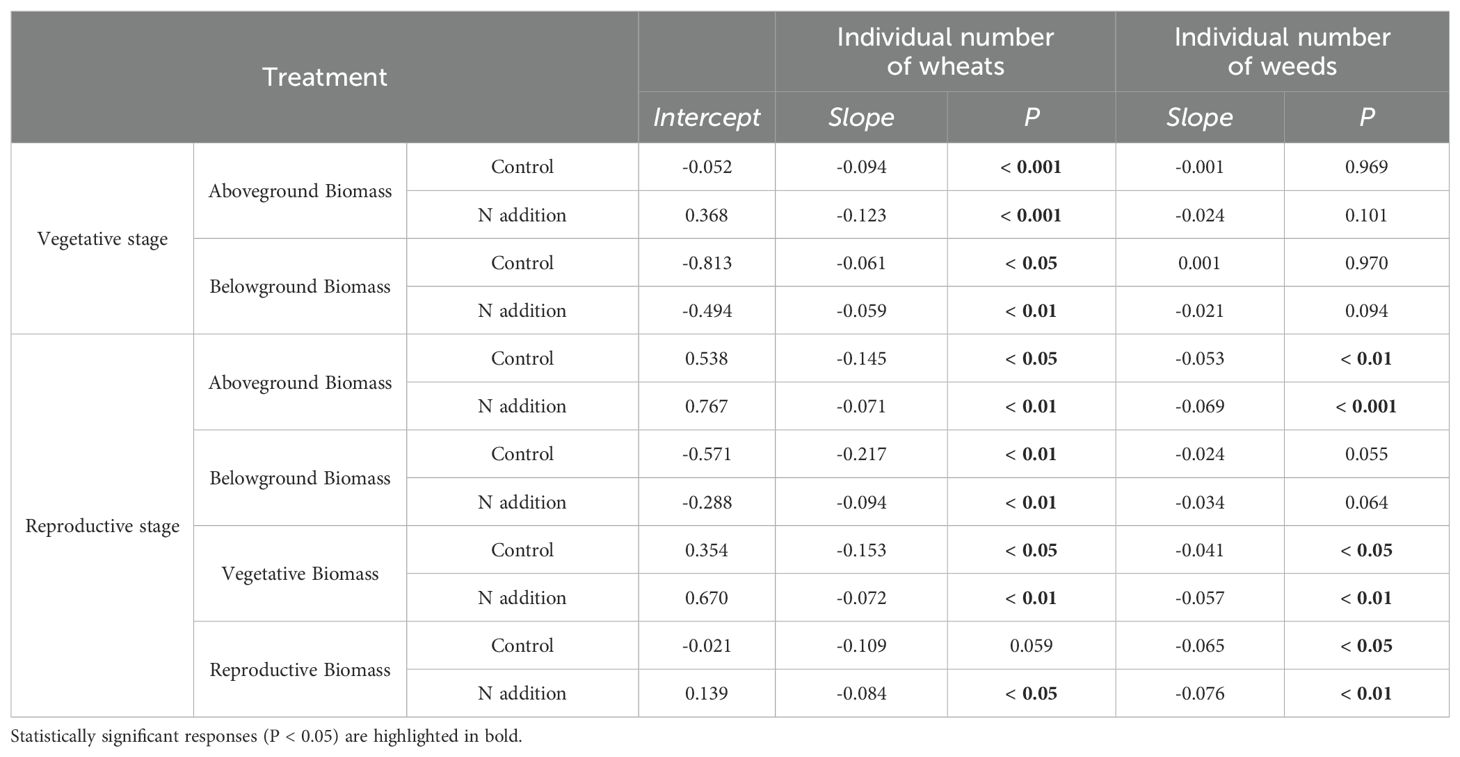
Table 4. Effects of wheat and weeds density on weeds’ aboveground, belowground, vegetative, and reproductive biomass with or without urea fertilization at vegetative and reproductive stages.
3.2 Wheat allometric relationships between aboveground and belowground biomass
At the vegetative stage, the scaling exponents (α) for wheat aboveground biomass versus belowground biomass were 1.375, 1.295, 1.443, 1.290 at planting densities of 4, 8, 12, 16, respectively, without fertilization. With fertilization, the α values were 1.175, 1.704, 1.684, 1.750 for the same respective densities. At the reproductive stage, the α values were 1.208, 1.879, and 1.338 at planting densities of 8, 12, and 16, respectively, without fertilization, and 1.410, 1.533, and 1.378 under fertilization. Additionally, at a planting density of 4, the α value was 0.711 under non-fertilized conditions at the reproductive stage (Figure 1, Table 5).
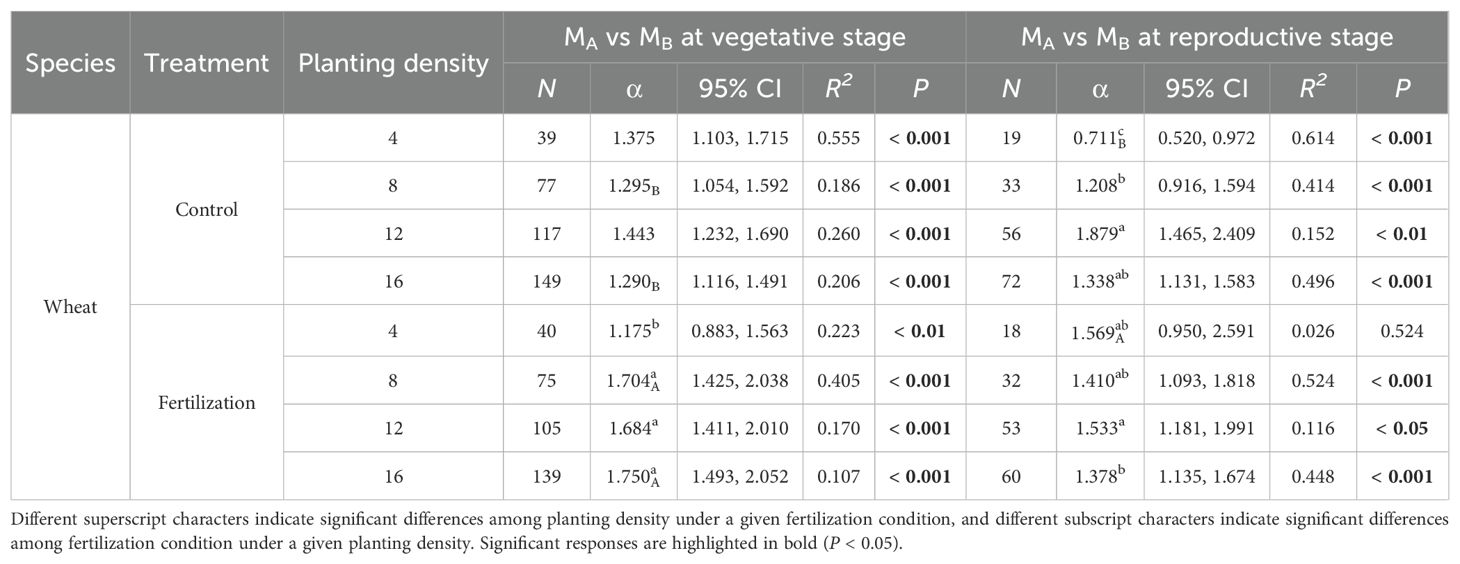
Table 5. Scaling exponents (α), their 95% confidence intervals (95% CI), and goodness of fit (R2) for wheat, based on standardized major axis (SMA) regression of log-transformed aboveground biomass (MA)and belowground biomass (MB) under different fertilization condition (control and fertilization) and planting densities (4, 8, 12 and 16) at vegetative and reproductive stages. N represents individual number. P values indicate the significance of SMA between the two organs.
3.3 Weeds allometric relationships between aboveground and belowground biomass
At the vegetative stage, weeds exhibited similar biomass allocation between aboveground and belowground biomass under certain conditions. The scaling exponents (α) were 1.099, 0.901, 1.004, and 0.918 at planting densities of 4, 8, 12, and 16, respectively, under non-fertilized conditions. With fertilization, the α values were 0.918 and 1.082 at planting densities of 4 and 12, respectively. At the reproductive stage, the α values were 0.837 at a planting density of 16 without fertilization and 0.880 at a density of 12 with fertilization. For planting density of 8 and 16 with fertilization at the vegetative stage, and 8 without fertilization at the reproductive stage, α were 0.700, 0.747, and 0.491, respectively. At a planting density of 12 without fertilization at the reproductive stage, α was 1.368. At the reproductive stage, for planting densities of 4, 8 and 16 with fertilization, α values did not show significance (P = 0.325; P = 0.432; P = 0.067) (Figure 2, Table 6).
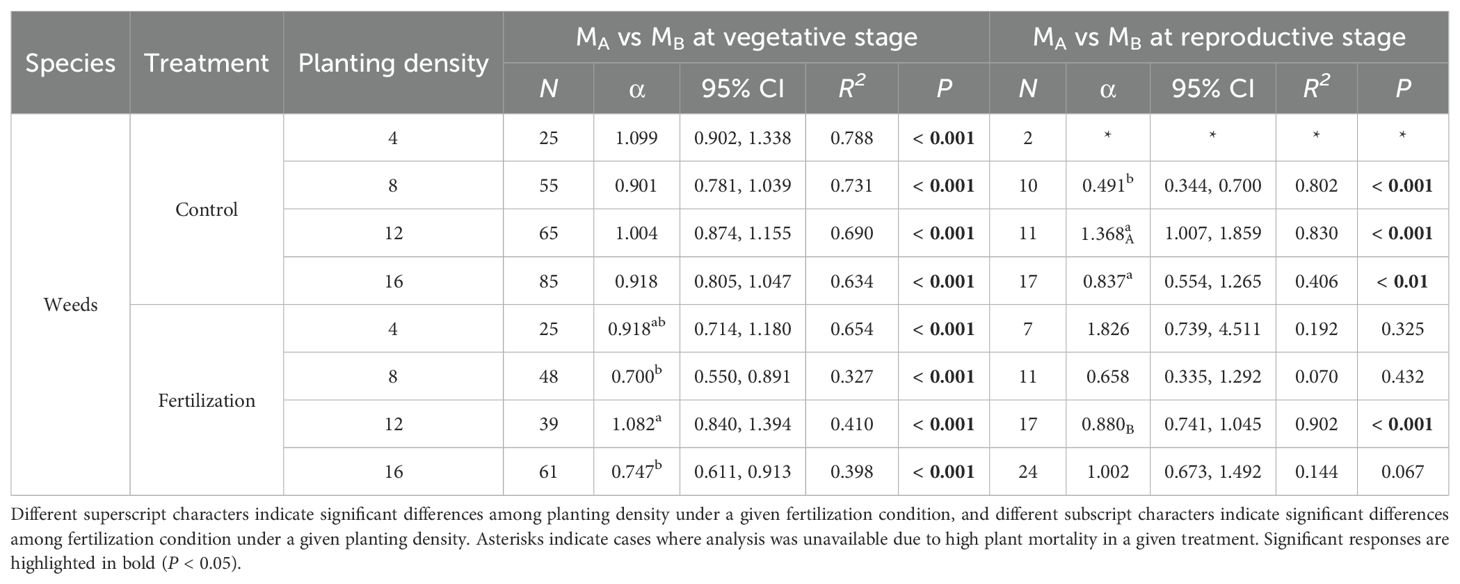
Table 6. Scaling exponents (α), their 95% confidence intervals (95% CI), and goodness of fit (R2) for weeds based on standardized major axis (SMA) regression of log-transformed MA and MB under different fertilization conditions (control and fertilization) and planting densities (4, 8, 12 and 16) at vegetative and reproductive stages. N represents individual number. P values indicate the significance of SMA between the two organs.
3.4 Wheat and weeds allometric relationships between reproductive and vegetative biomass
The scaling exponents (α) for wheat vegetative biomass versus reproductive biomass were 0.965, 0.687, 0.677, 0.644 at planting densities of 4, 8, 12, 16, respectively, without fertilization. Under fertilization, the α values were 0.451 and 0.632 at planting densities of 12 and 16, respectively. For weeds, the α value was 1.138 at a planting density of 16 without fertilization. However, with fertilization, the α value was 0.337. At a planting density of 12 with fertilization, weeds had an α value of 0.920 (Figure 3, Table 7).
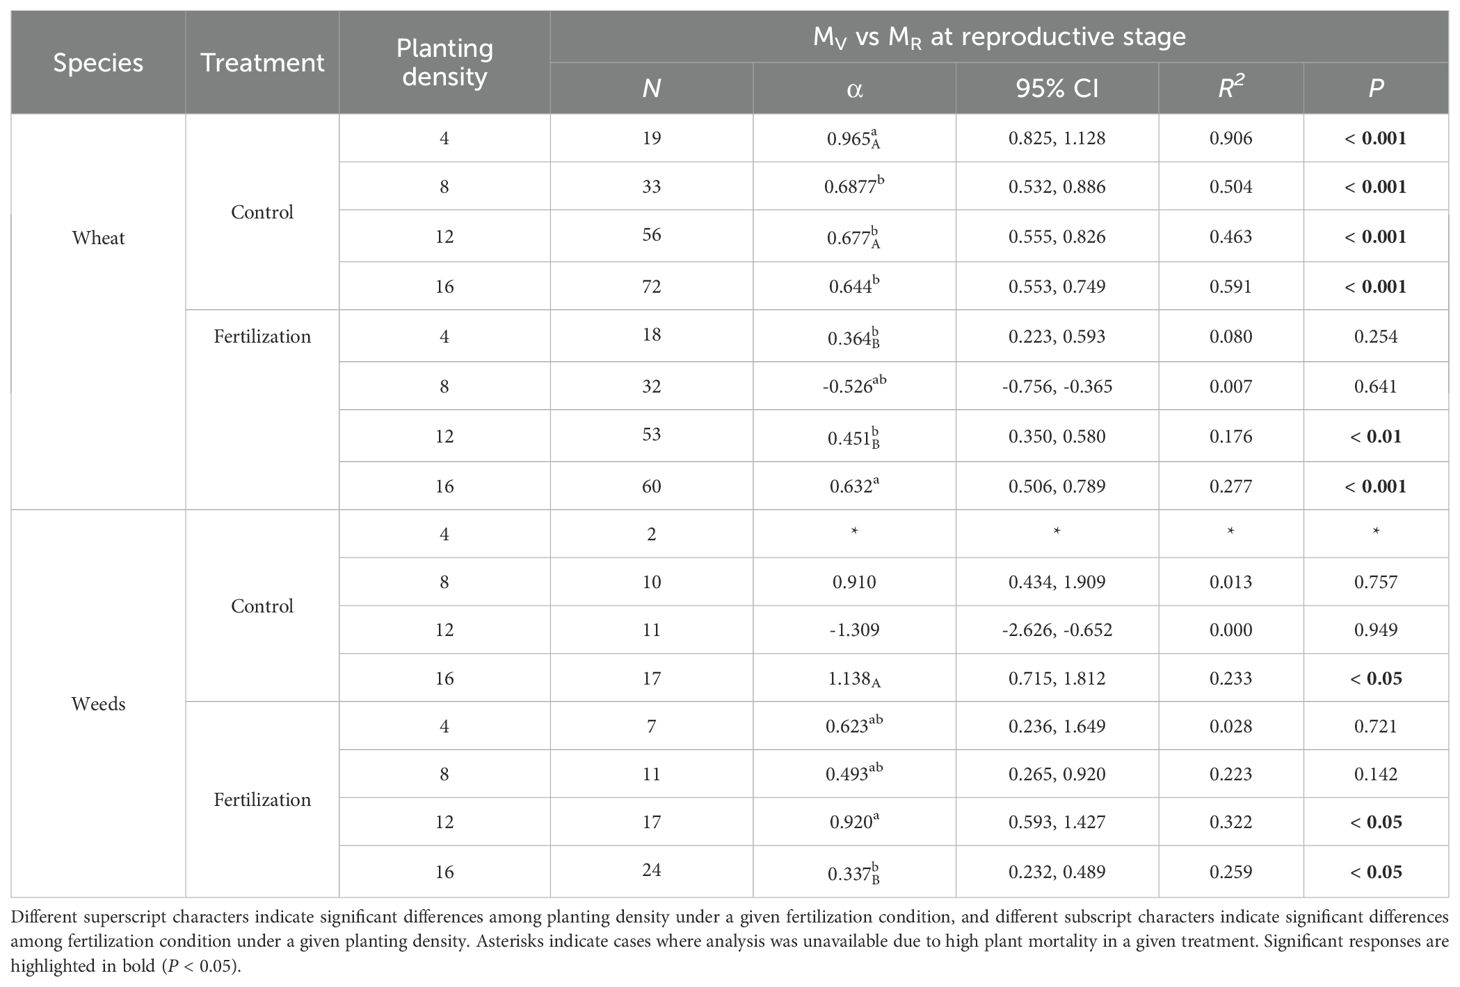
Table 7. Scaling exponents (α), their 95% confidence intervals (95% CI), and goodness of fit (R2) of wheat and weeds, based on standardized major axis (SMA) regression of log-transformed MR and MV under different fertilization condition (control and fertilization) and planting densities (4, 8, 12 and 16) at reproductive stage. N represents individual number. P values indicate the significance of SMA between the two organs.
4 Discussion
Our study found that aboveground, belowground, vegetative and reproductive biomass of wheat and weeds increased with fertilization, decreased with higher planting density, and exhibited limited interactive effects between these factors. For wheat biomass allocation, more biomass was allocated to roots than to shoots across ontogenetic stages and more to reproduction than vegetation at the reproductive stage. This allometric partitioning pattern remained consistent, regardless of fertilization or planting density, aligning with the allometric partitioning theory. In contrast, weeds biomass allocation strategies varied across fertilization and planting density gradients, indicating that weeds adjust biomass allocation in response to resource availability, consistent with the optimal partitioning theory.
Our findings align with previous studies on the effects of fertilization (Xia and Wan, 2008; Yue et al., 2016) and planting density (Fang et al., 1991) on plant biomass production. Fertilization enhanced aboveground, belowground, vegetative and reproductive biomass in both wheat and weeds, whereas higher planting density had negative effects, independent of ontogenetic stages. Increased N fertilizer application is expected to increase plant N uptake, enhance photosynthesis, and thereby improve biomass production (Lawlor et al., 2001). In contrast, increased plant density intensifies competition among individuals, modifying their structural and physiological characteristics by reducing resource availability per plant (Hecht et al., 2016; Postma et al., 2021; Rehling et al., 2021). Wheat exerted stronger competitive effects on weeds than weeds exerted on wheat, suggesting that wheat is a superior competitor, while weeds function as inferior competitors (Tables 3, 4). This finding contributes to our understanding of species coexistence mechanisms in wheat-weed communities, particularly within the framework of contemporary species coexistence theory, which considers both intraspecific and interspecific competition (Chesson, 2000; Kraft et al., 2015; Van Dyke et al., 2022). Our research also revealed that biomass accumulation was driven by the additive effects of ontogenetic stages, fertilization, and planting density on biomass, rather than interactive effects, consistent with previous studies (Dieleman et al., 2012; Poorter et al., 2012). This suggests that each factor independently contributes to biomass accumulation without significant interactions. These additive effects imply that wheat production can be managed more flexibly in agricultural practice. By independently optimizing fertilization and planting density, wheat yield can be maximized, (Miguez et al., 2008).
Standardized major axes regressions confirmed significant allometric scaling in wheat biomass distribution, indicating size-dependent allocation among aboveground, belowground, and reproductive components, consistent with the theory of allometric growth (Figure 4). Across gradients of fertilization and planting density, biomass allocation followed the same general allometric patterns: greater allocation to roots than shoots and greater allocation to reproduction than to vegetative structures. This suggests that while fertilization and planting density influence overall wheat biomass, the proportional allocation of biomass remains relatively fixed at a given plant size. Increased biomass allocation to roots suggests a greater limitation of water and nutrient than light, as root expansion is necessary for resource uptake, whereas light competition favors shoot growth (Padilla et al., 2009). During the reproductive phase, wheat prioritizes reproductive over vegetative biomass to ensure seed development and successful reproduction. This allocation strategy is likely a result of the “passive tendency” of this wheat variety to become a stable food crop after years of intensive human selection (Khan, 2016). Maintaining a balanced biomass distribution across roots, shoots, and reproductive organs is crucial for mechanical stability (Poorter et al., 2015). Future research on trait-size relationships in crop species will provide insights into how selective breeding for traits like high reproductive biomass can be harnessed to enhance crop yields (Westgeest et al., 2024).
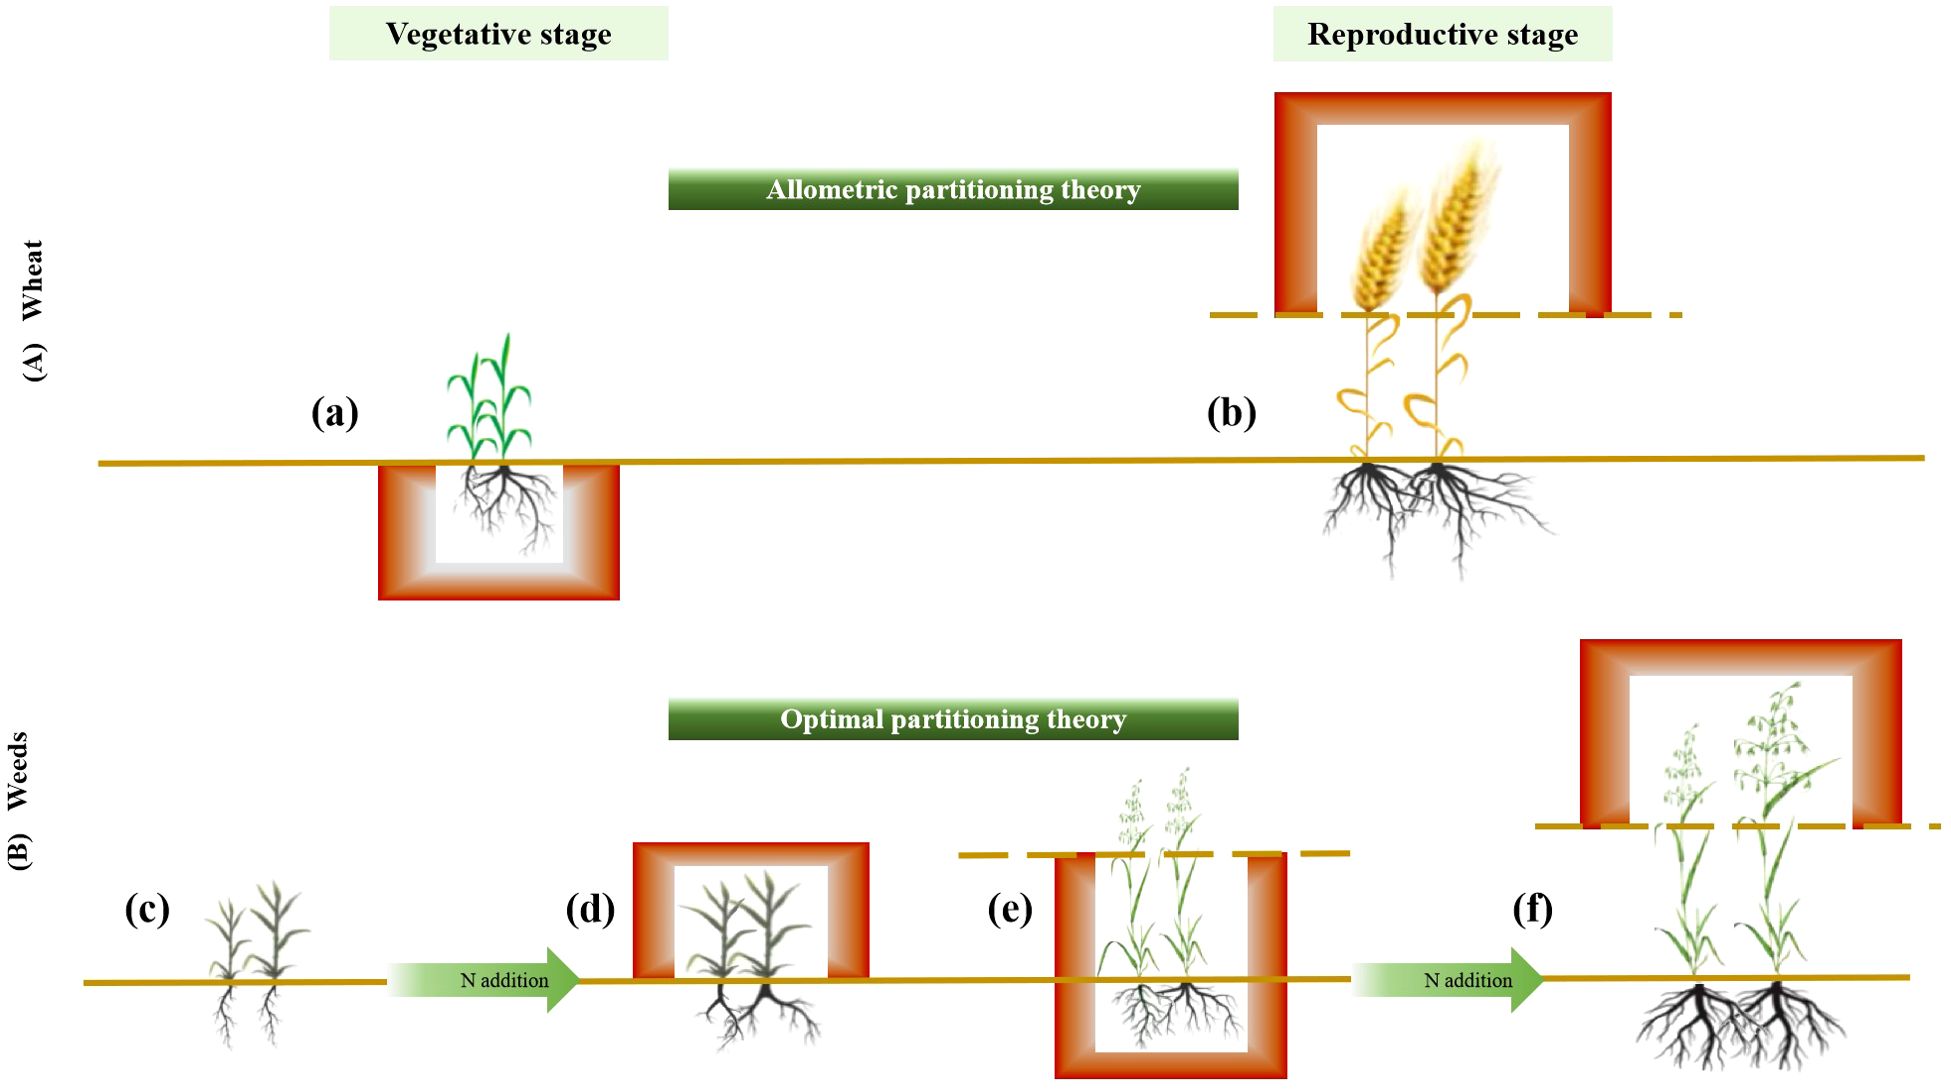
Figure 4. Diagram illustrating the effects of fertilization and planting density on the accumulation and allocation of aboveground, belowground, and reproductive biomass during the vegetative and reproductive stages in wheat and weeds. (A) Wheat follows the allometric partitioning theory, allocating more biomass to belowground than aboveground tissues during the vegetative stage (a) and more biomass to reproductive than vegetative structures during the reproductive stage (b), irrespective of fertilization and planting density. (B) Weeds exhibit allocation patterns consistent with the optimal partitioning theory, adjusting biomass distribution in response to resource availability. For example, at a density of 8 without fertilization, biomass was equally allocated between shoots and roots (c), whereas fertilization increased shoot allocation relative to root (d). At a density of 16 without fertilization, weeds allocated more biomass to vegetative growth than reproductive growth (e), but with fertilization, allocation shifted toward reproductive growth (f).
Weeds demonstrate allocation strategies that align with the optimal partitioning theory, adjusting their allocation patterns in response to the environment to enhance survival and reproduction (Figure 4). This adaptability is consistent with their invasive nature in agricultural systems, where they thrive without structured planting schemes and remain highly dependent on environmental conditions (Ramesh et al., 2017). For example, at a density of 8 without fertilization, biomass allocation between shoots and roots was nearly equal. However, after fertilization, allocation shifted toward greater root biomass, likely due to increased nitrogen availability. Both light and nitrogen limitations promote a balanced shoot-to-root biomass allocation, whereas fertilization reduces belowground competition for nitrogen, allowing plants to focus on root expansion to exploit spatially heterogeneous soil resources (Cleland et al., 2019). At a density of 16, weeds allocated more biomass to vegetative growth under non-fertilized conditions, whereas fertilization shifted allocation toward seed production. This pattern reflects high phenotypic plasticity in growth and reproduction, enabling weeds to persist in nutrient-poor conditions (Garrison et al., 2024; Grime, 1977). As nutrient limitations are alleviated, weeds can allocate more resources to reproduction, allowing them to expand their population under favorable conditions while securing offspring production when resources are abundant.
Our findings have important implications for understanding species coexistence and phenotypic plasticity in wheat and weeds under abiotic stress. Conducting a reproductive fitness and whole life-history experiment provides a comprehensive, whole-plant perspective, which is essential for unravelling the physiological and biochemical mechanisms underlying adaptability. This approach also offers valuable insights for optimizing agricultural management practices to enhance crop resilience and productivity.
Data availability statement
The raw data supporting the conclusions of this article will be made available by the authors, without undue reservation.
Author contributions
JX: Conceptualization, Data curation, Formal Analysis, Methodology, Visualization, Writing – original draft, Writing – review & editing. SS: Conceptualization, Data curation, Formal Analysis, Investigation, Validation, Writing – original draft, Writing – review & editing. YR: Conceptualization, Data curation, Investigation, Validation, Visualization, Writing – original draft, Writing – review & editing. JL: Conceptualization, Data curation, Investigation, Validation, Writing – original draft, Writing – review & editing. LZ: Conceptualization, Funding acquisition, Methodology, Resources, Supervision, Writing – original draft, Writing – review & editing.
Funding
The author(s) declare that financial support was received for the research and/or publication of this article. This work was supported by Jiangsu Provincial Innovation Research Program on Carbon Peaking and Carbon Neutrality (BT2024012), the National Natural Science Foundation of China (32101260) and Nanjing Forestry University (163100030).
Conflict of interest
The authors declare that the research was conducted in the absence of any commercial or financial relationships that could be construed as a potential conflict of interest.
Generative AI statement
The author(s) declare that no Generative AI was used in the creation of this manuscript.
Publisher’s note
All claims expressed in this article are solely those of the authors and do not necessarily represent those of their affiliated organizations, or those of the publisher, the editors and the reviewers. Any product that may be evaluated in this article, or claim that may be made by its manufacturer, is not guaranteed or endorsed by the publisher.
Supplementary material
The Supplementary Material for this article can be found online at: https://www.frontiersin.org/articles/10.3389/fpls.2025.1542205/full#supplementary-material
References
Acciaresi, H. A., Guiamet, J. J. (2010). Below-and above-ground growth and biomass allocation in maize and Sorghum halepense in response to soil water competition. Weed Res. 50, 481–492. doi: 10.1111/j.1365-3180.2010.00794.x
Adeux, G., Vieren, E., Carlesi, S., Bàrberi, P., Munier-Jolain, N., Cordeau, S. (2019). Mitigating crop yield losses through weed diversity. Nat. Sustainability 2, 1018–1026. doi: 10.1038/s41893-019-0415-y
Bloom, A. J., Chapin, F. S., Mooney, H. A. (1985). Resource limitation in plants-an economic analogy. Annu. Rev. Ecol. Systematics 16, 363–392. doi: 10.1146/annurev.ecolsys.16.1.363
Brancourt-Hulmel, M., Doussinault, G., Lecomte, C., Bérard, P., Le Buanec, B., Trottet, M. (2003). Genetic improvement of agronomic traits of winter wheat cultivars released in France from 1946 to 1992. Crop Sci. 43, 37–45. doi: 10.2135/cropsci2003.0037
Brooks, M. L. (2003). Effects of increased soil nitrogen on the dominance of alien annual plants in the Mojave Desert. J. Appl. Ecol. 40, 344–353. doi: 10.1046/j.1365-2664.2003.00789.x
Cheng, D. L., Niklas, K. J. (2007). Above-and below-ground biomass relationships across 1534 forested communities. Ann. Bot. 99, 95–102. doi: 10.1093/aob/mcl206
Cheng, D., Zhong, Q., Lin, M., Jin, M., Qian, R. (2011). The advance of allometric studies on plant metabolic rates and biomass. Shengtai Xuebao/Acta Ecologica Sin. 31, 2312–2320. doi: 10.3724/SP.J.1011.2011.00468
Chesson, P. (2000). Mechanisms of maintenance of species diversity. Annu. Rev. Ecol. Systematics 31, 343–366. doi: 10.1146/annurev.ecolsys.31.1.343
Cleland, E. E., Lind, E. M., DeCrappeo, N. M., DeLorenze, E., Wilkins, R. A., Adler, P. B., et al. (2019). Belowground biomass response to nutrient enrichment depends on light limitation across globally distributed grasslands. Ecosystems 22, 1466–1477. doi: 10.1007/s10021-019-00350-4
Dias-Filho, M. B. (1999). Physiological responses of two tropical weeds to shade: I. Growth Biomass allocation. Pesquisa Agropecuária Bras. 34, 944–952. doi: 10.1590/s0100-204x1999000600004
Dieleman, W. I., Vicca, S., Dijkstra, F. A., Hagedorn, F., Hovenden, M. J., Larsen, K. S., et al. (2012). Simple additive effects are rare: a quantitative review of plant biomass and soil process responses to combined manipulations of CO2 and temperature. Global Change Biol. 18, 2681–2693. doi: 10.1111/j.1365-2486.2012.02745.x
Enquist, B. J., Niklas, K. J. (2002). Global allocation rules for patterns of biomass partitioning in seed plants. Science 295, 1517–1520. doi: 10.1126/science.1066360
Falster, D. S., Duursma, R. A., Ishihara, M. I., Barneche, D. R., FitzJohn, R. G., Vårhammar, A., et al. (2015). BAAD: A biomass and allometry database for woody plants. Ecol. Soc. America. 96, 1445–1445. doi: 10.59350/ec8b2-x1a35
Fang, J. Y., Kan, M., Yamakura, T. (1991). Relationship between population growth and population density in monocultures of Larix leptolepis. Acta Bot. Sin. 33, 949–957.
Fang, T., Rao, M., Chen, Q., Liu, S., Lai, J., Chen, T., et al. (2023). Different biomass allocation strategies of geophytes and non-geophytes along an altitude gradient. Ecol. Indic. 146, 109805. doi: 10.1016/j.ecolind.2022.109805
FAO. (2023). Food and agriculture organization of the United Nations. FAOSTAT Online Database. Available online at: http://faostat.fao.org/.
Fischer, R. A., Ramos, O. M., Monasterio, I. O., Sayre, K. D. (2019). Yield response to plant density, row spacing and raised beds in low latitude spring wheat with ample soil resources: an update. Field Crops Res. 232, 95–105. doi: 10.1016/j.fcr.2018.12.011
Frink, C. R., Waggoner, P. E., Ausubel, J. H. (1999). Nitrogen fertilizer: retrospect and prospect. Proc. Natl. Acad. Sci. 96, 1175–1180. doi: 10.1073/pnas.96.4.1175
Garrison, A. J., Norwood, L. A., Conner, J. K. (2024). Plasticity-mediated persistence and subsequent local adaptation in a global agricultural weed. Evolution 78, 1804–1817. doi: 10.1093/evolut/qpae109
Grime, J. P. (1977). Evidence for the existence of three primary strategies in plants and its relevance to ecological and evolutionary theory. Am. Nat. 111, 1169–1194. doi: 10.1086/283244
Hecht, V. L., Temperton, V. M., Nagel, K. A., Rascher, U., Postma, J. A. (2016). Sowing density: a neglected factor fundamentally affecting root distribution and biomass allocation of field grown spring barley (Hordeum vulgare L.). Front. Plant Sci. 7. doi: 10.3389/fpls.2016.00944
Huangfu, C., Zhang, L., Hui, D. (2022). Density-dependent plant-soil feedbacks of two plant species affected by plant competition. Sci. Total Environ. 807, 150908. doi: 10.1016/j.scitotenv.2021.150908
Hulshof, C. M., Stegen, J. C., Swenson, N. G., Enquist, C. A., Enquist, B. J. (2012). Interannual variability of growth and reproduction in Bursera simAruba: the role of allometry and resource variability. Ecology 93, 180–190. doi: 10.1890/11-0740.1
Huxley, J. S. (1972). Problems of Relative Growth, 2nd ed. (Dover, New York: Johns Hopkins University Press). doi: 10.56021/9780801846595
Jia, X., Huangfu, C., Hui, D. (2020). Nitrogen uptake by two plants in response to plant competition as regulated by neighbor density. Front. Plant Sci. 11. doi: 10.3389/fpls.2020.584370
Khan, K. (2016). Wheat: chemistry and technology (Elsevier). American Association of Cereal Chemists.
Kraft, N. J., Godoy, O., Levine, J. M. (2015). Plant functional traits and the multidimensional nature of species coexistence. Proc. Natl. Acad. Sci. 112, 797–802. doi: 10.1073/pnas.1413650112
Lawlor, D. W., Lemaire, G., Gastal, F. (2001). Nitrogen, plant growth and crop yield. Plant Nitrogen, 343–367. doi: 10.1007/978-3-662-04064-5_13
LeBauer, D. S., Treseder, K. K. (2008). Nitrogen limitation of net primary productivity in terrestrial ecosystems is globally distributed. Ecology 89, 371–379. doi: 10.1890/06-2057.1
Liu, Q., Song, M., Kou, L., Li, Q., Wang, H. (2023). Contrasting effects of nitrogen and phosphorus additions on nitrogen competition between coniferous and broadleaf seedlings. Sci. Total Environ. 861, 160661. doi: 10.1016/j.scitotenv.2022.160661
Liu, R., Yang, X., Gao, R., Hou, X., Huo, L., Huang, Z., et al. (2021). Allometry rather than abiotic drivers explains biomass allocation among leaves, stems and roots of Artemisia across a large environmental gradient in China. J. Ecol. 109, 1026–1040. doi: 10.1111/1365-2745.13532
Luo, H. H., Qiang, W. A. N. G., Zhang, J. K., Wang, L. S., Li, Y. B., Yang, G. Z. (2020). One-time fertilization at first flowering improves lint yield and dry matter partitioning in late planted short-season cotton. J. Integr. Agric. 19, 509–517. doi: 10.1016/S2095-3119(19)62623-7
McCarthy, M. C., Enquist, B. J. (2007). Consistency between an allometric approach and optimal partitioning theory in global patterns of plant biomass allocation. Funct. Ecol. 21, 713–720. doi: 10.1111/j.1365-2435.2007.01276.x
Miguez, F. E., Villamil, M. B., Long, S. P., Bollero, G. A. (2008). Meta-analysis of the effects of management factors on Miscanthus × giganteus growth and biomass production. Agric. For. Meteorology 148, 1280–1292. doi: 10.1016/j.agrformet.2008.03.010
Müller, I., Schmid, B., Weiner, J. (2000). The effect of nutrient availability on biomass allocation patterns in 27 species of herbaceous plants. Perspect. Plant ecology Evol. Systematics 3, 115–127. doi: 10.1078/1433-8319-00007
Niklas, K. J. (2004). Plant allometry: is there a grand unifying theory? Biol. Rev. 79, 871–889. doi: 10.1017/s1464793104006499
Padilla, F. M., Miranda, J. D., Pugnaire, J. F. I. (2009). Variability in amount and frequency of water supply affects roots but not growth of arid shrubs. Plant Ecol. 204, 261–270. doi: 10.2307/40305764
Pallas, B., Da Silva, D., Valsesia, P., Yang, W., Guillaume, O., Lauri, P. E., et al. (2016). Simulation of carbon allocation and organ growth variability in apple tree by connecting architectural and source-sink models. Ann. Bot. 118, 317–330. doi: 10.1093/aob/mcw085
Peng, Y., Yang, Y. (2016). Allometric biomass partitioning under nitrogen enrichment: Evidence from manipulative experiments around the world. Sci. Rep. 6, 28918. doi: 10.1038/srep28918
Poorter, H., Jagodzinski, A. M., Ruiz-Peinado, R., Kuyah, S., Luo, Y., Oleksyn, J., et al. (2015). How does biomass distribution change with size and differ among species? An analysis for 1200 plant species from five continents. New Phytol. 208, 736–749. doi: 10.1111/nph.13571
Poorter, H., Niklas, K. J., Reich, P. B., Oleksyn, J., Poot, P., Mommer, L. (2012). Biomass allocation to leaves, stems and roots: meta-analyses of interspecific variation and environmental control. New Phytol. 193, 30–50. doi: 10.1111/j.1469-8137.2011.03952.x
Postma, J. A., Hecht, V. L., Hikosaka, K., Nord, E. A., Pons, T. L., Poorter, H. (2021). Dividing the pie: A quantitative review on plant density responses. Plant Cell Environ. 44, 1072–1094. doi: 10.1111/pce.13968
Qin, X. L., Weiner, J., Qi, L., Xiong, Y. C., Li, F. M. (2013). Allometric analysis of the effects of density on reproductive allocation and Harvest Index in 6 varieties of wheat (Triticum). Field Crops Res. 144, 162–166. doi: 10.1016/j.fcr.2012.12.011
Ramesh, K., Matloob, A., Aslam, F., Florentine, S. K., Chauhan, B. S. (2017). Weeds in a changing climate: vulnerabilities, consequences, and implications for future weed management. Front. Plant Sci. 8. doi: 10.3389/fpls.2017.00095
R Core Team (2022). R: A language and environment for statistical computing (Vienna, Austria: R Foundation for Statistical Computing). Available online at: www.R-project (Accessed June 16, 2024).
Rehling, F., Sandner, T. M., Matthies, D. (2021). Biomass partitioning in response to intraspecific competition depends on nutrients and species characteristics: A study of 43 plant species. J. Ecol. 109, 2219–2233. doi: 10.1111/1365-2745.13635
Ringselle, B., Prieto-Ruiz, I., Andersson, L., Aronsson, H., Bergkvist, G. (2017). Elymus repens biomass allocation and acquisition as affected by light and nutrient supply and companion crop competition. Ann. Bot. 119, 477–485. doi: 10.1093/aob/mcw228
Schoen, D. J., Johnson, M. T., Wright, S. I. (2019). The ecology, evolution, and genetics of plant reproductive systems. New Phytol. 224, 999–1004. doi: 10.1111/nph.16222
Shipley, B., Meziane, D. (2002). The balanced-growth hypothesis and the allometry of leaf and root biomass allocation. Funct. Ecol. 16, 326–331. doi: 10.1046/j.1365-2435.2002.00626.x
Thornley, J. H. M. (1972). A balanced quantitative model for root: shoot ratios in vegetative plants. Ann. Bot. 36, 431–441. doi: 10.1093/oxfordjournals.aob.a084602
Van Dyke, M. N., Levine, J. M., Kraft, N. J. (2022). Small rainfall changes drive substantial changes in plant coexistence. Nature 611, 507–511. doi: 10.1038/s41586-022-05391-9
Wang, Z., Gong, H., Sardans, J., Zhou, Q., Deng, J., Niklas, K. J., et al. (2022). Divergent nitrogen and phosphorus allocation strategies in terrestrial plant leaves and fine roots: A global meta-analysis. J. Ecol. 110, 2745–2758. doi: 10.1111/1365-2745.13985
Wang, Z., Yu, K., Lv, S., Niklas, K. J., Mipam, T. D., Crowther, T. W., et al. (2019). The scaling of fine root nitrogen versus phosphorus in terrestrial plants: a global synthesis. Funct. Ecol. 33, 2081–2094. doi: 10.1111/1365-2435.13434
Weiner, J. (2004). Allocation, plasticity and allometry in plants. Perspect. Plant Ecology Evol. Systematics 6, 207–215. doi: 10.1111/1365-2745.13532
West, G. B., Brown, J. H., Enquist, B. J. (1999). A general model for the structure and allometry of plant vascular systems. Nature 400, 664–667. doi: 10.1038/23251
Westgeest, A. J., Vasseur, F., Enquist, B. J., Milla, R., Gómez-Fernández, A., Pot, D., et al. (2024). An allometry perspective on crops. New Phytol. 244, 1223–1237. doi: 10.1111/nph.20129
Xia, J., Wan, S. (2008). Global response patterns of terrestrial plant species to nitrogen addition. New Phytol. 179, 428–439. doi: 10.1111/j.1469-8137.2008.02488.x
Yin, Q., Tian, T., Han, X., Xu, J., Chai, Y., Mo, J., et al. (2019). The relationships between biomass allocation and plant functional trait. Ecol. Indic. 102, 302–308. doi: 10.1016/j.ecolind.2019.02.047
Yoda, K. (1963). Self-thinning in overcrowded pure stands under cultivated and natural conditions (Intraspecific competition among higher plants XI.). J. Biol. Osaka City Univ. D. 14, 107–129.
Yue, K., Peng, Y., Peng, C., Yang, W., Peng, X., Wu, F. (2016). Stimulation of terrestrial ecosystem carbon storage by nitrogen addition: a meta-analysis. Sci. Rep. 6, 19895. doi: 10.1038/srep19895
Zhang, Z., Cao, Y. M., Wu, J. Y., Ma, Y. H., He, J. L., Zhou, D. (2019). Effects of different tillage methods on weed community diversity in winter wheat fields. J. Ecol. Rural Environ. 35, 210–216. doi: 10.1111/ele.13320
Zhang, Z., van Kleunen, M. (2019). Common alien plants are more competitive than rare natives but not than common natives. Ecol. Lett. 22, 1378–1386. doi: 10.1111/ele.13320
Zheng, Y., Yue, Y., Li, C., Wang, Y., Zhang, H., Ren, H., et al. (2023). Revolutionizing maize crop productivity: the winning combination of zigzag planting and deep nitrogen fertilization for maximum yield through root–shoot ratio management. Agronomy 13, 1307. doi: 10.3390/agronomy13051307
Keywords: allometric partitioning theory, biomass allocation, plant life history, reproductive strategy, size dependence
Citation: Xi J, Shi S, Rong Y, Liu J and Zhang L (2025) Contrasting allocation patterns in wheat and weeds: allometric belowground and reproductive investment versus optimal partitioning adaptations. Front. Plant Sci. 16:1542205. doi: 10.3389/fpls.2025.1542205
Received: 09 December 2024; Accepted: 28 March 2025;
Published: 24 April 2025.
Edited by:
Abazar Ghorbani, Guizhou University, ChinaReviewed by:
Zhiqiang Wang, Southwest Minzu University, ChinaHeng Huang, Sun Yat-sen University, China
Chaohe Huangfu, Anhui University, China
Copyright © 2025 Xi, Shi, Rong, Liu and Zhang. This is an open-access article distributed under the terms of the Creative Commons Attribution License (CC BY). The use, distribution or reproduction in other forums is permitted, provided the original author(s) and the copyright owner(s) are credited and that the original publication in this journal is cited, in accordance with accepted academic practice. No use, distribution or reproduction is permitted which does not comply with these terms.
*Correspondence: Li Zhang, emhhbmdsQG5qZnUuZWR1LmNu