Abstract
Large-scale prediction of tree diameter at breast height (DBH) using airborne LiDAR remains constrained by models that inadequately address differences in tree growth stages and regional ecological variation. Existing approaches often overlook non-linear growth patterns and hierarchical spatial effects, thereby limiting predictive accuracy and scalability. In this study, we developed a DBH estimation model tailored for Cunninghamia lanceolata forests by integrating field-measured DBH with corresponding airborne LiDAR data collected from 26,768 trees across 130 plots in Guangdong Province, China. To capture growth-stage variability, a dummy variable approach was implemented to enable stage-specific adjustments within the model. Moreover, a two-level linear mixed-effects model was employed to account for nested spatial heterogeneity at both regional and stand levels. Competing model structures were rigorously evaluated using Akaike Information Criterion (AIC) and multiple error metrics, and the final model performance was validated with an independent dataset. Our results demonstrate that incorporating growth-stage differentiation and multilevel random effects significantly enhances model accuracy, with additional improvements observed upon including stand density and crown width indicators. The final model outperformed traditional approaches, effectively capturing spatial and ontogenetic variability. This study provides a methodological foundation for improving DBH estimation of Cunninghamia lanceolata using airborne LiDAR data. While further validation is needed, the modeling framework may also offer a potential basis for future applications using UAV-borne LiDAR platforms in similar forest environments.
1 Introduction
Forests play a crucial role in carbon sequestration and climate regulation, making accurate forest inventory data essential for sustainable forest management (Bonan, 2008). Diameter at breast height (DBH) is a key metric for forest management, providing essential information for estimating tree stock, biomass, and carbon storage (Fischer and Traub, 2019). Traditional DBH measurement using manual tools such as calipers is accurate but inefficient, making it unsuitable for large-scale forest resource assessments (Popescu and Wynne, 2004).
The advancement of remote sensing technologies has significantly improved forest inventory efficiency and scalability (Gonzalez-Benecke et al., 2014). LiDAR excels at capturing forest structure, providing valuable insights into forest metrics and stand characteristics (Faridhouseini et al., 2011). Previous studies have demonstrated the utility of LiDAR in estimating stand-level metrics (Falkowski et al., 2006; González-Ferreiro et al., 2012) and individual tree attributes (Aubry-Kientz et al., 2019; Wang et al., 2020; Yuwei et al., 2021). However, airborne LiDAR cannot directly measure DBH (Liu et al., 2018), and while handheld or backpack LiDAR improves efficiency, it is limited by understory complexity and small-scale applicability (Bu and Wang, 2016; Hui et al., 2024). Furthermore, existing DBH models primarily focus on stand-level metrics and often fail to capture individual tree-level variability, particularly across different growth stages and environmental conditions (Piao et al., 2018; Zhang et al., 2023). This underscores the need for more refined models that can integrate multiple influencing factors, including site-specific differences and within-stand competition, to improve predictive performance and generalizability.
DBH can be categorized into stand-level and individual tree-level metrics, with individual tree DBH being critical for detailed forest management and improved precision in forest operations (Sparks and Smith, 2022). While tree height and crown width have been widely used as DBH model predictors (Filipescu et al., 2012; Sharma et al., 2019; Nigul et al., 2021; Iizuka et al., 2022; Tinkham et al., 2022; Lele et al., 2023), Growth rates differ across age classes (Mu et al., 2017; Liu et al., 2020a), and models incorporating growth stage effects tend to improve predictive accuracy (Mu et al., 2017; Xiao et al., 2022). Similarly, competition within stands alters growth strategies, with intense competition favoring height over diameter growth (Kunstler et al., 2011; Wertz et al., 2020). addition to growth stage and competition, regional differences such as climate, soil type, and topography also significantly affect tree growth patterns (Canham et al., 2018; Luo et al., 2024). Therefore, developing a modeling framework that incorporates multi-scale variability and site-specific influences is essential for improving DBH estimation at both the stand and individual tree levels.
Chinese fir is a commercially and ecologically important species native to southern China. Accurate large-scale DBH estimation for Chinese fir can improve forest resource management and ecological monitoring. This study aims to: (1) develop a two-level nonlinear mixed-effects model, using blocks and plots as random effects, to enhance the accuracy of individual tree DBH estimation for Chinese fir. improve individual tree DBH estimation accuracy; (2) evaluate the influence of growth stage and competition intensity on DBH estimation; and (3) propose a scalable DBH estimation method using airborne LiDAR data to support large-scale forest management and resource assessment.
2 Materials and methods
2.1 Data description
The study area is located in five forested regions in Guangdong Province, China (20°09′~25°31′N and 109°45′~117°20′E) (Figure 1). The study area is predominantly situated in the northwestern part of Guangdong, characterized by a landscape of mountains and low hills. Slopes within the region range from 10° to 40°, with generally high relief in the north and lower relief in the south. Precipitation in this region is concentrated from April to September, with an average annual rainfall of 1,777 mm. The highest recorded average annual rainfall can reach 2,321 mm. The region has an average annual temperature of 21.8°C, with warm temperatures throughout the year and abundant rainfall. The soil in the study area is primarily red and yellow loam. This area is an important part of the middle subtropical zone in China and one of the key distribution areas for Chinese fir.
Figure 1
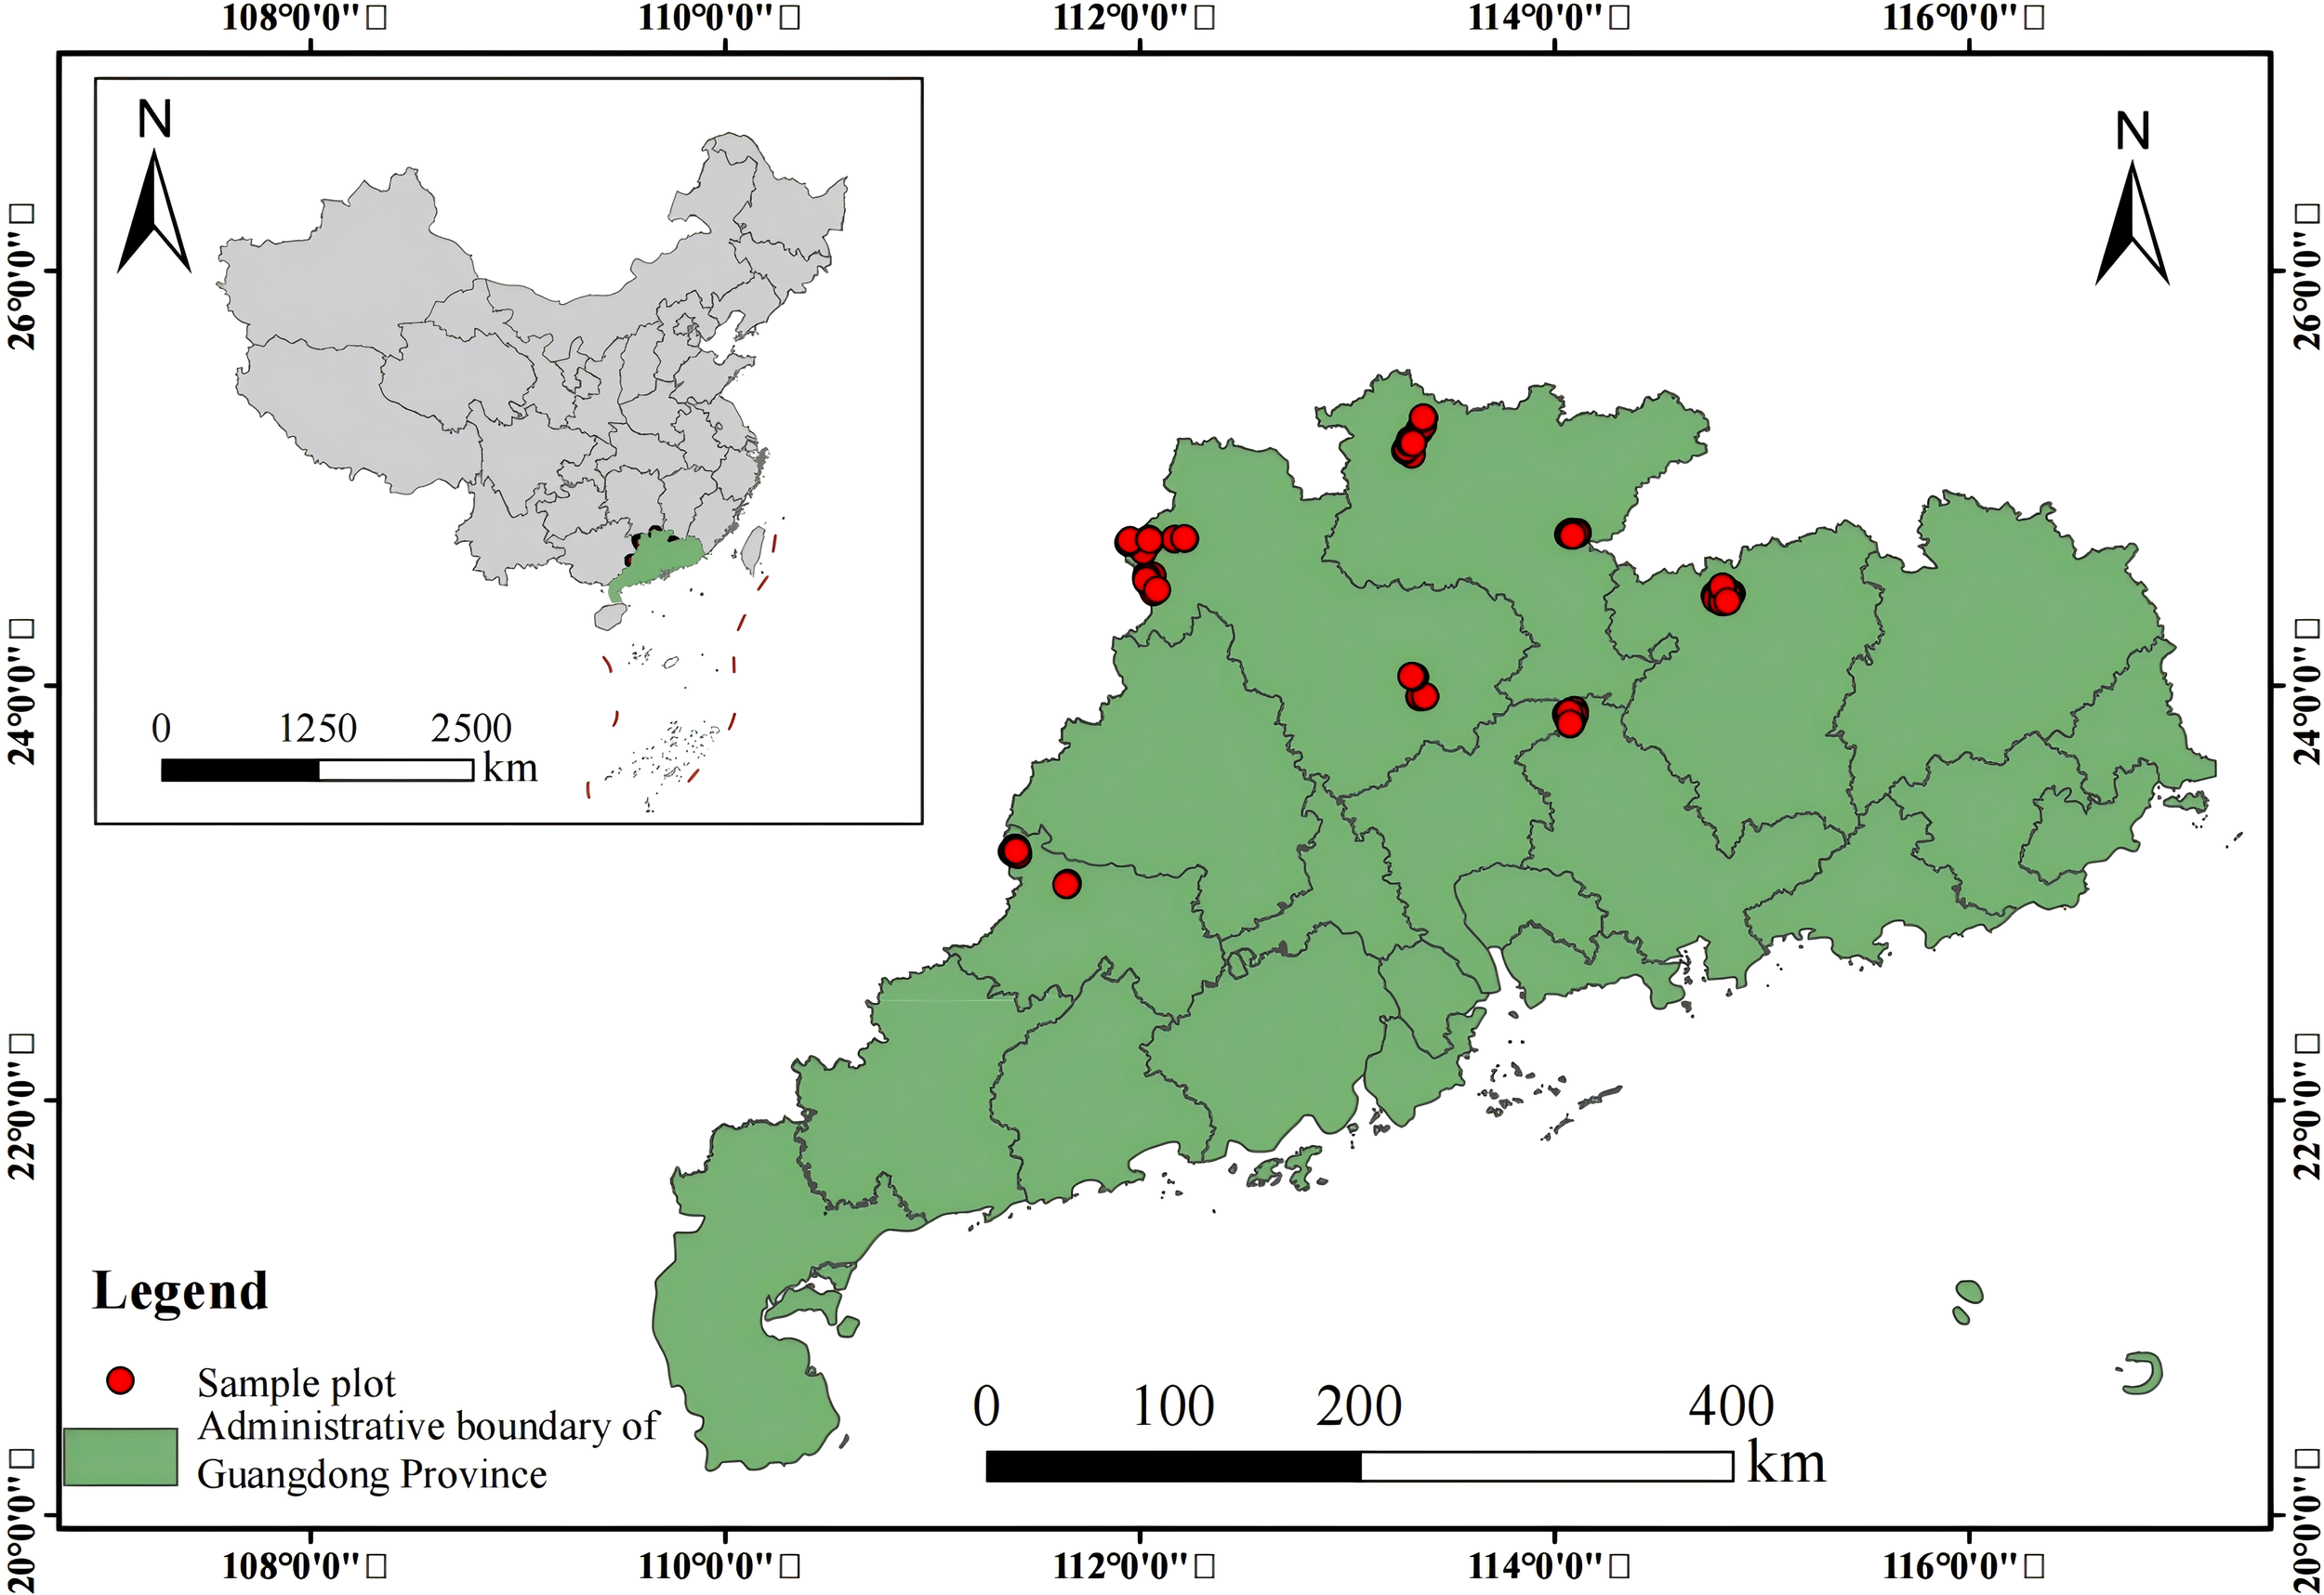
Plot of site location.
In March 2024, we selected representative Chinese fir(Cunninghamia lanceolata) plantation forests and established 130 sample plots containing a total of 26,768 trees, each covering an area of 666.67 m2. The basic site conditions of the sample plots were recorded, and for each tree within the plots (with a DBH > 5 cm), we measured the tree height(H), diameter at breast hight(DBH), height crown base, and crown width(CW) in four perpendicular directions. The exact location of each tree within the plot was also recorded.
In June 2024, we collected data from all the plots using airborne LiDAR. The equipment used to collect the data was the AS-1300HL LiDAR system, which is equipped with the Rigel VUX-1LR laser scanner. This system operates at a wavelength of 1550 nm, with a pulse duration of 3.5 ns and a laser beam divergence of 0.5 m rad. The pulse repetition frequency is set at 50 kHz, the maximum scan angle is 30°, and the scanning frequency is 49 Hz. A grid-pattern flight path was used, with a 50% side overlap of the point clouds. The average flight speed was 10 m/s, and the average point cloud density was 200 points per square meter.
The independent validation method is one of the most commonly used methods to test the generalization ability and fitting effectiveness of a model, we used 70% of the data as modeling data and 30% as independent validation dataset, Collected UAV LiDAR data were preprocessed using LiDAR 360 software. Noise filtering of the point cloud was performed using a neighborhood-based approach with a threshold set at three times the standard deviation. Ground points were identified using an improved progressive triangulated irregular network (TIN) densification filtering algorithm, enabling point cloud normalization. Individual tree segmentation was conducted using a distance-based single tree segmentation algorithm.
In cases of high stand density, where the point clouds might become densely packed, we performed an additional manual segmentation step to ensure accurate delineation of individual trees. This secondary segmentation ensured that overlapping or closely spaced trees were properly separated, maintaining the quality and accuracy of the segmentation process. The correlation between the LiDAR-derived tree height (H) and the field-measured values reached 0.79, and the overall correlation coefficient between canopy width and measured values was 0.63. Stand density indicators were the number of plants per hectare based on sample plot surveys, and the growth stage of fir trees was determined by the age group. A detailed summary of the data is given in Table 1. Box plots of the distribution of breast diameter with age groups are shown in Figure 2.
Table 1
| Training data | Testing data | |||||||||
|---|---|---|---|---|---|---|---|---|---|---|
| DBH | LH | LCD | S | A | DBH | LH | LCD | S | A | |
| Max. | 51.20 | 32.58 | 12.29 | 5311 | 40 | 44.10 | 29.76 | 16.47 | 5311 | 40 |
| Mean | 14.69 | 13.14 | 2.32 | 2878 | 18.24 | 14.71 | 13.13 | 2.33 | 2866 | 18.28 |
| Min. | 5.00 | 3.82 | 0.04 | 433 | 6 | 5.00 | 3.51 | 0.046 | 433 | 6 |
| Stand error | 5.02 | 3.90 | 1.40 | 916 | 9.82 | 5.01 | 3.91 | 1.42 | 919 | 9.70 |
Summary statistics of data acquired by both methods (UAV LiDAR and ground measurement).
DBH, stem outside bark diameter at 1.3 m height (cm); LH, tree height by lidar (m); LCD, Crown width by lidar (m); S, number of living trees per hectare (ha); A: the age of an individual tree (years).
Figure 2
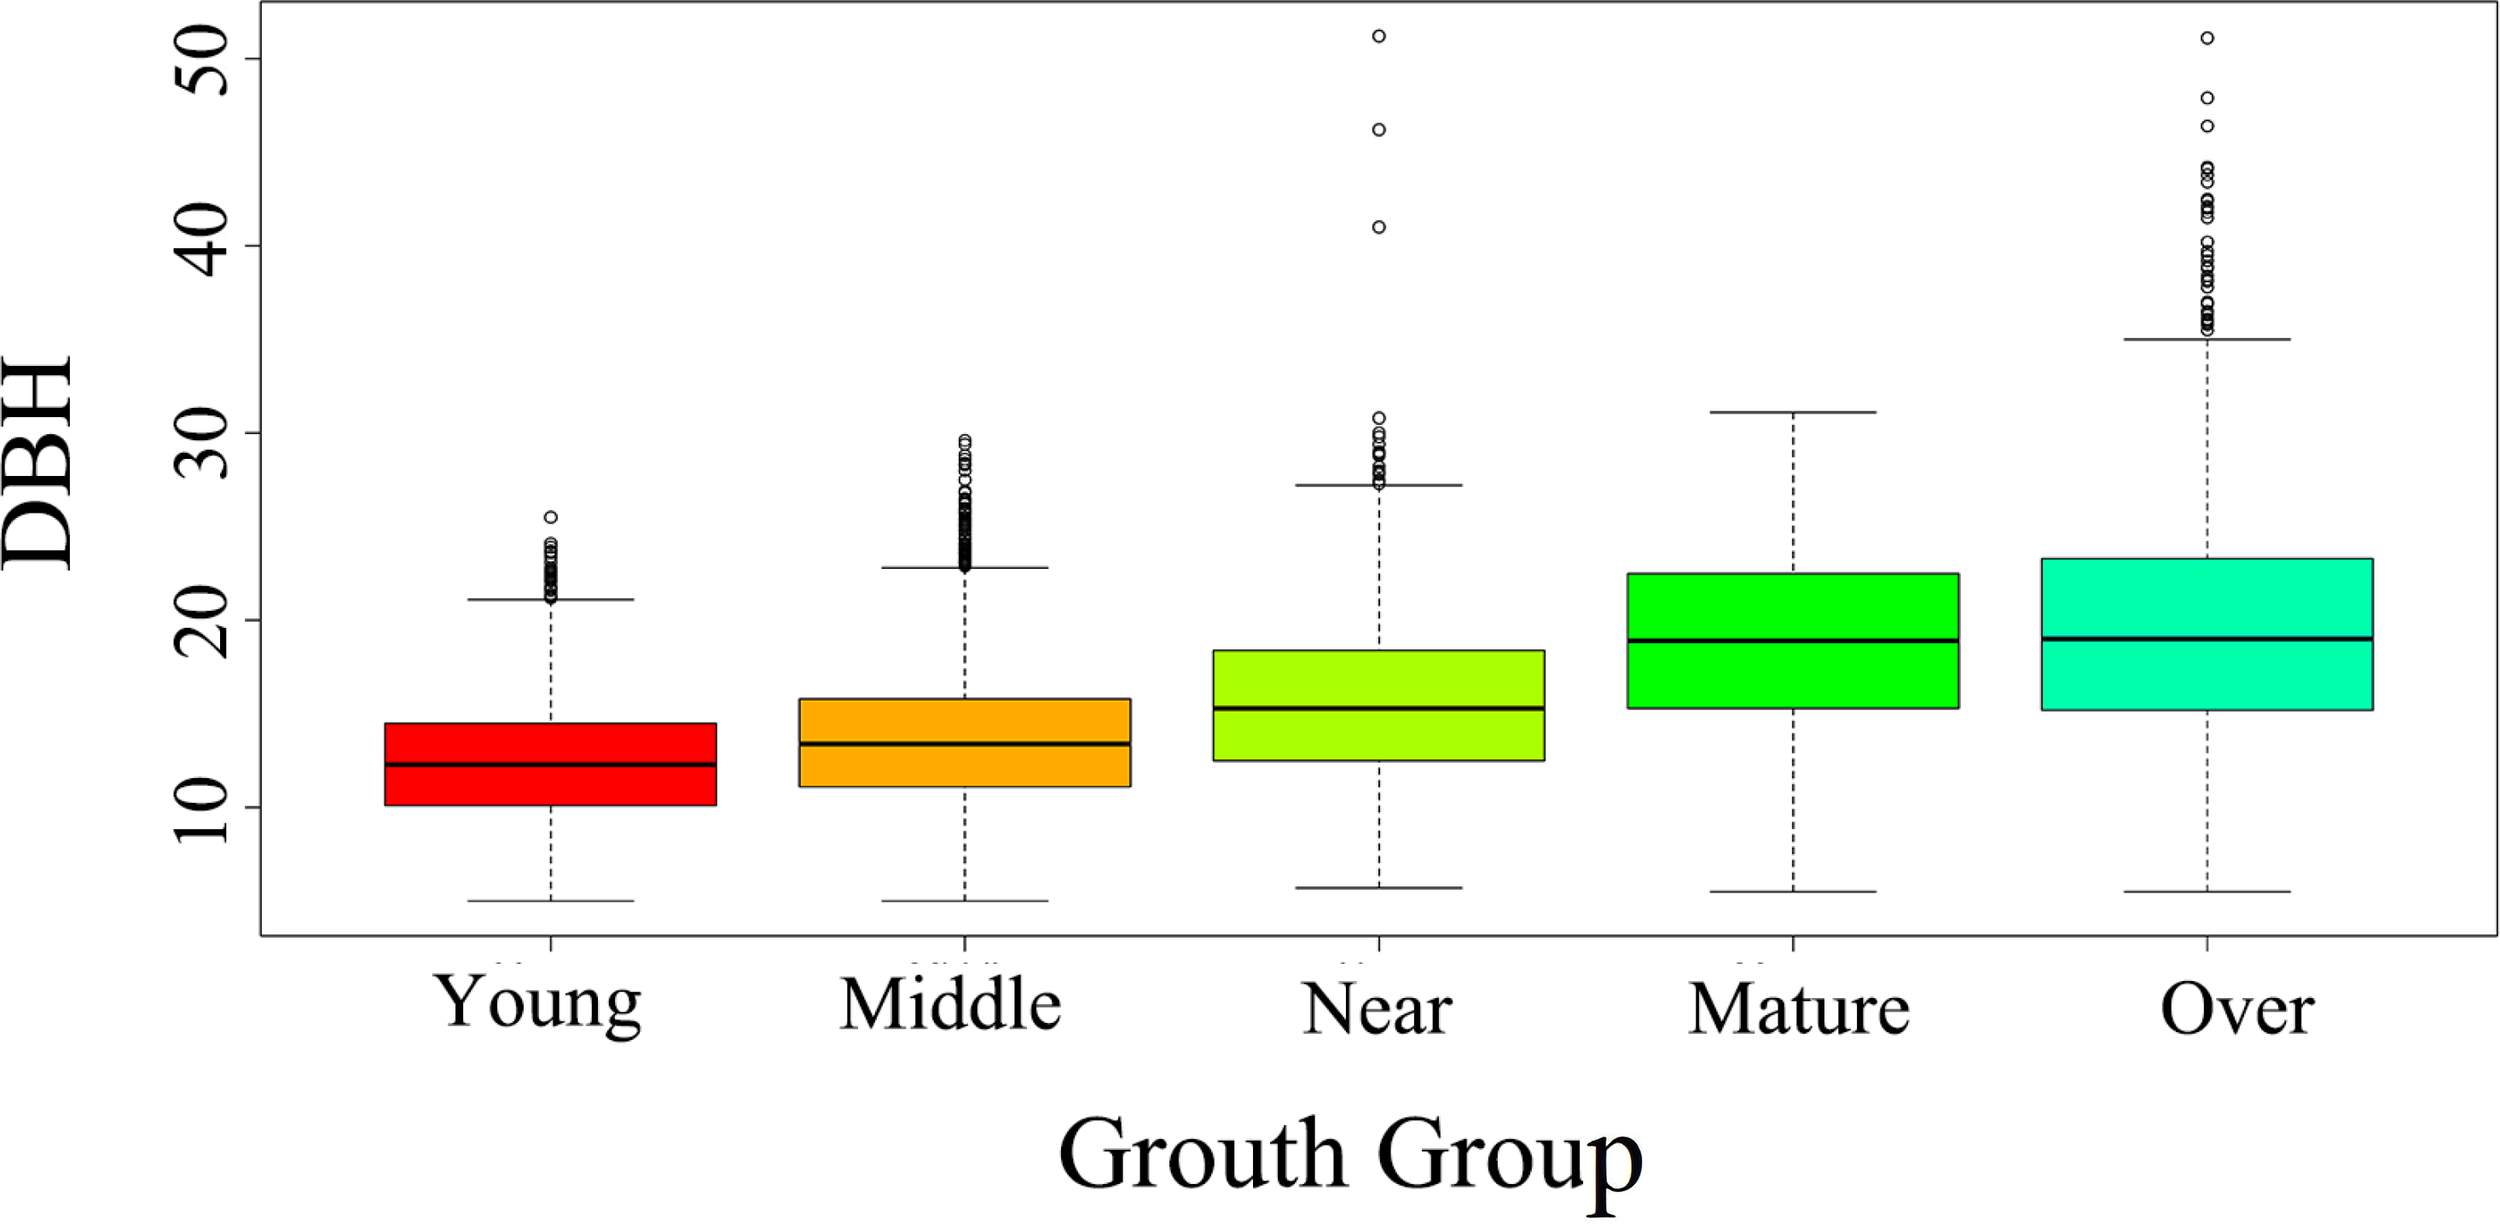
The box plots of the distribution of breast diameter with age groups.
2.2 Modeling Methods
2.2.1 Basic models
Tree H and DBH are highly correlated (Hao et al., 2016), and airborne LiDAR excels at providing accurate height data. To model the relationship between DBH and LiDAR-derived height, five candidate models were selected to describe the curvilinear relationship between DBH and H: linear, Weibull, logistic, Wykoff, and Gompertz models (Xue-hua et al., 2013).These models have been widely applied in forestry for capturing tree growth patterns and height-diameter relationships. Since DBH is also frequently used to estimate tree height, we reversed the equations of several established H-DBH models (Filipescu et al., 2012) to generate additional candidate models for DBH estimation. Ultimately, a total of ten candidate base models were identified. The mathematical expressions of these models are presented in Table 2.
Table 2
| Model | Equation | Name |
|---|---|---|
| Two-parameter models | ||
| M1 | Linear | |
| M2 | Allometric growth model | |
| M3 | Exponential functions | |
| M4 | Logarithmic functions | |
| M5 | Tuan et al., 2019 | |
| M6 | Wykoff et al, 1982 | |
| Three-parameter models | ||
| M7 | Allometric model with intercepts | |
| M8 | Yang et al., 1978 | |
| M9 | Clarke and Haines, 1995 | |
| M10 | Exponential | |
Basic DBH - height models evaluated.
D, diameter at breast height; H, tree height; a, b, and c are parameters to be estimated.
2.2.2 Variable selection
LiDAR-derived metrics were classified into two primary categories: height-related metrics (e.g., tree height) and canopy-related metrics (e.g., crown width, canopy area, and canopy volume). These metrics are widely used in forestry due to their strong ecological interpretation and demonstrated correlations with DBH (Brolly et al., 2012). To account for competition effects, stand density was extracted by counting individual trees identified through LiDAR point cloud segmentation within each sample plot. Studies have shown that LiDAR-derived metrics often exhibit multicollinearity (Silva et al., 2016; Stitt et al., 2022). To mitigate this issue, we first conducted a Variance Inflation Factor (VIF) test and retained only those variables with VIF< 5 (Peereman et al., 2021). Subsequently, a Pearson correlation analysis was performed on the selected variables to identify the optimal set for model development. Once the base model (Table 2) was established, additional variables were gradually introduced through the reparameterization or other statistical methods to optimize the models’ evaluation metrics (Equations 3-6).
2.2.3 Dummy variable modeling
Dummy variables allow for the inclusion of categorical variables into the model, i.e., growth stages or age groups can be included in the form of dummy variables to influence the model. Tree growth patterns can vary across different growth stages, as observed in species, such as Picea abies (Konopka et al., 1987), Calocedrus formosana (Chiu et al., 2015), and Larix (Orzeł, 2007). Chinese fir is a typical fast-growing species, and according to age, we categorized fir into five growth stages: young (1–10 years), middle-aged (11–20 years), near mature (21–25 years), mature (26–36 years), and overmature (>36 years), and we used this to characterize the effect of growth stage on the model of DBH. Therefore the DBH model was developed by incorporating the tree growth stage as a dummy variable. The dummy variable model is formulated as shown in Equation 1.
Where:ai are model parameters and Gi is the dummy variable which can be 0 or 1. i =1,2,3,4,5. When G1 = 1,G2,G3,G4 and G5 are 0, and so on, G1 refers to young fir forests and G5 refers to over-mature fir forests, g(LH, C, ci) represents a DBH model with LH and C as variables and ci as parameter, HL and C are independent variables in the model, and ε represents the error term.
The established dummy variable model not only incorporates the individual tree variables and competition variables but also accounts for the impact on the changes in DBH. The optimal form of the model and its fitting performance are determined and selected based on model evaluation metrics (Equations 3-6).
2.2.4 Mixed-effects modeling
A combination of factors, such as regional climatic conditions, significantly influences DBH growth (Liu et al., 2020b). Even within the same region, subtle environmental and competitive differences between sample sites can lead to variations in DBH growth. Therefore, it is essential to consider both inter-regional and intra-regional differences when modeling DBH growth. To better account for these hierarchical influences, we implemented a two-level nonlinear mixed-effects model that captures both broad regional variability and localized site-specific effects. This approach enhances the accuracy of DBH growth estimation by incorporating nested random effects, providing a more refined representation of the underlying biological and environmental processes. In this model, tree growth is expressed as a function of both broad regional influences and localized site-specific factors. By integrating random effects at both the regional and sample plot levels, The general form of the two-level nonlinear mixed-effects model is presented in Equation 2.
where DBHijk represents the diameter at breast height (DBH) of the k-th tree in the j-th sample plot of the i-th region.; fijk is DBH model that includes two-level random effects; is the model with LHijk and Cijk as variables and with as the parameter to be estimated. ui and vij are random effects vectors indicating the level of sample plots in the region and within the region, respectively. denotes the random error in k-th tree diameter at breast height for j-th sample plots in i-th region, and refer to the corresponding random-effects variance-covariance matrixes, and refers to the random error variance. The random effects assumption and the error term assumption are independent of each other and each follows a normal distribution.
Mixed-effects model was fitted by the nlme package in R 4.2.3. Model parameters were estimated using the restricted maximum likelihood (REML) method (Corbeil and Searle, 1976), which provides unbiased estimates of variance components by accounting for the degrees of freedom consumed in estimating fixed effects. After fitting the model, we used the AIC and the likelihood ratio test(LRT) to evaluate model performance and select the best-fitting model (Fang and Bailey, 2001). AIC was used to compare model fit by balancing model complexity and goodness of fit, while LRT assessed the significance of additional model terms.
2.3 Model evaluation
In this study, we used an independent validation approach to model validation, and we randomly divided the data into two datasets, with 70% of the data used for model fitting (18738 observations) and the other 30% for model validation (8030 observations). The model evaluation metrics were AIC (Akaike Information Criterion), R2 (Coefficient of Determination), RMSE (Root Mean Squared Error) and TRE (Total Relative Error).
where is the maximum likelihood of the model; is the number of observations;p is the number of parameters in the model;Diis the i-th observed value of the DBH; is the i-th predicted value of the DBH; is the mean value of the DBH.
3 Results
3.1 Selected variables and their correlations with DBH
After VIF testing, the final retained variables were CW and S. The results of the VIF values are shown in Table 3. Pearson correlation analysis revealed that LiDAR-derived tree height exhibited the highest correlation with ground-measured DBH, indicating its strong predictive power. Both stand density and CW also showed correlations with DBH, consistent with their biological roles in tree growth — CW representing the proportion of stand growth and stand density reflecting competition intensity within the stand. In contrast, canopy area and canopy volume exhibited weaker correlations with DBH, suggesting that they contribute less to explaining diameter variability. To enhance model generalizability and reduce overfitting, we ultimately selected tree height, canopy width, and stand density as covariates in the DBH model. The correlation heatmap between DBH and the various variables is shown in Figure 3.
Table 3
| Variable | LH | LCD | S |
|---|---|---|---|
| VIF | 1.799 | 1.200 | 1.600 |
VIF values for each variable.
Figure 3
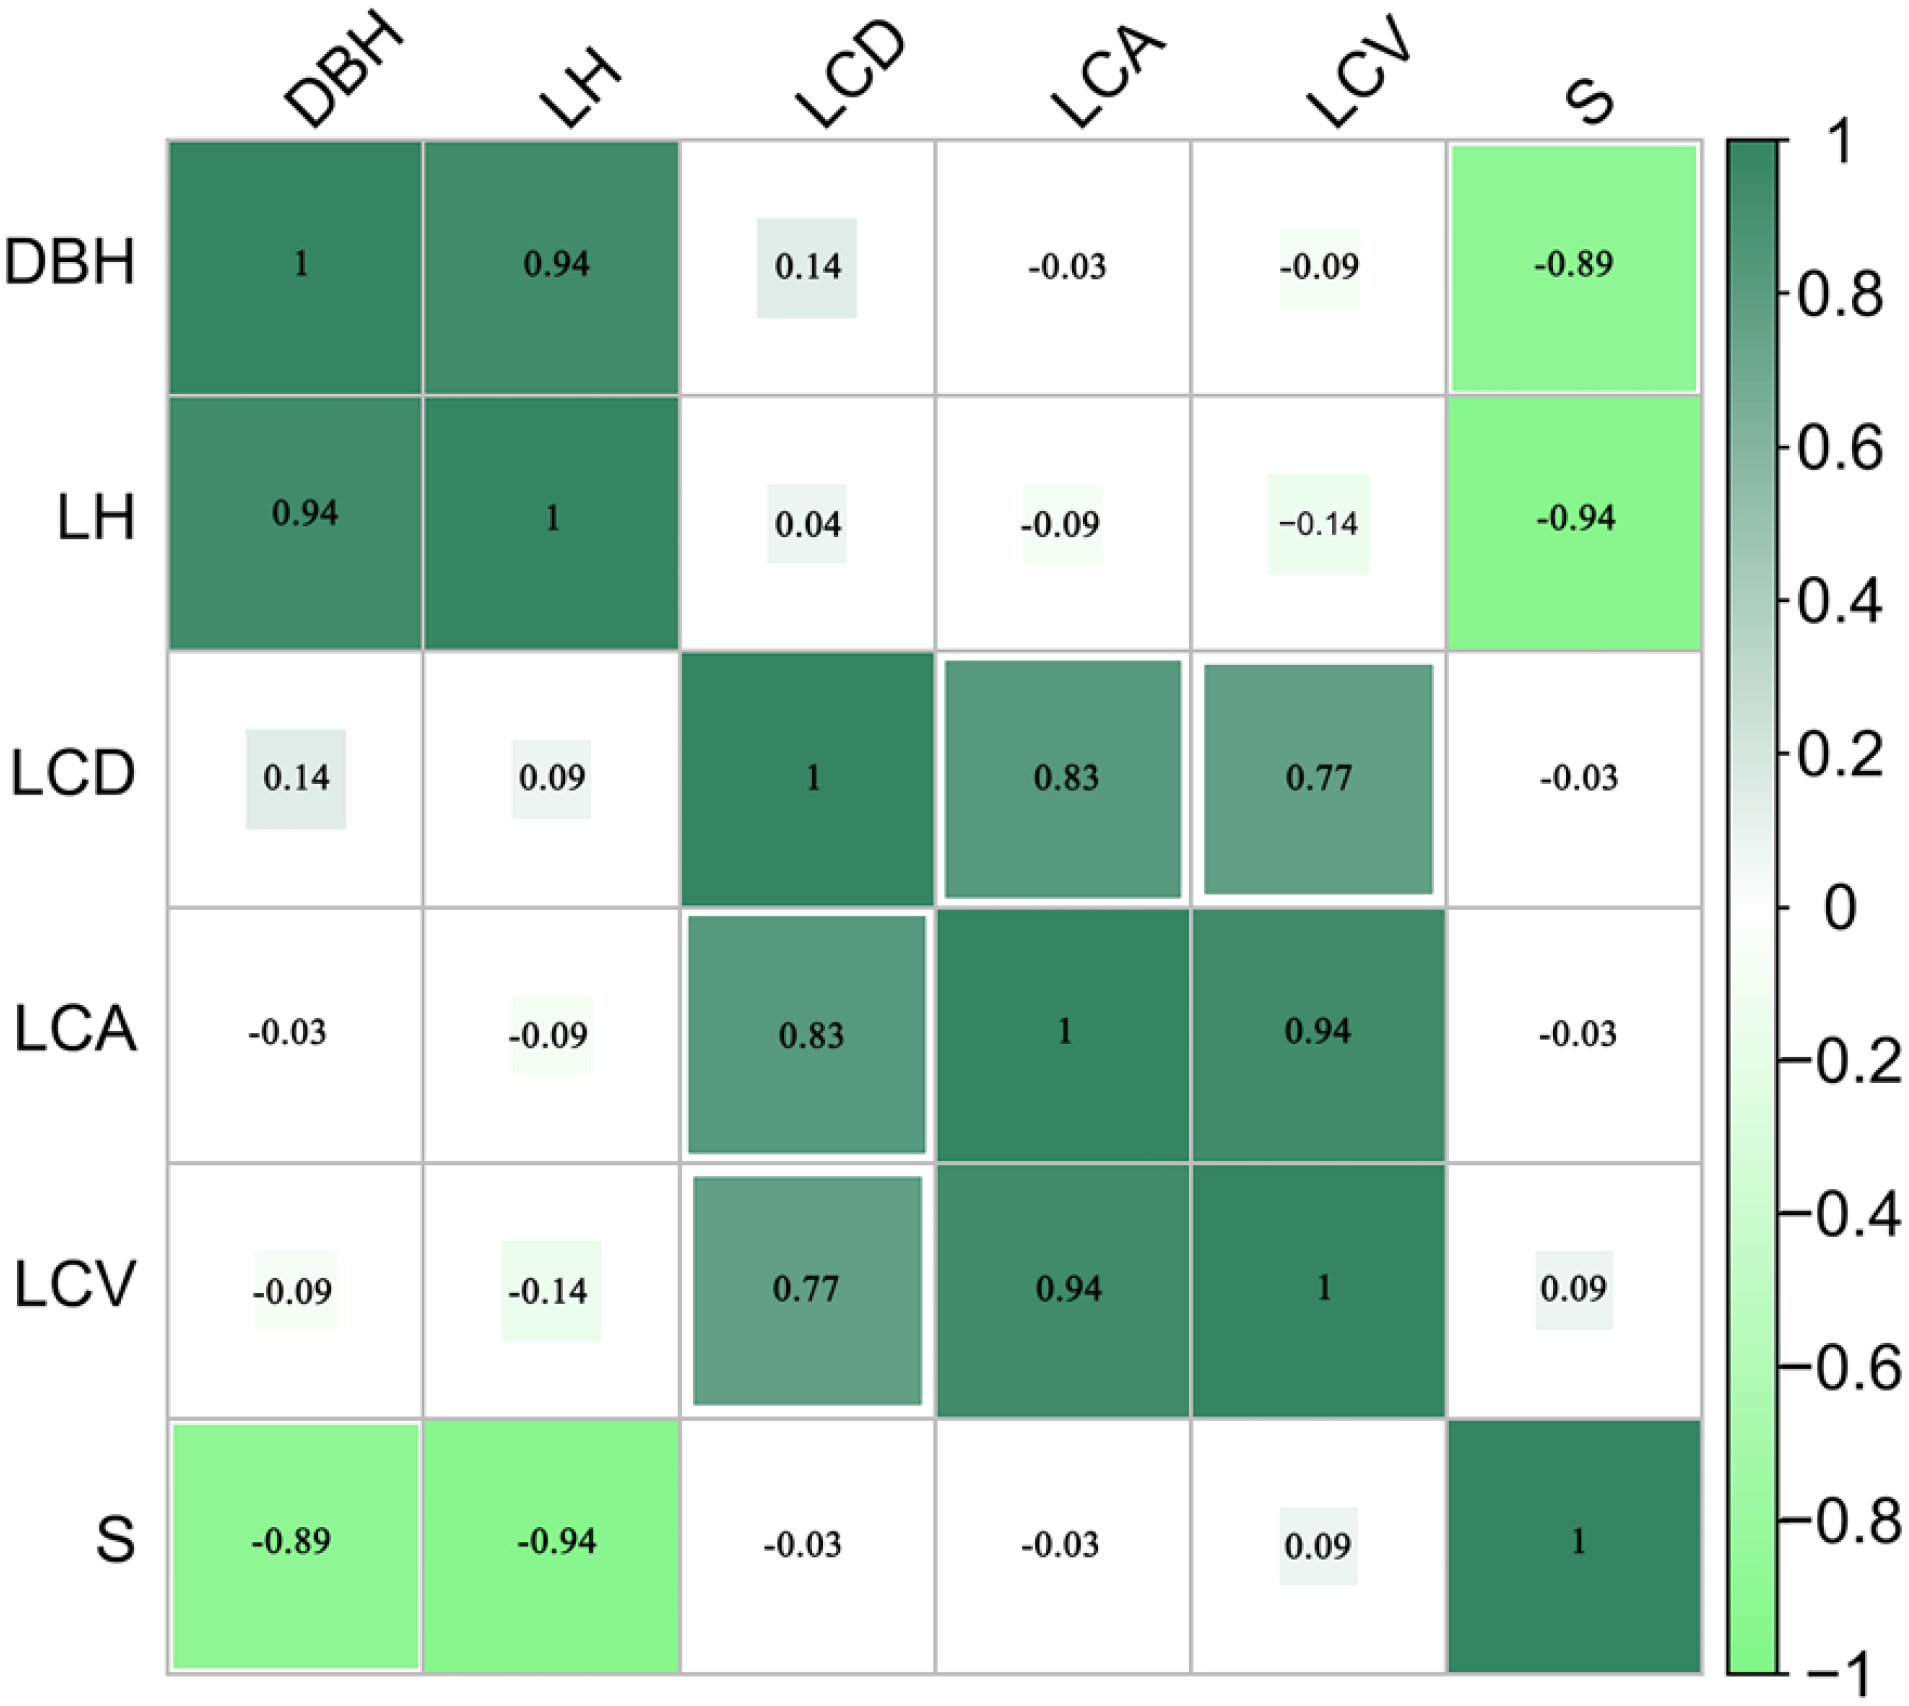
The correlation heatmap between diameter at breast height and various variables is provided. DBH represents the ground truth diameter at breast height (DBH), LH denotes tree height, and LCD, LCA, and LCV represent canopy width derived from LiDAR data. S refers to stand density.
3.2 Generalized OLS model
As shown in Table 4, Model M7 was selected as the optimal base model due to its highest R² and lowest RMSE and AIC values, indicating that the most appropriate relationship between individual tree DBH and tree height follows an intercept plus power function. To account for the effects of multiple variables on DBH estimation, variables were gradually added to M7 using a stepwise reparameterization procedure based on the continuous product of power functions. A total of ten reconstructed model forms were compared, and the extended version of the base model, known as a generalized OLS model (Equation 7), demonstrated superior predictive performance over the best base model (M7) (Table 5). An F-test comparing Equation 7 and M7 indicated that the generalized model improved predictive ability and statistical significance (F = 470, p< 0.001). Although the improvement in predictive accuracy was modest, the new model enhanced interpretability and increased robustness under varying site conditions.
Table 4
| Model | Training data | Testing data | AIC | ||
|---|---|---|---|---|---|
| R2 | RMSE(cm) | R2 | RMSE(cm) | ||
| M1 | 0.6028 | 3.160 | 0.6027 | 3.1535 | 69655 |
| M2 | 0.6024 | 3.165 | 0.6023 | 3.1589 | 69701 |
| M3 | 0.5989 | 3.1790 | 0.5971 | 3.1797 | 69821 |
| M4 | 0.4131 | 3.8456 | 0.4143 | 3.8337 | 74979 |
| M5 | 0.6041 | 3.1730 | 0.6004 | 3.1667 | 69770 |
| M6 | 0.2265 | 9.5978 | 0.2101 | 9.6921 | 99772 |
| M7 | 0.6053 | 3.1530 | 0.6049 | 3.1489 | 69604 |
| M8 | 0.5916 | 3.2078 | 0.5919 | 3.1999 | 70066 |
| M9 | 0.5635 | 3.3163 | 0.5624 | 3.3137 | 70967 |
| M10 | 0.5635 | 3.3163 | 0.5624 | 3.3137 | 70967 |
Fit indicators of the base models.
Table 5
| Dataset | Indicators | M7 | Equation 7 |
|---|---|---|---|
| Train set | RMSE (cm) | 3.153 | 3.049 |
| TRE (%) | 4.302 | 4.012 | |
| R2 | 0.6053 | 0.6301 | |
| Test set | RMSE (cm) | 3.151 | 3.059 |
| TRE (%) | 4.290 | 4.051 | |
| R2 | 0.6052 | 0.6261 | |
| Evaluation | AIC | 69604 | 68698 |
| F (M7 VS Equation 7) | 470 | ||
| p-value | <0.001*** | ||
Fit indicators of base model (M7) and Equation 7.
The expression for this model is as follows:
3.3 Dummy variable model
Dummy variables were introduced to represent different age groups, allowing the model to account for growth stage-specific variations. To avoid overfitting and excessive model complexity, we incorporated dummy variables for only one parameter to balance model performance and simplicity. Through a systematic evaluation procedure, the model that applied dummy variables to parameter b demonstrated the best fit, as indicated by the lowest AIC. Parameter b reflects the growth rate adjustment across different age groups, suggesting that growth stage variations primarily influence the scaling factor rather than the base growth function. The model specification is as follows:
where: G1, G2, G3, G4 and G5 are dummy variables representing the different age classes of Chinese fir: young forest, middle-aged forest, near-mature forest, mature forest, and over-mature forest, respectively.
3.4 Mixed-effects model
Figure 4 presents the distribution of DBH across different forest regions. It is evident that DBH varies significantly among regions, with some regions (e.g., Tl, Sx) exhibiting greater DBH variability and higher median values compared to others (e.g., Hp, Dt). These differences highlight the necessity of incorporating regional random effects in the model. Based on Equation 8, we developed a two-level random effects model incorporating region-level and plot-level variability. Various model structures were tested and evaluated based on optimal model selection criteria. model achieved the best performance when regional random effects were applied to all parameters, while plot-level random effects were applied only to parameter a. This model had the highest log-likelihood (-33,466) and the lowest AIC (66973). To further quantify the contribution of random effects and assess the impact of incorporating mixed effects, we conducted a LRT. Compared to the baseline model, introducing regional random effects significantly improved model performance (LRT = 1600, p< 0.001), confirming the importance of capturing broad-scale site variation. Furthermore, when comparing the single-level regional random effects model to the two-level random effects model, the model was further optimized (LRT = 404, p< 0.001), confirming the effectiveness of the two-level structure. The evaluation indicators of the model are shown in Table 6. Therefore, the two-level mixed-effects model of the DBH expression is:
Figure 4
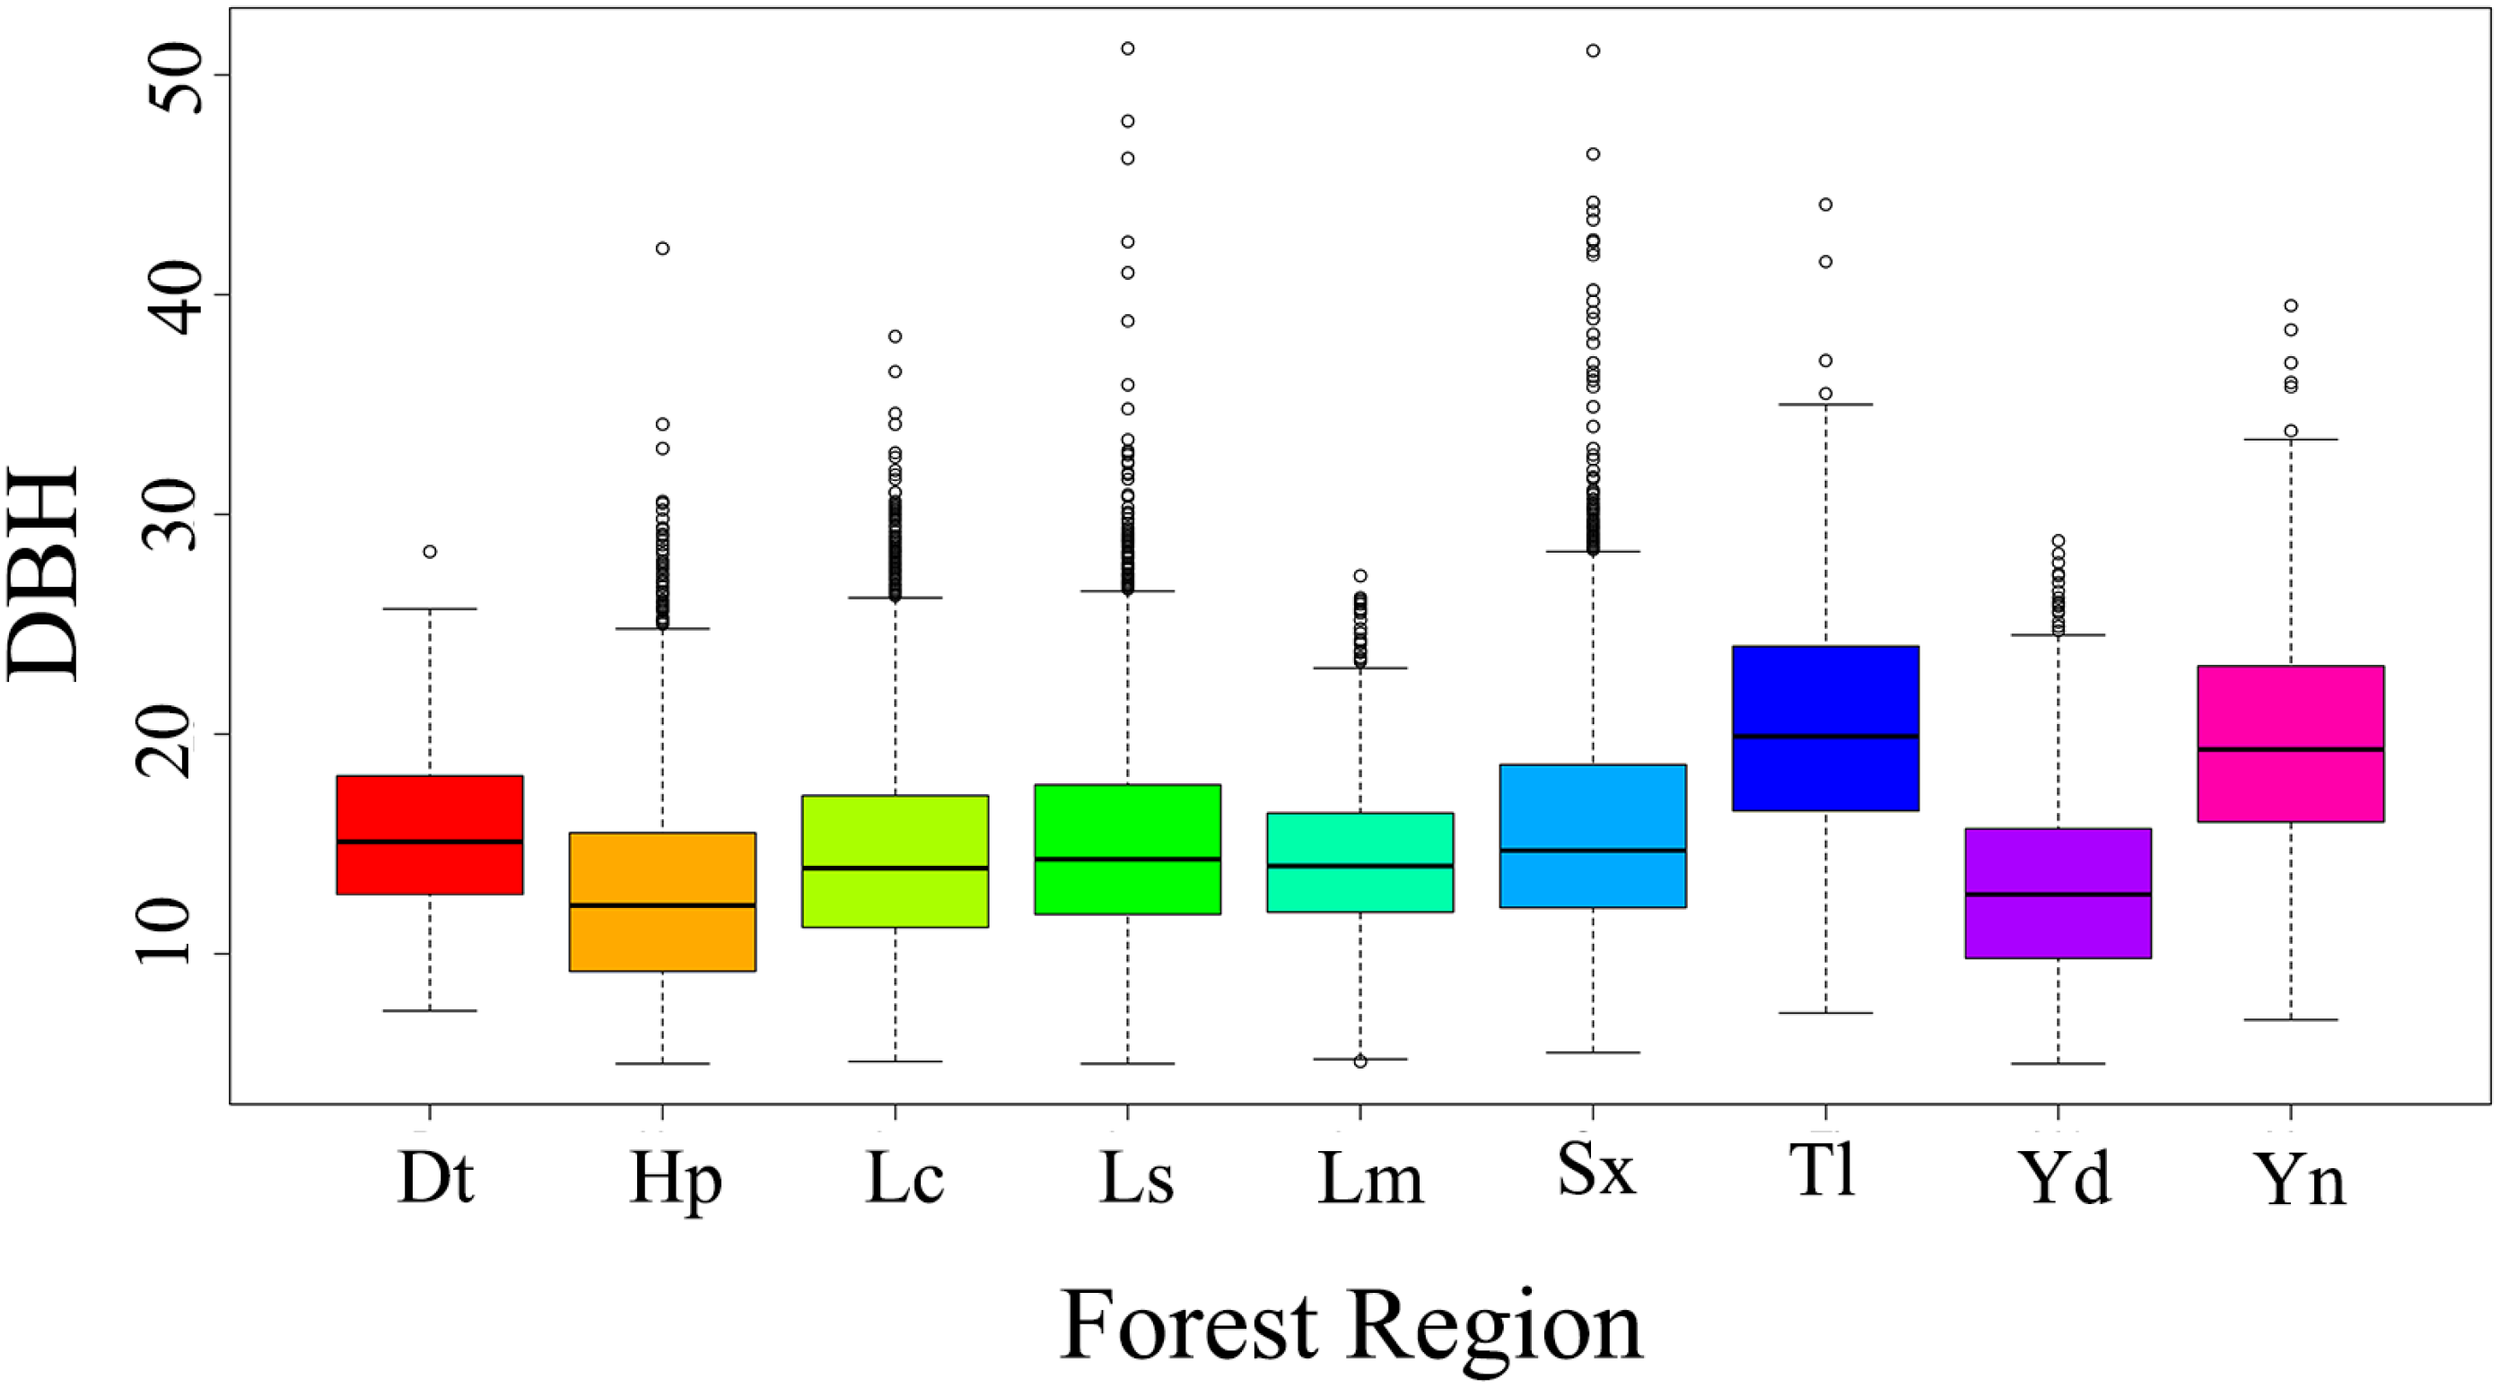
Distribution of DBH across different forest regions. Abbreviations represent the corresponding locations: Dt, Datang Industrial Zone; Hp, Heping County; Lc, Lechang County; Ls, Lianshan County; Lm, Longmen County; Sx, Shixing County; Td, Tongle Forest Farm; Yd, Yingde Forest Farm; and Yn, Yunan Forest Farm.
Table 6
| Dataset | Indicators | Equation 8 | Equation 9 |
|---|---|---|---|
| Train set | RMSE (cm) | 3.032 | 2.794 |
| TRE (%) | 3.965 | 3.348 | |
| R2 | 0.6651 | 0.7002 | |
| Test set | RMSE (cm) | 3.048 | 2.822 |
| TRE (%) | 4.002 | 3.408 | |
| R2 | 0.6497 | 0.7025 | |
| Evaluation | AIC | 68553 | 66973 |
| Loglik | -34266 | -33466 |
Fit indicators of Equations 8, 9.
where
where DBHijk refers to the diameter at breast height of the k-th tree in the j-th sample plot in the i-th region. G1~G5 denote dummy variables for the five growth stages of fir from juvenile to overstory. LH, LCD, and S denote the H of an individual tree corresponding to the diameter at breast height, the crown width, and the density of the stand in the sample plot, respectively.
According Figure 5, addition of the relevant variables improved the fit of the DBH model and reduced the error index, The model was gradually optimized by incorporating growth stages, regional effects, and plot-level variability. the final model R2 improving by 16.04% compared to the base model, indicating a substantial improvement in model accuracy and explanatory power. Furthermore, as the model was refined, the alignment between the predicted and observed values in the point plot improved noticeably. The points increasingly converged along the reference line x=y, suggesting that the model’s predictive performance became more accurate and reliable as additional hierarchical effects were incorporated.
Figure 5
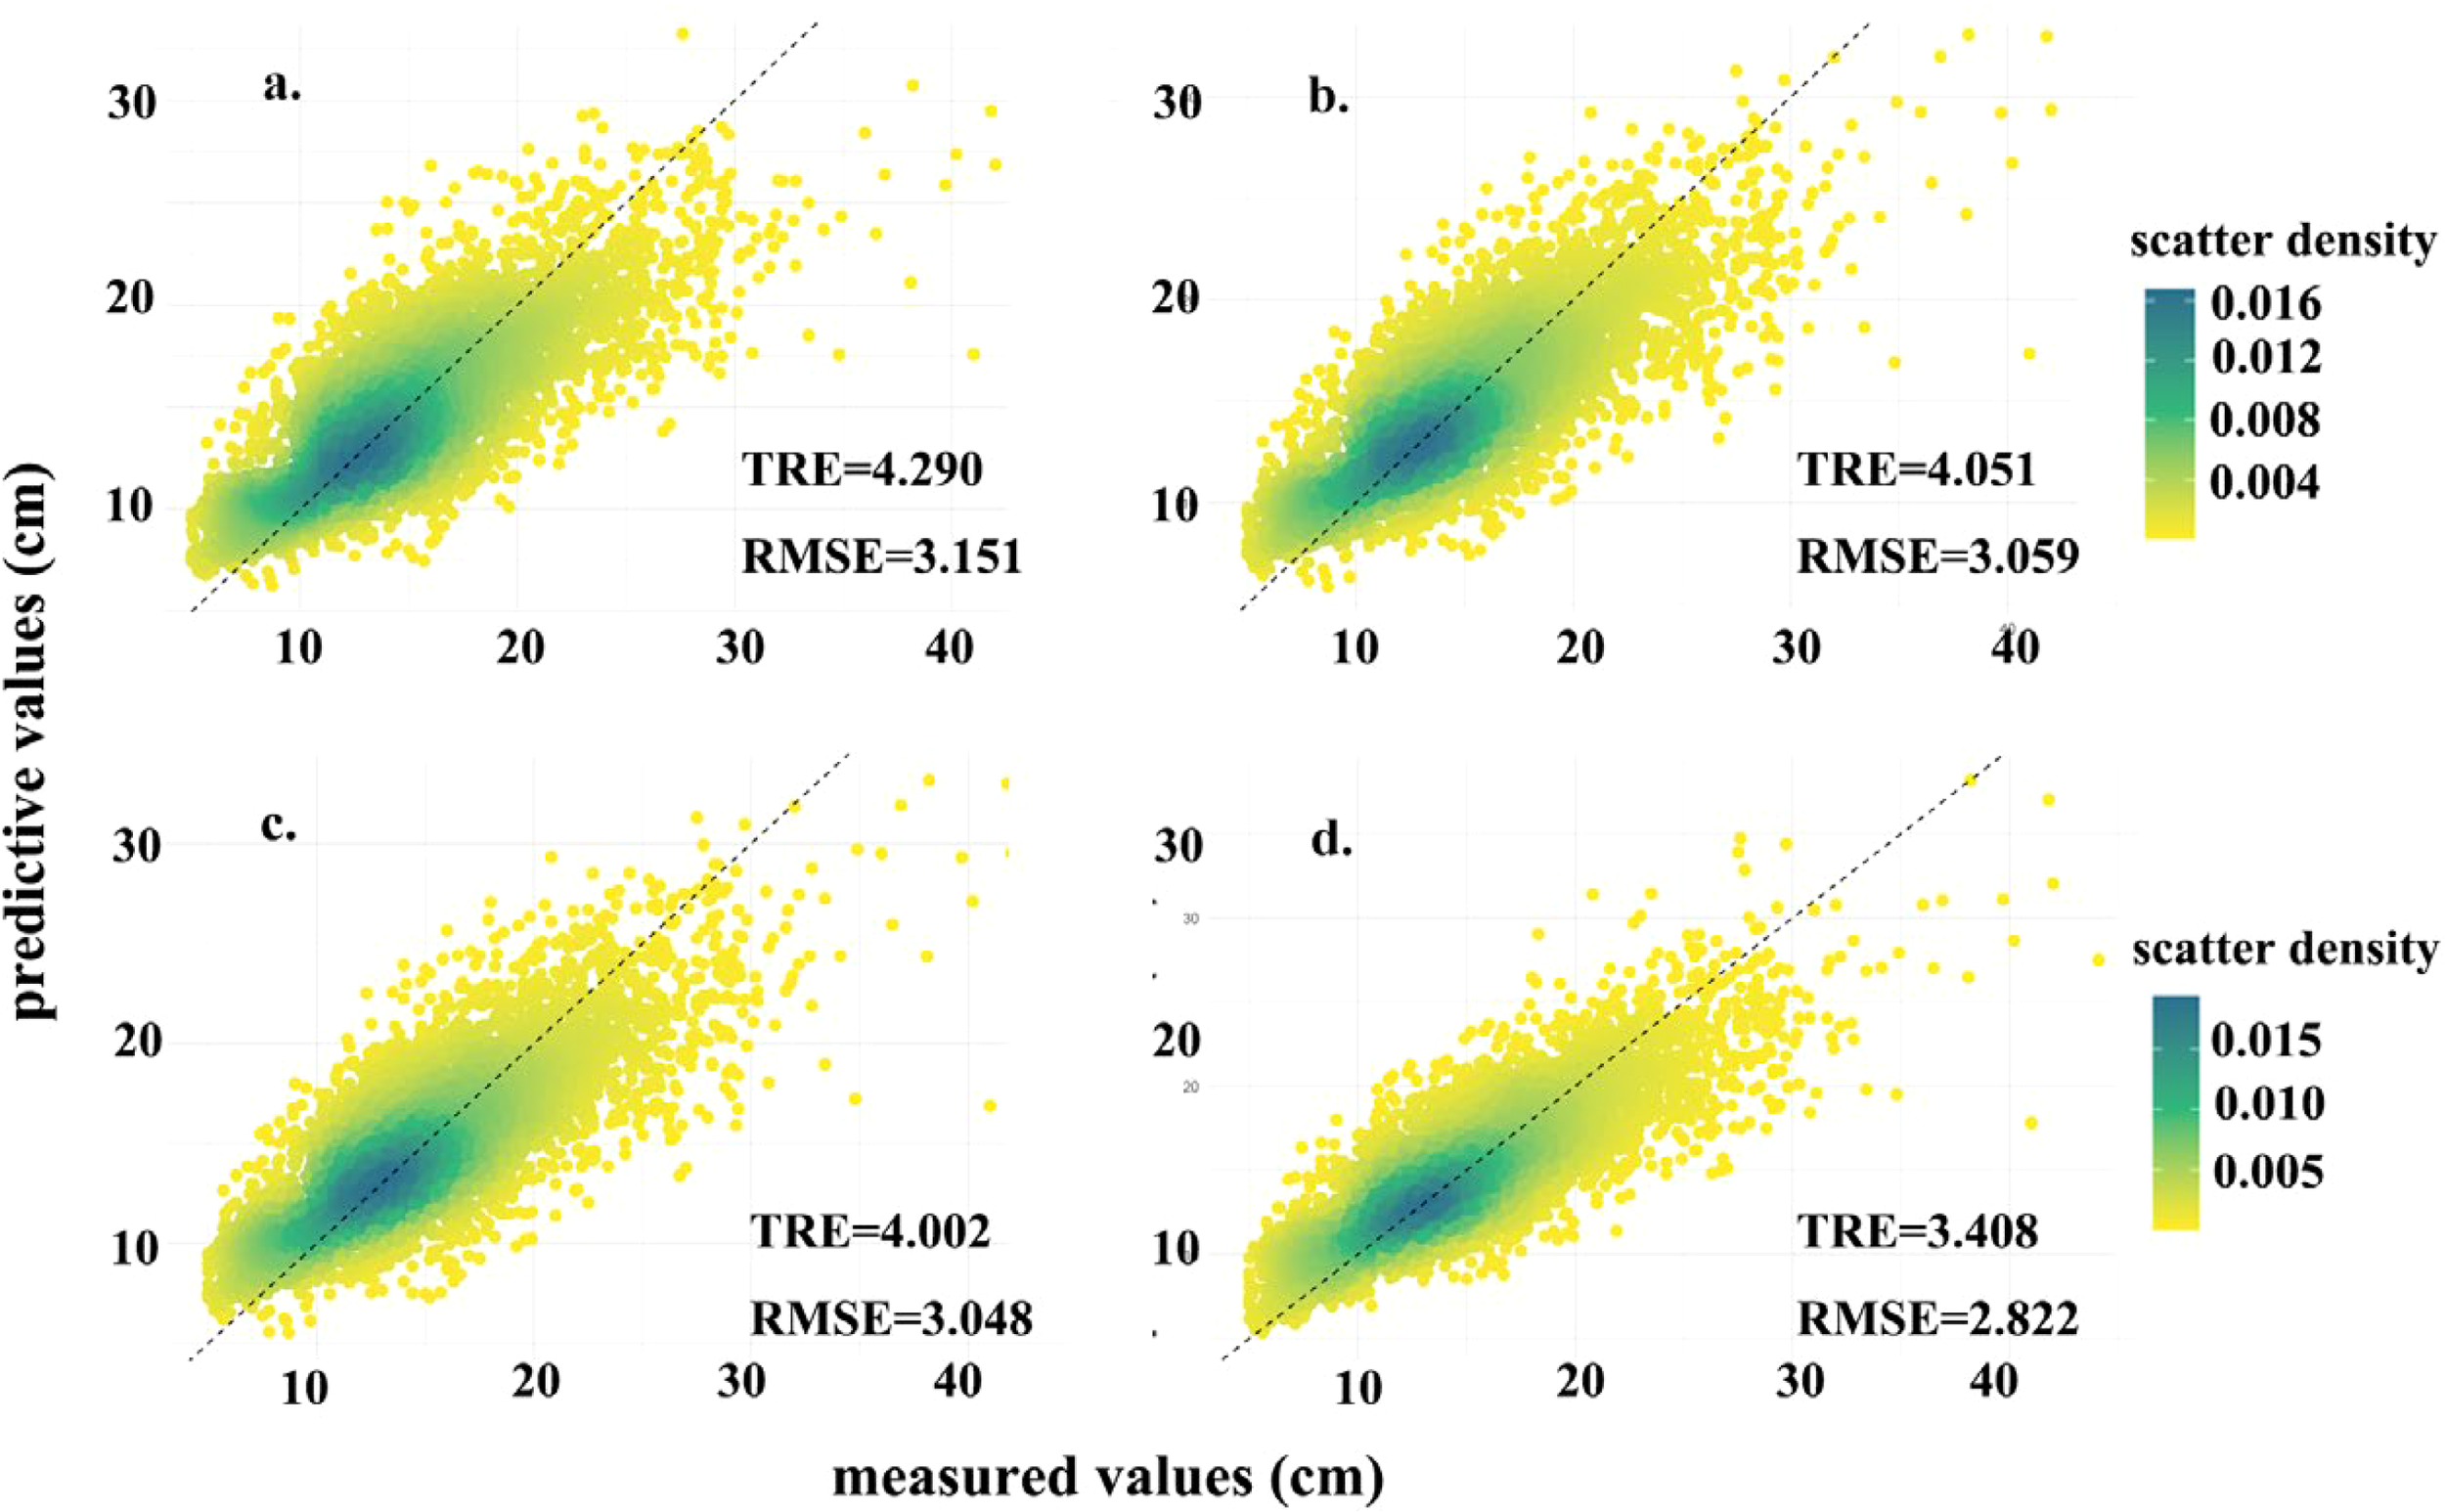
Predictive map (a–d) for M7, Equations 7–9 respectively, the reference line with a diagonal line of y=x.
4 Discussion
While traditional methods have provided valuable insights into DBH estimation, the need for large-scale, efficient assessment methods remains unmet (Liu et al., 2021). Existing LiDAR-based methods have shown promise in large-scale monitoring but face limitations in capturing individual tree metrics accurately, particularly under varying site conditions. To overcome these challenges, this study developed a general model for estimating the DBH of individual trees using terrestrial and airborne LiDAR data, enabling the rapid acquisition of a large number of Chinese fir DBH measurements through airborne LiDAR. The proposed model integrates allometric growth relationships and incorporates the effects of growth stage and regional variations, demonstrating both strong interpretability and high predictive accuracy. With the continuous advancement of smart forestry, this model provides reliable technical support for the rapid measurement of Chinese fir DBH.
UAV remote sensing offers high efficiency and large-scale coverage (Yan, 2020), but existing LiDAR-based methods still face limitations in individual tree-level DBH estimation (Lo and Lin, 2013). Previous studies on DBH estimation using LiDAR have focused primarily on stand-level mean DBH (Muhamad-Afizzul et al., 2019; Ozkan et al., 2022; Zhang et al., 2023).The challenge lies in the unstable relationship between LiDAR-derived metrics and individual tree DBH, making it difficult to identify consistent patterns and predictive variables. Interestingly, this study found a weak correlation between LiDAR-derived canopy width and DBH, which contrasts with the findings of some researchers (Kalliovirta and Tokola, 2005; Raptis et al., 2018), This discrepancy may stem from LiDAR’s superior ability to capture vertical forest structure while being less effective at representing horizontal structure (Bouvier et al., 2015; Coomes et al., 2017; Moran et al., 2018).
Tree growth strategies are influenced by both intrinsic factors (e.g., growth stage) and extrinsic factors (e.g., competition), which jointly determine resource allocation and growth efficiency (Vanninen, 2004). For a long time, the allometric growth relationships of trees have been a key focus in forest management and afforestation research, as these relationships are shaped by a complex interaction between genetic potential and environmental pressures (Matsushita et al., 2015; Sharma et al., 2019). Liu et al. (2020a)demonstrated that including age as a variable significantly improved DBH model performance for Larix species. Similarly, this study introduced growth stage as a dummy variable, yielding comparable improvements in predictive performance. However, the improvement was relatively modest, likely due to species differences or variations in model variables (Cao et al., 2024; Taye and Kelil, 2024). Competition also plays a critical role in tree growth strategies. Under high stand density, trees tend to prioritize height growth over radial growth, leading to suppressed DBH under competitive conditions (Boyden et al., 2009; Zhang et al., 2024). Incorporating plot density as a competition-related variable improved model fitting performance, highlighting the importance of accounting for stand competition in DBH models.
The two-level random effects introduced in this study include block-level and plot-level variations. The block-level effect accounts for broad-scale regional differences caused by factors such as climate, topography, and soil type, which influence tree growth patterns at a macro scale (Canham et al., 2018; Wang and Ibáñez, 2022; Luo et al., 2024). In contrast, the plot-level effect captures fine-scale environmental heterogeneity within blocks, such as microclimate and local competition intensity (Prior and Bowman, 2014; Latifi et al., 2015). To evaluate the contribution of the two-level effects, we compared the model’s performance with and without these random effects. When excluding the two-level effects, the model exhibited a substantial increase in the AIC the model exhibited a substantial increase in the AIC by 1580 and a reduction in the R² by 0.0528, indicating poorer model fit and predictive accuracy. (Table 6). This suggests that ignoring regional and plot-level variations results in increased model bias and reduced generalization ability. For instance, similar findings have been reported in other forest growth models. Fortin et al. (2016)demonstrated that accounting for hierarchical site variability improved the accuracy of tree growth predictions, particularly under varying environmental conditions. Therefore, the inclusion of two-level effects in this study reflects an essential methodological improvement that enhances both the interpretability and predictive power of the DBH model. Lo and Lin (2013) developed a DBH model incorporating competition and regional differences, showing strong interpretability, can also attest to this. Their model achieved higher overall accuracy, which may be attributed to differences in predictor variables and sample size. Lo et al. introduced a novel competition-related variable (LCI) to account for neighboring competitors, whereas our study incorporated plot density to reflect competition intensity. Additionally, our model encompassed all growth stages of Chinese fir, whereas Lo et al.’s model focused solely on mature and overmature stands.
Interestingly, the explanatory power of the density variable weakened after introducing random effects into the model (Tables 7, 8). This may be due to the fixed effect of stand density being partially absorbed by block-level random effects, or it may reflect environmental variations in the influence of stand density on DBH growth (Jordan and Philips, 2023).
Table 7
| Model parameters | Estimation Values | Std | t value | p(r<t) |
|---|---|---|---|---|
| a1 | 4.203706 | 0.487757 | 8.618 | < 2e-16 *** |
| a2 | 3.971733 | 0.466937 | 8.506 | < 2e-16*** |
| a3 | 3.926678 | 0.460988 | 8.518 | < 2e-16*** |
| a4 | 4.07862 | 0.477705 | 8.538 | < 2e-16*** |
| a5 | 4.119038 | 0.479186 | 8.596 | < 2e-16*** |
| a | 1.591742 | 0.469297 | 3.392 | 0.000696*** |
| b | 0.026961 | 0.001668 | 16.159 | < 2e-16*** |
| c | 0.856735 | 0.033305 | 25.724 | < 2e-16*** |
| d | -0.135598 | 0.00758 | -17.888 | < 2e-16*** |
Parameter estimations for the dummy variable model (Equation 8).
‘***’ indicates significance at the p < 0.001 level.
Table 8
| Model parameters | Estimation Values | Std.e | t value | p |
|---|---|---|---|---|
| a1 | 4.461787 | 0.9142237 | 4.88041 | <0.0001*** |
| a2 | 0.230677 | 0.056861 | 4.05686 | 0.0001*** |
| a3 | 0.203524 | 0.0506867 | 4.015322 | 0.0001*** |
| a4 | 0.190579 | 0.0475194 | 4.010551 | 0.0001*** |
| a5 | 0.200793 | 0.0507849 | 3.953799 | <0.0001*** |
| a | 0.213843 | 0.0525322 | 4.070705 | 0.0001*** |
| b | 1.461044 | 0.0502492 | 29.075945 | <0.0001*** |
| c | 0.007194 | 0.0258796 | 0.277977 | 0.781 |
| d | 0.042946 | 0.0041594 | 10.324873 | <0.0001*** |
Parameter estimations for the mixed-effects model (fixed effects).
‘***’ indicates significance at the p < 0.001 level.
4 Conclusion
A DBH estimation model was developed using airborne LiDAR to estimate individual tree DBH in large-scale Chinese fir plantations. This model integrates dummy variables and a two-level mixed-effects approach, which accounts for regional heterogeneity and the influence of tree age on the allometric growth relationship of Chinese fir. With a coefficient of determination of 0.7025, the model demonstrates strong interpretability and performs well in validation, highlighting its robust generalization ability. These findings support the potential application of airborne LiDAR in plantation inventory.
In summary, we have developed a tailored single-tree DBH model for Chinese fir plantations in southern China. The model is characterized by its simplicity, strong interpretability, and effectiveness, offering a valuable tool for improving DBH assessments in plantation inventory practices.
4.1 Suggestion
Establishing DBH models using airborne LiDAR and other remote sensing techniques significantly enhances the efficiency and scalability of DBH estimation. As future advancements integrate multiple remote sensing methods and improve LiDAR-derived stand structure characterization, DBH models are expected to achieve higher accuracy and progressively replace traditional field-based surveys. The Chinese fir DBH model developed in this study provides an effective approach for large-scale DBH assessment in southern China. Future research could focus on improving the representation of horizontal canopy structure in LiDAR data and integrating multi-source remote sensing data to enhance model robustness and predictive accuracy
Statements
Data availability statement
The raw data supporting the conclusions of this article will be made available by the authors, without undue reservation.
Author contributions
ZL: Conceptualization, Formal Analysis, Investigation, Methodology, Writing – original draft. DX: Formal Analysis, Software, Writing – review & editing. ZW: Methodology, Software, Writing – review & editing. LFe: Methodology, Visualization, Writing – review & editing. XL: Software, Writing – review & editing. YW: Visualization, Writing – review & editing. WZ: Software, Writing – review & editing. RS: Software, Writing – review & editing. LFu: Conceptualization, Funding acquisition, Project administration, Writing – review & editing.
Funding
The author(s) declare that financial support was received for the research, authorship, and/or publication of this article. This work was funded by the Fundamental Research Funds for the Central Nonprofit Research Institution of CAF (Grant No. CAFYBB2022ZB002), the project “The Development and application of the information platform of Chengdu’s forest management system” (Grant No. 2023-YF09-00016-SN), and the project “An airborne LiDAR-based model for estimating stand volume and aboveground biomass of major tree species in Guangdong Province” (Grant No. 2021KJCX001).
Conflict of interest
The authors declare that they have no known competing financial interests or personal relationships that could have appeared to influence the work reported in this paper.
Generative AI statement
The author(s) declare that no Generative AI was used in the creation of this manuscript.
Publisher’s note
All claims expressed in this article are solely those of the authors and do not necessarily represent those of their affiliated organizations, or those of the publisher, the editors and the reviewers. Any product that may be evaluated in this article, or claim that may be made by its manufacturer, is not guaranteed or endorsed by the publisher.
References
1
Aubry-Kientz M. Dutrieux R. Ferraz A. Saatchi S. Hamraz H. Williams J. et al . (2019). A comparative assessment of the performance of individual tree crowns delineation algorithms from ALS data in tropical forests. Remote Sens.11, 1086. doi: 10.3390/rs11091086
2
Bonan G. B. (2008). Forests and climate change: forcings, feedbacks, and the climate benefits of forests. Science320, 1444–1449. doi: 10.1126/science.1155121
3
Bouvier M. Durrieu S. Fournier R. A. Renaud J.-P. (2015). Generalizing predictive models of forest inventory attributes using an area-based approach with airborne LiDAR data. Remote Sens. Environ.156, 322–334. doi: 10.1016/j.rse.2014.10.004
4
Boyden S. Reich P. B. Puettmann K. J. Baker T. R. (2009). Effects of density and ontogeny on size and growth ranks of three competing tree species. J. Ecol.97, 277–288. Available online at: https://api.semanticscholar.org/CorpusID:53398583.
5
Brolly M. Woodhouse I. H. Niklas K. J. Hammond S. T. (2012). A macroecological analysis of SERA derived forest heights and implications for forest volume remote sensing. PloS One7, 1–14. doi: 10.1371/journal.pone.0033927
6
Bu G. Wang P. (2016). Adaptive estimation method for diameter at breast height based on terrestrial laser scanning. Laser Optoelectron. Prog.53, 082803. doi: 10.3788/LOP53.082803
7
Canham C. D. Murphy L. Riemann R. McCullough R. Burrill E. (2018). Local differentiation in tree growth responses to climate. Ecosphere9, e02368. doi: 10.1002/ecs2.2368
8
Cao X. M. Miao Z. Hao Y. S. Dong L. H. (2024). Height-diameter model of broad-leaved mixed forest based on species classification in Maoershan, Northeast China. Ying Yong Sheng Tai Xue Bao J. Appl. Ecol.35, 307–320. doi: 10.13287/j.1001-9332.202402.016
9
Chiu C.-M. Chien C.-T. Nigh G. (2015). A comparison of three taper equation formulations and an analysis of the slenderness coefficient for Taiwan incense cedar (Calocedrus formosana). Aust. For.78, 159–168. doi: 10.1080/00049158.2015.1051610
10
Clarke G. P. Y. Haines L. M. (1995). Optimal design for models incorporating the Richards function. In Statistical Modelling: Proceedings of the 10th International Workshop on Statistical Modelling (Springer), 61–66.
11
Coomes D. A. Dalponte M. Jucker T. Asner G. P. Banin L. F. Burslem D. F. R. P. et al . (2017). Area-based vs tree-centric approaches to mapping forest carbon in Southeast Asian forests from airborne laser scanning data. Remote Sens. Environ.194, 77–88. doi: 10.1016/j.rse.2017.03.017
12
Corbeil R. R. Searle S. R. (1976). Restricted maximum likelihood (REML) estimation of variance components in the mixed model. Technometrics18, 31. doi: 10.2307/1267913
13
Falkowski M. J. Smith A. M. S. Hudak A. T. Gessler P. E. Vierling L. A. Crookston N. L. (2006). Automated estimation of individual conifer tree height and crown diameter via two-dimensional spatial wavelet analysis of lidar data. Can. J. Remote Sens.32, 153–161. doi: 10.5589/m06-005
14
Fang Z. Bailey R. L. (2001). Nonlinear mixed effects modeling for slash pine dominant height growth following intensive silvicultural treatments. For. Sci.47, 287–300. doi: 10.1093/forestscience/47.3.287
15
Faridhouseini A. Mianabadi A. Bannayan M. Alizadeh A. (2011). Lidar remote sensing for forestry and terrestrial applications. Int. J. Appl. Environ. Sci.6 (1), 99–114.
16
Filipescu C. N. Groot A. MacIsaac D. A. Cruickshank M. G. Stewart J. D. (2012). Prediction of diameter using height and crown attributes: a case study. West. J. Appl. For.27, 30–35. doi: 10.1093/wjaf/27.1.30
17
Fischer C. Traub B. (2019). Swiss National Forest Inventory – Methods and Models of the Fourth Assessment (Cham: Springer).
18
Fortin M. Manso R. Calama R. (2016). Hybrid estimation based on mixed-effects models in forest inventories. Can. J. For. Res.46, 1310–1319. doi: 10.1139/cjfr-2016-0298
19
Gonzalez-Benecke C. A. Gezan S. A. Samuelson L. J. Cropper W. P. Leduc D. J. Martin T. A. (2014). Estimating Pinus palustris tree diameter and stem volume from tree height, crown area and stand-level parameters. J. For. Res.25, 43–52. doi: 10.1007/s11676-014-0427-4
20
González-Ferreiro E. Diéguez-Aranda U. Miranda D. (2012). Estimation of stand variables in Pinus radiata D. Don plantations using different LiDAR pulse densities. For. Int. J. For. Res.85, 281–292. doi: 10.1093/forestry/cps002
21
Hao Z. Xiang-dong L. E. I. Hui-ru Z. Chun-ming L. I. Jun L. U. (2016). Nonlinear mixed-effects height-diameter model of Pinus koraiensis. J. Beijing For. Univ.38, 8–9. doi: 10.13332/j.1000-1522.20160008
22
Hui Z. Lin L. Jin S. Xia Y. Ziggah Y. Y. (2024). A reliable DBH estimation method using terrestrial LiDAR points through polar coordinate transformation and progressive outlier removal. Forests15, 1031. doi: 10.3390/f15061031
23
Iizuka K. Kosugi Y. Noguchi S. Iwagami S. (2022). Toward a comprehensive model for estimating diameter at breast height of Japanese cypress (Chamaecyparis obtusa) using crown size derived from unmanned aerial systems. Comput. Electron. Agric.192. doi: 10.1016/j.compag.2021.106579
24
Jordan S. Philips A. Q. (2023). Improving the interpretation of random effects regression results. Polit. Stud. Rev.21, 210–220. doi: 10.1177/14789299211068418
25
Kalliovirta J. Tokola T. (2005). Functions for estimating stem diameter and tree age using tree height, crown width and existing stand database information. Silva Fenn.39 (2), 227–248. doi: 10.14214/sf.386
26
Konopka J. Petras R. Toma R. (1987). Slenderness coefficient of the major tree species and its importance for static stability of stands. Lesnictvi33, 887–904.
27
Kunstler G. Albert C. H. Courbaud B. Lavergne S. Thuiller W. Vieilledent G. et al . (2011). Effects of competition on tree radial-growth vary in importance but not in intensity along climatic gradients. J. Ecol.99, 300–312. doi: 10.1111/j.1365-2745.2010.01751.x
28
Latifi H. Fassnacht F. E. Hartig F. Berger C. Hernández J. Corvalán P. et al . (2015). Stratified aboveground forest biomass estimation by remote sensing data. Int. J. Appl. Earth Obs. Geoinformation38, 229–241. doi: 10.1016/j.jag.2015.01.016
29
Lele L. WenBin W. LingBo D. (2023). Height-diameter models of regenerated saplings of Larix gmelinii based on dummy variable and quantile regression. Ying Yong Sheng Tai Xue Bao J. Appl. Ecol.34, 2355–2362. doi: 10.13287/j.1001-9332.202309.005
30
Liu Z. Hikosaka K. Li F. Zhu L. Jin G. (2020b). Plant size, environmental factors and functional traits jointly shape the stem radius growth rate in an evergreen coniferous species across ontogenetic stages. J. Plant Ecol.14, 257–269. doi: 10.1093/jpe/rtaa093
31
Liu Y. Yue C. Wei X. Blanco J. A. Trancoso R. (2020a). Tree profile equations are significantly improved when adding tree age and stocking degree: an example for Larix gmelinii in the Greater Khingan Mountains of Inner Mongolia, northeast China. Eur. J. For. Res.139, 443–458. doi: 10.1007/s10342-020-01261-z
32
Liu L. Zhang A. Xiao S. Hu S. He N. Pang H. et al . (2021). Single tree segmentation and diameter at breast height estimation with mobile LiDAR. IEEE Access9, 24314–24325. doi: 10.1109/ACCESS.2021.3056877
33
Liu H. Zhang X. Zhang Y. Zhu Y. Hui L. Wang L. (2018). Review on individual tree detection based on airborne LiDAR. Laser Optoelectron. Prog.55, 40–48. doi: 10.3788/lop55.082805
34
Lo C.-S. Lin C. (2013). Growth-competition-based stem diameter and volume modeling for tree-level forest inventory using airborne LiDAR data. IEEE Trans. Geosci. Remote Sens.51, 2216–2226. doi: 10.1109/TGRS.2012.2211023
35
Luo T. Wang Z. Zhang D. Li X. Wang X. (2024). Response of radial growth of Dahurian larch (Larix gmelinii) to climate factors at different altitudes in the northern part of the Greater Khingan Mountains. Front. For. Glob. Change7. doi: 10.3389/ffgc.2024.1434773
36
Matsushita M. Takata K. Hitsuma G. Yagihashi T. Noguchi M. Shibata M. et al . (2015). A novel growth model evaluating age–size effect on long-term trends in tree growth. Funct. Ecol.29, 1250–1259. doi: 10.1111/1365-2435.12416
37
Moran C. J. Rowell E. M. Seielstad C. A. (2018). A data-driven framework to identify and compare forest structure classes using LiDAR. Remote Sens. Environ.211, 154–166. doi: 10.1016/j.rse.2018.04.005
38
Mu L. Zhongke F. Zhixiang Z. Chenghui M. Mingming W. Bo-Ling L. et al . (2017). Development and evaluation of height diameter at breast models for native Chinese Metasequoia. PloS One12, e0182170. doi: 10.1371/journal.pone.0182170
39
Muhamad-Afizzul M. Siti-Yasmin Y. Hamdan O. Tan S. (2019). Estimating stand-level structural and biophysical variables of lowland dipterocarp forest using airborne lidar data. J. Trop. For. Sci. 31 (3), 312–323. Available online at: https://api.semanticscholar.org/CorpusID:199641574.
40
Nigul K. Padari A. Kiviste A. Noe S. M. Korjus H. Laarmann D. et al . (2021). The possibility of using the chapman–richards and näslund functions to model height–diameter relationships in hemiboreal old-growth forest in Estonia. Forests12, 184–184. doi: 10.3390/f12020184
41
Orzeł S. (2007). A comparative analysis of slenderness of the main tree species of the Niepolomice Forest. EJPAU10 (2), 13.
42
Ozkan U. Y. Demirel T. Ozdemir I. Saglam S. Mert A. (2022). Predicting forest stand attributes using the integration of airborne laser scanning and Worldview-3 data in a mixed forest in Turkey. Adv. Space Res.69, 1146–1158. doi: 10.1016/j.asr.2021.10.049
43
Peereman J. Hogan J. A. Lin T.-C. Michaletz S. T. (2021). Disturbance frequency, intensity and forest structure modulate cyclone-induced changes in mangrove forest canopy cover. Glob. Ecol. Biogeogr. 31 (1), 37–50. Available online at: https://api.semanticscholar.org/CorpusID:240530050.
44
Piao D. Kim M. Choi G.-M. Moon J. Yu H. Lee W.-K. et al . (2018). Development of an integrated DBH estimation model based on stand and climatic conditions. Forests9. doi: 10.3390/f9030155
45
Popescu S. C. Wynne R. H. (2004). Seeing the trees in the forest. Photogramm. Eng. Remote Sens.70, 589–604. doi: 10.14358/PERS.70.5.589
46
Prior L. D. Bowman D. M. (2014). Across a macro-ecological gradient forest competition is strongest at the most productive sites. Front. Plant Sci.5, 260. doi: 10.3389/fpls.2014.00260
47
Raptis D. Kazana V. Kazaklis A. Stamatiou C. (2018). A crown width-diameter model for natural even-aged black pine forest management. Forests9, 610. doi: 10.3390/f9100610
48
Sharma R. P. Vacek Z. Vacek S. Kučera M. (2019). A nonlinear mixed-effects height-to-diameter ratio model for several tree species based on Czech national forest inventory data. Forests10. doi: 10.3390/f10010070
49
Silva C. Klauberg C. Hudak A. Vierling L. Liesenberg V. Carvalho S. et al . (2016). A principal component approach for predicting the stem volume in Eucalyptus plantations in Brazil using airborne LiDAR data. Forestry89, cpw016. doi: 10.1093/forestry/cpw016
50
Sparks A. M. Smith A. M. S. (2022). Accuracy of a LiDAR-based individual tree detection and attribute measurement algorithm developed to inform forest products supply chain and resource management. Forests13. doi: 10.3390/f13010003
51
Stitt J. M. Hudak A. T. Silva C. A. Vierling L. A. Vierling K. T. (2022). Evaluating the use of lidar to discern snag characteristics important for wildlife. Remote Sens.14 (3), 720. doi: 10.3390/rs14030720
52
Taye S. Kelil S. (2024). Adaptation and growth performance evaluation of selected multipurpose trees and shrubs at Yabello district, Borana zone, Southern Oromia, Ethiopia. Int. J. Food Sci. Agric.8 (1). doi: 10.26855/ijfsa.2024.03.001
53
Tinkham W. T. Swayze N. C. Hoffman C. M. Lad L. E. Battaglia M. A. (2022). Modeling the missing DBHs: influence of model form on UAV DBH characterization. Forests13, 2077–2077. doi: 10.3390/f13122077
54
Tuan T. N. Dinh T. T. Long H. S. (2019). Height-diameter relationship for Pinus koraiensis in Mengjiagang Forest Farm of Northeast China using nonlinear regressions and artificial neural network models. J. For. Sci.65, 134–143. doi: 10.17221/5/2019-JFS
55
Vanninen P. (2004). Allocation of above-ground growth in pinus sylvestris - impacts of tree size and competition. Silva Fenn.38 (2), 155–166. doi: 10.14214/sf.425
56
Wang X. Ibáñez I. (2022). The contrasting effects of local environmental conditions on tree growth between populations at different latitudes. Forests13 (3), 429. doi: 10.3390/f13030429
57
Wang K. Ma Y. Zhou F. (2020). Tree height inversion combining light detection and ranging and optical remote sensing data. E3S Web Conf.165, 3020. doi: 10.1051/e3sconf/202016503020
58
Wertz B. Bembenek M. Karaszewski Z. Ochał W. Skorupski M. Strzeliński P. et al . (2020). Impact of stand density and tree social status on aboveground biomass allocation of scots pine pinus sylvestris L. Forests11 (7), 765. doi: 10.3390/f11070765
59
Wykoff W. R. Crookston N. L. Stage A. R. (1982). User’s Guide to the Stand Prognosis Model (Ogden, UT, USA: USDA Forest Service, Intermountain Forest and Range Experiment Station). General Technical Report INT-133.
60
Xiao Y. Xunzhi O. Ping P. Wenping D. Songli P. Hao Z. et al . (2022). Spatial structure characteristics and its evaluation of evergreen broadleaved forest at different growth stages in Lushan Mountain, Jiangxi Province of eastern China. J. Beijing For. Univ.44, 32–40. doi: 10.12171/j.1000-1522.20210450
61
Xue-hua W. Jia W. Zhong-ke F. (2013). Estimating diameter at breast height for thirteen common tree species in Beijing. J. Beijing For. Univ.35 (5), 56–63.
62
Yan Q. (2020). Advantage and application of unmanned aerial vehicle remote sensing in engineering survey. Remote Sens.9, 22. doi: 10.18282/rs.v9i1.1098
63
Yang R. C. Kozak A. Smith J. H. G. (1978). The potential of Weibull-type functions as flexible growth curves. Can. J. For. Res.8, 424–431. doi: 10.1139/x78-062
64
Yuwei Z. Chao Z. Juan W. Huayu L. Mingxiong B. Anrong Y. (2021). Individual tree crown width extraction and DBH estimation model based on UAV remote sensing. Forest and Grassland Resources Research67 (3), 67.
65
Zhang H. Gao Y. Zheng X. Hu Y. Zhou X. Fang Y. et al . (2024). Neighborhood diversity promotes tree growth in a secondary forest: the interplay of intraspecific competition, interspecific competition, and spatial scale. Plants13 (14), 1994. doi: 10.3390/plants13141994
66
Zhang Z. Wang T. Skidmore A. K. Cao F. She G. Cao L. (2023). An improved area-based approach for estimating plot-level tree DBH from airborne LiDAR data. For. Ecosyst.10, 100089. doi: 10.1016/j.fecs.2023.100089
Summary
Keywords
Cunninghamia lanceolata , airborne LiDAR, diameter at breast height modeling, growth stage, nonlinear mixed-effects model
Citation
Liu Z, Xie D, Wu Z, Feng L, Liao X, Wang Y, Zhu W, Sharma RP and Fu L (2025) Modeling diameter at breast height of Chinese fir (Cunninghamia lanceolata) using UAV LiDAR data in Southern China. Front. Plant Sci. 16:1546055. doi: 10.3389/fpls.2025.1546055
Received
16 December 2024
Accepted
09 April 2025
Published
02 October 2025
Volume
16 - 2025
Edited by
Lorena Parra, Universitat Politècnica de València, Spain
Reviewed by
Zhengjun Liu, Chinese Academy of Surveying and Mapping, China
Zongzheng Chai, Guizhou University, China
Jiaming Zhang, Michigan State University, United States
Updates
Copyright
© 2025 Liu, Xie, Wu, Feng, Liao, Wang, Zhu, Sharma and Fu.
This is an open-access article distributed under the terms of the Creative Commons Attribution License (CC BY). The use, distribution or reproduction in other forums is permitted, provided the original author(s) and the copyright owner(s) are credited and that the original publication in this journal is cited, in accordance with accepted academic practice. No use, distribution or reproduction is permitted which does not comply with these terms.
*Correspondence: Liyong Fu, fuly@ifrit.ac.cn
†These authors have contributed equally to this work
Disclaimer
All claims expressed in this article are solely those of the authors and do not necessarily represent those of their affiliated organizations, or those of the publisher, the editors and the reviewers. Any product that may be evaluated in this article or claim that may be made by its manufacturer is not guaranteed or endorsed by the publisher.