 João Victor Da Silva Rabelo-Araujo1*
 Ana Flávia Francisconi1
 Caroline Bertocco Garcia2
 Cássio Van Den Berg3
 Otavio Batista de Castro Ribeiro4
 Ana Paula da Silva Marques2
 Matheus Scaketti1
 Ana Cristina Silva Amoroso Anastacio5
 Maria Imaculada Zucchi1
- 1Universidade Estadual de Campinas, Instituto de Biologia, Campinas, Brazil
- 2Escola Superior de Agricultura Luiz de Queiroz, Universidade de São Paulo, São Paulo, Brazil
- 3Department of Biological Sciences, Universidade Estadual de Feira de Santana, Feira de Santana, Bahia, Brazil
- 4Instituto Rupestris, Minas Gerais, Brazil
- 5Department Long-term Strategic Studies, Vale S.A, Minas Gerais, Brazil
Dyckia spp. are xeromorphic bromeliads, with diversity centered in the ferruginous rocky outcrops of the Espinhaço mountain Range in Brazilian tropical savana. Due to their recent radiation – during the Pliocene – along with their vast phenotypic plasticity and the limited herbarium records, many species in the genus present challenges for correct identification and the development of robust conservation strategies. We sequenced the complete chloroplast genome of six rare Dyckia species in an effort to identify hotspots of diversity that could serve as molecular markers capable of distinguishing species and elucidating phylogenetic relationships within the genus. The plastome sizes of the species ranged from 159,689 bp to 159,264 bp, and the GC content was highly consistent across all species, varying narrowly between 37.2% to 37.3%. Despite the high structural similarity, polymorphism analyses identified three regions of high polymorphic diversity—the clpP1 and psa1 genes, and the intergenic spacer region between trnT and the trnL — that may serve as molecular markers within the genus. Additionally, we detected a high number of SSRs (637), dispersed repeats (208), SNPs (1035), and indels (823) among the species compared to other bromeliads. Phylogenetic analyses using whole plastid genomes showed low variability among species, associating them with their geographic distribution. These results not only highlight the structural variability of the Dyckia plastid genome but also provide new molecular tools for the identification of related species, enhancing the development of conservation protocols for these bromeliads.
1 Introduction
Dyckia Schult. & Schult.f. are xenomorphic bromeliads with terrestrial or saxicolous habits and CAM photosynthetic metabolism. These plants are morphologically characterized by the lateral emission of a racemose inflorescence, rosette leaves with well-developed spines on the leaf margins, variations in succulence level, extranuptial nectaries, and red, yellow, or orange petals (Smith and Downs, 1974; Guarçoni et al., 2017). Although the genus has approximately 170 described species with wide distribution throughout South America, 80% of them are endemic to Brazil (Leme and Kollmann, 2011). The region with the highest endemism of Dyckia species is the southern portion of the Espinhaço mountain range in the Brazilian state of Minas Gerais, an ecosystem characterized by a heterogeneous alpine landscape, full of ferruginous rocky outcrops locally known as “canga” with dry soils and nutrient scarcity (Versieux and Wendt, 2006; Silveira et al., 2016).
According to estimates based on plastid markers, Dyckia underwent a recent massive radiation process between 4.6 to 2.9 million years ago, still in the Pliocene (Krapp et al., 2014). The frequent temperature variations during this period, as well as the heterogeneous landscape of the Campos Rupestres, may have contributed to the frequent isolation and fragmentation of populations of xeric plants due to altitude variations throughout this ecosystem, promoting widespread allopatric speciation, as well as recurrent introgression, of several species along the entire Espinhaço mountain range (Antonelli et al., 2009; Antonelli et al., 2010).Despite the significant diversity of Dyckia in this region, the low morphological heterogeneity between related species, the scarcity of records in herbaria and collections, as well as the lack of distribution and population diversity data, often lead to errors in endemic species identification, including at the molecular level (Pinangé et al., 2020). In addition to the identification difficulties of Dyckia in the region, many rare species still face constant threats from human activities such as mining, agriculture, and livestock farming, as well as recurrent spontaneous fires (Versieux and Wendt, 2007; Leme et al., 2012). This scenario underscores the urgent need for reliable molecular markers capable of distinguishing morphologically similar species and supporting effective conservation strategies.
Phylogenetic relationships in Dyckia have so far been based on some universal plastid regions used for Bromeliaceae phylogenies (matK, rps16 intron, petD intron, rpl32-trnL, rps16-trnK, trnS-ycf3, and trnD-trnT), the use of the nuclear locus phyC, AFLP molecular markers and morphological analyses (Knowles and Chan, 2008; Philippe et al., 2011; Krapp et al., 2014). Although previous molecular studies have included up to 106 Dyckia species and confirmed the monophyly of the genus, the resulting phylogenies consistently recover clades organized by geographic distribution rather than by taxonomic affinity. These phylogenies often exhibit low resolution among closely related species, frequently resulting in large polytomies and poorly informative trees.
The limited resolution of phylogenetic trees is a recurrent issue in taxonomic groups that have undergone recent speciation, as the brief intervals between evolutionary events does not allow enough time for genetic variation to accumulate between taxa. This issue is particularly pronounced especially when using few markers with low mutation rate, such as plastid sequences with limited variability, which are frequently uninformative for distinguishing closely related species (Knowles and Chan, 2008; Philippe et al., 2011). This is also true for other phylogenetic analyses in taxa within the Bromeliaceae, such as Puya, Tillandsioideae, and Hechtioideae, whose rapid and recent speciation was strongly influenced by climatic and geographic variations in the last 10 million years (Jabaily and Sytsma, 2010; MaChado et al., 2020; Rivera-Martínez et al., 2022).
In contrast, with the advancement of Next-Generation Sequencing (NGS) techniques, new phylogenomic analyses based on whole plastome sequences have become a powerful tool for resolving phylogenies in complex and recent taxa, providing new insights into plastome evolution and aiding in the identification of reliable new diversity hotspots to function as powerful molecular markers (Wang et al., 2021; Liu et al., 2022; Ren et al., 2022).
Land plants chloroplast genomes are highly conserved, ranging in size from 120 to160 kb, and are typically organized into a quadripartite structure comprising large (LSC) and small (SSC) single-copy regions and two inverted repeat (IR) regions (Dobrogojski et al., 2020). Containing between 100–150 functional genes, as well as tRNAs and rRNAs, the plastid genome genes are commonly involved in photosynthesis pathways, but also in fatty acid synthesis, and nucleic acid transcription and translation (Wicke et al., 2011; Olejniczak et al., 2016). Although plastid genes are characterized by a low mutation rate, structural rearrangements, gene losses, and the contraction of repetitive regions can be used to infer evolutionary relationships and serve as effective molecular markers (Cauz-Santos et al., 2020; Vera-Paz et al., 2022; Ramírez-Morillo et al., 2023).
In this study, we provide seven newly sequenced complete chloroplast genomes of Dyckia representing six rare species restricted to the Espinhaço mountain range. We aim to 1) identify potential molecular diversity hotspots to serve as new markers capable of discriminating species; 2) To detect repetitive regions, structural variations and possible syntenies with other available Bromeliaceae species; and to assess the effectiveness of phylogenies based on whole plastome sequences in elucidating interspecific relationships among closely related species of the genus.
2 Materials and methods
2.1 Plant material and DNA extraction
The six species of Dyckia analyzed in this study are restricted to rocky outcrops in the southern portion of the Espinhaço Mountain Range, in the state of Minas Gerais, Brazil. Samples of Dyckia consimilis (Mez), as well as individuals tentatively referred to as Dyckia aff. trichostachya and Dyckia sp., were collected from remnant populations across the Sinclinal Moeda, a mountainous region located south of Belo Horizonte, in the state of Minas Gerais, Brazil. The latter two could not be identified to the species level due to the absence of inflorescence, a key morphological trait for species delimitation in Dyckia. These individuals may represent undescribed taxa.
Due to the pronounced morphological variability observed in Dyckia consimilis, even among populations in close geographic proximity—and its occasional misidentification with related taxa such as D. macedoi (L.B.Sm.) and D. schwackeana (Mez)—two individuals of this species were included in the sampling. This strategy was adopted to better represent the potential intraspecific genetic diversity at the plastid genome level.
Samples of Dyckia rariflora (Schult. & Schult.f.) and Dyckia elata (Mez) were obtained from populations occurring on rocky outcrops of Serra de Antônio Pereira, in the municipality of Catas Altas, while samples of Dyckia densiflora were collected in Serra da Piedade, located in Caeté, Minas Gerais, Brazil. All the species analyzed here are included in the “Rede Propagar”, a plant conservation initiative for threatened species of the Campos Rupestres, developed in partnership between Vale S.A. and the São Paulo Agency for Agribusiness Technology (APTA).
Leaf samples from seven specimens of the species described above were kept in saturated NaCl-CTAB solution in a refrigerator at 8°C until DNA extraction (Rogstad, 1992). Total genomic DNA was isolated using approximately 200mg of leaves per sample. Leaves were macerated using liquid nitrogen, and the extraction was performed using a modified protocol of DNeasy Plant Maxi Kit (Qiagen). Extracted DNA samples were quantified in a 1% agarose gel and stained with GelRed (Sigma-Aldrich) for visualization under ultraviolet light using 1 Kb Plus DNA Ladder a reference. Samples were quantified using the Qubit Broad range kit fluorometer (Sigma-Aldrich).
2.2 Chloroplast genome sequencing, assembly, and annotation
The genomic libraries of the seven specimens were constructed using 250 ng of total genomic DNA using the Illumina DNA Prep kit following the manufacturer’s instructions. The libraries were sequenced in Illumina NextSeq 2000 platform in a paired-end sequencing (2 × 100 bp) in the Life Sciences Core Facility (LaCTAD) from the State University of Campinas (UNICAMP). The assembly of Chloroplast DNA from Dyckia species was conducted using two different strategies: First, we employed GetOrganelle v 1.7.3.1 (https://github.com/Kinggerm/GetOrganelle/) using as seed, the plastome of Pitcairnia breedlovei (NC_080307.1), available in GenBank (https://www.ncbi.nlm.nih.gov/nuccore/NC_080307.1). Despite multiple attempts with GetOrganelle for the chloroplast genome assembly of D. rariflora, we were unsuccessful. For this species, we therefore used NovoWrap (https://github.com/wpwupingwp/novowrap), following the parameters described in the online manual for the correct assembly of plastomes (Jin et al., 2020; Wu et al., 2021).To assess the continuity of plastome alignment we use BWA v.07.17 (https://github.com/lh3/bwa) (Abeel et al., 2012) for mapping DNA sequences against a reference chloroplast genome of Ananas comosus (NC_026220.1). Subsequently, Samtools v.1.13. (https://github.com/samtools/samtools) was employed to organize the data generated from the alignment by estimating the average coverage, and to visualize the mapping, we used Integrative Genomics Viewer (IGV) (https://igv.org/) and Geneious prime v2023 1.2 (https://www.geneious.com). The plastome annotation was performed with the Chlorobox platform GeSeq (Organellar Genome Annotation) in which parameters were set to identify protein-coding sequences (CDS), rRNAs, and tRNAs by referencing chloroplast sequences and homologies through BLAST and the 3rd Party stand-alone annotator Chloe. After GeSeq annotation, we performed manual correction of start and stop codons, and verification of pseudogene and intron positions using GenomeView (Abeel et al., 2012; Tillich et al., 2017). Finally, chloroplast circular genome maps were generated using OGDRAW (Greiner et al., 2019).
2.3 Chloroplast genome structure comparison and detection of nucleotide divergence hotspots, SNPs, and indels
Two multiple progressive sequence alignments in Mauve v.2.4 were used for the comparative plastid analysis in Dyckia (Darling et al., 2004). First, using the chloroplast genome of Pitcairnia atrorubens (Genbank: NC_085612.1) as reference, we aligned the seven sequenced Dyckia specimens here: two individuals of Dyckia consimilis, D. rariflora, D. elata, D. densiflora, D. aff. trichostachya and Dyckia sp. The second analysis aimed to understand the structural synteny of the chloroplast genome in Bromeliaceae. The analysis was conducted using our set of sequenced Dyckia species, and seven Bromeliaceae samples representing seven additional subfamilies available in GenBank: Brocchinioideae, Bromelioideae, Hechtioideae, Puyoideae, Tillandsioideae, Navioideae, and Lindmanioideae (Supplementary Table S1).
Similarly, to assess potential events of expansions and contractions of the IR regions, the genes present in the borders of LSC and SSC were annotated and manually compared to detect potential polymorphic regions, we performed pairwise alignments between the chloroplast genomes of the second alignment using MAFFT v.7 (Katoh et al., 2002). Employing the DnaSP v.5 program, we conducted a sliding window analysis (with a window length of 200 bp and a step size of 50 bp) to identify nucleotide divergence hotspots (Librado and Rozas, 2009). Additionally, the first alignment among the seven plastomes was used to nail down small insertions/deletions (indels) in the sequences (Supplementary Table S2) and to identify single nucleotide polymorphisms (SNPs) among the genomes (Supplementary Table S3). All positions of nucleotide divergence hotspots, indels, and SNPs were manually identified using the annotations of the chloroplast genomes obtained from GE-SEQ. Heatmaps were generated from SNP and indel data using the pheatmap package in the R platform v. 4.2.2.
2.4 Identification of SSRs and dispersed repeats
To detect simple sequence repeats (SSRs) of 1–6 nucleotides, we used the virtual MISA package (available at https://webblast.ipk-gatersleben.de/misa/). The criteria for identifying SSR motifs (Supplementary Table S4) in the chloroplast genome were as follows: SSRs ranging from one to six nucleotides in length, with a minimum repeat number of 10, 5, and 4 units for mono-, di-, and trinucleotide SSRs, respectively, and three units for tetra-, penta-, and hexanucleotide SSRs (Beier et al., 2017). REPuter was used to investigated the presence of four types of dispersed repeats: forward, reverse, palindrome and complement sequences (Supplementary Table S5). The criteria for the identification were: minimum repetition size ≥ 30 bp and sequence identity ≥ 90% (Hamming distance = 3). The location of SSRs and dispersed repeat sequences were manually annotated between the species (Kurtz and Schleiermacher, 1999).
2.5 Phylogenomic studies
The plastomes of all seven samples sequenced in this study were aligned to 14 Bromeliaceae species from the genbank (Supplementary Table S1) using the MAFFT tool (Katoh et al., 2002). Lindmania sp. (genbank accession OQ308827) was used as an outgroup based on previous phylogenetic studies in Bromeliaceae (Givnish et al., 2014). Of the 206,120 bp of the aligned matrix, we used positions 45163-211048, which were completely collinear between all samples, with a total of 165,996 characters, including the entire LSC, SSC, IRa, IRb, and all genes, spacers and introns. Phylogenetic analysis and model selection were performed with IQTREE2 (Minh et al., 2020) Model selection was performed with ModelFinder embedded in IQTREE2, and phylogenetic analysis was performed under Maximum Likelihood criterion, and 1,000 ultrafast-bootstrap pseudoreplicates, with the -BNNI option, to avoid overestimation due to model violations along the heterogeneous matrix. The bootstrap consensus tree was imported to FigTree 1.4 (https://github.com/rambaut/figtree/releases) and later edited in Inkscape.
3 Results
3.1 Organization of the Dyckia species chloroplast genomes
The chloroplast genome of D. consimilis, D. rariflora, D. elata, D. densiflora, D. aff. trichostachya, and D. sp had the typical quadripartite circular structure consisting of one large single copy (LSC), one small single copy (SSC), and two inverted repeats (IRB and IRA) regions (Figure 1). The plastome size ranges from 159,689 pb (Dyckia densiflora) to 159,264 pb (Dyckia consimilis ind 2) with all plastomes displaying comparable lengths for the LSC, SSC, and IR regions. The GC content was highly consistent across all species, ranging between 37.2% and 37.3%. (Table 1).
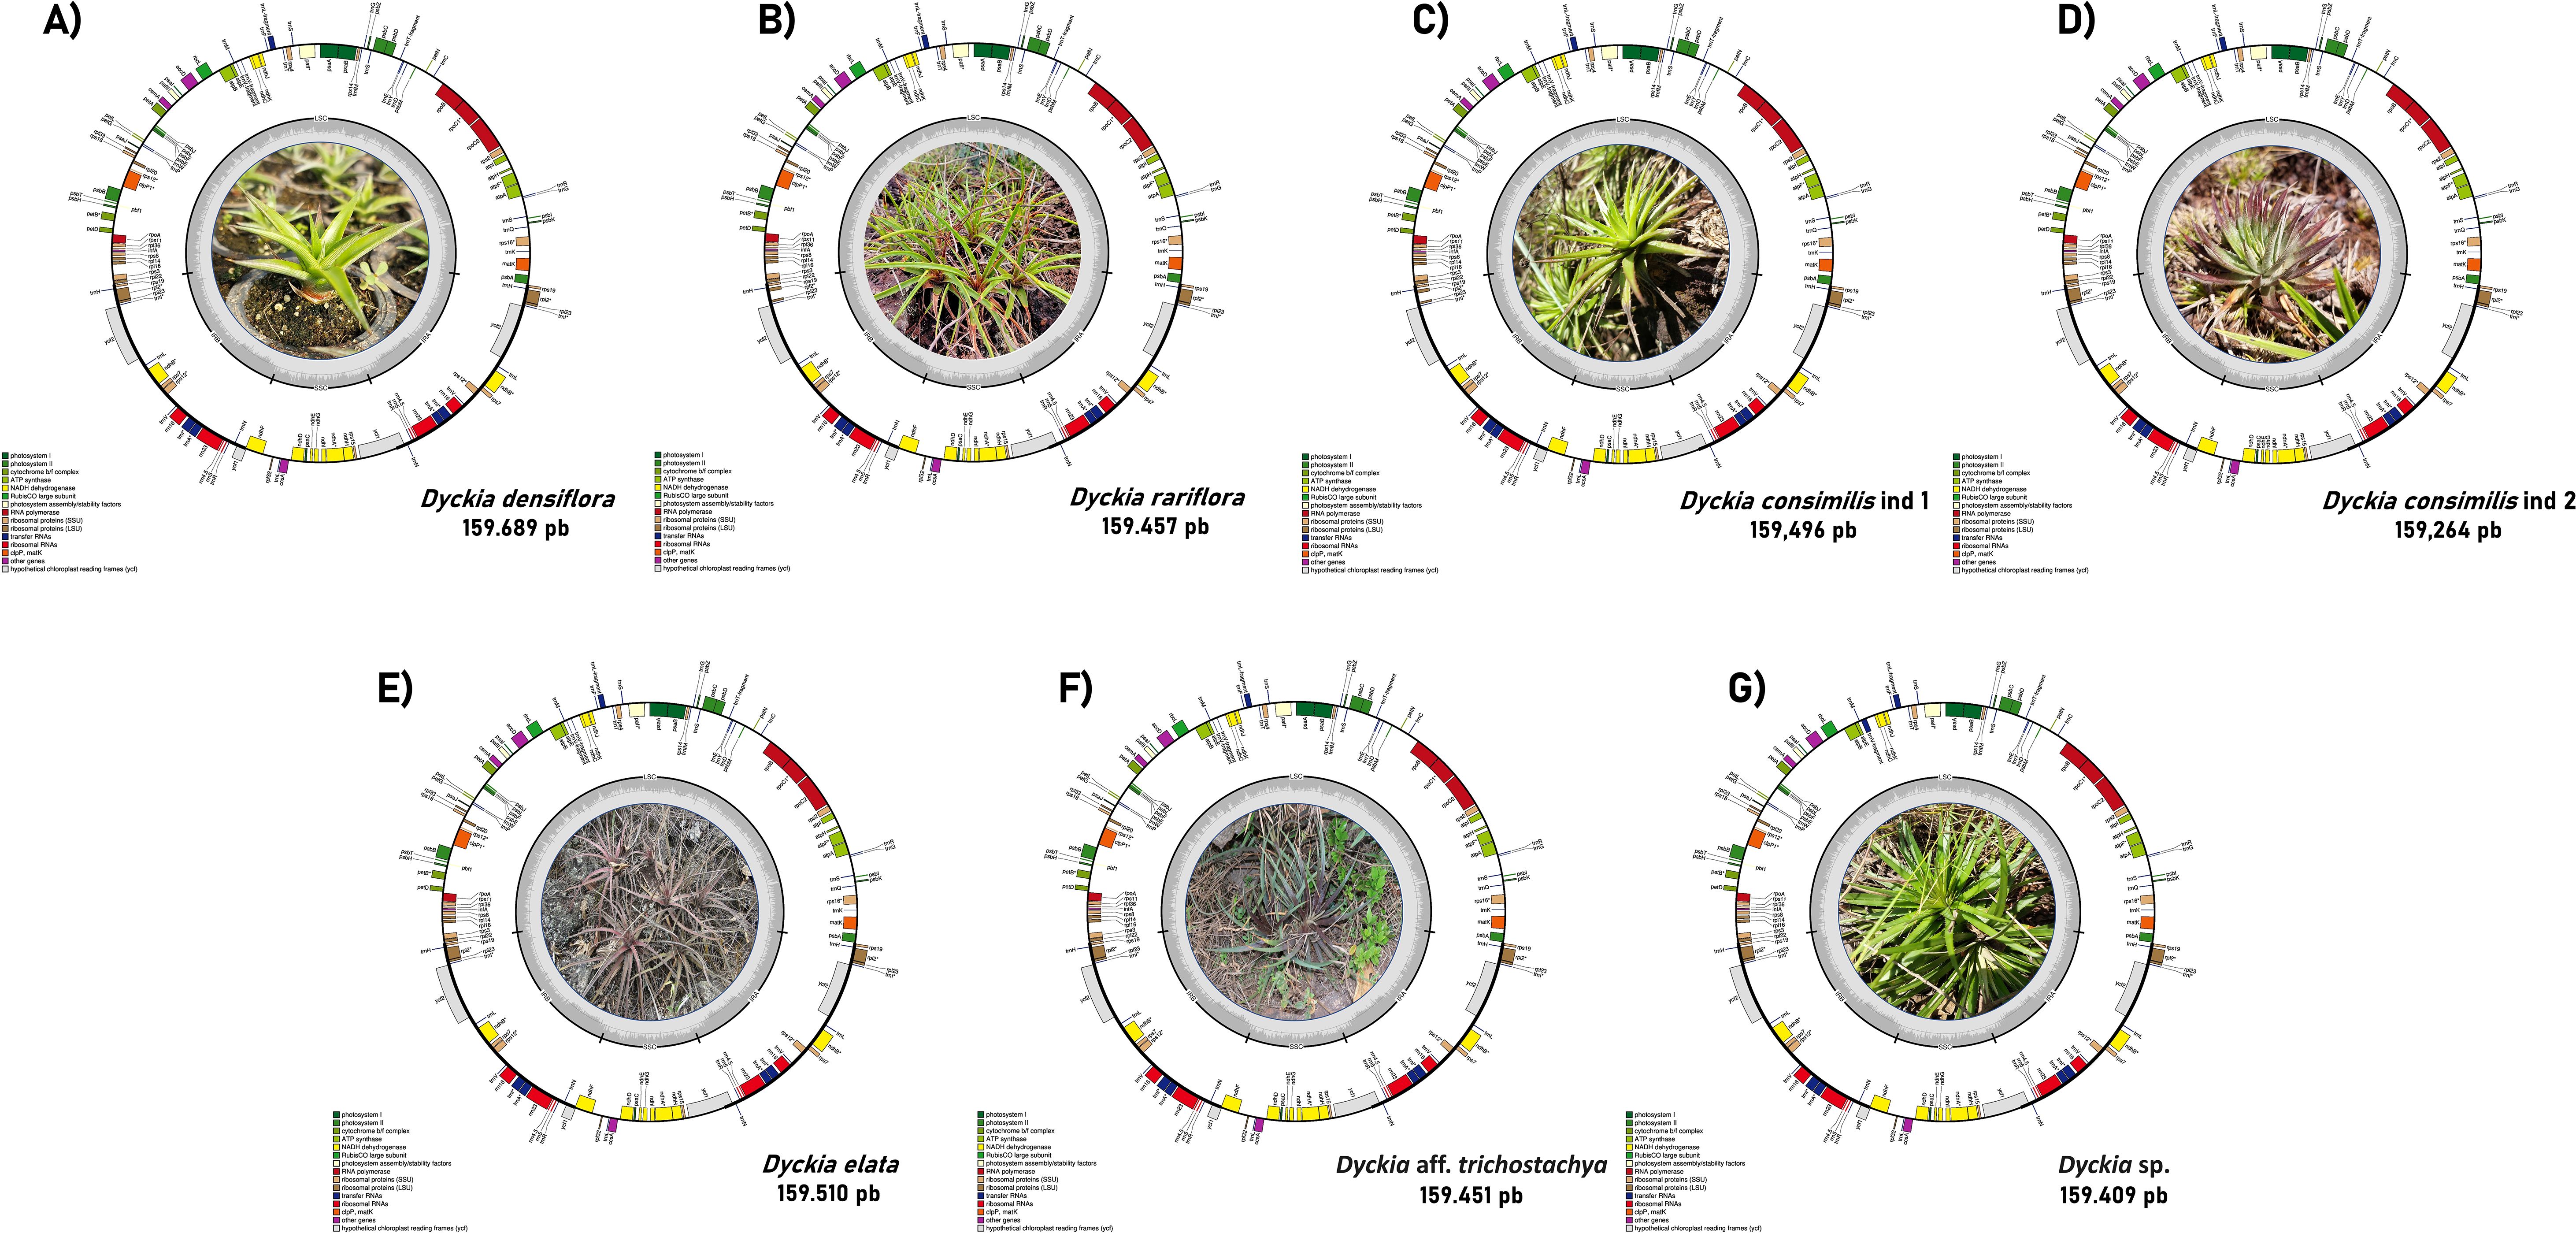
Figure 1. Circular representation of Cloroplastidial genome of Dyckia spp. The color within the genes represents their categorical function, while the inner circle in gray represents the GC content along the plastome. Genes shown inside the circle have a clockwise orientation, while those outside have a counterclockwise orientation. (A) Dyckia densiflora; (B) Dyckia rariflora; (C) Dyckia consimilis ind 1; (D) Dyckia consimilis ind 2; (E) Dyckia elata; (F) Dyckia aff. trichostachya; (G) Dyckia sp.
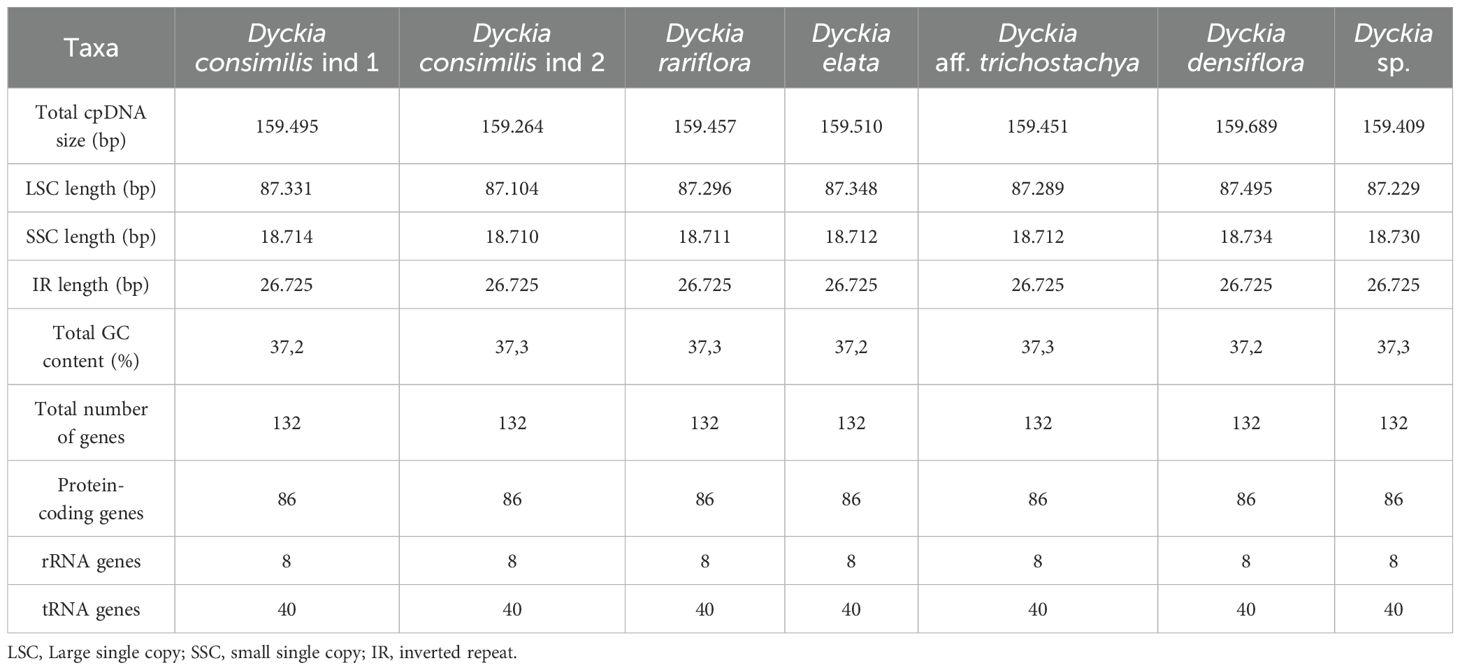
Table 1. General features of chloroplast genomes of seven Dyckia taxa.
Dyckia plastomes present the same amount of genes (132), with 86 protein-coding genes, eight ribosomal RNAs (rRNAs), and 40 transfer RNAs (tRNA) (Figure 1). Among the protein-coding genes present in Dyckia spp. five were associated with Photosystem I, 14 with Photosystem II, six with Cytochrome b/f complex, six genes with ATP synthase, and 11 genes responsible for NADH dehydrogenase (Table 2). Regarding the hypothetical chloroplast reading frames (ycf), all Dyckia spp. exhibited a small fragment of ycf1 at the border of the IRB and SSC regions. This distinctive characteristic was simultaneously found in all Dyckia spp. exclusively through the annotation software Chloe, which was the unique gene exclusive to this third-party stand-alone annotator.
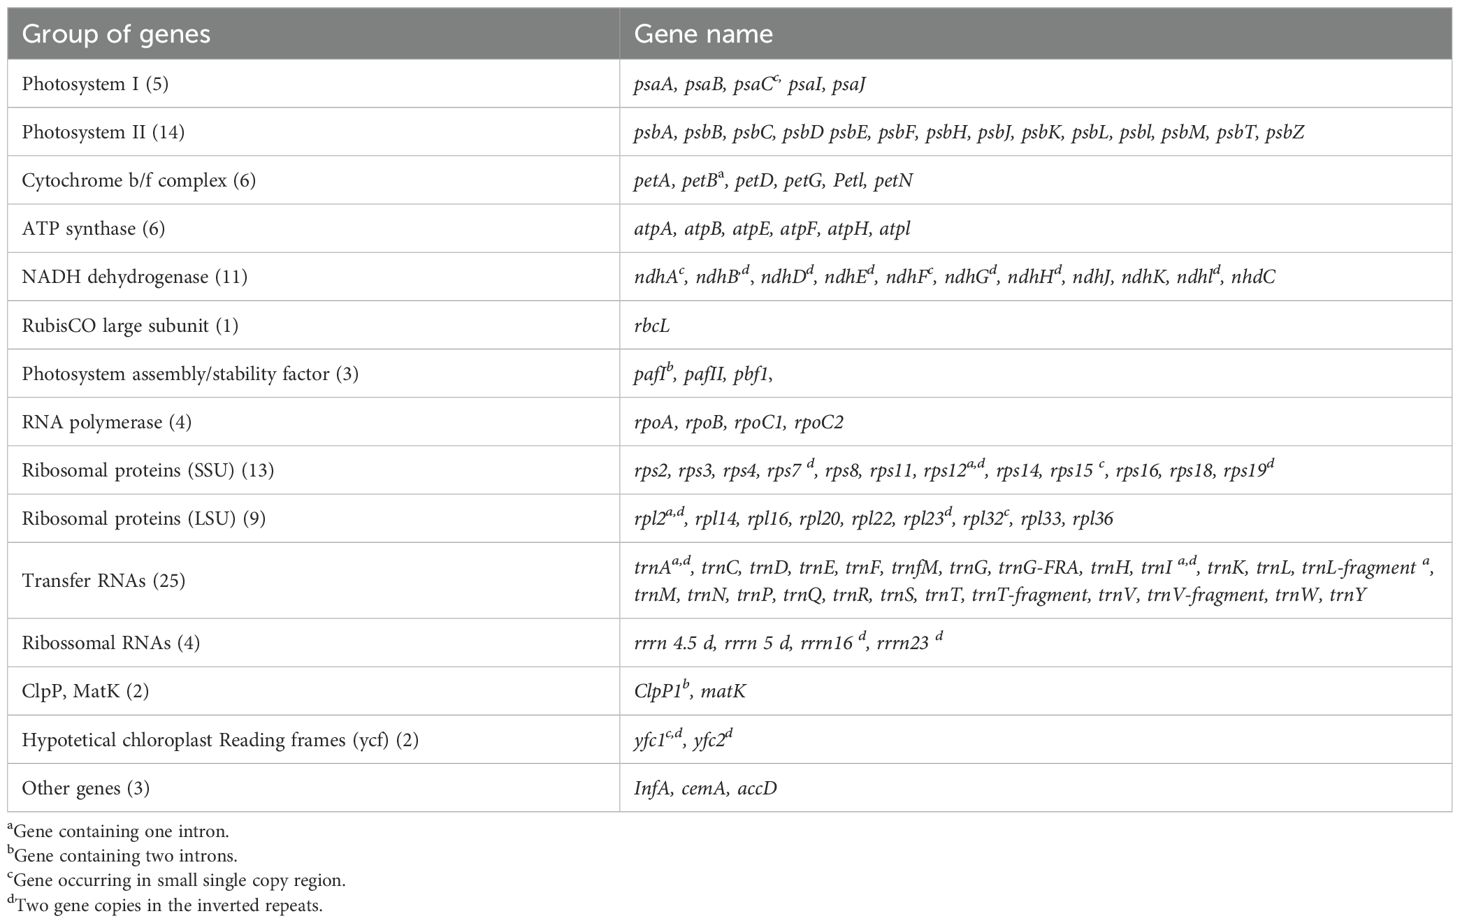
Table 2. Chloroplastidial genes in Dyckia spp.
Additionally, some genes showed slight variations in length among species. Associated with the coding of the ATP synthase F subunit, the gene atpF had a length of 1414 bp in all species, except for Dyckia sp., whose length was slightly lower at 1398 bp. Similarly, ndhD in Dyckia consimilis and Dyckia densiflora possess a length of 1506 bp, however, in D. rariflora, D. elata, D. aff. trichostachya, and D. sp., the gene had a length of 1527 bp. These minor differences, although small and possibly negligible in functional terms, may be attributed to the insertion or deletion of indels within the gene sequences.
The chloroplast genomes revealed 15 unique genes containing introns: 12 in protein-coding genes (rpl2, ndhB, rps12, ndhA, petB, clpP1, pafI, rpoC1, atpF, rps16) and three (trnI, trnA, trnL-fragment) within tRNA-coding genes. Five genes were duplicated in the inverted repeats (rpl2, ndhB, rps12, trnI, trnA). Only two genes (clpP1 and pafI) comprised two introns, while the others contained only a single intron. The largest intron was found in ndhA (1061 bp) and the smallest in petB (215 bp) in the SSC and the LSC region respectively.
3.2 Structural comparison for Dyckia spp. plastomes with related species in Bromeliaceae
In accordance with the alignment produced using the chloroplast genome of Pitcairnia atrorubens as a reference, all Dyckia species exhibited the same number and orientation of syntenic blocks with no detected inversions (Figure 2). However, the only noTable difference was a reorganization in the small syntenic block (highlighted in green) that shifted from the beginning of the alignment in Dyckia to the end in Pitcairnia atrorubens, due to differences in the determination of the LSC region. The noTable decrease in the extent of the second syntenic block (highlighted in blue) in D. consimilis, D. densiflora, and D sp. between 13,200 pb and 16,000 pb overlaps with the IRA region in the plastomes here sequenced.
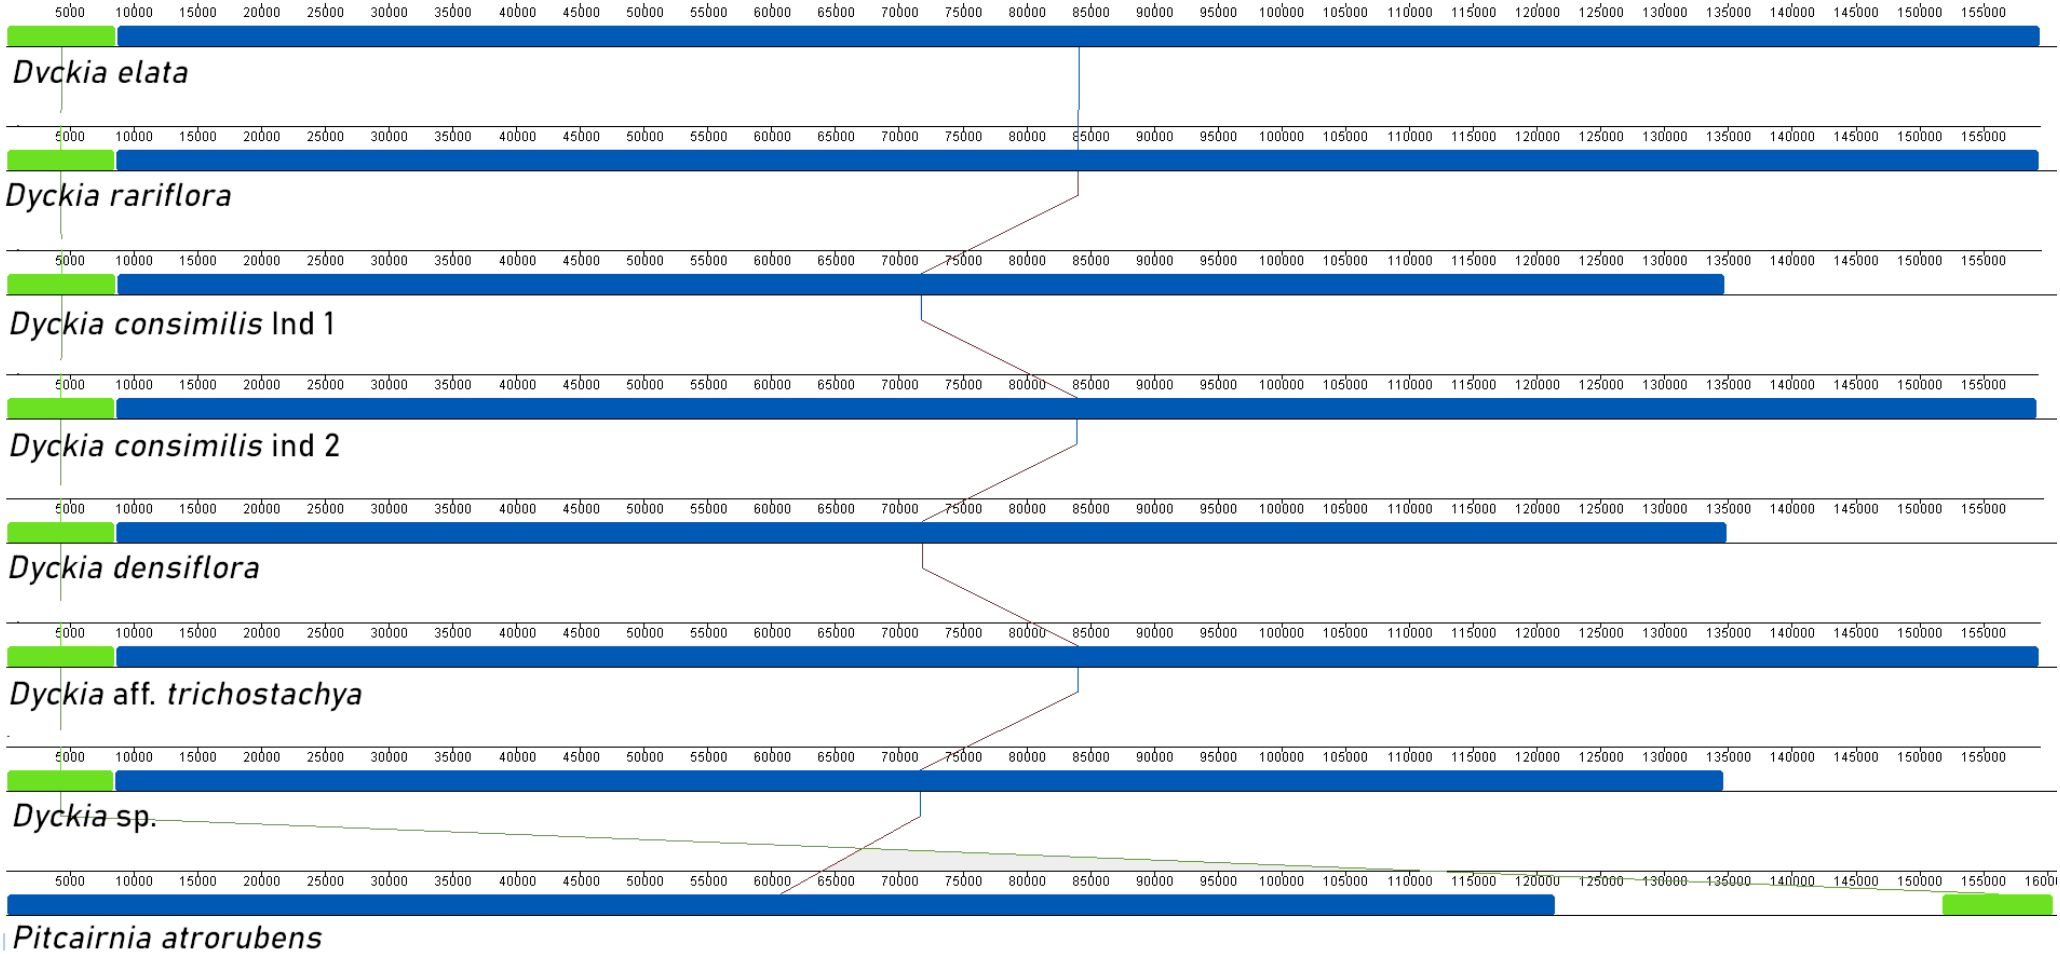
Figure 2. Synteny between Dyckia species using Mauve multiple-genome alignment program. Eight different chloroplast genomes are displayed. Colored bars indicate putative syntenic blocks, and connecting lines indicate corresponding blocks.
On the other hand, the alignment of all Dyckia samples and seven other species representing all subfamilies in Bromeliaceae reveals a high level of synteny in the family with three distinct conserved blocks (Figure 3). In this analysis, the small syntenic block (highlighted in dark green) overlaps with the border of the IRB and SSC region. Similar to what was observed in the first alignment, the second syntenic block (highlighted in blue) experiences a decrease in extent over the SSC and IRA border, resulting in unaligned regions in some cases, particularly in the IRA region (between 135,000 bp and the end of the alignment). The rearrangement of the syntenic block order in Brocchinia micrantha and Hechtia rosea may result from plastome assembly artifacts in NCBI or procedural errors in genome annotation of LSC and SSC region boundaries in the analyzed individuals.
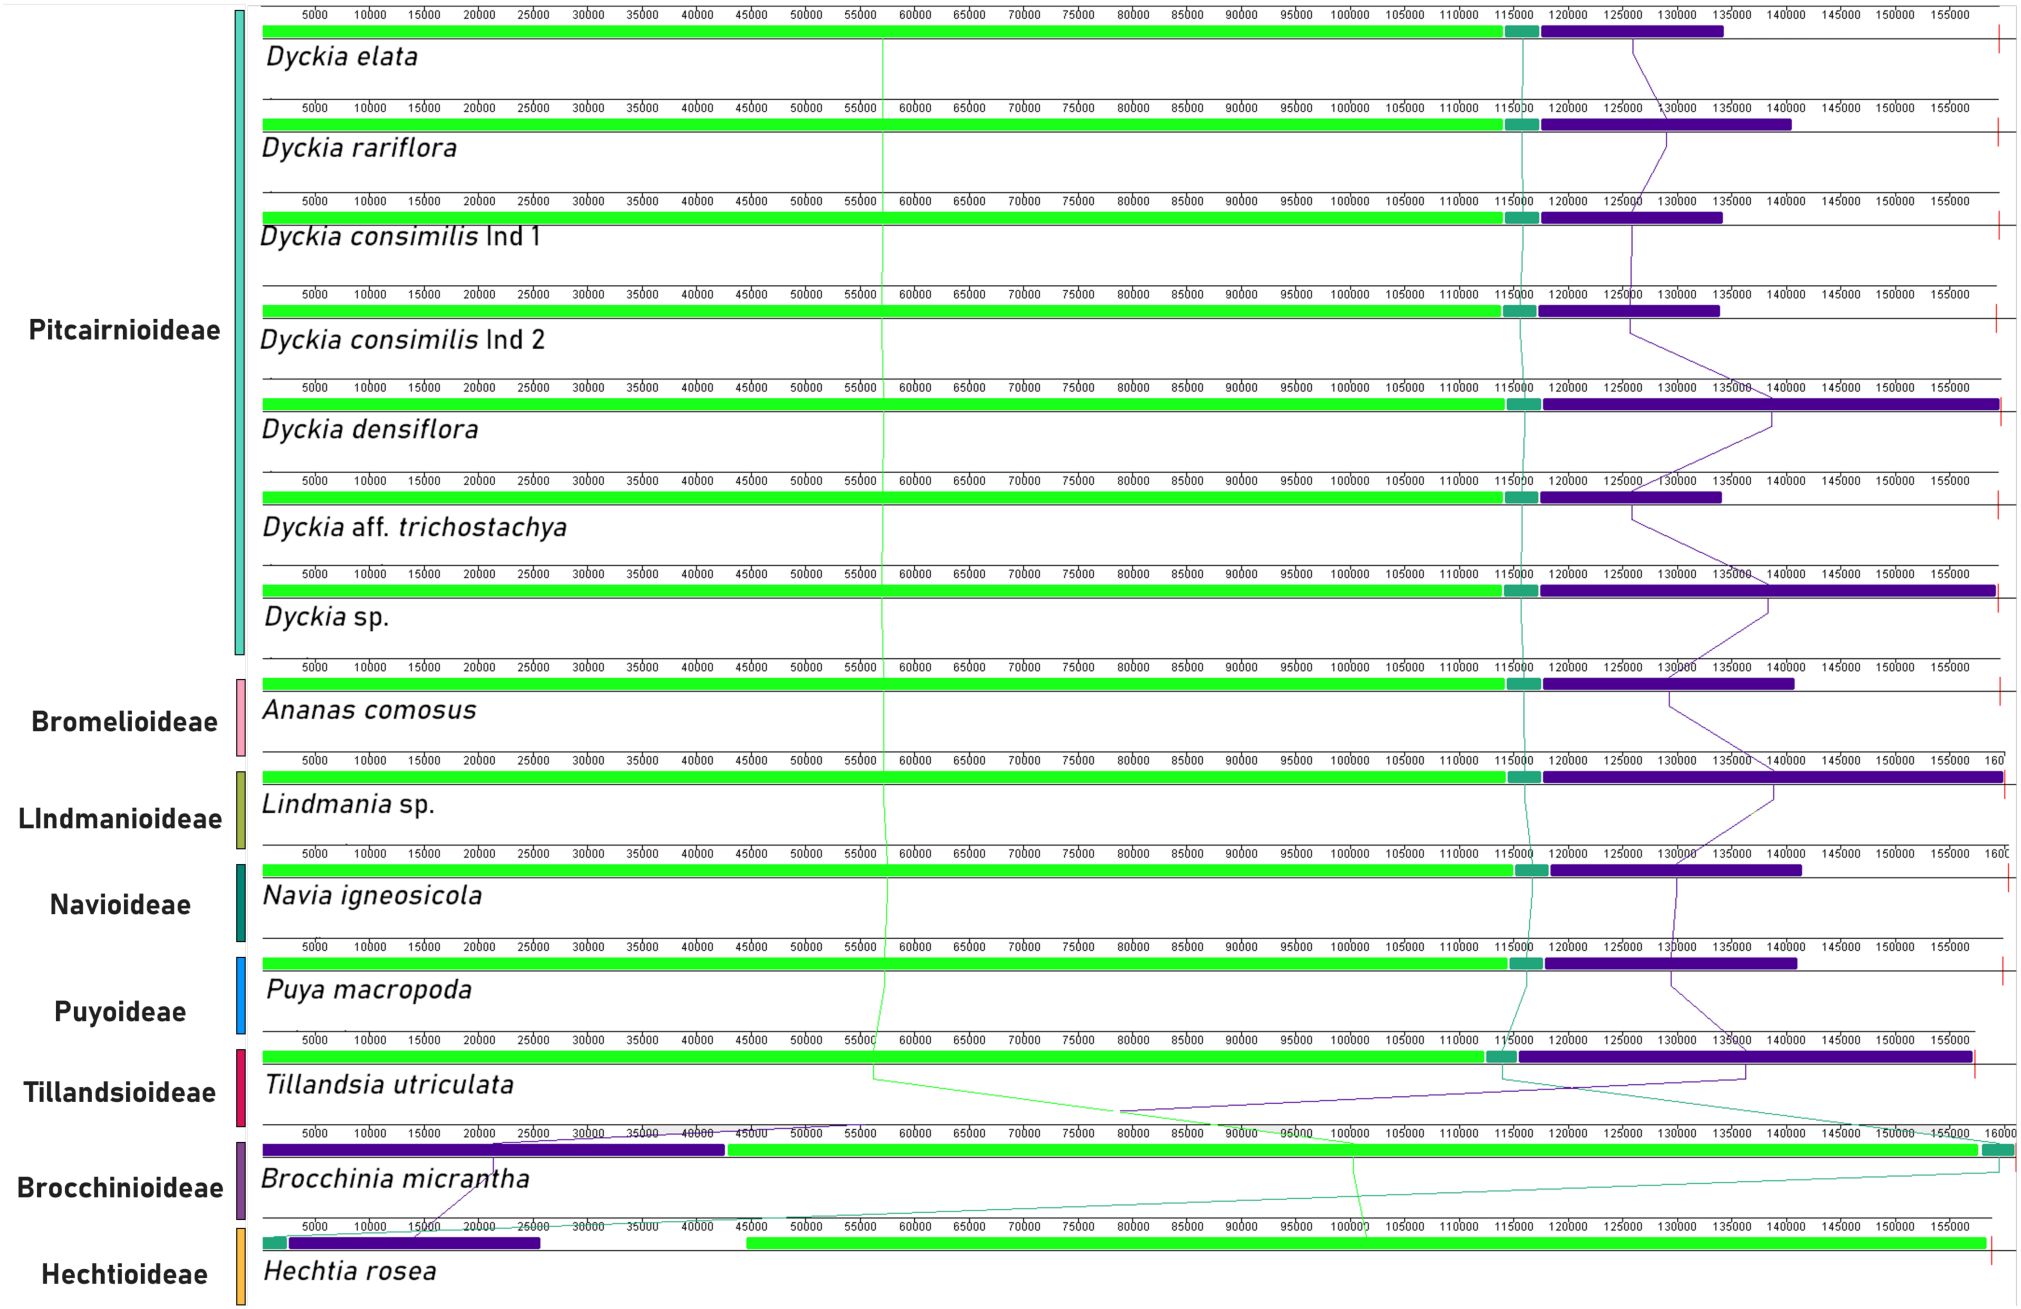
Figure 3. Synteny between Bromeliaceae sub-families using Mauve multiple-genome alignment program. 14 different chloroplast genomes are displayed among all eight Bromeliaceae sub-families. Pitcairnioideae is represented by seven specimens of Dyckia genus; Bromelioideae is represented by Ananas comosus; Lindmanioideae by Lidmania. sp; Navioideae by Navia igneosicola; Puyoideae by Puya macropoda; Tillandsioideae by Tilandsia utriculate; Brocchinioideae by Brocchinia micrantha and Hechtioideae by Hetchia rosea. All cloroplastidial genomes were available in GenBank. Colored bars indicate putative syntenic blocks, and connecting lines indicate corresponding blocks.
The analysis of the expansion and contraction of the boundaries in the IRs regions showed that although there is a high conservation of the type, size, and orientation of genes present in the boundaries of LSC and SSC among Dyckia, the absence of the ycf1 fragment in Puya hutchisonii was noteworthy (Figure 4). The transition of the IRB and SSC regions was characterized by the presence of the ycf1 fragment, whose length and distance from the SSC border varied considerably. In Dyckia species and Pitcairnia atrorubens, the ycf1 fragment extends by 101 and 71 bp into the SSC region, respectively. In Tillandsia utriculata, although of similar length, the ycf1 fragment ends 32 bp before the boundary. Furthermore, within Dyckia species, variations (ranging from 1 to 12 base pairs) were identified in the length between the ndhF gene and the IRB-SSC region boundary. However, in Dyckia elata, a significant expansion of the gene by 649 bp was detected compared to other species.
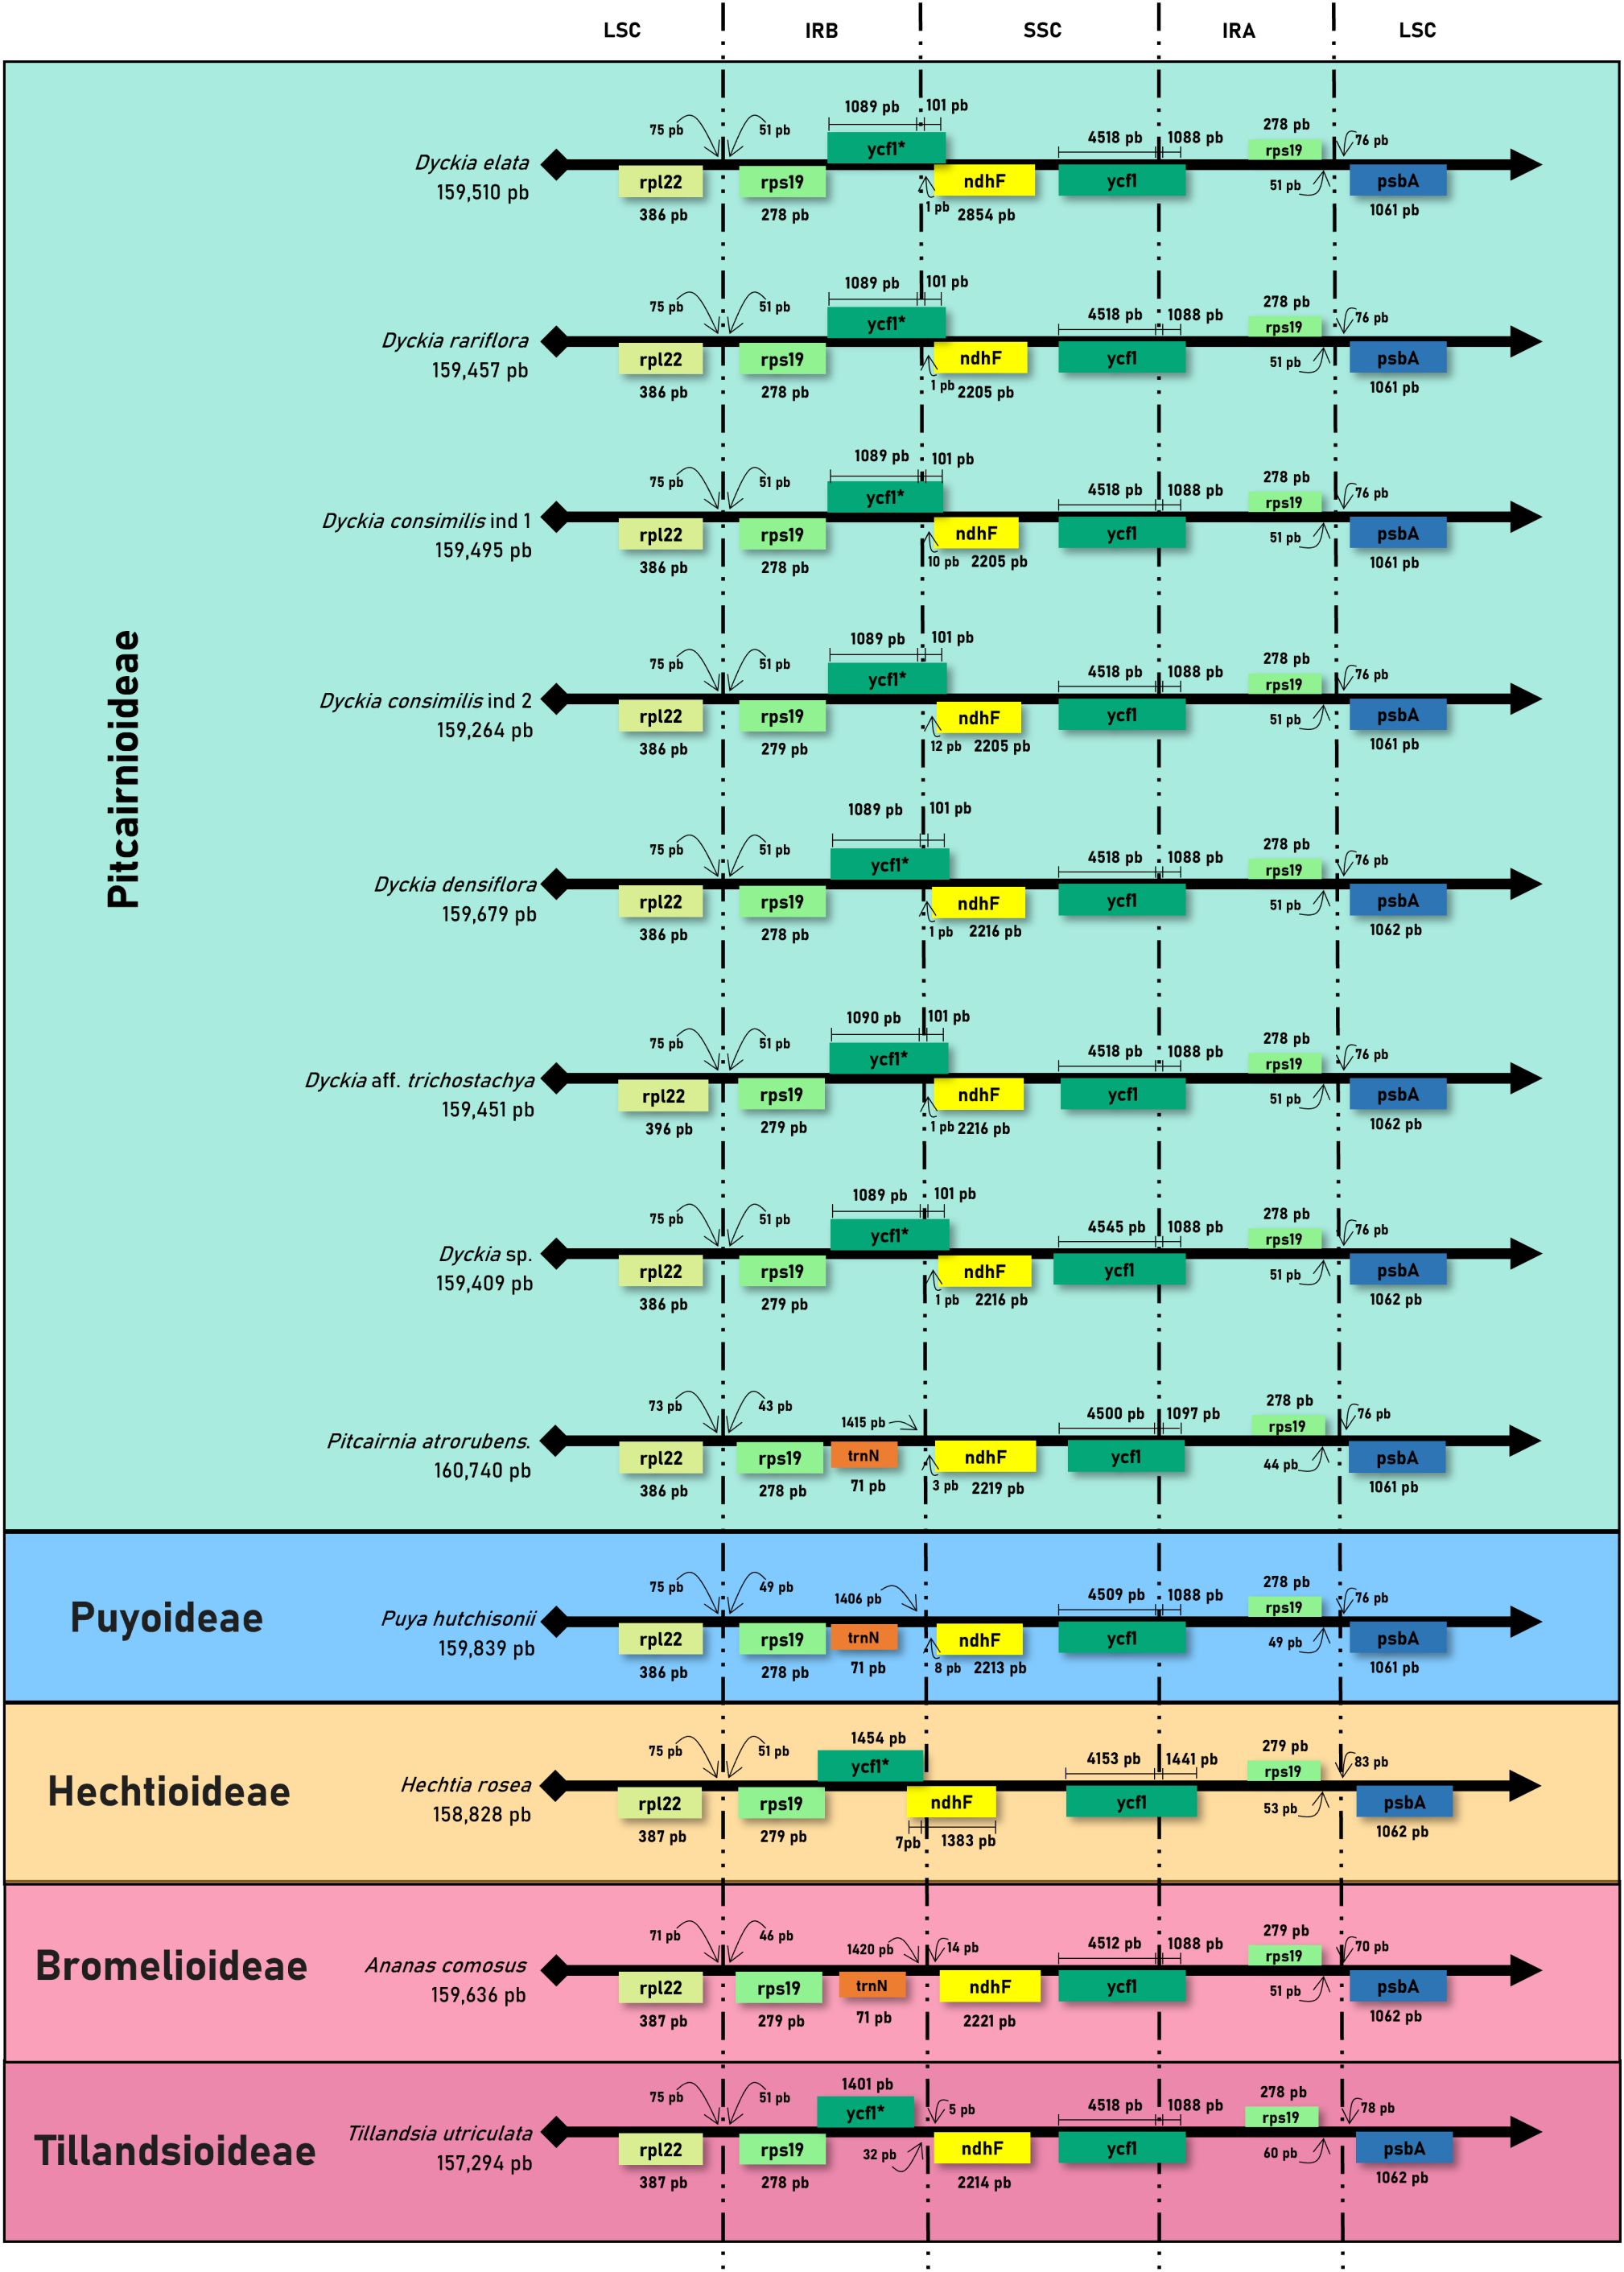
Figure 4. Comparative analysis of the border positions of LSC, SSC, and IR regions across chloroplastial genome sequences from 12 taxa belonging to the Bromeliaceae family.
3.3 Detection of Sequence Repeats and Polymorphisms in Dyckia
We identified 637 simple sequence repeats (SSR) among Dyckia species. The species with the most SSR were D. elata and D. densiflora (94) followed by D. aff. trichostachya, D. rariflora, and D. consimilis ind 1 (92, 91, and 91 respectively). The species with less SSRs found were D. consimilis ind 2 (87) and Dyckia sp (88). The most common type of SSRs motifs found was mononucleotide (67.03%), followed by tetra and dinucleotides with 11.93% and 12.87%, respectively (Figure 5A). Although the SSR motif recurs in all Dyckia species, two species have diverged from this pattern: AAAAC/GTTTT was found only in D. elata and D. rariflora, and the motif AAT/ATT is present in all species except D. rariflora (Figure 5B). Among Dyckia the SSR were more abundant in LSC (81.32%) and less in the IR regions (4.40%) (Figure 5C).
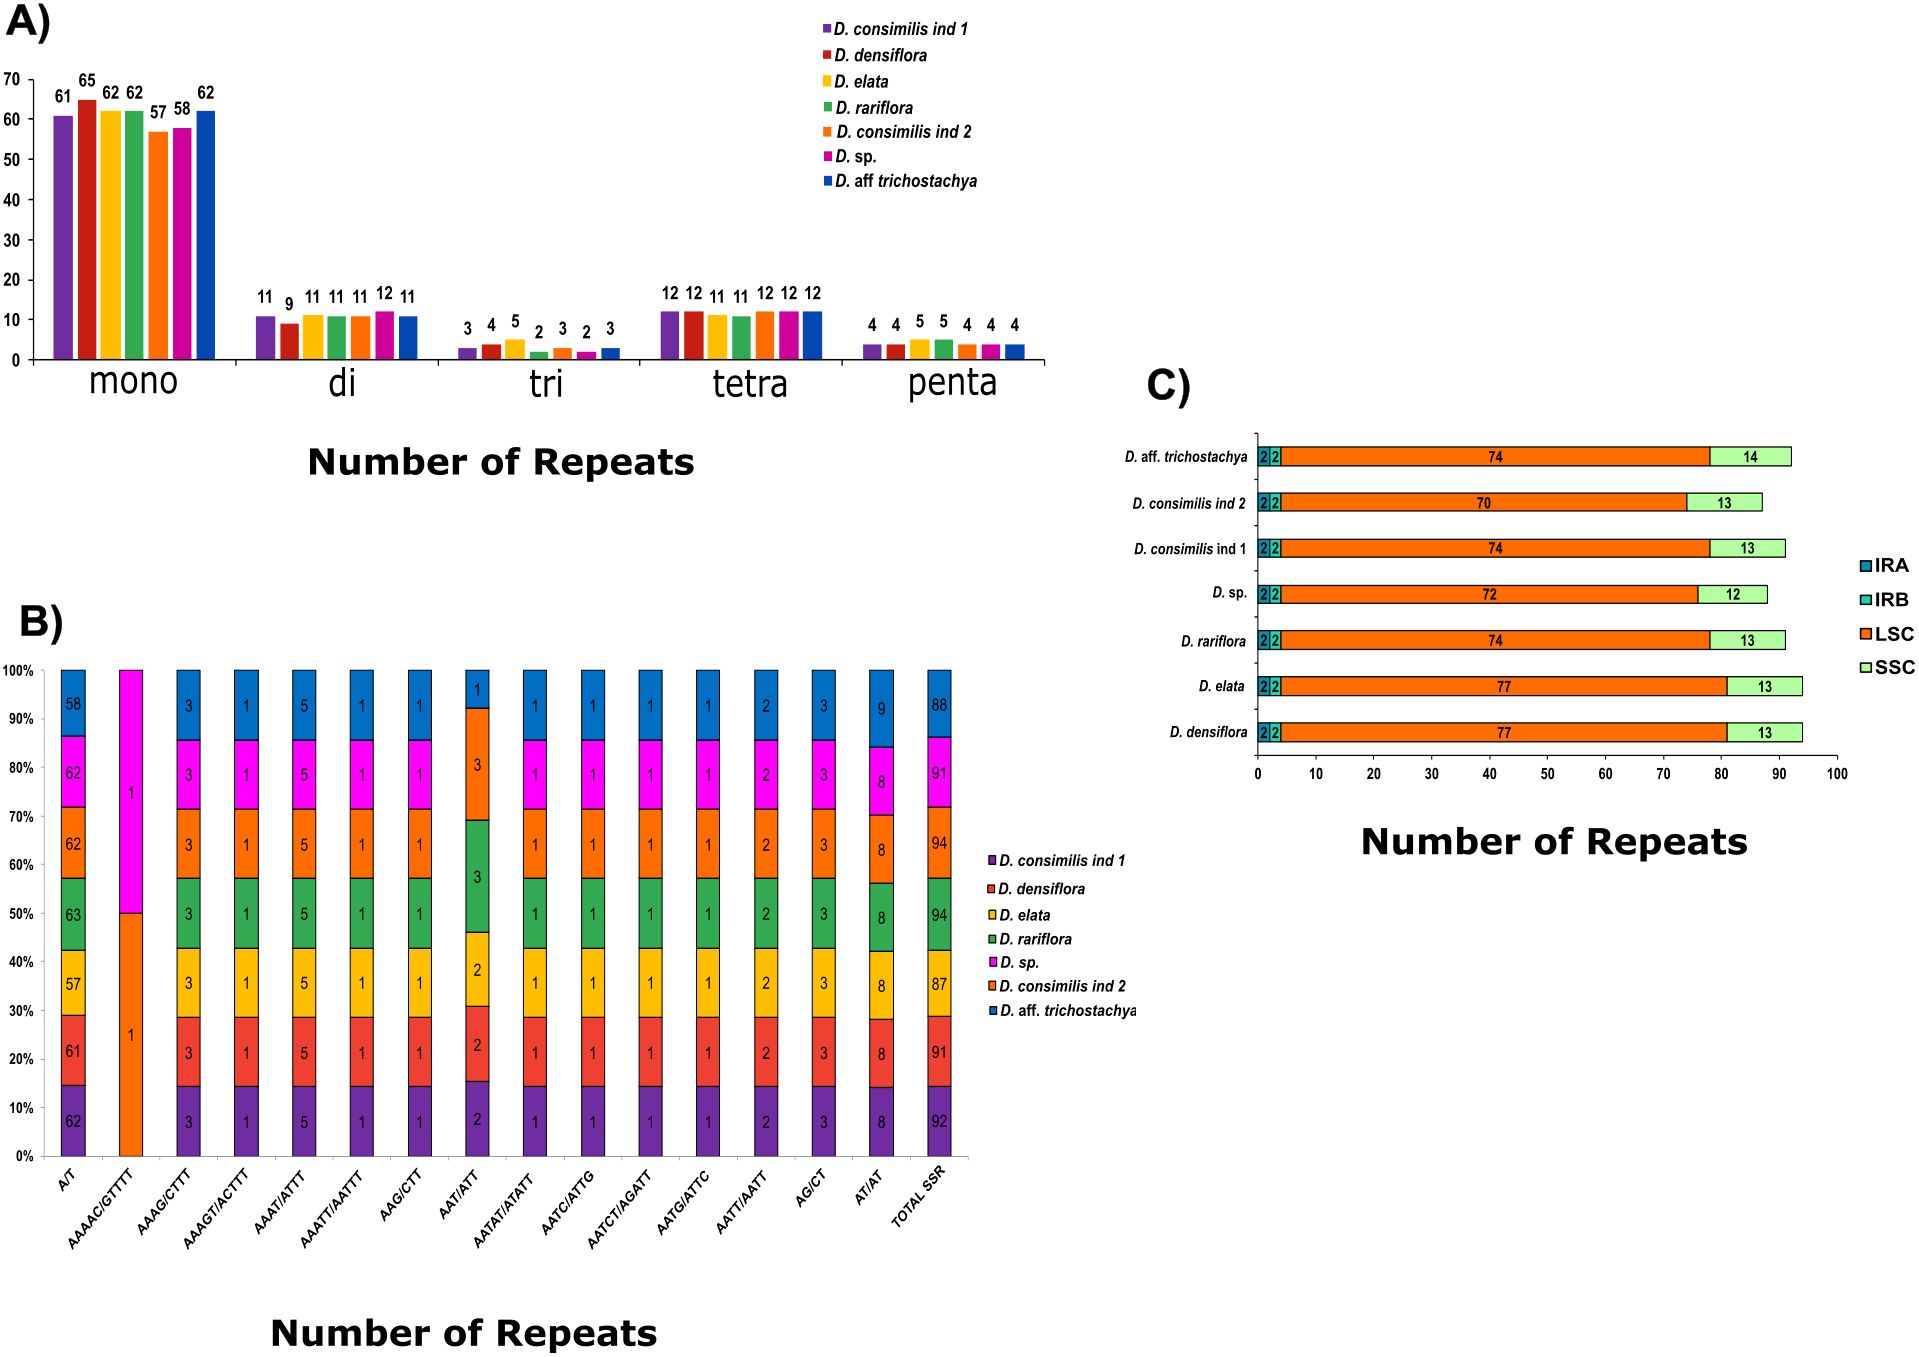
Figure 5. Classification, motifs and chloroplast region occurrence of single sequence repeats (SSR) in the chloroplast genomes of Dyckia. (A) Number of SSR types (mono-, di-, tri-, tetra-, penta-, and hexanucleotides) present in the seven chloroplast genomes; (B) Number of different SSR motifs in the plastomes; (C) Number of SSR in the different chloroplast genome regions among species.
The quantification of dispersed repeats varied considerably among the species. We observed 42 in D. rariflora, 40 in D. consimilis, 39 in D. aff trichostachya, 37 in D. sp, 26 in D. densiflora, and only 24 in D. elata. The most prevalent type in Dyckia were palindromic totaling 208 instances. Nevertheless, we also found 82 forward repeats, 27 reverse, and just 6 complement repeats (Figure 6A). Similarly to the distribution of SSRs, the majority were found in the LSC (71%), with the least in the IRB (6.5%). Reverse and complement types were only found in the LSC, and although it had the highest number of palindromic repetitions (Vera-Paz et al., 2022), it was not possible to find a complement type in D. rariflora (Figure 6B). Despite having the lowest quantity of dispersed repeats, D. elata exhibited the longest repeats (54 and 53 bp), and it was also the only species to present repeats of 40 bp (Figure 6C).
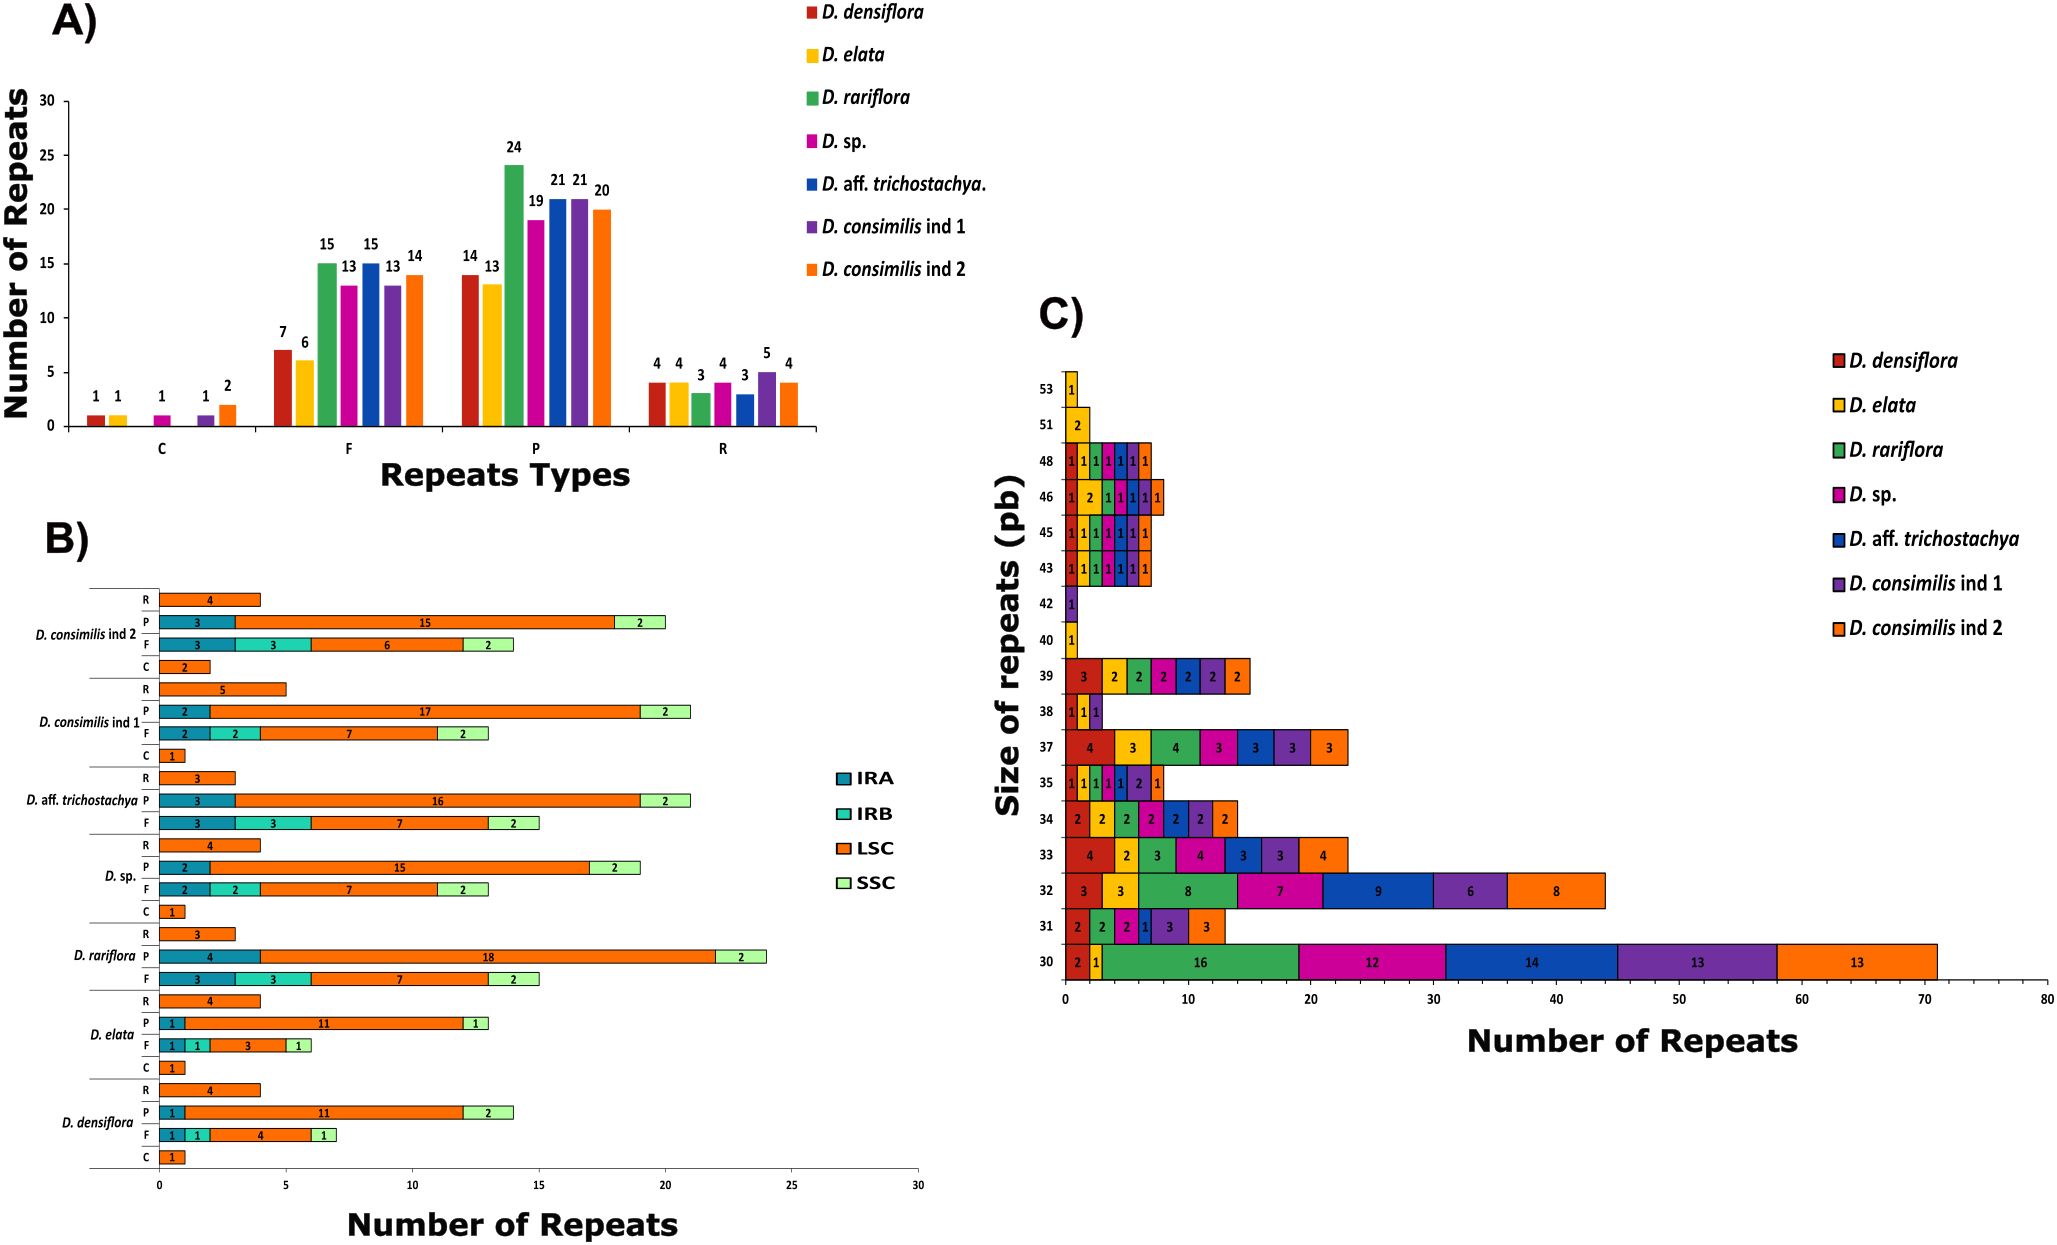
Figure 6. Classification, chloroplast region occurrence and size quantification of dispersed repeats in the chloroplast genomes of Dyckia. (A) Distribution of different types of repeats: F=Forward, P=Palindrome, R=Reverse and C=Complement; (B) Number of repeats in the different chloroplast genome; (C) Size quantification of repeats between Dyckia.
1035 SNPs were identified across the samples, with the majority (71%) occurring in the single-copy regions LSC and SSC (71% and 22% respectively). The most frequently observed nucleotide substitution was A/T (128 SNPs), and C/G substitutions (26 SNPs) were the rarest. In a pairwise comparison, the most significant divergence in SNPs quantification occurred between D. densiflora and D. sp. (90 SNPs), which could not be grouped into any similarity block among the evaluated specimens. The lowest number of SNPs was detected between D. rariflora and D. elata (12 SNPs), with all substitutions found in the LSC and SSC regions. The intermediate differences in SNP quantification allowed the formation of a group comprising the two individuals of D. consimilis (29 SNPs between them) and D. aff. trichostachya (Figure 7A).
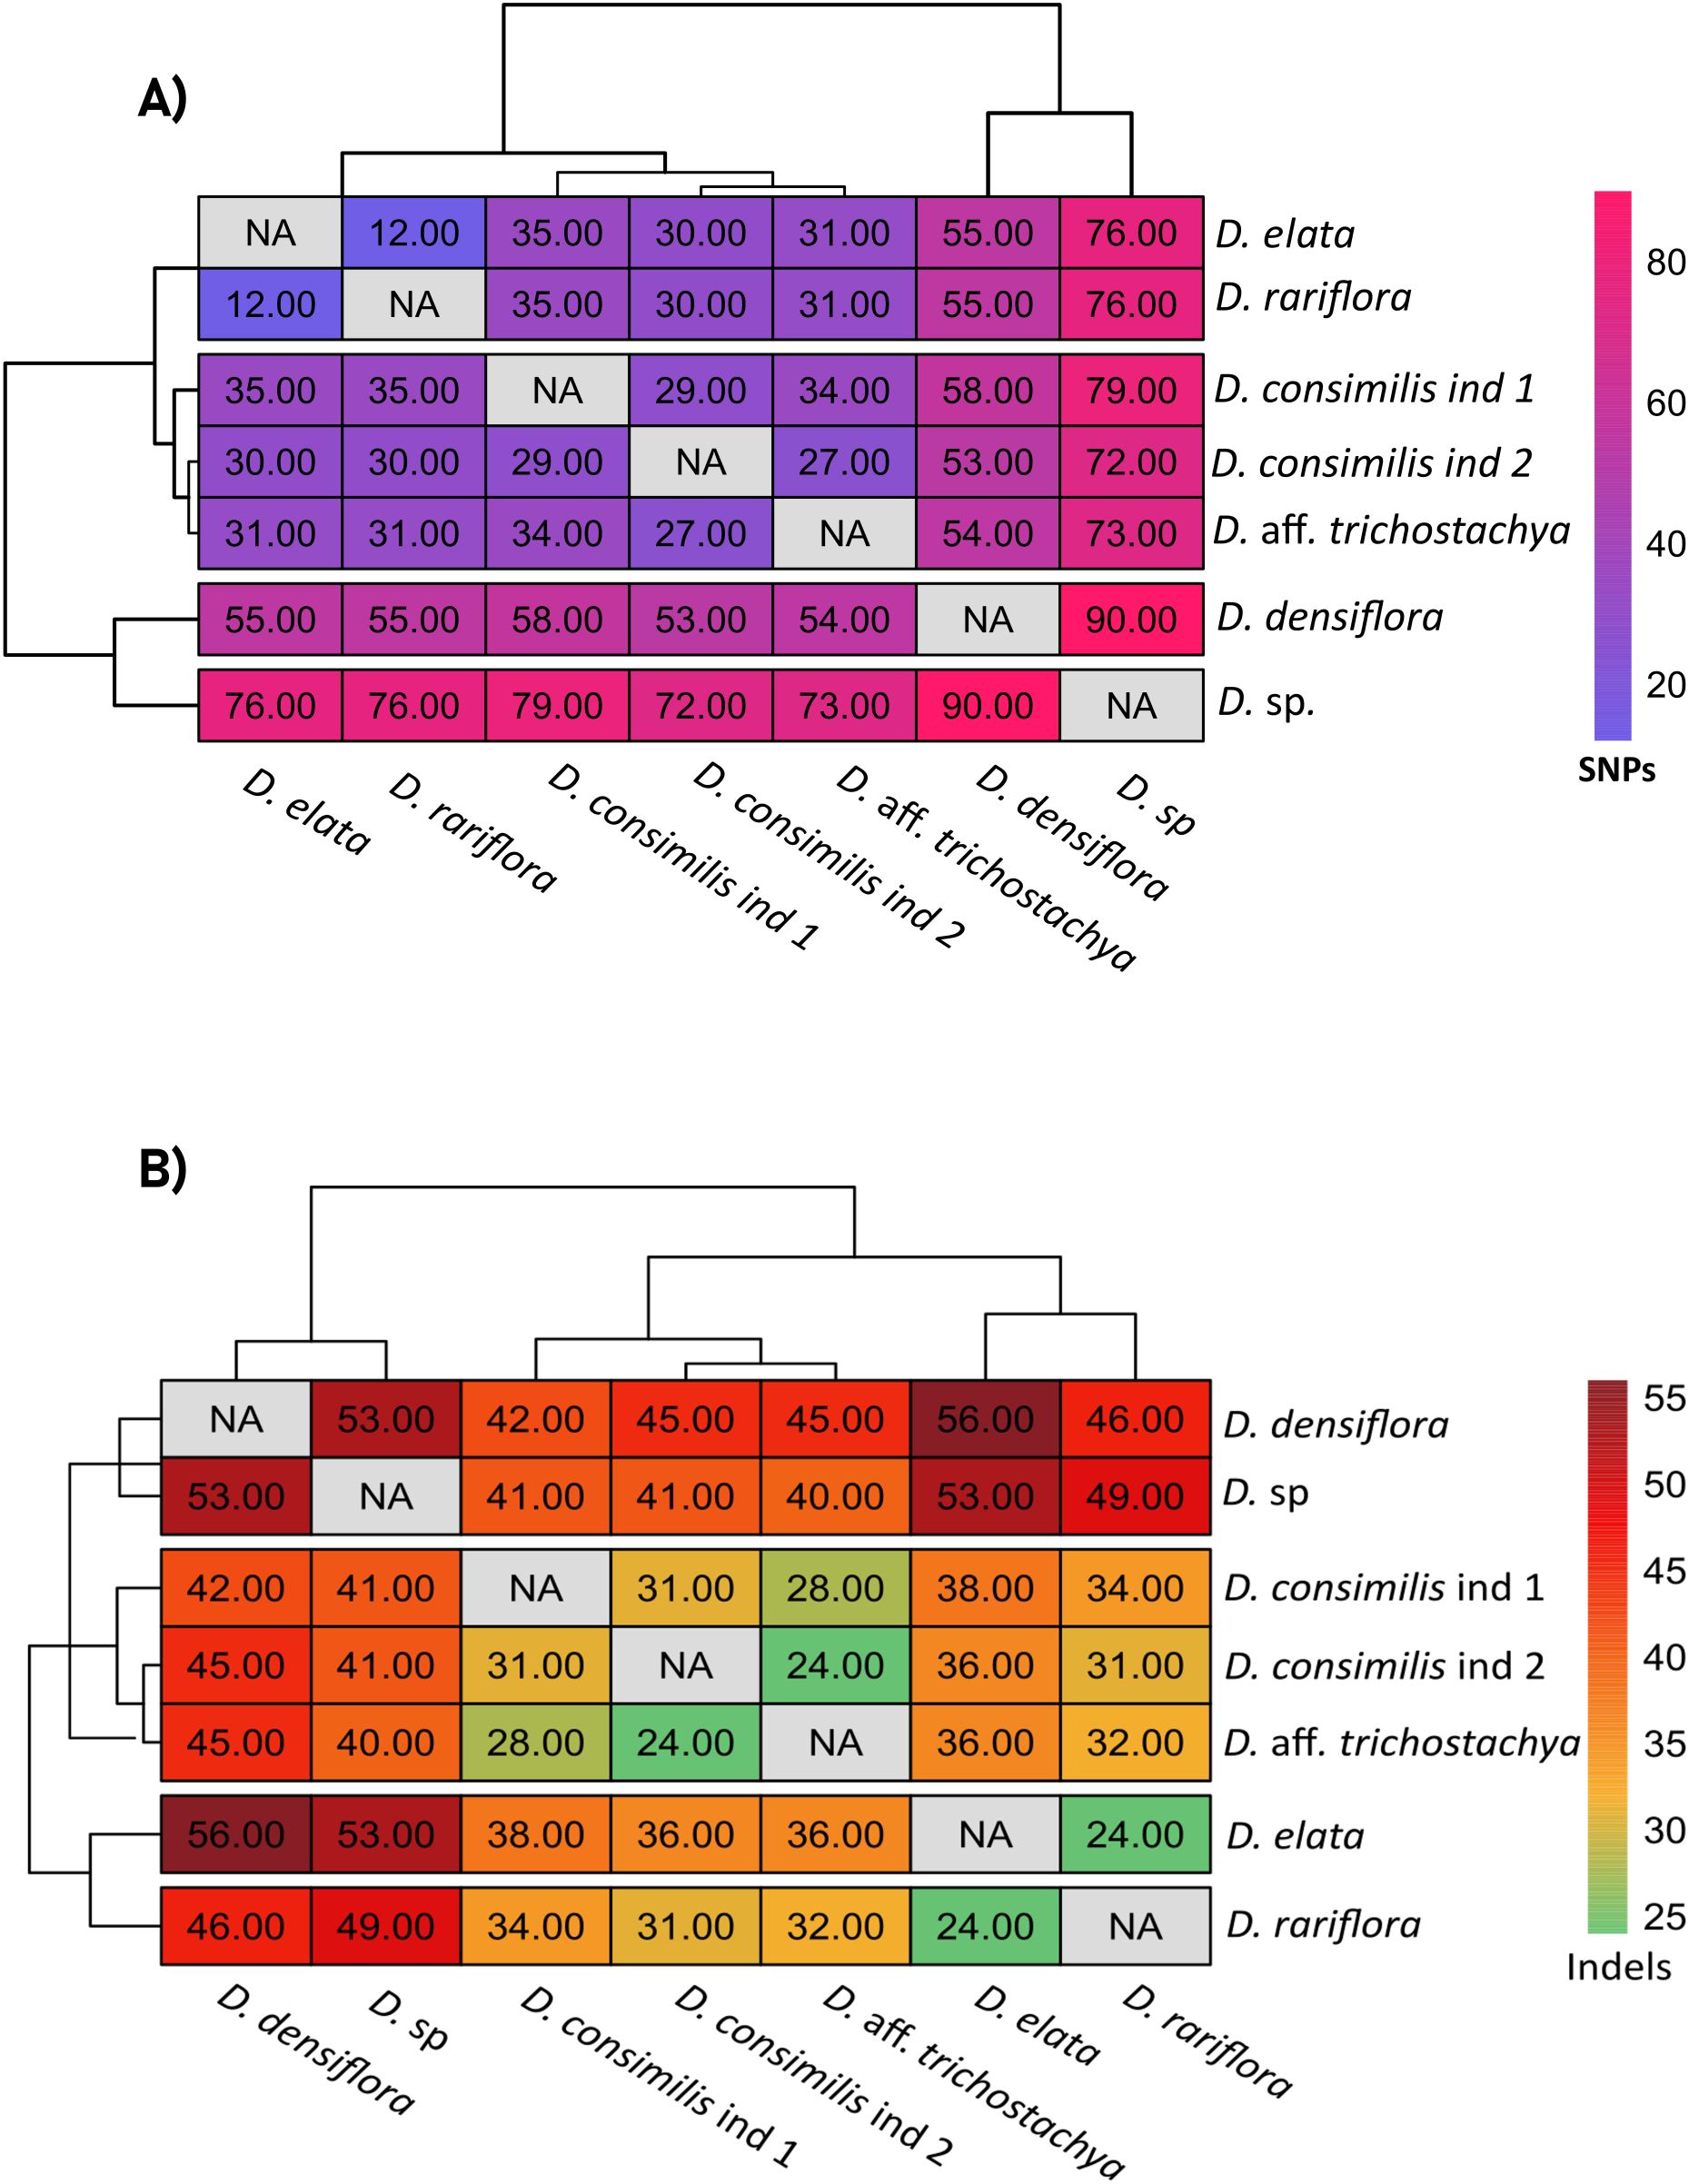
Figure 7. Heatmaps representing the pairwise comparison of SNPS and indels among Dyckia spp. (A) Heatmap showing the pairwise comparison of single nucleotide polymorphisms (SNPs) among Dyckia species. (B) Heatmap showing the pairwise comparison of insertions and deletions (indels) among Dyckia species.
Although less frequent than SNPs, indels were also detected as a means of assessing genetic diversity among the plastomes. A total of 823 indels were found among the chloroplast genomes of Dyckia, occurring exclusively in the single-copy regions LSC and SSC (Supplementary Table S3) The lowest divergence in indel quantification was observed between the species D. elata and D. rariflora, and D. consimilis ind 2 and D. aff. trichostachya (24 indels). The highest divergence was found between D. densiflora and D. elata (Darshetkar et al., 2019), as well as between D. sp and D. densiflora (53 indels) (Figure 7B).
Considering pi > 0.015, the sliding window analysis was able to find three regions of high polymorphic diversity among Dyckia all located in LSC region (Supplementary Table S6) The highly conserved clpP1 gene, associated with protein denaturation and cellular development maintenance, psa1 gene involved in the synthesis of GDP-mannose and the intergenic region trnT and trnL a non-coding region commonly used as a barcode for inferring relationships between several botanical lineages. All these regions, typically not considered traditional chloroplast markers in phylogenetic analyses or barcoding, may serve as potential hotspots of diversity and important molecular markers for Dyckia (Figure 8).
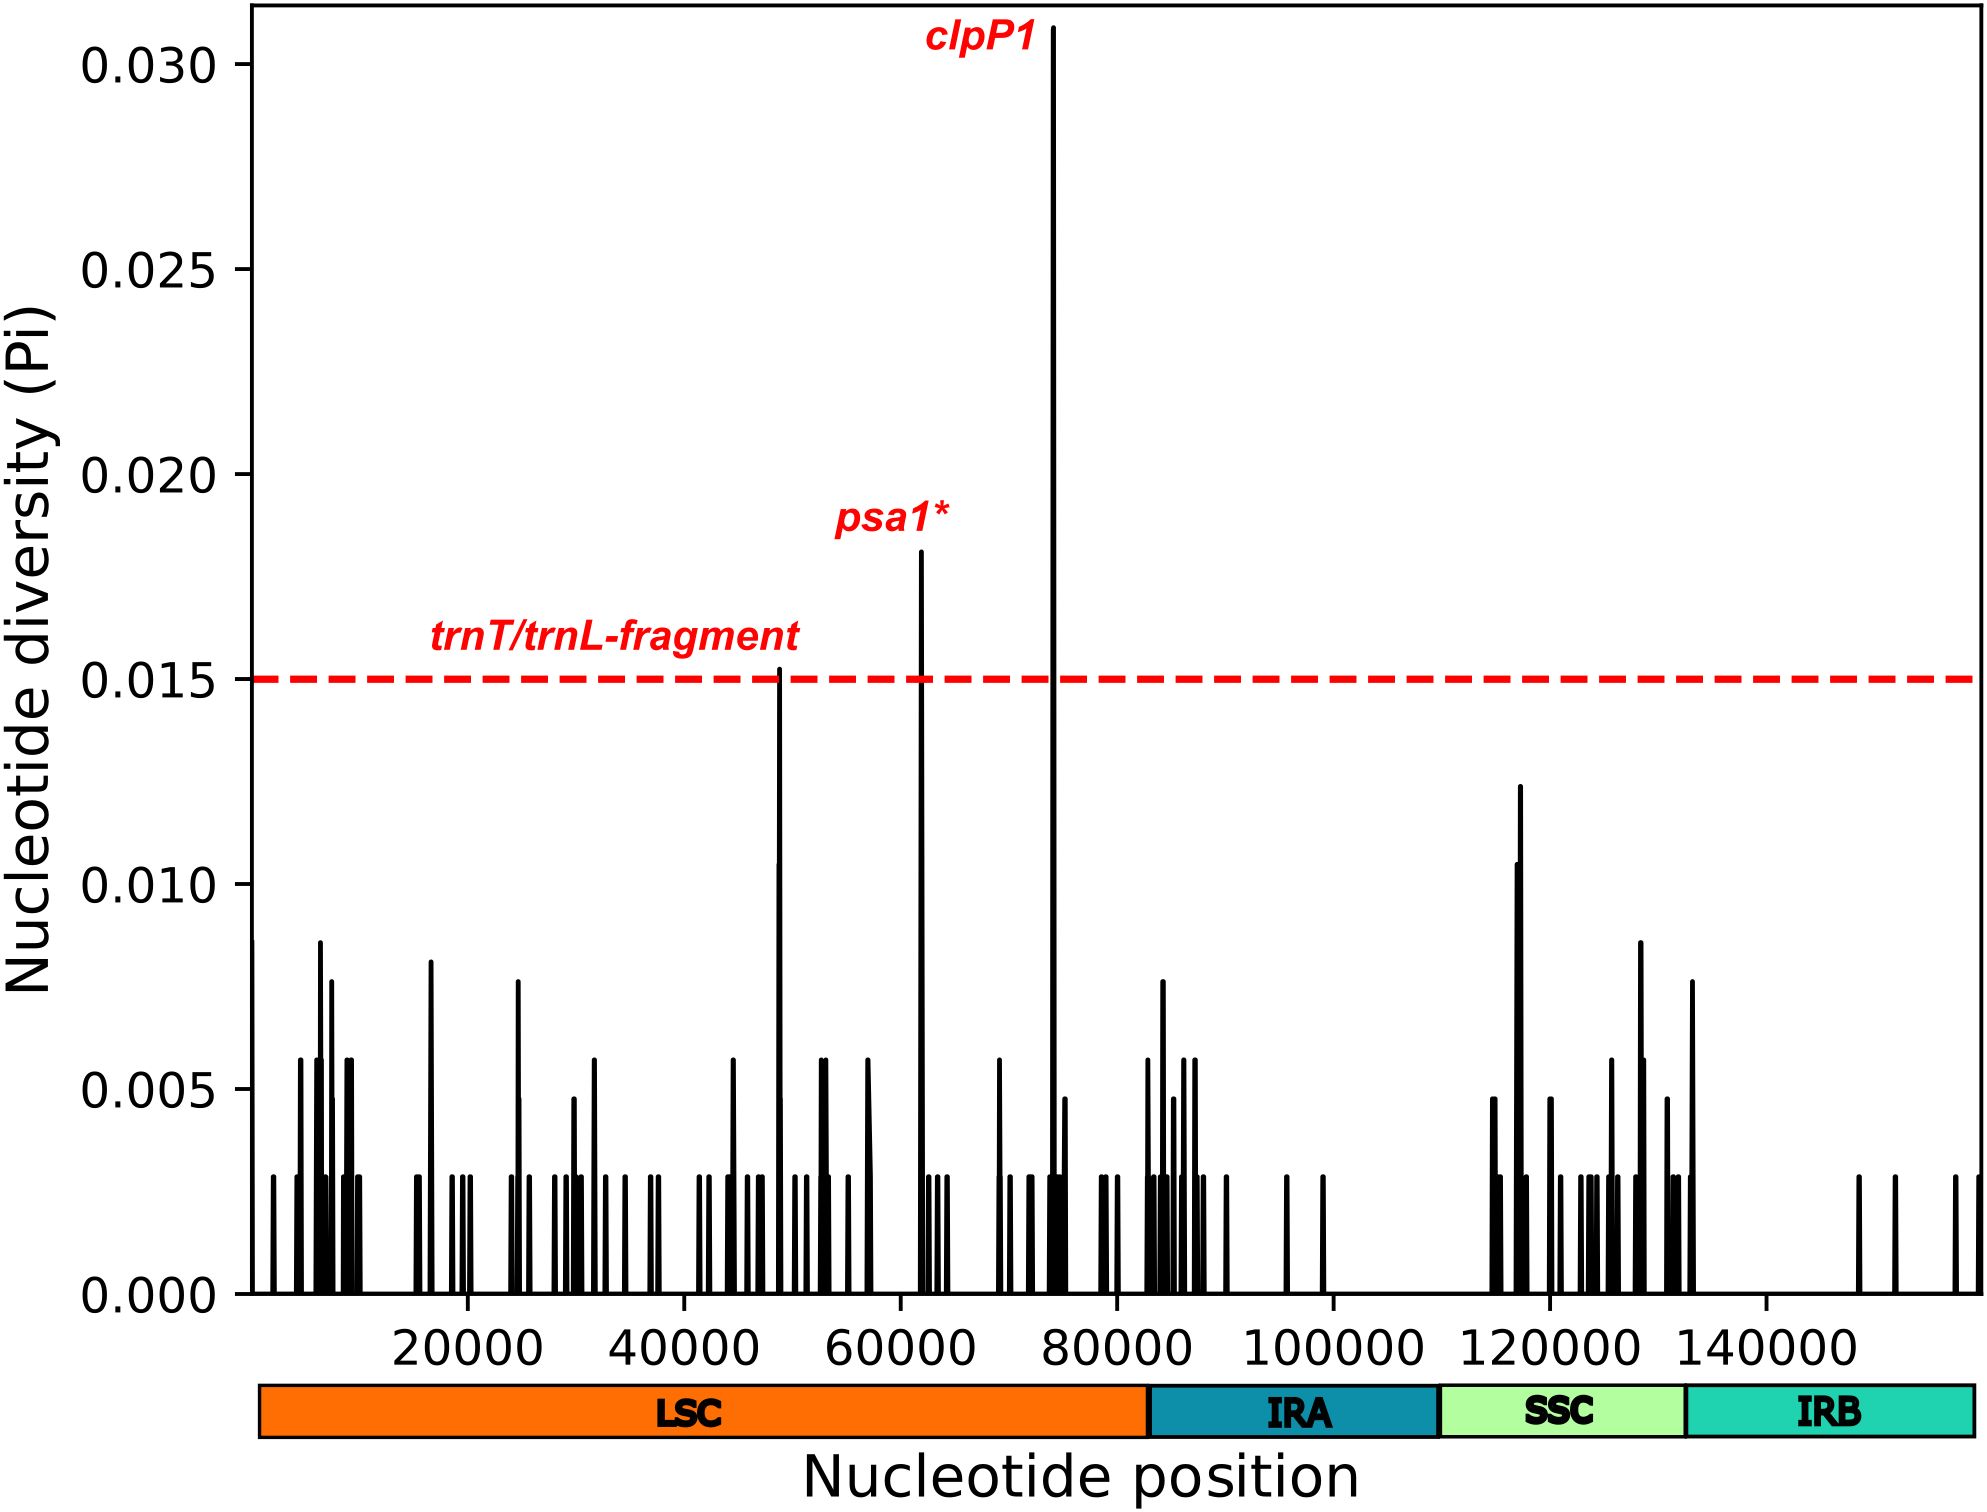
Figure 8. Sliding window analysis conducted on the alignment of chloroplast genomes from Dyckia spp. Highlighted is region with high nucleotide variability (Pi > 0.015). Pi denotes the nucleotide diversity within each window, with a window length of 200 bp and step size of 50 bp. The symbol * indicates a gene fragment.
3.4 Phylogenomic analysis
The ModelFinder software found the best score for the model TVM+F+R2 for the whole partition of characters. The phylogenetic tree (rooted on Lindmania) separated two main groups of bromeliads, the first with Tillandsioideae taxa (Tillandsia and Pseudoalcantarea, 100% Bootstrap Support-BS) and the remaining with taxa of subfamilies Bromelioideae, Puyoideae, Navioideae and Pitcairnioideae, which were closer to Dyckia (Figure 9). Within this clade, Navia (Navioideae) was sister (84% BS) to the remaining taxa in Bromelioideae, Puyoideae and Pitcarinioideae. This clade was in turn divided in two subclades (each with 100% BS). One subclade had species of Puya (Puyoideae) as sister to all taxa in Bromelioideae (Ochagavia, Cryptanthus, Billbergia and Neoregelia, 100% BS). The other subclade presented Pitcairnia atrorubens as sister (100% BS) to all species of Dyckia. The monophyly of Dyckia was well supported (100% BS). Within Dyckia, branch lengths were much shorter, but D. densiflora was sister to remaining species with 90% BS. The next level corresponds to a branch with very low support (58% BS) which corresponds to a methodological polytomy, with Dyckia sp. as sister to two smaller groups. One corresponds to D. rariflora as sister to D. elata (100% BS) and the other the two samples of D. consimilis together (88% BS) and sister (98% BS) to D. aff. trichostachya.
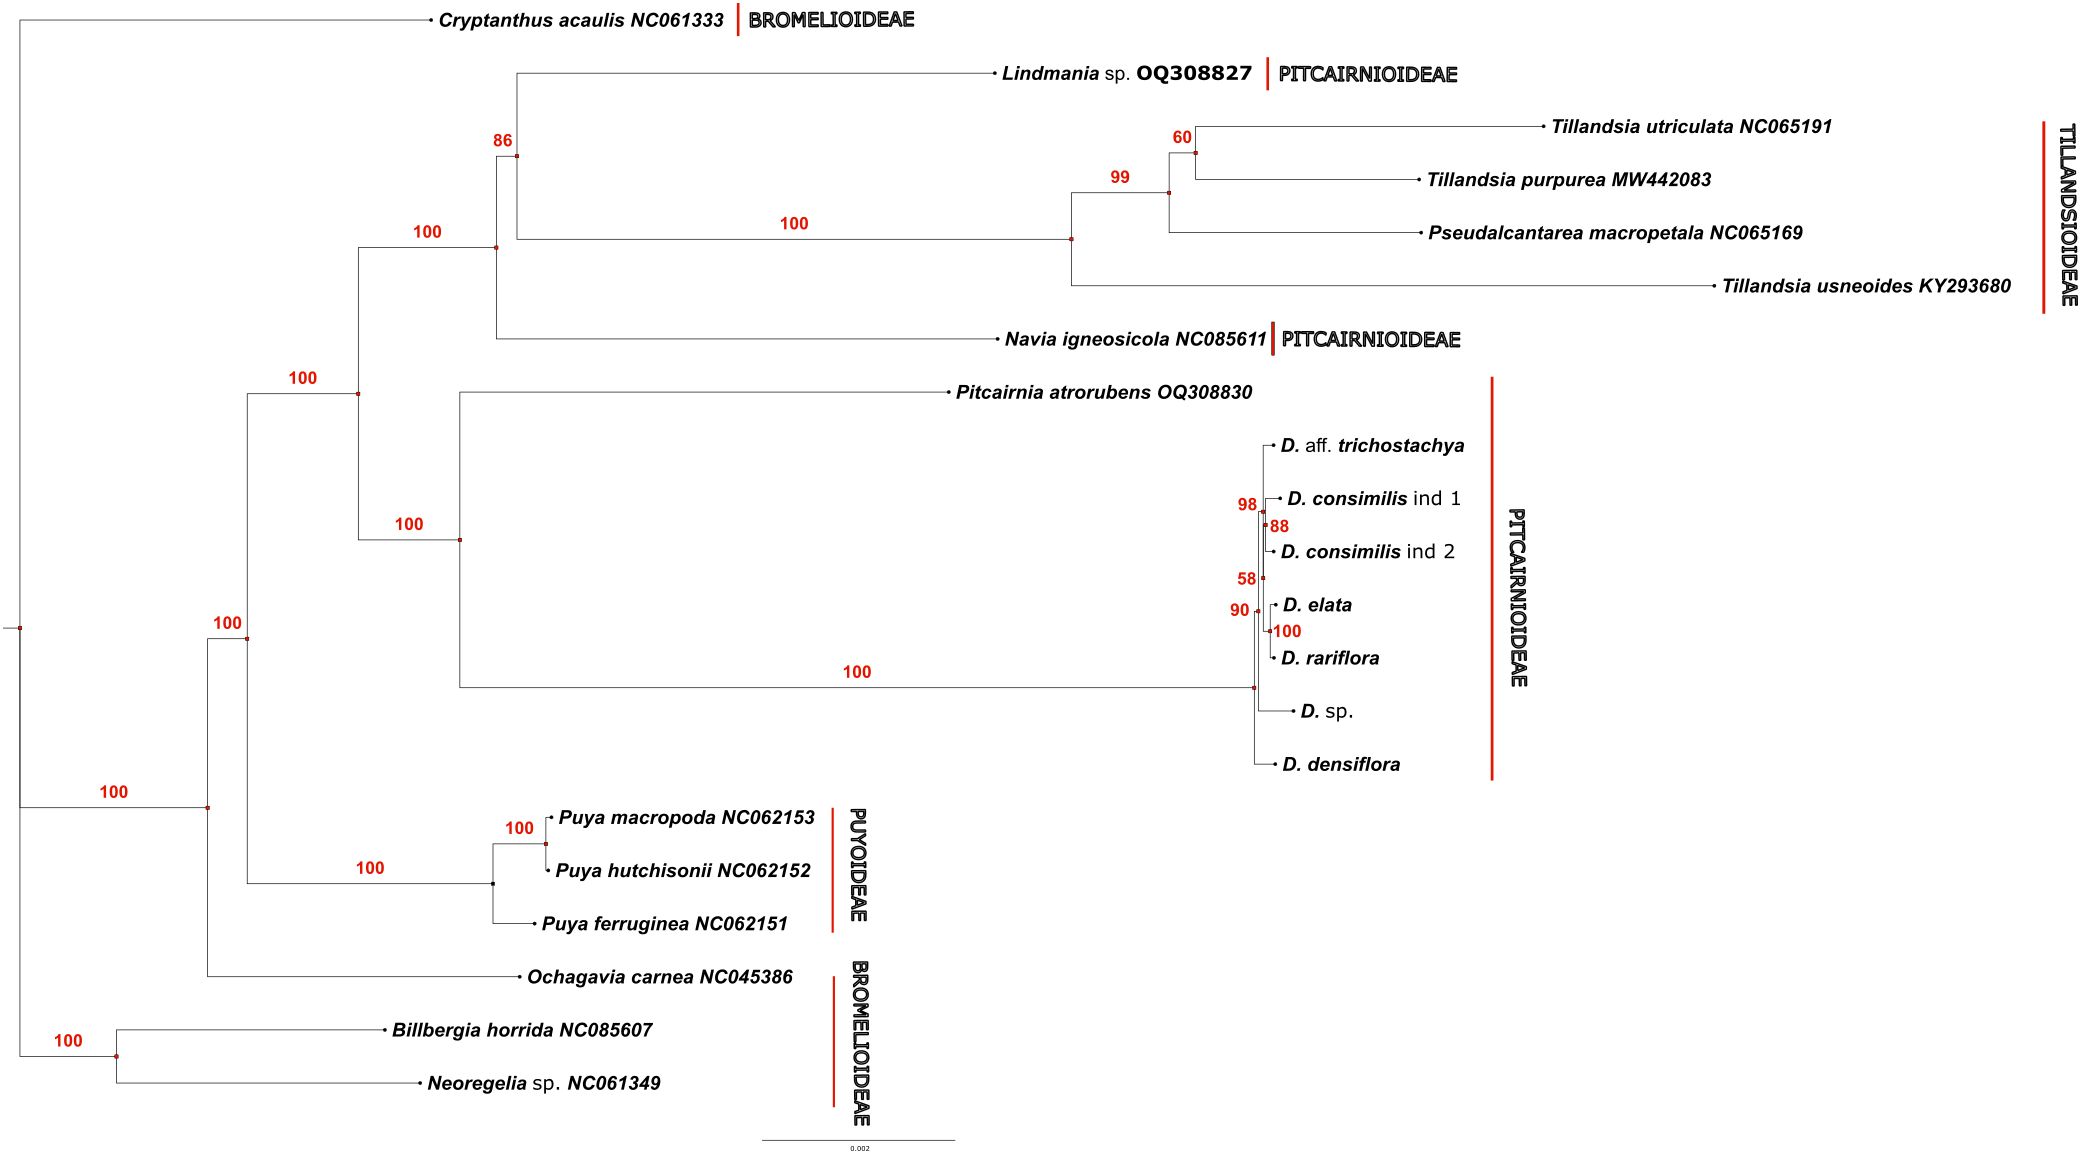
Figure 9. Phylogenetic tree performed under Maximum Likelihood for 21 complete chloroplast genomes of Bromeliaceae species.
4 Discussion
As shown in Figure 1 and Table 1, the complete chloroplast genome sequencing of related Dyckia species revealed a high degree of structural and gene composition conservation. However, we detected minor variations in gene order, consistent with previous observations in other Bromeliaceae species (Redwan et al., 2015; Liu et al., 2022). This pattern has also been widely reported in species with limited distribution and recent evolutionary radiation (Niu et al., 2017; Li et al., 2020; Xu and Xu, 2021). Although similar in length, small variations due to the expansion and contraction of the IR/SSC regions were observed among individuals of the same species (Table 1). For example, in Dyckia consimilis, the length of the LSC region varied from 87,331 bp to 87,104 bp. Despite this, unlike other Bromeliaceae genera such as Hechtia and Vriesea, no inversions were found in the plastomes of Dyckia species (Vera-Paz et al., 2022; Ramírez-Morillo et al., 2023).
Even though its function is not yet fully understood, the open reading frame 1 (ycf1) fragment appears to be a noTable synapomorphy of the chloroplast genome in Bromeliaceae. Its unique positioning, extending between the SSC border and the repetitive regions of the plastome, along with its apparent essential role in plant viability, underscores its potential as a promising barcode marker for terrestrial plants (Drescher et al., 2000; Neubig et al., 2009). Given the significant potential for recombination and homologous rearrangement, along with the high substitution rates in inverted regions that affect structural stability, the borders between the LSC, IR, and SSC regions are common sites of structural variation and mutations (Kim and Lee, 2005; Yue et al., 2008; Xiong et al., 2009; Zhu et al., 2016). While all evaluated Dyckia species displayed a truncated ycf1 fragment at the IRB/LSC border, variations in the length of the ndhF gene, as observed in D. elata, along with small modifications in the distance between plastid region borders and the gene, support its potential use as a molecular marker in this genus. The overlap between the ycf1 and ndhF genes, along with their structural variations, has been widely linked to the expansion of the IR region (Dong et al., 2015). This suggests rapid positive selection acting on these genes, with their rate of structural variation potentially providing more insightful information for the development of DNA barcodes than traditionally used genes like rbcL or matK (Amar, 2020).
In our screening for potential DNA barcodes, we identified three sequences—clpP1, psaI, and the trnT-trnL intergenic region—with higher molecular variability that were not included in the most recent phylogenetic analysis proposed for Dyckia (Gomes-Da-Silva et al., 2019). Despite their promising variability, the informative potential of these regions remains underexplored in previous studies (Krapp et al., 2014). The diversity found in barcodes that are not conventionally used in molecular analyses for Dyckia and other bromeliad lineages highlights the need for taxon-specific barcodes or the use of ‘super-barcodes’ with complete plastome sequences to enhance interspecific resolution in these taxa.
Repetitive sequences play an important role in the structural rearrangement of the chloroplast genome in various plant species (Wheeler et al., 2014). Similarly, cpSSRs have been widely used as molecular tools in population genetics studies, species delimitation, and analyses of hybridization and introgression in related species, largely due to their co-dominant expression and polymorphism (Gonçalves-Oliveira et al., 2020; Aecyo et al., 2021; Pinheiro et al., 2021).
The repetitive content of Dyckia chloroplasts, including cpSSRs (94–88) and dispersed repeats (42–24), was higher than that found in Puya spp. and other species of the order Poales, such as Eriocaulon decemflorum, but still considerably lower than that found in other bromeliads such as Ananas comosus and Tillandsia usneoides (Redwan et al., 2015; Poczai and Hyvönen, 2017; Darshetkar et al., 2019; Liu et al., 2022). Dispersed repeats are broadly associated with mutational hotspots, chromosomal rearrangements, and localized expansions of chloroplast genome size. Their presence and variability among Dyckia species suggest considerable evolutionary plasticity and highlight their potential as informative polymorphic markers at the population level. These features, as well as cpSSR motifs, may be particularly valuable for distinguishing closely related species and for informing the design of effective in situ conservation strategies (Ebert and Peakall, 2009).
SNPs and indels are the most common types of mutations in cpGenomes. The low SNPs diversity between D. elata and D rariflora may support the previously suggested hypothesis of synonymization between the species (Guarçoni, 2014). However, considering their restricted distribution and high morphological similarity, analyses using other molecular markers with higher mutation rates, capable of elucidating recent evolutionary events, are needed to further clarify the similarity between the species. Furthermore, the diversity of indels and SNPs among individuals of the same species, as seen in Dyckia consimilis, underscores a possible intra-populational diversity greater than what is typically found in other Dyckia spp, highlighting the need for further population studies in Dyckia (Hmeljevski et al., 2011; Hirsch et al., 2020).
The phylogeny obtained despite the limited sample of plastomes included, clearly replicates the overall phylogenetic structure of Bromeliaceae of Givnish and colleagues (Givnish et al., 2014). Based on that study, we selected Lindmania as an outgroup, and the first group to diverge was Tillandsoideae, followed by Navioideae, since no plastome of Hechtioideae was included in our matrix. Finally, the next part included Puyoideae+Bromelioideae as sister to Pitcairnioideae, and Pircairnia as sister to the samples of Dyckia, which is altogether a perfect reduced mirror of the phylogenetic structure of Givnish and colleagues. Pitcairnia as sister of Dyckia is also perfectly congruent with other studies in Pitcarinioideae (Pinangé et al., 2017; Gomes-Da-Silva et al., 2019; Moura et al., 2019), since Fosterella and Deuterocohnia are not sampled in our study. All of the relationships above attained high support (86-100% BS), except the relationship between the two taxa in Tillandsia, which are probably closely related and with low divergence.
Although the Dyckia samples analyzed in this study have not previously been evaluated collectively in other phylogenetic analyses, with the exception of D. rariflora and D. densiflora, which were previously studied together (Pinangé et al., 2017), their restricted distribution in the southern portion of the Espinhaço Range supports the formation of a monophyletic clade of Dyckia, composed of microendemic species from this region. The polytomy observed between Dyckia sp. and the remaining species may be attributed to their geographical distribution along the southern Espinhaço Mountain Range: D. elata and D. rariflora exhibit remnant populations in the Serra do Caraça, about 100 km away from the other species analyzed, which occur throughout the “Sinclinal Moeda” mountains in small, isolated populations of very few individuals, separated by civil infrastructure, roads, and mining areas.
The low molecular variability observed among Dyckia species, even using non-coding regions, may reflect the genus’s recent history of radiative evolution, particularly in its center of origin, as well as the influence of evolutionary strategies such as self-fertilization and introgression, which are common within the genus (Hmeljevski et al., 2011; Hirsch et al., 2020; Pinangé et al., 2020). Our findings highlight the increasing need for genomic studies utilizing nuclear and chloroplast markers, aimed at examining a broader range of samples and elucidating the evolutionary dynamics of Dyckia at the population level, taking into account geographic and reproductive barriers among threatened microendemic species.
Data availability statement
The data presented in this study are publicly available in the NCBI BioProject repository under accession number PRJNA1273098.
Author contributions
JR-A: Conceptualization, Data curation, Formal Analysis, Investigation, Methodology, Project administration, Software, Supervision, Validation, Visualization, Writing – original draft, Writing – review & editing. AF: Data curation, Formal Analysis, Investigation, Methodology, Software, Visualization, Writing – review & editing. CG: Formal Analysis, Methodology, Writing – review & editing. CB: Conceptualization, Formal Analysis, Methodology, Supervision, Validation, Visualization, Writing – original draft, Writing – review & editing. OR: Data curation, Investigation, Writing – review & editing. AM: Project administration, Writing – review & editing. MS: Methodology, Software, Writing – review & editing. AA: Project administration, Resources, Supervision, Writing – review & editing. MZ: Conceptualization, Funding acquisition, Project administration, Resources, Supervision, Validation, Writing – review & editing.
Funding
The author(s) declare that financial support was received for the research and/or publication of this article. This work was supported by the São Paulo Research Foundation (FAPESP, Portuguese: Fundação de Amparo à Pesquisa do Estado de São Paulo) (2023/00765-9).
Acknowledgments
The authors would like to thank Vale S.A for the support.
Conflict of interest
Author AA was employed by company Vale S.A.
The remaining authors declare that the research was conducted in the absence of any commercial or financial relationships that could be construed as a potential conflict of interest.
Generative AI statement
The author(s) declare that no Generative AI was used in the creation of this manuscript.
Publisher’s note
All claims expressed in this article are solely those of the authors and do not necessarily represent those of their affiliated organizations, or those of the publisher, the editors and the reviewers. Any product that may be evaluated in this article, or claim that may be made by its manufacturer, is not guaranteed or endorsed by the publisher.
Supplementary material
The Supplementary Material for this article can be found online at: https://www.frontiersin.org/articles/10.3389/fpls.2025.1549351/full#supplementary-material
References
Abeel, T., Van Parys, T., Saeys, Y., Galagan, J., and Van de Peer, Y. (2012). GenomeView: a next-generation genome browser. Nucleic Acids Res. 40, e12.
Aecyo, P., Marques, A., Huettel, B., Silva, A., Esposito, T., Ribeiro, E., et al. (2021). Plastome evolution in the Caesalpinia group (Leguminosae) and its application in phylogenomics and populations genetics. Planta. 254, 27.
Amar, M. H. (2020). ycf1-ndhF genes, the most promising plastid genomic barcode, sheds light on phylogeny at low taxonomic levels in Prunus persica. J. Genet. Eng. Biotechnol. 18, 42.
Antonelli, A., Nylander, J. A. A., Persson, C., and Sanmartín, I. (2009). Tracing the impact of the Andean uplift on Neotropical plant evolution. Proc. Natl. Acad. Sci. 106, 9749–9754.
Antonelli, A., Verola, C. F., Parisod, C., and Gustafsson, A. L. S. (2010). Climate cooling promoted the expansion and radiation of a threatened group of South American orchids (Epidendroideae: Laeliinae). Biol. J. Linn. Society. 100, 597–607.
Beier, S., Thiel, T., Münch, T., Scholz, U., and Mascher, M. (2017). MISA-web: a web server for microsatellite prediction. Bioinformatics. 33, 2583–2585.
Cauz-Santos, L. A., da Costa, Z. P., Callot, C., Cauet, S., Zucchi, M. I., Bergès, H., et al. (2020). A repertory of rearrangements and the loss of an inverted repeat region in passiflora chloroplast genomes. Genome Biol. Evolution. 12, 1841–1857.
Darling, A. C. E., Mau, B., Blattner, F. R., and Perna, N. T. (2004). Mauve: multiple alignment of conserved genomic sequence with rearrangements. Genome Res. 14, 1394–1403.
Darshetkar, A. M., Datar, M. N., Tamhankar, S., Li, P., and Choudhary, R. K. (2019). Understanding evolution in Poales: Insights from Eriocaulaceae plastome. PloS One 14, e0221423.
Dobrogojski, J., Adamiec, M., and Luciński, R. (2020). The chloroplast genome: a review. Acta Physiol. Plant 42, 98.
Dong, W., Xu, C., Li, C., Sun, J., Zuo, Y., Shi, S., et al. (2015). ycf1, the most promising plastid DNA barcode of land plants. Sci. Rep. 5, 8348.
Drescher, A., Ruf, S., Calsa, T., Jr, Carrer, H., and Bock, R. (2000). The two largest chloroplast genome-encoded open reading frames of higher plants are essential genes. Plant J. 22, 97–104.
Ebert, D. and Peakall, R. (2009). Chloroplast simple sequence repeats (cpSSRs): technical resources and recommendations for expanding cpSSR discovery and applications to a wide array of plant species. Mol. Ecol. Resources. 9, 673–690.
Givnish, T. J., Barfuss, M. H. J., Ee, B. V., Riina, R., Schulte, K., Horres, R., et al. (2014). Adaptive radiation, correlated and contingent evolution, and net species diversification in Bromeliaceae. Mol. Phylogenet. Evolution. 71, 55–78.
Gomes-Da-Silva, J., Santos-Silva, F., and Forzza, R. C. (2019). Does nomenclatural stability justify para/polyphyletic taxa? A phylogenetic classification in the xeric clade Pitcairnioideae (Bromeliaceae). Systematics Biodiversity. 17, 467–490.
Gonçalves-Oliveira, R. C., Wöhrmann, T., Weising, K., Wanderley M das, G. L., and Benko-Iseppon, A. M. (2020). Genetic structure and gene flow among populations of Encholirium magalhaesii, a rocky grassland fields bromeliad. Braz. J. Bot. 43, 283–290.
Greiner, S., Lehwark, P., and Bock, R. (2019). OrganellarGenomeDRAW (OGDRAW) version 1.3.1: expanded toolkit for the graphical visualization of organellar genomes. Nucleic Acids Res. 47, W59–W64.
Guarçoni, E. A. E. (2014). Estudos taxonômicos e de anatomia foliar em espécies de Dyckia Schult. & Schult. f. (Bromeliaceae, Pitcairnioideae). Available online at: http://www.locus.ufv.br/handle/123456789/7590 (Accessed June 6, 2025).
Guarçoni, E., Azevedo, A., and Costa, A. (2017). The restablishment of Dyckia oligantha and D. nana (Bromeliaceae, Pitcairnioideae), belonging to the D. macedoi complex. Phytotaxa. 306, 049–065.
Hirsch, L. D., Zanella, C. M., Aguiar-Melo, C., Costa, L. M. S., and Bered, F. (2020). Interspecific gene flow and an intermediate molecular profile of Dyckia julianae (Bromeliaceae), an endemic species from southern Brazil. Botanical J. Linn. Society. 192, 675–690.
Hmeljevski, K. V., Reis, A., Montagna, T., and dos Reis, M. S. (2011). Genetic diversity, genetic drift and mixed mating system in small subpopulations of Dyckia ibiramensis, a rare endemic bromeliad from Southern Brazil. Conserv. Genet. 12, 761–769.
Jabaily, R. S. and Sytsma, K. J. (2010). Phylogenetics of Puya (Bromeliaceae): Placement, major lineages, and evolution of Chilean species. Am. J. Bot. 97, 337–356.
Jin, J. J., Yu, W. B., Yang, J. B., Song, Y., dePamphilis, C. W., Yi, T. S., et al. (2020). GetOrganelle: a fast and versatile toolkit for accurate de novo assembly of organelle genomes. Genome Biol. 21, 241.
Katoh, K., Misawa, K., Kuma, K., and Miyata, T. (2002). MAFFT: a novel method for rapid multiple sequence alignment based on fast Fourier transform. Nucleic Acids Res. 30, 3059–3066.
Kim, K. J. and Lee, H. L. (2005). Widespread occurrence of small inversions in the chloroplast genomes of land plants. Molecules Cells 19, 104–113.
Knowles, L. L. and Chan, Y. H. (2008). Resolving species phylogenies of recent evolutionary radiations1. mobt. 95, 224–231.
Krapp, F., de Barros Pinangé, D. S., Benko-Iseppon, A. M., Leme, E. M. C., and Weising, K. (2014). Phylogeny and evolution of Dyckia (Bromeliaceae) inferred from chloroplast and nuclear sequences. Plant Syst. Evol. 300, 1591–1614.
Kurtz, S. and Schleiermacher, C. (1999). REPuter: fast computation of maximal repeats in complete genomes. Bioinformatics. 15, 426–427.
Leme, E. M. C. and Kollmann, L. J. C. (2011). New species and a new combination of Brazilian Bromeliaceae. Phytotaxa. 16, 1–36.
Leme, E. M. C., Ribeiro OB de, C., and Miranda, Z. D. J. G. (2012). New species of Dyckia (Bromeliaceae) from Brazil. Phytotaxa. , 67:9–6737.
Li, H., Xie, D. F., Chen, J. P., Zhou, S. D., and He, X. J. (2020). Chloroplast genomic comparison of two sister species Allium macranthum and A. fasciculatum provides valuable insights into adaptive evolution. Genes Genom. 42, 507–517.
Librado, P. and Rozas, J. (2009). DnaSP v5: a software for comprehensive analysis of DNA polymorphism data. Bioinformatics. 25, 1451–1452.
Liu, L., Zhang, Y. Q., Tumi, L., Suni, M. L., Arakaki, M., Burgess, K. S., et al. (2022). Genetic markers in Andean Puya species (Bromeliaceae) with implications on plastome evolution and phylogeny. Ecol. Evolution. 12, e9159.
MaChado, T. M., Loiseau, O., Paris, M., Weigand, A., Versieux, L. M., Stehmann, J. R., et al. (2020). Systematics of Vriesea (Bromeliaceae): phylogenetic relationships based on nuclear gene and partial plastome sequences. Botanical J. Linn. Society. 192, 656–674.
Minh, B. Q., Schmidt, H. A., Chernomor, O., Schrempf, D., Woodhams, M. D., von Haeseler, A., et al. (2020). IQ-TREE 2: new models and efficient methods for phylogenetic inference in the genomic era. Mol. Biol. Evolution. 37, 1530–1534.
Moura, M. N., Santos-Silva, F., Gomes-da-Silva, J., Pereira de Almeida, J. P., and Forzza, R. C. (2019). Between spines and molecules: A total evidence phylogeny of the Brazilian endemic genus encholirium (Pitcairnioideae, bromeliaceae). Systematic Botany. 44, 14–25.
Neubig, K. M., Whitten, W. M., Carlsward, B. S., Blanco, M. A., Endara, L., Williams, N. H., et al. (2009). Phylogenetic utility of ycf1 in orchids: a plastid gene more variable than matK. Plant Syst. Evol. 277, 75–84.
Niu, Z., Xue, Q., Zhu, S., Sun, J., Liu, W., and Ding, X. (2017). The complete plastome sequences of four orchid species: insights into the evolution of the orchidaceae and the utility of plastomic mutational hotspots. Front. Plant Sci. 8. doi: 10.3389/fpls.2017.00715/full
Olejniczak, S. A., Łojewska, E., Kowalczyk, T., and Sakowicz, T. (2016). Chloroplasts: state of research and practical applications of plastome sequencing. Planta. 244, 517–527.
Philippe, H., Brinkmann, H., Lavrov, D. V., Littlewood, D. T. J., Manuel, M., Wörheide, G., et al. (2011). Resolving difficult phylogenetic questions: why more sequences are not enough. PloS Biol. 9, e1000602.
Pinangé, D. S. B., Krapp, F., Zizka, G., Silvestro, D., Leme, E. M. C., Weising, K., et al. (2017). Molecular phylogenetics, historical biogeography and character evolution in Dyckia (Bromeliaceae, Pitcairnioideae). Botanical J. Linn. Society. 183, 39–56.
Pinangé, D. S. B., Louzada, R. B., Wöhrmann, T., Krapp, F., Weising, K., Zizka, G., et al. (2020). Population genetics shed light on species delimitation and life history of the Dyckia pernambucana complex (Bromeliaceae). Botanical J. Linn. Society. 192, 706–725.
Pinheiro, F., Veiga, G. S., Chaves, C. J. N., da Costa Cacossi, T., and da Silva, C. P. (2021). Reproductive barriers and genetic differentiation between continental and island populations of Epidendrum fulgens (Orchidaceae). Plant Syst. Evol. 307, 36.
Poczai, P. and Hyvönen, J. (2017). The complete chloroplast genome sequence of the CAM epiphyte Spanish moss (Tillandsia usneoides, Bromeliaceae) and its comparative analysis. PloS One 12, e0187199.
Ramírez-Morillo, I. M., Espinosa-Barrera, L. A., Granados Mendoza, C., Vera-Paz, S. I., Díaz Contreras Díaz, D. D., and Romero-Soler, K. J. (2023). Expansions and contractions of the inverted repeat, as well as gene loss and potential pseudogenization shape plastome evolution in Hechtioideae (Bromeliaceae, Poales). J. Systematics Evol. 61, 1–17. doi: 10.1111/jse.12873
Redwan, R. M., Saidin, A., and Kumar, S. V. (2015). Complete chloroplast genome sequence of MD-2 pineapple and its comparative analysis among nine other plants from the subclass Commelinidae. BMC Plant Biol. 15, 196.
Ren, T., Xie, D., Peng, C., Gui, L., Price, M., Zhou, S., et al. (2022). Molecular evolution and phylogenetic relationships of Ligusticum (Apiaceae) inferred from the whole plastome sequences. BMC Ecol. Evo. 22, 55.
Rivera-Martínez, R., Ramírez-Morillo, I. M., De-Nova, J. A., Carnevali, G., Pinzón, J. P., Romero-Soler, K. J., et al. (2022). Spatial phylogenetics in Hechtioideae (Bromeliaceae) reveals recent diversification and dispersal. Botanical Sci. 100, 692–709.
Rogstad, S. H. (1992). Saturated naCl-CTAB solution as a means of field preservation of leaves for DNA analyses. Taxon. 41, 701–708.
Silveira, F. A. O., Negreiros, D., Barbosa, N. P. U., Buisson, E., Carmo, F. F., Carstensen, D. W., et al. (2016). Ecology and evolution of plant diversity in the endangered campo rupestre: a neglected conservation priority. Plant Soil. 403, 129–152.
Tillich, M., Lehwark, P., Pellizzer, T., Ulbricht-Jones, E. S., Fischer, A., Bock, R., et al. (2017). GeSeq - versatile and accurate annotation of organelle genomes. Nucleic Acids Res. 45, W6–11.
Vera-Paz, S. I., Díaz Contreras Díaz, D. D., Jost, M., Wanke, S., Rossado, A. J., Hernández-Gutiérrez, R., et al. (2022). New plastome structural rearrangements discovered in core Tillandsioideae (Bromeliaceae) support recently adopted taxonomy. Front. Plant Sci. 13. doi: 10.3389/fpls.2022.924922/full
Versieux, L. M. and Wendt, T. (2006). Checklist of bromeliaceae of minas gerais, Brazil, with notes on taxonomy and endemism. Selbyana. 27, 107–146.
Versieux, L. M. and Wendt, T. (2007). Bromeliaceae diversity and conservation in Minas Gerais state, Brazil. Biodivers Conserv. 16, 2989–3009.
Wang, M., Wang, X., Sun, J., Wang, Y., Ge, Y., Dong, W., et al. (2021). Phylogenomic and evolutionary dynamics of inverted repeats across Angelica plastomes. BMC Plant Biol. 21, 26.
Wheeler, G. L., Dorman, H. E., Buchanan, A., Challagundla, L., and Wallace, L. E. (2014). A review of the prevalence, utility, and caveats of using chloroplast simple sequence repeats for studies of plant biology. Appl. Plant Sci. 2, 1400059.
Wicke, S., Schneeweiss, G. M., dePamphilis, C. W., Müller, K. F., and Quandt, D. (2011). The evolution of the plastid chromosome in land plants: gene content, gene order, gene function. Plant Mol. Biol. 76, 273–297.
Wu, P., Xu, C., Chen, H., Yang, J., Zhang, X., and Zhou, S. (2021). NOVOWrap: An automated solution for plastid genome assembly and structure standardization. Mol. Ecol. Resour. 21, 2177–2186.
Xiong, A. S., Peng, R. H., Zhuang, J., Gao, F., Zhu, B., Fu, X. Y., et al. (2009). Gene duplication, transfer, and evolution in the chloroplast genome. Biotechnol. Advances. 27, 340–347.
Xu, G. and Xu, W. (2021). Complete chloroplast genomes of Chinese wild-growing Vitis species: molecular structures and comparative and adaptive radiation analysis. Protoplasma. 258, 559–571.
Yue, F., Cui, L., dePamphilis, C. W., Moret, B. M., and Tang, J. (2008). Gene rearrangement analysis and ancestral order inference from chloroplast genomes with inverted repeat. BMC Genomics 9, S25.
Keywords: rocky outcrops, plastomes, biodiversity, bromeliads, molecular markers
Citation: Rabelo-Araujo JVDS, Francisconi AF, Garcia CB, Van Den Berg C, Ribeiro OBdC, Marques APdS, Scaketti M, Anastacio ACSA and Zucchi MI (2025) Phylogeny, structural patterns, and polymorphisms in Dyckia spp. from the Espinhaço mountain range based on complete chloroplast genome. Front. Plant Sci. 16:1549351. doi: 10.3389/fpls.2025.1549351
Received: 21 December 2024; Accepted: 30 May 2025;
Published: 19 June 2025.
Edited by:
Maximilian Weigend, University of Bonn, GermanyReviewed by:
André Luís Laforga Vanzela, State University of Londrina, BrazilMagdalena Vaio, Universidad de la República, Uruguay
Copyright © 2025 Rabelo-Araujo, Francisconi, Garcia, Van Den Berg, Ribeiro, Marques, Scaketti, Anastacio and Zucchi. This is an open-access article distributed under the terms of the Creative Commons Attribution License (CC BY). The use, distribution or reproduction in other forums is permitted, provided the original author(s) and the copyright owner(s) are credited and that the original publication in this journal is cited, in accordance with accepted academic practice. No use, distribution or reproduction is permitted which does not comply with these terms.
*Correspondence: João Victor Da Silva Rabelo-Araujo, ajIxOTk1OEBkYWMudW5pY2FtcC5icg==