 Junquan Zhen1,2,3†
 Dong Wang
- 1College of Mechanical and Electronic Engineering, Northwest A&F University, Yangling, China
- 2Key Laboratory of Agricultural Internet of Things, Ministry of Agricultural and Rural Affairs, Yangling, China
- 3Shaanxi Key Laboratory of Agricultural Information Perception and Intelligent Service, Yangling, China
- 4College of Horticulture, Northwest A&F University, Yangling, China
In this study, 6-year-old Xiahui No. 8 peach trees were used to investigate the effects of microclimates on their fruit quality between open-center and Y-shaped tree canopies. The impacts of the two canopy structures on light distribution, temperature, and relative humidity (RH) within the canopy, and their correlation with fruit quality metrics such as weight, hardness, soluble solid content (SSC), and dry matter content (DMC) were analyzed. The open-center-shaped trees had more favorable light distribution, with higher light intensity in the upper canopy layers and a larger light interception area, leading to improved fruit yield and quality compared to Y-shaped trees. The open-center-shaped trees also had higher single fruit weight, percentage of large fruits, SSC, flesh DMC and fruit hardness. However, free acidity showed only a minor difference between the two tree shapes. The study also found significant differences in the fruit coloration across canopy layers, with fruits in the upper layers exhibiting better coloration and higher SSC. Light intensity ranged from 30–90% and was strongly and positively correlated with fruit quality, thereby influencing the fruit size, coloration, and sugar-acid ratio. Overall, the open-center-shaped trees prove to be more conducive to improving fruit quality and yield. Nevertheless, proper management of the tree shapes, branch distribution, and light intensity is essential in optimizing fruit quality and maximizing the economic benefits of peach orchards.
1 Introduction
The canopy microclimate is influenced by the surrounding atmospheric climate and the growth and development of the tree. Hence, a larger crown volume and greater leaf area significantly affect the microclimate (Yang et al., 1998). Since the 1960s, most research on the leaf canopy microclimates has been concentrated abroad (Jackson, 1970; Palmer and Jackson, 1977; Barritt, 1988; Iglesias and Echeverria, 2022). These studies focused on the impacts of canopy structure on the physiological ecology of fruit trees and their economic benefits and differences in microclimates under different canopy shapes and their effects on fruit quality and yield. In China, experimental studies on fruit tree leaf canopy microclimates began in the 1970s. The concept of leaf canopy microclimate was first introduced by Zhang (1989) in their research on the influence of leaf canopy microclimates on grapefruit quality and yield. Since then, extensive studies have been conducted domestically and internationally on the relationships among leaf canopies, light energy, microenvironment assessment, microclimate differences, and the effects of canopies on fruit quality and yield (Dussi et al., 2005; Feng et al., 2014; Niu et al., 2015; Jia et al., 2016).
In recent years, research on leaf canopy microclimates in fruit trees such as peaches, apples, and pears has made significant progress. For instance, light is more uniformly distributed in the central leader shape of peach trees than in their Y-shaped, while its intensity in open-center (or open vase), Y-shaped and main trunk canopies increases from the bottom to the top and from the inside to the outside (He, 2007). In apple trees, the light intensity in the open-center canopy is the highest (Su, 2008; Wang et al., 2011). Additionally, the differences in temperature and humidity in the outer canopy of the Korla fragrant pear are greater than those in the middle (Niu et al., 2015).
Open-center systems capture more light, while Super High-Density systems have higher resource efficiency (Casanova-Gascón et al., 2019). Significant advances have also established the 3D models of fruit tree canopies, light interception, factors affecting photosynthesis, and the photosynthetic characteristics of canopies (Tang et al., 2015; Rojo et al., 2023).
The formation of fruit quality involves a series of physiological and biochemical processes, including carbohydrate metabolism, changes in sugar and acid content (AC), and the formation of dry matter. Studies have shown that the SSC, AC, DMC are key indicators for evaluating fruit quality (He et al., 2023). Biochemical analyses of different peach cultivars by Bassi and Selli (1990). indicated that the composition of sugars and acids is a core factor determining flavor quality. Furthermore, Tsipouridis and Thomidis (2005) confirmed that rootstock type significantly affects the absorption of mineral nutrients in fruits, thereby regulating SSC and AC levels. In addition to intrinsic physiological factors, various pre-harvest factors such as differences in microclimate, tree vigor, and leaf area can impact fruit quality (Minas et al., 2018). The differences in canopy position and microclimate also affect the fruit quality and significantly influence the development process and yield. Factors such as leaf light energy utilization efficiency, source-sink distance, branch positioning, and hormone signaling contribute to the canopy position of peach fruits, and impact their intrinsic quality (Anthony et al., 2021).
Improving fruit quality and yield is a key focus in fruit tree research. While previous studies have explored the relationship between tree shape, light, and fruit quality, there is relatively less research on the relationships among microclimates of different peach tree shapes, branch compositions, and fruit quality, yield, grading, and economic benefits (Li et al., 2013; Feng et al., 2014; Rudell et al., 2017; Serra et al., 2018; Minas et al., 2021). These studies have also revealed that tree shape and canopy structure significantly affect light distribution within the canopy, which in turn influences fruit growth and quality. Additionally, certain branch compositions are found to optimize fruit exposure to light, leading to improved yield and fruit grading. However, there is a lack of comprehensive studies examining the combined effects of canopy microclimates and branch distributions on the overall economic performance of fruit orchards. Therefore, an in-depth study of the microclimates and branch compositions of different tree shapes and canopies can aid in establishing efficient tree shapes, reveal the relationships between canopy microclimates and branch distributions, improve fruit quality and yield, and help in the analysis of cost-benefit ratios.
2 Materials and methods
2.1 Experimental materials
The experiment was conducted at the horticultural experimental garden of Northwest Agriculture and Forestry University in Yangling Demonstration Zone, Shaanxi Province (34°17’50.7”N 108°04’07.6”E). The experimental site consisted of sandy loam with 67.45 mg/kg of nitrogen (N), 140.73 mg/kg of phosphorus (P), 307.00 mg/kg of potassium (K), 20.12 g/kg of organic matter, and pH 7.93 in the 0−20 cm soil layer. The open-center training system facilitates light penetration and ventilation within the central canopy, which helps enhance fruit quality (Szewczuk and Gudarowska, 2012). The Y-shaped training system makes efficient use of vertical space and improves light exposure in the upper canopy (Sobierajski and Blain, 2022). These advantages make the two training systems ideal for studying how tree structure affects canopy microclimate and fruit quality. Therefore, in this study, six-year-old Xiahui No. 8 peach trees were trained using two different systems: the open-center system with a spacing of 3 m × 4 m, and the Y-shaped system with a spacing of 2 m × 4 m. For each training system, 4 trees were selected as experimental subjects. Routine horticultural care (pruning, thinning, irrigation, fertilization, and pest control) was applied to all trees throughout the season. In addition, fruit from both training systems was thinned approximately 30 days after full bloom by leaving about one fruit every 20 cm of shoot.
2.2 Measurement of canopy microclimate
The microclimate probes were vertically installed at the Lower (0.8 m), Middle (1.3 m), and Upper (1.8 m) parts of the open-center and Y-shaped peach canopies from the base of the trunk (Figure 1) and uniformly oriented towards the northeast, with two probes for each main branch at each canopy level. Afterwards, temperature, humidity, and light intensity were automatically recorded every 10 minutes (Liu et al., 2022).
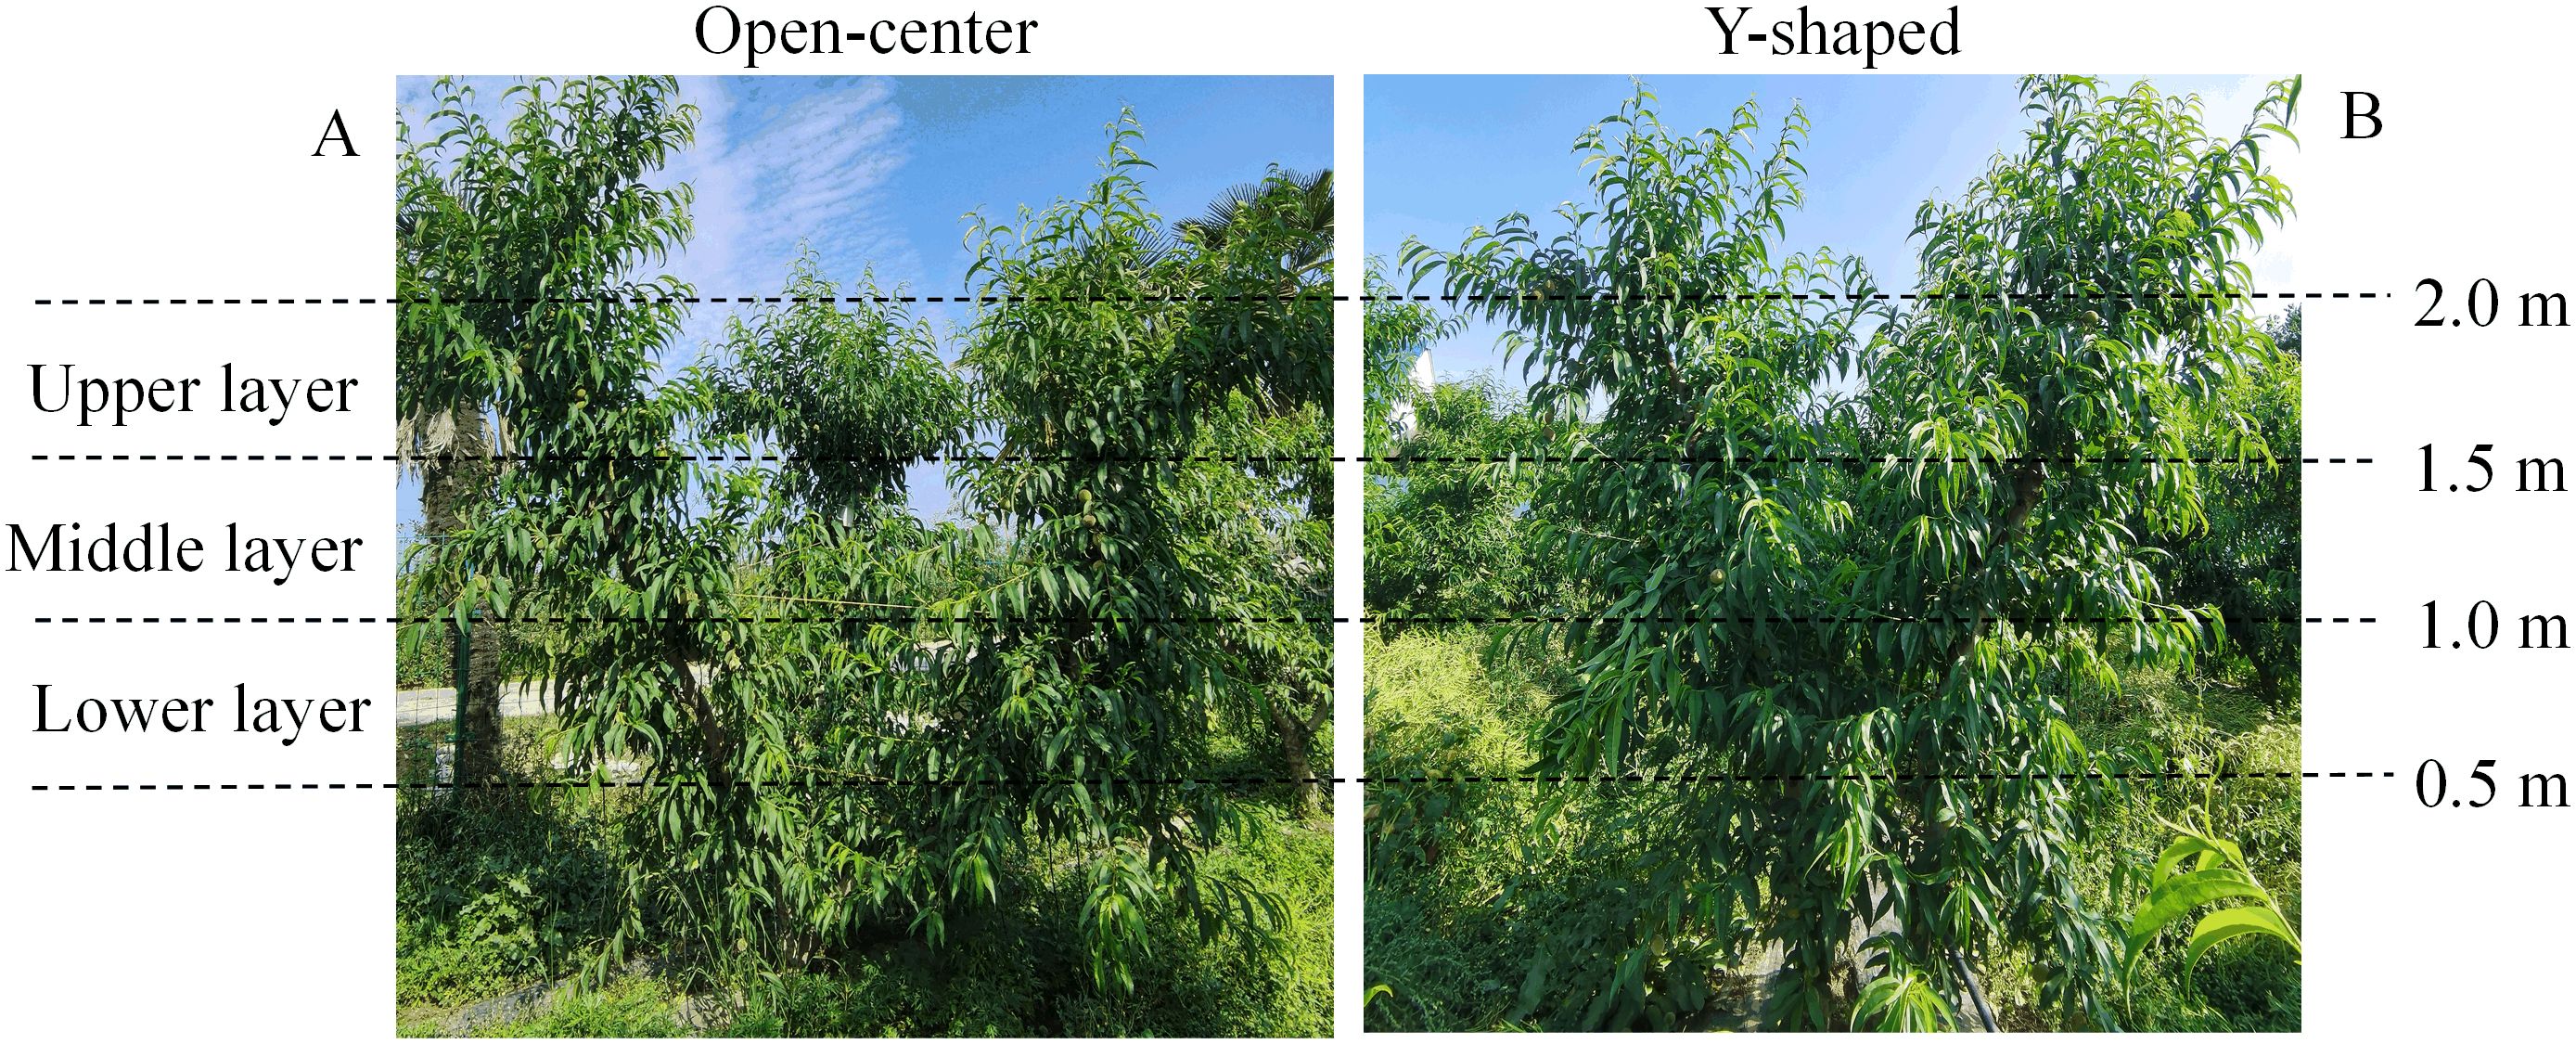
Figure 1. Peach trees with open-center (A) and Y-shaped (B) canopy layers.
2.3 Measurement of leaf area, chlorophyll, and dry matter content
Fifteen leaves from each of the three layers of each main branch were collected and their leaf area was measured using a leaf area meter (LI-3100C, LI-COR, Lincoln, NB, USA). The leaves were then punched into small discs using a hole punch and 0.1 g was mixed with 10 ml of 80% acetone (v/v) prepared with acetone and distilled water in a ratio of 4:1 in 10 ml centrifuge tubes. The preparation for each treatment was carried out in triplicates. The reaction mixtures were kept in the dark for 24 hours and occasionally shaken to ensure complete extraction and then used to measure chlorophyll a (Ca) and chlorophyll b (Cb) contents. A microplate was prepared, and 150μl of the extract was added to each well. The absorbance at 663 and 645 nm was measured using a microplate reader (Model-3550, Bio-Rad, Hercules, CA, USA). The formulas: Ca = 12.7A663 - 2.69A645 and Cb= 22.9A645 - 4.68A663 were used to calculate Ca and Cb contents (Porra, 2002; Chen et al., 2003), where A663 and A645 represent absorbance at 663 and 645 nm, respectively.
To measure the dry matter content (DMC), the above-remaining leaves were quickly chopped, mixed and then ground in a High-speed Tissue Homogenizer (TISSUELYSER-24L, Jingxin, Shanghai, China) for 1−2 minutes. A 2−5 g sample was weighed and dried in a dried centrifuge tube at 70°C for 4 hours. The weight of the samples was then recorded to an accuracy of 0.0002 g. The sample was further dried for 1 hour, and the weight was recorded again until the difference between the two weights was no more than 0.001 g to indicate a constant weight. The DMC of the leaves was calculated using the formula: DMC (%) = [(M2 - M0)/(M1 - M0)] * 100%, where M0 is the weight of the empty dried centrifuge tube, M1 is the weight of the dried centrifuge tube plus the sample, and M2 is the weight of the dried centrifuge tube plus the sample at constant weight (Shipley and Vu, 2002).
2.4 Measurement of daily photosynthetic variation and photosynthetically active radiation
To assess the daily photosynthetic variation, the net photosynthetic rate (Pn), transpiration rate (E), intercellular carbon dioxide concentration (Ci), and stomatal conductance (Gs) of leaves were measured at 8:00, 10:00, 12:00, 14:00, 16:00, 18:00, and 20:00 hours at 1.8, 1.3 and 0.8 m of the trunk. To evaluate the light distribution at different canopy levels and understand how light availability influences the photosynthetic capacity of leaves, the PAR at the upper, middle and lower canopy layers was determined by measuring light intensity using an integrated light meter (TA8121, Tasi, Suzhou, China) at heights of 1.8, 1.3 and 0.8 m. The PAR was then calculated using the formula, PAR = light intensity * 0.0185, where 1 Lux = 0.0185 μmol·m-²·s-¹ for sunlight (Thimijan and Heins, 1983; Ge et al., 2023).
2.5 The branch composition analysis
Branches on peach trees were measured using a 1.0 m ruler. The branches were then categorized as bouquet fruiting branches with height ≤5 cm, short fruiting branches with heights ranging from 5 to < 15 cm, medium fruiting branches with heights between 15 and 30 cm, long fruiting branches between 30 and 60 cm, and excessive growth fruiting branches measuring more than 60 cm. The number of each branch type was counted at different canopy levels, including the upper layer located between 1.5 and 2 m, the middle layer at 1−1.5 m, and the lower layer found from 0.5−1 m.
2.6 Fruit quality analysis
Once the fruits reached commercial maturity (with firmness ranging from 40N to 60N), they were harvested simultaneously from different canopy levels. All fruits were carefully labeled for subsequent analysis. 15 fruits were randomly selected from each canopy level for quality assessment. Each fruit was weighed individually using a high-precision balance to determine its single fruit weight. A fruit hardness tester (GY-4 with a 7.9 mm probe, Top, Zhejiang, China) was used to measure fruit hardness, which provided reliable readings for fruit firmness. The skin color of the fruits was assessed using a colorimeter (CR-400, Konica Minolta, Tokyo, Japan), which provided L, a, and b color values, offering insights into the ripeness and visual appeal of the fruit. The soluble solids content (SSC), an important indicator of fruit sweetness, was measured using a refractometer (PR-101α, Atago, Tokyo, Japan), following standard protocols for refractive index measurement, while the AC, was quantified using an acidity tester (PAL-BXIACID5, Atago, Tokyo, Japan). This device accurately measures the total AC in the fruit’s juice, indicating its tartness. The DMC of the fruit flesh was determined as described in Section 2.3, by ensuring consistency and accuracy across all measurements. This measurement gives an indication of the fruit’s solid content and texture, which is important in determining its quality. We also, estimated the fruit yield at 10 CNY/kg, and used the value for a cost-benefit analysis to assess the economic output of different tree shapes in the study.
2.7 Fruit grading standards
The fruit grading standards were based on the Jiangsu Province Xiahui No. 8 peach grading standard DB32/T 2594-2013 (Zhang et al., 2023a), where fruits weighing ≥250.0 were indicated as premium, ≥220.0 g as primary, ≥180.0 g as secondary and <180.0 g as substandard.
2.8 Data analysis
Raw data were organized, processed, and visualized using Microsoft Excel 2021 and Origin 2019. The spatial distribution maps were created using MATLAB 2019a. One-way analysis of variance and linear regression analysis were conducted with SPSS 2021, at a significance level of α = 0.05.
3 Results
3.1 Differences in microclimate and spatial distribution in different open-center and Y-shaped canopies
3.1.1 The differences in the microclimate
Generally, the light intensity (Figure 2A) and air temperature (Figure 2B) in the Open-center canopy were slightly higher than those in the Y-shaped canopy across the Upper, Middle, and Lower layers from July 6 to August 6. Both training systems exhibited a consistent vertical distribution pattern, with light intensity and temperature decreasing from the Upper to the Lower layers (Upper > Middle > Lower). In contrast, air humidity showed the opposite trend (Figure 2C), with the Y-shaped canopy maintaining higher humidity across all layers. Additionally, humidity increased progressively from the Upper to the Lower layers in both canopy structures (Upper < Middle < Lower). Both training systems received the highest PAR in the Upper layers and the lowest in the Lower layers, with the Lower-layer PAR of the Y-shaped canopy significantly lower than that of the Open-center canopy (Figure 2D).
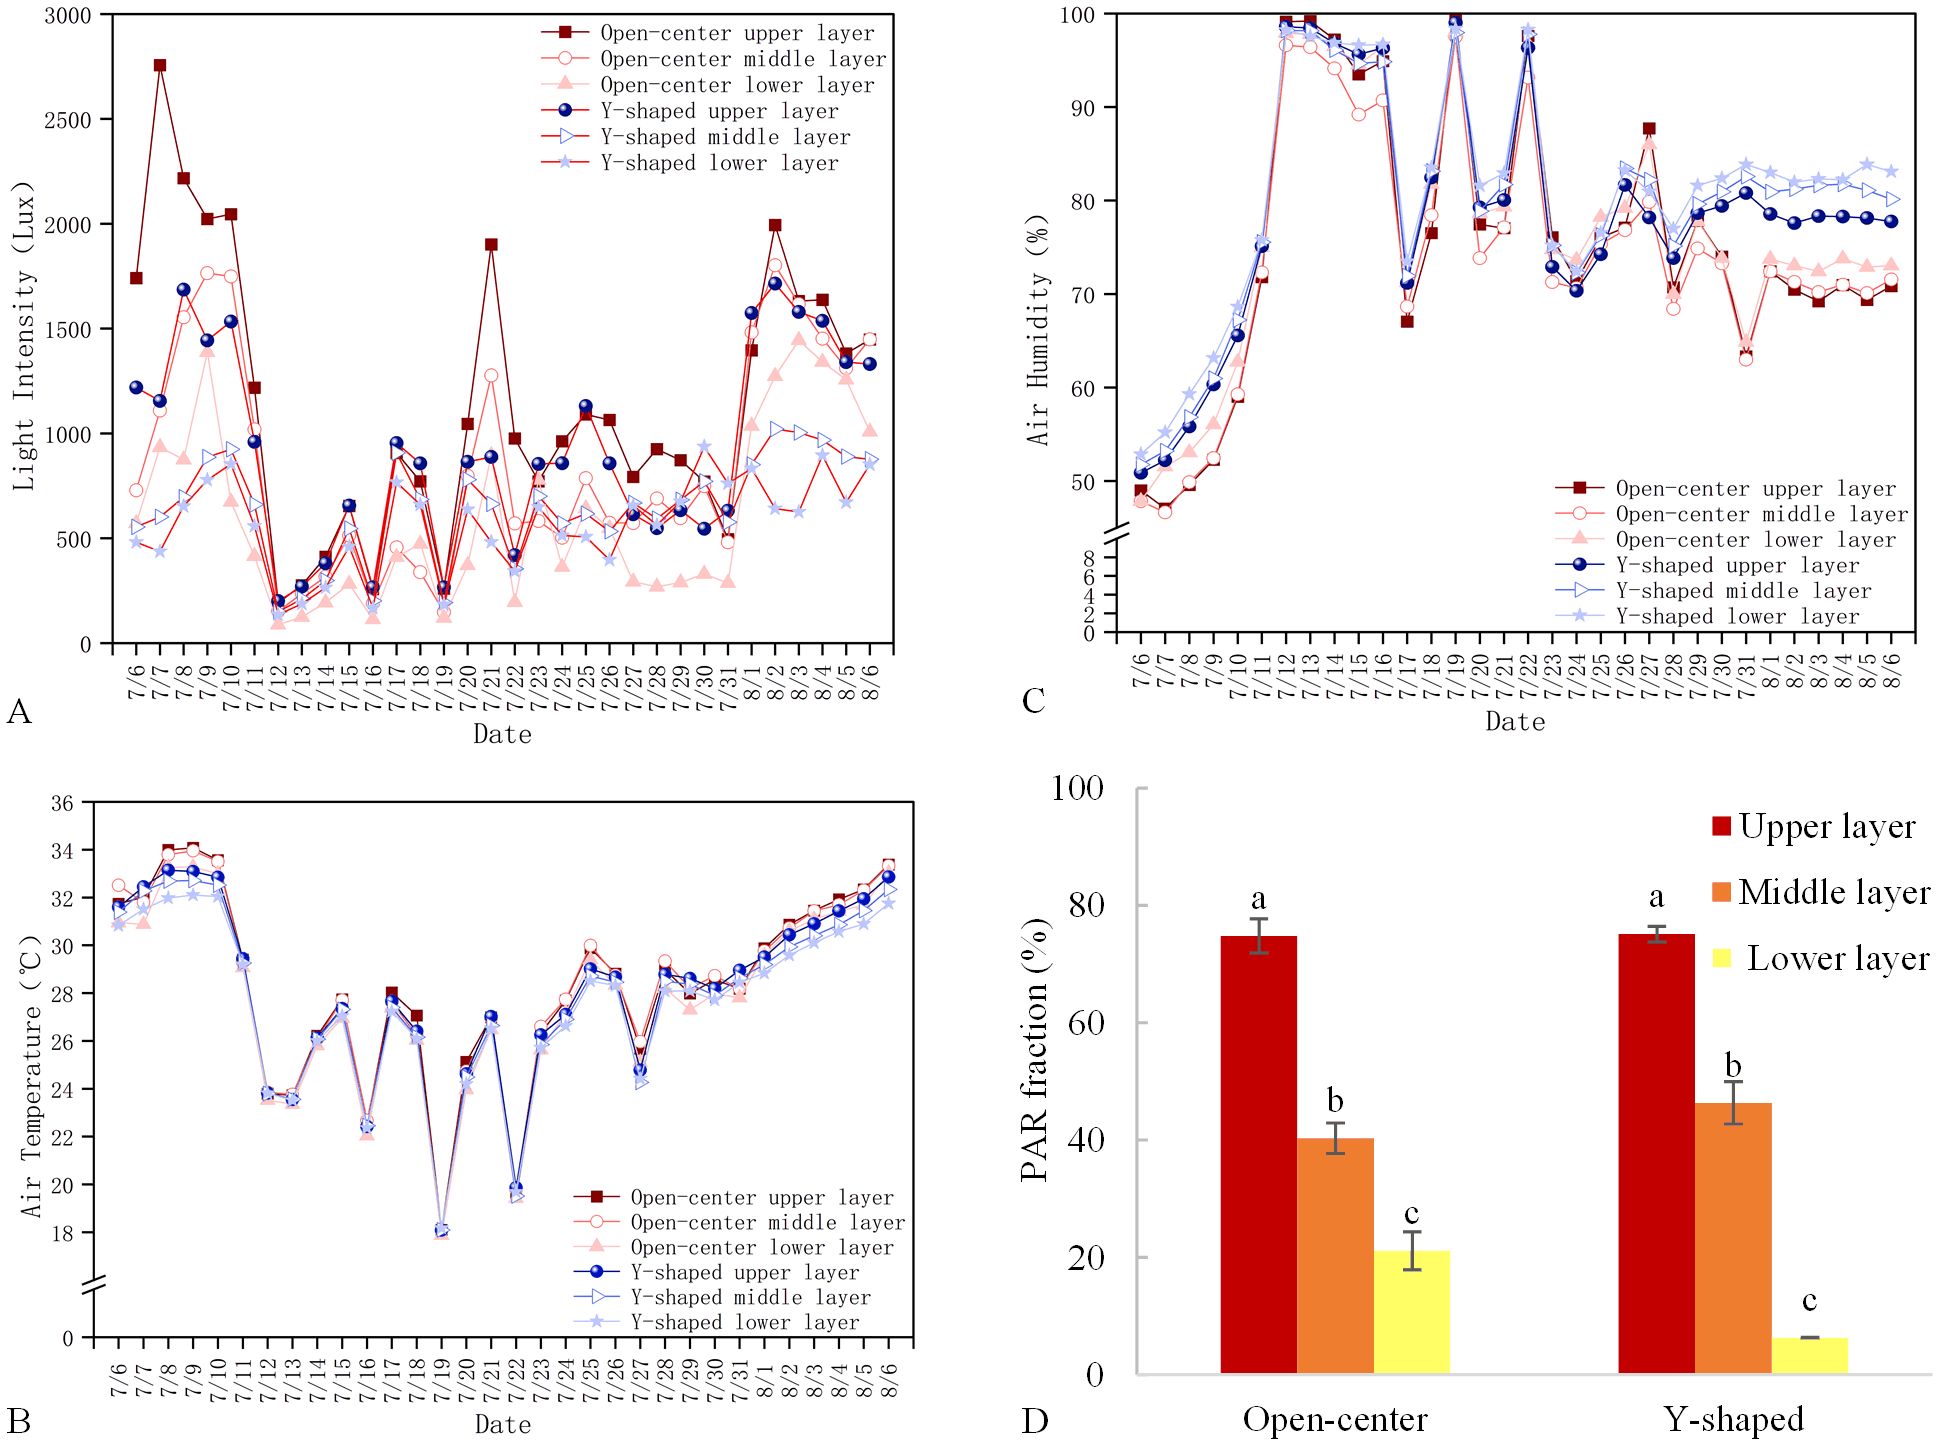
Figure 2. Microclimate changes from July 6 to August 6 in open-center and Y-shaped canopies: (A) Light intensity; (B) Air temperature; (C) Air humidity; (D) PAR proportion.
3.1.2 Spatial distribution of microclimate
A lateral comparison of temperatures in the open-center (Figure 3A) and Y-shaped (Figure 3B) found lower temperatures closer to the trunk. Vertically, the temperature in the canopy progressively decreased from top to bottom, with little variation in the same canopy layer. In the open-center trees, the average temperature ranged from 29.20 to 29.76°C in the upper layer, 28.92 to 29.31°C in the middle layer, and from 28.64 to 28.94°C in the lower layer. In the Y-shaped trees, the average temperature ranged from 27.39 to 29.52°C in the upper layer, 26.99 to 29.26°C in the middle layer and from 26.91 to 29.19°C in the lower layer. Therefore, the temperature distribution in the open-center canopy was more uniform and stratified than in the Y-shaped canopy. Laterally, higher relative humidity (RH) was found closer to the trunk (Figures 3C, D), while vertically, the RH in the canopy progressively increased from the top to bottom, with little variation within the same layer. The average RH in the upper layer of the open-center trees ranged from 67.03 to 67.91%, 69.53 to 69.67% in the middle layer, and from 70.15 to 71.53% in the lower layer. In the upper layer of the Y-shaped canopy, the average RH ranged from 68.49−73.33%, 70.43−78.84% in the middle layer, and from 72.31−80.19% in the lower layer. The RH in the open-center canopy was also uniformly distributed and more stratified than those in the Y-shaped canopy. A lateral comparison of relative light intensity between open-center and Y-shaped canopies revealed lower relative light intensity closer to the trunk. Vertically, the relative light intensity in the canopy decreased from top to bottom, with little variation within the same canopy layer. In the open-center canopy, the average relative light intensity in the upper layer ranged from 66.80 to 95.06%, in the middle layer from 40.63 to 62.43%, and in the lower layer from 25.90 to 38.46%. In the Y-shaped canopy, the average relative light intensity in the upper layer ranged from 56.30 to 93.64%, in the middle layer from 17.49 to 41.20%, and in the lower layer from 20.61 to 38.92% (Figures 3E, F).
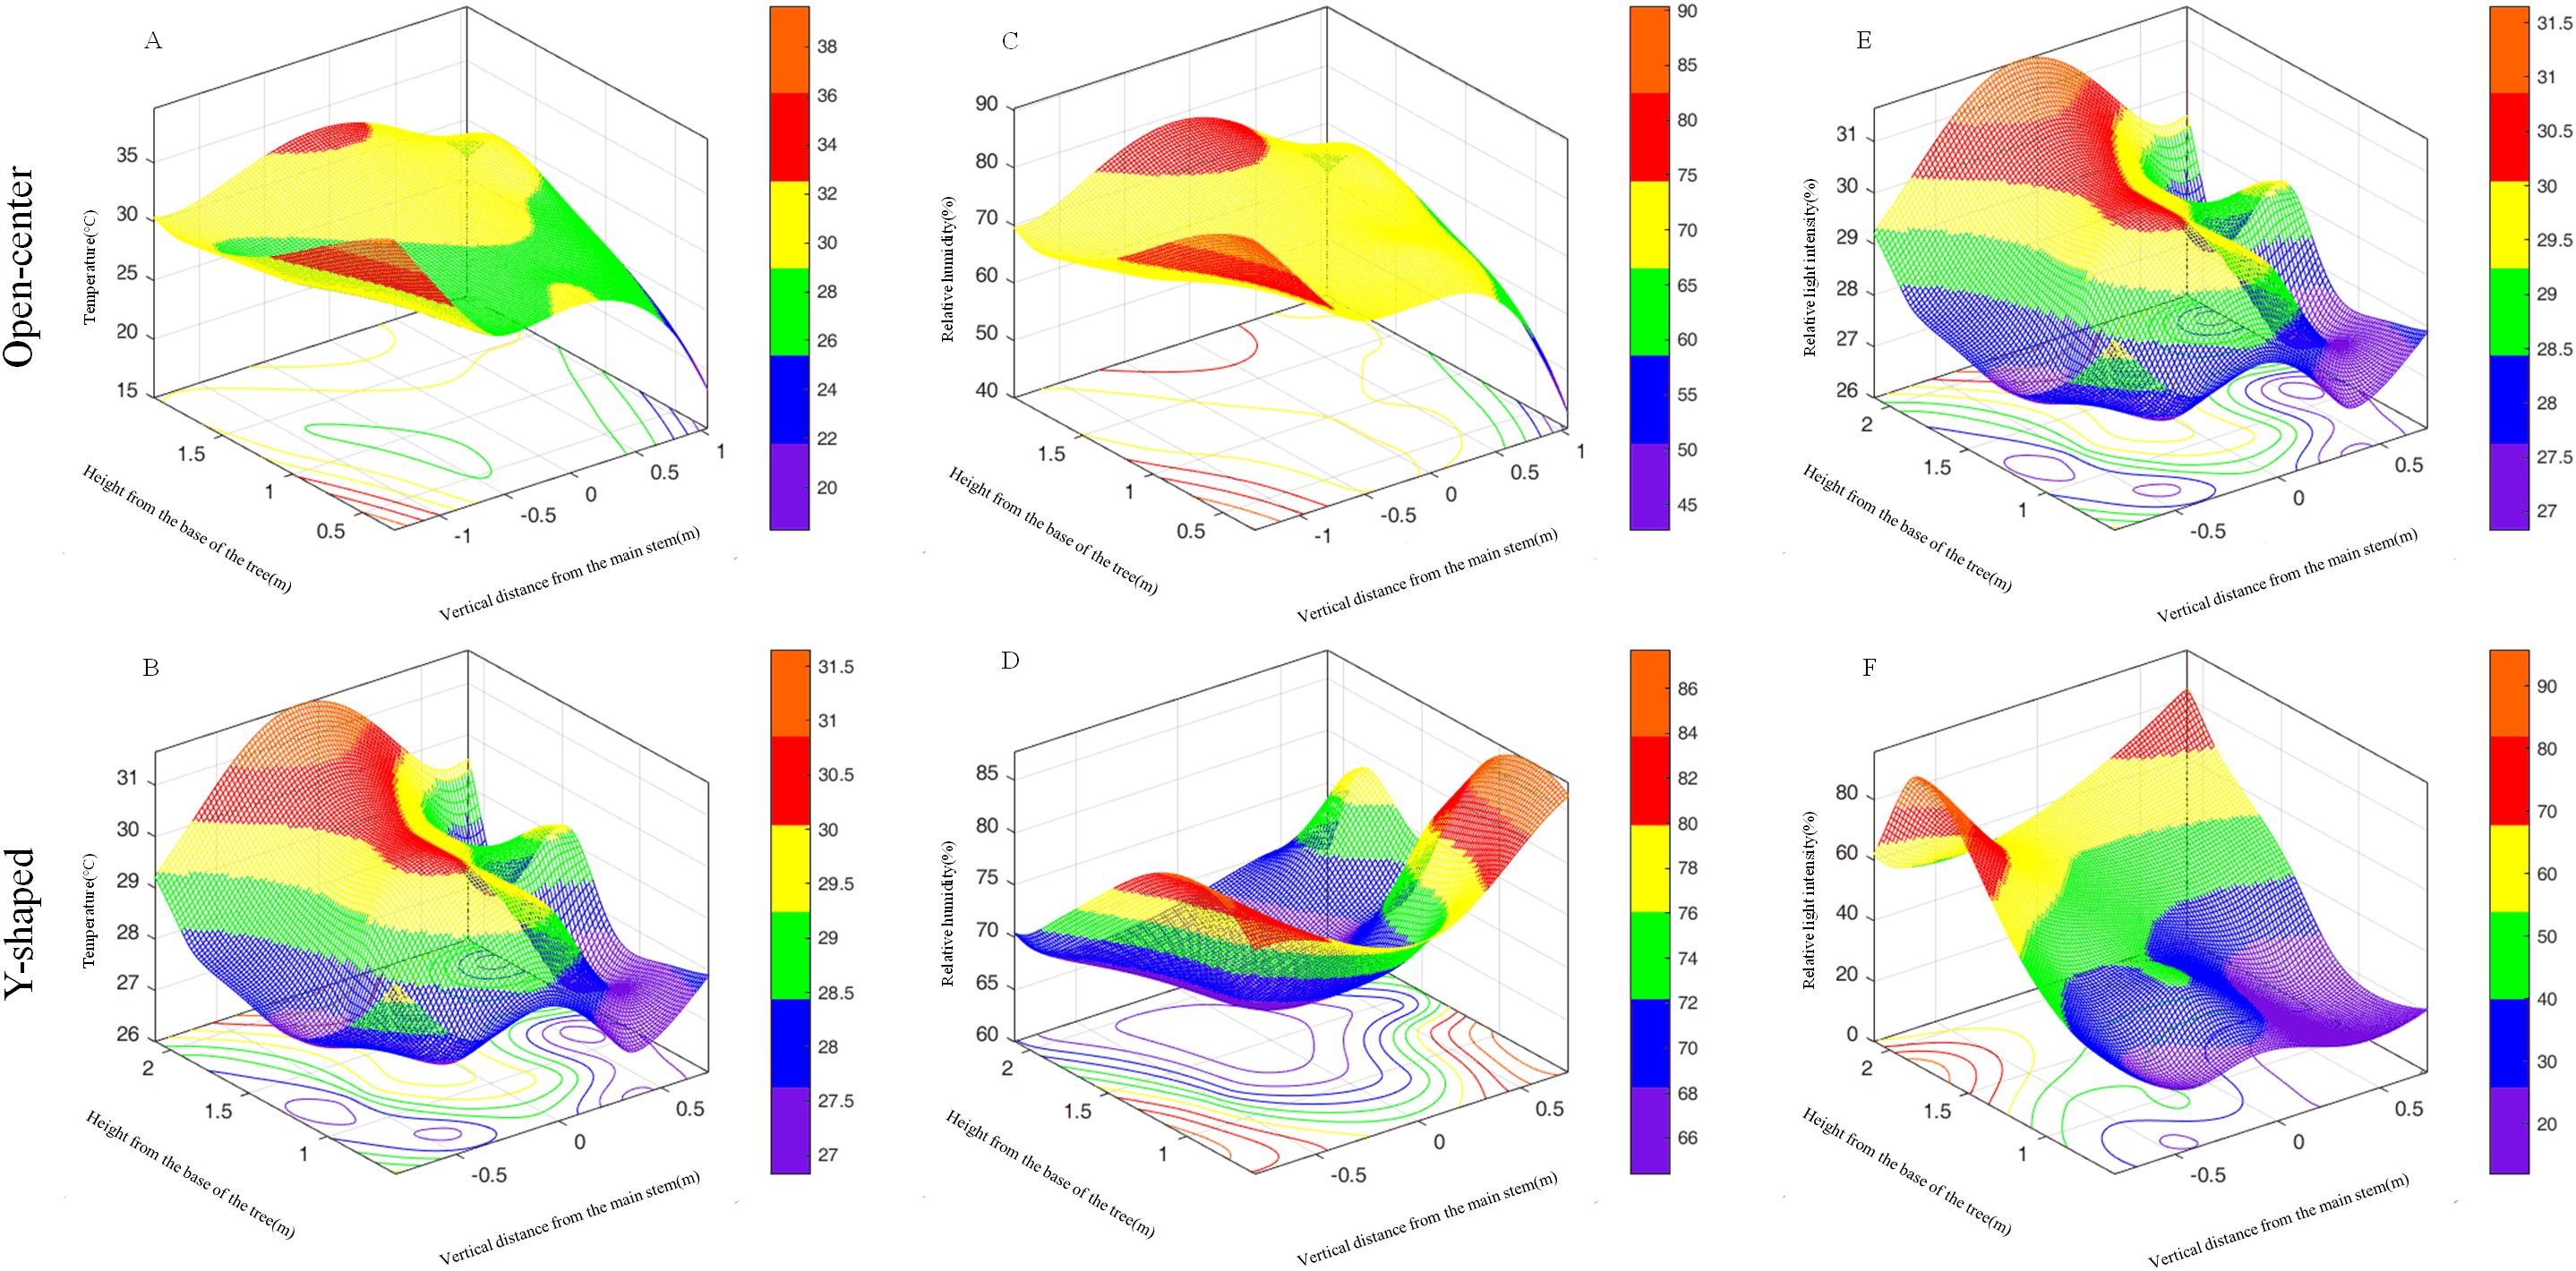
Figure 3. Spatial distribution changes of microclimate factors in open-center and Y-shaped canopies: (A, B: Temperature; C, D: Relative humidity; E, F: Relative light intensity).
3.1.3 The differences in branch composition and spatial distribution
The quantity of each branch type in the open-center tree was generally and significantly higher than those in the Y-shaped, with the open-center peach tree having 156 branches, while the Y-shaped had only 75 branches (Table 1), with more fruit branches generally found in the lower canopy. The study also showed that the distribution of fruit branches in the canopy of the open-center peach tree is relatively uniform, with the highest number of short and medium fruit branches found in the lower and middle layers, respectively, while fewer branches copied the upper layers. The Y-shaped had more fruit branches in the upper layer and fewer in the lower layer, with the most medium branches found in the middle layer and the longest branches in both the upper and lower layers.
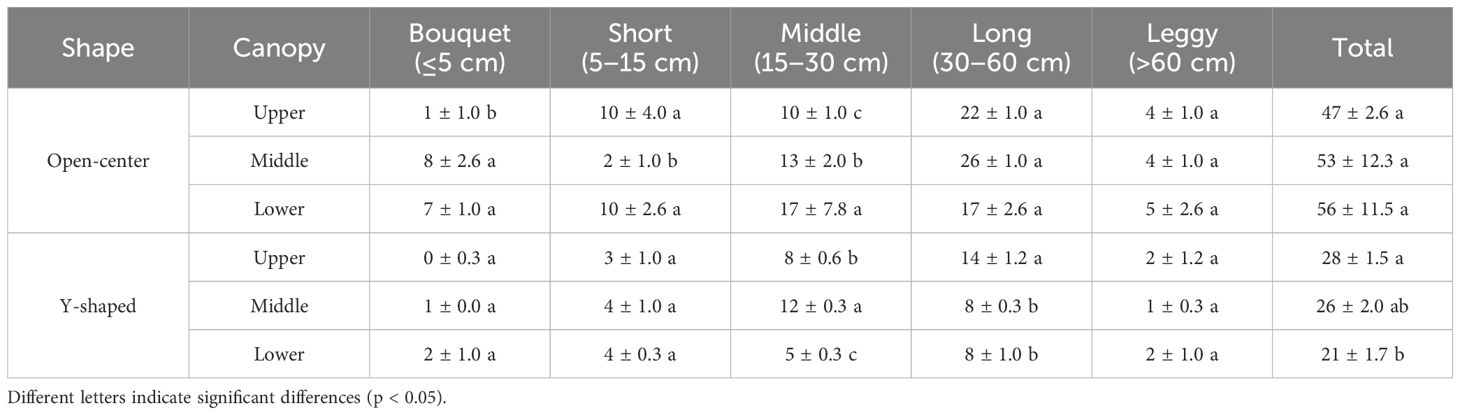
Table 1. Distribution of branches in different open-center and Y-shaped canopies.
3.2 Differences of leaf mass and photosynthetic characteristics in different open-center and Y-shaped canopies
3.2.1 Differences in leaf area and chlorophyll content
The leaf area between the open-center and Y-shaped tree canopies did not differ significantly but generally increased from the lower to middle and upper layers in each tree shape. The leaf area of the middle and upper canopy layers was significantly larger than that of the lower canopy layer (Figure 4A). The Y-shaped canopy showed a more pronounced variation in chlorophyll content. Therefore, the Ca and Cb contents in the upper canopy were significantly higher than those found in the middle layer. However, the Ca content insignificantly differed between the middle and lower layers, while the Cb content in the middle layer was significantly higher than those in the lower layer (Figure 4B). In the open center, there was no significant difference in chlorophyll content among the canopy layers (Figure 4C).
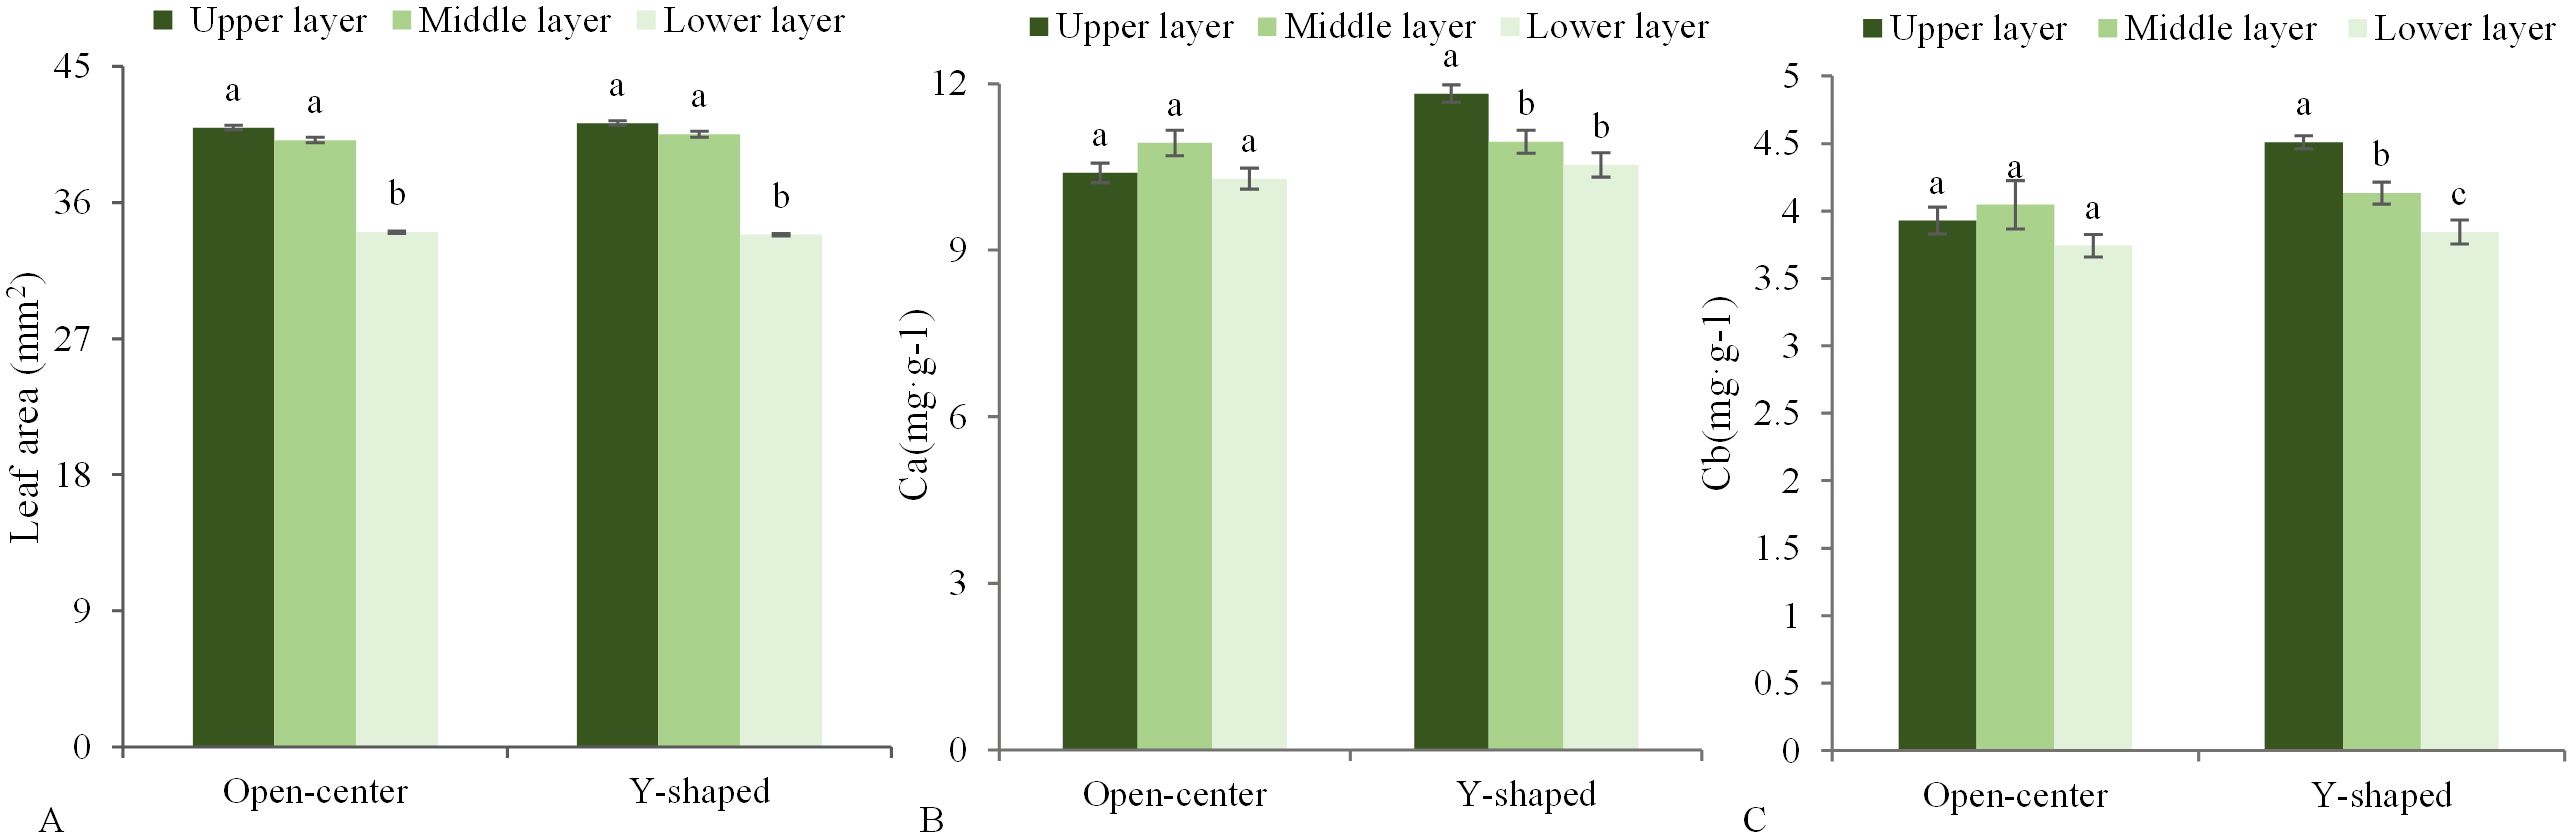
Figure 4. Difference in leaf area (A), Ca (B), and Cb (C) in different open-center and Y-shaped canopies. Different letters indicate significant differences (p < 0.05).
3.2.2 Differences in photosynthetic characteristics
The results indicated a consistent trend in the daily Pn changes for both tree shapes, with more Pn in the upper layer followed by those in the middle and lower layers (Figure 5). The Pn increased from 9:00 to 11:00 AM and then from 1:00 to 3:00 PM, with the highest day value at 11:00 AM. However, it decreased from 11:00 AM to 1:00 PM, and from 3:00 to 5:00 PM, with the lowest Pn value at 1:00 PM for both tree shapes, except for the lower layer of the open-center. The Ci, E, and Gs trends in both tree shapes were consistent with the Pn trends, except for the upper layer of the open center, where Ci continuously decreased from 9:00 AM to 5:00 PM, with the lowest values at 1:00 PM (Figure 5). However, as the temperature increased from 11:00 AM to 1:00 PM, the peach leaves entered a midday photosynthetic depression, causing their stomata to gradually close, thereby decreasing the Gs, E, Ci and Pn. Between 1:00 and 3:00 PM, the leaves recovered from the midday photosynthetic depression, and gradually regained their photosynthetic capacity. The most significant changes before and after the midday depression, from 11:00 AM to 3:00 PM, occurred in the upper layer of the Y-shaped, where Ci, E, and Gs dropped to levels below those of the lower layer. In contrast, the open center showed relatively stable performance (Figure 5).
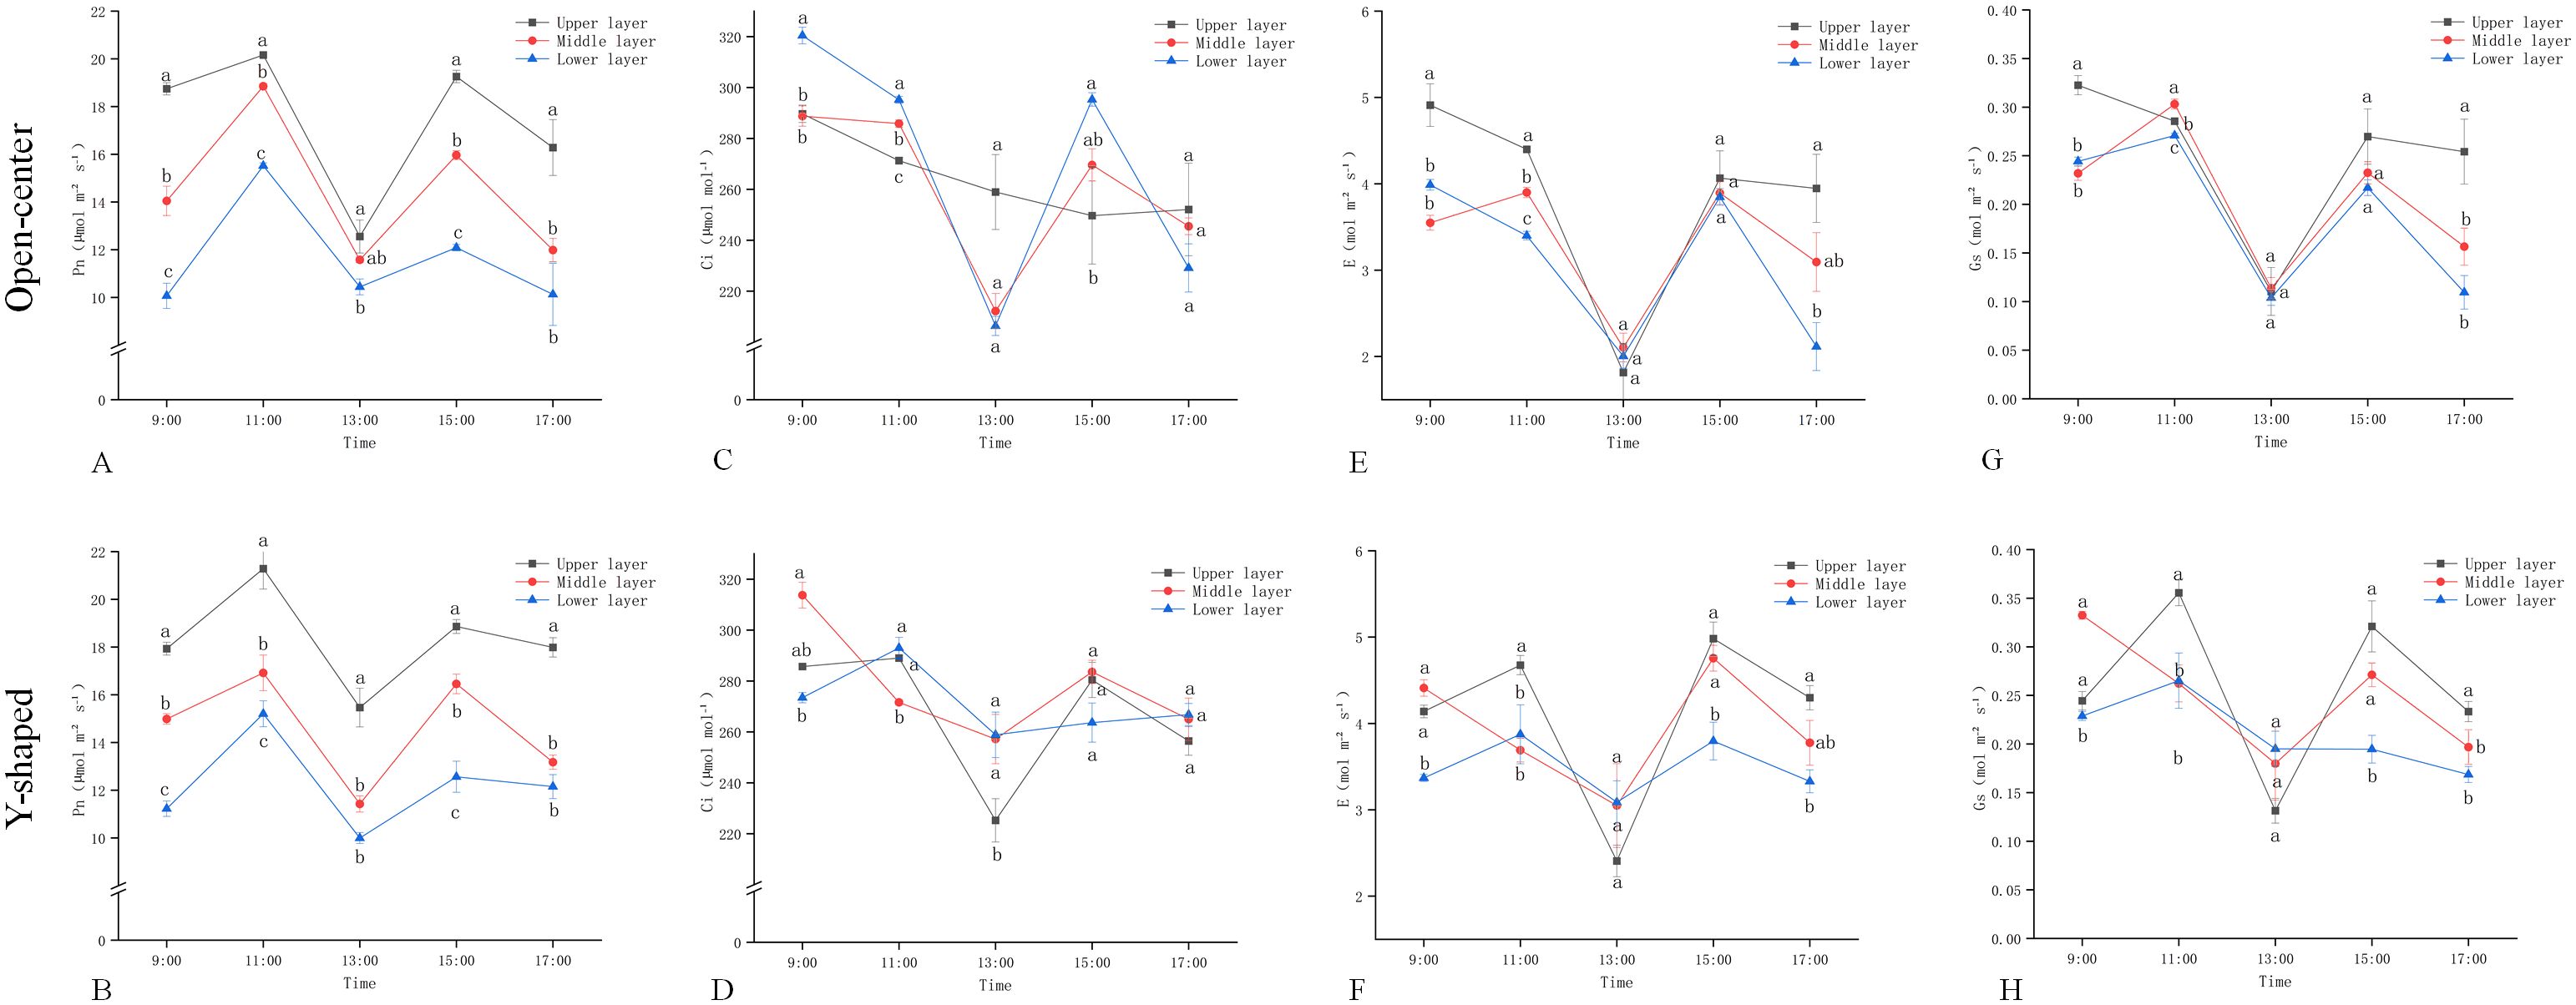
Figure 5. Diurnal variation of photosynthetic parameters of leaves in different open-center and Y-shaped canopies: (A, B: Pn; C, D: Ci; E, F: E; G, H: Gs).
3.3 Differences in peach fruit quality in different open-center and Y-shaped canopies
3.3.1 Differences in fruit grading
Most of the fruits found in the open-center and Y-shaped trees were substandard, followed by secondary, primary and premium fruits. The upper part of the canopy had the fewest substandard fruits, while the lower layer had the most. Premium and primary fruits were mainly distributed in the middle and upper parts of the canopy, with almost none in the lower part. On the other hand, the secondary, primary, and premium fruits were more uniformly distributed in the open center than in the Y-shaped. However, the proportion of substandard fruits in the Y-shaped was higher, with the fruits formed in the open center generally larger than those in the Y-shaped trees (Figure 6).
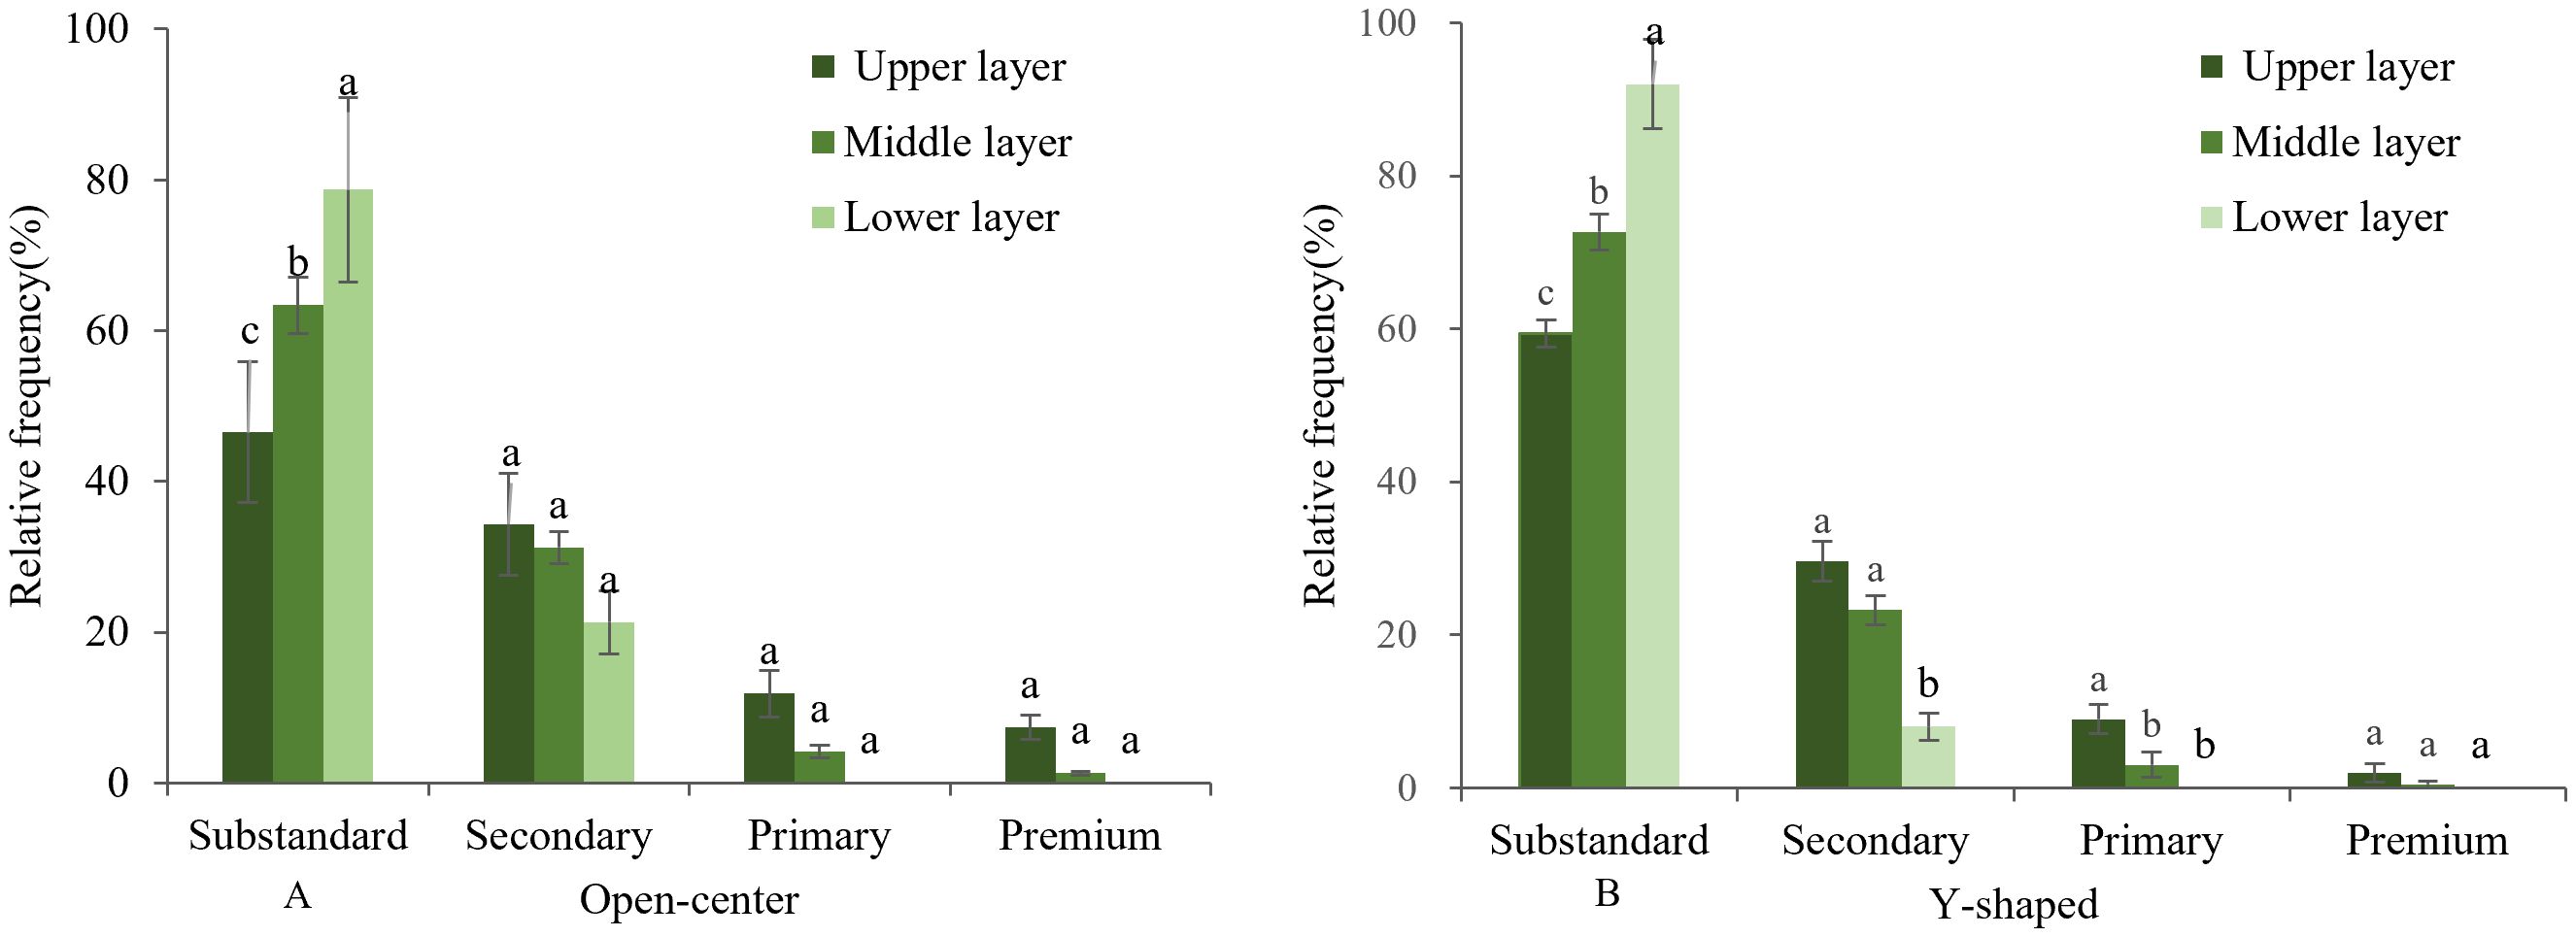
Figure 6. Fruit grading of peaches of open-center (A) and Y-shaped (B) canopies.
3.3.2 Differences in fruit weight and hardness
As the peach fruit ripened, fruit weight and hardness differed between the open-center and Y-shaped trees across different leaf curtain layers (Table 2). The hardness of the fruits was lowest for both tree shapes at the upper parts of the canopy layers and higher in the lower and middle layers, with those in the Y-shaped harder than those in the open center. Fruits from both tree shapes showed the heaviest fruit weight at the upper parts of the canopy, with the lightest fruits located at the lower parts. Though there were insignificant differences in the fruit outputs and incomes between the different canopy layers of the two tree shapes, the higher yields in the open-center likely caused slightly higher profits than those in the Y-shaped peaches. Therefore, in peach production, it is important to promote the formation of high-quality fruits while ensuring yield to achieve better profits.
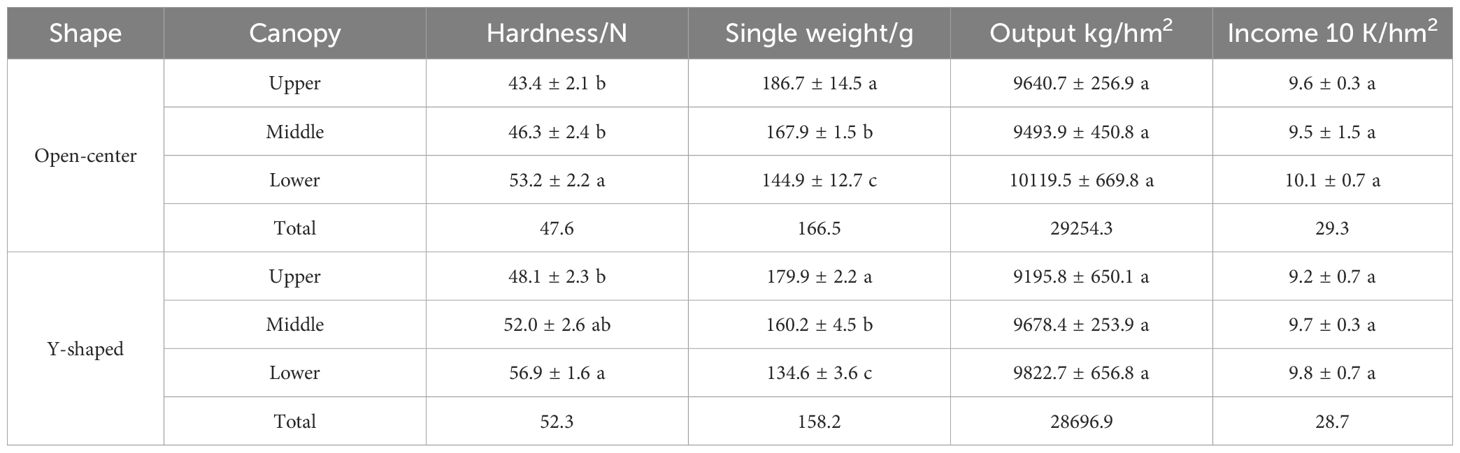
Table 2. Output and income of peaches in different open-center and Y-shaped canopies.
3.3.3 Differences in skin color
Both the open-center and Y-shaped trees had brighter and redder skin on the upper layer with a significantly lower comprehensive color index value (h*) than those on the lower layer, making the colors of the upper layer fruits more vivid and bright. Generally, the skin color of the open-center fruits was brighter, redder, vibrant and saturated than those found in the Y-shaped (Table 3).
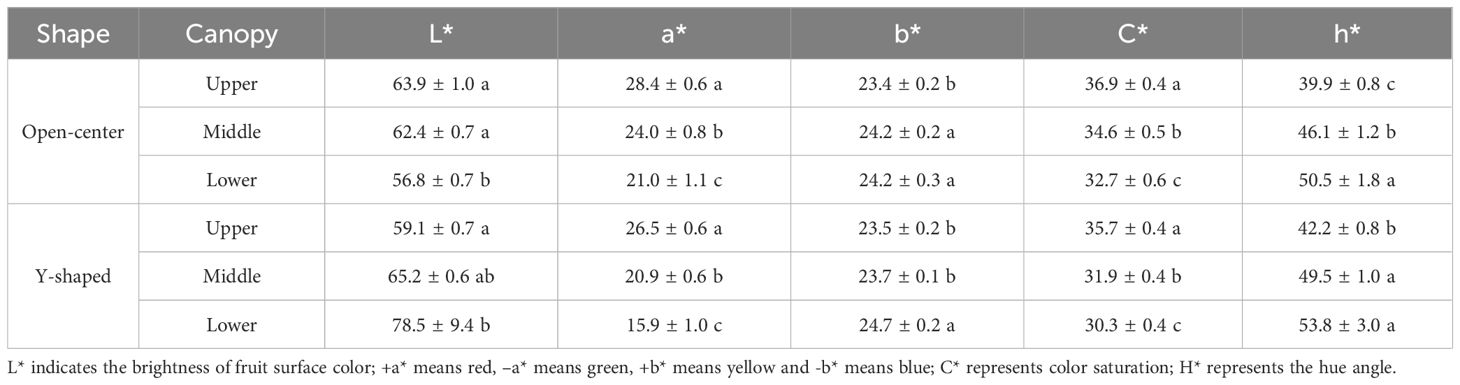
Table 3. Color change of peach peel in different Open-center and Y-shaped canopies.
3.3.4 Differences in soluble solids, acid and flesh DMC
During the ripening period, Xiahui 8 peaches from both tree shapes exhibited the highest levels of SSC and flesh DMC in the upper canopy, with the lowest levels in the lower canopy. However, AC was insignificantly different across the different canopy layers (Figure 7) but was slightly higher in Y-shaped fruits than in open-center fruits, with both tree shapes showing the lowest acid levels in the middle parts of the tree.
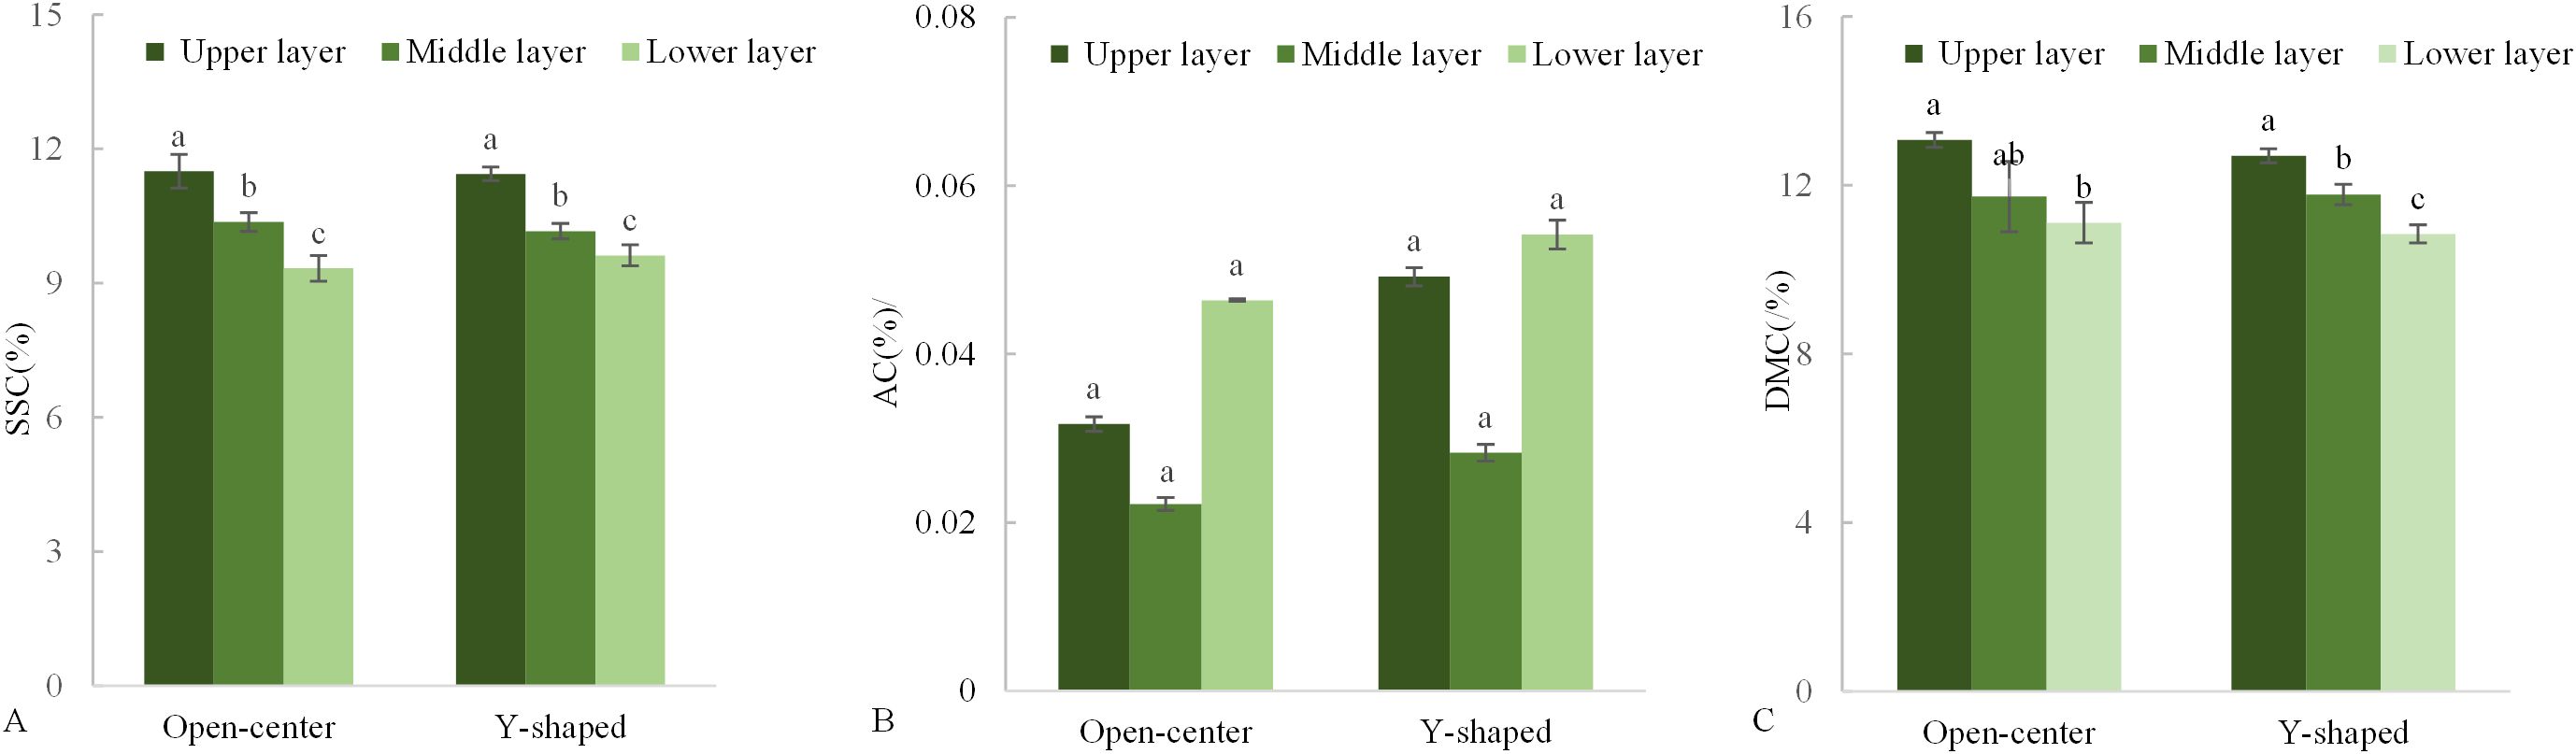
Figure 7. Changes in soluble solid content (A), acid content (B) and dry matter content (C) in different open-center and Y-shaped canopies.
3.4 Correlation between microclimates and fruit quality in open-center and Y-shaped canopies
The individual fruit weight and SSC were significantly and positively correlated with light intensity in both open-center and Y-shaped trees (Table 4). In the open-center fruits, the fruit hardness and AC significantly and negatively correlated with light intensity, while humidity was significantly and positively correlated with fruit hardness but significantly and negatively correlated with SSC. The DMC insignificantly correlated with temperature, humidity, and light intensity in the open-center fruits. In Y-shaped fruits, light intensity was significantly and positively correlated with DMC but significantly and negatively correlated with fruit hardness and AC. Humidity showed only a significant and negative correlation with DMC, while temperature had an insignificant correlation with all the fruit qualities in Y-shaped fruits.
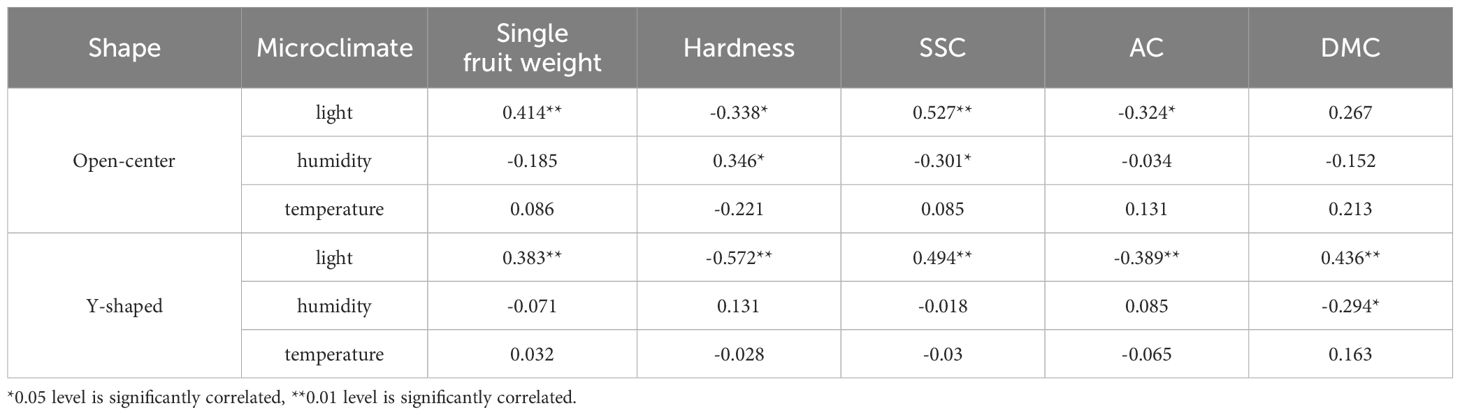
Table 4. Correlation between microclimate and fruit quality.
Based on the correlation analysis results, further regression analysis was conducted on light intensity and fruit quality. The regression equations for single fruit weight, hardness, SSC, and AC with light intensity all reached significant levels, indicating that the established equations are reliable. The calculated values indicate that optimal relative light intensity values for improving the fruit quality of open-center canopies are higher than those for Y-shaped canopies (Table 5).
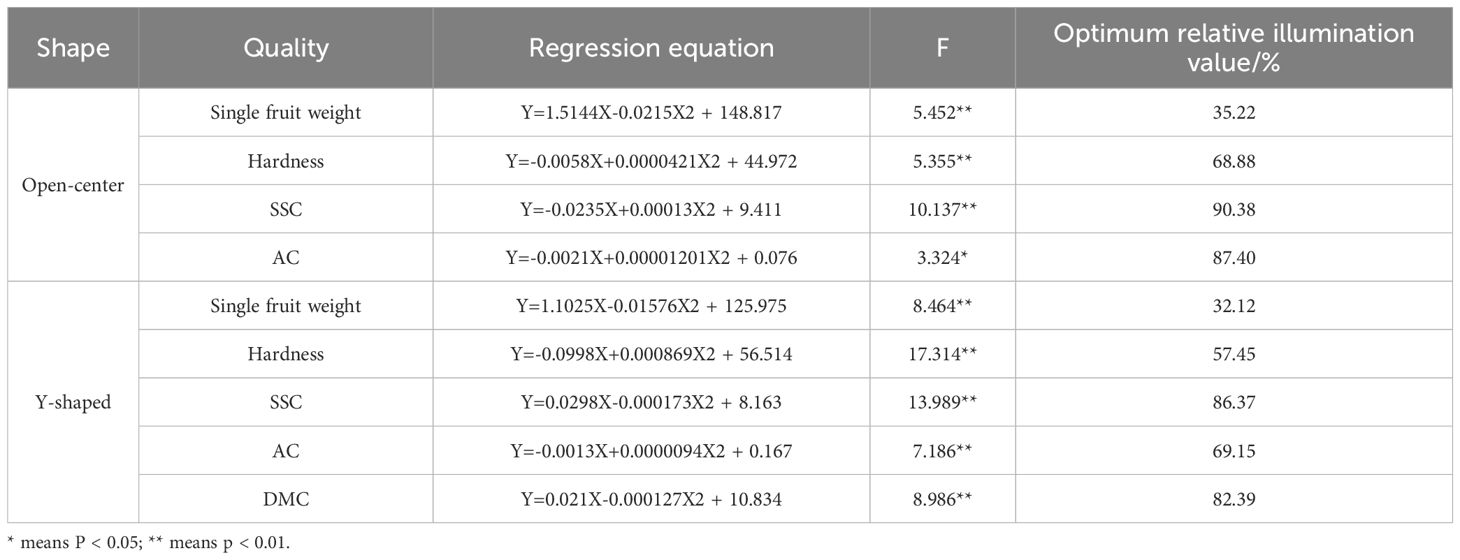
Table 5. Regression analysis of light intensity and fruit quality.
4 Discussion
4.1 Tree shape and microclimate distribution
Peach trees love light, and their shape and canopy structure directly affect the distribution of light within the canopy, branch and leaf growth, and the light interception rate, which affects fruit quality and yield (Génard et al., 2000; Farina et al., 2005; Anthony and Minas, 2025). In our study, we found that the light was vertically distributed more in the upper layer, followed by middle and lower layers but horizontally increased from inside to outside in both the open-center and Y-shaped canopy of Xiahui No. 8 peach trees. Meanwhile, light distribution in the Y-shaped canopy was more uniform compared to that in the open-center canopy, which is consistent with the findings of Yue et al. (2018) and Wen et al. (2019). The yield, including single fruit weight of the upper, middle, and lower layers of the open-center trees was slightly higher than that of the Y-shaped trees, while the fruits in all three layers of the open-center trees were less hard than the fruits in the Y-shaped trees. This indicates that the open-center canopy is more open, has a larger light-receiving area, and a higher light utilization rate. This is consistent with the results reported by Anthony et al. (2021) which showed that fruits growing under different light conditions experience variations in their maturation process and internal quality development, with fruit maturity increasing as light intensity increases.
The physiological processes of fruit trees, such as photosynthesis, respiration, and transpiration, need to occur under specific temperature and relative humidity (RH) conditions, which can affect fruit quality by regulating enzyme activity, as well as the SSC and DMC (Ou et al., 2023). In our study, the vertical distribution pattern of temperature in the canopy of both the open-center and Y-shaped trees was higher in the upper followed by the middle and lower layers, while horizontally the temperature gradually decreased from outside to inside. On the other hand, the distribution pattern of RH within the canopy was opposite that of the temperature.
4.2 Relationship between training system and fruit quality, yield and revenue
Different training system result in varying amounts and distributions of branches and leaves within the canopy, which alter its light intensity, temperature and humidity, directly impacting the fruit quality. Thus, the quality of fruits produced by different tree shapes varies (Zeng, 2022). The current study showed higher single fruit weight, percentage of large fruits, SSC, flesh DMC, and total number of fruiting branches in the open-center than in the Y-shaped trees. The primary reason for these differences may be that the open-center training system enables more efficient light interception and utilization, thereby enhancing photosynthetic activity, promoting the accumulation and transport of assimilates, and ultimately improving fruit DMC and SSC. These findings are consistent with those of Pieper et al. (2024) which emphasized that controlling the light environment within the canopy plays a crucial role in fruit quality development, with high light intensity being positively associated with superior fruit quality.
Moreover, significant differences in fruit surface coloration were observed among different canopy layers: fruits located in the upper canopy were notably redder and brighter than those in the middle and lower layers. This finding is consistent with the results reported Yue et al. (2018), primarily attributable to the higher photosynthetic intensity, extended light exposure duration, and elevated temperatures in the upper canopy, all of which promote the accumulation and synthesis of anthocyanins, resulting in redder and more vivid fruit coloration. Although the yield and revenue of different canopy layers between the two training systems showed no significant differences, the overall yield and revenue of open-center trees were slightly higher than those of Y-shaped trees. This is attributed to the fact that fruits from open-center trees exhibited higher sweetness, making them more appealing to consumers. This observation is consistent with the findings of Iglesias and Echeverría (2009) and Wen et al. (2019), which indicated that consumers generally prefer fruits with higher sugar content, thereby enhancing their market value.
Thus, the widely spaced main branches and numerous fruiting branch groups in the open-center peach tree, make it utilize light more efficiently than a Y-shaped tree, thereby enhancing its fruit quality.
4.3 Relationship between microclimate and fruit quality
The light intensity, RH and temperature inside the canopy significantly influence fruit quality and have complex interactions among themselves, with light intensity playing a dominant role (Zhang et al., 2019). In this study, we correlated light intensity, temperature and RH with single fruit weight, hardness, SSC, AC and flesh DMC, revealing a highly significant correlation between light intensity and the fruit quality attributes. Light intensity also significantly affects the coloration and sugar-acid ratio of fruit, thereby impacting its quality and yield. The study shows that fruits in the upper layers of the canopy have the greatest size, best coloration, and highest SSC. Additionally, the average temperature in the upper layers is higher than that in the middle and lower canopy, which promotes the activity of synthetic enzymes and accelerates the conversion and accumulation of sugars, ultimately leading to higher sugar content and elevated SSC levels in fruits from the upper canopy. These observations are consistent with previous studies on peach fruit composition and postharvest physiology, which similarly reported that enhanced light exposure and higher temperatures contribute to improved fruit coloration and increased sugar accumulation (Zhang et al., 2023b).
Overall, in the current study among the three major microclimatic factors, light intensity had the greatest correlation with fruit quality. Based on this, we established a binary linear regression equation between light intensity and fruit quality and calculated the optimal light intensity values for quality attributes. The optimal relative light intensity values between 30 and 90% enabled the Xiahui No. 8 peach to achieve high quality and yield as has been reported previously (Huang et al., 2015; Liu et al., 2021). Light intensity below 30% is characterized as low light efficacy, which is not conducive to producing high-quality and high-yield fruits.
5 Conclusion
This study explored the relationships between tree shape, microclimate, fruit quality, yield, and economic benefits in peach trees. The results showed that the open-centered canopy had higher light utilization, which in turn improved the single fruit weight, hardness, SSC, and DMC, and increased yield and revenue compared to the Y-shaped canopy. Furthermore, the number of fruiting branches within the canopy reflects the growth status and size of the tree, and maintaining a certain number of evenly distributed fruiting branches helps to effectively control fruit yield. The study also found that light intensity is the primary factor affecting fruit quality, with optimal relative light intensity ranging from 30 to 90%, which is also conducive to producing high-quality and yielding fruits. Therefore, proper management of tree shape, branch distribution, and light intensity plays a crucial role in improving fruit quality and economic benefits in peach orchards.
Data availability statement
The original contributions presented in the study are included in the article/supplementary material. Further inquiries can be directed to the corresponding author.
Author contributions
JZ: Conceptualization, Methodology, Writing – original draft, Writing – review & editing. YW: Conceptualization, Data curation, Methodology, Writing – review & editing, Writing – original draft. HX: Investigation, Methodology, Software, Writing – original draft. HL: Software, Validation, Visualization, Writing – review & editing. HW: Methodology, Validation, Writing – review & editing. CZ: Supervision, Validation, Writing – review & editing. DW: Conceptualization, Funding acquisition, Methodology, Writing – review & editing.
Funding
The author(s) declare that financial support was received for the research and/or publication of this article. This work is financially supported by the earmarked fund for CARS (CARS-30-Z-16).
Conflict of interest
The authors declare that the research was conducted in the absence of any commercial or financial relationships that could be construed as a potential conflict of interest.
Generative AI statement
The author(s) declare that no Generative AI was used in the creation of this manuscript.
Publisher’s note
All claims expressed in this article are solely those of the authors and do not necessarily represent those of their affiliated organizations, or those of the publisher, the editors and the reviewers. Any product that may be evaluated in this article, or claim that may be made by its manufacturer, is not guaranteed or endorsed by the publisher.
References
Anthony, B. M., Chaparro, J. M., Sterle, D. G., Prenni, J. E., and Minas, I. S. (2021). Metabolic signatures of the true physiological impact of canopy light environment on peach fruit quality. Environ. Exp. Bot. 191, 104630. doi: 10.1016/j.envexpbot.2021.104630
Anthony, B. M. and Minas, I. S. (2025). Canopy architecture impact on peach tree physiology, vigor diffusion, productivity and fruit quality. Sci. Hortic. 342, 114025. doi: 10.1016/j.scienta.2025.114025
Barritt, B. H. (1988). “Influence of orchard system on canopy development, light interception and production of third-year Granny Smith apple trees,” in Paper presented at the IV International Symposium on Research and Development on Orchard and Plantation Systems, 243. Dronten, Netherlands: ISHS
Bassi, D. and Selli, R. (1990). Evaluation of fruit quality in peach and apricot. Adv. Hortic. Sci. 4, 107–112. doi: 10.13938/j.issn.1007-1431.20230328
Casanova-Gascón, J., Figueras-Panillo, M., Iglesias-Castellarnau, I., and Martín-Ramos, P. (2019). Comparison of SHD and open-center training systems in almond tree orchards cv. ‘soleta.’. Agronomy 9, 874. doi: 10.3390/agronomy9120874
Chen, X., Yuan, H., Chen, R., Zhu, L., and He, G. (2003). Biochemical and photochemical changes in response to triacontanol in rice (Oryza sativa L.). Plant Growth Regul. 40, 249–256. doi: 10.1023/A:1025039027270
Dussi, M. C., Giardina, G., Sosa, D., Junyent, R. G., Zecca, A., and Reeb, P. R. (2005). Shade nets effect on canopy light distribution and quality of fruit and spur leaf on apple cv. Fuji. Span. J. Agric. Res. 3, 253–260. doi: 10.5424/sjar/2005032-144
Farina, V., Bianco, R. L., and Inglese, P. (2005). Vertical distribution of crop load and fruit quality within vase- and Y-shaped canopies of `elegant lady’ peach. HORTSCIENCE. 40, 587–59. doi: 10.21273/HORTSCI.40.3.587
Feng, F., Li, M., Ma, F., and Cheng, L. (2014). Effects of location within the tree canopy on carbohydrates, organic acids, amino acids and phenolic compounds in the fruit peel and flesh from three apple (Malus× domestica) cultivars. Hortic. Res. 1. doi: 10.1038/hortres.2014.19
Ge, Q., Ke, Z., Liu, Y., Chai, F., Yang, W., Zhang, Z., et al. (2023). Low-carbon strategy of demand-based regulating heating and lighting for the heterogeneous environment in beijing Venlo-type greenhouse. Energy 267, 126513. doi: 10.1016/j.energy.2022.126513
Génard, M., Baret, F., and Simon, D. (2000). A 3D peach canopy model used to evaluate the effect of tree architecture and density on photosynthesis at a range of scales. Ecol. Model. 128, 197–209. doi: 10.1016/S0304-3800(99)00232-X
He, F. (2007). Relationship between microclimate in canopy and yield and quality of peach fruit [master's thesis]. Yangling, Shaanxi: Northwest A&F University.
He, Y., Qin, H., Wen, J., Fan, S., Yang, Y., Zhang, B., et al. (2023). Quality analysis and comprehensive evaluation of 35 actinidia argute accessions. Vol. 40 (Institute of Special Animal and Plant Sciences of CAAS), 1523–1533. doi: 10.13925/j.cnki.gsxb.20220659
Huang, G., Tang, Z., Peng, Y., Wang, Y., and Li, W. (2015). Effects of different tree shapes on photosynthesis and fruit quality of ‘Lijiang Snow Peach’. Tianjin. Agric. Sci. 21, 103–106. doi: 10.3969/j.issn.1006-6500.2015.04.023
Iglesias, I. and Echeverría, G. (2009). Differential effect of cultivar and harvest date on nectarine colour, quality and consumer acceptance. Sci. Hortic. 120, 41–50. doi: 10.1016/j.scienta.2008.09.011
Iglesias, I. and Echeverria, G. (2022). Current situation, trends and challenges for efficient and sustainable peach production. Sci. Hortic. 296, 110899. doi: 10.1016/j.scienta.2022.110899
Jackson, J. E. (1970). Aspects of light climate within apple orchards. J. Appl. Ecol. 7, 207–216. doi: 10.2307/2401373
Jia, Y., Liao, K., Luo, Q., Sun, F., Ma, W., Niu, Y., et al. (2016). Analysis on the canopy microclimate and yield and quality of the different grape cultivation trellis in Turpan. Xinjiang. Agric. Sci. 53, 1210.
Li, P., Ma, F., and Cheng, L. (2013). Primary and secondary metabolism in the sun-exposed peel and the shaded peel of apple fruit. Physiol. Plant. 148, 9–24. doi: 10.1111/j.1399-3054.2012.01692.x
Liu, L., Li, Q., Gao, D., Wei, Z., Shi, C., Wang, Z., et al. (2022). Effects of tree shapes on growth, yield and quality of peach. J. Fruit Sci. 39, 36–46. doi: 10.13925/j.cnki.gsxb.20210225
Liu, B., Tang, G., Liang, J., Shu, X., Li, P., Zhao, D., et al. (2021). Effects of different tree shapes on yield and quality of’Luguang’walnut. J. Fruit Sci. 38, 73–81.
Minas, I. S., Blanco-Cipollone, F., and Sterle, D. (2021). Accurate non-destructive prediction of peach fruit internal quality and physiological maturity with a single scan using near infrared spectroscopy. Food Chem. 335, 127626. doi: 10.1016/j.foodchem.2020.127626
Minas, I. S., Tanou, G., and Molassiotis, A. (2018). Environmental and orchard bases of peach fruit quality. Sci. Hortic. 235, 307–322. doi: 10.1016/j.scienta.2018.01.028
Niu, Y., Liao, K., Zhao, S., Xu, G., Jiang, Z., Wei, Y., et al. (2015). Temperature and humidity change rule in canopy of Korla Fragrant Pear in different planting densities. Xinjiang. Agric. Sci. 38, 363–369. doi: 10.13925/j.cnki.gsxb.20200338
Ou, L., Zhang, Y., Zhang, Z., Chen, Y., Wang, K., Wen, Y., et al. (2023). The relationship between canopy microclimate, fruit and seed yield, and quality in xanthoceras sorbifolium. J. Plant Physiol. 284, 153975. doi: 10.1016/j.jplph.2023.153975
Palmer, J. and Jackson, J. (1977). Seasonal light interception and canopy development in hedgerow and bed system apple orchards. J. Appl. Ecol. 14, 539–549. doi: 10.2307/2402566
Pieper, J. R., Anthony, B. M., Chaparro, J. M., Prenni, J. E., and Minas, I. S. (2024). Rootstock vigor dictates the canopy light environment that regulates metabolite profile and internal fruit quality development in peach. Plant Physiol. Biochem. 208, 108449. doi: 10.1016/j.plaphy.2024.108449
Porra, R. J. (2002). The chequered history of the development and use of simultaneous equations for the accurate determination of chlorophylls a and b. Photosynth. Res. 73, 149–156. doi: 10.1023/A:1020470224740
Rojo, F., Del Río, R., Snyder, R. L., and Zaccaria, D. (2023). A novel simulation model to predict photosynthetic active radiation interception in micro-irrigated citrus production orchards based on tree spacing, canopy geometry, and row orientation. Comput. Electron. Agric. 212, 108062. doi: 10.1016/j.compag.2023.108062
Rudell, D. R., Serra, S., Sullivan, N., Mattheis, J. P., and Musacchi, S. (2017). Survey of ‘d’Anjou’pear metabolic profile following harvest from different canopy positions and fruit tissues. HortScience 52, 1501–1510. doi: 10.21273/HORTSCI12375-17
Serra, S., Sullivan, N., Mattheis, J. P., Musacchi, S., and Rudell, D. R. (2018). Canopy attachment position influences metabolism and peel constituency of European pear fruit. BMC Plant Biol. 18, 1–20. doi: 10.1186/s12870-018-1544-6
Shipley, B. and Vu, T. T. (2002). Dry matter content as a measure of dry matter concentration in plants and their parts. New Phytol. 153, 359–364. doi: 10.1046/j.0028-646X.2001.00320.x
Sobierajski, G. R. and Blain, G. C. (2022). The fruiting wall: An alternative training system for peach orchards in southeast Brazil. J. Agric. Sci. 15, p12. doi: 10.5539/jas.v15n1p12
Su, B. (2008). Effects of canopy micro-climate, yield and quality of different shapes on apple in Weibei .[Master’s thesis]. Yangling, Shaanxi: Northwest A&F University.
Szewczuk, A. and Gudarowska, E. (2012). Effect of spacing, trees crown shape and the way of planting on growth and yielding of two cultivars of peaches. ACTA. 11, 83–92
Tang, L., Hou, C., Huang, H., Chen, C., Zou, J., and Lin, D. (2015). Light interception efficiency analysis based on three-dimensional peach canopy models. Ecol. Inform 30, 60–67. doi: 10.1016/j.ecoinf.2015.09.012
Thimijan, R. W. and Heins, R. D. (1983). Photometric, radiometric, and quantum light units of measure: a review of procedures for interconversion. HortScience 18, 818–822. doi: 10.21273/HORTSCI.18.6.818
Tsipouridis, C. and Thomidis, T. (2005). Effect of 14 peach rootstocks on the yield, fruit quality, mortality, girth expansion and resistance to frost damages of may crest peach variety and their susceptibility on phytophthora citrophthora. Sci. Hortic. 103, 421–428. doi: 10.1016/j.scienta.2004.08.004
Wang, X., Niu, Z., Li, Z., Guo, A., and Gao, H. (2011). Influences of different canopy structures on their relative light intensity andfruit quality of Naganofuji No.2 apple. J. Fruit Sci. 28, 8–14.
Wen, Y., Zhang, Y., Su, S., Yang, S., Ma, L., Zhang, L., et al. (2019). Effects of tree shape on the microclimate and fruit quality parameters of camellia oleifera abel. Forests 10, 563. doi: 10.3390/f10070563
Yang, Z., Zhou, Y., Fu, Y., Yang, M., and Zhao, T. (1998). Relationship between microclimatic character of different crown types and fruit quality of Fu-ji apple. Chin. J. Appl. Ecol. 9, 533–537.
Yue, W., Shu-chai, S., Ma, L., Shao-yan, Y., Yu-wei, W., and Wang, X. (2018). Effects of canopy microclimate on fruit yield and quality of camellia oleifera. Sci. Hortic. 235, 132–141. doi: 10.1016/j.scienta.2017.12.042
Zeng, Z. (2022). Effects of different tree shapes on canopy light environment and fruit quality of peach. Southeast. Horticult. 10, 181–186. doi: 10.20023/j.cnki.2095-5774.2022.03.004
Zhang, D. (1989). Planting mode, leaf curtain micro-climate and grape production-research progress on eco-physiology of grape cultivation abroad. Viticult. Oenol. 3), 42–55. doi: 10.20023/j.cnki.2095-5774.2022.03.004
Zhang, B., Chen, H., Guo, L., Zhang, Y., Wang, X., Guo, S., et al. (2023a). Effects of fruit thinning at different stages on the yield and quality of peach variety “Xiahui No. 8. Fruit Trees South. China 52, 187–191. doi: 10.13938/j.issn.1007-1431.20230328
Zhang, Y.-Q., Wen, Y., Bai, Q., Ma, Z., Ye, H.-L., and Su, S.-C. (2019). Spatio-temporal effects of canopy microclimate on fruit yield and quality of sapindus mukorossi gaertn. Sci. Hortic. 251, 136–149. doi: 10.1016/j.scienta.2019.02.074
Keywords: peach, canopy, microclimate, fruit quality, Xiahui No. 8
Citation: Zhen J, Wang Y, Xia H, Li H, Wu H, Zhao C and Wang D (2025) The relationship between microclimate factors and fruit quality in different tree canopies of Xiahui No. 8 peach trees. Front. Plant Sci. 16:1551110. doi: 10.3389/fpls.2025.1551110
Received: 24 December 2024; Accepted: 23 May 2025;
Published: 05 June 2025.
Edited by:
Wei Guo, Chinese Academy of Agricultural Sciences (CAAS), ChinaReviewed by:
Gemma Reig, Institute of Agrifood Research and Technology (IRTA), SpainSana Zulfiqar, National Institute for Biotechnology and Genetic Engineering, Pakistan
Copyright © 2025 Zhen, Wang, Xia, Li, Wu, Zhao and Wang. This is an open-access article distributed under the terms of the Creative Commons Attribution License (CC BY). The use, distribution or reproduction in other forums is permitted, provided the original author(s) and the copyright owner(s) are credited and that the original publication in this journal is cited, in accordance with accepted academic practice. No use, distribution or reproduction is permitted which does not comply with these terms.
*Correspondence: Dong Wang, d2FuZ2Rvbmc1MTBAbndhZnUuZWR1LmNu
†These authors have contributed equally to this work