- 1College of Landscape Architecture and Horticulture Sciences, Southwest Forestry University, Kunming, China
- 2Southwest Research Center for Engineering Technology of Landscape Architecture (State Forestry and Grassland Administration), Kunming, Yunnan, China
Background: Plant phenotypic diversity is not solely determined by genetic variation but is also shaped by the combined effects of environmental factors. Polyspora, a genus within the Theaceae family, consists of evergreen trees or shrubs widely recognized for their horticultural value and suitability for afforestation in mountainous regions. Despite its ecological and economic significance, the genus Polyspora has received relatively limited attention from the plant taxonomy community, and no systematic studies on its phenotypic diversity have been conducted to date.
Methods: Thus, we conducted a comprehensive investigation on the phenotypic traits of Polyspora (8 species, 32 populations) distributed across China. We employed nested variance analysis to characterize the variation patterns of phenotypic traits within and among populations. Furthermore, redundancy analysis and Pearson correlation analysis were conducted to explore the relationships between leaf morphological traits and geo-environmental variables. A phylogenetic tree was constructed based on 15 morphological traits, and the strength of the phylogenetic signal was quantified using Blomberg’s K statistic.
Results: The results indicate that the phenotypic traits of Polyspora species exhibit significant interspecific and intraspecific differences, with abundant phenotypic variation. Specifically, the average coefficients of variation (CVs) were 24% for leaf traits, 11.98% for floral traits, and 17.49% for fruit and seed traits. In terms of variation degree, P. longicarpa exhibited the highest variation in leaf traits, P. chrysandra showed the greatest variation in floral traits, and P. axillaris displayed the maximum variation in fruit and seed traits. Among these species, P. speciosa had the largest leaves, whereas P. longicarpa possessed the largest flowers, fruits, and seeds. The 15 morphological traits examined, including style length, sepal length, capsule length, and seed wing length exhibited strong phylogenetic signals (K >>1, P< 0.05). Among the environmental factors analyzed, bioclimatic variables and ultraviolet radiation were found to exert a significant influence on leaf trait variation.
Conclusions: These findings improve our understanding of the morphological characteristics of Polyspora leaves and the extent to which environmental factors drive phenotypic variation. Furthermore, this study provides a scientific basis for the conservation and sustainable utilization of Polyspora resources in future research and practical applications.
1 Introduction
Phenotypic analysis involves the examination of plant traits based on morphology and constitutes a crucial component in the study of plant genetic diversity (Khadivi et al., 2019). Through comprehensive exploration of phenotypic traits, it becomes possible to identify valuable plant resources and effectively utilize existing germplasm. Plant phenotypic traits can directly reflect the genetic characteristics of plants, thereby providing researchers with intuitive information for studies (Costa et al., 2017). In this process, leaves are important organs for plants to perform photosynthesis and transpiration (Chapin et al., 1993). Phenotypic changes in leaves can indicate the extent of environmental impact on plants. Given the significant morphological differences observed in plant leaves across various growth environments, these characteristics naturally serve as an important foundation for interspecific classification and analysis of phenotypic variation. Furthermore, floral phenotypic traits play a crucial role in evaluating plant germplasm resources and are considered traditional characteristics for the complex phenotypic identification of different taxonomic groups as well as for assessing the interactions between evolutionary and developmental variations (Wessinge and Hileman, 2016). The data derived from floral morphological characteristics encompass a substantial array of qualitative and quantitative trait information; thus, phenotypic diversity analysis is deemed the most appropriate tool for its evaluation (Khadivi-khuband and Anjam, 2014; Oliveira et al., 2012). Plant fruit and seed traits represent relatively stable genetic characteristics; however, there exhibit notable variation in phenotypes among seeds sourced from different provenances. These variations arise from long-term adaptations of plants to their natural environments along with their respective phenologies. Consequently, by analyzing the morphological features across various aspects such as leaves, flowers, fruits, and seeds, we can gain deeper insights into the genetic basis underlying plant phenotypic traits—providing a scientific foundation for advancements in plant breeding and genetic improvement.
The genus Polyspora belongs to the Theaceae family, which was established by Sweet in 1826. It consists of 47 species, which are evergreen shrubs or trees with a rich variety of flower colors. They are distributed in South and Southeast Asia, primarily found in countries such as Malaysia, Indonesia, China, and Vietnam. In the “Red List of Theaceae,” six species of Polyspora are listed as critically endangered, three species are listed as vulnerable, and four species are listed as near threatened (Beech et al., 2017). Polyspora plants are evergreen broad-leaved tree species, with domestic varieties being trees or shrubs.
The genus Polyspora is outstanding for its ornamental traits, it is a group of excellent garden landscape tree species that are known mainly for their winter flowering, while also offering attractive foliage, fruit, trunk, and tree shape. The genus Polyspora, as a widely distributed native tree species in southern China, is currently cultivated only in a few botanical gardens within the country and has sporadic applications in some cities. The plants of the genus Polyspora have characteristics such as rapid growth, strong adaptability, high water content in leaves, round and full tree crowns, straight trunks, and dense wood texture. Most species are able to adapt to barren mountainous areas and are excellent mountain afforested and timber tree species in tropical and subtropical regions. The fruits of Polyspora plants often contain natural antioxidants, and the extracts from the roots and stems have high cytotoxic activity (Li et al., 2019a; Fu et al., 2013; Tang, 2013). These extracts can be developed into functional foods or nutritional health products, which have the ability to prevent certain diseases caused by oxidative stress, such as cardiovascular diseases and cancer. However, due to the late start of basic research, insufficient nursery cultivation, and market development, only a few species of Polyspora plants in China have sporadic applications in limited areas. The vast majority of species remain in the wild and have not yet been rationally developed and utilized.
Therefore, based on a nationwide survey of Polyspora resources, this study investigates the phenotypic traits of 32 wild populations across 8 species. By studying the phenotypic diversity and the correlation between leaf phenotypes and geographical environmental factors. The objectives of this work are to elucidate how leaf phenotypes adapt to different environments, identify morphological features that carry phylogenetic signals, and thereby establish a foundation for subsequent analyses of molecular genetic diversity.
2 Materials and methods
2.1 Sample collection
Based on the distribution of the Polyspora genus across the country, provinces with relatively high concentrations of Polyspora species and individuals, such as Yunnan, Guizhou, Sichuan, Chongqing, Guangxi, Guangdong, and Hainan, were selected to determine the scope and locations of the survey (Figure 1). According to factors such as different altitudes, habitats, and community structures, 1–2 representative populations in each survey area were identified. When there is no obvious geographical isolation such as rivers, valleys, or gullies, the minimum population distance for the same species should be restricted to more than 50 km; when there is obvious geographical isolation, the population distance is not limited.
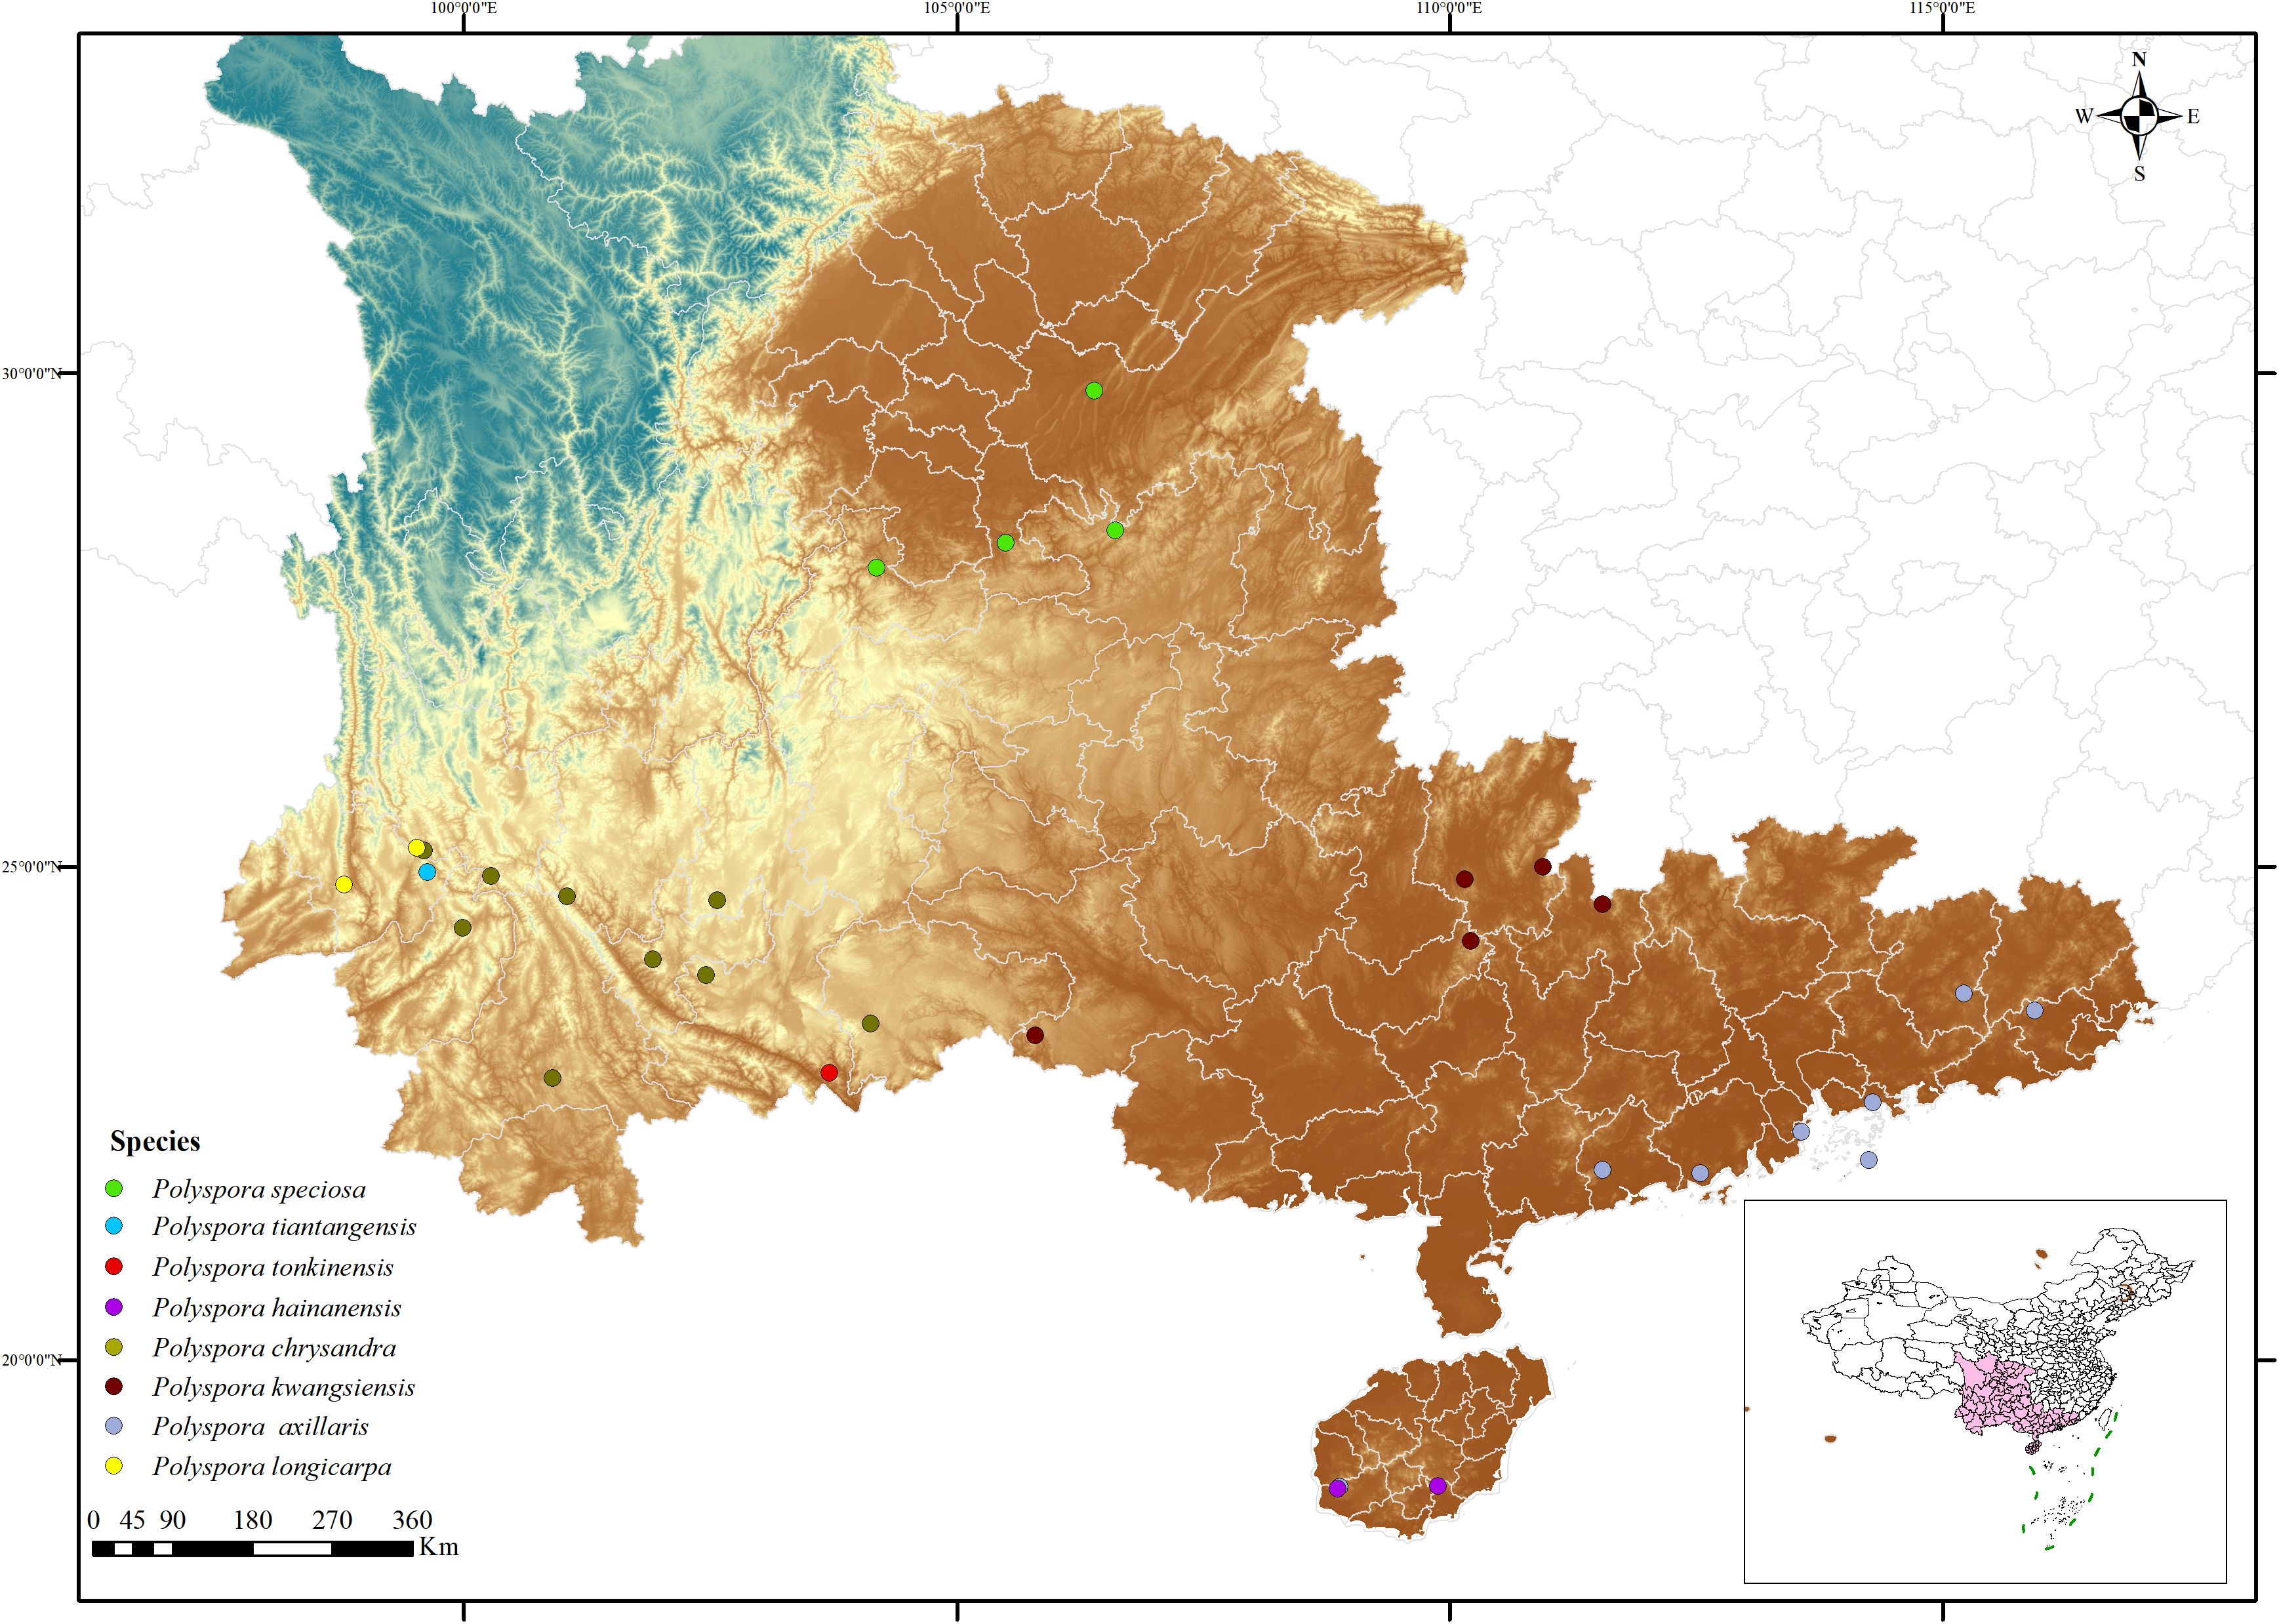
Figure 1. Distribution map of sampling sites for the natural population of Polyspora. Based on the standard map service website of the Ministry of Natural Resources with the approval number GS (2022) 1873, and the boundary of the base map has not been modified.
Within each population, more than 20 samples of Polyspora plants were selected, with an individual spacing of more than 50 m. If the population sample size is fewer than 20 individuals or if there are obvious phenotypic differences within the population, the sampling is not limited by population size and sampling interval, and all individuals are collected. From each population, individuals with obvious phenotypic differences and stable traits were selected, some morphological data of leaves and flowers in the field were measured. The collected fruits were stored in sealed plastic bags with ice packs for preservation and sent back to the laboratory for actual measurement of their morphological data. After the fruits were dried and split open, the morphological data of the seeds were collected.
From 2020 to 2022, a total of 753 individual materials (Supplementary Table S1) from 32 populations of Polyspora in China were collected. The average distance between populations was 744 km, with more than 100 samples collected, as well as a small amount of pollen and fruit. This included 8 populations of Polyspora axillaris, 9 populations of Polyspora chrysandra, 5 populations of Polyspora speciosa, 5 populations of Polyspora kwangsiensis, 1 population of Polyspora tonkinensis, 2 populations of Polyspora longicarpa, 1 population of Polyspora tiantangensis, and 2 populations of Polyspora hainanensis. The investigation and collection of samples in this study have been approved by the local regulatory authorities. All voucher specimens were morphologically identified by Zhifeng Fan from Southwest Forestry University and deposited in the Herbarium of Southwest Forestry University.
2.2 Phenotypic measurement
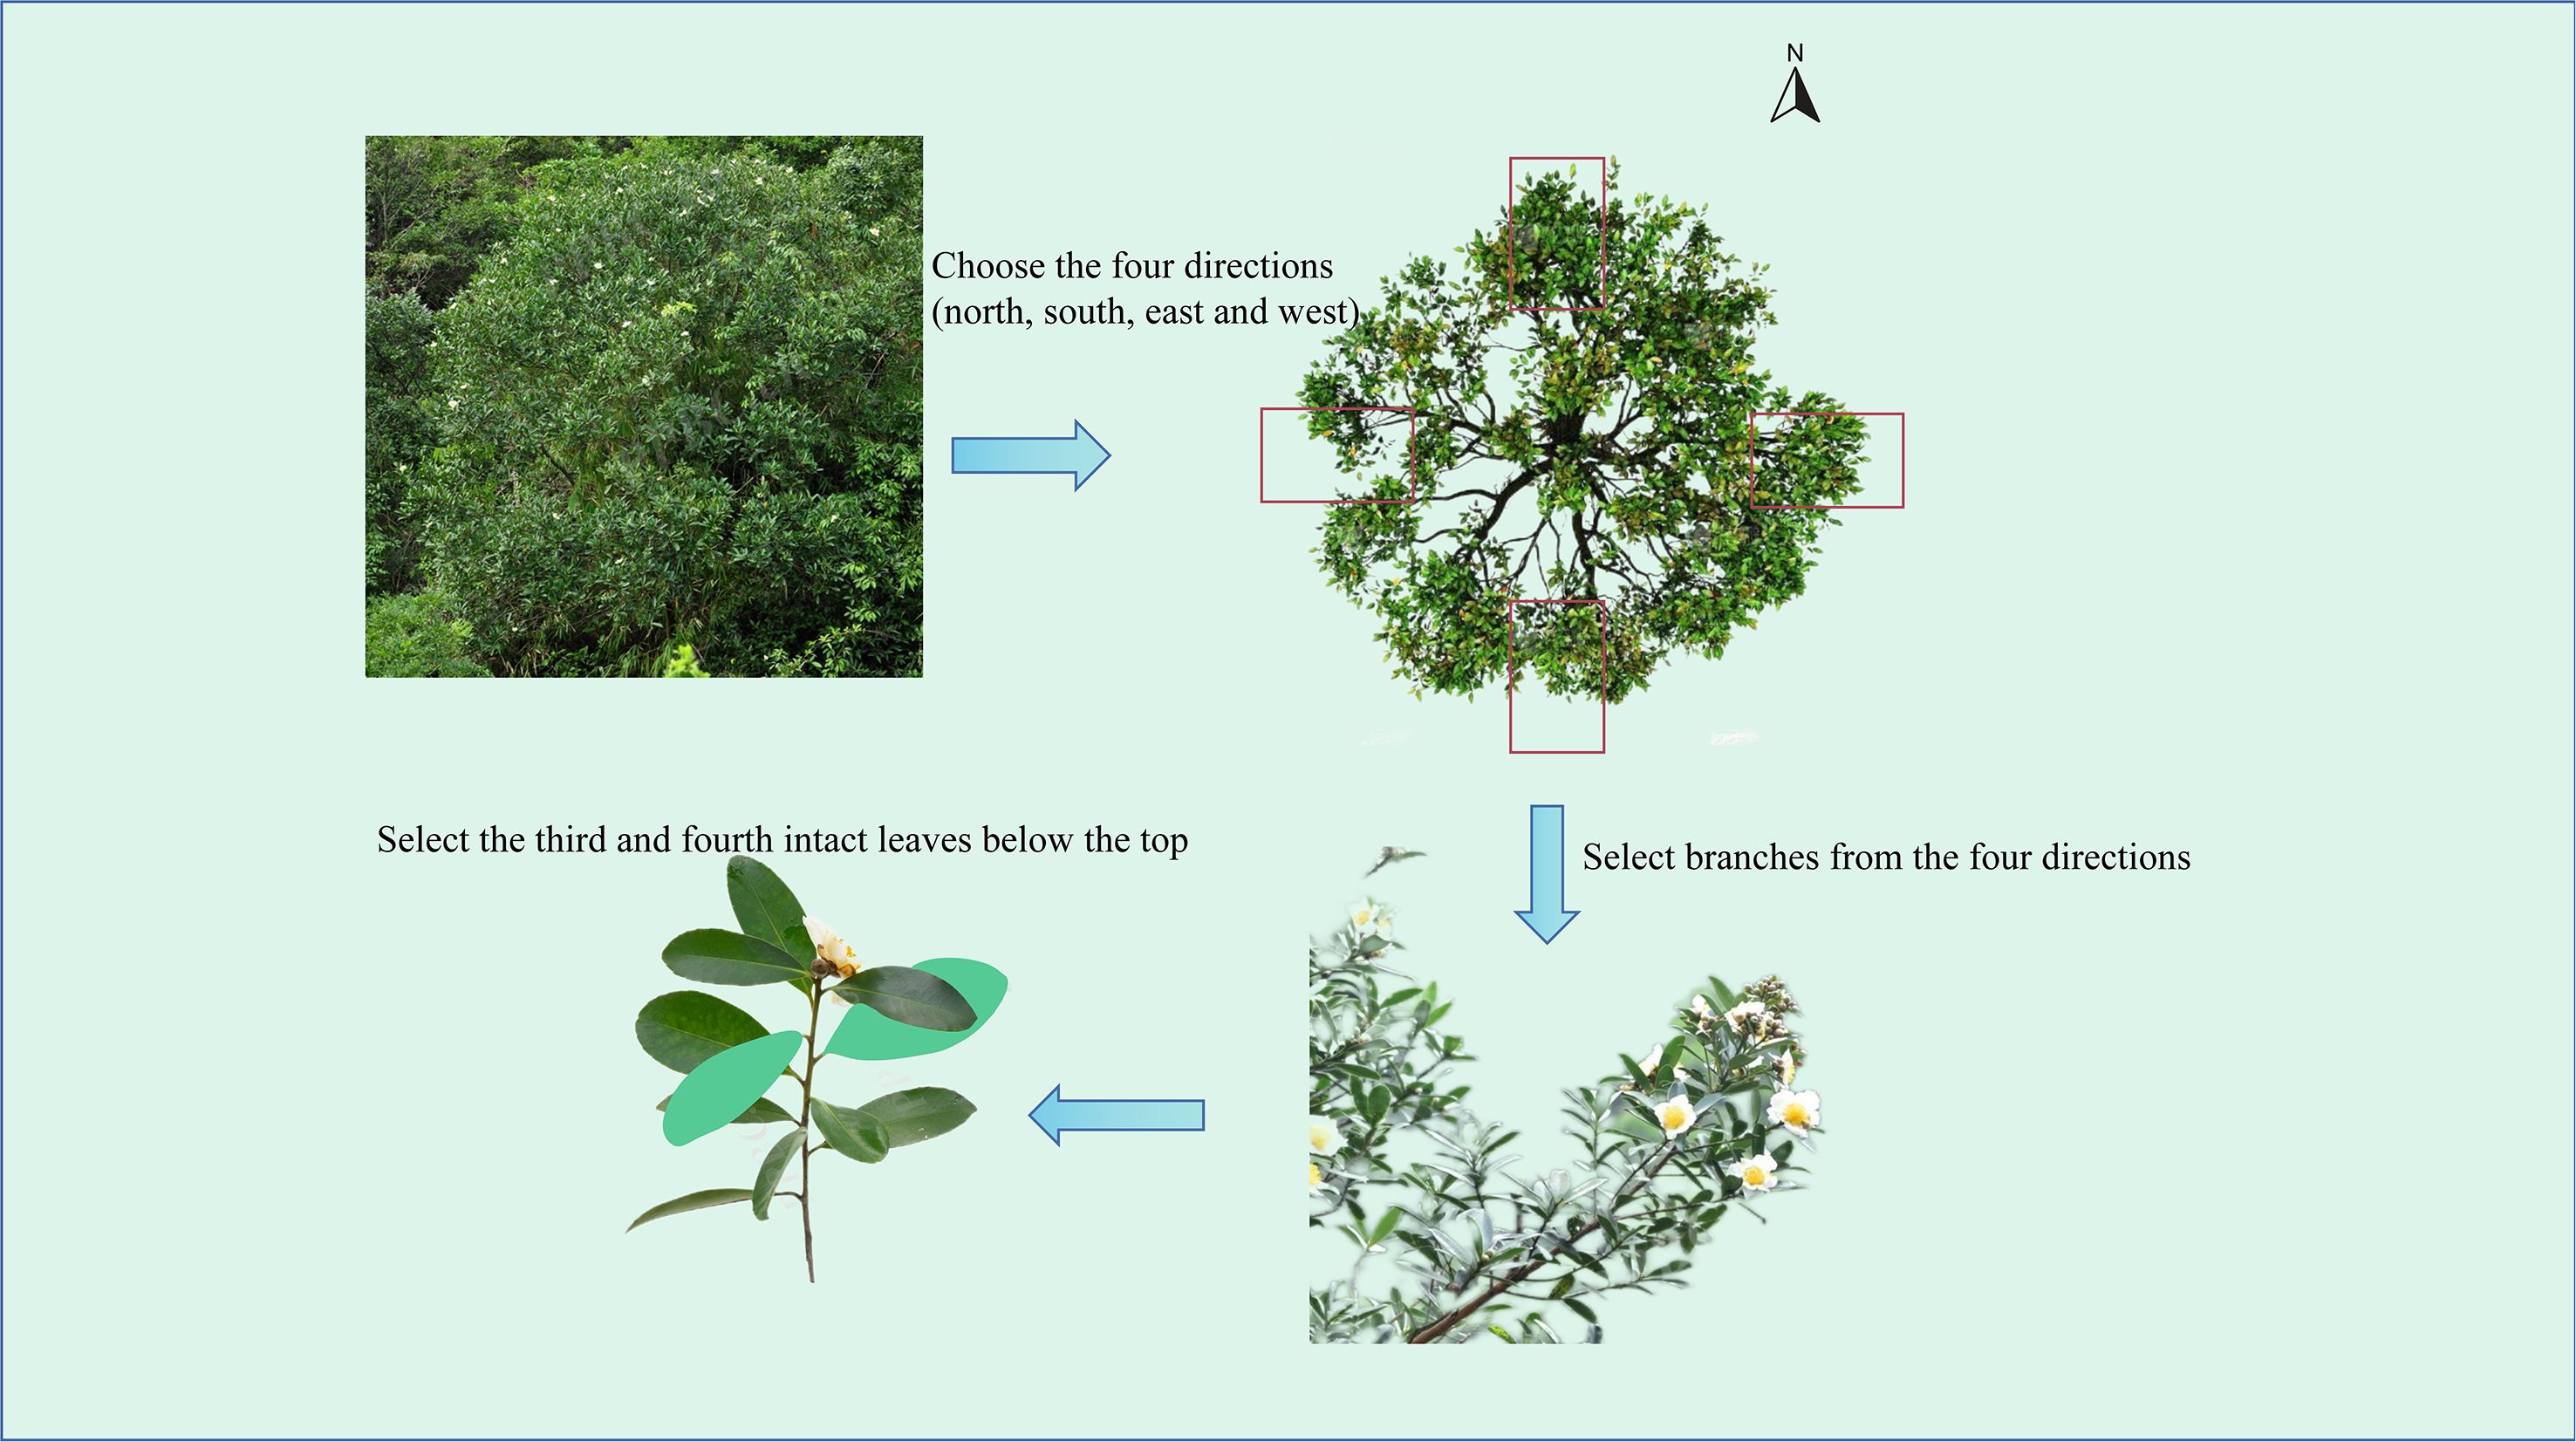
A total of 31 indicators were utilized for phenotypic analysis (Supplementary Table S2), with 25 directly measured and 6 obtained through secondary calculations. For each individual plant, we selected different lateral branches from the main stem in each of the four cardinal directions (east, south, west, north). From each lateral branch, the 3rd to 4th fully developed mature leaves, counted from the top down, were chosen. (Figure 2). A total of 20 leaves were collected per plant, and indices such as leaf length, leaf width, and petiole length were measured. For each plant, 5 fully open flowers were randomly selected to measure floral traits such as flower diameter, petal length, and petal width. For each plant, 20 healthy mature fruits per plant were randomly collected and brought back to the laboratory to measure the fruit length, peduncle length, seed wing length and other seed and fruit data, and the fruit mass and seed mass were weighed. In the above measurements, the lengths, widths, and diameters are all measured via an electronic vernier caliper (measurement accuracy of 0.01 mm); and the weight is determined via an electronic balance (measurement accuracy of 0.01 g). Following scanning of the leaves via Digimizer software, parameters such as leaf area, leaf base angle as well as tip angles were measured accordingly (with measurement accuracies of 0.01 cm², 0.01cm and 0.01° respectively). The leaf shape index, petiole index, leaf roundness, fruit shape index, fruit stem index, and wing shape index are calculated via specific formulas.
Due to the influence of phenological period, flowering and fruiting patterns, and timing of field surveys for plants in the genus Polyspora, some populations exhibit insufficient or absent flowers, fruits, or seeds to meet the desired data volume. To ensure relative uniformity, we selected phenotypic data on floral organs from 16 populations (representing 4 species), fruit and seed data from 23 populations (covering all species), and leaf morphological data from all 32 populations.
2.3 Collection of environmental data
Geographical environment factors include 19 biological climate factors, 2 topographic factors, 2 soil complex factors, 6 ultraviolet radiation factors, 1 aridity index, 1 vegetation factor and 2 latitude and longitude factors (Supplementary Table S3). The bioclimatic factors data were obtained from the WorldClim database (https://www.worldclim.org). The soil composite factors were acquired from the Harmonized World Soil Database v 1.2, HWSD, (https://www.fao.org/soils-portal/soil-survey/soil-maps-and-databases/harmonized-world-soil-database-v12/en/). The ultraviolet radiation factor was sourced from the Global UV-B Radiation Database, gIUV, (https://www.ufz.de/gluv/). Environmental variable values for each population were extracted using the ArcGIS spatial interpolation method. Latitude, longitude, and altitude factors were selected based on GPS records collected during field surveys. Slope aspect was derived by analyzing altitude through ArcGIS 10.2 spatial analysis functions (https://www.esri.com/zh-cn/home). The vegetation data were downloaded from the Resource and Environmental Science Data Center of the Chinese Academy of Sciences (http://www.resdc.cn).
2.4 Morphological traits
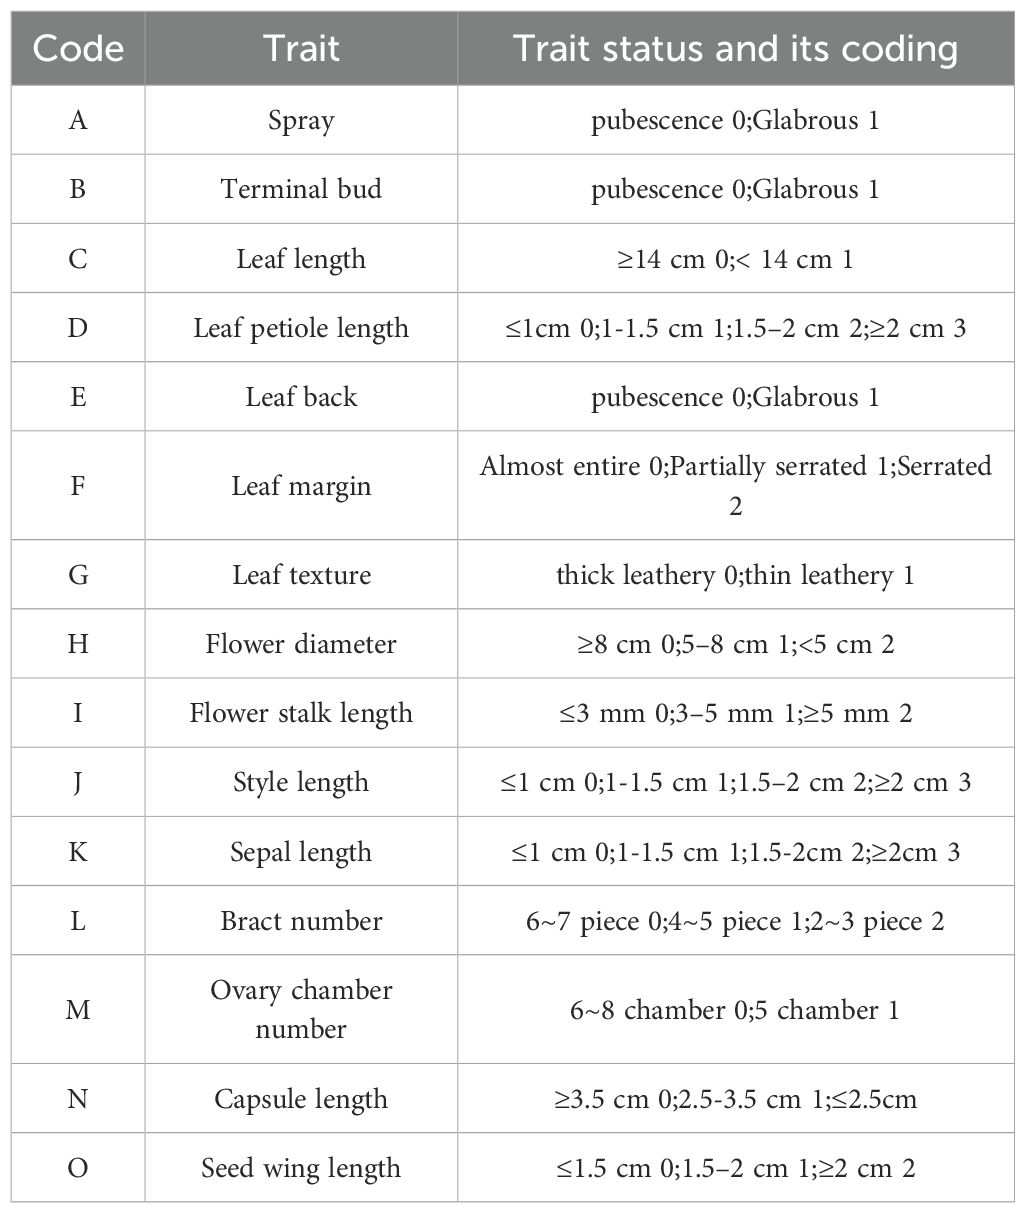
By integrating both quantitative and qualitative morphological characteristics, a total of 15 morphological traits were carefully selected, comprising 7 vegetative traits and 8 reproductive traits. These traits are coded as either 0 for primitive or 1+ for evolved traits, with a few disordered traits being treated as equal distances (Table 1). The traits utilized and their corresponding codes are as follows:
2.5 Statistical analysis
The phenotypic data were entered and statistically analyzed using Excel. The characteristics and variation patterns of each phenotypic trait among and within populations were calculated by nested analysis of variance (ANOVA). Multiple comparisons were performed using the Duncan’s new multiple range method. The coefficient of variation for each phenotypic trait was determined by ANOVA.
The linear model for the nested ANOVA is as follows:
where represents the kth observation of the jth individual of the ith population, represents the total mean, represents the population effect (fixed), represents the within-population monoculture effect (random), and represents the experimental error (Hao et al., 2017).
The phenotypic coefficient of variation is , where is the standard deviation and where is the mean.
The phenotypic differentiation coefficient.
, where is the variance component between-population and is the within-population variance component (Ge et al., 1988).
Due to the potential strong autocorrelation of bioclimatic factors and ultraviolet factors within the research scale, an autocorrelation test was first conducted on the 33 geographical environmental factors. For pairs of environmental factors with a correlation coefficient |r| ≥ 0.8, only the factor with greater biological significance was retained, forming a more concise geographical environmental factor matrix (explanatory variable matrix) for each population. Due to the limited number of leaf phenotypic traits, we did not perform deduplications on these traits. All 10 leaf phenotypic factors were included in the analysis as the response variable matrix (Supplementary Table S2). Subsequently, redundancy analysis and correlation analysis were employed to examine the relationships between leaf phenotypic traits and geographical environmental factors. By summarizing the results of the two methods, the responsive relationships between phenotypic traits and environmental factors were explored. For the paired variables between leaf phenotypic traits and geographical environmental factors with a correlation coefficient |r| ≥ 0.6, regression analysis was conducted to explain the relationships between the phenotypic spatial variation in the genus Polyspora and geographical environmental factors.
Basis on the results of the phenotypic survey, morphological traits were encoded according to Table 1, and an interspecific branching data matrix table for the genus Polyspora was established. Using MrBayes, a phylogenetic Bayesian inference (BI) tree based on morphological data was constructed. The parameters were set to establish 4 Markov chains, with a random tree as the starting tree. The analysis was run for a total of 2,000,000 generations, with sampling every 100 generations. The first 25% of the samples were discarded, and a consensus tree was constructed from the remaining samples. Using Apterosperma oblata was used as the outgroup. We calculated the phylogenetic signal of morphological traits based on Blomberg’s K (Blomberg et al., 2003).
Cluster analysis, analysis of variance, redundancy analysis, regression analysis, morphological phylogenetic signals, and plotting were conducted using R software version 4.2.2.
3 Results
3.1 Leaf morphological diversity
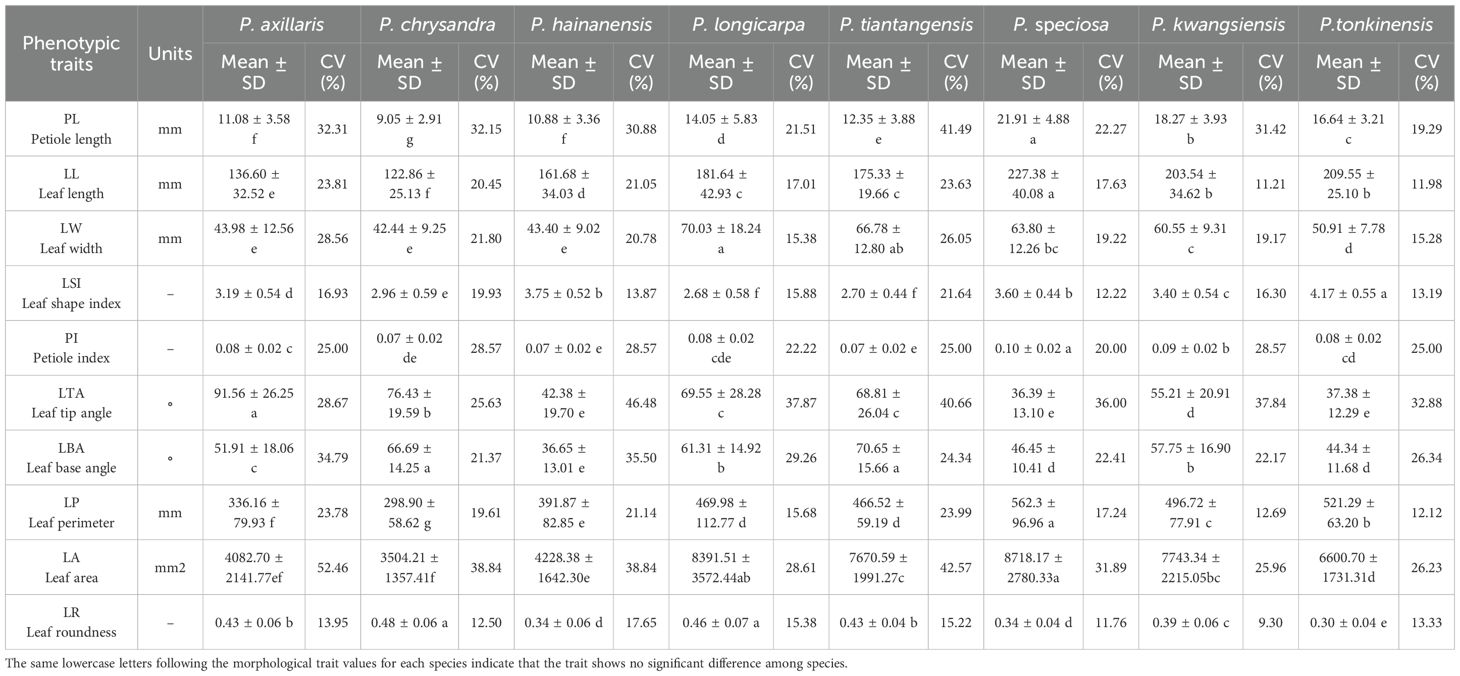
The analysis of leaf phenotypic variability in Polyspora showed that among the domestic Polyspora species, the largest leaf blade was P. speciosa, with a mean leaf length of up to 227 mm, a leaf width of 64 mm, a leaf perimeter of 562 mm, and a leaf area of 8,718 mm2; the smallest leaf blade was P. chrysandra, with a leaf length of 123 mm, a leaf width of 42 mm, a leaf perimeter of 299 mm, and a leaf area of 3,504 mm2; and the leaves with greater roundness were P. longicarpa and P. chrysandra (Table 2). A greater roundness of leaves was found for P. longicarpa and P. chrysandra. The average coefficient of variation of leaf traits across different species ranges from 19.56% to 28.46% (Table 2). Specifically, P. longicarpa exhibits the largest degree of variation, while P. tonkinensis shows the smallest. With respect to individual traits, the highest degree of variation is observed in the leaf area of P. axillaris, reaching 52.46% (Table 2). In contrast, the smallest degree of variation is detected in the leaf roundness of P. tiantangensis, at 9.3% (Table 2). P. hainanensis, P. kwangsiensis, P. speciosa, P. tiantangensis, and P. tonkinensis all demonstrate greater degrees of variation in leaf tips. Additionally, P. axillaris, P. chrysandra, and P. longicarpa display the greatest variation in leaf area, whereas they exhibit the smallest variation in leaf roundness.
3.2 Flower morphological diversity
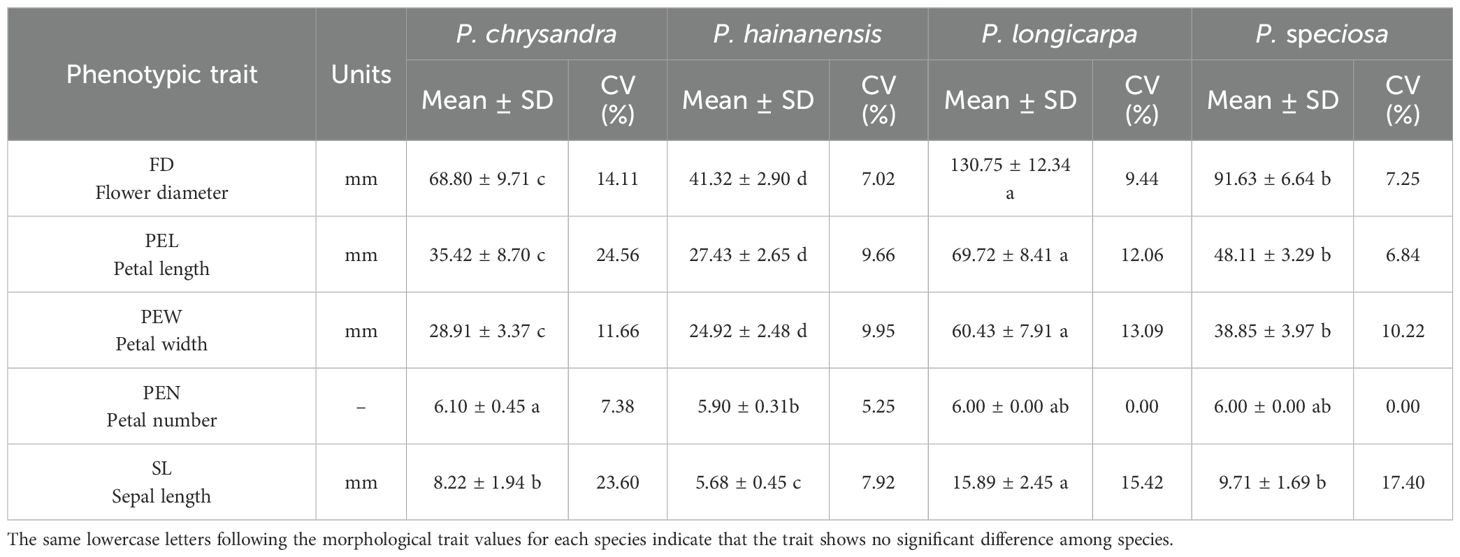
Due to the insufficient number of field observations and samples, floral phenotypic differentiation included only 16 populations of four species, namely, P. chrysandra, P. hainanensis, P. speciosa and P. longicarpa, and the remaining species did not have enough statistically significant floral organ phenotypic trait data. Phenotypic characterization of the flowers revealed that, among the domestically produced species, P. longicarpa had the largest flowers, with a mean flower diameter of 130.75 mm, a petal length of 69.72 mm, a petal width of 60.43 mm, and a sepal length of 15.89 mm. The smallest flowers were found on P. hainanensis, with a mean flower diameter of 41.32 mm, a petal length of 27.43 mm, a petal width of 24.92 mm, and a sepal length of 5.68 mm, the vast majority of the flowers were the same size as those on P. hainanensis. Most of the flowers were 6-merous, with an 8-merous variant found in P. chrysandra and a 5-merous variant found in P. hainanensis. The flowering phenotype of P. chrysandra plants was variable, with an average coefficient of variation of 16.26%, and the most variable trait was petal length (24.56%). Except for the number of petals, the petal width of the P. speciosa plants was the most stable, with a coefficient of variation of 6.84% (Table 3).
3.3 Fruit and seed morphological diversity
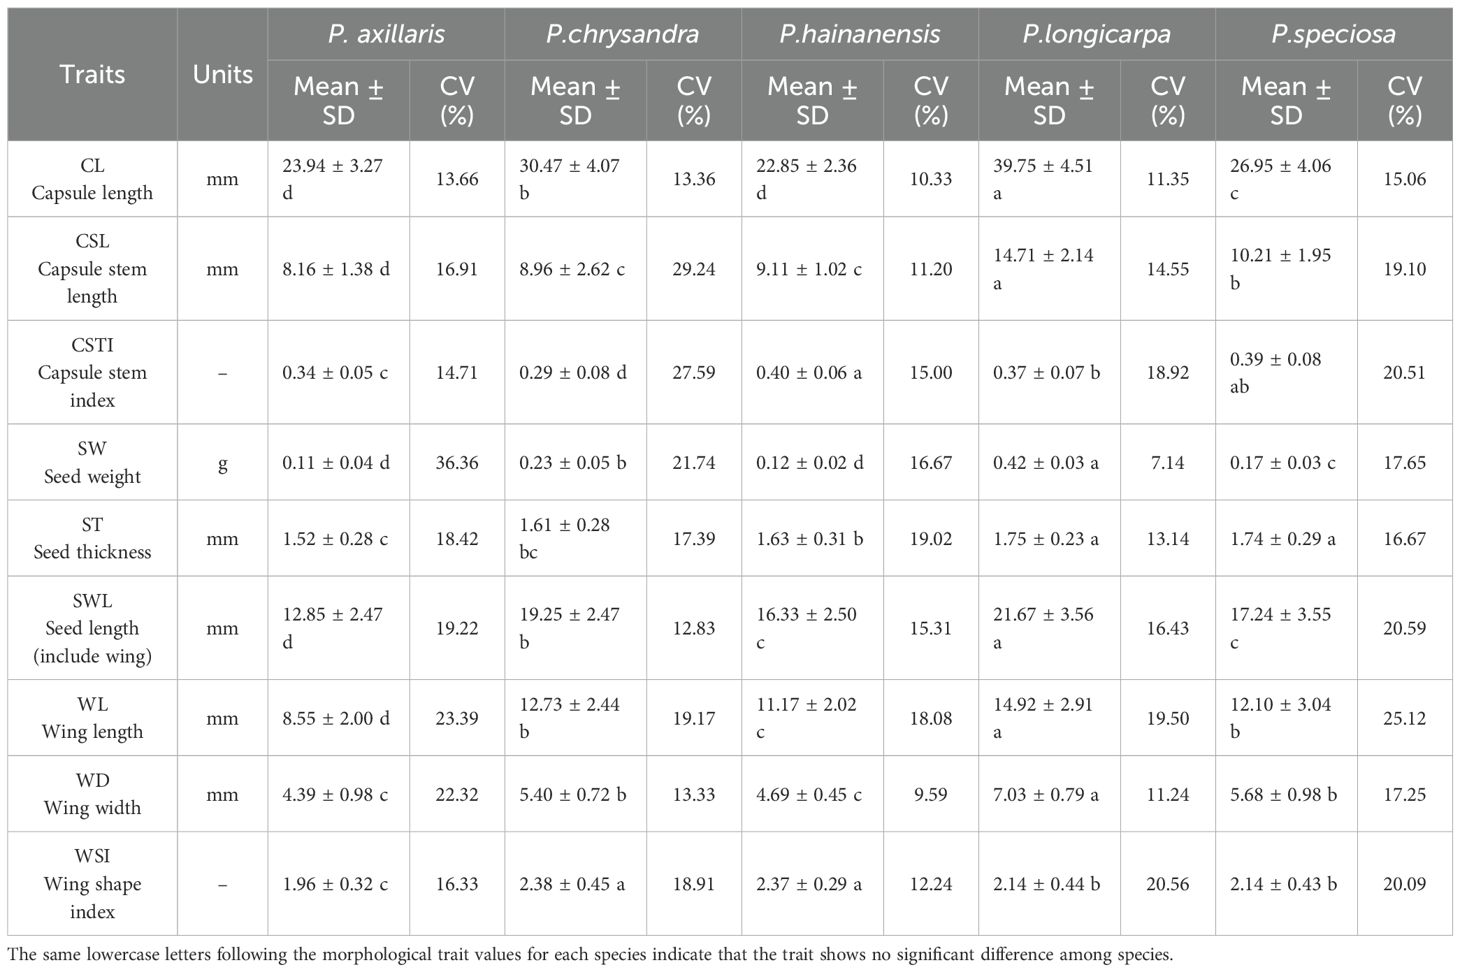
For the analyses of fruit and seed phenotypic traits, only 18 groups of five species were included, again due to insufficient sample data, P. axillaris, P. chrysandra, P. hainanensis, P. longicarpa, P. speciosa, respectively. The largest fruit and heaviest seed among the domestic species of Polyspora was P. longicarpa, with a mean capsule length of 39.75 mm, a thousand-seed weight of 42 g, and a wing length of 14.92 mm; the species with smaller seeds were P. hainanensis and P. axillaris, with capsule lengths of 22.85 mm and 23.94 mm, respectively, and thousand- seed weights of 12 g and 11 g, respectively, and the shortest seed wings were those of P. axillaris, with a mean value of 8.55 mm. The coefficient of variation for the seed phenotype was the highest for P. axillaris (20.15%), and the smallest was for P. hainanensis (14.16%). Among the traits, wing length had the greatest variation, with an average coefficient of variation of 21.05%, and capsule length was the most stable (12.75%). The seed weight of P. axillaris had the greatest variation, with a coefficient of variation of 36.36%. The wing width of P. hainanensis had the smallest variation, with a coefficient of variation of 9.59% (Table 4).
3.4 Population differentiation of phenotypic traits within the genus
To explore the ratio of variance components to variation for each trait, we calculated the nested variance component composition ratio. The results showed that the phenotypic differentiation coefficients of each trait exhibited a wide range of variation, from 1.49% to 97.14%, among the domestically produced species of Polyspora, with 0% or 100% for individual traits due to an insufficient amount of data (Supplementary Table S4). The traits that were not listed for each species were missing data; only one population was investigated for P. tonkinensis and P. tiantangensis, and no population differentiation study was carried out. A higher coefficient of variation indicates a greater degree of trait dispersion and higher phenotypic diversity within the population. The average phenotypic differentiation coefficient was 66.87% for P. axillaris, 40.77% for P. chrysandra, 40.31% for P. hainanensis, 48.18% for P. speciosa, 35.11% for P. kwangsiensis, and 5.02% for P. longicarpa. The phenotypic differentiation between populations was greater than that within populations for P. axillaris. For P. chrysandra, inter-population phenotypic differentiation was greater than intra-population differentiation. For P. speciosa, the phenotypic differentiation between inter-population and intra-population was not obvious. For P. hainanensis, P. kwangsiensis, and P. longicarpa, the primary variation originates from within populations. Among the traits, the phenotypic differentiation coefficients for leaf length were generally small, and those for wing length, wing width, and seed weight were large.
3.5 Correlations between leaf phenotypes and geoenvironmental factors in Polyspora
Through the autocorrelation analysis of 33 geoenvironmental factors, 18 environmental factors were ultimately retained to form a matrix of explanatory variables. The results of the RDA of the two matrices showed (Figure 3) that the first two sorting axes basically explained all the leaf phenotypic variation (cumulative explanation degree 99.99%). The degree of explanation of each type of factor was as follows: bioclimatic factor (42.24%) > UV factor (33.14%) > geographic factor (14.57%) > soil factor (7.73%) > drought factor (1.30%) > topographic factor (0.85%) > vegetation factor (0.17%). Among the individual geoenvironmental factors, the factor with the most explanations is latitude (lat.), annual temperature difference (bio7), seasonal variation in ultraviolet radiation (uvb2), lowest monthly mean ultraviolet radiation (uvb4), coldest monthly mean temperature (bio6), and the sum of the highest seasonal monthly mean ultraviolet radiation (uvb5), which are the six indicators that have the greatest influence on Axis 1, with correlation coefficients |r| exceeding 0.5. Among them, latitude, annual temperature difference, and seasonal variation in UV radiation were strongly positively correlated with leaf area, and the sum of the lowest monthly mean UV radiation, the coldest monthly mean temperature, and the highest seasonal monthly mean UV radiation were strongly negatively correlated with leaf area. In the four quadrants, the intraspecific populations of each species were more aggregated, and the selection of different species on geoenvironmental factors showed more obvious species differentiation, suggesting that the species’ own genetic factors also had a greater influence on leaf phenotypes.
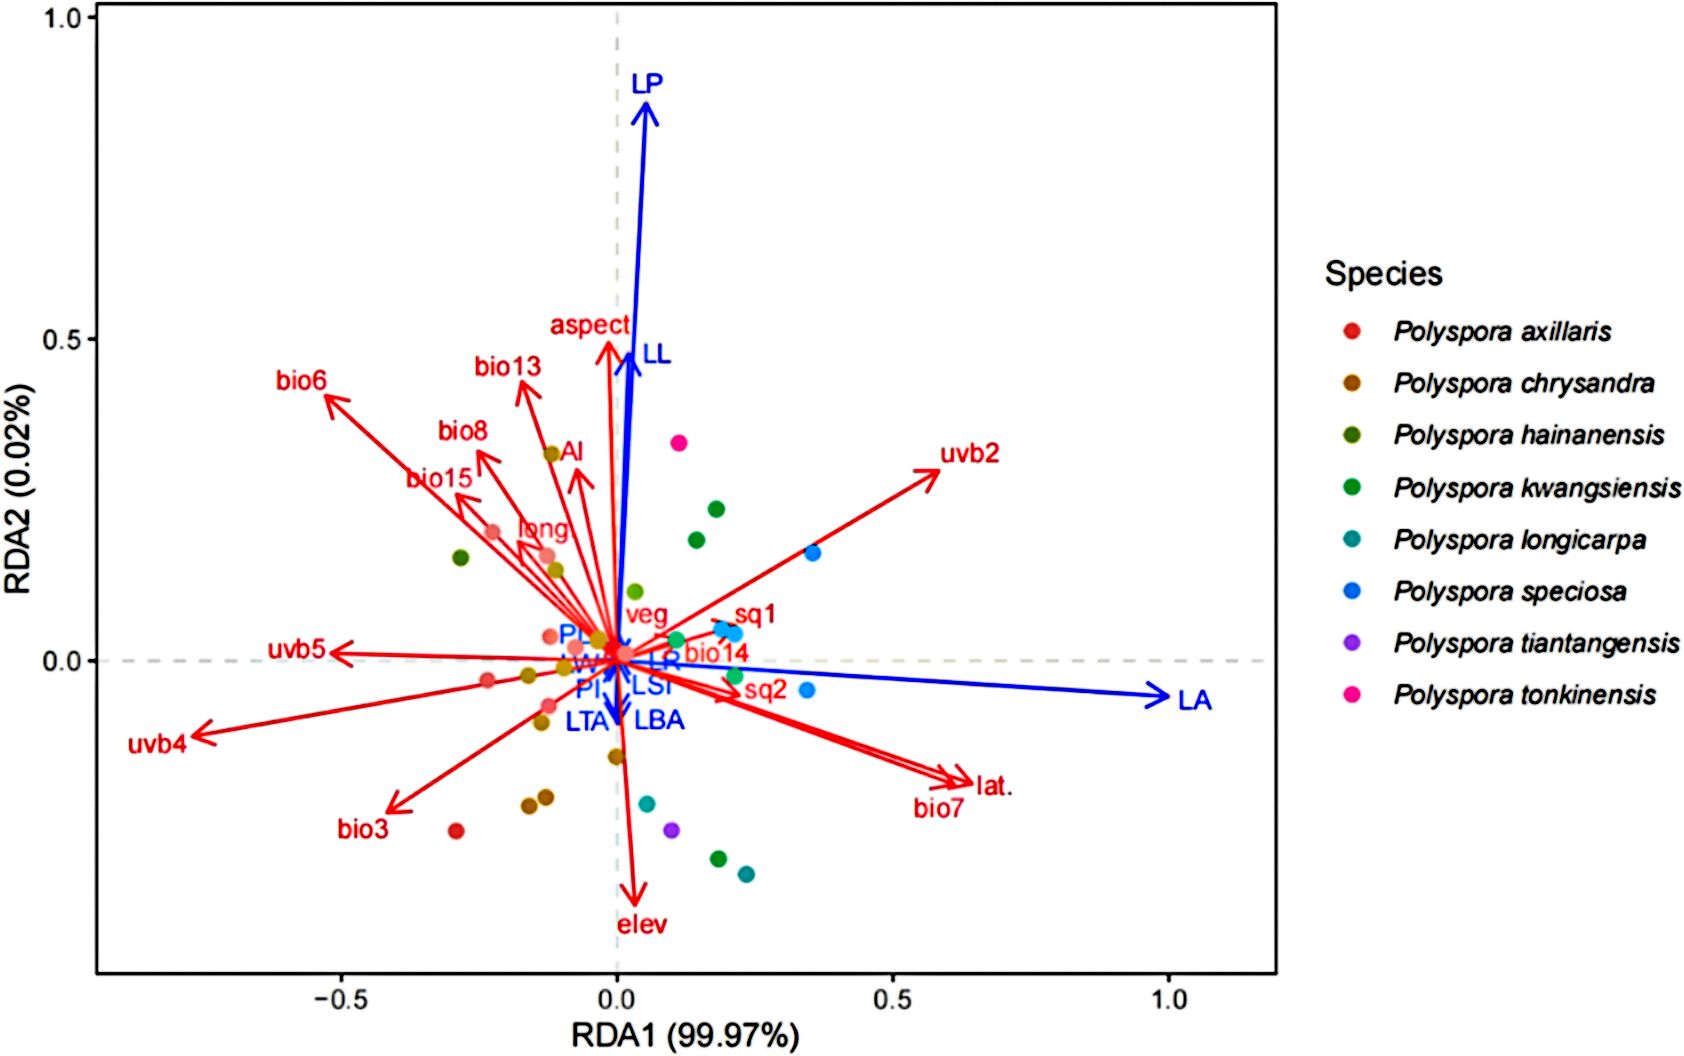
Figure 3. RDA of leaf phenotypic traits and geographic environmental factors in Polyspora. Environmental factors used in RDA analysis include: (bio03)Isothermality, (bio06) Min Temperature of Coldest Month, (bio07)Temperature Annual Range, (bio08) Mean Temperature of Wettest Quarter, (bio13) Precipitation of Wettest Month, (bio14) Precipitation of Driest Month, (bio15) Precipitation Seasonality, (uvb2) Seasonal variation of ultraviolet radiation, (uvb4) Minimum monthly average UV, (uvb5)sum of maximum monthly UV, (Elev) Elevation, Aspect, (sq1)Soil nutrient availability, (sq2)Soil nutrient retention capacity, (AI)Aridity index, (Veg) Vegetation types, (long.) Longitude, (lat.)Latitude.
3.6 Geographic clustering of phenotypic traits in the Polyspora
Geographic clustering analysis was carried out on 8 P. axillaris plant populations based on 19 leaf and seed phenotypic traits (Figure 4). At an Euclidean distance of 15, the eight populations were partitioned into two distinct branches. In particular, the Dangan Island Zhuhai Group (DGD), the Yantian Group of Shenzhen (YT), the Jiexi Group of Jieyang City (JXDT), and the Xiangzhou Group of Zhuhai City (XZ) were clustered into Branch I. Correspondingly, the Ledong Group of Hainan Province (LDHN), the Taishan Group of Jiangmen City (TS), the Yangchun Group of Yangjiang City (YC), and the Zijin Group of Heyuan City (ZJ) were clustered into Branch II. The results of geographical clustering analysis of 8 Polyspora populations were generally consistent with the longitudinal variation trends of leaf and seed phenotypic traits. Clade I is located in the eastern part of Guangdong, Province, which has larger longitudes and relatively smaller leaves. Clade II, with the exception of the Zijin group, is distributed in the western part of Guangdong Province, which exhibits smaller longitudes and relatively larger leaves.
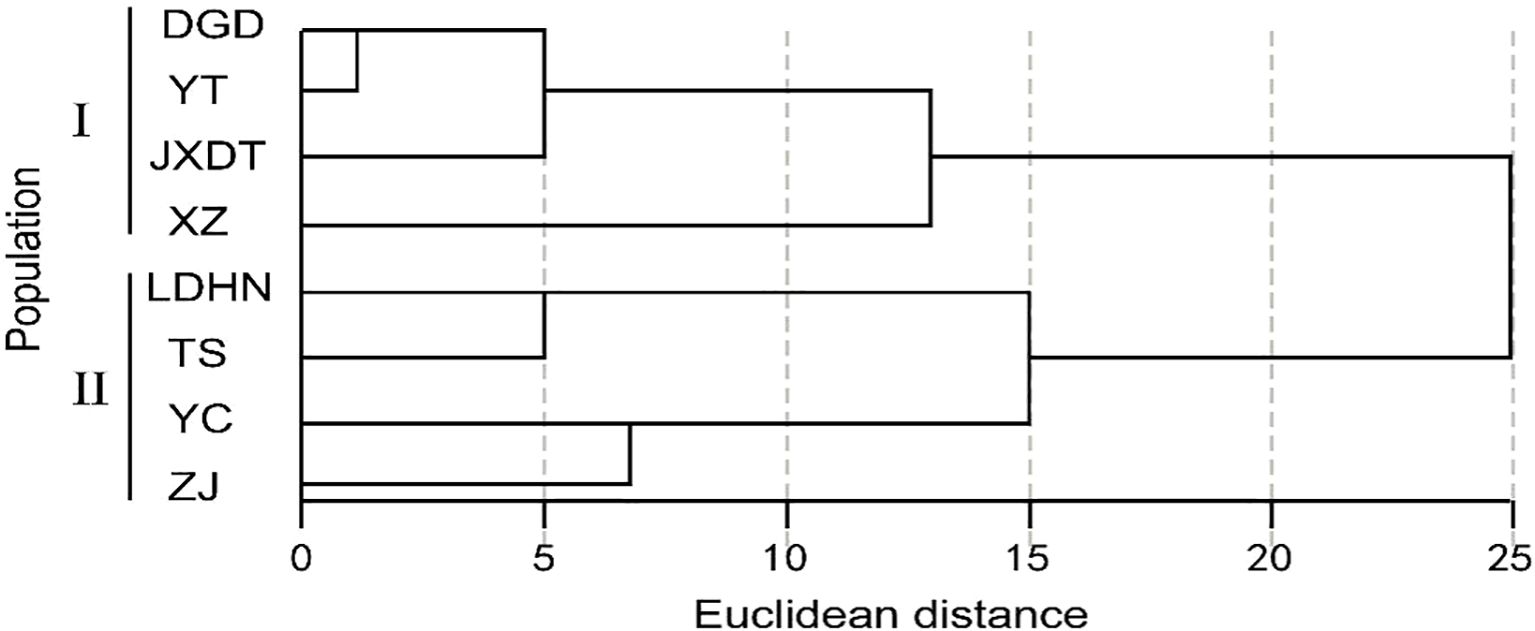
Figure 4. Clustering map of P. axillaris populations based on leaf, fruit and seed traits. The letters represent the colony codes of the collection sites, which correspond to the site information listed in Supplementary Table S1.
The geographical clustering of P. chrysandra based on 31 phenotypic traits reveals that, at an Euclidean distance of 16, five populations in south-central Yunnan (Shiping, Xinping, Wenshan, Simao, Fengqing) are clustered into one group, whereas the other five populations do not cluster according to geographical distribution (Figure 5). It is indicated that there exists discontinuity in the overall phenotypic variation of P. chrysandra, and the phenotypic traits of populations in central, southeastern, and southern Yunnan are relatively similar.
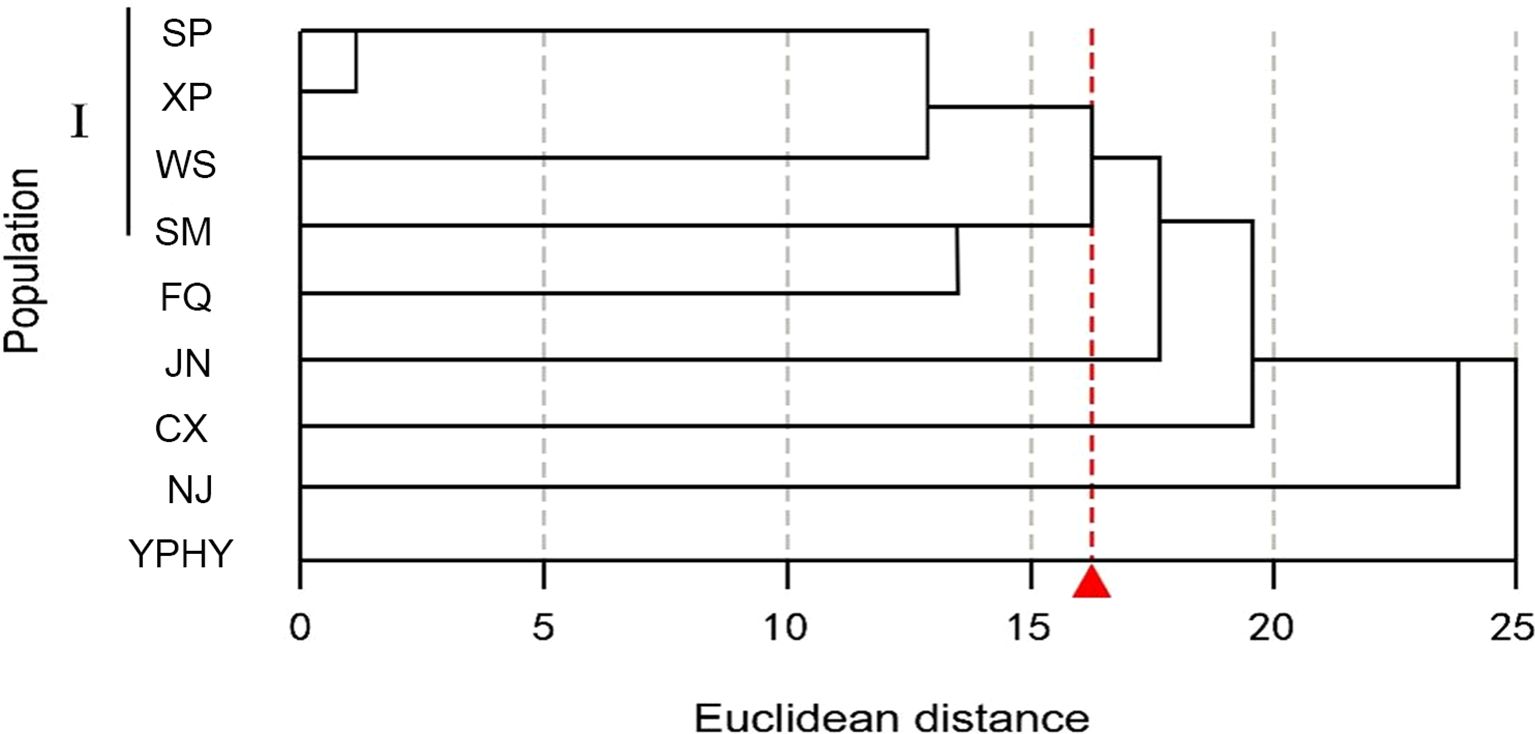
Figure 5. Geographical cluster analysis of P. chrysandra based on phenotypic traits. The letters represent the colony codes of the collection sites, which correspond to the site information listed in Supplementary Table S1.
Geographic clustering analyses of phenotypic traits were not performed for the remaining six species due to the small number of populations and close proximity of P. hainanensis, P. longicarpa, P. tiantangensis, P. speciosa, P. kwangsiensis and P. tonkinensis.
3.7 Morphology-based phylogenetic analyses of the Chinese Polyspora
The Bayesian phylogenetic tree based on 15 morphological traits showed that two nodes were strongly supported, with the basal taxon being P. hainanensis, the tropical component of the Polyspora in China, P. speciosa, P. tonkinensis, and P. kwangsiensis, with the three species forming a weak sister (Clade 1); P. tiantangensis and P. longicarpa, diverged later and formed a sister relationship between the two (Clade 2); and all the other nodes of the morphological phylogenetic tree presented a visual rate of less than 0.5 (Figure 6).

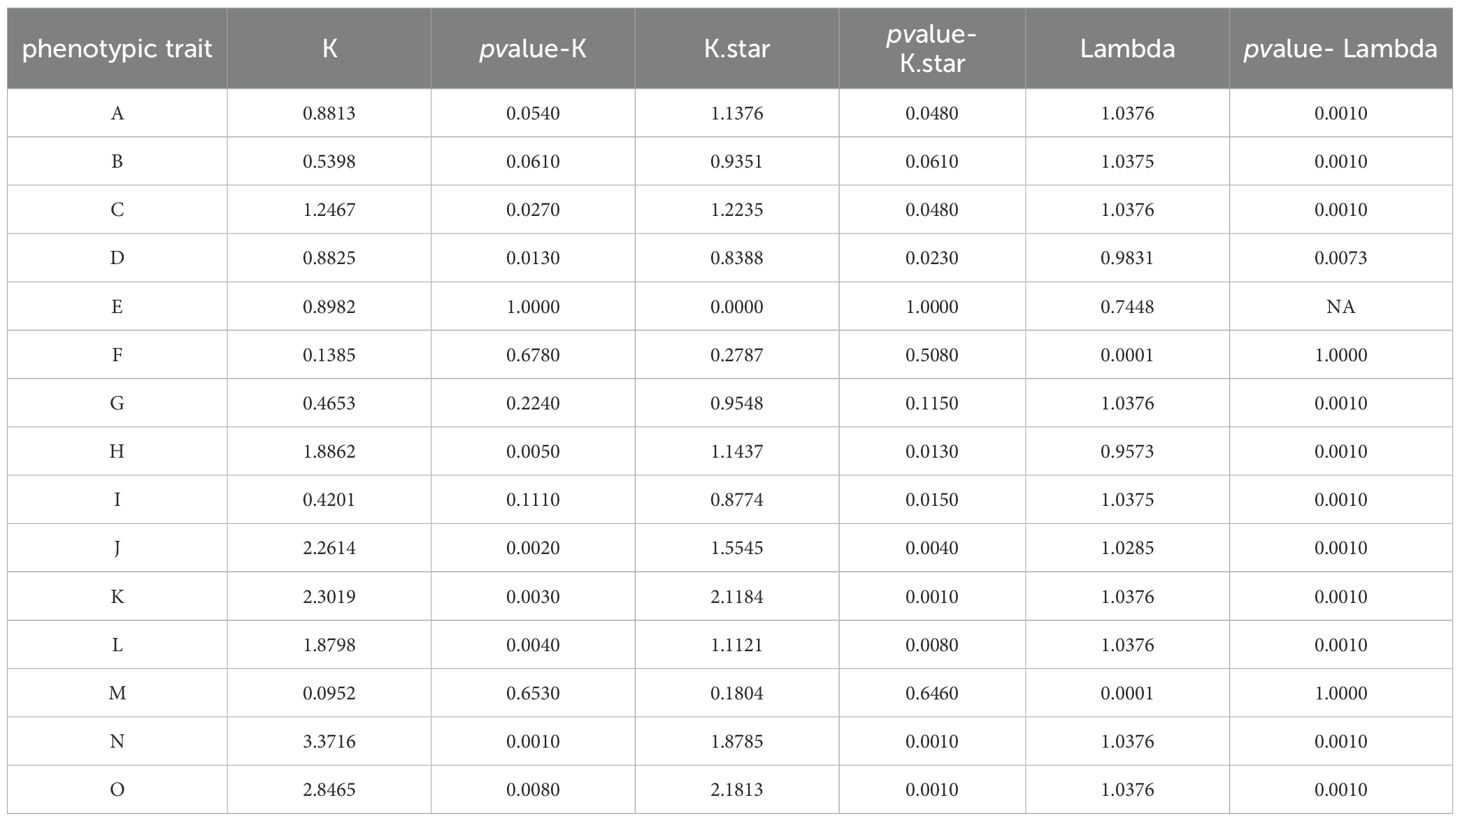
Figure 6. Phylogeny of the Chinese Polyspora based on morphology. (A–O) are the codes for each morphological trait. (A) Spray, (B) terminal bud, (C) leaf length, (D) Leaf petiole length, (E)Leaf back, (F) Leaf margin, (G)Leaf texture, (H) Flower diameter, (I) Flower stalk length, (J) style length, K sepal length,(L)bract number, (M) ovary chamber number, (N) capsule length, (O) seed wing length.
The K values of phylogenetic signal strengths for 15 morphological traits of 8 domestically produced species of the Polyspora were calculated by the Blomberg method, and the results are shown in Table 5. Significant phylogenetic signals were detected for style length, sepal length, capsule length, and wing length (K>>1, p < 0.05); flower diameter, leaf length, and bract number also had some spectral signals.
4 Discussion and conclusion
4.1 Characteristics of phenotypic variation in Polyspora
Phenotypic traits are an important basis for identifying germplasms, conserving species diversity and selecting and breeding new varieties (Duan, 2020), maintaining both stability and variability (Zhang et al., 2019), and being affected by both the species’ own genetic material and the ecological environment (Wang et al., 2019). In general, a coefficient of variation of more than 10% is considered to indicate a large trait difference (Li et al., 2019b; Dong et al., 2020). Multivariate statistical analyses of a total of 31 traits of leaves, flowers, fruits and seeds of eight species of the Polyspora, showed that the species of Polyspora differed significantly between and within species, and were rich in phenotypic variability. The mean coefficient of variation for leaf traits was 24%, that for flower phenotypes was 11.98%, and that for fruit and seed traits was 17.49%; these values were all greater than 10%. Among the leaf traits, the coefficient of variation for the leaf apical angle was the highest, with a mean value of 35.76%. The leaf shape of the Polyspora shows a high variability (obovate, lanceolate, oblong, narrow-oblong, etc.). The leaf tip is strongly affected by the leaf shape, which manifests as acuminate, acute, slightly concave, convex, rounded or obtuse among the different species and groups; this is the main factor leading to the large variation in the angle of the tip of the leaf (Figure 7). Typically, phenotypic variation in nutritional traits is more influenced by the environment than that in reproductive traits, which are relatively stable. A comparison of the phenotypic variation among leaves, flowers and fruits revealed that the results of the present study also confirmed this pattern. The capsule is cylindrical and dehiscent at maturity, and the seed has a terminal wing that exceeds the length of the seed itself; these are the most obvious characteristics that distinguish the Polyspora from the rest of Theaceae.
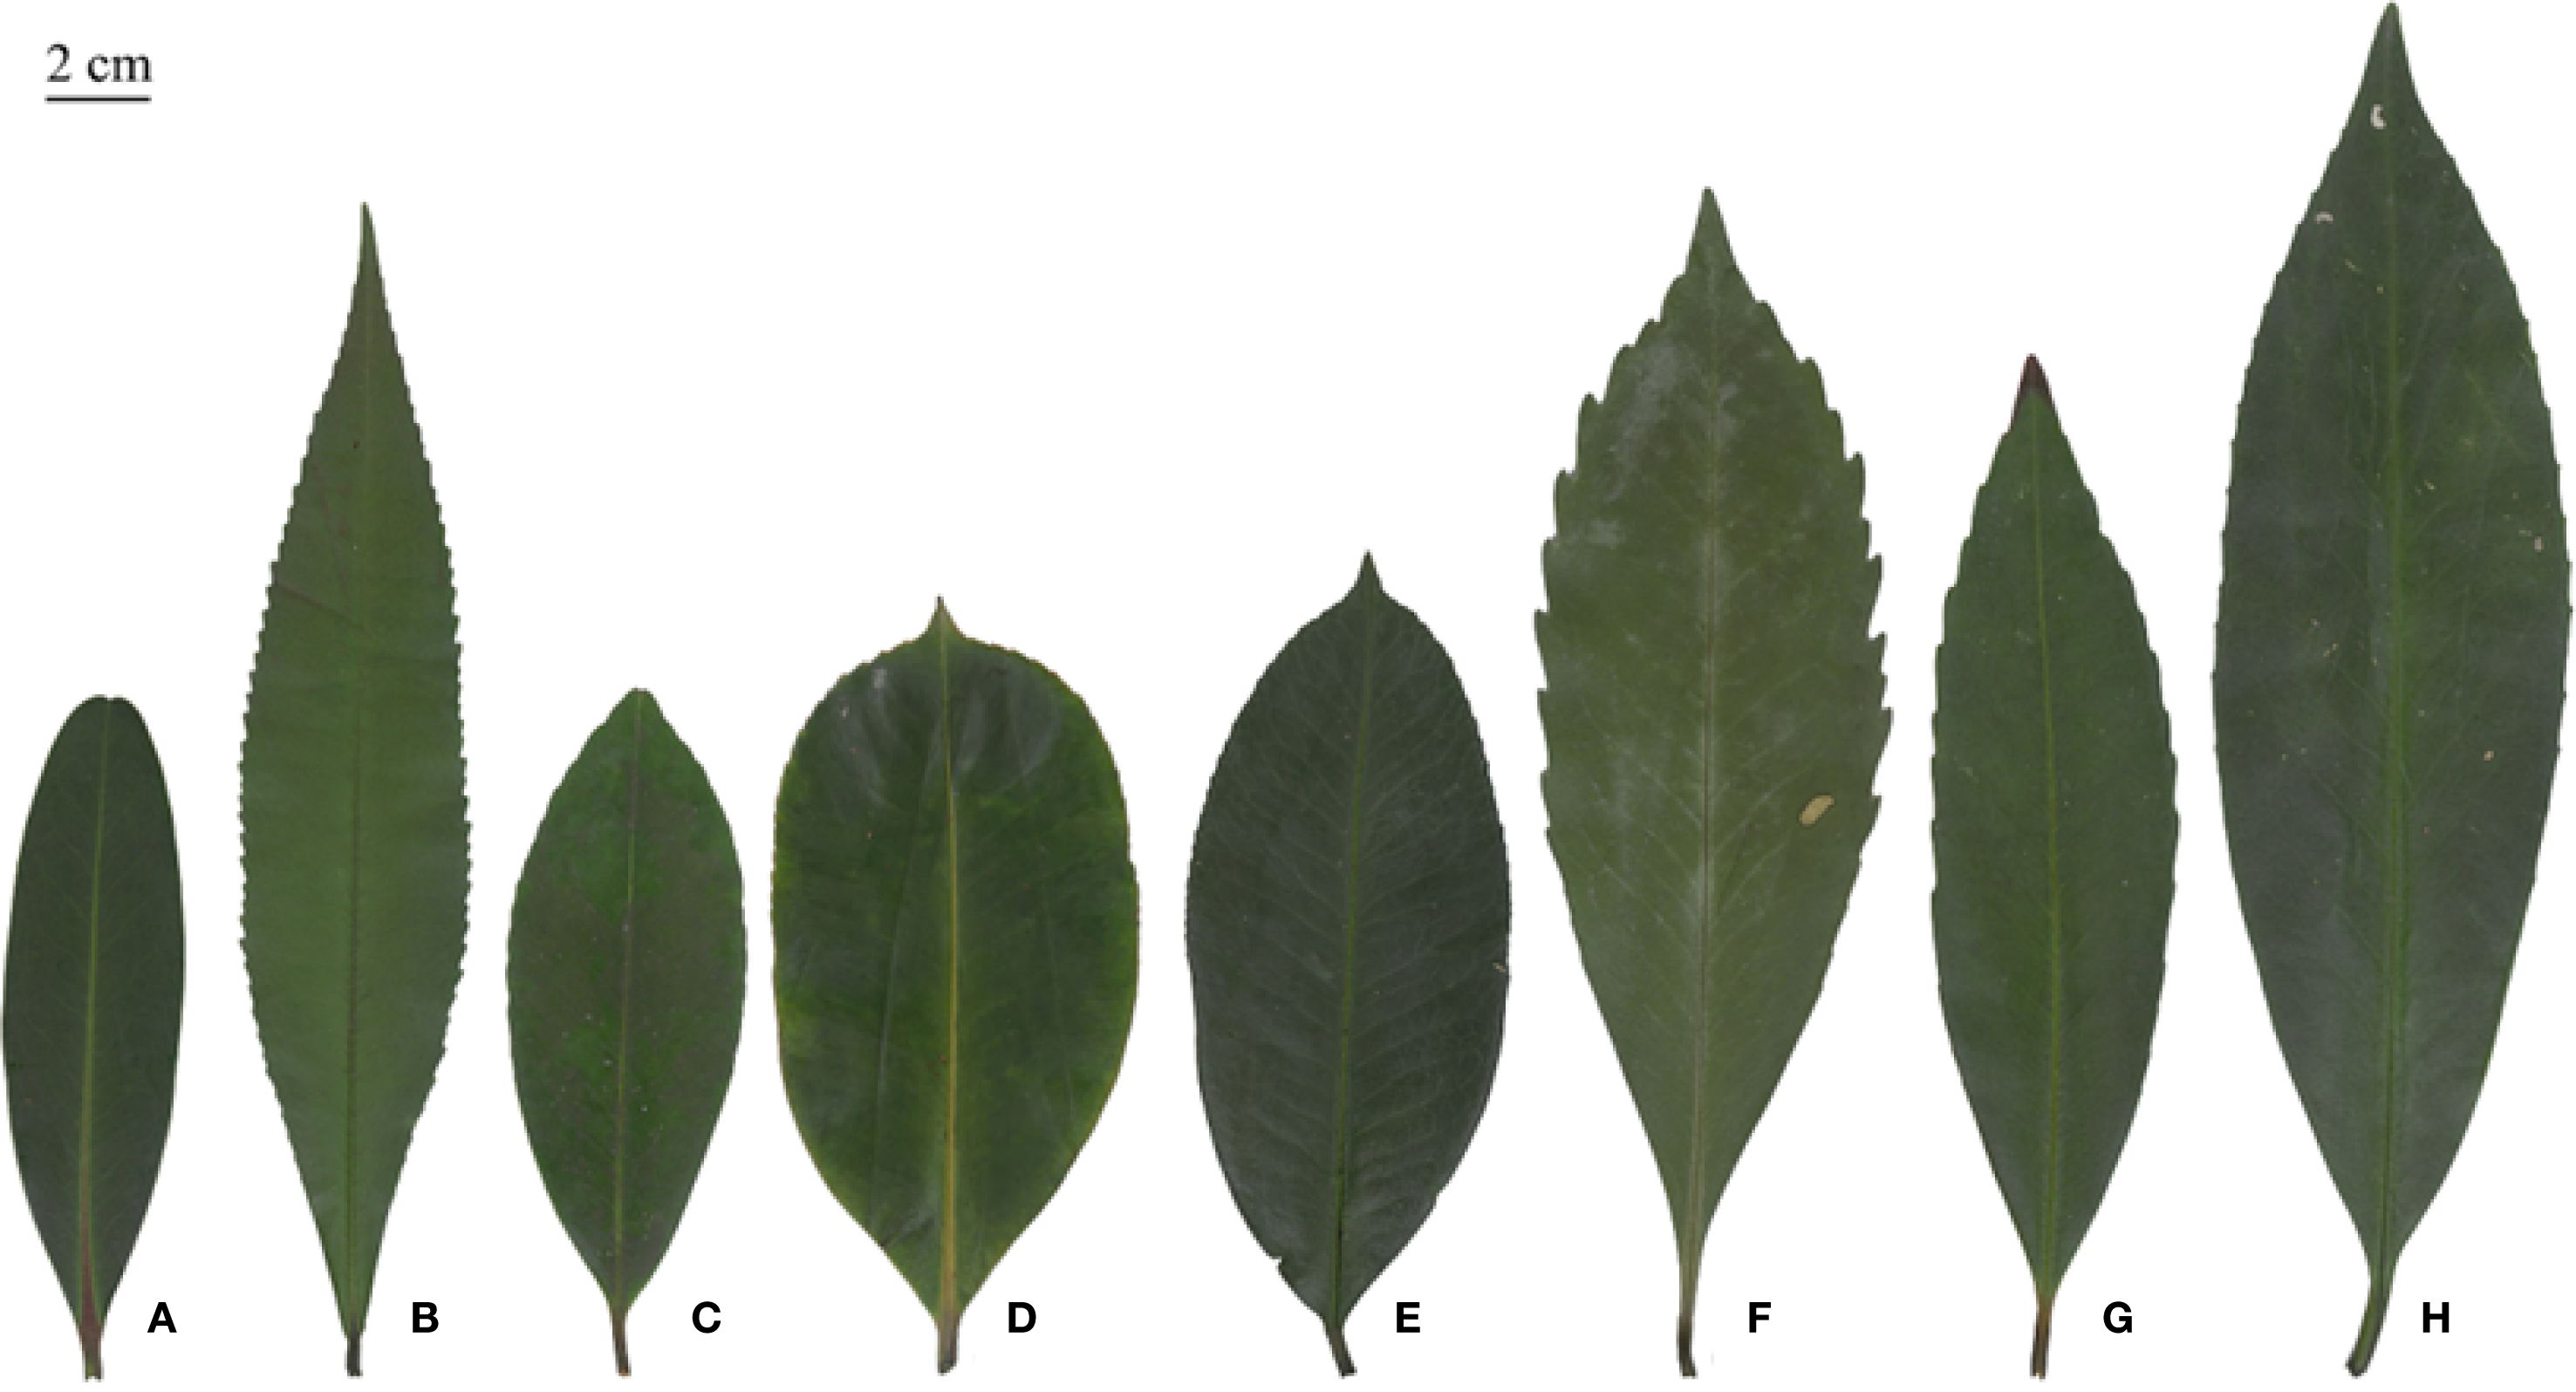
Figure 7. Typical leaf morphology of Polyspora species. (A) P. axillaris, (B) P. hainanensis, (C) P. chrysandra, (D) P. longicarpa, (E) P. tiantangensis, (F) P. speciosa, (G) P. tonkinensis, (H) P. kwangsiensis. All leaf images are original photographs of experimental samples.
The results of the phenotypic differentiation study showed that the phenotypic differentiation of most species of Polyspora occurred mainly within the population. The fact that insect-pollinated plants have shorter pollen dispersal distances compared to wind-pollinated plants, making intergroup gene exchange more difficult, may explain the constraints on intergroup genetic differentiation. This leads to the phenomenon where most species are predominantly phenotypically differentiated within their groups. In addition, the seeds of this genus are flattened and winged in the upper part, and the seeds are lighter; these conditions are suitable for wind propagation, and, to a certain extent, can also promote intergroup gene exchange, thus leading to a greater degree of intergroup differentiation in some species. The phenotypic differentiation of P. axillaris mainly occurs via intergroups, and the nonsignificant differences in phenotypic differentiation between and within P. speciosa provide good evidence of this feature.
The ovaries of Polyspora are usually 5-loculed, and the capsule splits into 5 valves at maturity. The main characteristic of P. tiantangensis that distinguishes it from P. longicarpa is that the ovary contains 6–8 cells (Deng and Fan, 1999). During field surveys, P. longicarpa capsules with 3, 4 and 6 valves were found on Dangang Island (DGD), Fenghuang Mountain (XZ) and Dabei Mountain (JXDT); P. chrysandra capsules with 3, 4 and 6 valves were found in Jinning District of Kunming City (JN) and Yongping County of Dali Prefecture (YPHY); and P. longicarpa capsules with 6 and 7 valves were found on Baotai Mountain of Yongping County of Dali Prefecture (YPCG). In particular, the P. speciosa group in Jinxiu County, Laibin city, Guangxi Province (JXSC), has 6- and 7-valved capsules, whereas conventional 5-valved capsules are rare (Figure 8). Among the 4,600 fruits observed in 23 populations of Polyspora, 5-lobed fruits composed the overwhelming majority of the fruits, but 3, 4, 6, 7, and 8 lobed fruits were produced by different species. These findings are not unique to P. tiantangensis, and the reasons for the differentiation of ovaries and the number of fruits with 5-lobed fruits need to be further investigated. The results of both leaf and fruit morphology studies support the idea that P. tiantangensis is an intraspecific variant of P. longicarpa, but as molecular biology has become an essential tool in plant taxonomy, the relationship between the two species needs to be further determined in combination with subsequent molecular data.
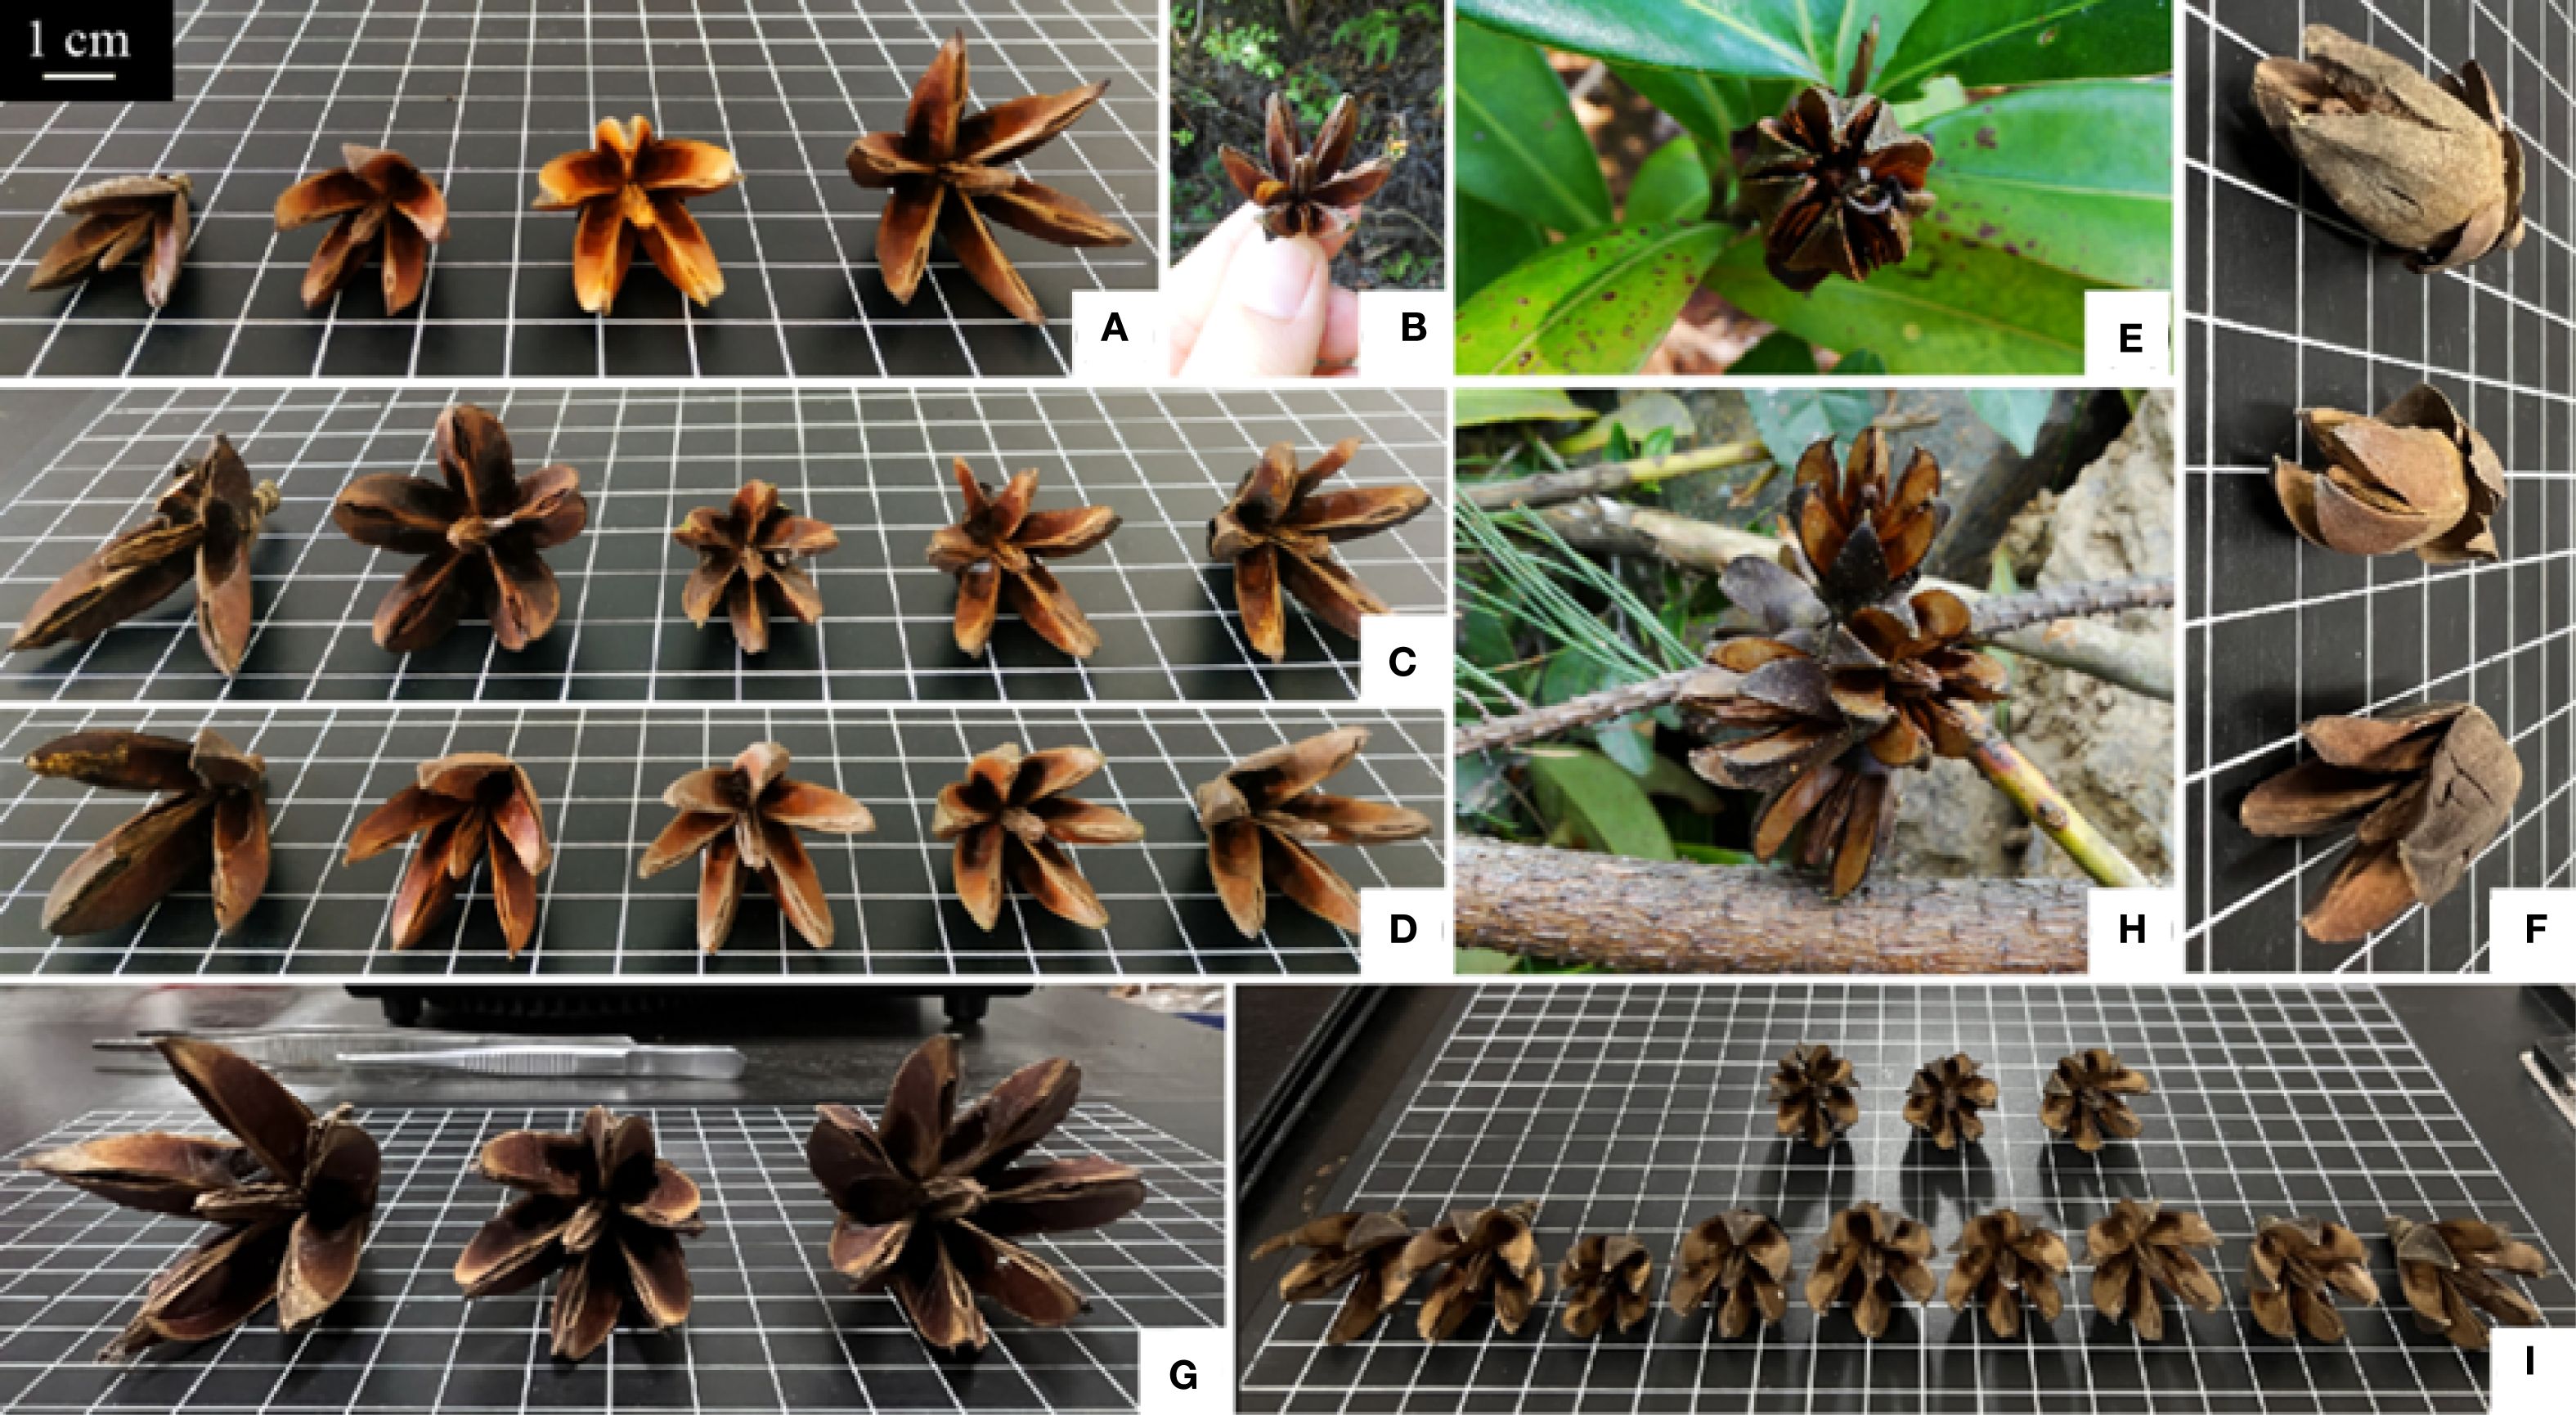
Figure 8. Capsule dehiscence of Polyspora. (A) P. axillaris in Dangan island, Zhuhai city, (B) P. axillaris in Meishajian, Shenzhen city, (C) P. axillaris in Jianyang county, Jiexi city, (D) P. axillaris in Fenghuang mountain, Zhuhai city, (E) P. chrysandra in Jinning county, Kunming city, (F) P. chrysandra in Yongping county, Dali city, (G) P. longicarpa in Yongping county, Dali city, (h/i) P. speciosa in Jinxiu county, Laibin city; Base plate grid is 1 cm×1 cm. All Capsule dehiscence of Polyspora images are original photographs of experimental samples.
4.2 Environmental adaptations of leaf phenotypic traits in the Polyspora
Plant traits are the result of interactions between gene expression and environmental factors over a long period of evolution (Osada et al., 2015). A phenotype is a combination of various morphological traits and is a direct expression of biological genetic variation (Rosique-Esplugas et al., 2022; Yuan et al., 2023). Changes in growth space and the environment can promote phenotypic adaptive responses in species (Morales et al., 2018; Neves et al., 2020). When phenotypes are associated with environmental gradients, these responses are often elicited by local adaptation, phenotypic plasticity, etc., and can influence gene flow and distribution patterns (Wanderley et al., 2018). Nutritional traits are often subject to greater environmental selection pressures than reproductive traits. Leaves are the main organs of plants for photosynthesis and material production, they have the largest contact area with the external environment, and are the most sensitive to environmental changes (Xu et al., 2023). Leaf traits are the product of long-term adaptive evolution of plants in specific habitats, they directly affect the basic functions of plants and directly reflect their survival strategies (Klich, 2000), and are often used to monitor environmental changes (Ram et al., 2015).
Plant leaf shape and size may have different patterns of variation across taxa, with shape generally being conserved and variation usually caused by its own genetic material; however, size is considered to be highly variable, and variation is influenced mainly by the environment (i.e., phenotypic plasticity) (Chitwood et al., 2013; Maestri et al., 2016). Leaves of plants in arid, high-latitude, and high-altitude regions are small in size, whereas those in high-humidity, hot, and sunny regions are large in size (Wright et al., 2017). Among the 10 leaf morphological indices used in this study, 5 reflect leaf shape and the remaining 5 reflect leaf size. Specifically, the indices related to leaf shape include leaf shape index, petiole index, leaf base angle, leaf tip angle, and leaf roundness, while the remaining 5 indices are associated with leaf size. The average coefficient of variation of leaf shape was 23.61%, the average coefficient of variation of leaf size was 24.40% in Polyspora domestica, and the leaf phenotypic variation of each species was influenced by its own genetic factors and geographical environment.
Plants in unfavorable environments improve their ability to access resources by moderately altering leaf morphology (Feng et al., 2021). Among the geoenvironmental factors, isothermality (bio3), the lowest monthly mean UV radiation (uvb4) and the sum of the highest seasonal monthly mean UV radiation (uvb5) were significantly negatively correlated with most of the leaf phenotypic indices of Polyspora. These findings reflect the resistance response and environmental adaptation of Polyspora leaves and the small size of Polyspora leaves in areas with strong UV radiation, relative dryness, and coldness. Latitude (lat.), seasonal variation in ultraviolet radiation (uvb2), and annual temperature range (bio7) exhibited a significant positive correlation with most leaf phenotypic traits. This unusual pattern is primarily attributed to the four populations of P. speciosa distributed in the vicinity Chongqing. These populations are distributed at the highest latitudes, with the most significant variations in temperature and ultraviolet radiation. Furthermore, P. speciosa possesses the largest leaves among domestic Polyspora species, a feature that contributes to this phenomenon. This characteristic is presumably determined by the species’ inherent genetic material. Temperature factors such as isothermality (bio3), mean coldest monthly temperature (bio6) and annual temperature difference (bio7) were strongly correlated with leaf traits, whereas rainfall-related factors were not strongly correlated with leaf shape. In addition to rainfall, temperature was the key factor influencing the variation in leaf traits in Cunninghamia lanceolata, a widely spread timber tree species in southern China (Xu et al., 2023). These findings are consistent with the results of studies of fir (Cunninghamia lanceolata), a widely distributed timber tree species in southern China, and Litsea coreana var. sinensis, which is also a dominant component of broadleaf evergreen forests (Pan et al., 2020). Generally, most of the bioclimatic factors were not strongly correlated with the leaf phenotypes of Polyspora, and the leaf phenotypic variation in Polyspora was the result of the joint influence of its own genetic material and geoenvironmental factors; moreover, the two types of factors played comparable roles.
Plants are often exposed to incident photons of ultraviolet radiation (UV-B, wavelength 280–315 nm) when they are searching for light for photosynthesis (Shinkle et al., 2022). Although these photons represent only 0.5% of the solar radiation that reaches the biosphere (Blumthaler, 1993), UV radiation has a significant effect on plants, causing morphological changes in plants (Jenkins, 2009). UV radiation rapidly induces gene regulation, leading to cumulative changes in plant physiology and morphology, but the resulting morphological changes are slow, suggesting that the transgenerational effects of solar shortwave UV radiation may contribute to plant adaptation through morphological traits (Yan et al., 2020). Leaves are considered the most important target organ for UV radiation in plants (Verdaguer et al., 2012). Plants protect sensitive tissues from UV-B radiation by reflecting UV photons from the leaf surface by thickening the cuticle, waxy layer, trichomes and altering the optical properties of the cells and other structures (Jenkins, 2009; Robson et al., 2019). In this study, UV radiation ranked second among the factors explaining the association between UV radiation and leaf phenotypes. Additionally, the sum of the lowest monthly mean UV radiation (uvb4) and the highest seasonal monthly mean UV radiation (uvb5) showed a significant negative correlation with most leaf morphological traits, indicating that the leaves of Polyspora species are highly sensitive to UV radiation. Most of the species in the strong UV-B radiation zone had thick leathery leaves, suggesting that Polyspora adapts to UV radiation stress mainly by changing the structure of the leaf epidermis to protect chloroplastic tissues. RDA and CA showed that leaf area was strongly negatively correlated with two UV factors (uvb4 and uvb5), i.e., the leaf area decreased with increasing UV radiation, which was supported by the fact that the leaf area of six woody species of Mediterranean sclerophyllous evergreen forests was negatively correlated with the sum of the highest seasonal monthly mean UV radiation (uvb5). This phenomenon was confirmed by physiological experiments with six woody plants from a Mediterranean sclerophyllous evergreen forest, which showed that UV radiation leads to an increase in the thickness of leaf fenestration tissue, a reduction in leaf area, and an increase in leaf weight per unit area, which in turn protects photosynthetic structures and nucleic acids from damage (Verdaguer et al., 2012).
In addition to the leaf phenotype, the body size of plants in Polyspora is also good for adapting to the environment. In tropical rainforests and monsoon evergreen broad-leaved forests, P. axillaris can grow into trees up to 10 m high, whereas on the windward slopes of Zhuhai Gaolan Island and Tandang Island, P. axillaris can transform into low bushes due to the influence of typhoons, which is a better reflection of phenotypic plasticity.
Due to the limitations of material and data volume, this study explored only the relationships between leaf morphological traits and geographic environmental factors, and preliminarily revealed the geographic variation pattern of leaf phenotypes in the Polyspora, as well as the main environmental factors affecting leaf phenotypic variation. However, the adaptive evolution of leaves is achieved mainly by leaf function. Subsequent studies should investigate the physiological traits (e.g., photosynthetic capacity, dark respiratory capacity), structural traits (e.g., fenestrated tissues, specific leaf weight), and chemical traits (e.g., nitrogen and phosphorus contents) of leaves in Polyspora species. Such studies would aim to link leaf morphological traits with functional traits, analyze the leaf economic spectrum of Polyspora species, explore the relationships between leaf functional traits and the environment, and ultimately elucidate the evolution of leaf adaptive strategies and the mechanisms underlying their interaction with the environment.
Data availability statement
The original contributions presented in the study are included in the article/Supplementary Material. Further inquiries can be directed to the corresponding author.
Ethics statement
This study was conducted in accordance with the relevant guidelines and legislation of the People’s Republic of China and international authorities.
Author contributions
CM: Writing – review & editing. MG: Writing – original draft. QG: Writing – review & editing. ZF: Investigation, Writing – review & editing. JY: Investigation, Writing – review & editing. LW: Software, Writing – review & editing. LD: Data curation, Writing – review & editing.
Funding
The author(s) declare financial support was received for the research and/or publication of this article. This study was supported by grants from the Joint Special Project on Basic Agricultural Research in Yunnan Province (Grant No. 202301BD070001-150), the Key Laboratory of Forest Resources Conservation and Utilization in Southwest Mountains of China Ministry of Education (Southwest Forestry University), The Yunnan Provincial Key Laboratory for Conservation and Utilization of Inforest Resources, and The Key Laboratory of Biodiversity Conservation in Southwest China (National Forestry and Grassland Administration) (Grant No. LXXK-2023M05), the Yunnan Provincial Education Department Scientific Research Fund [grand numbers 2025Y0859]
Acknowledgments
We are grateful for the assistance provided by the forestry stations and nature reserve staff in various regions during the sampling process.
Conflict of interest
The authors declare that the research was conducted in the absence of any commercial or financial relationships that could be construed as a potential conflict of interest.
Generative AI statement
The author(s) declare that Generative AI was used in the creation of this manuscript. The author(s) verify and take full responsibility for the use of generative AI in the preparation of this manuscript.
Any alternative text (alt text) provided alongside figures in this article has been generated by Frontiers with the support of artificial intelligence and reasonable efforts have been made to ensure accuracy, including review by the authors wherever possible. If you identify any issues, please contact us.
Publisher’s note
All claims expressed in this article are solely those of the authors and do not necessarily represent those of their affiliated organizations, or those of the publisher, the editors and the reviewers. Any product that may be evaluated in this article, or claim that may be made by its manufacturer, is not guaranteed or endorsed by the publisher.
Supplementary material
The Supplementary Material for this article can be found online at: https://www.frontiersin.org/articles/10.3389/fpls.2025.1553671/full#supplementary-material
References
Beech, E., Barstow, M., and Rivers, M. (2017). The red list of Theaceae (UK: Botanic Gardens Conservation International).
Blomberg, S. P., Garland, T., and Ives, A. R. (2003). Testing for phylogenetic signal in comparative data: Behavioral traits are more labile. Evolution 57, 717–745. doi: 10.1111/j.0014-3820.2003.tb00285.x
Blumthaler, M. (1993). “Solar UV Measurements,” in UV-B Radiation and Ozone Depletion: Effects on Humans, Animals, Plants, Microorganisms, and Materials. Ed. Tevini, M. (Lewis Publishers, Boca Raton, Florida).
Chapin, F. S., Autumn, K., and Pugnaire, F. (1993). Evolution of suites of traits in response to environmental-stress. Am. Naturalist. 142, 78–S92. doi: 10.1086/285524
Chitwood, D. H., Ranjan, A., Martinez, C. C., Headland, L. R., Thiem, T., Kumar, R., et al. (2013). A modern ampelography: A genctic basis for leaf shape and venation patterning in grape. Plant Physiol. 164, 259–272. doi: 10.1104/pp.113.229708
Costa, J. C., Fracetto, G. G. M., Fracetto, F. J. C., Santos, M. V. F., and Lira Júnior, M. A. (2017). Genetic diversity of Desmanthus sp accessions using ISSR markers and morphological traits. Genet. Mol. Res. Gmr 16(2).. doi: 10.4238/gmr16029667
Deng, L. and Fan, G. S. (1999). A new species of genus gordonia. J. Trop. Subtropical Bot. (03), 193–194.
Dong, S. J., Wang, R. X., Zhang, H. K., Chen, J. H., Liu, L. X., Yu, Q. F., et al. (2020). Analysis on diversity of fruit phenotypic characters of Armeniaca mandshurica from different provenances. J. Plant Resour. Environ. 29, 42–50. doi: CNKI:SUN:ZWZY.0.2020-06-006
Duan, G. Z. (2020). Ecological divergence and population genetics of Picea mongolica its related species (Hohhot: Inner Mongolia Agricultural University).
Feng, J., Jiang, C., Tai, W., Zhu, S. F., Guo, P. P., Sun, X., et al. (2021). Functional traits of Fagaceae plants in shady and sunny slopes in karst degraded tiankeng. Chin. J. Appl. Ecol. 32, 2301–2308. doi: 10.13287/j.1001-9332.202107.021
Fu, H. Z., Li, C. J., Yang, J. Z., Chen, X. G., and Zhang, D. M. (2013). Triterpenoid glycosides from the stems of Gordonia kwangsiensis. Phytochemistry 85, 167–174. doi: 10.1016/j.phytochem.2012.08.019
Ge, S., Wang, M. P., and Chen, Y. W. (1988). An analysis of population genetic structure of masson bine by isozyme technique. Scientia Silvae Sinicae 24(4), 399–409.
Hao, L., Zhang, L., Zhang, G. S., Wang, Y., Han, S. J., Bai, Y. R., et al. (2017). Genetic diversity and population genetic structure of Salix psammophila. Acta Botanica Boreali-Occidentalia Sin. 37, 1507–1516. doi: 10.7606/j.issn.1000-4025.2017.08.1507
Jenkins, G. I. (2009). Signal transduction in responses to UV-B radiation. Annu. Rev. Plant Biol. 60, 407–431. doi: 10.1146/annurev.arplant.59.032607.092953
Khadivi, A., Safdari, L., and Hajian, M. H. (2019). Selection of the promising almond (Prunus amygdalus L.) genotypes among seedling origin trees. Scientia Hortic. (256), 108547. doi: 10.1016/j.scienta.2019.108587
Khadivi-khuband, A. and Anjam, K. (2014). Morphological characterization of Prunus scoparia using multivariate analysis. Plant Systematics Evol. 300, 1361–1372. doi: 10.1007/s00606-013-0967-7
Klich, M. G. (2000). Leaf variations in Elaeagnus angustifolia related to environmental heterogeneity. Environ. Exp. Bot. 44, 171–183. doi: 10.1016/S0098-8472(00)00056-3
Li, Y., Cao, S. Y., Lin, S. J., Zhang, J. R., Gan, R. Y., Li, H. B., et al. (2019a). Polyphenolic profile and antioxidant capacity of extracts from Polyspora axillaris fruits. Antioxidants 8, 150. doi: 10.3390/antiox8060150
Li, H. L., Hu, W. B., Hong, Q. M., Pu, W. H., He, Y., Zhang, D. X., et al. (2019b). Genetic diversity analysis of fruit traits of hylocereus undatus Germplasm Resources. J. Trop. Subtropical Bot. 27, 432–438. doi: 10.3390/antiox8060150
Maestri, R., Fornel, R., Gonçalves, G. L., Geise, L., and Freitas, T. R. O. D. (2016). Predictors of intraspecific morphological variability in a tropical hotspot: Comparing the influence of random and non-random factors. J. Biogeography 43, 2160–2172. doi: 10.1111/jbi.12815
Morales, A., Curiel, M. D. L. M., and Piñero, D. (2018). Spatial and environmental factors predict skull variation and genetic structure in the cosmopolitan bat Tadarida brasiliensis. J. biogeography 45, 1529–1540. doi: 10.1111/jbi.13243
Neves, B., Zanella, C. M., Kessous, I. M., Uribbe, P. F., Salgueiro, F., Bered, F., et al. (2020). Drivers of bromeliad leaf and floral bract variation across a latitudinal gradient in the Atlantic Forest. J. Biogeography 47, 261–274. doi: 10.1111/jbi.13746
Oliveira, E. J. D., Dias, N. L. P., and Dantas, J. L. L. (2012). Selection of morpho-agronomic descriptors for characterization of papaya cultivars. Euphytica 185, 253–265. doi: 10.1007/s10681-011-0565-0
Osada, N., Nabeshima, E., and Hiura, T. (2015). Geographic variation in shoot traits and branching intensity in relation to leaf size in Fagus crenata: A common garden experiment. Am. J. Bot. 102, 878–887. doi: 10.3732/ajb.1400559
Pan, J., Fan, X., Luo, S., Zhang, Y. Q., Yao, S., Guo, Q. Q., et al. (2020). Predicting the potential distribution of two varieties of Litsea coreana (Leopard-Skin Camphor) in China under climate change. Forests 11, 1159. doi: 10.3390/f11111159
Ram, S. S., Majumder, S., Chaudhuri, P., Chanada, S., Santra, C. S., Chakreborty, A., et al. (2015). A review on air pollution monitoring and management using plants with special reference to foliar dust adsorption and physiological stress responses. Crit. Rev. Environ. Sci. Technol. 45, 2489–2522. doi: 10.1080/10643389.2015.1046775
Robson, T. M., Aphalo, P. J., Banaś, A. K., Barnes, W. P., Brelsford, C. C., Jenkins, I. G., et al. (2019). A perspective on ecologically relevant plant-UV research and its practical application. Photochemical Photobiological Sci. 18, 970–988. doi: 10.1039/c8pp00526e
Rosique-Esplugas, C., Cottrell, J. E., Cavers, S., Whittet, R., and Ennos, A. R. (2022). Clinal genetic variation and phenotypic plasticity in leaf phenology, growth and stem form in common ash (Fraxinus excelsior L.). Forestry 95, 83–94. doi: 10.1093/forestry/cpab026
Shinkle, J., Nebhut, A., Semro, M., and Worley, C. (2022). Natural shortwave UV-B radiation increases UV absorbing pigments levels in Texas native grasses Chasmanthium latifolium and Bouteloua curtipendula. bioRxiv. doi: 10.1101/2022.12.30.519826
Tang, J. (2013). Studies on the Chemical Constituents and Biological Activities of P. longicarpa & Synthesis and Biological Activities of Claulansine F (Beijing: Peking Union Medical College), 1–81.
Verdaguer, D., Llorens, L., Bernal, M., and Badasa, J. (2012). Photomorphogenic effects of UVB and UVA radiation on leaves of six Mediterranean sclerophyllous woody species subjected to two different watering regimes at the seedling stage. Environ. Exp. Bot. 79, 66–75. doi: 10.1016/j.envexpbot.2012.01.008
Wanderley, A. M., MaChado, I. C. S., Almeida, E. M., Almeida, E. M. D., Felix, L. P., Galetto, L., et al. (2018). The roles of geography and environment in divergence within and between two closely related plant species inhabiting an island-like habitat. J. Biogeography 45, 381–393. doi: 10.1111/jbi.13137
Wang, N., Niu, L. X., and Zhang, Y. L. (2019). Phenotypic diversity of acer truncatum natural populations in China. Northern Horticulture (08), 90–96. doi: CNKI:SUN:BFYY.0.2019-08-015
Wessinge, C. A. and Hileman, L. C. (2016). Accessibility,constraint,and repetition in adaptive floral evolution. Dev. Biol. 419, 175–183. doi: 10.1016/j.ydbio.2016.05.003
Wright, I. J., Dong, N., Maire, V., Prentice, I. C., Westoby, M., Díaz, S., et al. (2017). Global climatic drivers of leaf size. Science 357, 917–921. doi: 10.1126/science.aal4760
Xu, R., Cheng, S., Zhou, J., Tigabu, M., Ma, X. Q., Li, M., et al. (2023). Intraspecific variations in leaf functional traits of Cunninghamia lanceolata provenances. BMC Plant Biol. 23, 1–11. doi: 10.1186/s12870-023-04097-y
Yan, Y., Stoddard, F. L., and Neugart, S. (2020). The transgenerational effects of solar short-UV radiation differed in two accessions of Vicia faba L. from contrasting UV environments. J. Plant Physiol. 248, 153145. doi: 10.1016/j.jplph.2020.153145
Yuan, G., Guo, Q., Zhang, Y., Gui, Q., Xie, N., Luo, S. Q., et al. (2023). Geographical differences of leaf traits of the endangered plant Litsea coreana Levl. var. sinensis and its relationship with climate. J. Forestry Res. 34, 125–135. doi: 10.1007/s11676-022-01588-w
Keywords: Polyspora, phenotypic traits, genetic factors, geoecological factors, natural populations
Citation: Ma C, Gong M, Gui Q, Fan Z, Yang J, Wang L and Deng L (2025) The impact of environmental factors on phenotypic diversity of natural populations of Polyspora in China. Front. Plant Sci. 16:1553671. doi: 10.3389/fpls.2025.1553671
Received: 31 December 2024; Accepted: 24 September 2025;
Published: 10 October 2025.
Edited by:
Ebiamadon Andi Brisibe, University of Calabar, NigeriaReviewed by:
Valentine Otang Ntui, International Institute of Tropical Agriculture (IITA), KenyaOgbu Udensi, University of Calabar, Nigeria
Copyright © 2025 Ma, Gong, Gui, Fan, Yang, Wang and Deng. This is an open-access article distributed under the terms of the Creative Commons Attribution License (CC BY). The use, distribution or reproduction in other forums is permitted, provided the original author(s) and the copyright owner(s) are credited and that the original publication in this journal is cited, in accordance with accepted academic practice. No use, distribution or reproduction is permitted which does not comply with these terms.
*Correspondence: Changle Ma, bWNsQHN3ZnUuZWR1LmNu
†ORCID: Maiyu Gong, orcid.org/0009-0009-9279-2554
Qing Gui, orcid.org/0009-0006-0405-5588
Lijuan Wang, orcid.org/0009-0004-4092-9508
 Changle Ma
 Maiyu Gong1,2†
 Zhifeng Fan
 Jianxin Yang