 Fahuo Li1,2
 Jian Qin1,2Jingying Li1,2Liang Cheng1,2Xuehan He3Xiaohui Zhong1,2Yangpeng Mo1,2Han Liang1,2
 Peng Wang3*Yan Li1,2*Yongguan Wu1,2*
- 1Vegetable Research Institute, Guangxi Academy of Agricultural Sciences, Nanning, China
- 2Guangxi Key Laboratory of Vegetable Breeding and New Technology Development, Nanning, China
- 3College of Agriculture, Guangxi University, Nanning, China
Fusarium wilt (FW), caused by the plant fungus Fusarium oxysporum, causes severe economic losses in wax gourd (Benincasa hispida Cogn.). Developing disease-resistant varieties is an effective measure. Currently, no reports exist on gene localization or cloning of genes associated with FW resistance in wax gourd. However, our team has identified an FW resistance gene and plans to apply it in resistant varieties. In this study, we used bulked segregant analysis sequencing and quantitative trait locus detection on 1,304 inbred lines derived from resistant GD68 and susceptible HM25 parents to identify FW resistance genes. We successfully identified a resistance locus between the 3M13.385 and 3M16.869 markers on chromosome 3, named Fob1(t). Fine mapping between markers 3M15.904 and 3M16.373 (469 kb apart) identified 22 candidate genes. The transcriptome, sequencing comparison, and qRT-PCR analyses suggested that the endochitinase gene Bch03G006380 is the resistance gene, with significant expression differences between the parents and a one-base mutation in the first exon. The study also revealed the roles of Fob1(t) in plant hormones, transcription factors, phenylpropane metabolism, oxidation–reduction, disease progression, enzymes, and cell wall modification pathways, enhancing FW resistance in GD68. Finally, we identified two closely linked insertion–deletion markers that can assist in the transfer and utilization of the Fob1(t) gene, significantly improving the screening rate of positive individual plants and reducing breeding time.
1 Introduction
Wax gourd (Benincasa hispida Cogn.) is an annual vine herb, rich in various kinds of supplements, including vitamins, nutrients, and seven essential amino acids for the human body (not including tryptophan) (Chu et al., 2006). It is an important vegetable for dietary vegetables, light vegetables, and southern vegetables to the north, with great economic value. Considering its great economic value, this important dietary vegetable that originated from China and East India is always transported to the north of China. At present, the cultivation area of wax gourd in China exceeds 350,000 hm2, concentrated in Guangdong, Guangxi, and Hainan, among other areas, with an average yield of over 112,500 kg/ha (Jiang et al., 2013; Xie et al., 2020). In recent years, wax gourd has gradually become the preferred vegetable species to support industrial revitalization, offering advantages of strong adaptability, easy cultivation, resistance to heat and humidity resistance, high yield, ease of storage, and transportation resistance (Zhou et al., 2014; Shi et al., 2022). Nevertheless, an increase in mass planting of wax gourd resulted in the development of Fusarium wilt (FW), which can occur during the whole growth period, flowering, fruit sitting, and fruit expansion. Notably, the incidence rate is as high as 60% or above due to strong adaptability to temperature, sensitivity to humidity, and challenges in control and eradication (Shen, 2012; Jing et al., 2019). Previous studies demonstrated that these dreadful diseases caused huge economic losses to the wax gourd industry, becoming the bottleneck to the sustainable and healthy development of wax gourd (Kang et al., 2012).
Fusarium oxysporum, a pathogenic fungus with devastating effects on plants, is known to induce FW in a variety of significant melon crops. The localization, cloning, and elucidation of the resistance mechanisms to FW in cucurbits have been progressing at a slow pace, with only 11 resistance genes having been documented thus far. In some instances, it was demonstrated that the main genes of the watermelon included Fo-1.1, Fon-1, and qFon1-9 (Lambel et al., 2014; Zhang et al., 2013; Li et al., 2017; Branham et al., 2019, 2020). In addition, the major genes in cucumber include Foc2.1, Foc4, and fw2.1 (Zhang et al., 2014; Zhou et al., 2015; Dong et al., 2019). Notably, FW resistance genes on the melon have been successfully identified, including Fom-1, Fom-2, Fom-3, and a newly located gene on chromosome 9 (Risser et al., 1976; Brotman et al., 2013; Joobeur et al., 2004; Zink and Gubler, 1985; Yang et al., 2024). However, no genes associated with FW resistance have been identified in wax gourd, and only five FW resistance varieties of wax gourd are currently in circulation within the market. Accordingly, the Sichuan Academy of Agricultural Sciences selected the pink wax gourd “ChuanFen No. 1” (Zeng et al., 2006) and the Guangdong Academy of Agricultural Sciences selected “TieZhu No. 1” and “TieZhu No. 2” (Xie et al., 2009a, 2013, 2017) for cultivation. To this end, “GuiShu No.6” and “GuiShu No.8” are being cultivated by the Guangxi Academy of Agricultural Sciences (Zhao et al., 2017; Wu et al., 2019; He et al., 2021). The predominant reasons include the medium- and low-resistance germplasm materials of wax gourd, as well as ancient local varieties with poor agronomic properties. Notably, these ancient germplasm materials cannot be directly bred and utilized (Liang et al., 2018; Zhou and Everts, 2001; Peng et al., 2020; Zeng et al., 2024). Moreover, the genetic basis of FW resistance in wax gourd is complex. For instance, Xie et al. (2009b) observed that FW resistance was controlled by multigene recessive inheritance, conforming to the “additive-dominant” model. Although the additive effect was predominant, susceptibility to the disease was partially dominant over resistance. Thus, it is of great significance to collect and screen more resistance sources and carry out the mining and utilization of the FW resistance gene of wax gourd.
Considering the slow research progress on wax gourd’s resistance to FW, this study aimed to explore gene mining and variety cultivation. According to the analysis of the parents (resistant GD68 and susceptible HM25), F1, and the genetic population (HM25/GD68 F2) by bulked segregant analysis sequencing (BSA-seq) and quantitative trait locus (QTL) detection, we successfully identified a resistance locus. Further fine mapping (screening recombinant individual plants and encrypted molecular markers), candidate gene analysis (including sequence difference, gene expression, and transcriptome analyses), and molecular markers were developed to assist in applying the resistance gene. Together, we believe that the FW resistance gene mapping and the development of molecular markers will certainly provide a research basis for exploring the mechanism of FW resistance and breeding for disease resistance.
2 Materials and methods
2.1 Plant materials and phenotypic evaluation
2.1.1 Plant materials
In this study, wax gourd varieties, including GD68 with a high resistance to FW and HM25 with a high susceptibility to FW, were initially selected respectively as the male and female parents to construct an F2 segregating population. Further, the F2:3 line obtained from the F2 generation was used to screen recombinant individual plants for fine mapping analysis. In spring 2023, two parents (GD68 and HM25) and 1,304 individual plants (F2 population) were tested for FW. The wax gourd seeds were soaked in warm water for 6 h, wrapped in a towel, and then placed in a 28°C light incubator. After 2~3 days, the activated seeds were sowed in the seedling tray (0.5 m × 1.2 m) filled with substrate and grown to two true leaves for F. oxysporum treatment.
2.1.2 Pathogen preparation
Initially, the DG510 strain (F. oxysporum Schl. f. sp. benincasae) was isolated, identified, and preserved by our team (Kang et al., 2012). Further, the culture medium was prepared using PS nutrient solution (200 g potatoes, 20 g sucrose, and 1,000 mL water), and cultured at 30°C for 6 days in the incubator. After producing a large number of spores, the concentration of the pathogen spores was calculated using a hemocytometer. The spore solution was prepared at a density of 5 × 10⁵ spores/mL.
2.1.3 Phenotypic evaluation
The wax gourd seedlings were infected by the root irrigation method. First, the spore solution of the DG510 strain was irrigated to the roots of the wax gourd seedlings until the fungus solution overflowed from the cultivation plate. Then, all plants were transplanted in the plastic bucket (h = 0.2 m, d = 0.2 m) and planted at the experimental base in Nanning, Guangxi, PR China (108°22′E and 22°48′N). Further, the conventional production management was performed by timely watering and exposure to the net sun during drought, ensuring the normal growth of seedlings.
2.1.4 Observed the disease occurrence of seedlings every day
When the highly susceptible material HM25 was dead, the disease characteristics were recorded, and a disease resistance score (DRS) was given for each seedling according to the FW classification of wax gourd (Zeng et al., 2004). Notably, the disease index (DI) of each material was calculated according to Equation 1 based on the survey and statistical results of the incidence of every individual plant,
where s presents representative values for each disease grade, n indicates the number of diseased plants at each disease grade, N presents the total number of investigations, and S shows the representative value of the highest disease level.
2.2 Gene mapping
2.2.1 DNA extraction
After 3 days of FW infection, the fresh young leaves from parents, F1, and F2 were initially collected in a 2-mL centrifuge tube and stored at −80°C. Further, DNA was extracted using the improved cetyl trimethyl ammonium bromide (CTAB) method (An et al., 2011). After extraction, the concentration of the DNA was determined using an ultra-micro spectrophotometer. Then, the quality of DNA was examined through 1.0% agarose gel electrophoresis.
2.2.2 BSA-seq
Extreme resistance plants (n = 30) derived from the F2 population were selected, and the genomic DNA of each sample was diluted to 100 ng/μL. Then, 20 μL of DNA from each sample was mixed to develop one resistance DNA pool, which was also used to establish the susceptible DNA pool. Then, samples (two parents and two extreme DNA pools) were sent to Shanghai PersonalBio Technology Co., Ltd. (Shanghai, China) for BSA-seq to search for resistance loci and the candidate intervals (Michelmore and Kesseli, 1991). Further, the association analysis was conducted between a resistance-susceptible mixed pool and two-parent pools with GX-19 (unpublished) as the reference genome. Single-nucleotide polymorphism (SNP) and insertion–deletion (InDel) were detected using the GATK software. The candidate intervals were analyzed using the ED, GPS, SNP-index, and MutMap algorithm.
2.2.3 QTL validation
Considering the results of the four analytical models, InDel molecular markers covering the target region on the corresponding chromosome were designed according to the BSA-seq data. The polymorphic markers were detected in the two extreme DNA pools and two parents. Furthermore, several polymorphic markers were identified between the parents in the target chromosomal region. In the F2 populations, the bands consistent with the resistant parents (GD68) or susceptible parents (HM25) were designated as B and A, respectively. The samples with both bands of resistant and susceptible parents were designated as H. The markers with polymorphism on both parents were tested for genotype on 96 samples (select representative plants from 1,304 F2 populations). Then, these genotypes were combined with phenotype to detect resistance locus with composite interval mapping using the QTL IciMapping software (Wang, 2013). Finally, the BSA-seq resistance locus was validated when the threshold limit of detection (LOD) value ≥2.5.
2.2.4 Fine mapping
Based on the interval position of QTL mapping, markers on both sides of the localization were selected to screen individual recombinant plants in the F2:3 lines, as well as to identify the DI phenotype by Equation 1 for the recombinant individuals, develop new primers, and obtain the genotypes of these recombinant individuals using the newly designed primers. The primer development was aimed at specific QTL localization intervals using BLAST tools from websites such as the National Center for Biotechnology Information (NCBI). By comparing the genomic sequences of GX-19 as the reference genome, primers with product sizes between 100 and 300– bp were designed using the Premier Primer software (version 5.0) for insertion and deletion regions of over 10 bp. The primer BLAST tool in the NCBI was used to compare the designed primers, and primers with high specificity were selected as candidates and synthesized by Huada Gene Technology Co., Ltd. (Shenzhen, China).
2.3 RT-qPCR and transcriptome analyses
The plant samples (GD68 and HM25) infected with FW were taken at five different time points (0, 4, 6, 8, and 10 days). The first true leaf of the seedlings was rapidly collected and stored in liquid nitrogen or −80°C freezer for RT-qPCR and transcriptome analyses. It should be noted that each treatment time point was performed in triplicate.
2.3.1 RT-qPCR analysis
Initially, RNA was extracted using TaKaRa TransZol Up Plus RNA Kit (Tokyo, Japan) and then reverse transcribed to complementary DNA (cDNA) using the PrimeScript™ First-Strand cDNA Synthesis SuperMix kit. Further, the RT-qPCR primers were designed based on the GX-19 genome using the Primer 5.0 software for candidate genes within the mapping interval. The PCR analysis was performed on the ABI PRISM 7300 real-time PCR system (Applied Biosystems, Waltham, MA, USA). According to the instructions of the PrimeScript™ RT kit (TaKaRa Co., Ltd.), the RT-qPCR system was prepared using 0.4 µL of forward and reverse primers, 0.4 µL of Passive Reference Dye (50×), 1 µL of template cDNA, 10 µL of 2× TransStart Top, and 20 µL of ddH2O. The reaction procedure involved preheating for 30 seconds at 94°C and for 40 cycles of 5 seconds at 94°C, 15 seconds at 56°C, and 10 seconds at 72°C. The samples were set up in triplicate. Further, the standard curve was drawn to calculate the slope and R2. The wax gourd gene Actin (upstream primer 5′-CCATTCCCACCTCGTGTTCA-3′ and downstream primer 5′-TCCCACAGTTTCCTCACAGC-3′) was used as a reference to analyze the gene expression level between samples by the 2−ΔΔCt method. Based on the quantitative expression results of three replicates, the changes in the gene expression of the target candidate gene were compared at various time points of FW treatment (Cheng et al., 2021).
2.3.2 Transcriptome sequencing
Initially, the samples collected at different time intervals were sent to Shanghai Majorbio Bio-Pharm Technology Co., Ltd. (Shanghai, China) for eukaryotic mRNA sequencing. The experimental procedures sequentially included extracting total RNA, enriching mRNA, mRNA fragmentation, reverse synthesis of cDNA, adapter ligation, construction of sequencing library, and high-throughput sequencing. The NovaSeq X Plus and DNBSEQ-T7 platforms were used for sequencing, and dual-end reads were obtained. The Fastp software was employed to perform data quality filtering and obtain clean reads. Using the TopHat2 software (Kim et al., 2013), paired clean reads were aligned with the wax gourd reference genome GX-19 to obtain mapped data. The Cufflinks or StringTie software was used to assemble and splice mapped reads (Trapnell et al., 2010; Pertea et al., 2015). Based on the length of the gene and the Htseq count, the fragments per kilobase of transcript sequence per million base pair sequence (FPKM) and transcripts per million reads (TPM) were calculated to quantify the gene expression for gene/transcript length and sequencing depth. To compare genomes (Li and Dewey, 2011), read counts for each sample gene/transcript were obtained using RNA-seq by Expectation–Maximization (RSEM). Finally, FPKM or TPM conversion was performed to obtain standardized gene/transcript expression levels.
2.3.3 Differential expression, enrichment, and functional annotation of differentially expressed genes
Difference multiple | log2 (Fold Change) | > 2 and p < 0.01 were used as criteria to screen differentially expressed genes (DEGs). Differential analysis was performed using the DESeq2 software of DEGs with non-redundant protein sequences (NR) database (https://www.ncbi.nlm.nih.gov/) (Love et al., 2014), SwissProt protein sequences (SWISS-PROT) database (https://www.uniprot.org/uniprotkb/), eukaryotic homologous protein cluster (KOG) (https://www.ncbi.nlm.nih.gov/COG/), Pfam database (https://www.ebi.ac.uk/interpro/), the Gene Ontology (GO) (https://geneontology.org/), and Kyoto Encyclopedia of Genes and Genomes (KEGG) databases (https://www.kegg.jp/) for comparison. The information on the functional annotation and pathway enrichment of the DEGs was obtained.
2.4 Molecular marker-assisted breeding
Two InDel markers tightly linked to the predicted main regulatory resistant gene were designed using Premier 5.0 (Supplementary Table S1). Combined with developed markers, 13 wax gourd germplasms from the parent plants (GD68 and HM25), nine F2 individual plants, and four negative wax gourd materials (149, 158, 183, and 121-long) without the resistant gene were used for molecular marker-assisted and FW resistance accuracy verification experiments.
2.5 Statistical analysis
The expressed data were compared using one-way analysis of variance (ANOVA) to compare multiple samples and the t-test to examine the differences between the two groups. All the data were compared using the least significant difference (LSD) test at the 5% or 1% significance level.
3 Results
3.1 Genetic analysis of GD68 resistance
After 14 days of infection with DG510 pathogen (F. oxysporum f. sp. benincasae), the leaves of susceptible parent HM25 plants showed wilting, brown and decaying stems, lodging of the whole plant, and death, with a DRS of 5 and DI of 100. Contrarily, the leaves of resistant parent GD68 plants were healthy, showing normal stems and vigorous vitality, with DRS = 0 and DI = 0. Notably, it showed a significant difference from HM25. In addition, the same experiment was conducted on F1 plants, indicating healthy leaves with only individual leaves wilted or yellow stemness health (DRS = 0 and DI = 8.3). The overall states showed not much difference from GD68, which, however, showed a significant difference with HM25 (Figures 1A–C). It was observed that HM25 was a highly susceptible material. At the same time, GD68 was a highly resistant material, and F1 was significantly resistant to FW, indicating that the resistance gene could be inherited dominantly. A total of 1,304 plants from the F2 population were identified for their resistance to FW. Notably, the distribution of their resistance grades basically followed a normal distribution. The ratio of the coefficient of resistant plants (DRS ≤ 3) and susceptible plants (DRS ≥ 4) was 955:349 (χ2 = 2.16 < χ20.01,1 = 3.84). The chi-square test validated the conformation to the segregation pattern of a major gene (Figures 1D, E).
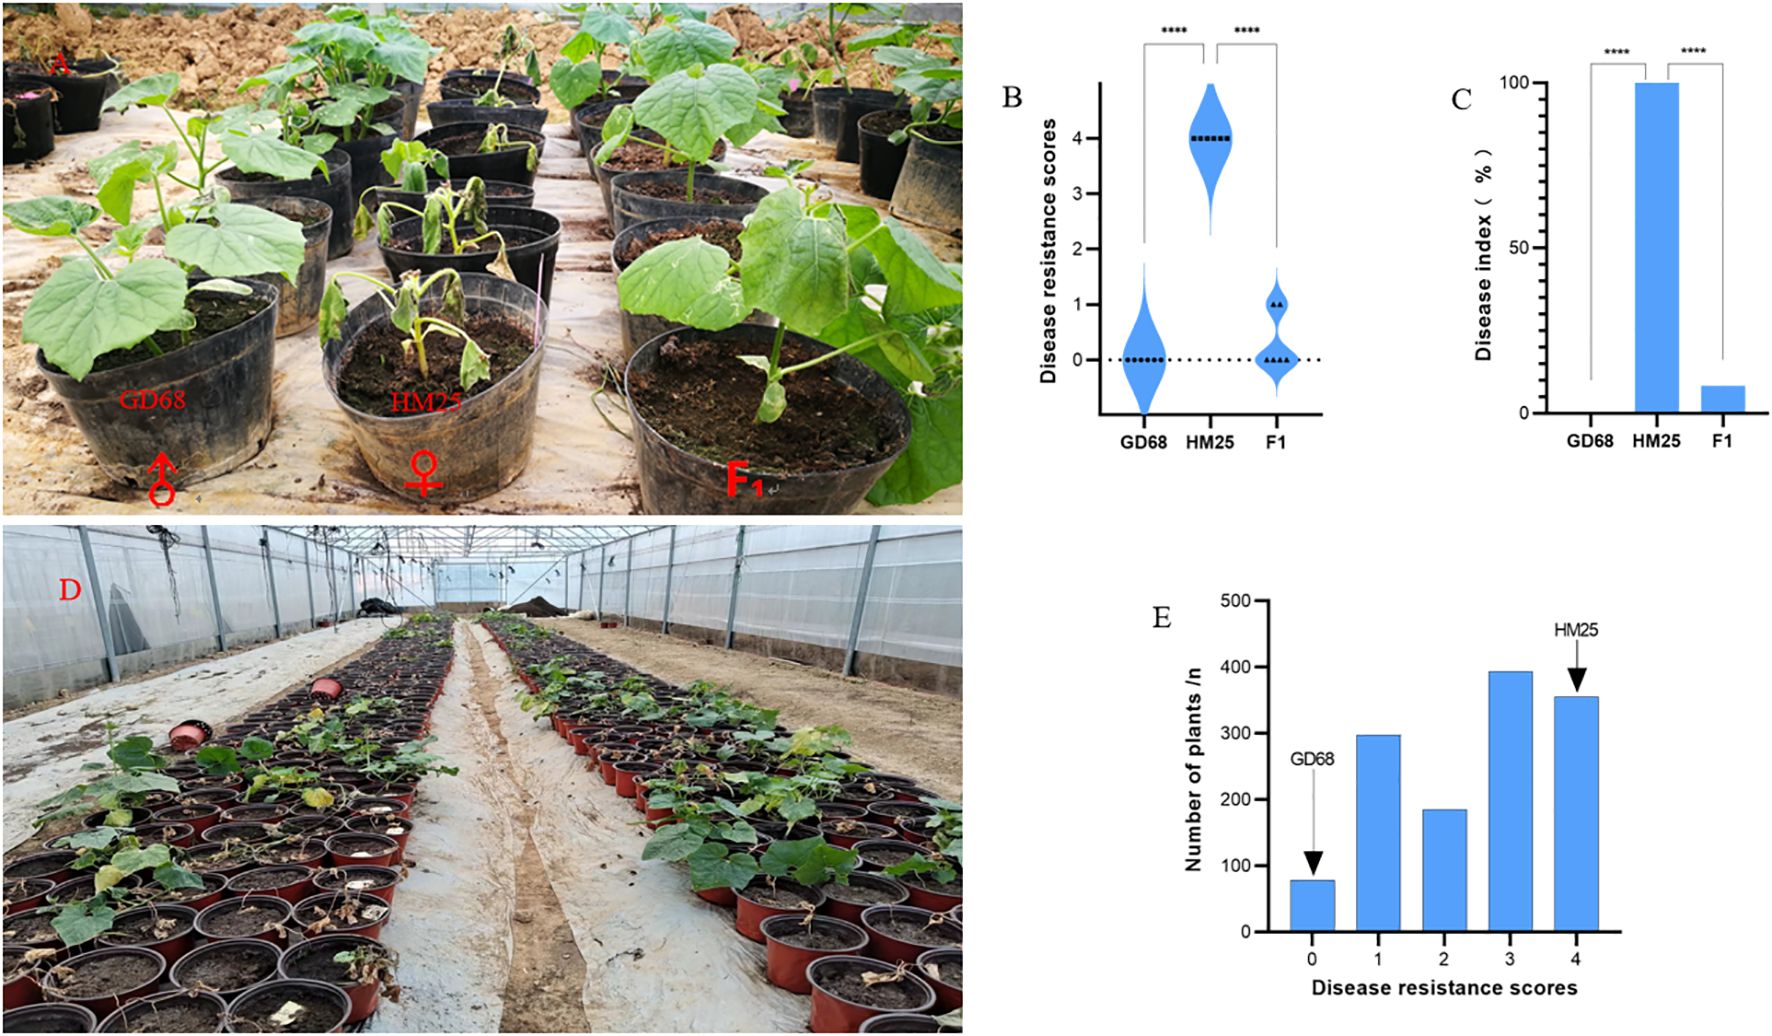
Figure 1. GD68 resistance identification and genetic characteristics. (A) The bright field image shows the phenotype of Fusarium wilt (FW) identification at the seedling stage and corresponding (B) disease resistance score and (C) disease index, where from the left only GD68, HM25, and HM25/GD68 F1 populations had six replicates for each material. The graphs show (D) the HM25/GD68 F2 population phenotype of FW identification at the seedling stage, with a total of 1,304 individual plants and corresponding (E) disease resistance score. The left arrow indicates the resistance value of GD68, and the right arrow indicates the resistance value of HM25.
3.2 Resistance locus detection and validation
Further, 30 extremely resistant and 30 susceptible plants from HM25/GD68 F2 were selected to construct extreme resistance and susceptibility pools for BSA-seq analysis. With the analysis using the four models of detection, regions exceeding the 95% threshold line were selected as candidate regions for trait correlation. The ED model results showed that the candidate intervals were between Chr01:101.3Mb-96.2Mb and Chr03:5.5Mb-33.4Mb. The SNP index modeling displayed that the candidate interval was Chr03:9.8Mb-20.4Mb. The GPS model results showed that the candidate interval was Chr03:10Mb-19.6Mb, while the MutMap model showed that the candidate interval was Chr08:56.9Mb-58Mb (Figures 2A–D).
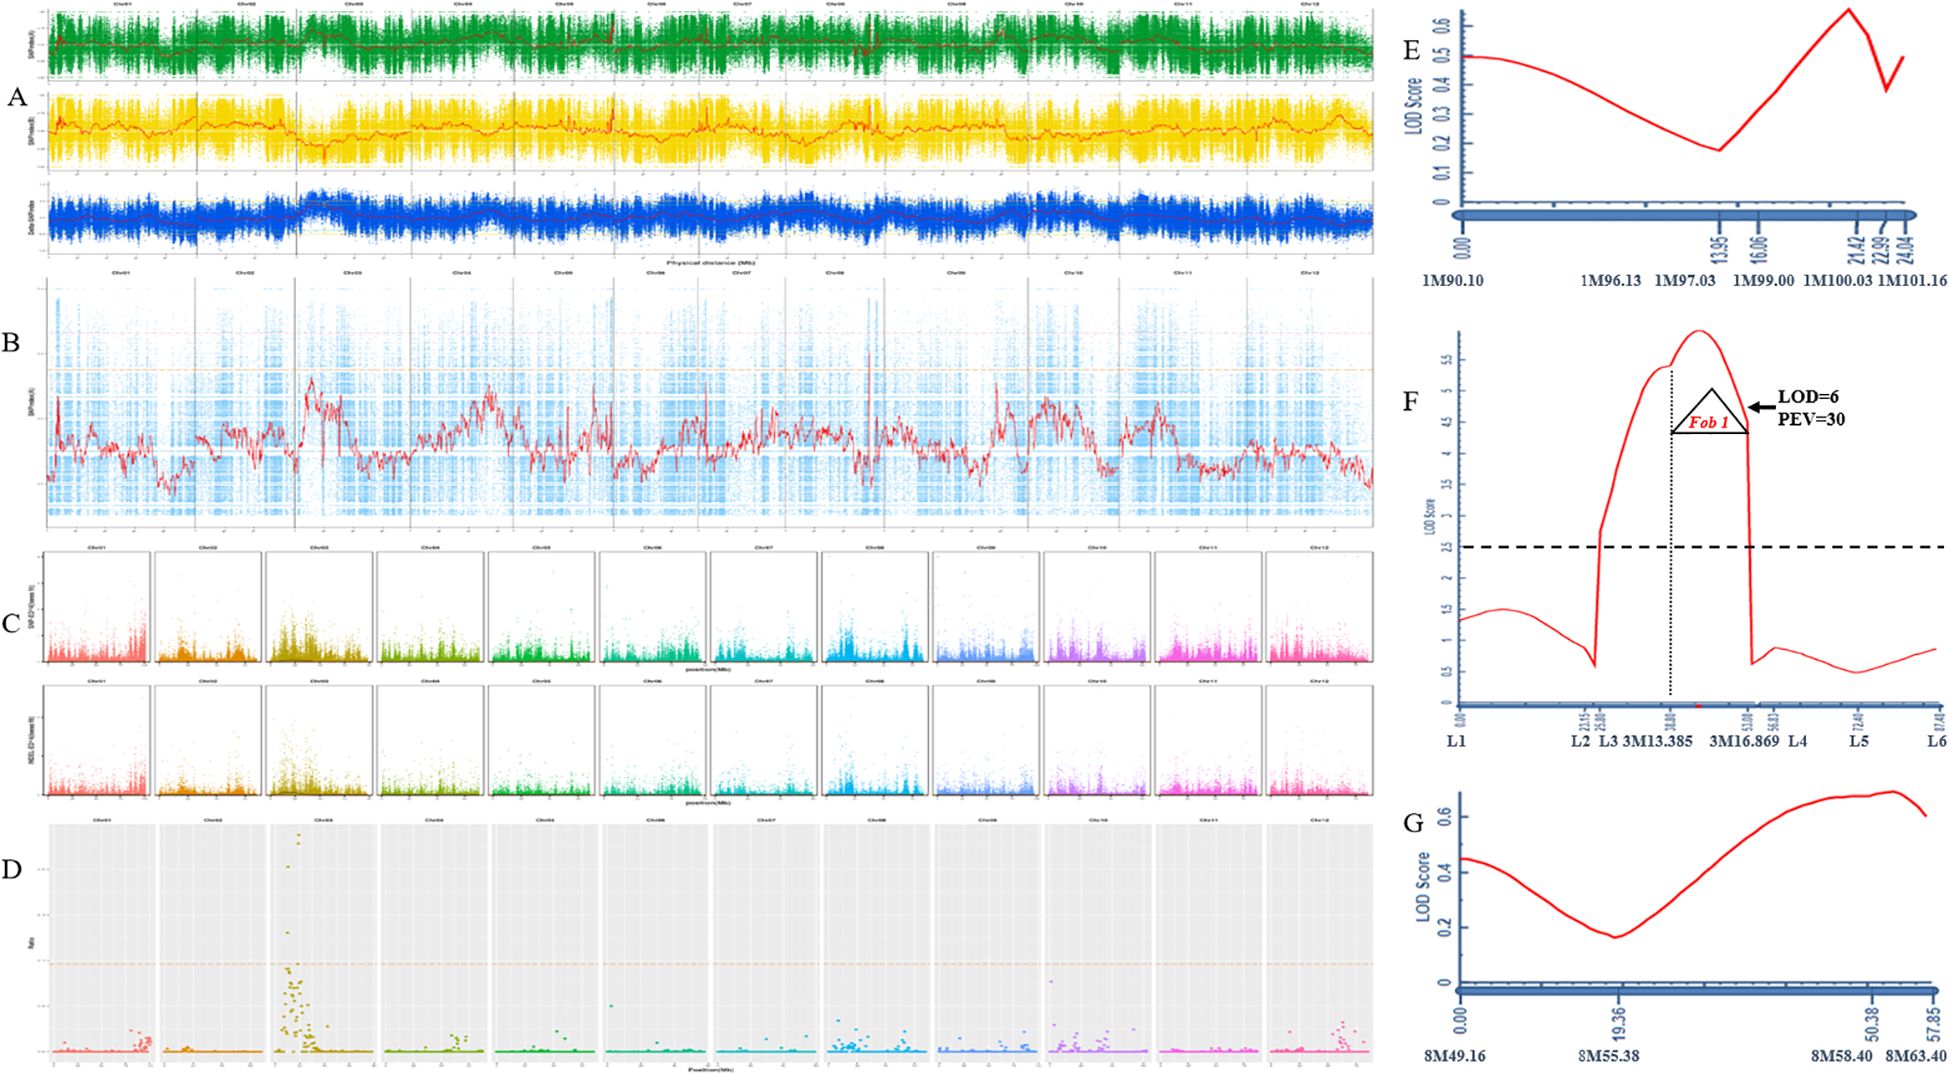
Figure 2. GD68 resistance locus detection and identification. (A) Single-nucleotide polymorphism (SNP) index model. The horizontal axis represents the names and lengths of each chromosome, the vertical axis represents the SNP index value, the red line represents the mean SNP index, the orange line represents the 99% confidence line, and the green line represents the 95% confidence line. The positioning range is Chr03:9.8Mb-20.4Mb. (B) MutMap model. The horizontal axis represents the names and lengths of each chromosome, the vertical axis represents the SNP index value, the red line represents the mean SNP index, the pink line represents the threshold line corresponding to the 99th percentile, and the orange line represents the threshold line corresponding to the 95th percentile. The positioning range is Chr08:56.9Mb-58Mb. (C) ED model. The horizontal axis represents the base position on each chromosome, and the vertical axis represents the Nth power of the ED value of SNP/insertion–deletion (InDel). Each point represents an SNP/InDel, with black indicating the fitting line and orange indicating the threshold line. The positioning range is Chr01:101.3Mb-96.2Mb Chr03:5.5Mb-33.4Mb. (D) GPS model. The horizontal axis represents the SNP position on the chromosome, and the vertical axis represents the corresponding ratio value [using the sliding window method for denoising, that is, calculating the ratio of the number of sites with −ln (p-value) values greater than 10 within the sliding window (400 kb) to the total number of sites within the sliding window; the larger the value, the more associated it is with the trait]. The positioning range is Chr03:10Mb-19.6Mb. The quantitative trait locus (QTL) detection on chromosomes 3 (E), 1 (F), and 8 (G). The X-axis is genetic distance (cM) and corresponding molecular markers. The Y-axis is the limit of detection (LOD) value; dashed line LOD = 2.5; LOD ≥ 2.5 indicates the presence of a major effector locus. PEV explains the phenotypic variation caused by this locus.
Considering the large range of detected loci, InDel markers on chromosomes 1, 3, and 8 were designed based on biparental resequencing data to cover the corresponding candidate interval. The genotypes of 1,304 HM25/GD68 F2 plants and the DRS of FW resistance phenotype were combined to construct a genetic map and detect resistance locus QTL. A significant QTL was detected between markers 3M13.385 and 3M16.869 on Chr03, LOD = 6, which could explain 30% of the genetic variation (Figure 2E). Based on the absence of a gene or loci identified for FW resistance in wax gourd, this locus was named Fob1(t), following international naming rules. Meanwhile, no resistance sites on Chr01 and Chr08 were detected (Figures 2F, G).
3.3 Fine mapping of Fob1(t)
To finely map the resistance genes, several recombinants (n = 287) derived from 1,304 F2 plants were identified using markers 3M13.385 and 3M16.896. A total of six pairs of InDel markers (Supplementary Table S1) in the mapped interval were initially designed at 3.48-Mb intervals based on the QTL results. Further, a genotype–phenotype joint analysis was performed on the parents and recombinants. The interval was mapped to a region of 1.62 Mb between 3M14.893 and 3M16.516 (Figures 3A, E). To identify and localize the genes controlling resistance to FW, the F2:3 line of 3,000 plants was screened to retrieve additional recombinants with 3M14.893 and 3M16.516, finally obtaining 42 recombinants. Further, the development of four pairs of InDel markers between 3M14.893 and 3M16.516 resulted in the detection of the genotypes of the 42 recombinant individual plants. Moreover, two recombinants (19–39 and 20-4) could determine the right marker (3M16.373), and the other two recombinants (20–39 and 20-54) could choose the left marker (3M15.906) in the target region (Figures 3B, C). It was finally mapped to be one region harbored by markers (3M15.906 and 3M16.373), which was approximately 467 kb based on the wax gourd reference genome (GX-19). Accordingly, 22 genes were predicted in the target region (Table 1, Figure 3D).
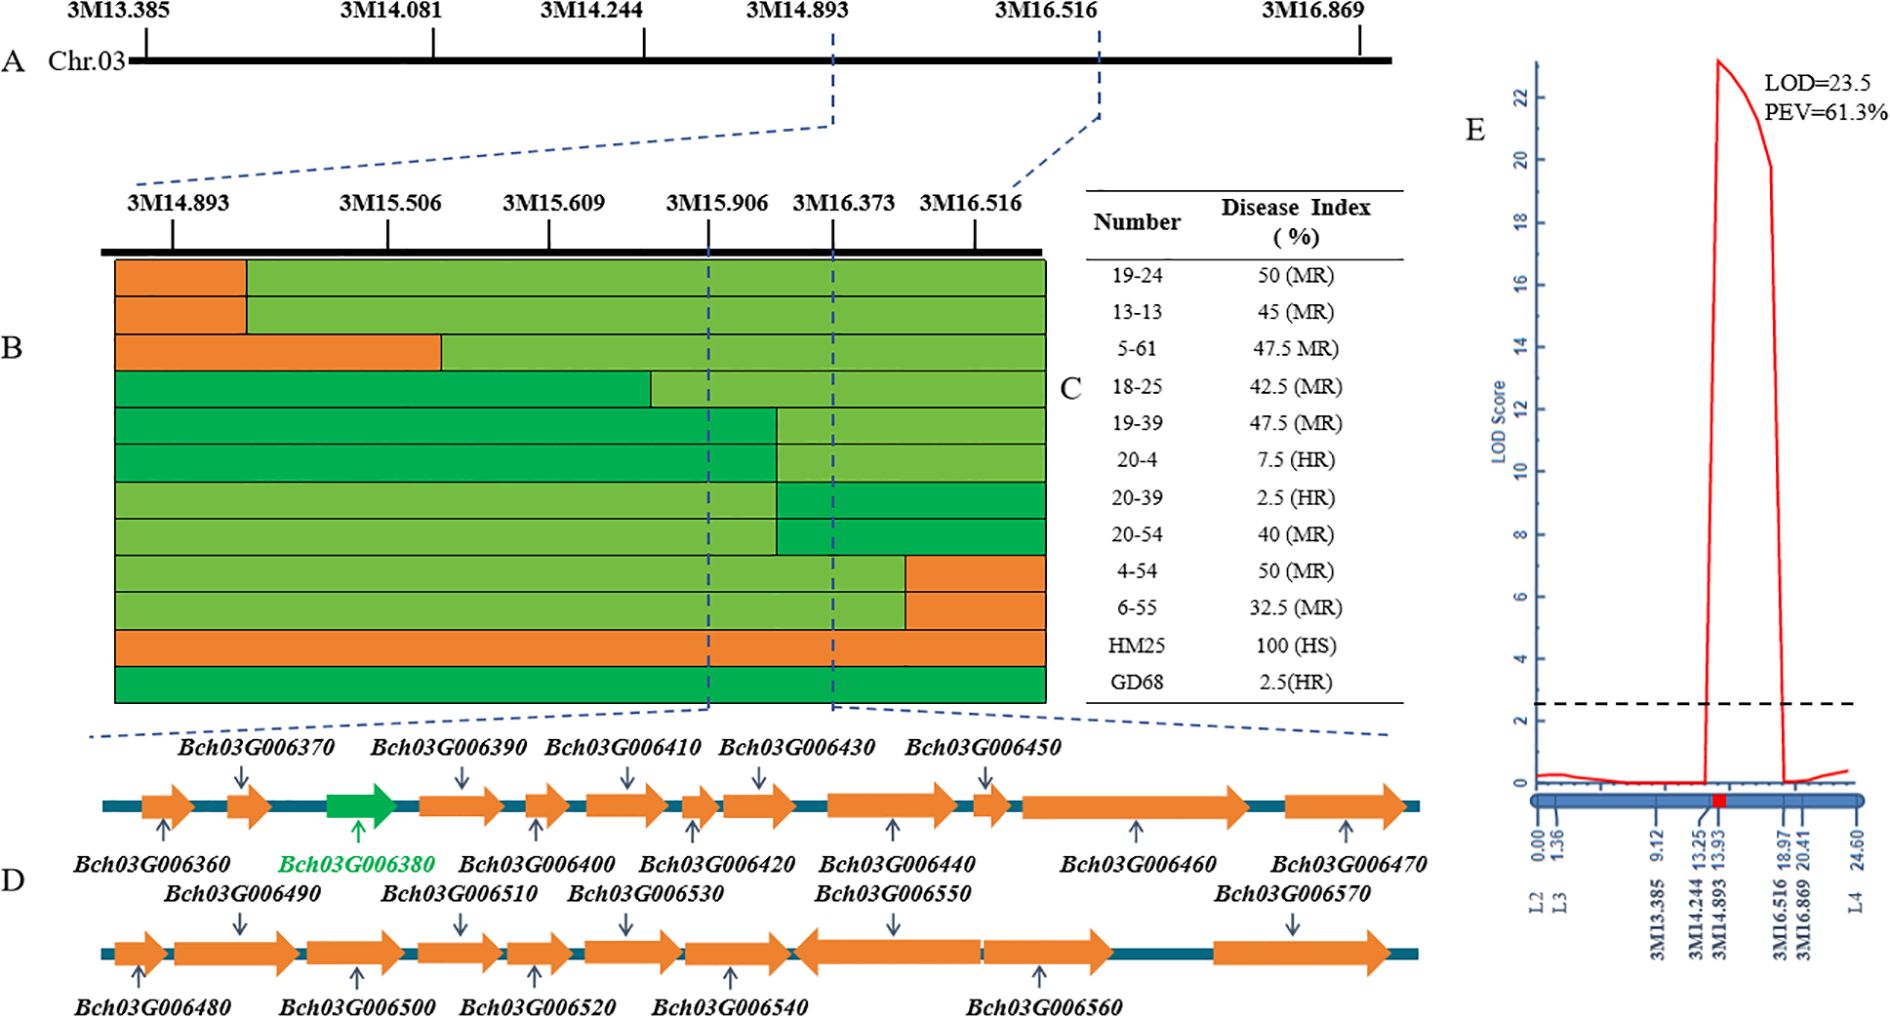
Figure 3. Fine mapping of Fob1(t). (A, B) The images show that the markers correspond to specific locations on chromosome 03, as well as (C) genotypes and phenotypes of the selected recombinants. Green, yellow, and light green bars denote the resistant parent homozygote of GD68, susceptible parent homozygote of HM25, and heterozygotes, respectively. Other numbers refer to recombinants derived from the F2:3 line generations of HM25/GD68, and the DI phenotype of each recombination is calculated based on the Equation 1 of 10 individual plants of its offspring. (D) The image presents candidate genes of fine mapping interval, where green represents the most likely target gene. (E) Quantitative trait locus (QTL) mapping map of encryption mark on chromosome 3. The X-axis vertical is genetic distance (cM), and the horizontal is corresponding molecular markers. The Y-axis is the limit of detection (LOD) value; dashed line LOD = 2.5; LOD ≥ 2.5 indicates the presence of a major effector locus. PEV explains the phenotypic variation caused by this locus.
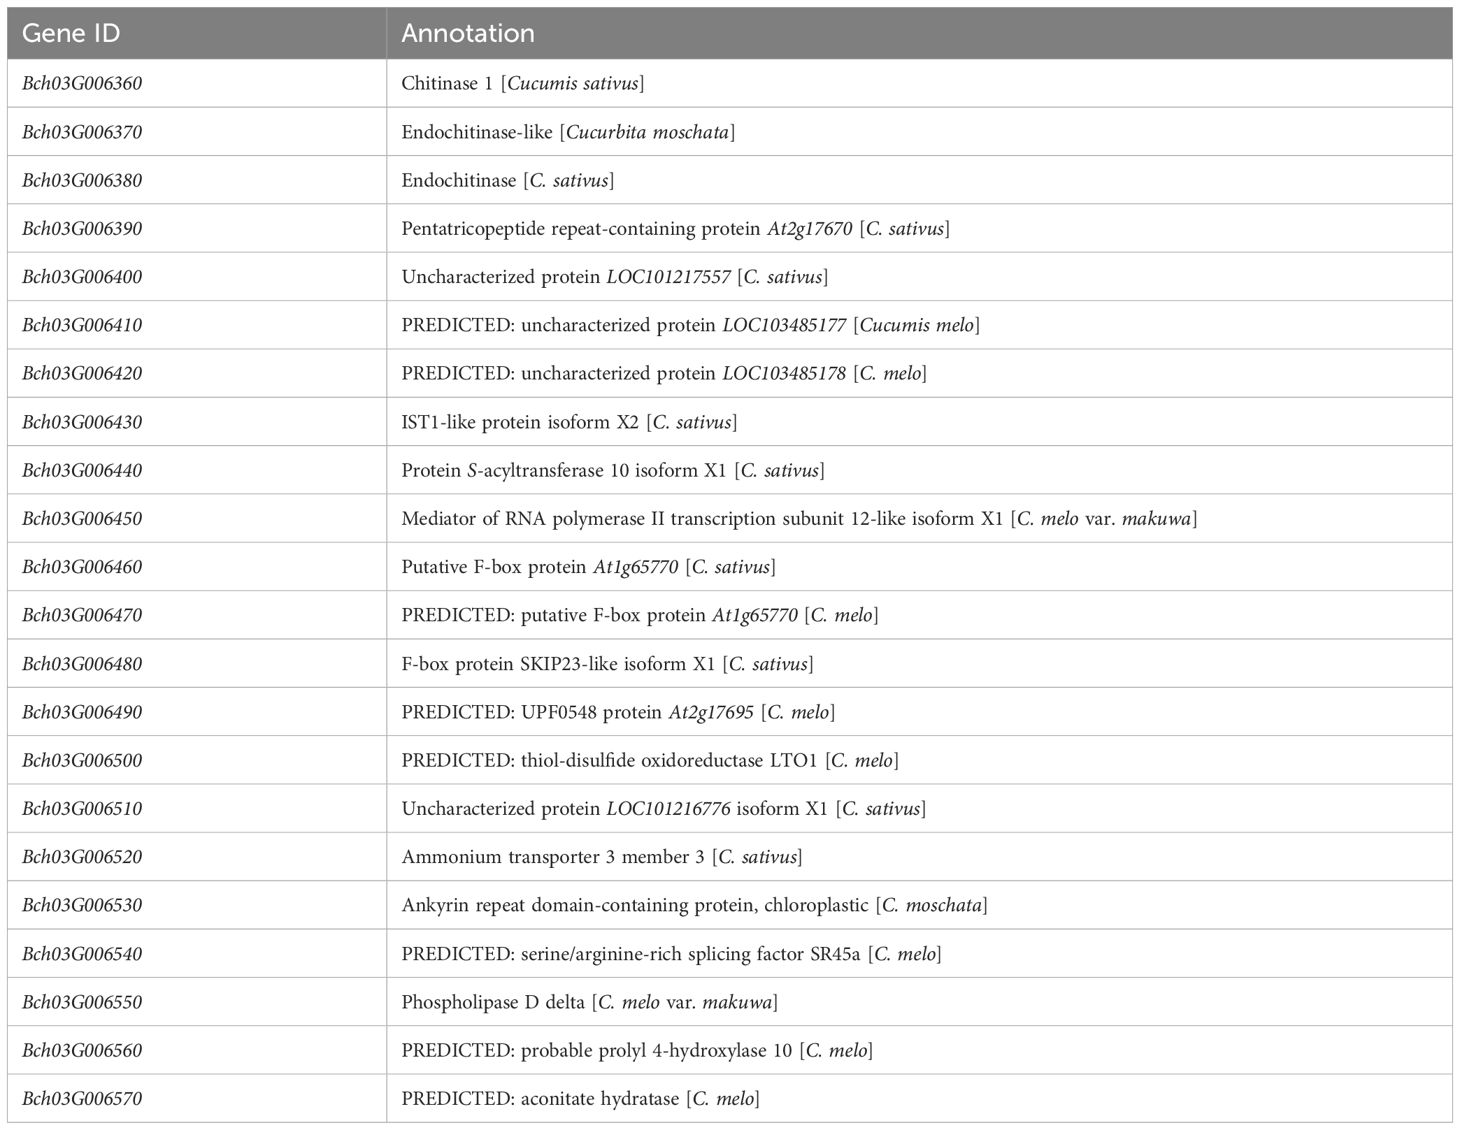
Table 1. Predicted candidate genes for Fob1 in wax gourd reference genome GX-19.
3.4 Candidate gene analysis
To analyze the candidate genes, sequencing comparison, transcriptome, and RT-qPCR analyses were performed to validate the 22 genes from GD68 and HM25 (Table 1). It was observed that there were only four genes with sequence differences in the coding sequences (CDS) of two parents, GD68 and HM25. Consequently, Bch03G006380 showed one SNP variation in the first exon (T changed to A), causing the amino acid Val to change to Asp (Figure 4A). Bch03G006410 presented one variation of three base insertions in 5′UTR, causing no frameshift (Figure 4B). Bch03G006470 showed one variation of 12 base insertions in 5′UTR, causing no frameshift (Figure 4C). Bch03G006550 presented one SNP variation in the eighth exon (A changed to G), causing the amino acid Met to change to Thr (Figure 4D). After FW treatment, only gene Bch03G006380 showed a significant difference in the expression level of transcriptome and RT-qPCR on the 10th day. Specifically, the expression level of the Bch03G006380 gene from HM25 reached 15,000 (transcriptome) and 20,000 (RT-qPCR), which was significantly different from GD68 (Figures 4E, I). These findings indicated that it may belong to constitutive genes, and FW inoculation could not lead to excessive expression in resistant materials. While another 3 genes (Bch03G006410, Bch03G006470, and Bch03G006550) didn't showed a significant difference (Figures 4F–H, J–L). Together, these findings suggested that Bch03G006380 was likely the target resistance gene, which could mediate an endochitinase gene and offer unique efficacy in antifungal treatment.
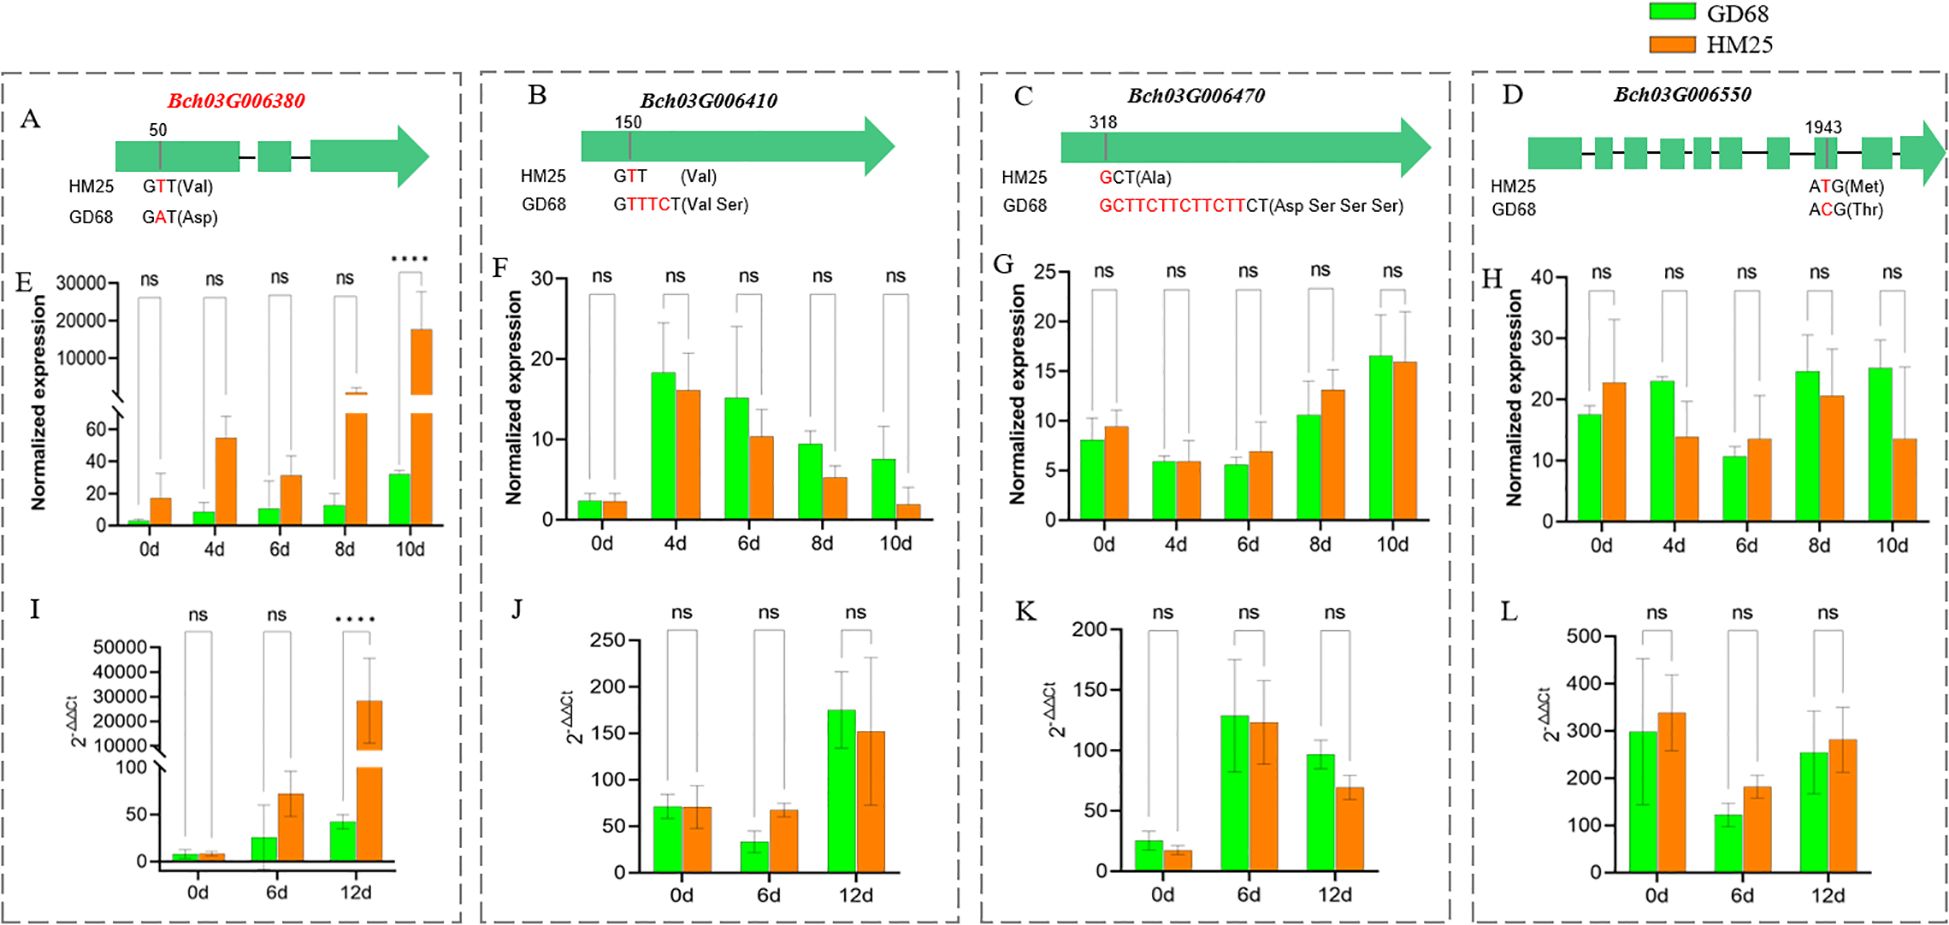
Figure 4. Candidate genes analysis of Fob1(t). (A–D) The image shows the CDS comparison of Bch03G006380, Bch03G006410, Bch03G006470, and Bch03G006550 between GD68 and HM25. Red represents differential bases, while parentheses indicate corresponding changes in amino acids. (E–H) The graphs show transcriptome validation of the four candidate genes in GD68 and HM25. Difference multiplelog2 (Fold Change)> 2 and p < 0.01 were used as criteria to screen differentially expressed genes (DEGs). Differential analysis was performed using the DESeq2 software. Bars represent the means of three replicates. Error bars represent the SD. ****, p < 0.0001. (I–L) The image shows quantitative reverse transcription polymerase chain reaction validation of the four candidate genes between GD68 and HM25. Actin was used as an internal control. The relative expression level of each gene was measured using the 2−ΔΔCt method. Bars represent the means of three replicates. Error bars represent the SD. ****, p < 0.0001. ns, no significant difference.
To understand the relationship between the protein sequence of Bch03G006380 and other homologous sequences, we analyzed the Bch03G006380 protein sequence using NCBI BLAST (NCBI, Bethesda, MD, USA). Subsequently, we used the neighbor-joining function in MEGA 7.0 to generate a 1,000-repeat phylogenetic tree, using the bootstrap method. The results revealed that Bch03G006380 shared a close phylogenetic relationship with cucurbits, including cucumbers, pumpkins, and bitter gourd (Figure 5).

Figure 5. Phylogenetic tree for Bch03G006380 and its homologous proteins. Phylogenetic tree was constructed with 1,000 bootstrap replicates using MEGA 7.0. Numbers at tree forks indicate bootstrap values.
3.5 Molecular pathway analysis of Fob1(t)
To explore the pathway mediated by the resistance gene Fob1(t), RNA-seq was performed at five different time points (0, 4, 6, 8, and 10 days) after FW inoculation of the parent materials (GD68 and HM25). At 4, 6, and 8 days, the gene transcription levels between resistant and susceptible materials remained at a relatively stable level (Figure 6A). Contrarily, the gene transcription levels at 10 days between the resistant materials increased sharply (up = 2,946, down = 3,427) (Figures 6A, B). These results were consistent with the FW phenotype of wax gourd seedlings after treatment, indicating that obvious FW symptoms appeared in susceptible materials on the 10th day. Accordingly, the gene transcription levels between resistant and susceptible materials were significantly induced only when the wilt phenotype appeared after FW was treated. At 10 days, the differential genes were annotated. On the one hand, the GO analysis presented that these genes may mainly affect various functions, such as binding, catalytic activity, cellular anatomical entity, metabolic process, and cellular process (Figure 6D). On the other hand, the KEGG analysis demonstrated that these genes may affect other functions, such as energy metabolism, amino acid metabolism, carbohydrate metabolism, translation, folding, sorting, and degradation, as well as signal transduction (Figure 6E). These enrichment analyses related to disease resistance were mainly classified into seven categories: 307 genes related to plant hormones (ABA, SA, MeJA, ET, IAA, etc.), 289 genes related to transcription factors (AP2/ERF, WRKY, MYB, bHLH, CRF, EFR, etc.), 173 genes related to plant phenylpropane metabolism pathways (PER, BGLU, PAL, 4-CL, CCoAOMT, etc.), 100 genes related to plant redox (RBOHs, APX, CAT, POD, GPX, etc.), 66 genes related to disease progression (MLP, MLO, and TMVR), 47 genes related to enzymes (MAPK kinase, LRR-RLK, chitinase, cellulase, etc.), and nine genes related to cell wall decoration (Figure 6C).
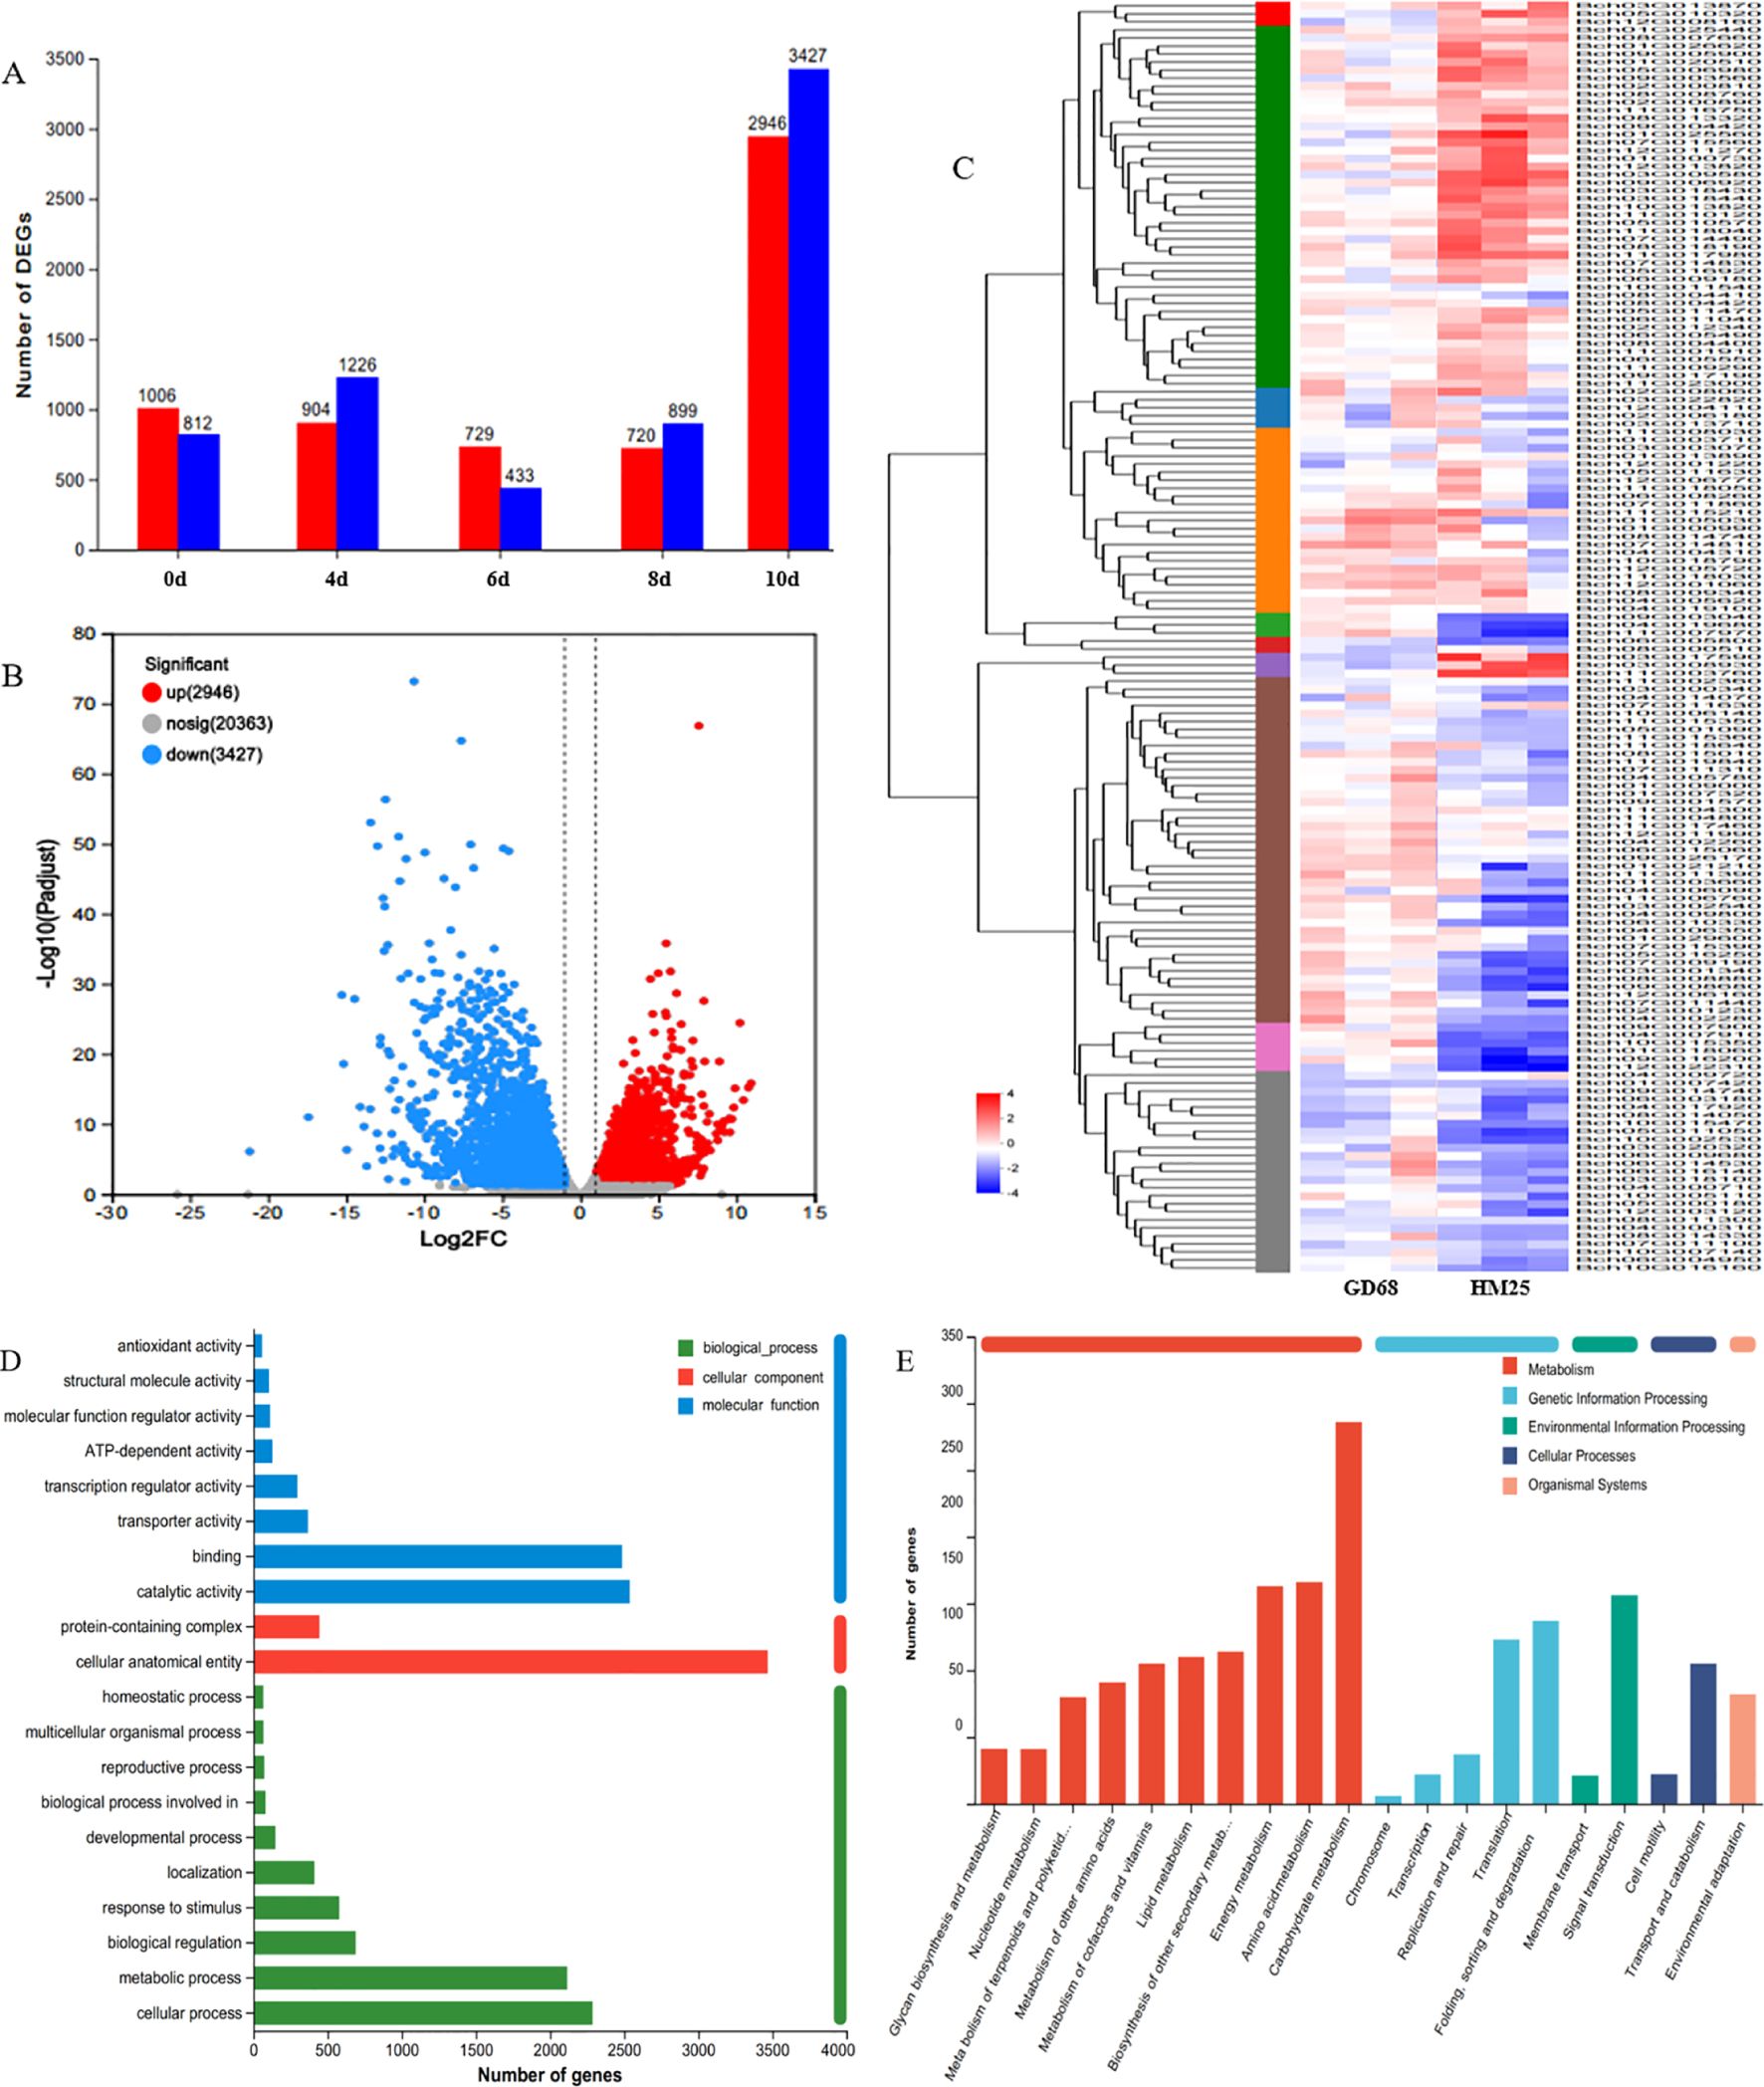
Figure 6. Molecular pathway analysis of Fob1(t). (A–E) The images show the differential gene statistics diagram, volcano diagram, heatmap diagram, Gene Ontology (GO) annotation diagram, and Kyoto Encyclopedia of Genes and Genomes (KEGG) annotation diagram, with three types of biology per sample.
3.6 Development and application of molecular markers
Finally, two markers (3M9.425 and 3M16.869) were developed for the resistance genes Fob1(t) to apply marker-assisted selection (MAS). The InDel marker (3M9.425) showed a deletion of 58 bp in GD68 compared to HM25. After the PCR product was electrophoretically analyzed on an agarose gel, yielding one band of 243 bp in GD68, the susceptible varieties presented one band of approximately 301 bp (Figure 7A, lanes 1 and 2; Supplementary Figure S1). The InDel marker (3M16.869) possessed an insertion of 42 bp in GD68 compared to HM25. Although it yielded one band of approximately 420 bp in GD68, the susceptible varieties showed one band of approximately 378 bp (Figure 7B, lanes 1 and 2; Supplementary Figure S2).
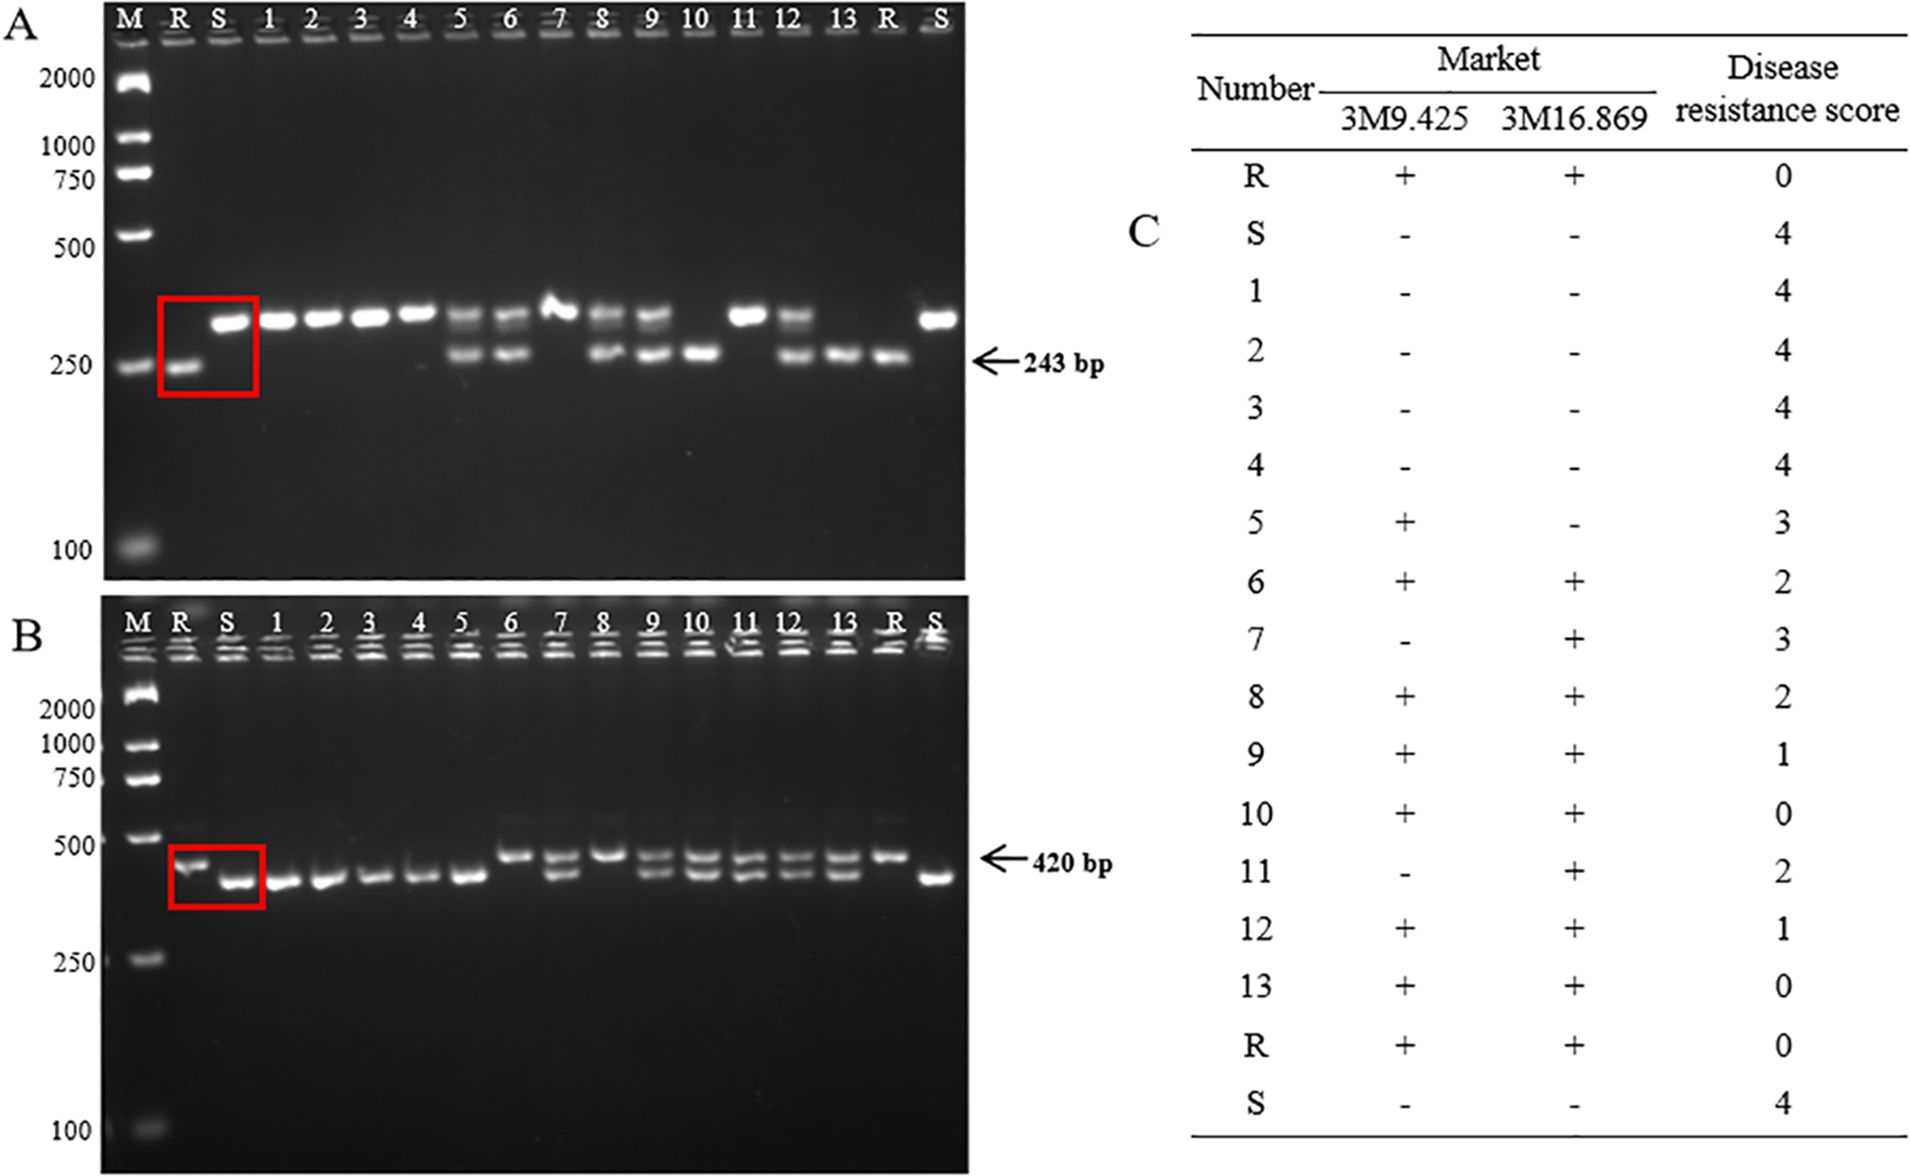
Figure 7. Marker-assisted selection detection. The images show the detection of markers 3M9.425 (A) and 3M16.869 (B) in 2.5% agarose gel. M refers to the BM2000 DNA marker, and the sizes of the bands from top to bottom are 2,000, 1,000, 750, 500, 250, and 100 bp, respectively. R indicates GD68, and S refers to HM25. Lanes 1–4 are four negative wax gourd materials without the Fob1(t) gene. Lanes 5–13 are partial HM25/GD68 F2 selected individual plants. The arrow indicates the target band of the resistant parent. (C) The table presents the resistance grading values of Fusarium wilt (FW) corresponding to “+” and “−”, where “+” indicates that the molecular test result is positive with the Fob1(t) gene and “−” the molecular test result is negative without the Fob1(t) gene.
These two markers were validated with 13 wax gourd accessions, including four susceptible varieties and nine HM25/GD68 F2 individuals’ plants. The bands of four susceptible varieties were consistent with HM25, whereas those of nine HM25/GD68 F2 individual plants were consistent with GD68. The result of the detected markers was consistent with FW resistance identification (Figure 7C). Together, these findings indicated that two markers could be used for MAS.
4 Discussion
F. oxysporum, which is the main cause of melon wilt, is a worldwide soil pathogen fungus with a wide host range. Currently, two resistance genes have been cloned on melon, Fom-1 and Fom-1, both of which belong to R-type protein, where Fom-1 is an NB-ARC protein and Fom-2 is an NBS-LRR protein (Brotman et al., 2013; Joobeur et al., 2004). In addition, some FW resistance genes are also mapped in cucurbits. QTL fw2.1 was accurately located within the 0.60-Mb interval and transcriptome screening analysis revealed five genes were significantly induced by FW (calmodulin protein, an edited transmembrane protein, and a serine-rich protein, among others) (Dong et al., 2019). In another instance, Wang and colleagues conducted a genome-wide association analysis of 192 bitter gourd germplasms for FW and analyzed candidate genes; potassium transporter 5-like (encoded by LOC111013191) was homologous to Arabidopsis CCC1 protein (proven to enhance Arabidopsis resistance to Pseudomonas syringae), which may be a candidate gene for resistance to FW (Wang, 2022). In this study, a major gene was identified for resistance to FW in wax gourd, currently inferred to be an edited endogenous chitinase gene Bch03G006380. The expression level of Bch03G006380 showed significant differences after being infected by FW, indicating that it could mediate the synthesis of chitin-related genes and substances. The transcriptome analysis revealed that Fob1(t) could participate mainly in seven ways related to disease resistance, namely plant hormones, transcription factors, phenylpropane metabolism, oxidation–reduction, disease progression, enzymes, and cell wall modification, enhancing FW resistance in GD68. Nevertheless, the specific regulation mechanism remains to be further validated.
MAS is an effective molecular breeding technique widely used in breeding programs for FW resistance. Currently, the common markers include Cleaved Amplified Polymorphic Sequences/derived Cleaved Amplified Polymorphic Sequences (CAPS/dCAPS), Simple Sequence Repeat (SSR), and InDel marker. These markers can assist in the screening of positive individual plants in breeding and greatly accelerate the process of breeding. For instance, Zhang and colleagues developed three linked CAPS/dCAPS markers for the watermelon variety ‘Calhourn Gray’ FW resistance gene Fon-1. In contrast, Li and colleagues developed an InDel marker closely linked to the disease-resistance gene Fon-1 carried in the watermelon cultivar ‘ZXG01478’ (Zhang et al., 2013; Li et al., 2017). In another instance, Zhou and coworkers developed nine SSR markers tightly linked to the cucumber FW resistance gene Foc-4. Dong and group demonstrated five InDel markers for the main stabilization point of cucumber resistance fw2.1 (Zhou et al., 2015; Dong et al., 2019); Wang and colleagues developed CAPS markers for two SNP sites of Fom-2 and successfully converted them into functional markers (Wang, 2010). In this study, two InDel markers (3M9.425 and 3M16.689) were closely linked and separated with resistance genes Fob1(t), which were clearly polymorphous. Further, the traditional agarose gel electrophoresis could effectively assist in the selection of positive individuals during breeding, overcoming the outstanding problems of low efficiency and poor accuracy of target character selection in traditional breeding for disease resistance. This study substantially provided scientific and technological support for breeding new varieties with disease resistance, thus promoting the breeding process of wax gourd for resistance to FW.
Data availability statement
The original contributions presented in this study are publicly available. The data sets presented in NCBI, PRJNA1264041.
Author contributions
FL: Conceptualization, Data curation, Writing – original draft, Writing – review & editing. JQ: Data curation, Formal analysis, Writing – original draft. JL: Data curation, Formal analysis, Writing – original draft. LC: Investigation, Methodology, Writing – original draft. XH: Project administration, Resources, Writing – original draft. XZ: Software, Validation, Writing – original draft. YM: Supervision, Visualization, Writing – original draft. HL: Investigation, Visualization, Writing – original draft. PW: Conceptualization, Writing – review & editing. YL: Conceptualization, Funding acquisition, Writing – review & editing. YW: Conceptualization, Funding acquisition, Writing – review & editing.
Funding
The author(s) declare that financial support was received for the research and/or publication of this article. This research was funded by a grant from the National Natural Science Foundation of China (32160707), Guangxi Science and Technology Major Program (Guike AA22068086), Guangxi Key Research and Development Program (Guike AB21220029), Postdoctoral Fund Project of Guangxi Academy of Agricultural Sciences (Guinongkebo 2023048), and the Guangxi Vegetable Innovation Team Construction Special Project (nycytxgxcxtd-2023-10-02).
Conflict of interest
The authors declare that the research was conducted in the absence of any commercial or financial relationships that could be construed as a potential conflict of interest.
Generative AI statement
The author(s) declare that no Generative AI was used in the creation of this manuscript.
Publisher’s note
All claims expressed in this article are solely those of the authors and do not necessarily represent those of their affiliated organizations, or those of the publisher, the editors and the reviewers. Any product that may be evaluated in this article, or claim that may be made by its manufacturer, is not guaranteed or endorsed by the publisher.
Supplementary material
The Supplementary Material for this article can be found online at: https://www.frontiersin.org/articles/10.3389/fpls.2025.1555316/full#supplementary-material
Supplementary Figure 1 | Marker 3M9.425 detection in 2.5% agarose gel;
Supplementary Figure 2 | Marker 3M16.869 detection in 2.5% agarose gel;
Supplementary Table 1 | Primer list.
References
An, Z., Xie, D., Peng, Q., and He, X. (2011). Comparison of genomic DNA extraction methods in chieh-qua (Benincasa hispida). China Cucurbits Veg. 24, 1–4.
Branham, S., Levi, A., and Wechter, W. (2019). QTL mapping identifies novel source of resistance to fusarium wilt race 1 in citrullus amarus. Plant Dis. 103, 1–26. doi: 10.1094/PDIS-09-18-1677-RE
Branham, S., Wechter, W., Ling, K., Chanda, B., Massey, L., Zhao, G., et al. (2020). QTL mapping of resistance to Fusarium oxysporum f. sp. niveum race 2 and Papaya ringspot virus in Citrullus amarus. Theor. Appl. Genet. 133, 677–687. doi: 10.1007/s00122-019-03500-3
Brotman, Y., Normantovich, M., Goldenberg, Z., Zvirin, Z., Kovalski, I., Stovbun, N., et al. (2013). Dual resistance of melon to Fusarium oxysporum races 0 and 2 and to Papaya ring-spot virus is controlled by a pair of head-to-head-oriented NB-LRR genes of unusual architecture. Mol. Plant 6, 235–238. doi: 10.1093/mp/sss121
Cheng, Z., Liu, Z., Xu, Y., Ma, L., Chen, J., Gou, J., et al. (2021). Fine mapping and identification of the candidate gene BFS for fruit shape in wax gourd (Benincasa hispida). Theor. Appl. Genet. 134, 3983–3995. doi: 10.1007/s00122-021-03942-8
Chu, Y., Xu, Y., Liao, S., Zhang, M., and Zhang, Y. (2006). Research progress on the nutritional value and comprehensive utilization of winter melon. China Fruit Veg. 5, 46–47.
Dong, J., Xu, J., Xu, X., Xu, Q., and Chen, X. (20191425). Inheritance and quantitative trait locus mapping of Fusarium wilt resistance in cucumber. Front. Plant Sci. 10. doi: 10.3389/fpls.2019.01425
He, X., Peng, Q., Wang, M., and Yan, J. (2021). Research progresses in genetic breeding of chieh-qua in China. Guangdong Agric. Sci. 48, 1–11.
Jiang, B., Liu, W., Xie, D., He, X., and Peng, Q. (2013). Phylogenetic relationships of wax gourd (Benincasa hispida) germplasms based on ISSR markers. Chin. J. Trop. Crops. 34, 616–620.
Jing, X., Luo, Y., Qin, Z., Li, X., Yan, H., and Liu, X. (2019). Biological characteristics and fungicidal toxicity determination of Fusarium oxysporum. Chin. J. Grassland. 41, 144–151.
Joobeur, T., King, J., Nolin, S., Thomas, C., and Dean, R. (2004). The fusarium wilt resistance locus fom-2 of melon contains a single resistance gene with complex features. Plant J. 39, 283–297. doi: 10.1111/j.1365-313X.2004.02134.x
Kang, D., Chen, Z., Wu, Y., Li, W., Huang, H., Li, Y., et al. (2012). Identification of wax gourd wilt pathogens and field resistance of germplasm resources to fusarium wilt. Southwest China J. Agric. Sci. 25, 1698–1702.
Kim, D., Pertea, G., Trapnell, C., Pimentel, H., Kelley, R., and Salzberg, S. (2013). TopHat2, accurate alignment of transcriptomes in the presence of insertions, deletions and gene fusions. Genome Biol. 14, R36. doi: 10.1186/gb-2013-14-4-r36
Lambel, S., Lanini, B., Vivoda, E., Fauve, J., Patrick Wechter, W., Harris-Shultz, K., et al. (2014). A major QTL associated with Fusarium oxysporum race 1 resistance identified in genetic populations derived from closely related watermelon lines using selective genotyping and genotyping-by-sequencing for SNP discovery. Theor. Appl. Genet. 127, 2105–2115. doi: 10.1007/s00122-014-2363-2
Li, B. and Dewey, C. (2011). RSEM, accurate transcript quantification from RNA-Seq data with or without a reference genome. BMC Bioinform. 12, 323. doi: 10.1186/1471-2105-12-323
Li, N., Wang, J., Shang, J., Li, N., Xu, Y., and Ma, S. (2017). Fine mapping of QTL and development of inDel markers for fusarium oxysporum race 1 resistance in watermelon. Scientia Agric. Sinica. 50, 131–141.
Liang, S., Liu, L., Ren, X., Chen, K., Tang, Q., Wang, Y., et al. (2018). Resistance ldentification to fusarium wilt of wax gourd varieties in dongguan city. Mod. Agric. Sci. Technol. 24, 110–111.
Love, M., Huber, W., and Anders, S. (2014). Moderated estimation of fold change and dispersion for RNA-seq data with DESeq2. Genome Biol. 15, 550. doi: 10.1186/s13059-014-0550-8
Michelmore, R. and Kesseli, I. (1991). Identification of markers linked to disease-resistance genes by bulked segregant analysis, a rapid method to detect markers in specific genomic regions by using segregating populations. Proc. Nat. Acad. Sci. 21, 42. doi: 10.1073/pnas.88.21.9828
Peng, J., Qiao, Y., Li, L., Liu, Y., Zhang, S., and Zhu, D. (2020). Isolation and ITS molecular detection of pathogens brought wilt disease in chieh-qua and luffa. Mol. Plant Breed. 18, 7120–7125.
Pertea, M., Pertea, G., Antonescu, C., Chang, T., Mendell, J., and Salzberg, S. (2015). StringTie enables improved reconstruction of a transcriptome from RNA-seq reads. Nat. Biotechnol. 33, 290–295. doi: 10.1038/nbt.3122
Risser, G., Banihashemi, Z., and Davis, D. (1976). A proposed nomenclature of Fusarium oxysporum f. sp melonis races and resisitance genes. Phytopathology. 66, 1105–1106. doi: 10.1094/Phyto-66-1105
Shen, W. (2012). Biological characteristics and biological control research on four kinds of gourd Fusarium wilt. Sichuan Agric. Univ.
Shi, B., Guan, F., Zhang, J., Wan, X., Zhang, H., and Huang, G. (2022). Advance of research in Fusarium wilt of wax gourd. China Cucurbits Veg. 35, 11–14.
Trapnell, C., Williams, B., Pertea, G., Mortazavi, A., Kwan, G., van Baren, M., et al. (2010). Transcript assembly and quantification by RNA-Seq reveals unannotated transcripts and isoform switching during cell differentiation. Nat. Biotechnol. 28, 511–515. doi: 10.1038/nbt.1621
Wang, S. (2010). Development and utilization of functional marker for the fusarium wilt resistance gene Fom-2 in melon (Cucumis melo L.) based on single nucleotide polymorphism. Zhejiang Univ.
Wang, J. (2013). QTL iciMapping, integrated software for building linkage maps and mapping quantitative trait genes. Int. Plant Anim. Genome Conf. XXI. 0.
Wang, Y. (2022). Genome-wide association analysis of resistance to fusarium wilt in bitter gourd germplasm. Hainan Univ.
Wu, Y., Li, Y., Li, W., Wang, Y., Kang, D., Jiang, Y., et al. (2019). A new black peel wax gourd F1 hybrid ‘Guishu no.6’. China Veg. 5, 83–85.
Xie, D., He, X., Liu, W., Peng, Q., Jiang, B., and Zhao, Q. (2013). A new hybrid winter gourd cultivar ‘Tiezhu’. Acta Hortic. Sinica. 40 , 2091–2092.
Xie, D., He, X., and Peng, Q. (2009a). Identification and evaluation of Benincasa hispida cogn. Germplasm resources. China Veg. 8, 36–41.
Xie, D., He, X., Peng, Q., and Li, H. (2009b). Inheritance of resistance to fusarium wilt in winter melon. Chin. J. Trop. Crops. 30, 1005–1008.
Xie, D., Jiang, B., Liu, W., Peng, Q., and Lin, Y. (2017). A new hybrid winter gourd cultivar ‘Tiezhu no.2’. Acta Hortic. Sin. 44 , 1625–1626.
Xie, D., Jiang, B., Liu, W., Xue, S., and Zhang, B. (2020). Research progress in diversification breeding of high-quality and disease resistant on wax gourd. Guangdong Agric. Sci. 47, 50–59.
Yang, M., Xia, L., Liang, X., Han, X., and Yang, X. (2024). Localization of melon wilt resistance-related genes based on BSA-seg and annotation of candidate genes. Mol. Plant Breed. 22, 3156–3165.
Zeng, L., Chen, K., Du, C., Li, H., Miao, B., Mo, W., et al. (2024). lsolation and identification of Fusarium wilt pathogen from wax gourd and identification of resistance of wax gourd germplasm. China Cucurbits Veg. 37, 64–75.
Zeng, H., He, L., Ye, P., and Li, Q. (2004). Identification and method study of resistance to wilt disease in winter melon varieties. Proceedings of the academic annual meeting of chinese society for plant pathology, beijing. China Agric. Sci. Technol. Press, 340–344.
Zeng, H., Ye, P., He, L., and Li, Q. (2006). Resistance evaluation of white gourd resources to Fusarium Wilt (C)//. Proc. 2006 Annu. Meeting Chin. Soc. Plant Pathol., 251–255.
Zhang, S., Miao, H., Yang, Y., Xie, B., Wang, Y., and Gu, X. (2014). A major quantitative trait locus conferring resistance to fusarium wilt was detected in cucumber by using recombinant inbred lines. Mol. Breed. 34, 1805–1815. doi: 10.1007/s11032-014-0140-1
Zhang, Y., Zhang, H., Guo, S., Ren, Y., Zhang, J., Geng, L., et al. (2013). Developments of molecular markers tightly linked to Fon-1 for resistance to Fusarium oxysporm f. sp. Niveum rece 1 in watermelon. Scientia Agric. Sinica. 46, 2085–2093.
Zhao, K., Wu, Y., Zhang, C., Li, W., Li, Y., Mo, Y., et al. (2017). A new black peel wax gourd F1 hybrid- ‘Guishu no.8’. China Veg. 10, 78–80.
Zhou, S., Chen, X., Zhu, Y., Chen, L., and Zhang, P. (2014). Research progress and suggestion on germplasms of ash gourd and chieh-qua. Plant Genet. Resour. 15, 211–214.
Zhou, H., Dong, C., Zhang, H., Ren, Y., Guo, S., Yang, W., et al. (2015). SSR molecular markers and localization of the gene foc-4 linked to the resistance to fusarium wilt of cucumber. Mol. Plant Breed. 13, 1980–1986.
Zhou, X. and Everts, K. (2001). First report of the occurrence of Fusarium oysporum, f, sp, niveum race 2 in commercial watermelon production areas of maryland and delaware. Plant Dis. 85, 1291. doi: 10.1094/PDIS.2001.85.12.1291C
Keywords: wax gourd, Fusarium Wilt, bulked segregant analysis sequencing (BSA-seq), gene mapping, marker-assisted selection (MAS)
Citation: Li F, Qin J, Li J, Cheng L, He X, Zhong X, Mo Y, Liang H, Wang P, Li Y and Wu Y (2025) Fine mapping and characterization of Fusarium wilt (Fusarium oxysporum f. sp. benincasae) resistance gene Fob1(t) in wax gourd (Benincasa hispida Cogn.). Front. Plant Sci. 16:1555316. doi: 10.3389/fpls.2025.1555316
Received: 04 January 2025; Accepted: 15 April 2025;
Published: 26 May 2025.
Edited by:
Jianping Wang, University of Florida, United StatesReviewed by:
Qibin Wu, Chinese Academy of Tropical Agricultural Sciences, ChinaJingping Dong, Yangzhou University, China
Rashid Waqas, University of Agriculture, Faisalabad, Pakistan
Copyright © 2025 Li, Qin, Li, Cheng, He, Zhong, Mo, Liang, Wang, Li and Wu. This is an open-access article distributed under the terms of the Creative Commons Attribution License (CC BY). The use, distribution or reproduction in other forums is permitted, provided the original author(s) and the copyright owner(s) are credited and that the original publication in this journal is cited, in accordance with accepted academic practice. No use, distribution or reproduction is permitted which does not comply with these terms.
*Correspondence: Peng Wang, d2FuZ3BlbmdAZ3h1LmVkdS5jbg==; Yan Li, bHlseUBneGFhcy5uZXQ=; Yongguan Wu, d3lnQGd4YWFzLm5ldA==