 Yanyan Zhang
 Tingting Yang
 Xiangpei Wang
 Feng Xu
 Linlin Du
 Hongmei Wu
- 1College of Pharmacy, Guizhou University of Traditional Chinese Medicine, Guiyang, China
- 2School of Ethnic Medicine, Guizhou Minzu University, Guiyang, China
Introduction: The Gleditsia sinensis Lam. polysaccharide gum contained in G. sinensis seeds is not only an additive specified in national food standards, but also an important strategic resource for industrial raw materials such as oil and natural gas in China.The main component of G. sinensis polysaccharide gum is galactomannan (GM). To date, most studies have focused on the structural modification and component separation of the polysaccharide gum of G. sinensis seeds, with only a few reports on the regulatory genes involved in its formation.
Methods: Transcriptome analysis was performed to assess the gene networks associated with GM synthesis in G. sinensis seeds at four stages: 6, 9, 12, and 16 weeks after flowering.
Results: The result indicated that differential expression analysis identified 20 unigenes linked to five critical enzymes in the GM biosynthesis pathway. Further pathway enrichment analysis demonstrated that fructokinase, galactose gyrase, inositol galactoside synthase, phosphogalactosyltransferase, and raffinose synthase play pivotal roles in GM biosynthesis, positively regulating its production.
Discussion: The results of this study provide new ideas for the research of GM biosynthesis related genes in G. sinensis and enhance the potential application prospects in genetic engineering.
1 Introduction
Dried and mature seeds of leguminous plant Gleditsia sinensis Lam., also known as Zaojiazi (Liu and Zhao, 2009), are warm and exhibit a pungent taste, aligning with the lung and large intestine meridians in traditional Chinese medicine. These seeds exhibit various pharmacological benefits, including proper moisturization, promotion of bowel movements, dispelling of wind, nodule dispersion, and swelling reduction. Consequently, they are used to treat various symptoms and conditions, such as constipation, urgent diarrhea with tenesmus, hernia pain, scrofula, swelling, toxicity, and skin diseases. They are listed in the local standards of traditional Chinese medicine in the Shandong and Henan provinces (Hao et al., 2012; Li and Zhang, 2018). Polysaccharide gum derived from G. sinensis seeds is used as an additive according to the national food standards and an industrial raw material for oil and natural gas, serving as an important resource in China (Li et al., 1980; Zhang and Xiao, 1990; Shao and Yuan, 2005; Jiang et al., 2009; Liu, 2022). The main component of G. sinensis polysaccharide gum is galactomannan (GM), which is composed of (1-4) β-D-pyranose mannose groups as the backbone and (1-6)-linked α-D-pyranose galactose residues as the side chains. G. sinensis polysaccharides are composed of mannose, glucose, and galactose (Wu et al., 2025). To date, most studies have focused on the structural modification and component separation of the polysaccharide gum of G. sinensis seeds, with only a few reports on the regulatory genes involved in its formation (Lei et al., 2018; Guo, 2020). Identification of the key regulatory genes in the GM synthesis pathway of G. sinensis seeds will facilitate the enhancement of GM content via genetic engineering, thereby enhancing the quality and yield of G. sinensis polysaccharide gum. This study aimed to establish a solid foundation for G. sinensis molecular breeding. In this study, we conducted transcriptome analysis of G. sinensis seeds at different growth stages to examine the relationships between their growth and developmental stage and GM biosynthesis-related functional gene levels and explore the underlying regulatory mechanisms. This study provides basic information for future research on GM biosynthesis-related gene functions during G. sinensis seed development.
2 Materials and methods
2.1 Plant materials and sampling
Zaojiazi is the dried and mature seed of leguminous plant Gleditsia sinensis Lam., G. sinensis Lam. Seeds were collected from various locations in Guizhou Province, China. Representative distribution areas of G. sinensis in Guizhou: covering karst mountainous areas (Guanling Town), hilly basins (Dangwu Town), plateau plateaus (Jichangba) and other habitats. In southern Guizhou, Lushan Town receives annual precipitation up to 1,300 mm, while in the northwestern Bijie City, rainfall is only 900–1,100 mm. Such humidity variations may significantly affect seed germination rates. Yellow earth (around Guiyang, acidic, low phosphorus), Limestone soil (Guanling Town, Anshun, high calcium content, karst region), Purple soil (Jinbi Town, Qianxi City, relatively fertile). Despite the small geographic scale, Guizhou’s complex topography and microclimates create distinct environmental gradients, affecting the accumulation of G. sinensis seeds GM. Based on the post-flowering period, their growth and developmental stages were categorized into four types: 6, 9, 12, and 16 weeks post-flowering stages. The 6, 9, 12, and 16 weeks post-flowering stages were selected based on the biological characteristics and physiological and biochemical changes during G. sinensis seed development, according to our research objectives. These time points provide systematic and in-depth developmental dynamic information, facilitating the evaluation of the regulatory patterns underlying G. sinensis seed development (McCleary et al., 1987; Li et al., 2018). Ten samples (Table 1) from Guizhou Province were tracked and sampled across the four growth stages. The seeds were confirmed as G. sinensis. seeds by Professor Wang Xiangyu at Guizhou Minzu University. To obtain Gleditsia polysaccharide gum (GPG) for GM content determination, endosperms of seeds at different growth stages were extracted, dried, and pulverized. Fresh seeds were wrapped in aluminum foil, appropriately labeled, stored in liquid nitrogen, and transferred to a –80 °C freezer for long-term preservation. These frozen seeds were used for subsequent RNA extraction and transcriptome sequencing.
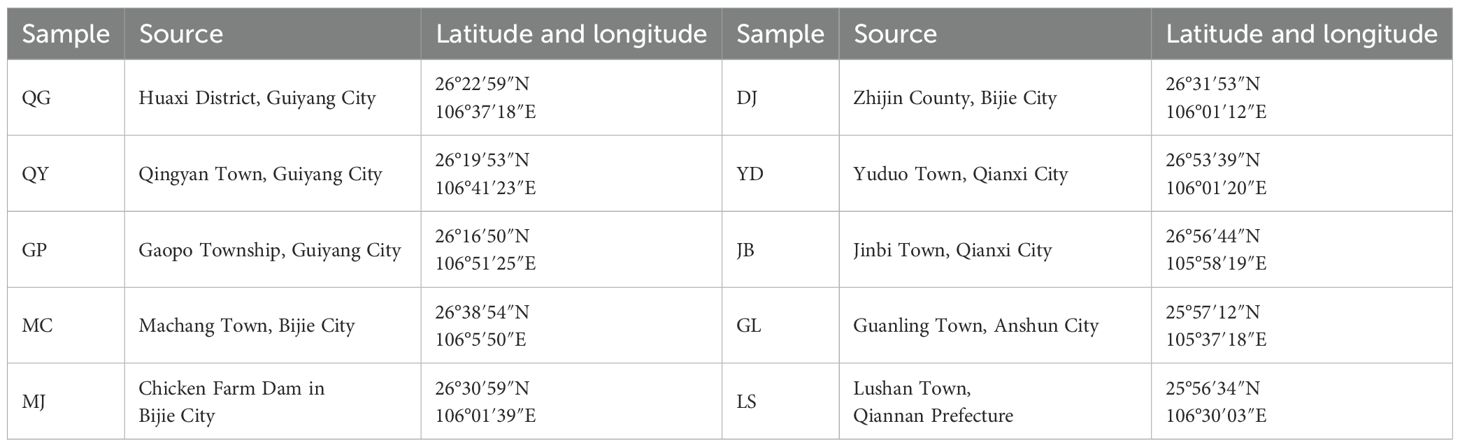
Table 1. Sample sources.
2.2 Experimental instruments and reagents
The following instruments and reagents were used in this study: KZ-III-F High-speed Low-Temperature Tissue Grinder (Wuhan Sevier Biotechnology Co., Ltd.), SYQ-DSX-280B Portable Stainless Steel Pressure Steam Sterilization Pot (Shanghai Shen’an Medical Equipment Factory), Bio Rad Electrophoresis Tank and DYY-6C Electrophoresis Instrument (Beijing Liuyi Instrument Factory), Bio Rad Gel Imaging System XRS+ and MK3 Full Function ELISA Reader (Thermo Fisher Instrument Co., Ltd.), Waters-e2695 HPLC Chromatograph (Waters Corporation, USA), DW-86L386 Ultra-Low Temperature Refrigerator (–80 °C; Haier Group), N60 Ultra Micro Spectrophotometer (IMPLEN GmbH, Germany), Plant RNA Extraction and PCR kits (Tiangen Biochemical Technology Co., Ltd.), and BCD-248-20 °C/4 °C Refrigerator (Electrolux Corporation).
2.3 Determination of GM levels
2.3.1 Sample pretreatment
Endosperms were stripped from the G. sinensis seed samples, dried, powdered, and sieved through a No. 5 sieve to obtain the G. sinensis polysaccharide gum. According to the current standard GB/T 31742-2015 of the People’s Republic of China, 300 mg ± 10 mg of GPG was accurately weighed and placed in a pressure-resistant bottle. Then, 3 mL of 72% sulfuric acid was added, and the mixture was stirred with a glass rod for 1 min. After uniform dispersion, the mixture was placed in a constant temperature water bath at 30 °C for 60 min. Subsequently, 85 mL of deionized water was added to dilute the sulfuric acid to 4%. The pressure-resistant bottle was tightly sealed and placed in an autoclave at 121 °C for 60 min. After removal and cooling, calcium carbonate was added to neutralize the solution and achieve a pH of 5–6. The mixture was centrifuged at 4000 rpm to obtain the supernatant, which was the hydrolyzed sample of GPG.
2.3.2 Preparation of the reference solution
Appropriate amounts of the four monosaccharide references were accurately weighed and dissolved in distilled water to prepare the mixed reference solution with glucose, galactose, D-mannose, and D-xylose concentrations of 2.175, 11.900, 21.780, and 2.418 mg/mL, respectively. This solution was stored at 4 °C for future use.
2.3.3 Preparation of the test solution
Pretreated hydrolyzed sample of GPG or reference solution (1 mL) was placed in a test tube, and 1 mL of 0.3 mol/L NaOH solution was added. After mixing, 1 mL of 0.5 mol/L 1-phenyl-3-methyl-5-pyrazolone-methanol solution was added. The mixture was thoroughly mixed and placed in a water bath at 70 °C for 1 h. After cooling, 1 mL of 0.3 mol/L HCl solution was added to neutralize NaOH. After adding 1 mL of chloroform, the solution was vortexed for 30 s and centrifuged. The chloroform layer was discarded. This extraction process was repeated twice to ensure the complete removal of excess 1-phenyl-3-methyl-5-pyrazolone. Finally, the solution was filtered through a 0.22-µm microporous membrane to obtain the test solution.
2.3.4 Measurement of GM levels
Diamononsil C18 chromatographic column (250 mm × 4.6 mm; 5 μm) was used for chromatography. The mobile phase consisted of acetonitrile (A) and a 0.05 M ammonium acetate solution (B) at a flow rate of 1 mL/min. Injection volume was 10 μL, detection wavelength was 254 nm, and column temperature was 40 °C. Chromatographic separation was performed according to the mobile phase gradient shown in Table 2, with an analysis time of 42 min.
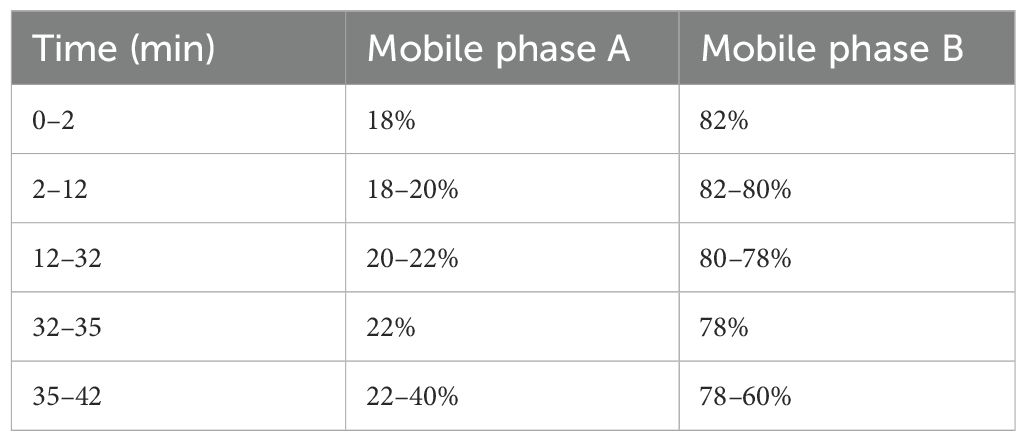
Table 2. Mobile phase gradient elution table.
2.4 Transcriptome sequencing and data analysis
2.4.1 RNA extraction and quality assessment
In total, 12 samples were collected from three biological replicates at each QY1–4 stage. Total RNA was extracted from G. sinensis seeds, following the procedures outlined in the Plant RNA Extraction Kit. Then, OD260/OD280 ratio of RNA was measured using the multifunctional ELISA Reader. Here, 2 µL of RNA solution was used to assess its purity. Subsequently, RNA concentration and quality were assessed using the Agilent 5300 Capillary Electrophoresis system.
2.4.2 Quality control of the sequencing data
Qualified RNA samples were subjected to transcriptome sequencing using the Illumina HiSeq 4000 platform. The sequencing image signals were converted into text signals using CASAVA base calling on the Illumina HiSeq 4000 platform and stored in fastq format as raw data. Raw reads were subjected to quality control using the SeqPrep and Sickle tools to remove the adapter sequences, trim the low-quality bases, discard the reads containing N bases, and eliminate the sequences shorter than 30 bp after trimming. High-quality clean reads were obtained after quality control to ensure the accuracy of subsequent analyses. Trinity software (Fang et al., 2022) was used to cluster the clean reads into unigenes.
2.4.3 Unigene annotation and analysis
TopHat software (Trapnell et al., 2009) was used to align the quality-controlled read data to obtain the mapped reads. The mapped reads were further assembled into transcripts. Basic Local Alignment Search Tool (Ashburner et al., 2000), with E-value ≤ 10-5, was used to annotate the transcripts against six databases: Non-Redundant (NR), Gene Ontology (GO), Evolutionary Genealogy of Genes: Non-Supervised Orthologous Groups (eggNOG), Kyoto Encyclopedia of Genes and Genomes (KEGG), Protein Family, and Swiss-Prot databases (Tatusov et al., 2000; Koonin et al., 2004; Kanehisa et al., 2004; Trapnell et al., 2010; Xie et al., 2011; Huerta-Cepas et al., 2016). Comprehensive annotation information of the transcripts was obtained, and annotation status in each database was statistically summarized.
2.4.4 Differential gene expression analysis
Bowtie (McKenna et al., 2010) was used to align the sequencing reads and unigene data. The alignment results were further analyzed using the RSEM software (Li and Dewey, 2011) to estimate the expression levels, which were represented as the transcripts per million (TPM) values of the corresponding unigenes. Differential gene expression analysis was conducted using the DESeq2 software (Anders and Huber, 2010). Number of differentially expressed genes (DEGs) was counted using false discovery rate < 0.01 and | log2 (FC) | ≥ 2 as the screening criteria. Moreover, Benjamini–Hochberg correction was applied for multiple testing adjustments.
2.5 Statistical analyses
GM content data of various samples were imported into SPSS 26.0 and SIMCA-P 14.0 for comprehensive statistical analyses.
3 Results
3.1 Determination of GM levels
Samples were prepared by processing the polysaccharide gum of G. sinensis collected at different seed growth stages. Each sample was injected three times consecutively, and the peak areas of D-mannose and galactose were recorded. These peak areas were substituted into the corresponding linear regression equations to calculate the proportion of GM in the G. sinensis polysaccharide gum (Table 3). D- mannose: Y=1963.2x+269193, R2 = 0.9994, 2.178~0.218mg/mL; galactose: Y=19896.3x-47828, R2 = 0.9997, 1.19~0.119mg/mL.
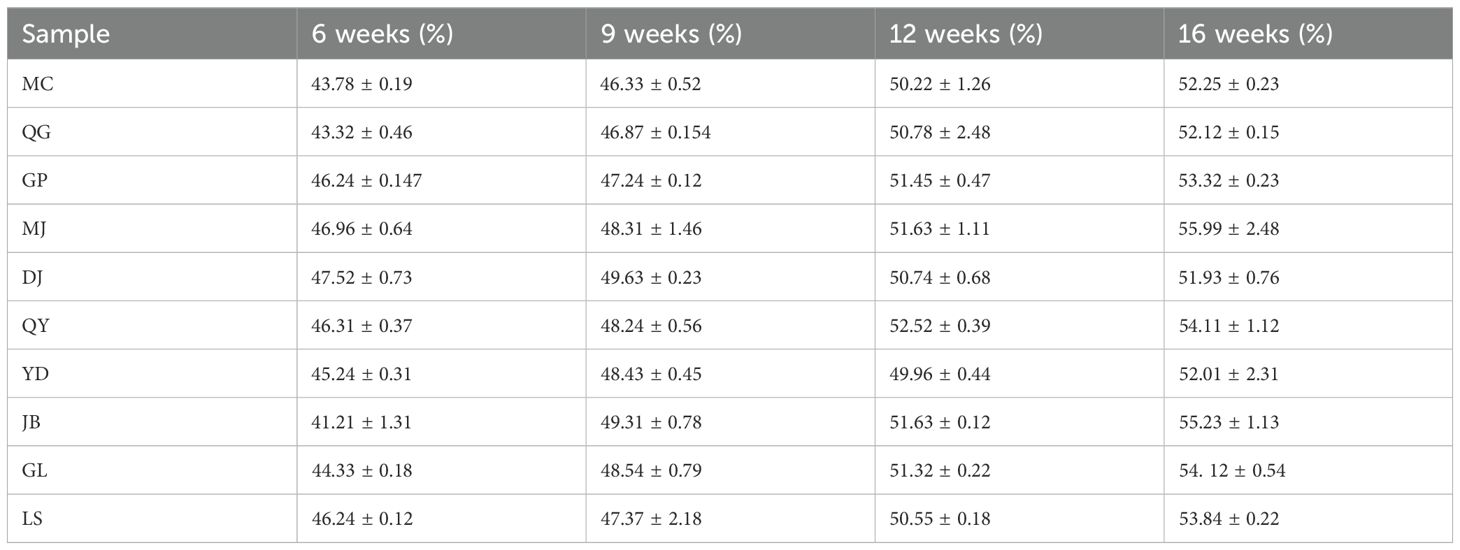
Table 3. GM levels in Gleditsia sinensis seeds (percentage of dry weight) (n = 3).
3.2 Orthogonal partial least-squares discriminant analysis
GM levels in G. sinensis seeds at four different growth stages were used as variables and imported into the SIMCA-P 14.0 software for orthogonal partial least-squares discriminant analysis. In this model, R2X and R2Y were 0.99 and 0.994, respectively, and Q2 was 0.943, all of which were greater than 0.5, confirming that the established model was stable and reliable. Differences in the GM levels of different growth stage samples are shown in Figure 1A. Samples with statistically significant differences were screened by ranking the variable importance in projection values in the model. As shown in Figure 1B, three samples (QY, LS, and GL) exhibited variable importance in projection values > 1. Based on these results, the four growth stages of G. sinensis seeds from the QY sample were selected for subsequent transcriptome analysis.
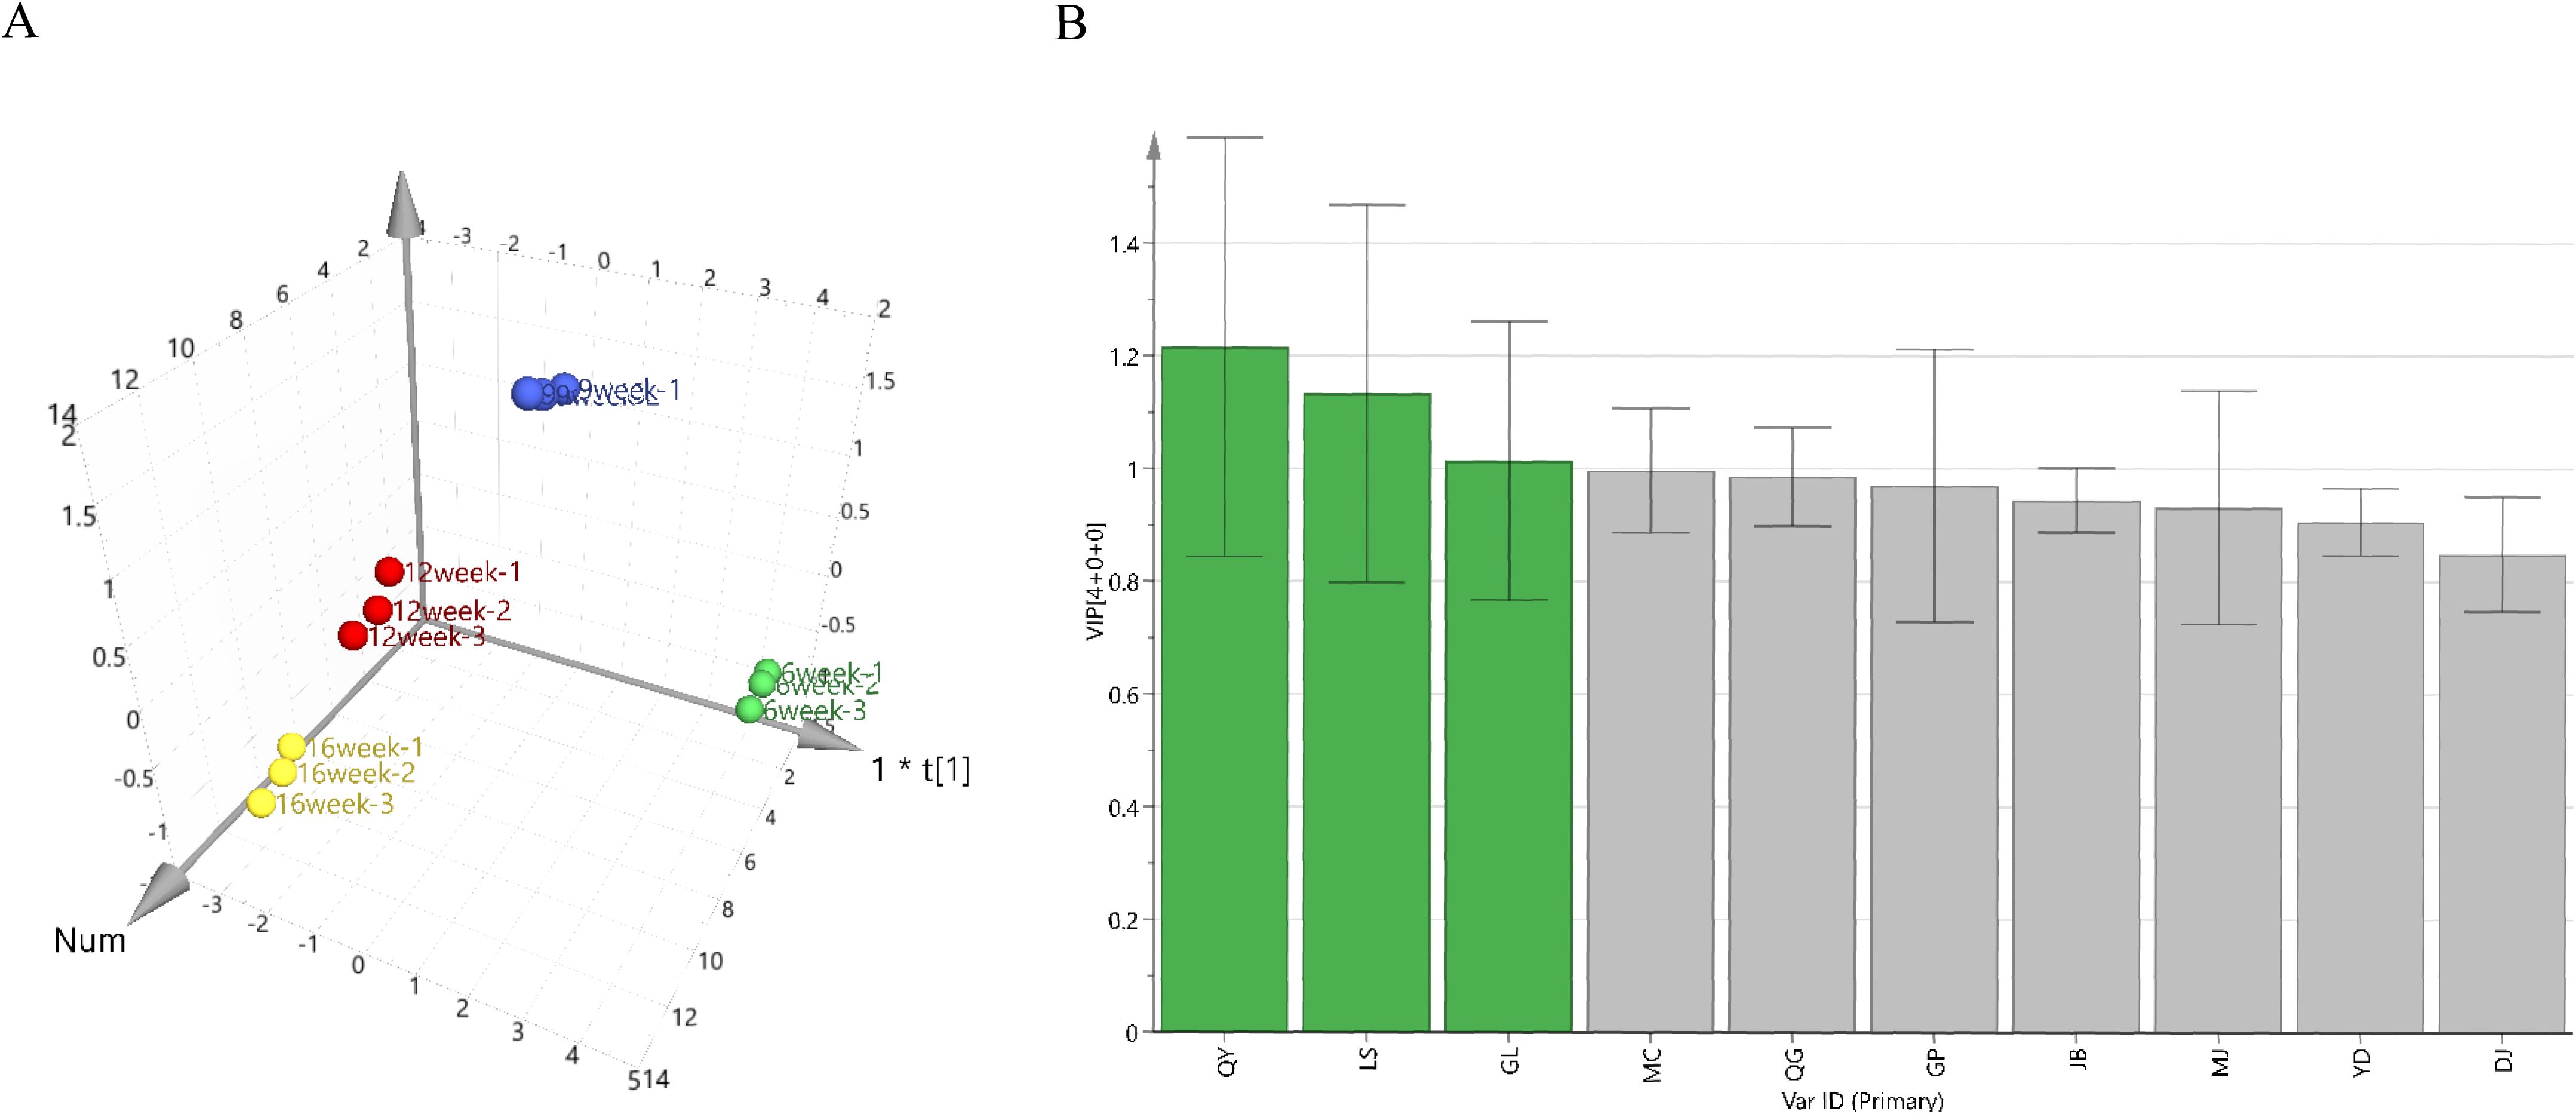
Figure 1. Orthogonal partial least-squares discriminant analysis (OPLS-DA). (A) OPLS-DA model diagram. (B) Differential variable importance in projection (VIP) value graph.
3.3 Sample RNA quality
RNA sample integrity was assessed via 1% agarose gel electrophoresis. RNA purity and concentration in each sample were examined using NanoDrop 2000. Furthermore, RNA quality number was determined using the Agilent 5300 system (Table 4). Notably, RNA quality and integrity of all G. sinensis seed samples were satisfactory, making them suitable for subsequent analysis.
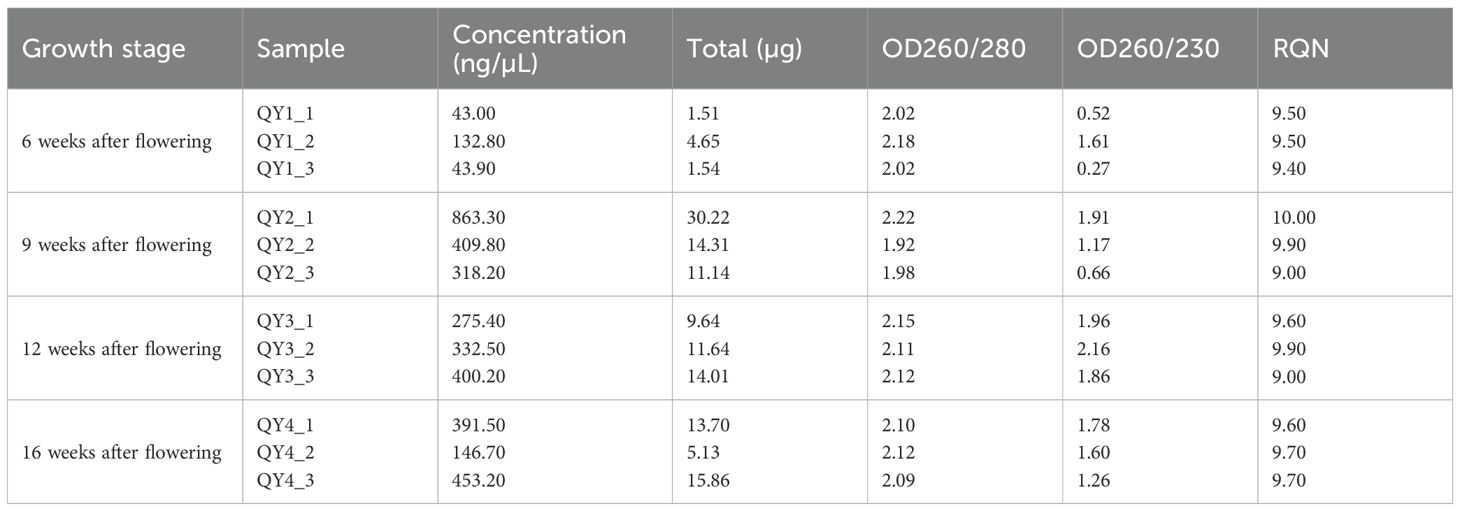
Table 4. RNA quality of each sample.
3.4 Overall transcriptome sequencing analysis
Qualified RNA samples were subjected to high-throughput sequencing using the Illumina HiSeq 4000 platform to obtain the gene expression profiles of G. sinensis seeds at different growth stages. After a series of data filtering and redundancy removal steps, clean data were obtained for 12 samples, totaling 79.13 GB (Table 5). Each sample had clean data exceeding 6.23 GB, with a GC content of 44.45–46.38%. The GC content of Q20 was 97.32–97.84% and Q30 was 92.62–93.72%. These data suggest that the sequencing quality of G. sinensis seeds was high, facilitating further analysis.
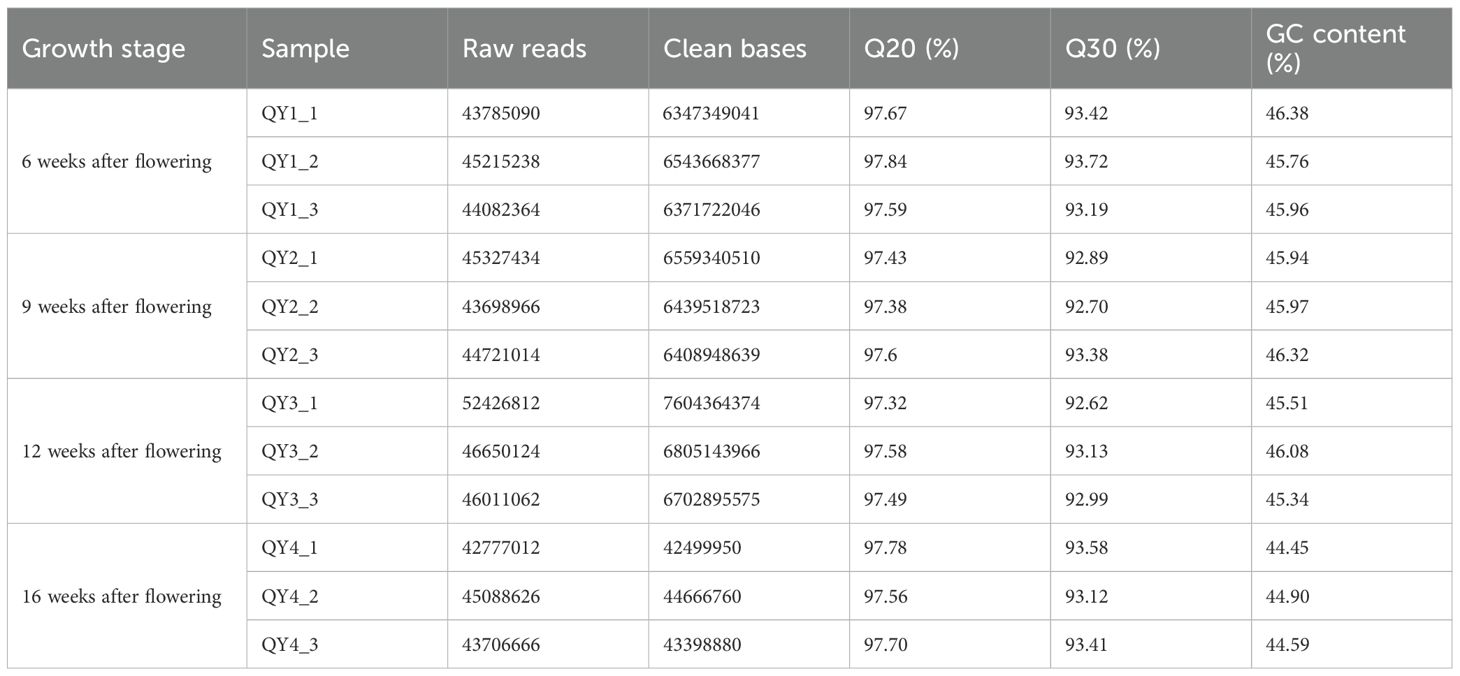
Table 5. Transcriptome sequencing data statistics.
Using the Trinity software, we performed de novo assembly of the clean data of all samples and conducted an optimized evaluation of the assembly results. Number of assembled unigenes was 110,141, and the number of transcripts was 199,142. Average N50 length was 1,425 bp; Table 6). Proportions of transcripts and unigenes with lengths ≥ 1,000 bp were 58.295 and 77.957%, respectively. Collectively, these findings indicate the high sequencing and assembly completeness of the samples.
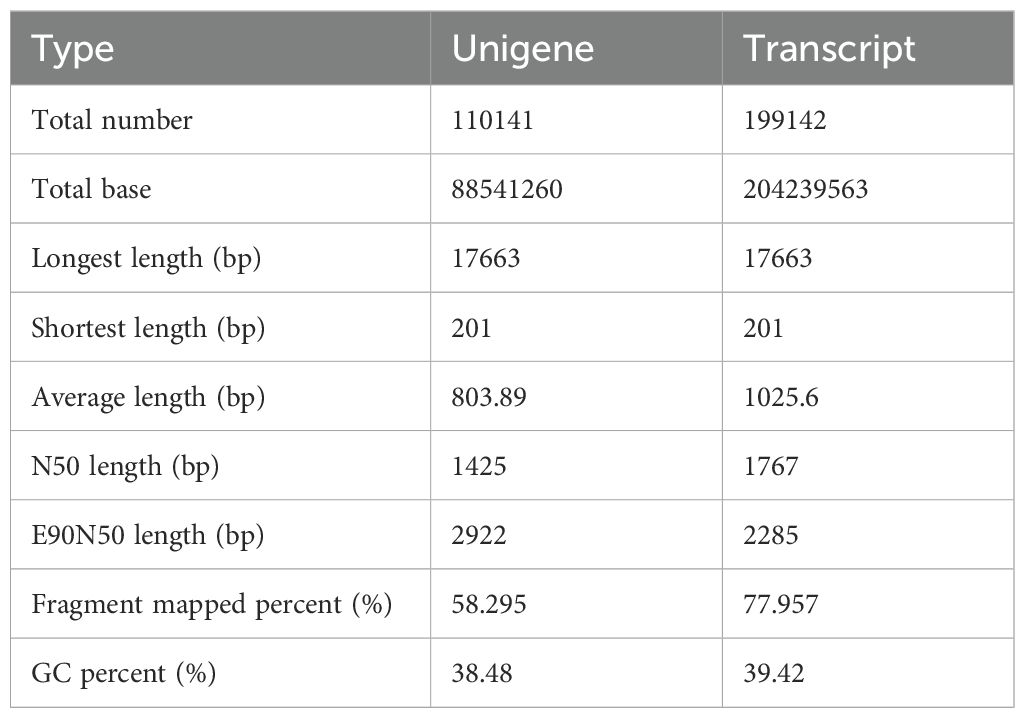
Table 6. Transcript data assembly optimization results.
3.5 Functional annotation of unigenes
Unigenes and transcripts obtained from the assembly of the four developmental stage samples of G. sinensis seeds were annotated and compared against databases, including the GO, KEGG, and Swiss-Prot databases. Annotation results for all databases are presented in Table 7. In total, 214,031 unigenes and 537,031 transcripts were annotated.
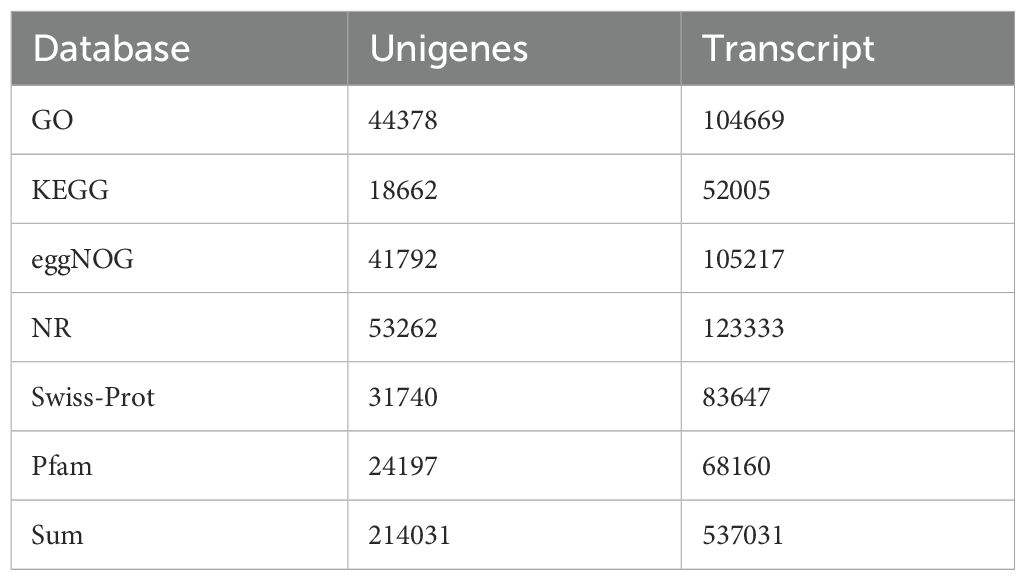
Table 7. Unigene functional annotations in various databases.
Specifically, 53,262 unigenes were annotated using the NR database. Among the species annotated in this database, Senna tora, Prosopis alba, Vitis vinifera, and Cajanus cajan ranked in the top four positions, accounting for 18.99, 14.26, 4.56, and 3.81% of all species, respectively (Figure 2A). GM accumulates extensively in the seed endosperm of many leguminous plants. Previous studies have also characterized the genes involved in GM biosynthesis in various leguminous plants, such as fenugreek (Wang et al., 2012) and guar (Naoumkina et al., 2007). This suggests that the GM synthesis pathway in G. sinensis is similar to that in other leguminous plants, providing a reference for subsequent transcriptome data analysis.
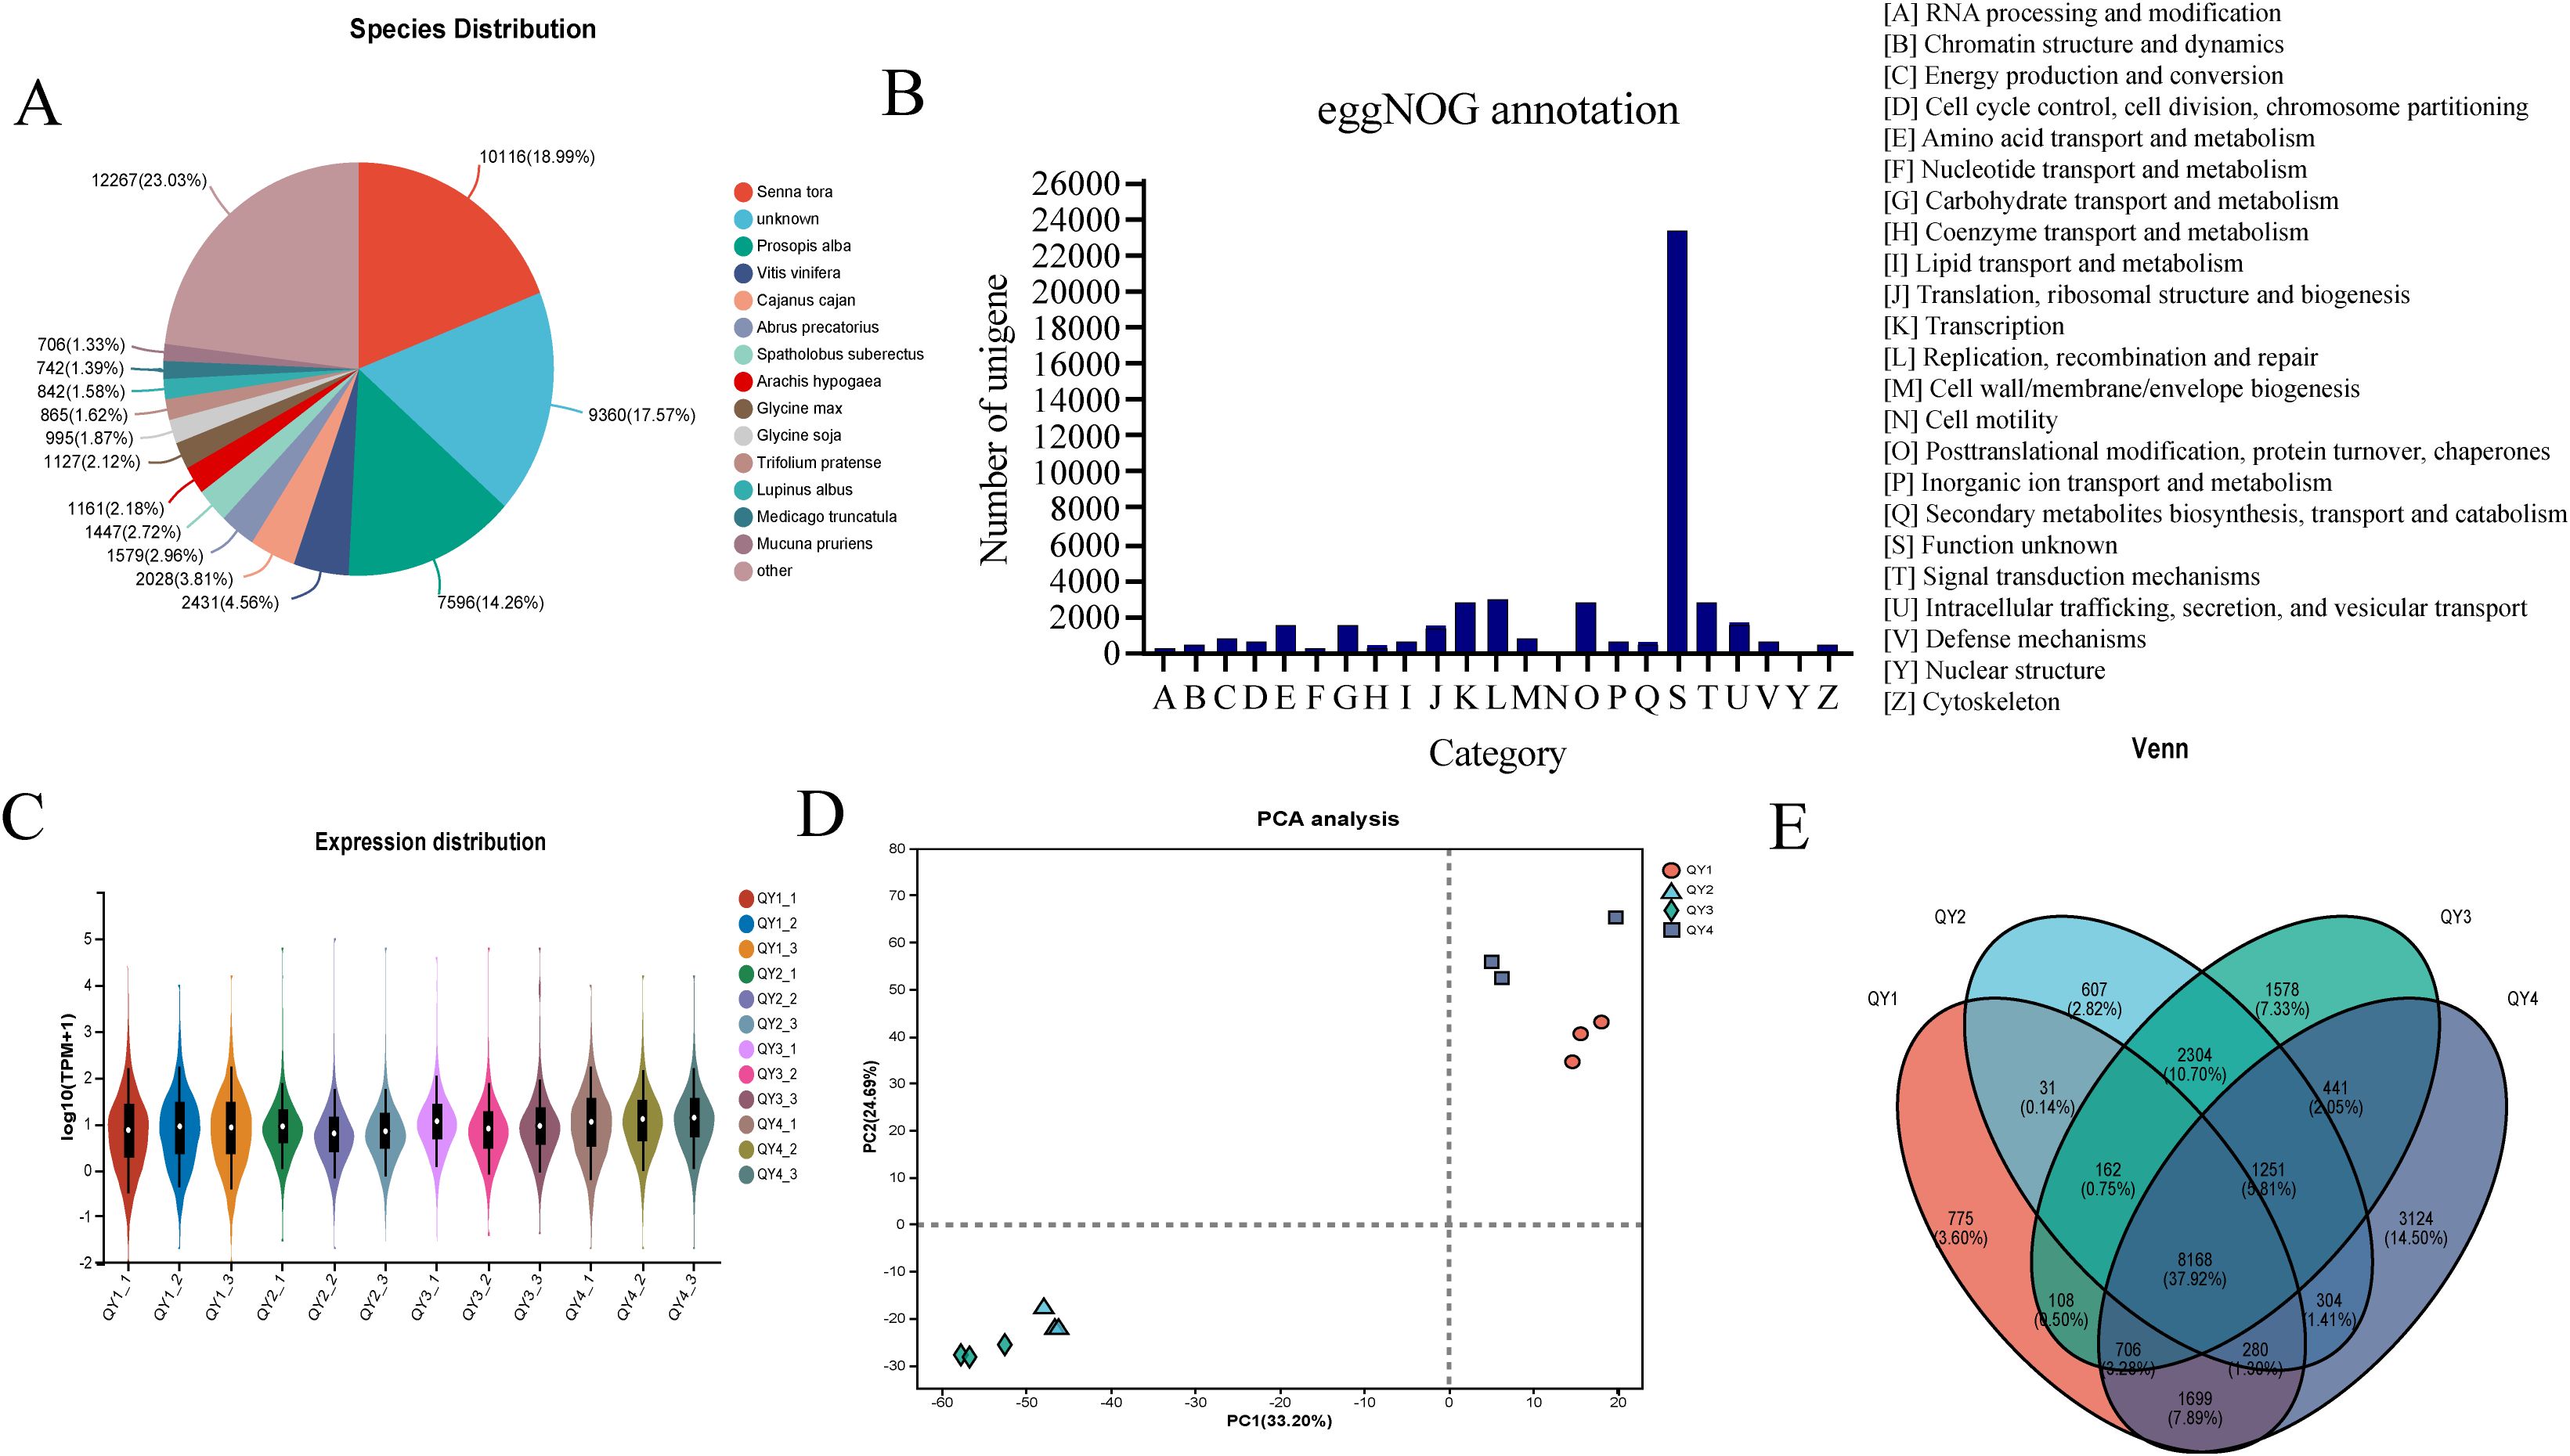
Figure 2. Functional annotation and expression profiling analysis of G. sinensis transcriptome data (A) Species distribution of NR-annotated genes; (B) Functional categorization by eggNOG annotation; (C) Expression level distribution across samples; (D) Principal Component Analysis (PCA) of sample relationships; (E) Comparative Venn diagram of expressed genes.
EggNOG database, which is rich in genomic information, was used to further investigate the functions of the identified genes via functional annotation, which resulted in 24 functional categories (Figure 2B). The category with the highest number of gene annotations was “[S] (function unknown),” encompassing 23,380 genes. This indicates the presence of a substantial number of genes with unknown functions in the G. sinensis seeds, warranting further exploration. The second largest category was “[L]: Replication, recombination and repair),” with 2,885 genes, followed by “[K]: Transcription” with 2,689 genes and “[T]: Signal transduction mechanisms” with 2,731 genes. Additionally, “[G]: Carbohydrate transport and metabolism” category included 1,453 genes. These results provide valuable insights into the GM biosynthesis pathway.
3.6 Gene expression analysis
Quantitative analysis of unigene expression levels was performed using the RSEM software. The number of transcripts was used as a unit, and TPM value served as a quantitative indicator to calculate the expression level of each gene. Logarithmic distribution of unigene expression levels across various samples is shown in Figure 2C. Data of different groups were relatively similar, suggesting that the gene expression patterns were similar among all groups.
Principal component analysis of 12 samples was conducted based on the gene expression levels. The first principal component accounted for 33.20%, whereas the second principal component accounted for 24.69% of the variance in the dataset (Figure 2D). This result suggests that different growth stage samples clustered together, indicating the reliability and effectiveness of biological replication in the selected samples.
Next, Venn diagram analysis of the four developmental stage samples was performed based on the TPM values (Figure 2E). Uniquely expressed genes were identified in each stage (QY1, QY2, QY3, and QY4), resulting in a total of 6,084 NR genes. Additionally, 8,168 common genes were expressed in all stages (QY1–4). These genes possibly play regulatory roles in the growth and development of G. sinensis seeds.
3.7 DEG screening
To investigate the dynamic changes in gene expression levels during G. sinensis seed development, we used the DESeq2 software based on the TPM values to conduct pairwise comparisons of the expressed genes in the four growth stage samples of G. sinensis seeds. The number of DEGs was counted using false discovery rate < 0.01 and | log2 (FC) | ≥ 2. Between QY1 and QY2, 31,655 DEGs, with more downregulated genes (22,036; 69.61%) than upregulated genes (9,619; 30.39%), were identified. Between QY1 and QY3, 33,548 DEGs, including 32.31% upregulated and 67.69% downregulated genes, were identified. Between QY1 and QY4, 8,252 DEGs, including 29.52% upregulated genes, were identified. Between QY2 and QY3, 5,342 DEGs, including 59.51% upregulated genes, were detected. Between QY2 and QY4, 22,016 DEGs, including 64.41% upregulated genes were identified, Between QY3 and QY4, 29,101 DEGs, including 60.18% upregulated genes, were noted (Table 8). In total, 57,767 upregulated and 72,147 downregulated genes were identified.
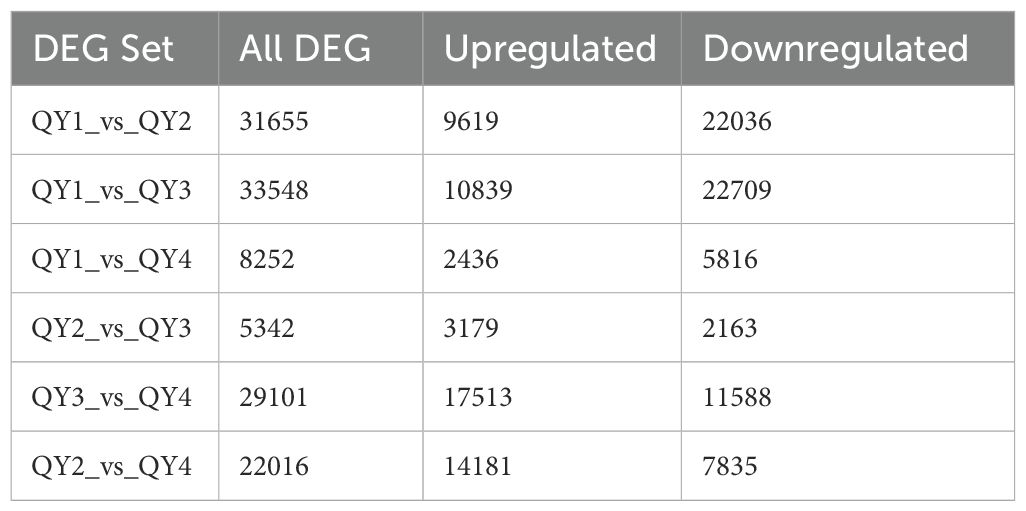
Table 8. List of differentially expressed genes at different growth stages G. sinensis seeds.
DEGs across the four developmental stages of G. sinensis seeds were visualized, and the results are presented in Figure 3. In this figure, abscissa represents the logarithmic value of FC (|log2(FC)|) in gene expression levels between the two samples. High absolute values indicate high fold differences in the expression levels between two samples. The ordinate represents the negative logarithm of the adjusted p-value (–log10 (Padjust)), with high values indicating more significant differential expression, thereby confirming the high reliability of the identified DEGs.
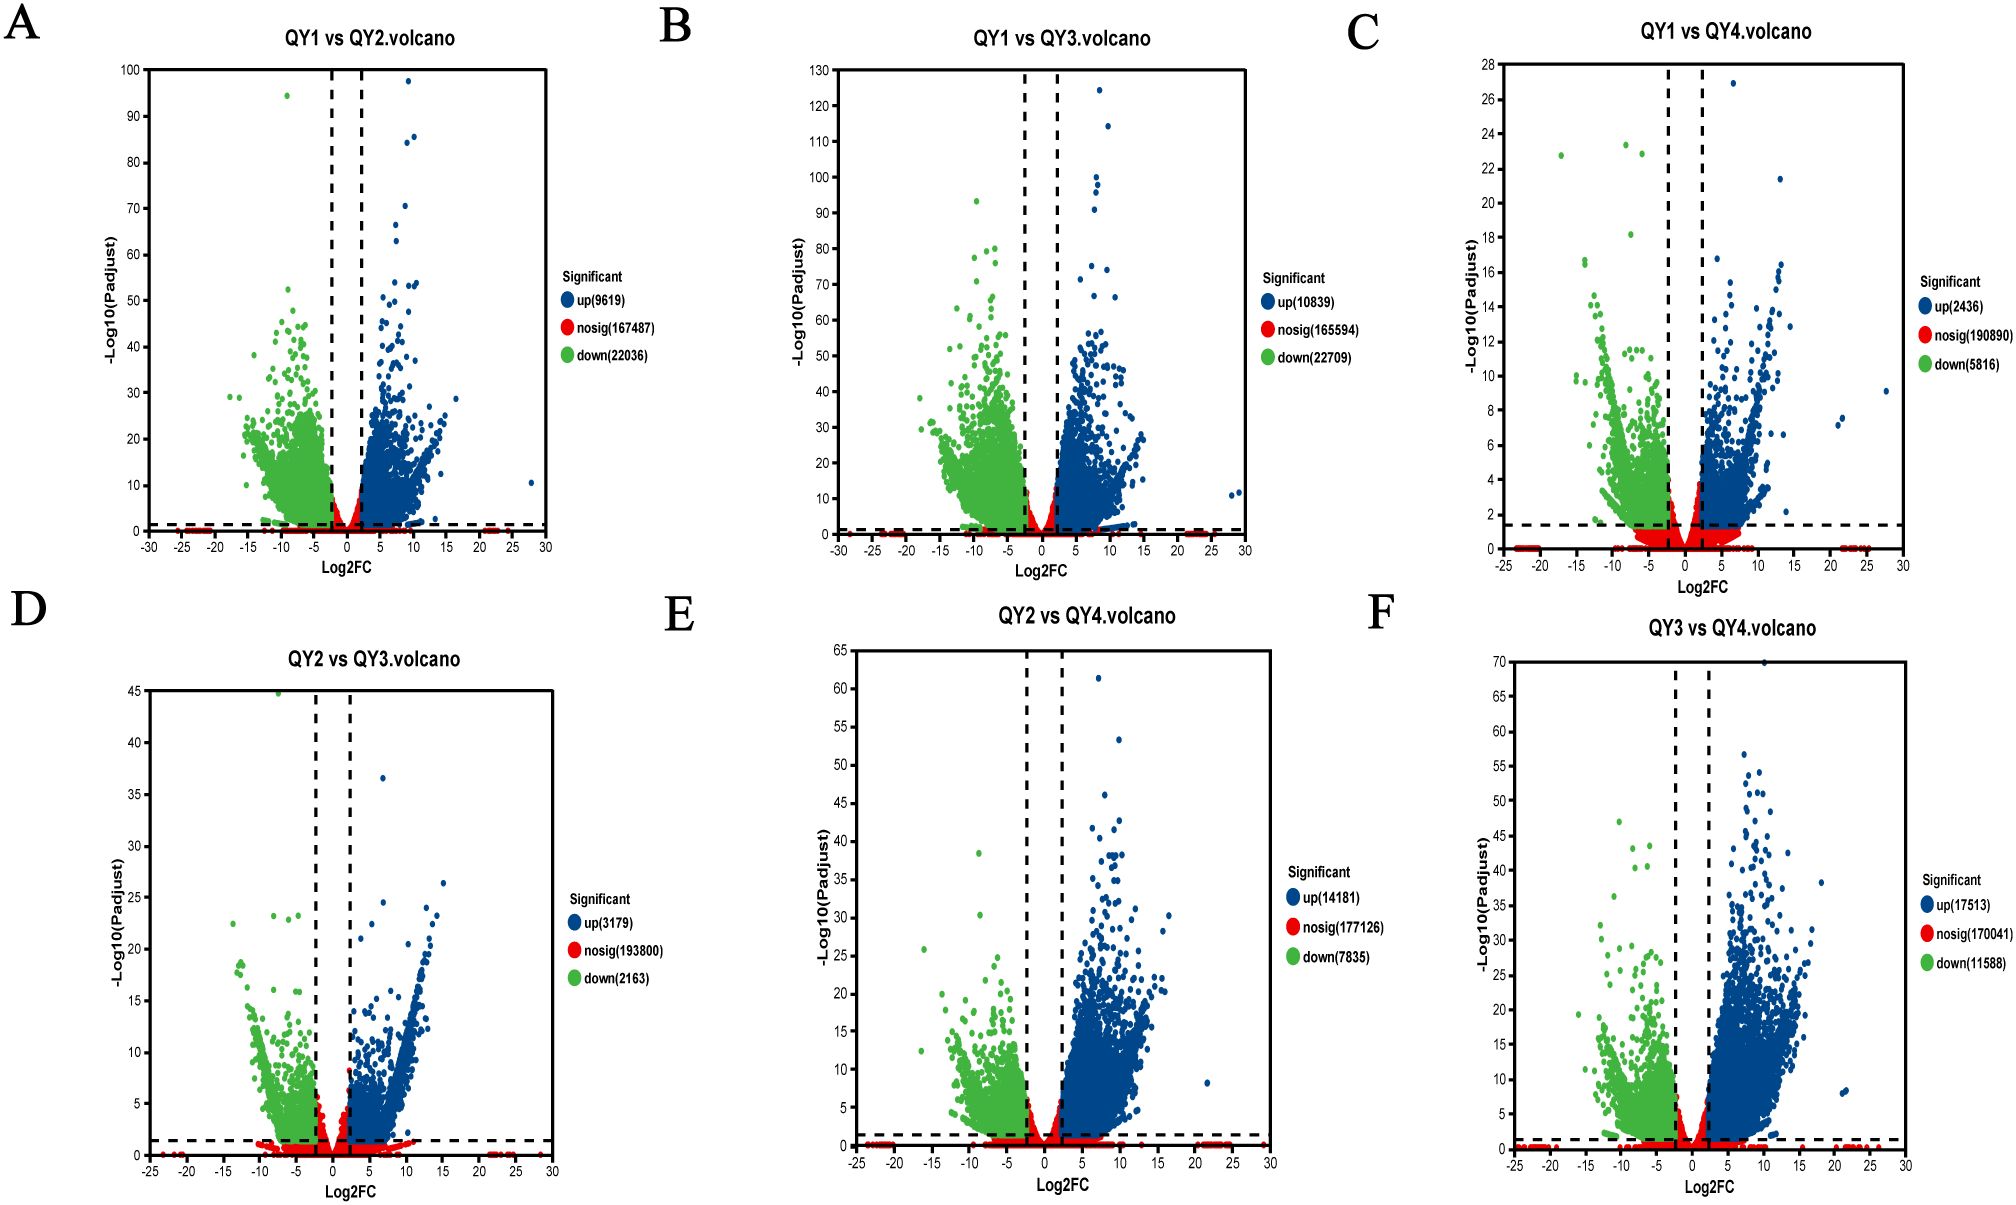
Figure 3. Visualization and functional characterization of differentially expressed genes (DEGs) in G. sinensis seeds across developmental stages. (blue/green dots represent significantly up-/down-regulated genes). (A) QY1 vs QY2; (B) QY1 vs QY3; (C) QY1 vs QY4; (D) QY2 vs QY3; (E) QY2 vs QY4; (F) QY3 vs QY4.
3.8 Cluster analysis
To understand the expression patterns of DEGs, hierarchical clustering analysis was performed for the 6,084 DEGs identified in section 3.6. As shown in Figure 4, all samples clustered into two main groups, with one group including the 6- and 16-week post-flowering stage samples and the other comprising the 9- and 12-week post-flowering stage samples. Clustered expression patterns of the DEG subclasses were further divided into five subgroups. Subcluster 1 was composed of 838 genes, and expression levels of these genes generally increased during the QY1 stage, suggesting that the overall expression levels of these genes are positively correlated with the early growth of G. sinensis seeds. In QY4, expression levels of 1,646 genes in subcluster 2 were generally upregulated. Expression levels of 1,305 genes in subcluster 3 were balanced between QY1 and QY2, increased in QY3, and decreased in QY4. Subcluster 4 contained 1,411 genes, whose expression levels gradually increased from QY1 to QY4. Expression levels of 884 genes in subcluster 5 increased during QY2 and gradually decreased from QY3 to QY4.
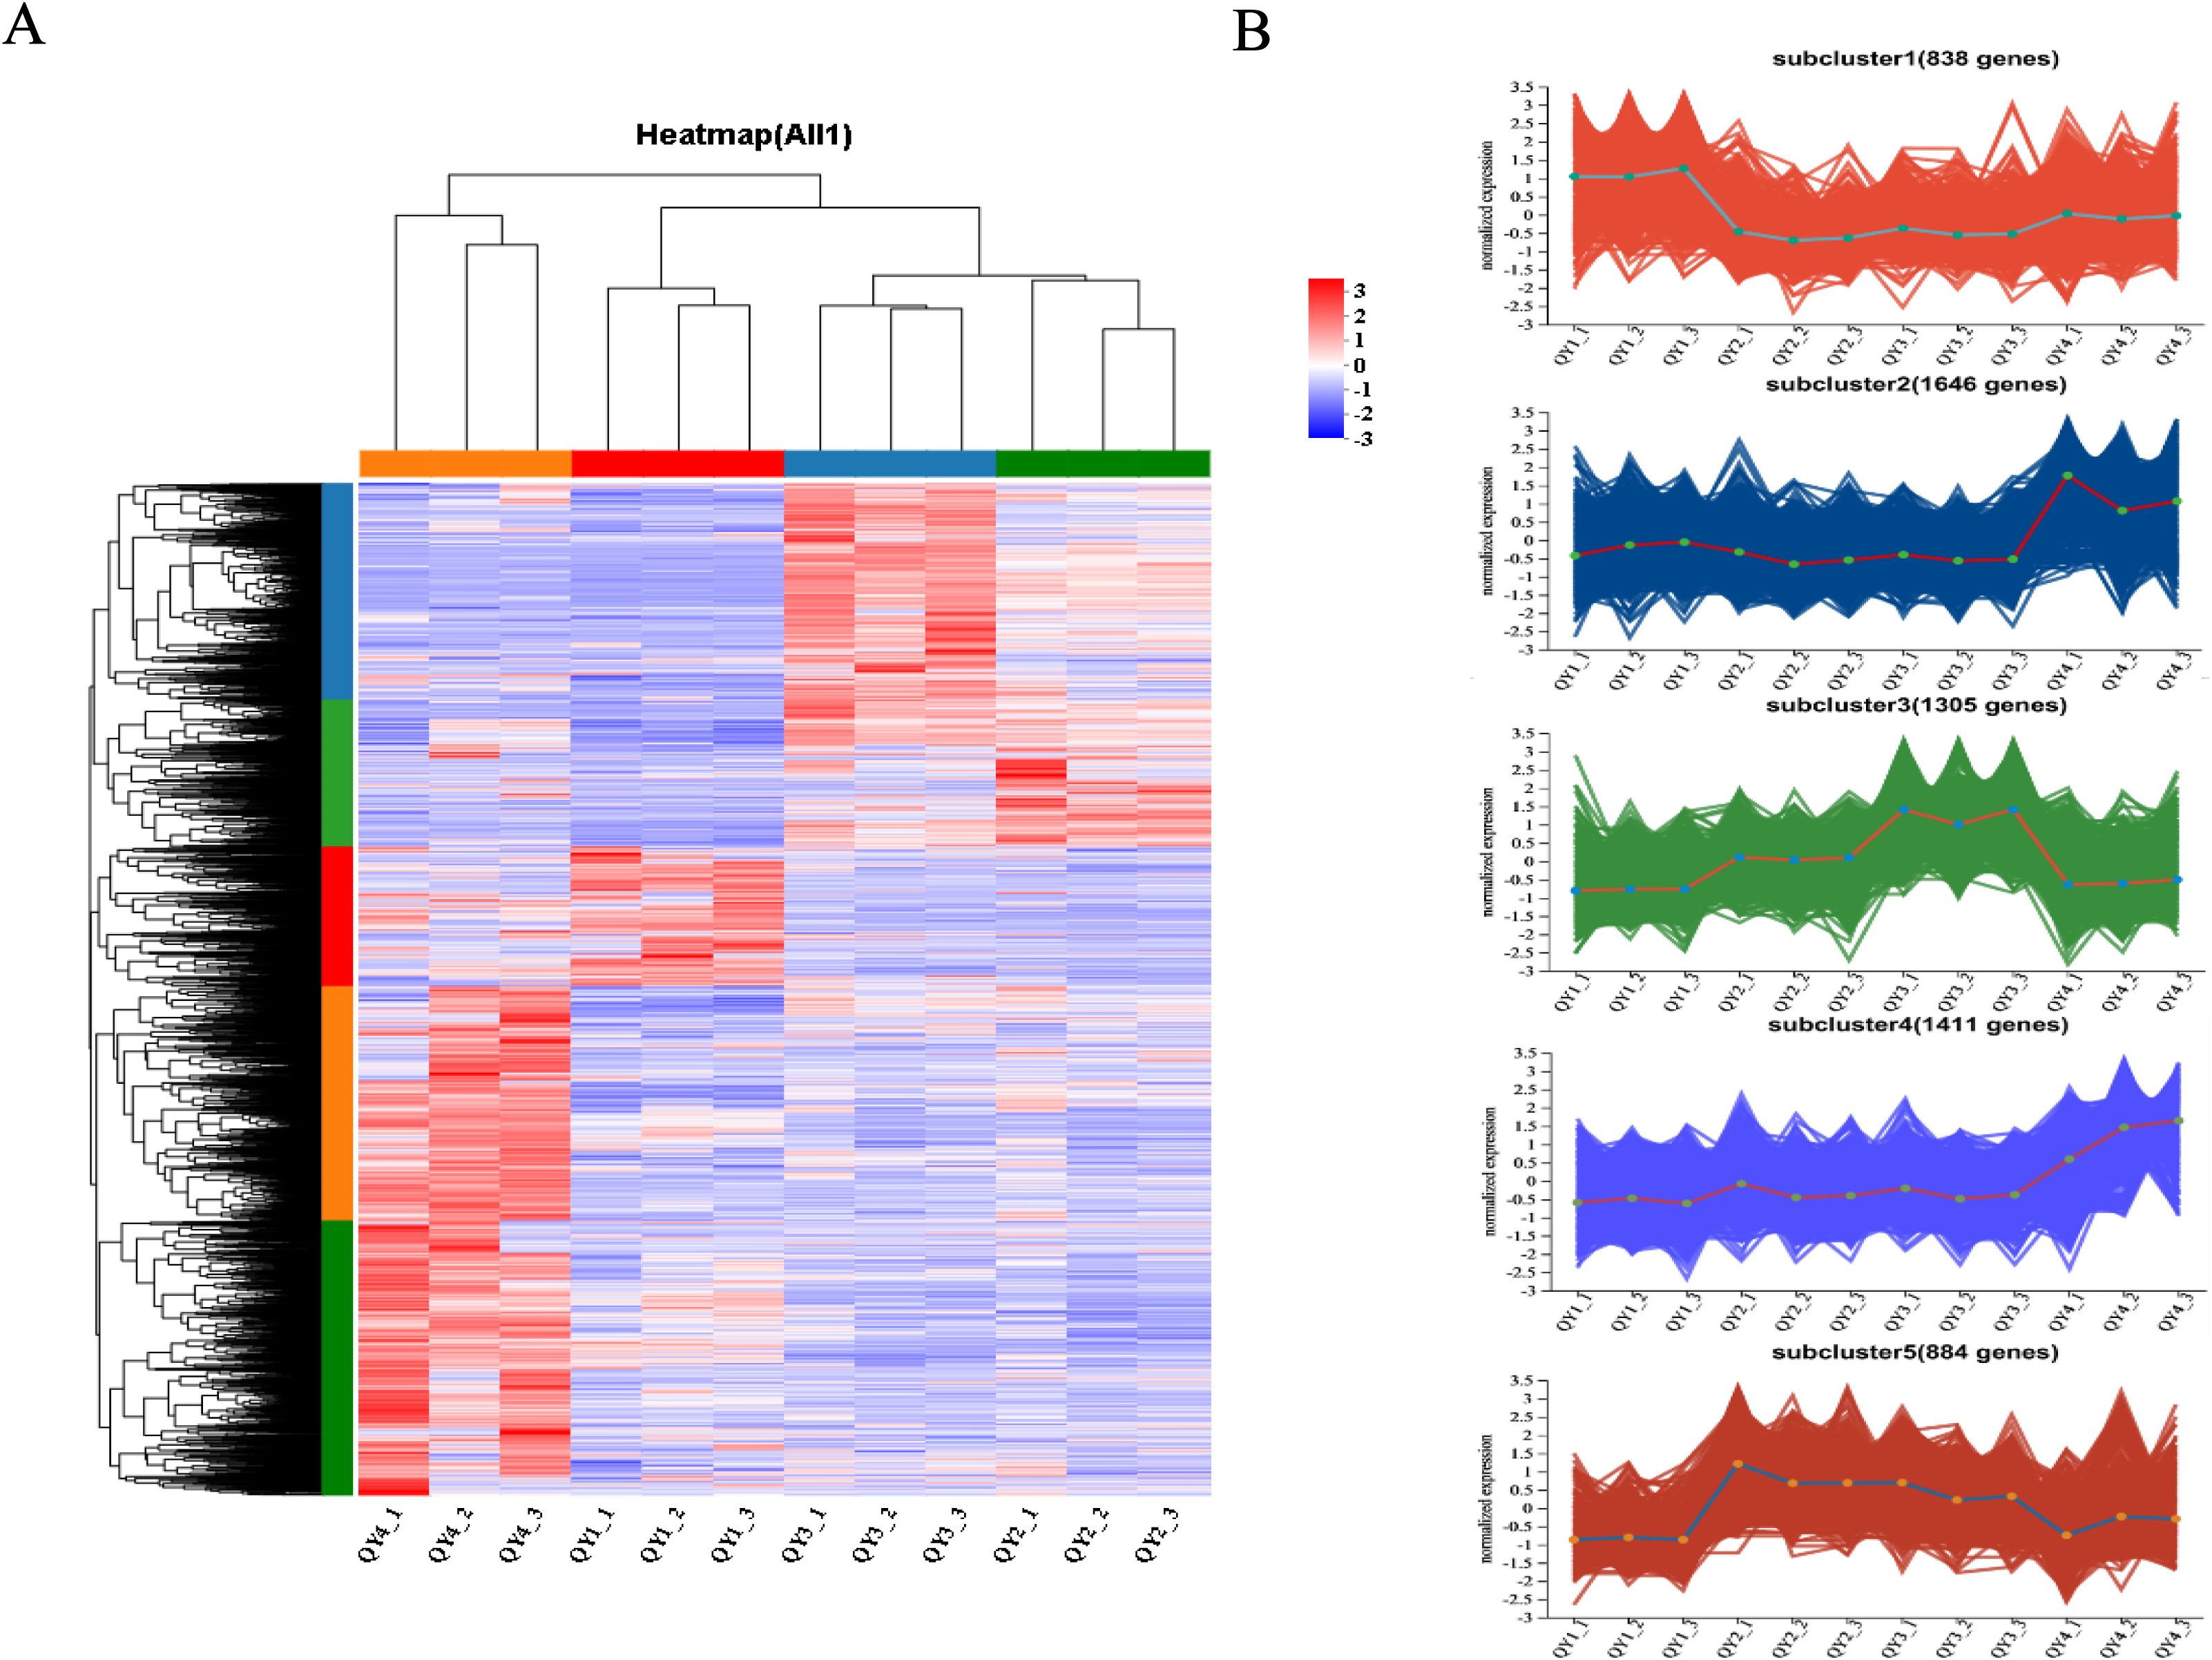
Figure 4. Cluster analysis of differentially expressed genes (DEGs) during G. sinensis seeds development (A) Hierarchical clustering analysis of DEGs, The color bars represent the expression levels of DEGs after TPM standardization, with red indicating high expression and blue indicating low expression; (B) Expression patterns of 5 subgroups of DEGs.
3.9 Functional annotation and enrichment analysis
To elucidate the specific functions of the identified DEGs, GO functional annotation analysis was performed for the 6,084 DEGs in the QY1–4 samples. In the GO database, genes were classified into three main functional categories: Biological process, cellular component, and molecular function. Cellular component category included 10 subcategories, with “metabolic process,” “cell part,” and “organelle” being the top three subcategories in terms of abundance values, with 1,120 (18.41%), 1,291 (21.22%), and 793 (13.03%) genes, respectively. Biological process category included 14 subcategories, with the most annotated subcategories being “cellular process” and “metabolic process,” containing 1,545 (25.39%) and 1,396 (22.95%) genes, respectively. Of the 11 categories in the molecular function category, the two most abundant subcategories were “binding” and “catalytic activity,” with 1,856 (30.51%) and 1,762 (28.96%) genes, respectively (Figure 5A).
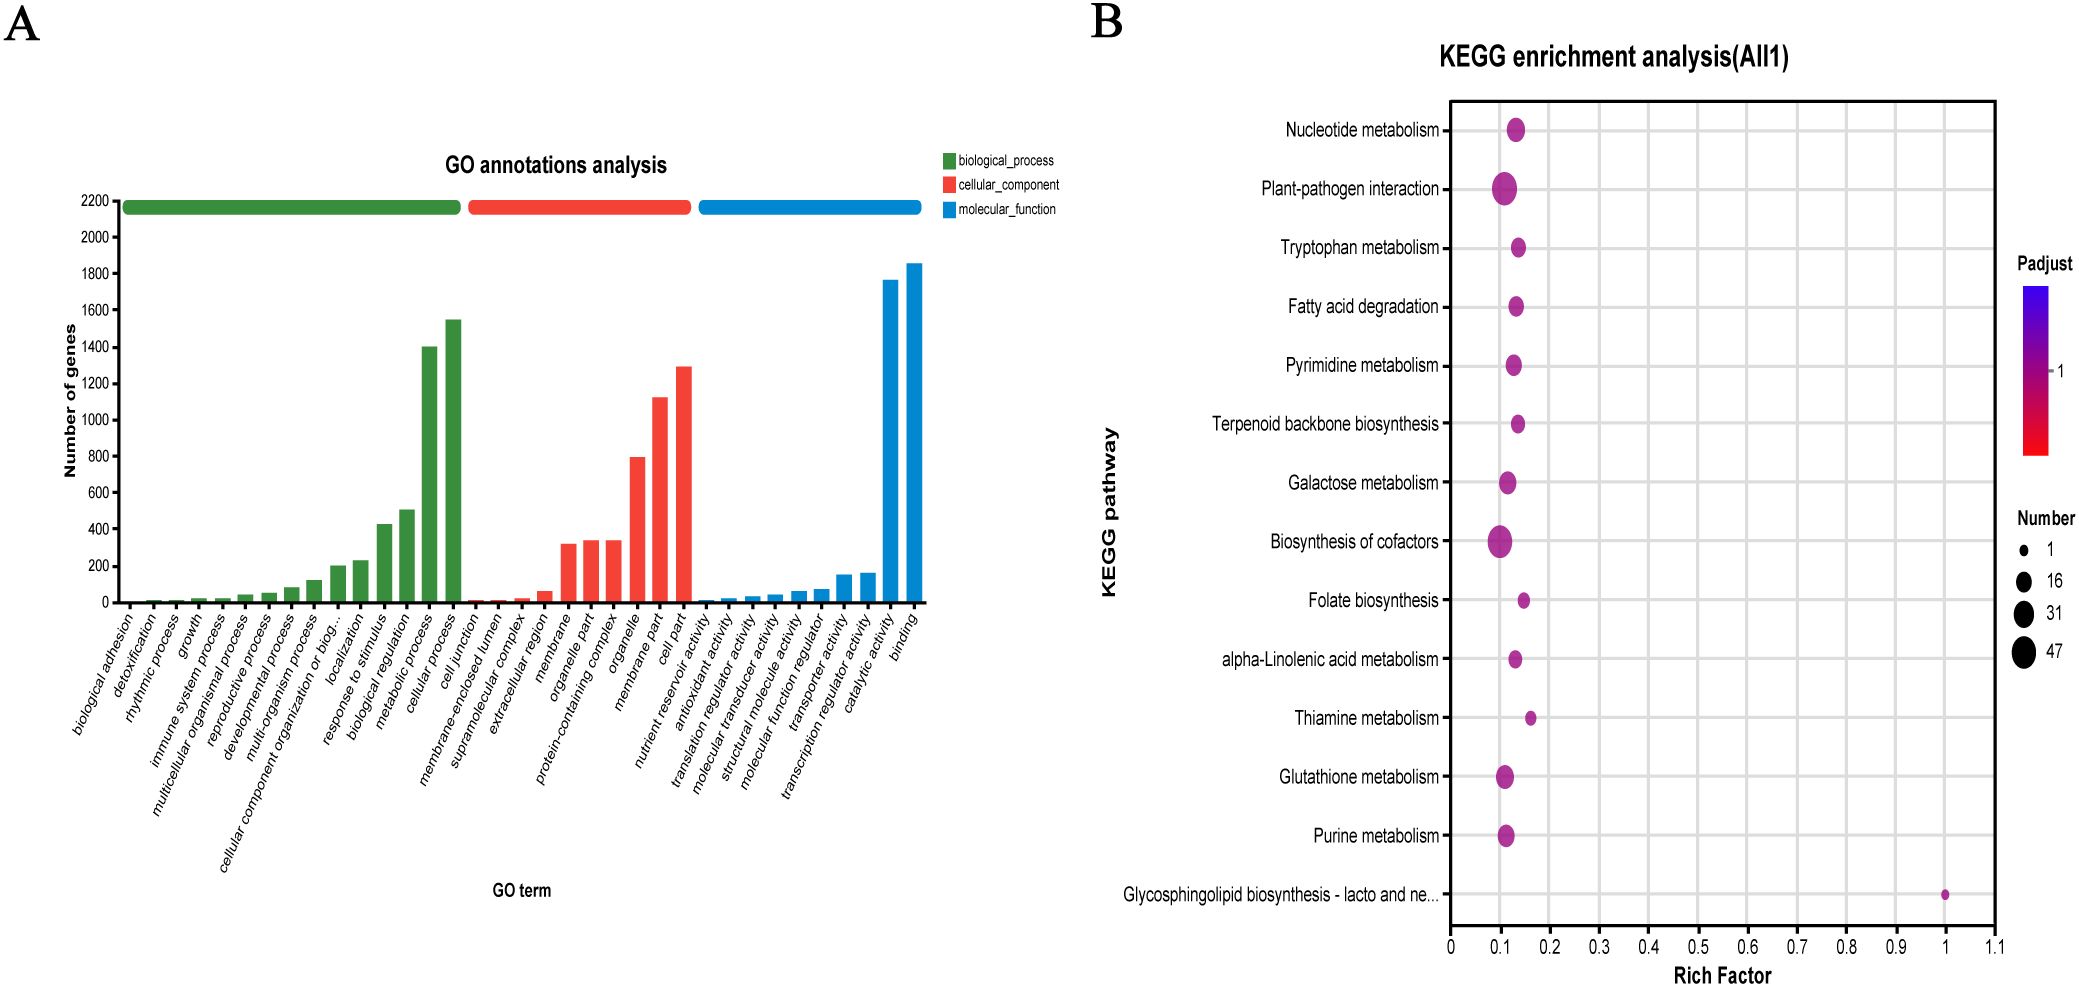
Figure 5. Functional annotation and pathway enrichment analysis of differentially expressed genes (DEGs) in G. sinensis seeds development (A) Gene Ontology (GO) functional classification of DEGs; (B) Kyoto Encyclopedia of Genes and Genomes (KEGG) pathway enrichment.
To investigate the associated metabolic pathways, 6,084 DEGs were subjected to KEGG enrichment analyses. A total of 1,466 genes were enriched in 122 biological metabolic pathways. As shown in Figure 5B, after setting the parameters, top 14 KEGG pathways included “nucleotide metabolism” (23 genes), “plant–pathogen interaction” (47 genes), “tryptophan metabolism” (14 genes), and “fatty acid degradation” (15 genes). Specifically, “galactose metabolism” (20 genes) and GM biosynthesis pathways were highly enriched, and “glycolysis/glycogenogenesis” (24 genes) and “other glycan degradation” (5 genes) bioinformatics pathways were also noted, providing a reference basis for further gene metabolic analysis. The top 20 candidate genes involved in galactose metabolism are listed in Table 9.
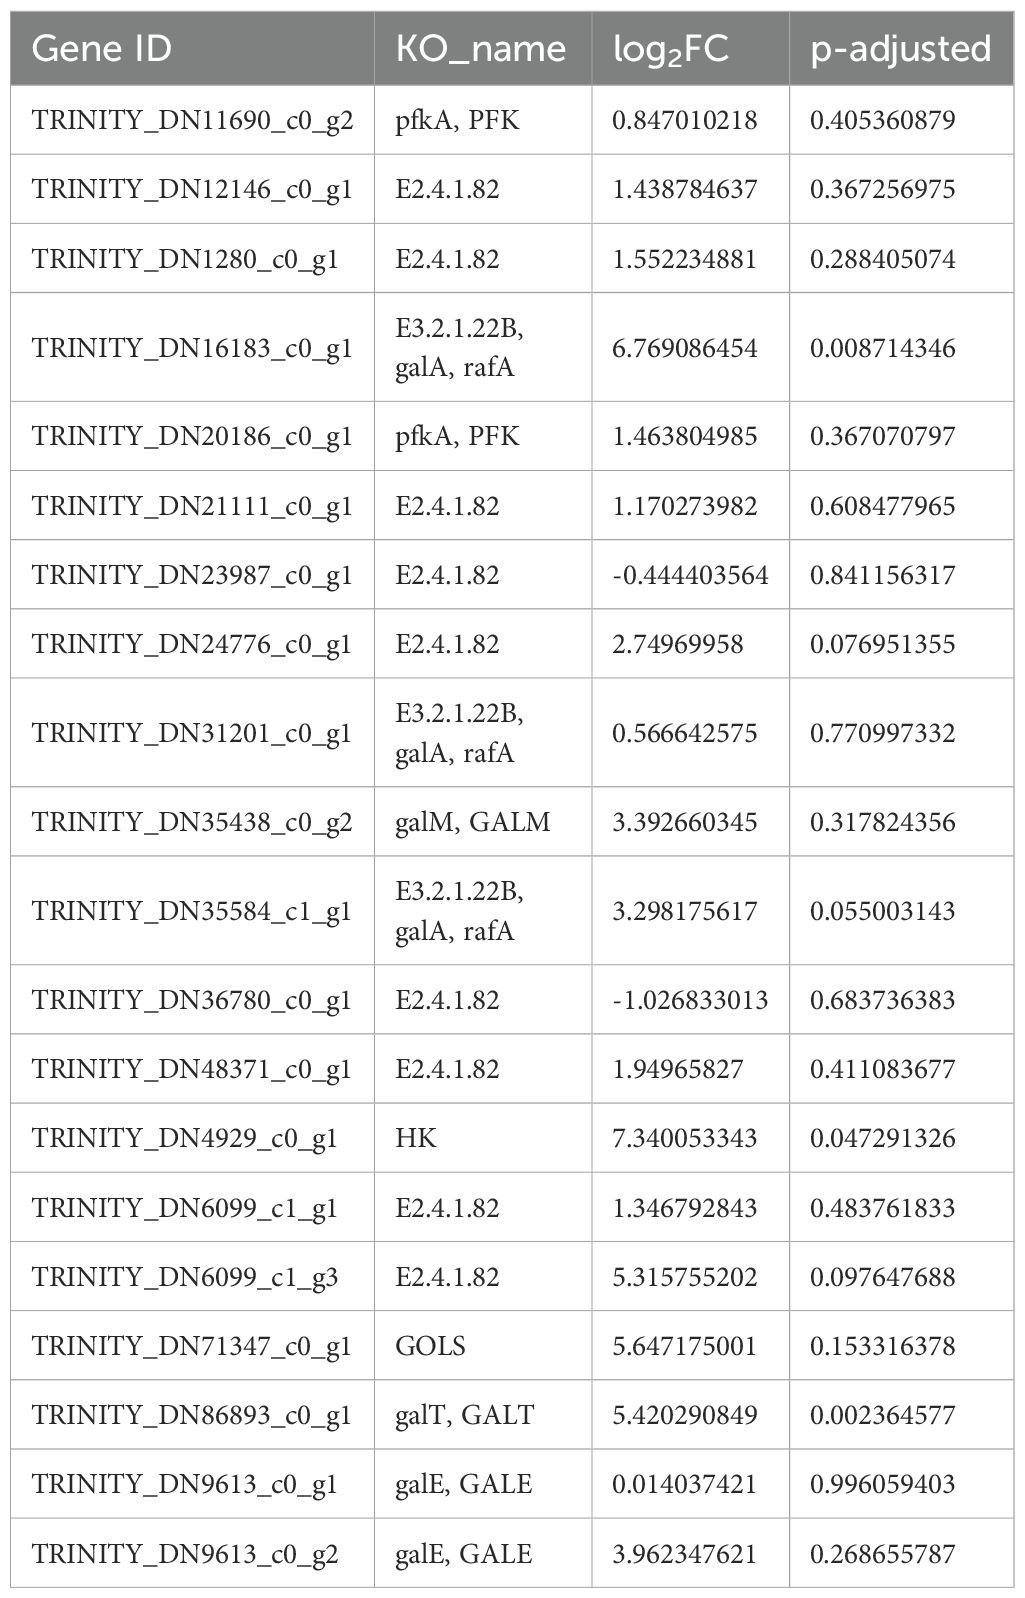
Table 9. Top 20 candidate genes involved in galactose metabolism.
Next, genes related to lactose metabolism were analyzed to identify the genes involved in GM biosynthesis in G. sinensis seeds. Levels of eight enzyme genes, including fructokinase (FK), galactosidase (GALA), galactose gyrase (GALM), hexokinase (HK), inositol galactoside synthase (GolS), phosphogalactosyltransferase (GALT), UDP galactose-4-isomerase (GALE), and raffinose synthase (RS), increased at different growth stages, indicating that these genes were related to the biosynthesis of GM, the main component of G. sinensis endosperm.
When conducting conservative motif analysis on the eight key genes involved in GM synthesis selected from transcriptome data and related genes in Arabidopsis thaliana, Zea mays and Glycine max, we obtained highly valuable results. Eight genes exhibit conserved motif features similar to homologous genes in A. thaliana, Z. mays and G. max, which to some extent reflects their evolutionary conservation and potential universal biological functions in GM synthesis. This provides some support for the identity of these genes as key regulatory factors at the sequence level (Supplementary Figure 11).
3.10 Prediction of GM biosynthesis-related genes
After enriching and analyzing the DEGs using relevant databases, 20 unigenes were found to be involved in galactose metabolism, expressing eight related enzymes, including FK, GALA, GALM, HK, GolS, GALT, GALE, and RS. Analysis of transcript expression in different growth stages revealed the upregulation of all eight factor levels. By combining transcriptome-related data with the GM biosynthesis model proposed by Joët, Akutsu, Gaikwad, Hu, and Wang et al (Wang et al., 2012; Joët et al., 2014; Hu et al., 2019; Gaikwad et al., 2023; Akutsu et al., 2024), a visual heatmap of the inferred GM biosynthesis pathway was constructed to visualize the dynamic changes in gene expression levels during G. sinensis seed development. This pathway is illustrated in Figures 6A, B.
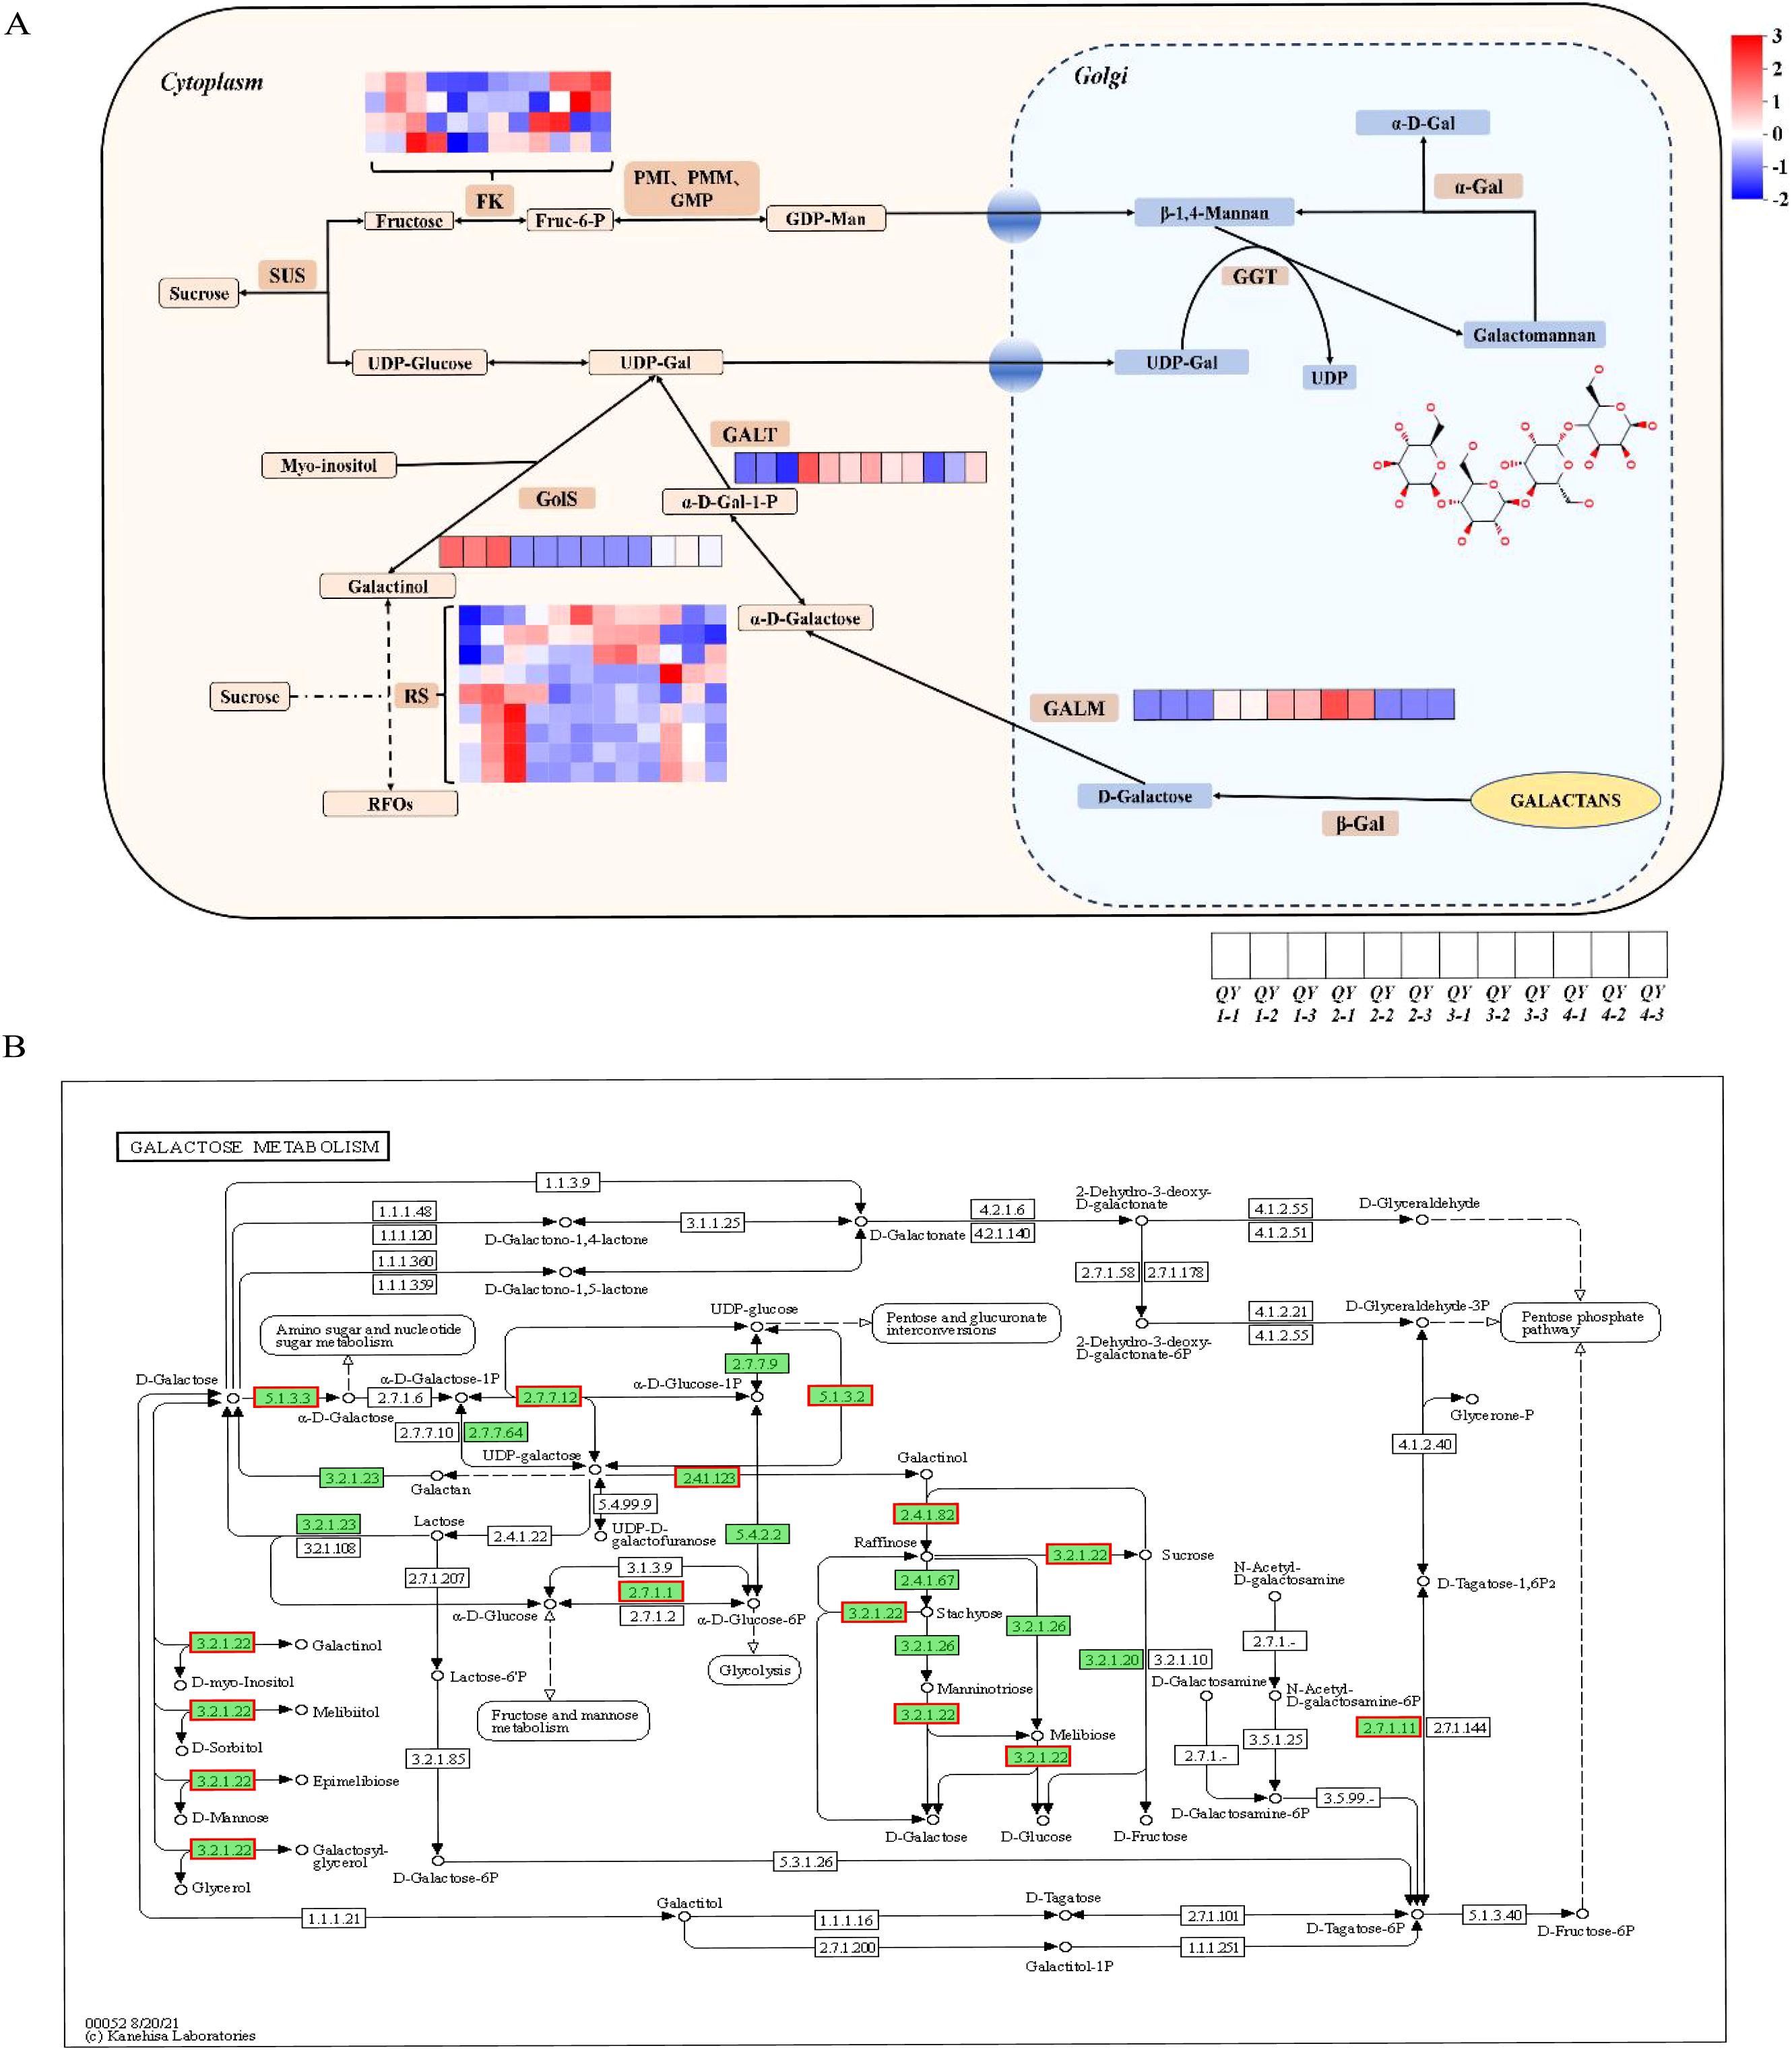
Figure 6. GM biosynthesis pathway prediction. (A) GM biosynthesis pathway prediction model diagram. Heatmap colors represent the logarithmic values of gene expression differences among different samples, with red indicating upregulation and blue indicating downregulation. (B) KEGG enrichment analysis of the galactose metabolism signaling pathway annotation diagram. Green background indicates the transcript obtained via sequencing, and red border indicates the upregulation of expression levels.
Under the action of invertase, sucrose is converted to fructose and glucose, which subsequently participate in GM synthesis through two distinct metabolic pathways (Shivanna et al., 1989). Fructose is phosphorylated by FK to form fructose-6-phosphate, which is converted to GDP-mannose in the presence of PMI, PMM, and GMP. UGE catalyzes the conversion of UDP-glucose to UDP-galactose. Substrates, such as GDP-mannose and UDP, are synthesized in the cytoplasm and subsequently transported to the Golgi apparatus by sugar nucleotide transporters for GM biosynthesis (Seifert, 2004). ManS used GDP mannose to generate a mannose polysaccharide backbone, and galactose residues are transferred from UDP-galactose to the mannose backbone via GGT, resulting in GM synthesis (Dhugga et al., 2004).
Gossypose is a raffinose family oligosaccharide (RFO) stored in the vacuoles of legume endosperm that is primarily responsible for the transient accumulation of carbohydrates. Through this accumulation, UDP galactose and GDP mannose are continuously replenished, forming GM (Joët et al., 2014). These results suggest that GM biosynthesis pathway in G. sinensis gum is inter-regulated with the RFO metabolic pathway.
By integrating the predicted model of the GM biosynthesis pathway, we found that the key regulatory factors (FK, RS, GolS, GALM, and GALT) were all expressed in the different growth stages of G. sinensis seeds. Notably, RS was active during the QY1–QY4 growth stages and contained nine gene copies. FK had four gene copies, whereas GolS, GALM, and GALT each had one gene copy. GolS levels were upregulated at the QY1 stage, GALT levels at the QY2 stage, GALM levels at the QY3 growth stage, and FK levels at both the QY1 and QY4 growth stages, indicating that RS, FK, GolS, GALM, and GALT play crucial regulatory roles in the different growth stages of G. sinensis seeds. This suggests that GM biosynthesis in G. sinensis polysaccharide gum is regulated by the RFO metabolic pathway, consistent with the previously proposed theory of GM formation in leguminous plants (Singh et al., 1990; Tyagi et al., 2018; Hu et al., 2019; Gaikwad et al., 2023; Akutsu et al., 2024).
4 Discussion
G. sinensis seeds contain abundant polysaccharides, which can be isolated and extracted from the seed endosperm to obtain the polysaccharide gum. A 1% aqueous solution of polysaccharide gum exhibits better apparent viscosity, natural biodegradation resistance, and stability than guar gum. It is used as a thickener, adhesive, and stabilizer in various industries, such as the food, petroleum, papermaking, printing and dyeing, and mineral processing industries (Liu, 2012; Liu et al., 2017). Structurally, G. sinensis polysaccharides are similar to the commercially used guar and locust bean gums and belong to the GM category. To better understand the GM biosynthesis pathway and regulatory mechanisms, we isolated RNA from the endosperm of G. sinensis seeds at four different developmental stages and constructed a cDNA library in this study. GM content was determined via HPLC. Based on the results, QY samples were selected for subsequent transcriptome analysis, which generated 79.13 GB of clean data, 19,914 transcripts, and 110,141 unigenes. By annotating and aligning the assembled unigenes against six major databases, we obtained 44,378 (GO), 18,662 (KEGG), 24,197 (Protein Family), 31,740 (Swiss-Prot), 41,792 (eggNOG), and 53,262 (NR) annotated results. Based on the pairwise comparisons of gene expression levels at the four growth stages, 10,291 DEGs, including 4,710 upregulated and 5,581 downregulated DEGs, were identified. Among these, 6,084 candidate genes were selected for further analysis via clustering analysis and Venn diagram visualization of DEGs. Functional annotation and enrichment analysis of these candidate genes using the GO and KEGG databases revealed that eight enzyme genes (FK, GALA, GALM, HK, GolS, GALT, GALE, and RS) were involved in the GM biosynthesis pathway and positively regulated GM biosynthesis.
Three enzymes and their coding genes (ManS, GMGT, and α-Gal) essential for GM synthesis have been isolated and functionally characterized in other plants (Joët et al., 2014; Akutsu et al., 2024). Wang et al. (2012) identified a group of genes encoding GM biosynthesis-related enzymes (PMI, PMM, GGT, ManS, UGE, GMP/MGT, FK, and invertase), and Hu et al. (2019) reported another group of genes (e.g., GALK, b-Gal, GALM, and GALT) highly expressed in the endosperm and suggested the involvement of these genes in GM metabolism regulation. Levels of transcription factors NAC and MYB, the main regulatory factors activating secondary cell wall biosynthesis, are upregulated in fenugreek endosperm (Zhong et al., 2010; Ambavaram et al., 2011). Tyagi et al. reported three novel microRNAs (CtmiR-3157, Ct-miR3130, and Ct-miR1315) as important regulatory factors in guar seeds (Tyagi et al., 2018). Consistent with previous reports, FK, GALM, and GALT were also identified in this study, confirming the reliability of our transcriptome sequencing results.
Sorbitol and RFOs, such as raffinose and raffinose, are transiently accumulated during endosperm development, serving as temporary storage carbohydrates for GDP mannose and UDP galactose synthesis (Joët et al., 2009). In addition to these factors, endosperm GM composition is also influenced by the climate. Low temperatures favor RFO and sorbitol synthesis but delay endosperm GM biosynthesis, indicating the close relationship between GM, RFO, and sorbitol metabolism during seed development (Joët et al., 2014).
As shown in the inferred GM biosynthesis pathway diagram in Figure 6A, FK, GALM, GolS, GALT, and RS were involved in the regulation of GM biosynthesis; however, HK, GALA, and GALE could not be unidentified. RFO metabolism is involved in multiple physiological processes, including plant transport, abiotic stress resistance, and seed vigor development. Specifically, RS is an important initiating factor in the RFO metabolic pathway that synthesizes or converts sucrose step-by-step into the components required for other physiological activities. In this study, RS exhibited the highest number of gene copies, indicating that the metabolic pathways of GM biosynthesis and RFOs are mutually regulated during the growth and development of G. sinensis. However, this study only analyzed the expression levels of these genes, warranting further investigations to verify their functions.
Similar to the biosynthesis of other plant wall polysaccharides, GM biosynthesis in G. sinensis seeds is a complex process involving multiple reactions in different cellular compartments (Seifert, 2004). In addition to FK, GALM, GolS, GALT, and RS, GM biosynthesis in G. sinensis seeds requires the coordinated action of several enzymes and transporter proteins. Therefore, identification of genes encoding these related proteins is essential to understand the biosynthesis pathways and regulatory mechanisms of GM. Future studies should use next-generation sequencing technology (454 sequencing) for in-depth expressed sequence tag analysis to identify the additional genes involved in GM biosynthesis and regulation.
Despite identifying the key candidate genes involved in the biosynthesis of G. sinensis seed GM (FK, GALM, GolS, GALT, and RS) via RNA sequencing analysis, this study was limited by the lack of adequate experimental validation (e.g., reverse transcription-quantitative polymerase chain reaction and enzyme activity assays) due to difficulties related to the experimental conditions (e.g., sample unavailability and insufficient technical resources) and constraints in research time and funding. Nevertheless, our results are consistent with the GM formation theory in leguminous plants of Singh et al., supporting the reliability of our transcriptome data (Singh et al., 1990; Tyagi et al., 2018; Hu et al., 2019; Gaikwad et al., 2023; Akutsu et al., 2024). Future studies should validate the functions of the identified genes via genetic and in vitro testing.
The latest research mainly reports the de novo assembly of the chromosome level genome of G. sinensis and reveals its evolutionary process and molecular mechanisms of thorn development (Xiao et al., 2025). Although the article did not directly mention GM synthesis research, some limitations and future directions regarding plant genetic engineering and molecular breeding can be inferred from it. Although transcriptomics plays an important role in studying gene expression and regulation, relying solely on transcriptomics to study key regulatory genes in the GM synthesis pathway has the following limitations: transcriptomics provides a snapshot of gene expression at a specific time point and can not capture the dynamic changes in gene expression processes; Transcriptomics can only display the correlation of gene expression, but cannot directly prove causal relationships. Although transcriptomics provides important information in studying GM, its limitations cannot be ignored. Future research should combine other omics techniques (such as proteomics, metabolomics, etc.) and functional validation experiments to gain a more comprehensive understanding of the regulatory mechanisms of GM synthesis.
5 Conclusion
To the best of our knowledge, this study is the first to construct 12 cDNA libraries of G. sinensis seeds using the Illumina HiSeq 4000 sequencing platform. The predicted GM biosynthesis pathway model revealed five genes (FK, GALM, GolS, GALT, and RS) encoding key enzymes in the GM biosynthesis pathway, facilitating further genomic research on G. sinensis seeds and cloning and functional analysis of GM biosynthesis-related enzymes. Furthermore, our transcriptome sequencing approach can contribute to future genetic and genomic research on the chemical constituents of G. sinensis seeds and improvement of their active ingredient levels via genetic engineering.
Data availability statement
All sequencing data have been deposited into the National Center for Biotechnology Information (NCBI) Sequence Read Archive (SRA) database under accession number PRJNA1242246.
Ethics statement
Written informed consent was obtained from the individual(s) for the publication of any potentially identifiable images or data included in this article.
Author contributions
YZ: Funding acquisition, Resources, Supervision, Writing – review & editing, Conceptualization. TY: Investigation, Methodology, Writing – original draft, Writing – review & editing, Conceptualization, Data curation. XW: Conceptualization, Investigation, Writing – review & editing. FX: Conceptualization, Investigation, Writing – review & editing. LD: Investigation, Methodology, Writing – original draft, Writing – review & editing. HW: Resources, Supervision, Writing – review & editing.
Funding
The author(s) declare that financial support was received for the research and/or publication of this article. This study was supported by the Guizhou Provincial Basic Research Program (Natural Science; No. QKHJC-ZK (2022) General 508).
Conflict of interest
The authors declare that the research was conducted in the absence of any commercial or financial relationships that could be construed as a potential conflict of interest.
Generative AI statement
The author(s) declare that no Generative AI was used in the creation of this manuscript.
Publisher’s note
All claims expressed in this article are solely those of the authors and do not necessarily represent those of their affiliated organizations, or those of the publisher, the editors and the reviewers. Any product that may be evaluated in this article, or claim that may be made by its manufacturer, is not guaranteed or endorsed by the publisher.
Supplementary material
The Supplementary Material for this article can be found online at: https://www.frontiersin.org/articles/10.3389/fpls.2025.1555374/full#supplementary-material
References
Akutsu, M., Shinozawa, A., Nishiyama, T., Sakata, Y., and Hiwatashi, Y. (2024). De novo sequencing allows genome-wide identification of genes involved in galactomannan synthesis in locust bean (Ceratonia siliqua). DNA Res. 31, dsae033. doi: 10.1093/dnares/dsae033
Ambavaram, M. M. R., Krishnan, A., Trijatmiko, K. R., and Pereira, A. (2011). Coordinated activation of cellulose and repression of lignin biosynthesis pathways in rice. Plant Physiol. 155, 916–931. doi: 10.1104/pp.110.168641
Anders, S. and Huber, W. (2010). Differential expression analysis for sequence count data. Genome Biol. 11, R106. doi: 10.1186/gb-2010-11-10-r106
Ashburner, M., Ball, C. A., Blake, J. A., Botstein, D., Butler, H., Cherry, J. M., et al. (2000). Gene ontology: tool for the unification of biology. The Gene Ontology Consortium. Nat. Genet. 25, 25–29. doi: 10.1038/75556
Dhugga, K. S., Barreiro, R., Whitten, B., Stecca, K., Hazebroek, J., Randhawa, G. S., et al. (2004). Guar seed beta-mannan synthase is a member of the cellulose synthase super gene family. Science. 303, 363–366. doi: 10.1126/science.1090908
Fang, X. X., Wang, H. Y., Zhou, X. T., Zhang, J., and Xiao, H. X. (2022). Transcriptome reveals insights into biosynthesis of ginseng polysaccharides. BMC Plant Biol. 22, 594. doi: 10.1186/s12870-022-03995-x
Gaikwad, K., Ramakrishna, G., Srivastava, H., Saxena, S., Kaila, T., Tyagi, A., et al. (2023). The chromosome-scale genome assembly of cluster bean provides molecular insight into edible gum (galactomannan) biosynthesis family genes. Sci. Rep. 13, 9941. doi: 10.1038/s41598-023-33762-3
Guo, C. Y. (2020). Study on properties of acacia polysaccharide gum and its micro-water solid phase modification (Yinchuan, Ningxia, China: Ningxia University). doi: 10.27257/d.cnki.gnxhc.2020.001095
Hao, X. C., Han, L. J., and Wang, Z. H. (2012). Research progress and application of Gleditsia sinensis. J. Anhui Agric. Sci. 40, 5989–5991. doi: 10.13989/j.cnki.0517-6611.2012.10.201
Hu, H., Wang, H., Zhang, Y., Kan, B., Ding, Y., and Huang, J. (2019). Characterization of genes in guar gum biosynthesis based on quantitative RNA-sequencing in guar bean (Cyamopsis tetragonoloba). Sci. Rep. 9, 10991. doi: 10.1038/s41598-019-47518-5
Huerta-Cepas, J., Szklarczyk, D., Forslund, K., Cook, H., Heller, D., Walter, M. C., et al. (2016). eggNOG 4.5: a hierarchical orthology framework with improved functional annotations for eukaryotic, prokaryotic and viral sequences. Nucleic Acids Res. 44, D286–D293. doi: 10.1093/nar/gkv1248
Jiang, J. X., Jian, H. L., Zhu, L. W., Zhang, W. M., and Sun, D. F. (2009). New progress in research and application of plant polysaccharide gum. Chem. Ind. For. Prod. 29, 121–126.
Joët, T., Laffargue, A., Salmona, J., Doulbeau, S., Descroix, F., Bertrand, B., et al. (2009). Metabolic pathways in tropical dicotyledonous albuminous seeds: Coffea arabica as a case study. New Phytol. 182, 146–162. doi: 10.1111/j.1469-8137.2008.02742.x
Joët, T., Laffargue, A., Salmona, J., Doulbeau, S., Descroix, F., Bertrand, B., et al. (2014). Regulation of galactomannan biosynthesis in coffee seeds. J. Exp. Bot. 65, 323–337. doi: 10.1093/jxb/ert380
Kanehisa, M., Goto, S., Kawashima, S., Okuno, Y., and Hattori, M. (2004). The KEGG resource for deciphering the genome. Nucleic Acids Res. 32, D277–D280. doi: 10.1093/nar/gkh063
Koonin, E. V., Fedorova, N. D., Jackson, J. D., Jacobs, A. R., Krylov, D. M., Makarova, K. S., et al. (2004). A comprehensive evolutionary classification of proteins encoded in complete eukaryotic genomes. Genome Biol. 5, R7. doi: 10.1186/gb-2004-5-2-r7
Lei, P., Sun, D. F., Zhu, C. L., Zhang, F. L., and Zhang, W. M. (2018). A micro water solid phase method for hydroxypropylation modification of Gleditsia sinensis polysaccharide. Chin. Wild Plant Resour. 37, 4–7.
Li, B. and Dewey, C. N. (2011). RSEM: accurate transcript quantification from RNA-Seq data with or without a reference genome. BMC Bioinform. 12, 323. doi: 10.1186/1471-2105-12-323
Li, X., Fan, M. J., Feng, K. B., Shan, X. Q., and Feng, Y. H. (1980). Analysis of galactomannan gum from 24 leguminous plant seeds. J. Integr. Plant Biol. 3, 302–304.
Li, J. J., Shang, X. C., Ma, J. X., and Zhang, G. T. (2018). Study on the changes in morphological characteristics and dynamic accumulation of total saponins and prickly acid during the development process of soapberry antler. J. Chin. Med. Mater. 41, 1323–1327. doi: 10.13863/j.issn1001-4454.2018.06.015
Li, S. L. and Zhang, Z. J. (2018). Research on medical history and clinical application of Gleditsia sinensis. Pract. Clin. J. Integr. Trad. Chin. West. Med. 18, 129–130. doi: 10.13638/j.issn.1671-4040.2018.07.069
Liu, F. (2012). Studies on the extraction, purification, structure and part of bioactivities of polysaccharides from Gleditsia sinensis Lam (Kunming, Yunnan, China: Kunming University of Science and Technology).
Liu, Y. T. (2022). Study on the structure and properties of polysaccharides from soapberry and efficient modification of micro water system (Beijing, China: Beijing Forestry University). doi: 10.26949/d.cnki.gblyu.2021.000899
Liu, Y. T., Zhang, W. W., Zhang, W. A., Wang, K., and Jiang, J. X. (2017). A Micro water Solid Phase Method for Carboxylmethylation of Gleditsia sinensis Lam. Galactomannan gum. Chem. Ind. For. Prod. 37, 45–50.
Liu, L. Z. and Zhao, G. Z. (2009). Comparative study on microscopic identification of powder of Semen Gleditsiae, Fructus Gleditsiae, Fructus Gleditsiae abnormalis. J. Shanxi Univ. Chin. Med. 10, 24–25.
McCleary, B. V., Mallett, I., and Matheson, N. K. (1987). Galactomannan changes in developing Gleditsia triacanthos seeds. Phytochemistry. 26, 1889–1894. doi: 10.1016/S0031-9422(00)81722-7
McKenna, A., Hanna, M., Banks, E., Sivachenko, A., Cibulskis, K., Kernytsky, A., et al. (2010). The Genome Analysis Toolkit: a MapReduce framework for analyzing next-generation DNA sequencing data. Genome Res. 20, 1297–1303. doi: 10.1101/gr.107524.110
Naoumkina, M., Torres-Jerez, I., Allen, S., He, J., Zhao, P. X., Dixon, R. A., et al. (2007). Analysis of cDNA libraries from developing seeds of guar (Cyamopsis tetragonoloba (L.) Taub). BMC Plant Biol. 7, 62. doi: 10.1186/1471-2229-7-62
Seifert, G. J. (2004). Nucleotide sugar interconversions and cell wall biosynthesis: how to bring the inside to the outside. Curr. Opin. Plant Biol. 7, 277–284. doi: 10.1016/j.pbi.2004.03.004
Shao, J. L. and Yuan, W. (2005). Exploration of the properties and application prospects of soapberry bean gum. China Food Addit. 2, 45–47.
Shivanna, B. D., Ramakrishna, M., Prakash, V., and Ramadoss, C. S. (1989). Influence of detergents and pH on the isolation, purification and molecular properties of alpha- galactosidase-C2 from germinating guar (Cyamopsis tetragonolobus). Indian J. Biochem. Biophys. 26, 234–242.
Singh, R., Aggarwal, A., Bhuliar, S. S., and Goyal, J. (1990). Import of sucrose and its partitioning in the synthesis of galactomannan and raffinose-oligosaccharides in the developing guar (Cyamopsis tetragonolobus) seed. J. Exp. Bot. 41, 101–110. doi: 10.1093/jxb/41.1.101
Tatusov, R. L., Galperin, M. Y., Natale, D. A., and Koonin, E. V. (2000). The COG database: a tool for genome -scale analysis of protein functions and evolution. Nucleic Acids Res. 28, 33–36. doi: 10.1093/nar/28.1.33
Trapnell, C., Pachter, L., and Salzberg, S. L. (2009). TopHat: discovering splice junctions with RNA-Seq. Bioinformatics. 25, 1105–1111. doi: 10.1093/bioinformatics/btp120
Trapnell, C., Williams, B. A., Pertea, G., Mortazavi, A., Kwan, G., van Baren, M. J. V., et al. (2010). Transcript assembly and quantification by RNA-Seq reveals unannotated transcripts and isoform switching during cell differentiation. Nat. Biotechnol. 28, 511–515. doi: 10.1038/nbt.1621
Tyagi, A., Nigam, D., S V, A. M., Solanke, A. U., Singh, N. K., Sharma, T. R., et al. (2018). Genome-wide discovery of tissue-specific miRNAs in clusterbean (Cyamopsis tetragonoloba) indicates their association with galactomannan biosynthesis. Plant Biotechnol. J. 16, 1241–1257. doi: 10.1111/pbi.12866
Wang, Y., Alonso, A. P., Wilkerson, C. G., and Keegstra, K. (2012). Deep EST profiling of developing fenugreek endosperm to investigate galactomannan biosynthesis and its regulation. Plant Mol. Biol. 79, 243–258. doi: 10.1007/s11103-012-9909-y
Wu, W. W., Pu, L. L., Zhu, D. Q., Zhou, D. J., and Yao, Q. P. (2025). Preparation, structural characterization, and antioxidant activity of soapberry polysaccharides using H2O2. Cereals Oils. 38, 139–145 + 151.
Xiao, D., Liu, J., Wang, J., Yang, X., Yang, Y., Yu, R., et al. (2025). Chromosome-level de novo genome unveils the evolution of Gleditsia sinensis and thorns development. Genomics. 117, 111004. doi: 10.1016/j.ygeno.2025.111004
Xie, C., Mao, X., Huang, J., Ding, Y., Wu, J., Dong, S., et al. (2011). KOBAS 2.0: a web server for annotation and identification of enriched pathways and diseases. Nucleic Acids Res. 39, W316–W322. doi: 10.1093/nar/gkr483
Zhang, G. L. and Xiao, Z. C. (1990). Research, production, and application of galactomannan gum. Chin. Wild Plant Resour. 2, 1–5.
Keywords: Gleditsia sinensis Lam., galactomannan, transcriptome, biosynthesis, unigenes enrichment analysis
Citation: Zhang Y, Yang T, Wang X, Xu F, Du L and Wu H (2025) Transcriptomic reveals key genes and regulatory pathways in galactomannan biosynthesis in Gleditsia sinensis polysaccharide gum. Front. Plant Sci. 16:1555374. doi: 10.3389/fpls.2025.1555374
Received: 04 January 2025; Accepted: 07 July 2025;
Published: 23 July 2025.
Edited by:
Bowei Chen, Jishou University, ChinaReviewed by:
Sarahani Harun, National University of Malaysia, MalaysiaRiza Arief Putranto, Universitas Esa Unggul, Indonesia
Copyright © 2025 Zhang, Yang, Wang, Xu, Du and Wu. This is an open-access article distributed under the terms of the Creative Commons Attribution License (CC BY). The use, distribution or reproduction in other forums is permitted, provided the original author(s) and the copyright owner(s) are credited and that the original publication in this journal is cited, in accordance with accepted academic practice. No use, distribution or reproduction is permitted which does not comply with these terms.
*Correspondence: Linlin Du, MTMyNDM2ODM1MUBxcS5jb20=; Hongmei Wu, MzgxMTc2NjU5QHFxLmNvbQ==
†These authors have contributed equally to this work and share first authorship