 Guofei Jiang†Xuqin Wang†Qingwen Jiang†Yutao BaiLingyuan ZhangPing ZhangJunna LiuLi LiHanxue LiLiubin HuangShan Zhang
 Peng Qin*
- College of Agronomy and Biotechnology, Yunnan Agricultural University, Kunming, China
Quinoa is a new crop with high nutritional value. Flooding stress plays an important role in constraining the growth and development of quinoa during the filling stage, and flavonoids have been shown to have important roles in abiotic plant stress; however, the mechanisms by which flavonoids respond to quinoa flooding stress during the filling stage are not clear. Therefore, we used Dian quinoa-1844 as the material and employed transcriptomics, metabolomics and bioinformatics techniques to study quinoa leaves under flooding stress during the filling stage. The results showed that 433 flavonoid metabolites were detected in the metabolome. Genes related to flavonoids in the transcriptome were significantly enriched in both GO and KEGG. Integrated transcriptomic and metabolomic analyses revealed 18 flavonoid metabolites and 30 genes exhibiting significant alterations under stress treatment. These 30 genes regulate flavonoid accumulation by modulating the activity of enzymes such as F3H, CHI, and CHS, thereby enhancing quinoa’s resistance to flooding stress. Network interaction analysis identified 5 core transcription factors, 2 core structural genes, and 4 key metabolites. These components synergistically regulate flavonoid biosynthesis to alleviate oxidative damage caused by flooding. This study elucidated the roles and mechanisms of flavonoids in quinoa’s response to flooding stress, providing a theoretical basis for selecting and breeding quinoa varieties with high flooding tolerance.
1 Introduction
Quinoa (Chenopodium quinoa Willd.) is a dicot herb of the amaranth family (Amaranthaceae) and Chenopodium genus, originating from the Andes Mountains (García-Parra et al., 2020; Vilcacundo and Hernández-Ledesma, 2017). It is recognized by the United Nations International Food and Agriculture Organization (FAO) as the only crop-plant that can meet the basic nutritional needs of the human body. It enjoys the reputation of “golden grain” (Angeli et al., 2020). Quinoa is rich in flavonoids, proteins, amino acids, minerals, polyphenols, vitamins, dietary fiber, unsaturated fatty acids, and many other components (Abderrahim et al., 2015; Lamothe et al., 2015; Tang et al., 2015). Many studies have shown that the protein, phenolic acids, flavonoids, saponins and other substances in quinoa are important in promoting human health by lowering blood lipids, antidiabetic, and antioxidant (Cao et al., 2020; Mudgil et al., 2020; Daliri et al., 2021).
The grain-filling stage, the final and most critical phase of cereal growth, directly determines grain weight and final yield. However, this process is highly vulnerable to diverse abiotic stresses (Teng et al., 2023). Flavonoid content in plants has been shown to correlate strongly with stress resistance (Zhuang et al., 2023; Meng et al., 2021). Therefore, investigating the synthesis mechanisms of flavonoids in quinoa during the grain-filling stage under flooding stress holds significant scientific and agronomic importance. Quinoa has been extensively cultivated in the Yunnan, Gansu, and Qinghai provinces of China. In these regions, the optimal sowing period consistently occurs in mid-May, with the critical filling stage spanning July to August. Notably, this phenological phase coincides with rainy summer across all three provinces (Wang and LinHo, 2002). Excessive precipitation during this period induces elevated soil water retention capacity, thereby subjecting quinoa to flooding stress (Guo et al., 2024). While adequate water availability is essential for normal plant growth, the resultant flooding has emerged as one of the predominant abiotic stressors impeding quinoa cultivation in China. During flooding stress, plant root respiration is inhibited and toxic substances accumulate, affecting nutrient growth and detrimental to reproductive growth, ultimately leading to yield loss or even plant death (Zhou et al., 2020). Plants adapt to inundation stress by osmoregulation and osmoprotection to maintain normal life activities. Most plant species cannot survive prolonged inundation or soil waterlogging. Previous studies have been reported on the mechanism of rice tolerance to flooding (Loreti et al., 2016), where more cellular gaps and better structural integration of chloroplast membranes were observed in the leaves of flood-tolerant varieties, probably due to increased ethylene content, decreased ABA content and reduced O2- accumulation (Luan et al., 2018). The use of exogenous ethylene may increase leaf photosynthesis by promoting stomatal opening under waterlogging stress (Wang et al., 2016). Currently, global warming and erratic precipitation have serious impacts on crops, and the study of flooding tolerance mechanisms in quinoa is important for improving quinoa yield as well as effectively responding to climate change.
Flavonoids are water-soluble secondary metabolites that are widely present in plants and mainly include six classes of compounds: chalcones, flavones, flavonols, flavanediols, anthocyanin glycosides, and condensed tannins (Winkel-Shirley, 2001b). Flavonoids play an important role in plant growth and development and have a variety of biological functions for the plant body itself, participating in a range of physiological processes including UV protection, pollination, seed development, pigmentation and chemosensitivity (Winkel-Shirley, 2001a, 2001). Flavonoids also play an important role in plant abiotic stress resistance due to their strong antioxidant capacity to scavenge excess reactive oxygen species (ROS) induced in plants by various abiotic stresses. Studies have shown that the stress resistance of numerous plants is closely related to the flavonoid content in the body (Zhuang et al., 2023; Meng et al., 2021). Overexpression of key genes involved in flavonoid biosyntheses such as chalcone isomerase 2 (CHI2), F3H, and production of anthocyanin pigment 1 (PAP1) increases flavonoid content in plants such as arabidopsis, rice and pohlia nutans, among others, and increase the flavonoid content and antioxidant properties, thereby significantly enhancing the resistance of these plants to salt, drought and cold damage (Nakabayashi et al., 2014; Jayaraman et al., 2021; Liu et al., 2022a). Salt stress significantly modulates the flavonoid biosynthesis pathway in germinating kidney beans and activates key enzymes such as chalcone isomerase (CHI) and flavonol synthase (FLS), demonstrating the critical role of flavonoid metabolism in salt stress adaptation (Zhang et al., 2022). Integrated multi-omics analysis in maize under lead stress revealed that DEMs and DEGs were co-enriched in the flavonoid biosynthesis pathway, with 20 flavonoid-related genes identified, further validating the pivotal function of this pathway in heavy metal stress responses (Han et al., 2024). Furthermore, soybean seeds with elevated flavonoid levels exhibit enhanced tolerance to herbicides, oxidative stress, and saline-alkaline stress during germination, highlighting their multi-stress synergistic defense capacity (Jiang et al., 2024). In drought-stressed Morus alba var. pendula, PEG-6000 treatment not only significantly increased flavonoid accumulation but also upregulated the expression of phenylpropanoid biosynthesis genes (Chen et al., 2024). Therefore, the outstanding antioxidant capacity of flavonoids plays an important role in mitigating oxidative damage and can effectively improve plant tolerance to various abiotic stresses (Singh et al., 2021). However, the response mechanisms of flavonoid compounds to flooding stress during the filling stage of quinoa remain uninvestigated to date. The findings of this study will address this critical knowledge gap.
In recent years, studies combining transcriptome and metabolome associations to analyze plant flavonoids in response to flooding stress have been rare. To explore this issue in depth, this experiment was conducted to comprehensively analyze the dynamic changes of leaf flavonoid metabolites in quinoa during the filling stage under flooding stress using an independently selected high-generation quinoa line as the material, and ultra-high-performance liquid chromatography and tandem mass spectrometry (UPLC-MS/MS) technology. At the same time, differentially expressed genes related to quinoa flooding stress were screened out with the help of transcriptomics, thus providing a theoretical basis for the study of the molecular mechanism of flavonoids in response to quinoa flooding stress as well as the selection and breeding of quinoa flooding-tolerant varieties.
2 Materials and methods
2.1 Test materials and treatments
This experiment selected Dianli-1844, a high generation red quinoa strain independently selected by Yunnan Agricultural University, as the experimental material. During the planting process, this strain is extremely sensitive to flooding stress during the filling stage. After encountering stress, the plants quickly wilt and the leaves significantly turn yellow, so it was selected as the research object. The material is planted in the Modern Agricultural Education and Research Base of Yunnan Agricultural University in Xundian County, Kunming City (E 102°41′, N 25°20′, Kunming, China). Uniform-sized seeds were selected and sown using hill-drop sowing method in 50 cm × 50 cm × 50 cm pots. Each flowerpot is equipped with 6 sowing holes, with 5 seeds per hole and a plant spacing of 20cm. Thinning was implemented when seedlings reached 5 cm height (corresponding to the emergence of the fourth true leaf), retaining only one robust quinoa plant per hole post-thinning. The first stage is managed according to normal cultivation management techniques, during the growth period, the average temperature was 25.6°C, and the sunshine duration was approximately 12 h. Flooding stress was simulated during the quinoa filling stage (15 days after flowering) using a double-pot system. Artificial flooding was implemented by injecting water into the pots to maintain a flooding depth 10 cm above the soil surface, with daily water replenishment to compensate for evapotranspiration losses. On day 7 post-flooding, when leaves exhibited significant chlorosis compared to the control group, the first sampling was conducted. Following this, the outer pot was removed to initiate gravitational drainage. The second sampling occurred 7 days after drainage completion, during which the sixth fully expanded leaf from the apex was excised, flash-frozen in liquid nitrogen, and subsequently stored at −80°C for downstream analyses. Sampled leaves were analyzed for metabolome and transcriptome (Wuhan Metware Biotechnology Co. Ltd., (www.metware), 3 biological replicates, a total of 12 samples. Specifically, three distinct quinoa plants were selected as biological replicates, and leaves were collected from identical developmental positions on each plant. These harvested leaves were divided into three aliquots for transcriptomic sequencing, metabolomic profiling, and other parameter measurements. In the analyses herein, TR represents 7 days of flooding treatment, R represents 7 days of drainage recovery, and C1 and C2 represent 7 and 14 days of normal growth control, respectively.
2.2 Flavonoid content assay
Flavonoid content was determined using a kit purchased from Wuhan Puyinte Bioengineering Co., Ltd, Wuhan, China (http://www.pytbio.com), and the assay process strictly followed the manufacturer’s instructions for experiments and calculations.
2.3 Flavonoid metabolite extraction detection
The quinoa leaf samples under different treatments were placed in a lyophilizer (Scientz-100F) and freeze-dried under vacuum, ground to powder form using a grinder (MM400, Retsch), dissolved in methanol extract, and the supernatant was taken by vortex centrifugation and filtered for UPLC-MS/MS analysis. The data acquisition instrumentation system mainly consisted of Ultra Performance Liquid Chromatography (UPLC) (SHIMADZU Nexera X2, https://www.shimadzu.com.cn/) and Tandem mass spectrometry (MS/MS) (Applied Biosystems 4500 QTRAP, http://www.appliedbiosystems.com.cn/). Based on the database (MWDB; http://en.metware.cn/list/27.html, accessed on 15 June 2021), substance characterization by secondary mass spectrometry interest and metabolite quantification by multiple reaction monitoring (MRM) modes using triple quadrupole mass spectrometry, metabolite profiling data were obtained for different samples, the Peak area integration was performed and the integral correction was applied (Kogenaru et al., 2012). Quality Control (QC) samples were prepared from a mixture of quinoa plant sample extracts to analyze the reproducibility of the samples under the same treatments.
2.4 Transcriptome sequencing and data analysis
Transcriptome sequencing was performed by Beijing NoZvogene Technology Co., Ltd. (www.noZvogene.com.cn), including RNA extraction and detection, library construction and quality inspection, and machine sequencing. Before library construction, the integrity of RNA was first judged by agarose gel electrophoresis, and then Qubit 2.0 fluorometer and Agilent 2100 bioanalyzer were used to detect the concentration and integrity of RNA to ensure that the quality of RNA was qualified. Library construction was performed using Illumina’s NEBNext® UltraTM RNA Library Prep Kit. After the library construction was completed, the Qubit2.0 Fluorometer was used for preliminary quantification, and the library was diluted to 1.5 ng/ul. Subsequently, the insert size of the library was detected using Agilent 2100 bioanalyzer, and after the insert size was the expected one, the effective concentration of the library was quantified (the effective concentration of the library was higher than 2 nM) by RT-qPCR to ensure the quality of the library. After passing the library check, different libraries were first pooled according to the effective concentration and target downstream data volume, and then sequenced using the Illumina platform, and 150bp paired-end reads were generated. The downlinked data were filtered using fastp v 0.19.3, and the filtering criteria were as follows: firstly, reads with adapters were removed; when the N content of any sequencing reads exceeded 10% of the number of bases of the reads, the paired reads were removed; when the number of low-quality (Q ≤ 20) bases in any sequencing reads exceeded 50% of the number of bases of the reads, the paired reads were removed, and the clean reads were obtained; the index was constructed using HISAT v2.1.0, and the clean reads were compared with the specified reference data, and the indexes were constructed using HISAT v2.1.0. reads, remove these paired reads when the number of bases in any one of the sequenced reads exceeds 50% of the number of bases in the reads, get clean reads, use HISAT v2.1.0 to construct indexes, and sequence the clean reads against the specified reference genome (GCF001683475.1ASM168347v1_genomic. fna. gz), and get the Mapped Data, and use StringTie v1.3.4d to perform new gene-prediction using the featureCounts v1.6.2 for gene comparison, and then calculate Fragments Per Kilobase of exon model per Million mapped fragments (FPKM) for each gene based on gene length. Differential expression analysis between two groups was performed using DESeq2 v1.22.1, and the Benjamini-Hochberg method was used to correct for P-values, resulting in a False Discovery Rate (FDR). The screening criteria for differentially expressed genes are | log2Fold Change |>=1 and FDR<0.05. Functional annotation of differentially expressed genes was performed using KEGG, GO (Gene Ontology), KOG (Karyotic Orthologous Groups), PfAM, Swiss-Prot, TrEMBL, and NR databases. Pathway significance enrichment analysis was performed as a hypergeometric distribution test in terms of pathways in the KEGG database to identify Pathways that were significantly enriched in differentially expressed genes compared to the whole genomic background.
2.5 Combined transcriptome and metabolome analysis
To better understand the relationship between genes and metabolites, differential genes and differential metabolites under the same grouping were simultaneously mapped to KEGG pathway maps based on the results of differential metabolite and differential gene analyses, and bar charts and bubble charts were plotted based on the results of the enrichment analyses, demonstrating the degree of differences in the enrichment of metabolites and gene pathways. The genes and metabolites detected in each treatment were correlated, and the Pearson correlation coefficients of the genes and metabolites were calculated using the COR program in R. Differential genes and differential metabolites were correlated, and the results with Pearson correlation coefficients greater than 0.8 were selected and the correlation coefficients were plotted in a clustered heatmap (Chong and Xia, 2018). Canonical correlation analysis (CCA) selected all the differential genes and differential metabolites to establish the O2PLS model and preliminarily judged the variables with higher correlation and weight in different data sets through the loading diagram (Bouhaddani et al., 2016).
2.6 Transcription factor identification analysis and RT-qPCR
Transcription factor families were identified and annotated using ITAK (IAITAM, Canton, OH, USA) software (Perez-Rodriguez et al., 2010; Jin et al., 2014). The core genes were subjected to protein sequence extraction at the NCBI website, and blasts were selected from the plantTFDB database (Jin et al., 2014) for transcription factor analysis prediction and further understanding of the functions of the core genes. RNA was extracted from leaves of the Dianli-1844 quinoa strain under various treatments (C1, C2, TR, R) for RT-qPCR analysis. The materials used for RT-qPCR and RNA-seq analysis were derived from the same batch of experimental plants. Each reaction was repeated three times with primer design using BeaconDesign 7.9, the internal reference gene was TUB-6 (Supplementary Table 1). The reagents were PerfectStartTM SYBR qPCR Supermix (TransGen Biotech, Beijing, China). The ABI Prism 7500 instrument (Applied Biosystems, USA) was utilized, and the 2-ΔΔCт method was applied to analyze the normalized expression of each sample (Livak and Schmittgen, 2001).
2.7 Data statistics and analysis
Physiological and morphological indicators and RT qPCR data were processed and statistically analyzed using Excel 2019 (Microsoft Corporation, Redmond, Washington, WA, USA) and SPSS 26.0 for Windows (IBM Corp., Armonk, NY, USA). Significant differences were identified using a two-way analysis of variance (ANOVA). Results with P<0.05 were deemed statistically significant.
Qualitative and quantitative analysis steps of flavonoid metabolites: During instrumental analysis, one quality control sample was inserted for every 10 samples analyzed by the assay to monitor the reproducibility of the analytical process. Multivariate statistical analysis was used to maximize the preservation of the original information, and the data were simplified and downscaled to create a reliable mathematical model, and the built-in statistical prcomp function (Fraga et al., 2010) of the R software (www.r-project.org/) was used to show the analyses between the groups and the differences between the sample groups. Heatmap was drawn by R software heatmap for hierarchical cluster analysis, and Orthogonal Projections to Latent Structures - Discriminant Analysis (OPLS-DA) was utilized for differential variable screening (Chen et al., 2009; Eriksson et al., 2005), furthermore, Variable Importance in Projection (VIP) was obtained for multivariate analysis of OPLS-DA model and combined with Fold Change to further screen differential metabolites (Thevenot et al., 2015). Significantly regulated metabolites between groups were further analyzed by screening differential metabolites with VIP ≥ 1, fold change ≥ 2 and fold change ≤ 0.5. If the difference in metabolites between the control group and the experimental group is more than 2 times or less than 0.5, it is considered significant. The identified metabolites were annotated through the Kyoto Encyclopedia of Genes and Genomes (KEGG) Compound Database (http://www.kegg.jp/kegg/compound/) and then the annotated metabolites were mapped to the KEGG Pathway Database (http://www.kegg.jp/kegg/pathway.html) (Thevenot et al., 2015). Pathways with significantly regulated metabolites were entered into MSEA (metabolite sets enrichment analysis) and their significance was determined by the p-value of the hypergeometric test.
3 Results and analysis
3.1 Changes in the phenotype of quinoa and the total flavonoid content in its leaves after flooding and drainage treatments
Following flooding and post-drainage recovery treatments, quinoa exhibited significant phenotypic alterations, indicating high sensitivity of its growth and developmental processes to flooding stress (Supplementary Table 2). Under flooding stress, the dry weight, fresh weight, and leaf area of quinoa leaves were significantly reduced. Following post-drainage recovery, plant height, leaf area, and dry leaf weight remained markedly lower compared to the control group. These results indicate that flooding stress inflicted irreversible damage on quinoa, leading to persistently impaired growth and development even after recovery. The total flavonoid content of quinoa leaves showed significant changes under flooding stress and recovery treatment (Figure 1). Overall, the flavonoid content of leaves under both flooding and recovery treatments was higher than that of the control. The TR flavonoid content was the highest and significantly higher than that of the other treatments, and the content decreased after drainage treatment. It indicated that flavonoids played a role in quinoa coping with flooding stress.
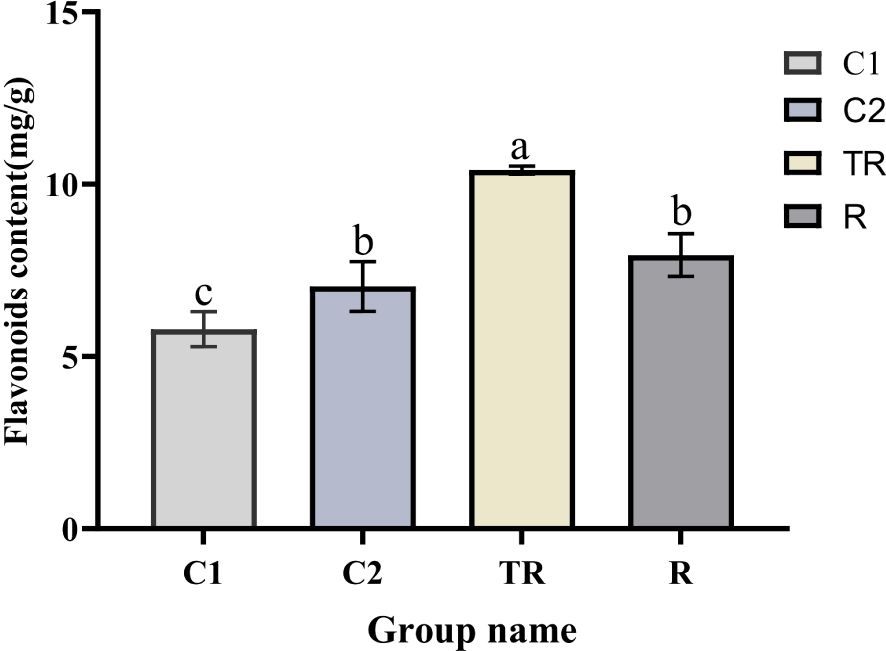
Figure 1. Changes in flavonoid content in quinoa leaves under flooding and recovery treatments. Different letters (a-c) indicate significant differences (P < 0.05) and the same letter indicates no significance (P > 0.05).
3.2 Qualitative and quantitative analysis of flavonoid metabolites
We constructed principal component analysis score plots (Supplementary Figure 1A) with flavonoids to understand the classification of flavonoids in the 12 samples. As shown in the figure, the QC samples have a high degree of overlap, indicating good instrumental stability and data reliability. The 12 samples showed good biological reproducibility within groups and good differentiation between groups, reaching 39.34% for PC1 and 71.03% overall, indicating that the flavonoids were reproducible in the 12 samples and reliable for subsequent analysis. Qualitative and quantitative analyses were conducted on flavonoids in quinoa leaves, with a total of 433 flavonoid metabolites detected (Supplementary Table 3). Of which there were 16 chalcones, 20 flavanols, 44 flavanones, 10 flavanonols, 150 flavones, 158 flavonols, 8 isoflavones, and 27 other flavonoids (Supplementary Figure 1B). Flavones and flavonols had the highest numbers, 150 and 158 respectively, while isoflavones and flavanonols had the fewest, only 8 and 10 respectively. Clustering heatmap analysis of 433 flavonoid metabolites (Supplementary Figure 1C) revealed a distinct separation between the up- and down-regulated clusters in the TR group compared to C1, indicating marked alterations in flavonoid accumulation during C1 vs TR. This suggests that flavonoid biosynthesis was significantly induced by flooding stress. Similarly, in the C2 vs R comparison, differential accumulation patterns persisted, where flavonoid levels failed to fully revert to baseline after 7-day drainage recovery, demonstrating that flooding-induced damage to quinoa was not entirely alleviated.
3.3 Analysis of differential accumulation of flavonoid metabolites
In the comparison of C1 vs. TR, 56 differential flavonoid metabolites were identified, with 22 down-regulated and 34 up-regulated (Figure 2A; Supplementary Table 4). For C2 vs. R, 52 differential flavonoid metabolites were detected, including 23 down-regulated and 29 up-regulated (Figure 2B; Supplementary Table 5). In the TR vs. R group, 75 differential flavonoid metabolites were observed, of which 40 were down-regulated and 35 up-regulated (Figure 2C; Supplementary Table 6). The top three metabolites with the largest absolute Log2 Fold Change values across the three comparative groups were summarized in Table 1. We observed that the highest-fold-change metabolites in all three comparisons belonged to the flavonols and flavones subclasses. Notably, Isotamarixin was consistently identified across all three comparative groups, suggesting its potential critical regulatory role in quinoa’s response to flooding stress. Furthermore, Galangin-7-O-glucoside, detected in both the C1 vs TR and C2 vs R comparisons, underscores its biologically significant involvement in adaptive mechanisms. In summary, the accumulation of flavonoids was both up-regulated and down-regulated in the three comparison groups of C1 vs TR, C2 vs R, and TR vs R, suggesting that flavonoids can respond to the flooding stress suffered by quinoa during the filling stage through changes in accumulation. Wayne’s analysis of flavonoid differential metabolites (Figure 2D; Supplementary Table 7) showed 22 flavonoid differential metabolites specific to C1 vs TR, dominated by flavonols (11) and flavones (7), and 19 flavonoid differential metabolites specific to C2 vs R, dominated by Flavonols (5) and flavones (7); the number of flavonoid differential metabolites specific to TR vs R was 45, dominated by flavones (19) and flavonols (14). Seven differential metabolites were co-occurring in the three comparison groups, mainly Flavones (4). This suggests that flavonols and flavones play an important role in the response of quinoa to flooding stress.
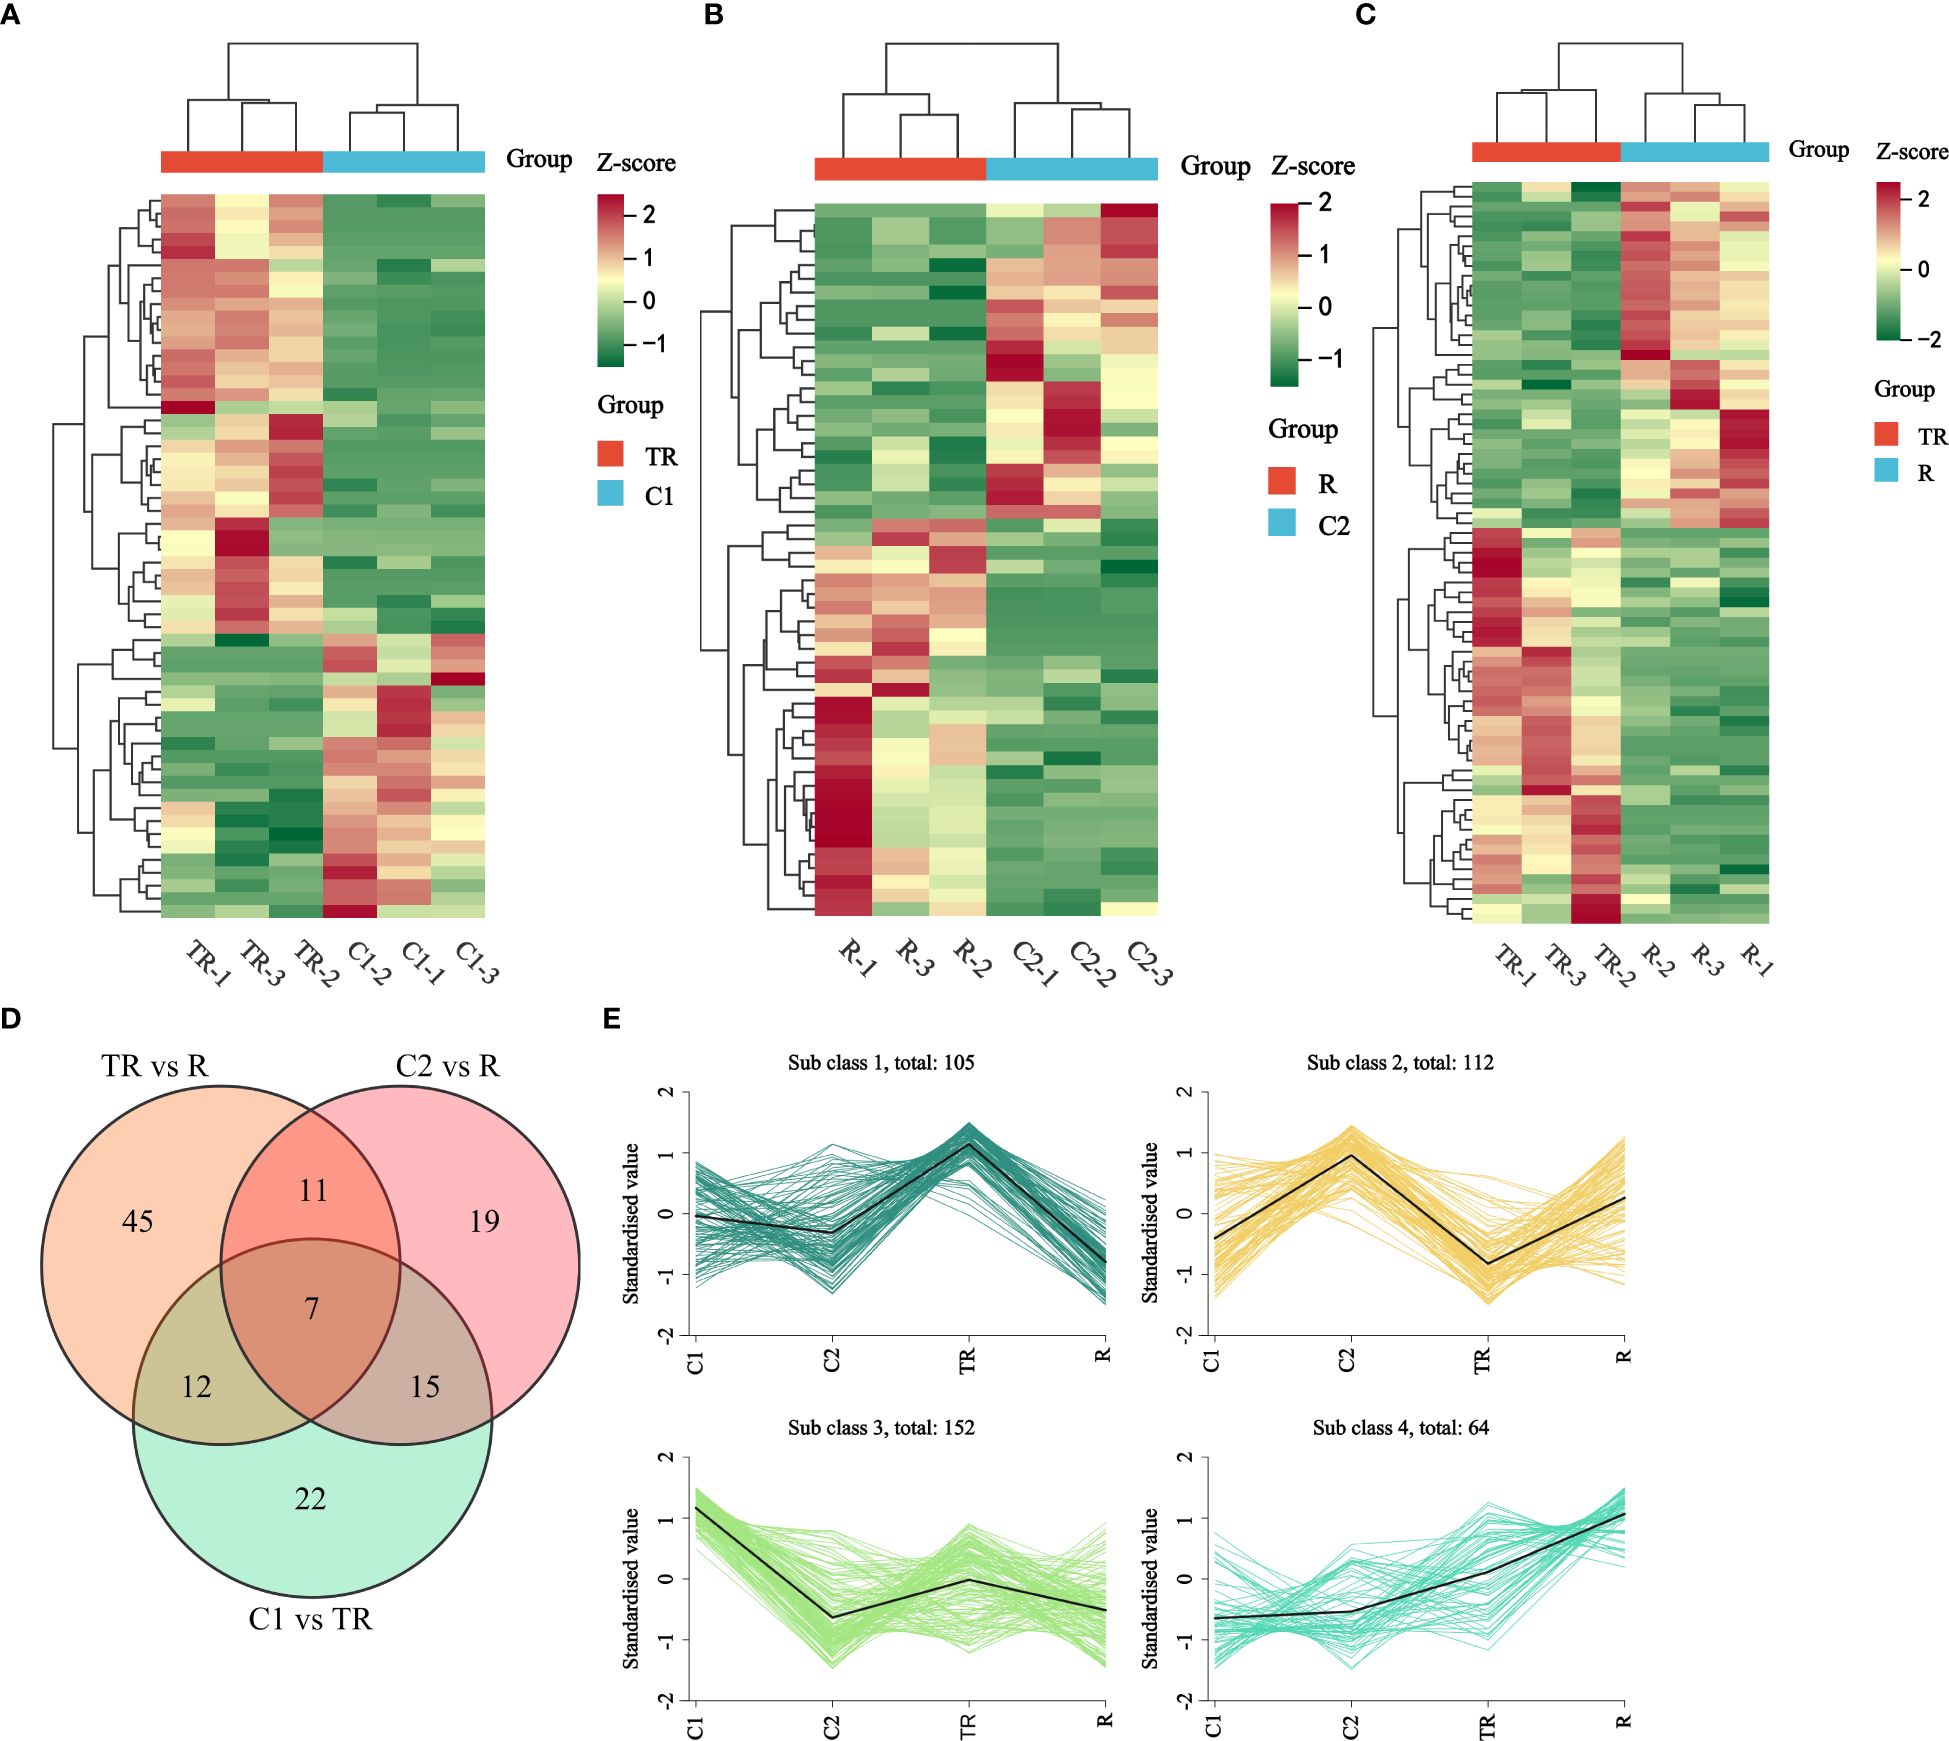
Figure 2. (A) Thermogram of differential metabolite accumulation of flavonoids in C1 vs TR. (B) Thermogram of differential metabolite accumulation of flavonoids in C2 vs R. (C) Thermogram of differential metabolite accumulation of flavonoids in TR vs R. (D) Venn diagram of differential accumulation of flavonoid metabolites. (E) K-means plot of relative content of differential metabolites of flavonoids. Horizontal coordinates indicate samples and vertical coordinates indicate metabolite abundance after centering and normalization.
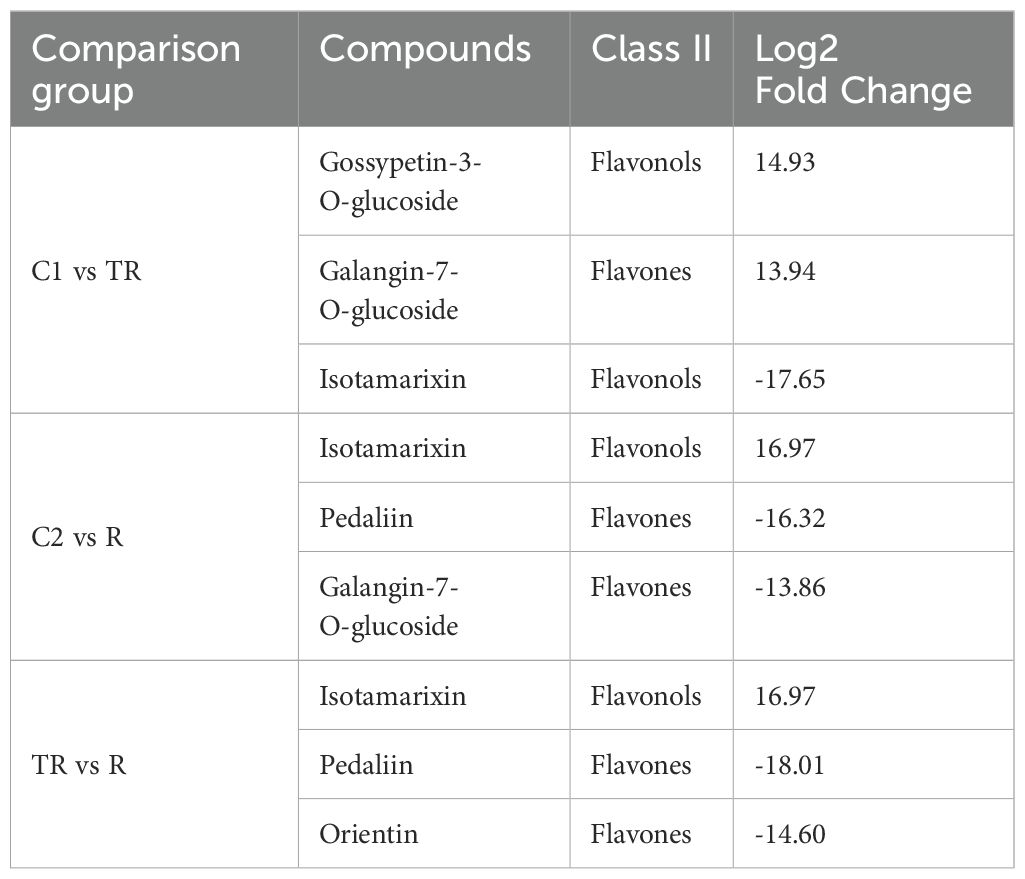
Table 1. Top three absolute values of Log2 Fold Change in flavonoid differential metabolites.
The flavonoid differential metabolites were subjected to K-means clustering analysis after standardized and centralized processing. The subclass categorization criteria were defined as follows: the similarity between data objects was measured by inter-sample distance, where smaller distances indicated higher similarity and a higher likelihood of belonging to the same subclass. The results revealed that flavonoids were clustered into four subclasses: Subclass1 (105), Subclass2 (112), Subclass3 (152), and Subclass4 (64) (Figure 2E). Subclass2 and Subclass3 likely represent flavonoids that naturally accumulate or decline with developmental progression. Notably, metabolites clustered in Subclass1 exhibited significantly higher levels under flooding stress (TR) compared to the control (C1, C2) and recovery groups (R), suggesting rapid accumulation in response to short-term hypoxia and subsequent sharp decline post-recovery. In Subclass4, metabolite levels in TR and R were higher than in C1 and C2, with R surpassing TR. It is hypothesized that these metabolites may be involved in long-term adaptation to flooding stress and mitigation of oxidative damage during recovery, thus maintaining elevated levels in R. The differential dynamics of these two subclasses highlight a dual “acute-chronic” regulatory strategy in quinoa to combat flooding stress through flavonoid metabolism.
3.4 Functional annotation and enrichment analysis of the flavonoid differential metabolite KEGG
The annotation results of KEGG database indicate that the flavonoid metabolites among different treatments were mainly involved in flavonoid biosynthesis (ko00941), phenylpropanoid biosynthesis (ko00940) and flavone and flavonol biosynthesis (ko00944). The differential metabolites annotated in these three pathways are shown in Table 2. In C1 vs TR, a total of 74 metabolites were annotated in the three pathways, of which 10 were significantly different; in C2 vs R, a total of 73 metabolites were annotated in the three pathways, of which 13 were significantly different; and in TR vs R, a total of 73 metabolites were annotated in the three pathways, of which 19 were significantly different. The number of differentially different metabolites enriched in these three pathways was relatively similar among the three comparison groups; however, in terms of significantly different metabolites, the TR vs R group was enriched in the highest number, while the C1 vs TR group was enriched in the lowest number.
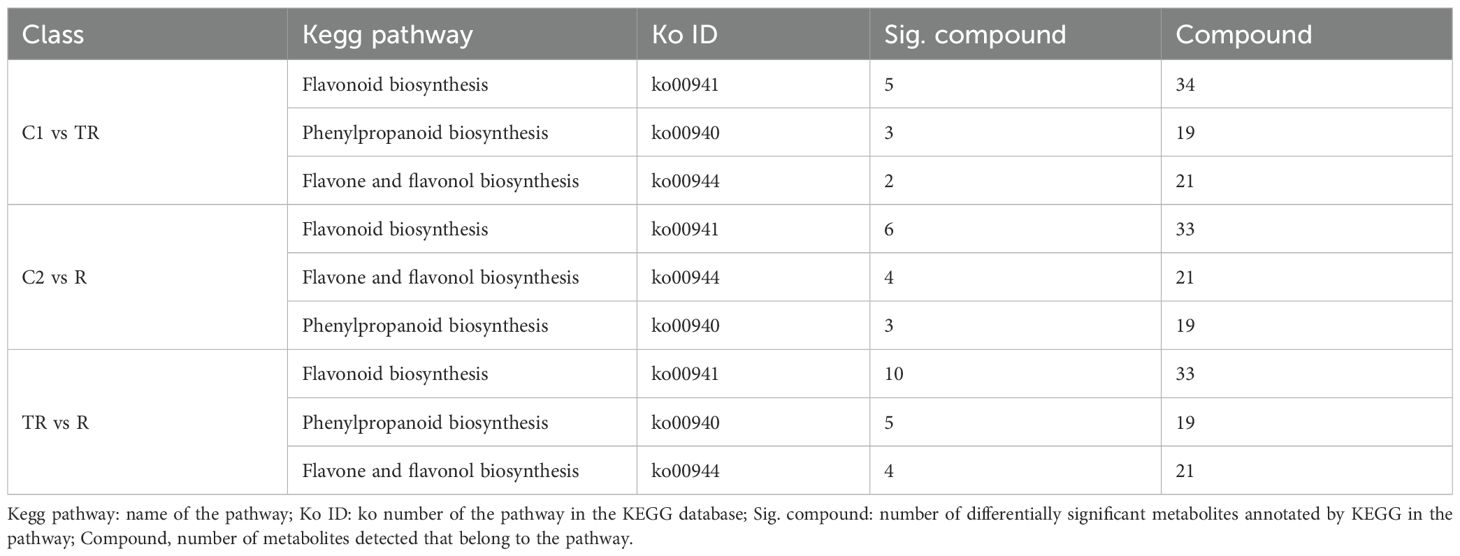
Table 2. Significant changes in KEGG statistics after flooding and restoration treatments.
3.5 Transcriptome and differentially expressed gene analysis
To intuitively demonstrate the dispersion patterns among the 12 samples, we constructed a principal component analysis (PCA) plot based on gene expression levels (Supplementary Figure 2A). The results revealed strong intra-group reproducibility and distinct inter-group separation, with PC1 accounting for 30.48% and cumulative reaching 54.43%, indicating high reliability for subsequent analyses. We identified 552 flavonoid biosynthesis-related genes enriched in three pathways: Flavonoid biosynthesis (ko00941), Phenylpropanoid biosynthesis (ko00940), and Flavone and flavonol biosynthesis (ko00944). These genes’ FPKM expression values were centered, normalized, and subjected to hierarchical clustering analysis, visualized through a clustering heatmap (Supplementary Figure 2B). The results demonstrated that the 12 samples clustered into four groups corresponding exactly to the 4 experimental treatments, with clear differentiation in gene expression profiles between treatments.
Genes within the same subclass exhibited similar expression trends across experimental groups, strongly suggesting shared functional roles. K-means clustering analysis was performed on the centralized and standardized FPKM values of 552 flavonoid biosynthesis-related genes (Figure 3A). The results categorized these genes into 10 distinct subclasses, with Subclass2 (108) and Subclass 4 (104) containing the largest number of genes. In Subclass 2, gene expression levels surged dramatically under waterlogging stress (TR), significantly exceeding those in other groups (C1, C2, and R), Indicating that these genes were strongly induced by flooding stress. For Subclass 4, gene expression sharply increased during post-flooding recovery (R), surpassing all other groups, suggesting these genes may regulate flavonoid accumulation to mitigate oxidative damage during reoxygenation. Additionally, genes in Subclass 6 displayed markedly higher expression in TR and R groups compared to controls (C1 and C2), implying their persistent regulatory role in countering oxidative stress. Notably, Subclass 7 genes exhibited declining expression from C1 to C2 but rising expression from TR to R. This divergent expression pattern between control and stress conditions strongly suggests their critical involvement in quinoa’s adaptive response to flooding. Differential genes associated with flavonoid synthesis were plotted on a Wayne diagram, and it was found that there were 42 differential genes common to the three comparison groups, and 42, 15, and 37 differential genes specific to C1 vs TR, C2 vs R, and TR vs R, respectively Figure 3B).
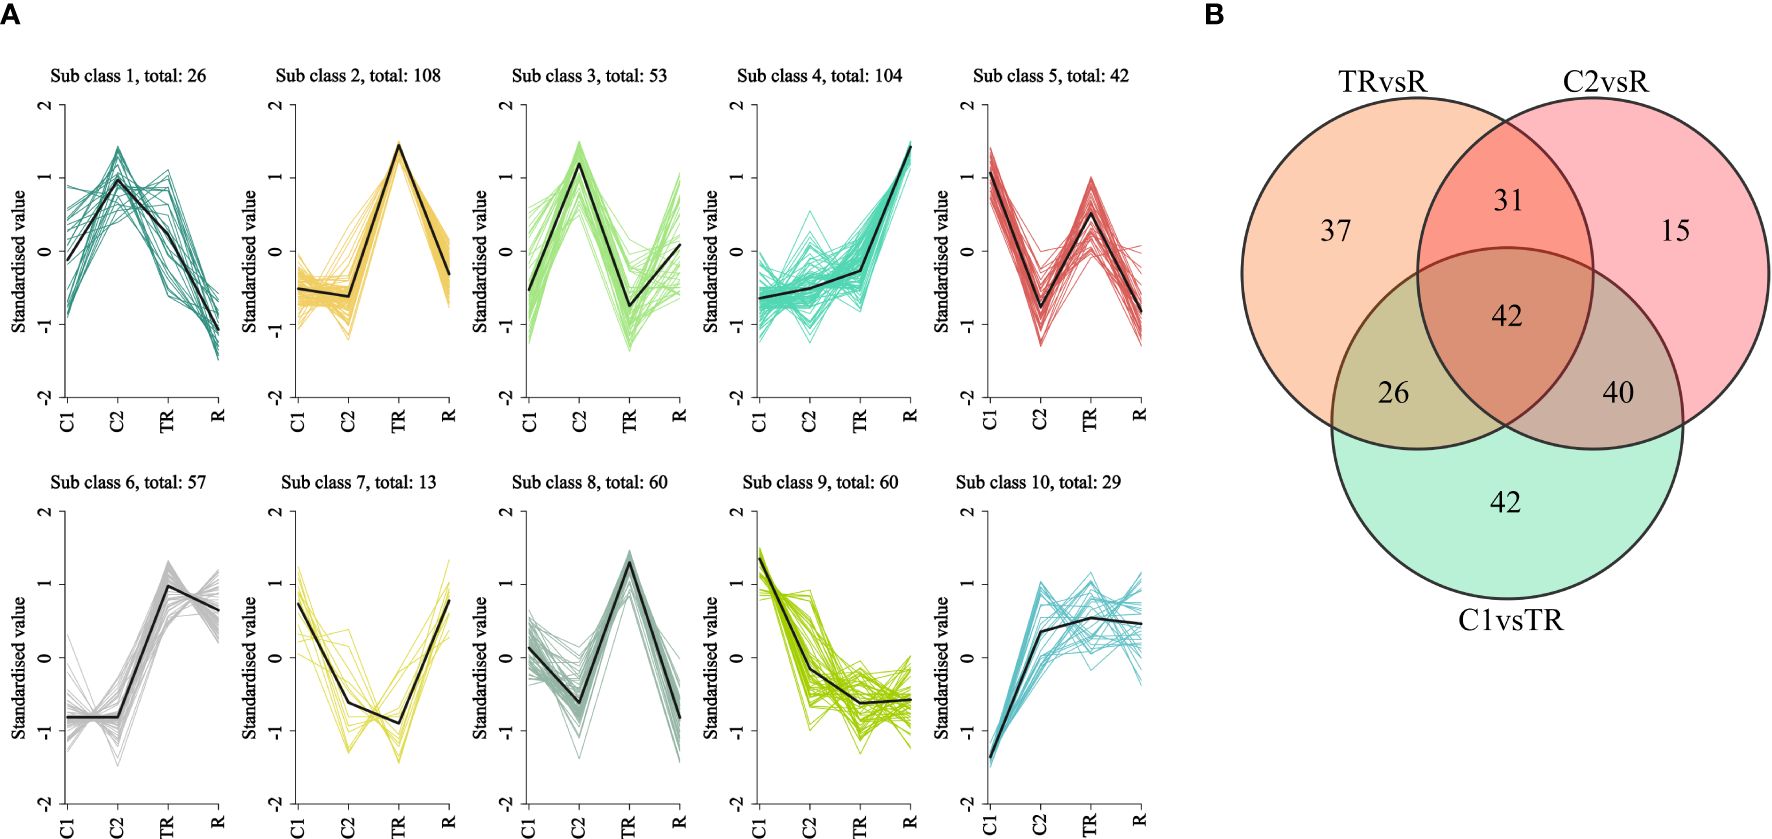
Figure 3. (A) K-means clustering plot. Horizontal coordinates indicate samples and vertical coordinates indicate expression after centering and normalization. (B) Wayne plots of differential genes in different subgroups.
3.6 Analysis of GO and KEGG associated with flavonoid metabolites in the transcriptome
As shown in Table 3, all expressed genes in the transcriptome were enriched only in the Molecular Function and Biological Process Ontology entries in the GO entry. In C1 vs TR, C2 vs R, and TR vs R, the differentially expressed genes are all enriched in flavonoid sulfotransferase activity (GO:1990135) in molecular function and flavonoid biosynthetic process (GO:0009813), flavonoid metabolic process (GO:0009812), phenylpropanoid biosynthetic process (GO:0009699), phenylpropanoid catabolic process (GO:0046271), and phenylpropanoid metabolic process (GO:0009698) in biological process. However, there were differences in the number of genes enriched in each group, with C1 vs TR, C2 vs R, and TR vs R enriched for a total of 252, 299, and 347 differential genes in these six pathways, respectively.
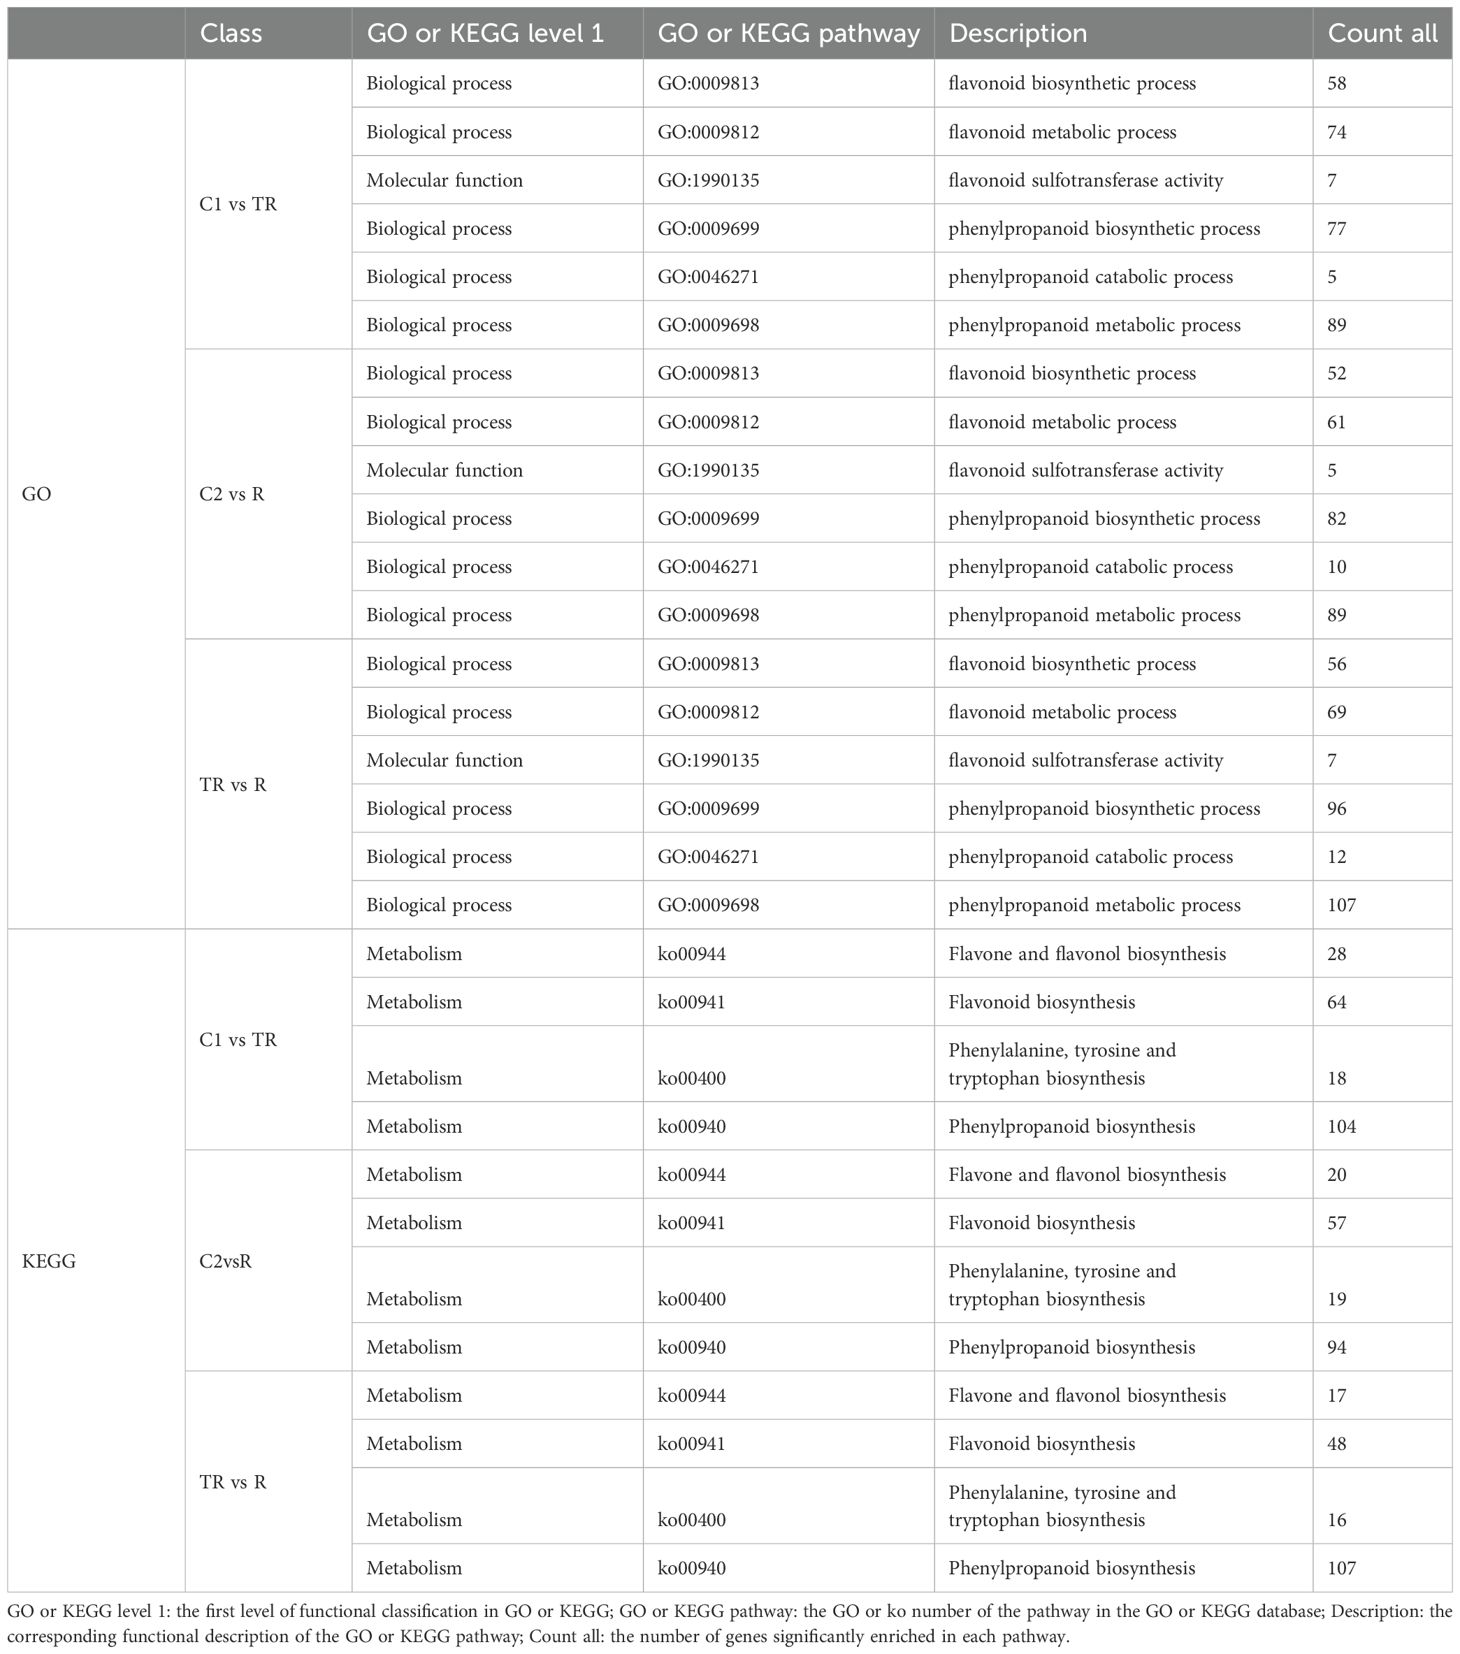
Table 3. Significant enrichment pathways of flavonoids in GO and KEGG.
Statistical analysis was performed to assess the significant enrichment of all expressed genes from the transcriptome in flavonoid biosynthesis-related KEGG pathways (Table 3). The results showed that the differential genes in the three comparison groups were mainly enriched in flavone and flavonol biosynthesis (ko00944), flavonoid biosynthesis (ko00941), phenylalanine, tyrosine and tryptophan biosynthesis (ko00400) and phenylpropanoid biosynthesis (ko00940). C1 vs TR, C2 vs R and TR vs R were enriched for a total of 214, 190 and 188 differential genes in the above four pathways.
3.7 Joint metabolomic and transcriptomic analysis of flavonoid regulation in quinoa leaves under flooding stress during the filling stage
To understand the differences in flavonoid biosynthesis in quinoa leaves under flooded, restored, and normal control conditions, we integrated metabolomic and transcriptomic data to construct the mechanism of flavonoid biosynthesis in quinoa leaves under flooded and restored treatments during the filling stage (Figure 4A). A total of 9 enzymes and 18 metabolites regulated by 30 genes were found to play key roles in response to flooding stress.
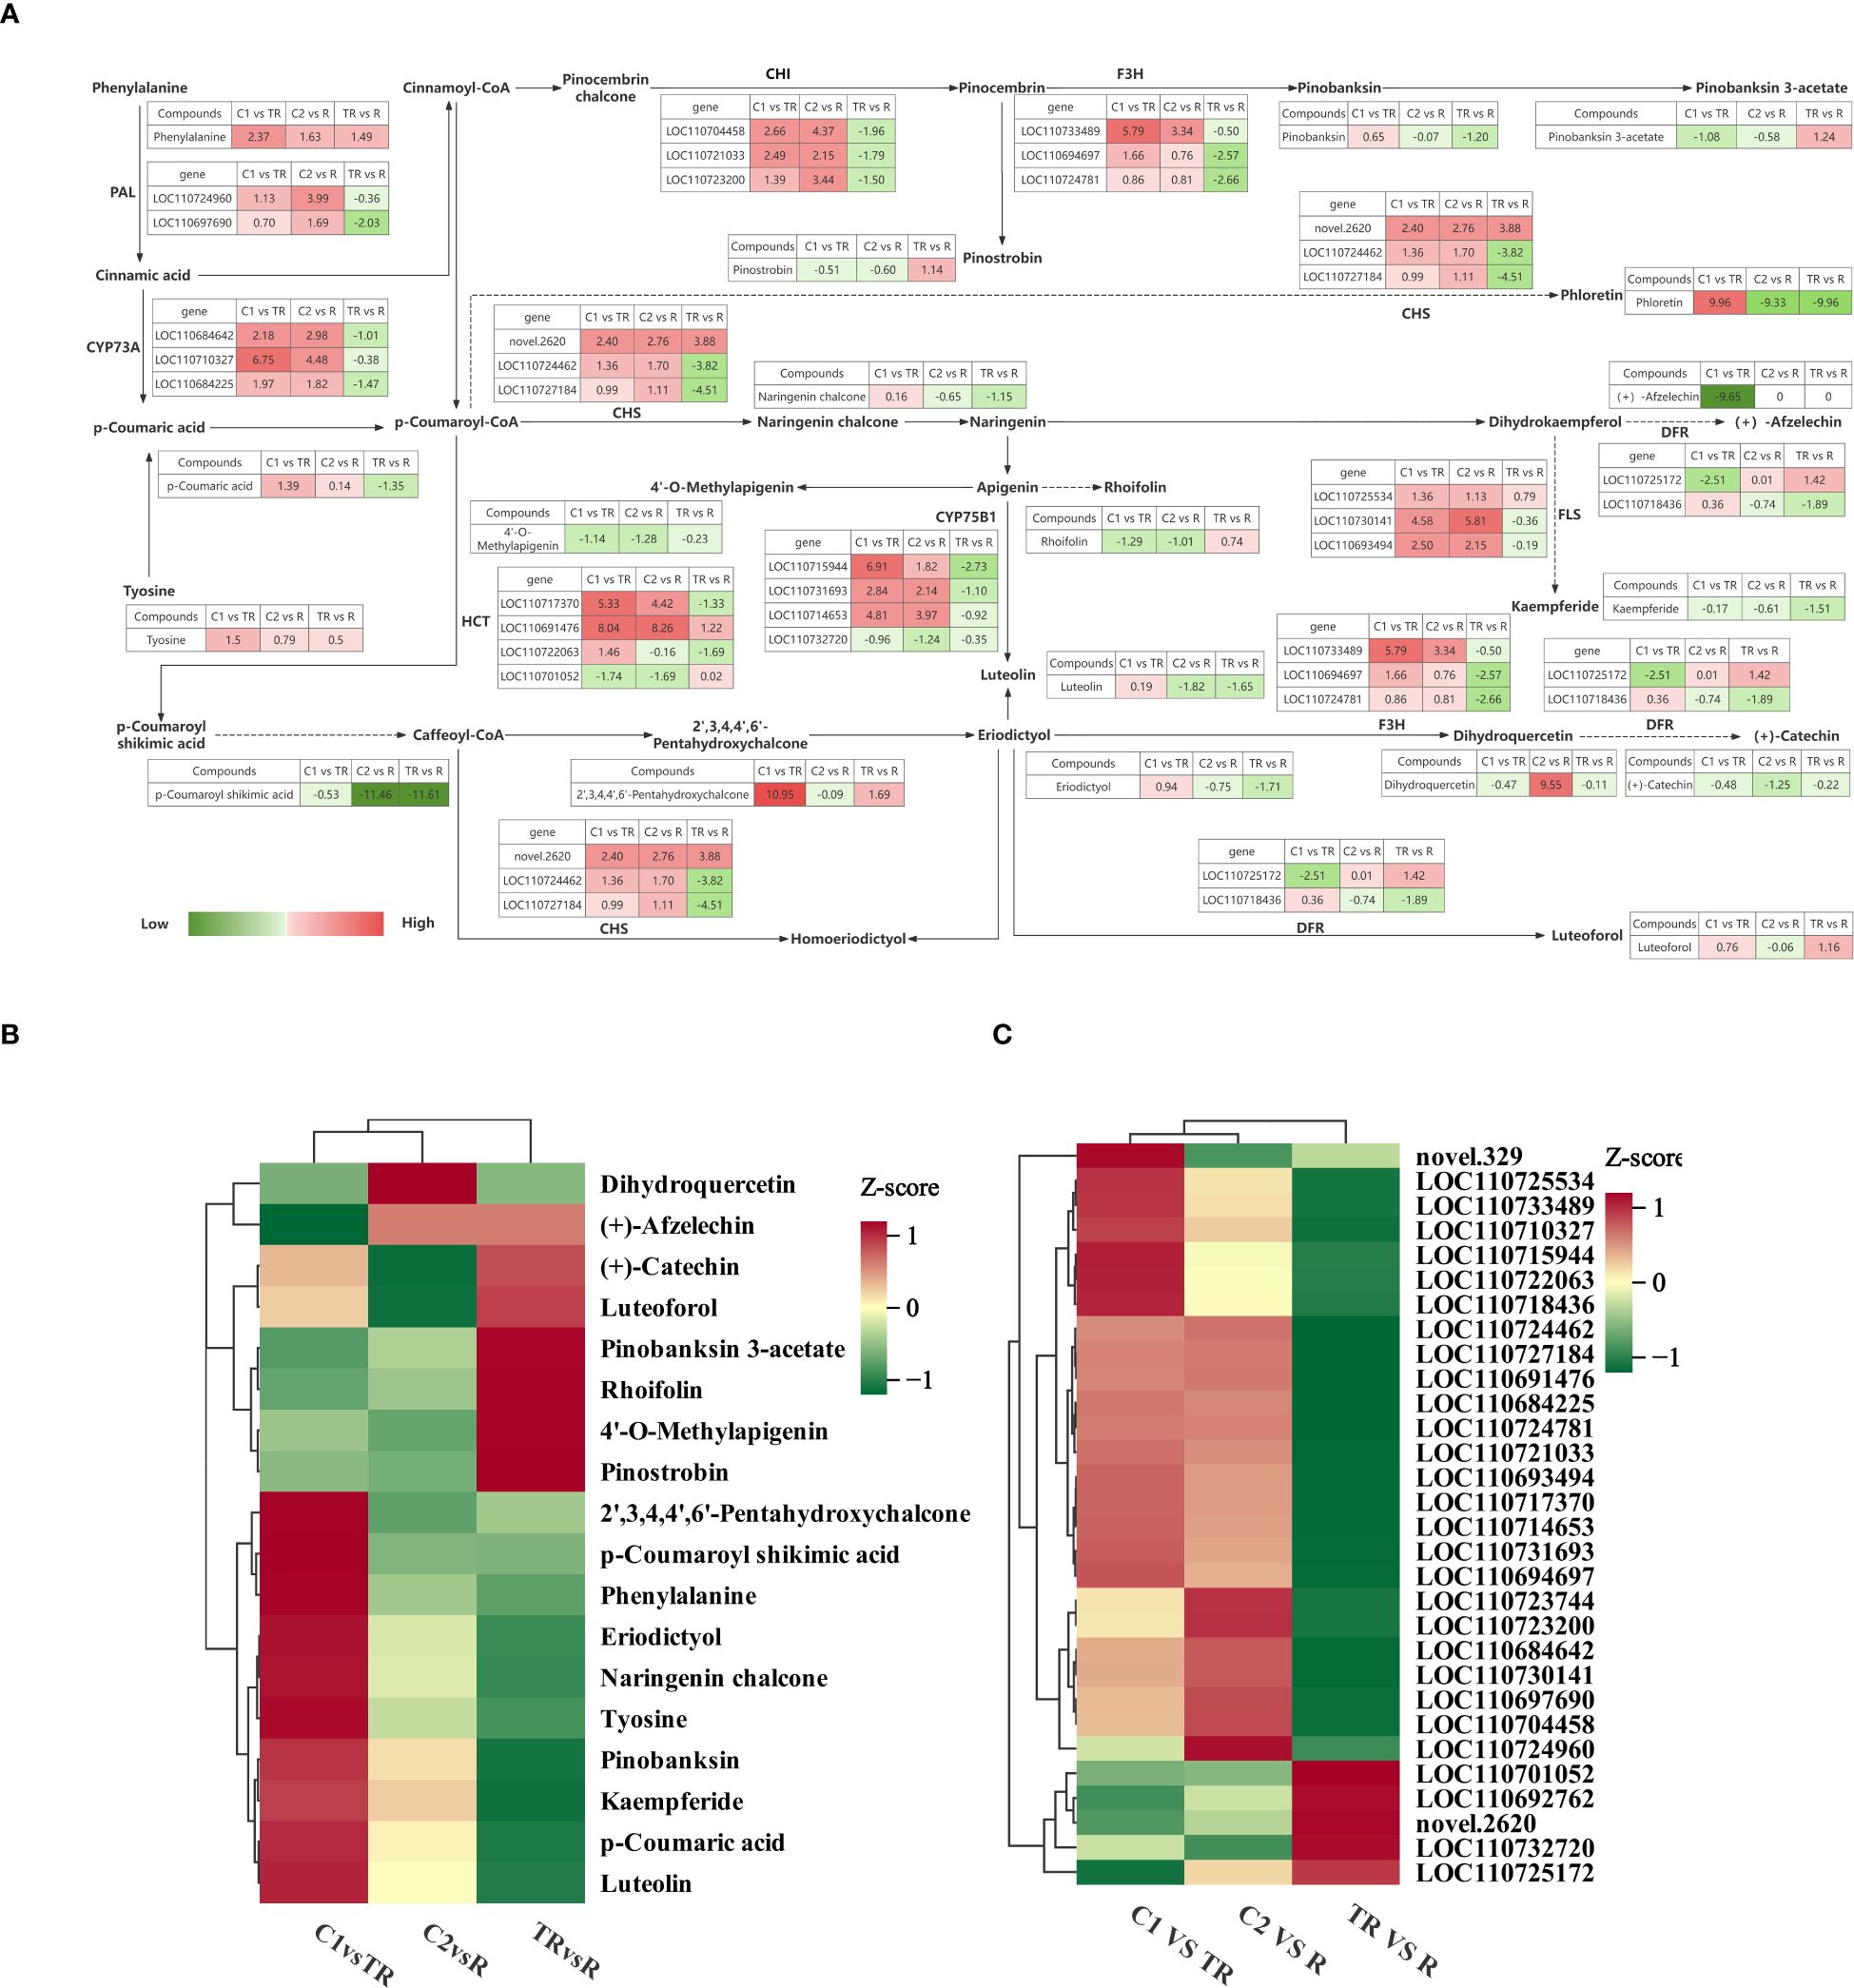
Figure 4. (A) Flavonoid response mechanisms in quinoa leaves during the filling stage under flooding-recovery conditions. Red coloration denotes upregulated expression in the latter treatment group of comparative pairs, while green indicates downregulation, with color intensity scaling proportionally to the absolute Log2Fold-Change values. (B) Clustering heat map of key metabolites. (C) Clustering heat map of key genes.
Phenylalanine is catalyzed by phenylalanine ammonia-lyase (PAL) [EC: 4.3.1.24] for the synthesis of Cinnamic acid, and two of the genes in PAL are up-regulated for expression in C1 vs TR, C2 vs R, and down-regulated for expression in TR vs R. Cinnamic acid synthesis of p-Coumaric acid was catalyzed by trans-cinnamate 4-monooxygenase (CYP73A) [EC: 1.14.14.91]. Up-regulation of CYP73A expression in C1 vs TR, C2 vs R resulted in up-regulation of p-coumaric acid accumulation, and down-regulation in TR vs R resulted in down-regulation of p-coumaric acid accumulation, suggesting a positive correlation between CYP73A and p-coumaric acid. Synthesis of p-coumaroyl shikimic acid from p-coumaroyl-CoA catalyzed by shikimate o-hydroxycinnamoyl transferase (HCT) [E2.3.1.133]; up-and down-regulation of some of the genes in HCT resulted in down-regulation of p-coumaroyl shikimic acid accumulation in both C1 vs TR, C2 vs R and TR vs R. Flavonoid 3’-monooxygenase (CYP75B1) [EC:1.14.14.82] catalyzed the synthesis of luteolin from naringenin, and luteolin was up-regulated in C1 vs TR and down-regulated in C2 vs R and TR vs R. Chalcone isomerase (CHI) [EC: 5.5.1.6] catalyzes the synthesis of pinocembrin from Pinocembrin chalcone. CHI is up-regulated in C1 vs TR and C2 vs R, and down-regulated in TR vs R. Catalyzed by naringenin 3-dioxygenase (F3H) [EC:1.14.11.9] pinocembrin forms pinobanksin and eriodictyol forms dihydroquercetin. In C1vsTR, F3H was significantly up-regulated, positively correlated with eriodictyol and negatively correlated with dihydroquercetin. In C2 vs R, F3H was down-regulated and negatively correlated with eriodictyol and positively correlated with dihydroquercetin; in TR vs R, F3H was down-regulated and positively correlated with both eriodictyol and dihydroquercetin. This indicates that under flooding stress, genes respond to flooding stress by upregulating F3H, and after recovery treatment, F3H activity gradually decreases. p-coumaroyl-CoA forms phloretin and naringenin chalcone catalyzed by chalcone synthase (CHS) [EC:2.3.1.74]. CHS was positively correlated with phloretin and naringenin chalcone in C1 vs TR; CHS was negatively correlated with phloretin and naringenin chalcone in C2 vs R; in TR vs R, the genes decreased the accumulation of phloretin and naringenin chalcone through a combination of up- and down-regulation. Under the co-catalysis of bifunctional dihydroflavonol 4-reductase (DFR) [EC: 1.1.1.219] and flavanone 4-reductase (DFR) [EC: 1.1.1.234], dihydrokaempferol formed (+)- afzelechin, dihydroquercetin to form (+)-catechin and eriodictyol to form luteoforol. Among them, the accumulation of (+)-afzelechin was significantly down-regulated in C1 vs TR, and there was no significant change in C2 vs R and TR vs R, indicating that the synthesis of (+)-afzelechin was blocked under flooding stress; the accumulation of (+)-catechin was down-regulated in C1 vs TR, C2 vs R and TR vs R; the accumulation of luteoforol was up-regulated in C1 vs TR and TR vs R, and down-regulated in C2 vs R. Dihydrokaempferol was catalyzed by flavonol synthase (FLS) [EC: 1.14.20.6] for the synthesis of kaempferide. FLS up-regulation in C1 vs TR and TR vs R resulted in down-regulation of kaempferide, and in TR vs R, the genes were both up-and down-regulated, which together resulted in a decrease in kaempferide content.
The changes of 30 key genes and 18 key metabolites in C1 vs TR, C2 vs R and TR vs R were plotted as clustered heatmaps (Figures 4B, C). The results showed that the expression and abundance of these genes and metabolites varied significantly across the comparison groups and may play an important role under the quinoa flooding-restoration treatment.
3.8 Identification and screening of core genes and transcription factors related to flavonoid synthesis
To investigate the overall correlation between flavonoids in the transcriptome and metabolome of quinoa under flooding stress, we performed CCA of differential genes and differential metabolites in the ko00940, ko00941, and ko00944 pathways in C1 and TR (Supplementary Figures 3A-C). The results showed that in the ko00940 pathway, l-tyrosine* (mws0250), l-phenyalanine (pme0021), and p-coumaric acid* (pme1439) were highly associated with LOC110719131, LOC110705359, and LOC110733538, respectively, indicating that these three genes are the core genes regulating l-tyrosine* (mws0250), l-phenyalanine (pme0021), and p-coumaric acid* (pme1439). In the ko00941 pathway, 3-o-acetylpinobanksin (mws1074), phloretin (pme1201), and xanthohumol (mwshy0112) have high associations with novel. 1604, LOC110710327, and LOC110725172, respectively. Afzelechin (pme3285) and 3,4,2 ‘, 4’, 6 ‘- pentahydroxychalcone (lmsp004137) have very high associations with LOC110717594 and LOC110710327, respectively. In the ko00944 pathway, rhoifolin (mws0047) and acacetin (mws0051) were highly correlated with LOC110719441 and LOC110732722, respectively. In summary, LOC110719131, LOC110705359, LOC110733538, novel.1604, LOC110725172, LOC110717594, LOC110710327, LOC110719441, and LOC110732722 genes have important roles in the synthesis of the above 10 flavonoid compounds.
To reflect the overall impact of transcriptomic and metabolomic data between groups, it is important to reflect the extent to which changes in different variables affect the other grouping, and thus to discover more precisely the key regulatory phenomena in quinoa leaves under flooding stress during grouting period. We selected the differential genes and flavonoid differential metabolites related to flavonoid synthesis in C1 vs TR to establish the Two - Block Orthogonal Partial Least Squares (O2PLS) model and screened out the important variables affecting the other omics by initially determining the variables with higher correlation and weight in different data sets through the loadings plot (Supplementary Figure 3D). The results showed that the top five genes with the greatest effect on flavonoid metabolites were LOC110695540, LOC110733538, LOC110725836, LOC110691988, and LOC110684657. The top five flavonoid metabolites with the greatest effect on gene expression were nobiletin (mwshy0018), tangeretin (mws0055),5-demethylnobiletin;5-hydroxy-6,7,8,3’,4’-pentamethoxyflavone(pmp000113),1,8-dihydroxy-2,6-dimethoxy-5-{[(2s,3r,4s,5s,6r)-3,4,5-trihydroxy-6-(hydroxymethyl) oxan-2-yl]oxy}xanthen-9-one(wbtn004861) and maesopsin* (lcsn003955). These five genes and metabolites are highly likely to be key factors in the response of quinoa leaves to flooding stress.
To clarify the effects of transcription factors on flavonoid accumulation under flooding stress, we analyzed the correlation between differential genes and flavonoid differential metabolites in C1 vs TR, C2 vs R, and TR vs R, and selected 50 genes with the top 20 Correlation values and a P-value ≤ 0.01 for transcription factor identification, and a total of 10 transcription factors were identified (Supplementary Table 8). Subsequently, the structural genes, transcription factors and flavonoid metabolites related to flavonoid synthesis were analyzed for correlation, and the structural genes, transcription factors and flavonoid metabolites with Correlation≥ |0.8| and P-value ≤ 0.01 were selected to draw the correlation network diagram (Figure 5). The network interactions map showed that the core transcription factors were LOC110683995 (bHLH), LOC110697487 (MYB), LOC110711216 (MADS-MIKC), LOC110685557 (bZIP) and LOC110689432 (MYB); the core structural genes were LOC110715716 and LOC110719130; core flavonoid metabolites were Genistin (mws0895), 3-methylkaempferol (lmcp004624), carthamone* (pmn001716) and oroxylin a (mwshy0187), respectively. Two of the transcription factors belonged to the MYB family, and one each to the bZIP, MADS, and bHLH families. RT-qPCR was performed on the five core transcription factors identified in the correlation network diagram to verify their expression. The results indicated that the expression levels were consistent with the RNA-sequencing (RNA-seq) data, thereby confirming the accuracy and reliability of the RNA-seq results (Supplementary Figure 4).
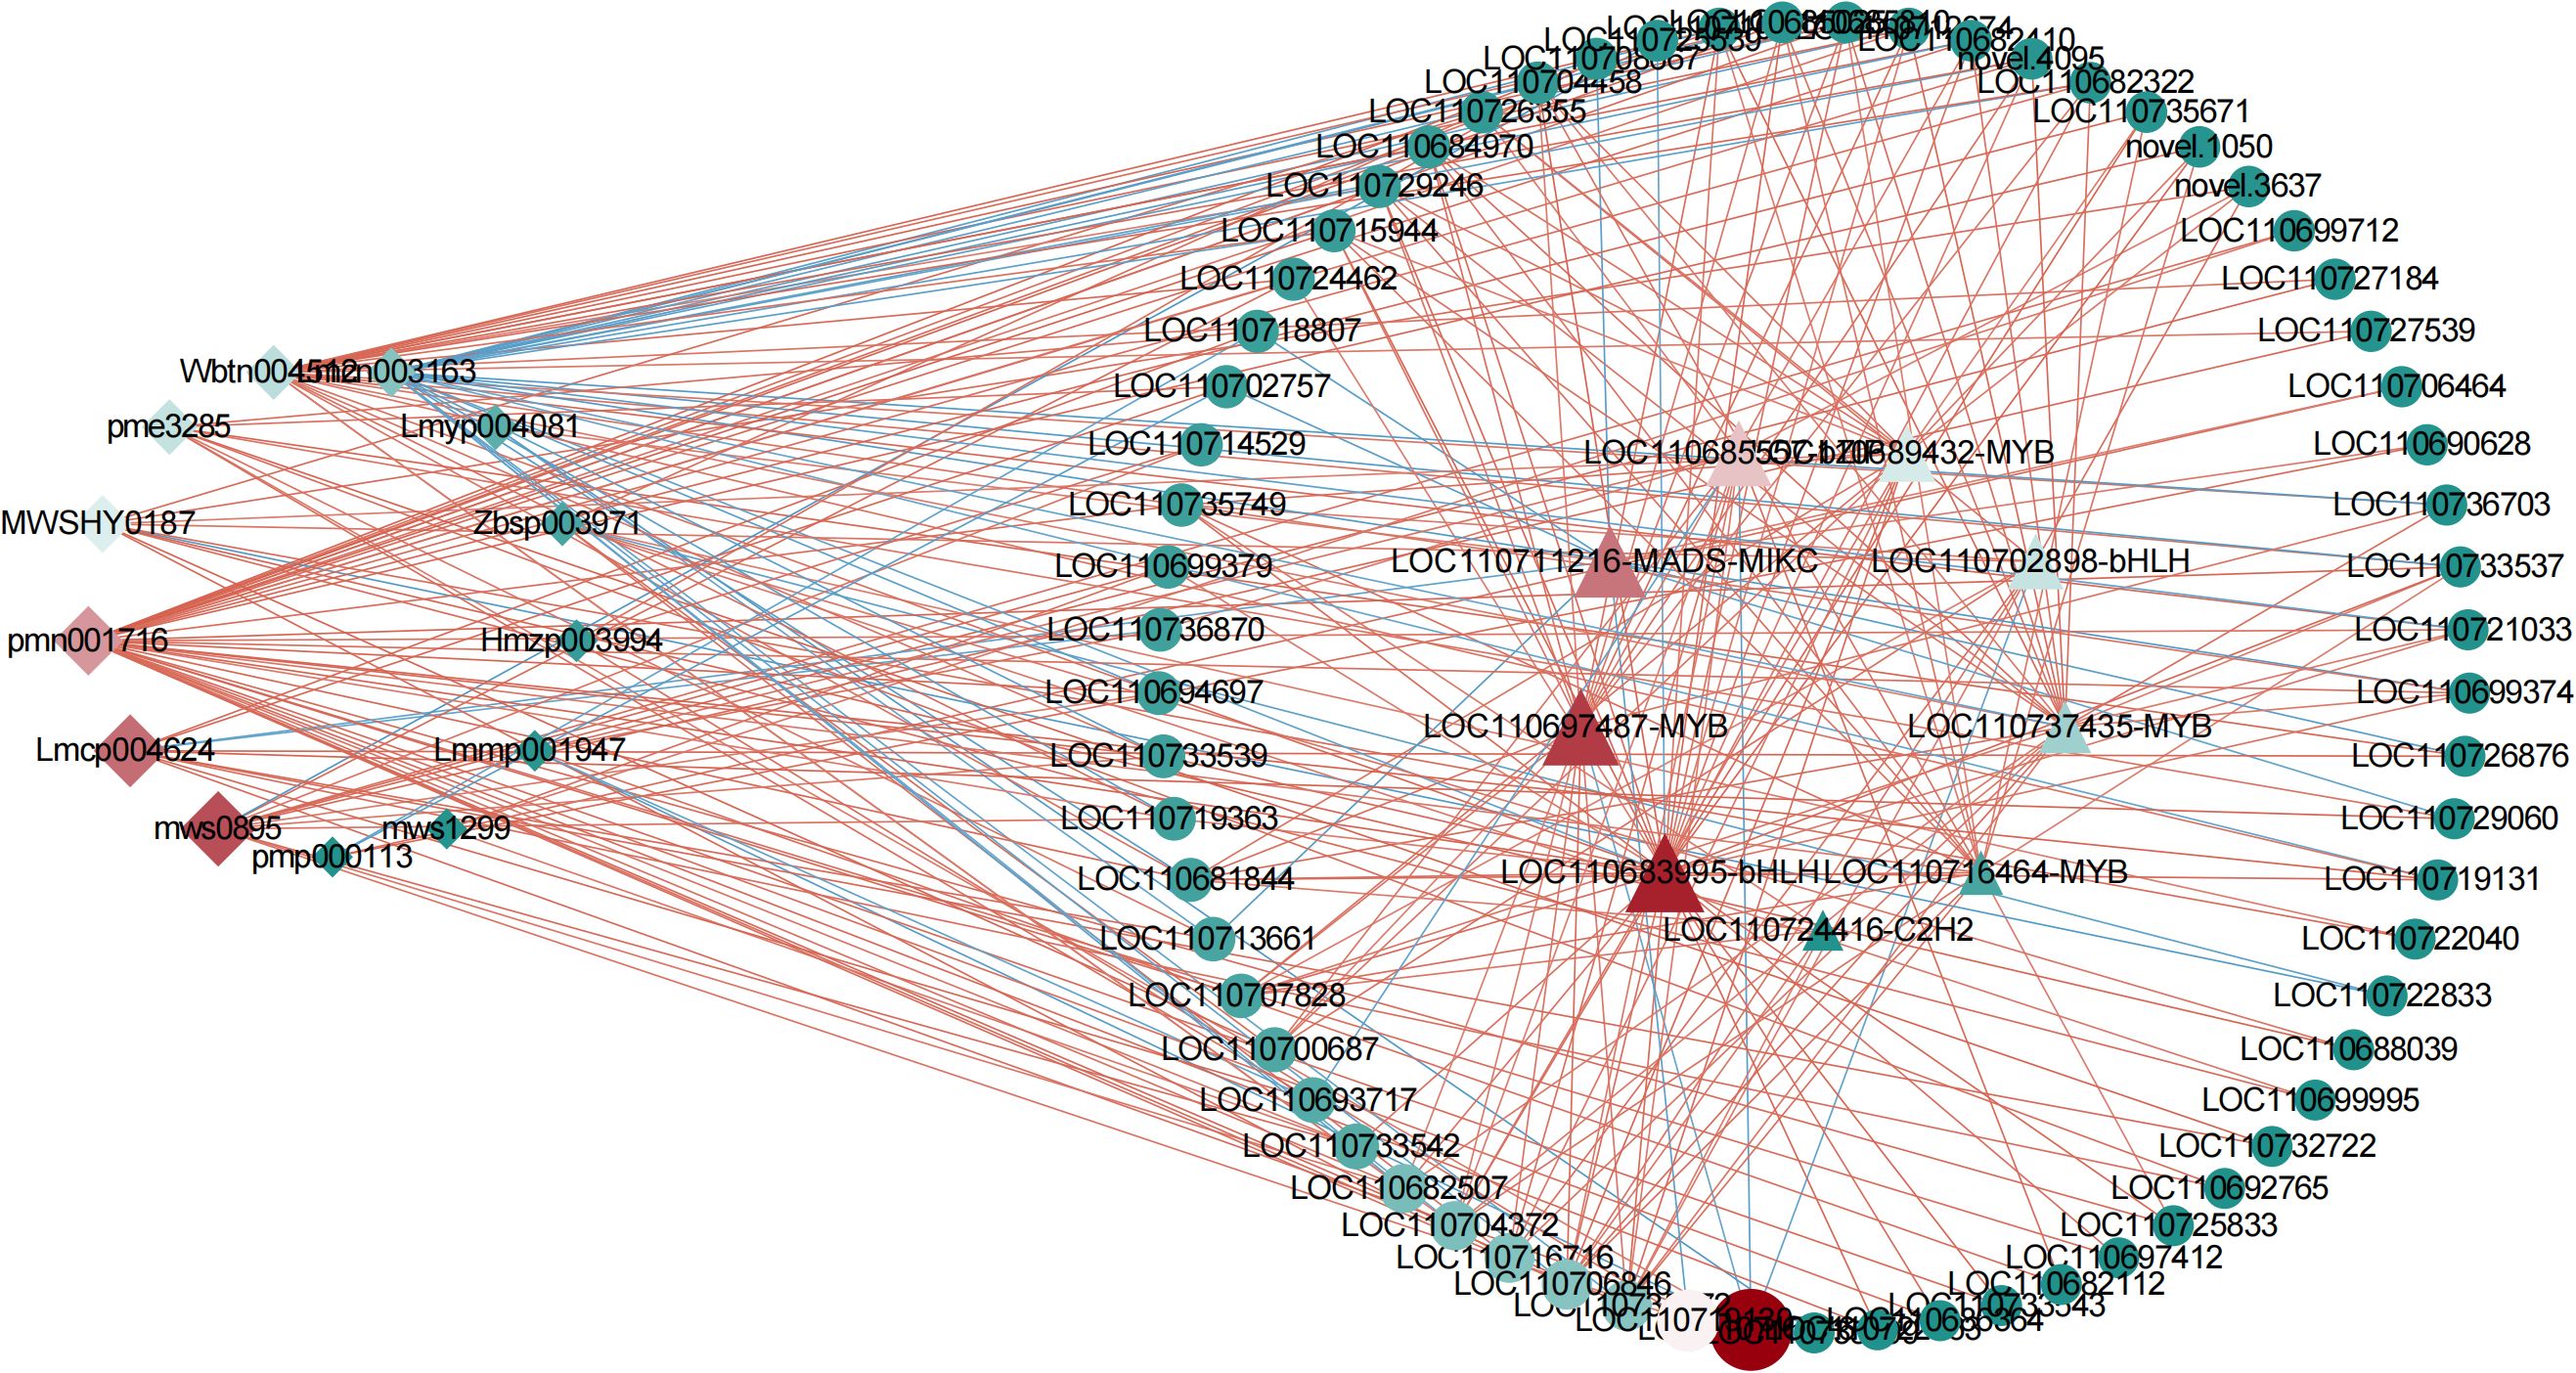
Figure 5. Network interaction diagram. Red lines indicate positive correlation and green is negative correlation. Shapes denote different components: diamond (metabolites), circle (structural genes), triangle (transcription factors). The size of each shape is proportional to the strength of correlation coefficients.
4 Discussion
Flavonoids have been shown to have the ability to scavenge reactive oxygen species and reduce the production of free radicals and free radicals, and have a positive effect on the removal of harmful substances produced under abiotic stresses (Dong et al., 2020; Li et al., 2021; Liu et al., 2021; Xing et al., 2021). In this experiment, the content of flavonoids in TR treatment was significantly higher than that in C1, and recovery occurred after 7 days of drainage. Perhaps due to the decrease in ROS levels after recovery treatment, the total flavonoid content also decreased accordingly. Studies have demonstrated that transgenic Arabidopsis overexpressing AcCHI (chalcone isomerase) exhibited significantly elevated flavonoid content. Compared to wild-type plants, the transgenic lines showed greater biomass, reduced H2O2 accumulation, and lower relative plasma membrane permeability under salt or osmotic stress conditions, indicating that flavonoids participate in plant abiotic stress responses through ROS scavenging (Feng et al., 2023). In the present study, three CHI genes were upregulated under flooding stress, and total flavonoid content in stressed plants was significantly higher than in the C1 control group. This suggests that the upregulation of CHI genes likely enhances flavonoid biosynthesis, thereby improving ROS scavenging capacity in quinoa. Notably, overexpression of EbbHLH80 in tobacco increased flavonoid accumulation, resulting in significantly lower ROS levels and enhanced antioxidant enzyme activity compared to wild-type plants (Gao et al., 2023). Therefore, we hypothesize that under flooding stress, flavonoids in quinoa mitigate oxidative damage through dual mechanisms: direct ROS neutralization and indirect upregulation of antioxidant enzyme activity.
Flavonoid metabolites were determined in leaves of quinoa during the filling stage under soil flooding stress using UPLC-MS/MS. A large number of differential metabolites of flavonoids were detected in all treatments, and these differential metabolites were dominated by flavonoids and flavonols. This suggests that flavonoids and flavonols are key elements for quinoa to cope with flooding stress. Meanwhile, the results of SINGHP et al. confirmed that flavonols are effective in increasing plant tolerance to a wide range of abiotic stresses (Singh et al., 2021), which validates the results of the present experiment. Previous studies have demonstrated that Isotamarixin enhances the antioxidant activity of Coreopsis under low-nitrogen conditions (Li et al., 2023). In this study, Isotamarixin consistently ranked among the top three metabolites with the highest fold changes across all three comparative groups, suggesting its potential role in augmenting antioxidant activity and serving as a key mediator in quinoa’s adaptation to flooding stress. Han et al. found that dark-colored quinoa grains contained higher levels of flavonoids than light-colored grains (Han et al., 2019), and Liu et al. found that flavonoids were higher in black and red quinoa than in yellow and white quinoa (Liu et al., 2022b). Quinoa grains are its main edible part, and this study did not investigate the accumulation mechanism of flavonoids in quinoa grains during the filling stage under flooding stress. Subsequent research can fill this gap. Iwashina and Pietta et al. showed that the flavonoid synthesis pathway is involved in stress regulation in plants and that flavonoids can reduce plant damage such as flooding stress, cold stress, and pest feeding, which again validates the role of flavonoids in quinoa under flooding stress in this paper (Pietta, 2000; Iwashina, 2003).
By comparing the differences in flavonoid biosynthesis in quinoa leaves during the filling stage under flooding stress, recovery treatment and normal control conditions, we constructed a map of flavonoid biosynthesis mechanisms. A total of 9 enzymes and 18 metabolites regulated by 30 genes were found to play key roles in response to flooding stress. Studies have shown that chalcone synthase (CHS) has an important influence and key role in plant flavonoid biosynthesis (Anguraj et al., 2018). In citrus, flavonoid biosynthesis is strongly correlated with the expression level of CHS (Wang et al., 2018); in Poncirus trifoliata, the total flavonoid content of leaves is significantly and positively correlated with CHS (Liu et al., 2022c); and, altering the expression level of EaCHS1 in tobacco affects the accumulation of flavonoids (Lijuan et al., 2015); and, the various expression modes of CHS genes are closely related to the synthesis of different classes of flavonoids (Li et al., 2016). In this experiment, p-coumaroyl-CoA formed phloretin and naringenin chalcone catalyzed by CHS; in C1 vs TR, the expression of CHS showed a positive correlation with the accumulation of naringenin chalcone and phloretin, especially phloretin accumulation was significantly increased, suggesting that CHS plays a key role in the synthesis of phloretin; in TR vs R, down-regulation of some CHS genes led to a decrease in the accumulation of flavonoids in R, suggesting that different CHS genes contribute differently to flavonoid accumulation (Zhou et al., 2013), which is by the results of a previous study. Overexpression of OsCHI2 (chalcone isomerase 2) from drought-tolerant rice cultivars in drought-sensitive varieties was found to not only regulate flavonoid metabolism but also enhance adaptability to diverse abiotic stresses beyond heat stress (Jayaraman et al., 2021). In the C1 vs TR comparison, three CHI genes were upregulated, whereas all three genes showed downregulation in TR vs R. We hypothesize that these genes positively regulate quinoa’s flooding resistance, which could be further validated through overexpression assays in Arabidopsis thaliana. Furthermore, three FLS (flavonol synthase)-encoding genes exhibited upregulated expression under flooding stress, correlating positively with total flavonoid content. This observation not only highlights the role of FLS genes in flooding adaptation but also suggests that their upregulation likely drives increased flavonoid accumulation. Notably, heterologous overexpression of DoFLS1, a flavonol synthase gene isolated from Dendrobium officinale, in Arabidopsis resulted in a 1.24-fold increase in flavonol content (Yu et al., 2021), a finding consistent with our hypothesis. While this study has not yet conducted functional validation of these genes, future investigations targeting their mechanistic roles could address current research gaps. Quercetin is a flavonoid synthesized via the phenylpropane metabolic pathway, which has excellent antioxidant capacity and significantly enhances plant tolerance to a wide range of abiotic stresses (Singh et al., 2021). In this experiment, the accumulation of dihydroquercetin was significantly up-regulated in C2 vs R, whereas the change was not significant in TR vs R. It is hypothesized that soil drainage did not improve plant performance, but instead may have exacerbated oxidative stress and accelerated plant damage (Hossain et al., 2009; Zhang et al., 2023), resulting in the maintenance of a still high accumulation of dihydroquercetin in R. Numerous studies have shown that differential genes and metabolites are enriched in the flavonoid synthesis pathway in plants under flooding stress, which is consistent with the results of this study (Zhang et al., 2017; Hong et al., 2023; Liang et al., 2023; Ren et al., 2017).
Key structural genes for flavonoid synthesis in plants are usually transcriptionally regulated by transcription factors, among which the MYB transcription factor plays an important role. It regulates the expression of enzyme genes during flavonoid biosynthesis and effectively regulates flavonoid accumulation (Payne et al., 2000; Hichri et al., 2011). It was shown that the transcription factor PpMYB17 activates genes for key enzymes in flavonoid biosynthesis and affects the accumulation of flavonoids in pear fruits (Premathilake et al., 2020). Zhou et al. found that the novel R2R3-MYB transcription factor, CmMYB012, can directly regulate the CmFNS to inhibit flavonoid biosynthesis (Zhou et al., 2021). Nakatsuka et al. identified two R2R3-MYB transcription factors from Gentian petals, and after overexpression transgenic Arabidopsis and Tobacco both resulted in increased flavonols in seedlings (Nakatsuka et al., 2012). In this study, a total of two MYB core transcription factors were screened using correlation and network interoperability graph analysis, and it is hypothesized that they play important roles in flavonoid synthesis. MYB6 has been reported to activate F3H and FLS1 expression and promote flavonol accumulation in buckwheat and tobacco plants (Yao et al., 2020). This study identified 6 genes encoding F3H and FLS that exhibited upregulated expression under flooding stress. We hypothesize that these genes may be regulated by the MYB transcription factor family. Future studies could perform transcription factor target gene screening assays on the two core MYB transcription factors identified in this experiment to validate their potential regulatory roles over these 6 candidate genes. Additionally, functional validation of these MYB transcription factors will provide critical insights into the molecular mechanisms underlying quinoa’s adaptation to flooding stress. It has been shown that MYB12 can interact with bHLH3 and bHLH33 to play an important role in proanthocyanidin synthesis (Wang et al., 2017). In our study, a key transcription factor of the bHLH family LOC110683995(bHLH) with a very high Betweenness value was also screened, and we hypothesized that this transcription factor might interact with the MYB family genes to co-regulate flavonoid metabolite synthesis. A key transcription factor of the MADS-MIKC and bZIP families was also identified through network interaction mapping, and studies have shown that differential expression of the bZIP family and MADS-MIKC family genes affects flavonoid accumulation (Kim et al., 2023; Zhang et al., 2024). These transcription factors may play an important role in the changes of flavonoid content, which is a key factor in response to flooding stress through flavonoids in quinoa during the grouting period, and need to be further verified in the future to see if they are related to flavonoid biosynthesis.
In summary, quinoa leaves synthesize excess reactive oxygen species under flooding stress during the grouting period, causing oxidative damage and cellular destruction and affecting plant growth (Hernandez et al., 2009). In response to the adverse effects of flooding stress on growth and development, quinoa has evolved a complex signaling network to sense environmental changes and initiate defense responses through transcriptional and metabolic regulation, which is manifested by elevating the activity of antioxidant enzymes and increasing the accumulation of cellular osmotic substances as well as flavonoids, thus effectively resisting flooding stress. Reactive oxygen species, as a signaling molecule for plant defense against abiotic stress, binds to stress-responsive transcription factors under stress, prompting the expression of relevant stress-responsive genes, which in turn promotes the synthesis and accumulation of relevant secondary metabolites. Flavonoids, the largest class of phenolic compounds, are important secondary metabolites in plants, capable of inhibiting the production of reactive oxygen species under stress conditions and possessing significant antioxidant functions (Agati et al., 2012). They play a key role in the response of quinoa leaves to flooding stress during the filling stage.
5 Conclusion
In this study, we used a combined transcriptome and metabolome analysis to investigate in depth the differences in the mechanism of flavonoid synthesis in leaves of quinoa during the filling stage under flooding and restoration treatments. A total of 433 flavonoid metabolites were detected in the leaves of quinoa during the filling stage under both flooded and drained treatments, and the regulation of their biosynthesis was mainly focused on two biosynthetic pathways, namely flavonoids as well as flavonoids and flavonols. Integrated multi-omics analysis identified multiple genes and metabolites responsive to flooding stress. Five core transcription factors, two core structural genes and four key metabolites were identified by network interactions mapping. This study elucidates the role of flavonoids in quinoa’s response to flooding stress, providing a robust theoretical foundation for breeding flooding-tolerant quinoa varieties. Subsequent studies could employ transgenic and gene editing technologies to validate the functions of these candidate genes under flooding stress.
Data availability statement
The datasets presented in this study can be found in onlinerepositories. This data can be found in the National Center for Biotechnology Information (NCBI) SRA database, with the bioproject accession number PRJNA1039692.
Author contributions
GJ: Methodology, Writing – original draft. XW: Conceptualization, Writing – review & editing. QJ: Formal Analysis, Methodology, Writing – review & editing. YB: Data curation, Visualization, Writing – review & editing. LZ: Data curation, Visualization, Writing – review & editing. PZ: Data curation, Investigation, Writing – review & editing. JL: Data curation, Investigation, Writing – review & editing. LL: Methodology, Visualization, Writing – review & editing. HL: Methodology, Visualization, Writing – review & editing. LH: Formal Analysis, Investigation, Writing – review & editing. SZ: Formal Analysis, Investigation, Writing – review & editing. PQ: Funding acquisition, Project administration, Supervision, Writing – review & editing.
Funding
The author(s) declare that financial support was received for the research and/or publication of this article. We gratefully acknowledge the financial support of the Yunnan Academician Workstation (202405AF140012) and the”Xingdian Talent” Industry Innovation Talent Program in Yunnan Province (XDYC CYCX-2022-0031).
Acknowledgments
We thank the staff of Wuhan Metware Biotechnology Co., Ltd. (Wuhan, China), for their support during the metabolite data analysis.
Conflict of interest
The authors declare that the research was conducted in the absence of any commercial or financial relationships that could be construed as a potential conflict of interest.
Generative AI statement
The author(s) declare that no Generative AI was used in the creation of this manuscript.
Publisher’s note
All claims expressed in this article are solely those of the authors and do not necessarily represent those of their affiliated organizations, or those of the publisher, the editors and the reviewers. Any product that may be evaluated in this article, or claim that may be made by its manufacturer, is not guaranteed or endorsed by the publisher.
Supplementary material
The Supplementary Material for this article can be found online at: https://www.frontiersin.org/articles/10.3389/fpls.2025.1565697/full#supplementary-material
Supplementary Figure 1 | (A) Plot of PCA scores of flavonoids in each group. (B) Circle plot of flavonoid metabolite secondary classification occupancy, the length of the column represents the relative content value of the substance. (C) Heat map of flavonoid metabolite clustering.
Supplementary Figure 2 | (A) PCA plot of samples that are clustered based on gene expression levels. (B) Clustering heat map of genes related to flavonoid synthesis.
Supplementary Figure 3 | (A) Ko00940 pathway CCA map. (B) Ko00941 pathway CCA map. (C) Ko00944 pathway CCA map. (D) O2PLS model loading value map. Omic1:transcriptomics,omic2:metabolomics.
Supplementary Figure 4 | Real-time fluorescence quantitative PCR plot. The y-axis represents the RT-qPCR relative quantification results (2^-ΔΔCt) and the normalized fold changes (log2(treatment/control)) of transcriptomic FPKM values.
Supplementary Table 1 | Specific primer pairs for selected genes.
Supplementary Table 2 | Phenotypic changes in quinoa at filling stage under various treatments.
Supplementary Table 3 | All flavonoids statistical table.
Supplementary Table 4 | Flavonoid differential metabolites in C1 vs TR.
Supplementary Table 5 | Flavonoid differential metabolites in C2 vs R.
Supplementary Table 6 | Flavonoid differential metabolites in TR vs R.
Supplementary Table 7 | Statistical table of Wayne analysis of flavonoids in each group.
Supplementary Table 8 | Core transcription factor list.
Abbreviations
UPLC-MS, Ultra-performance liquid chromatography-mass spectrometry; FPKM, Fragments Per Kilobase of exon model per Million mapped fragments; VIP, Variable Importance in Projection; KEGG, Kyoto Encyclopedia of Genes and Genomes; GO Gene Ontology; KOG Karyotic Orthologous Groups; CCA, Canonical correlation analysis; ROS, Reactive oxygen species.
References
Abderrahim, F., Huanatico, E., Segura, R., Arribas, S., Gonzalez, M. C., and Condezo-Hoyos, L. (2015). Physical features, phenolic compounds, betalains and total antioxidant capacity of coloured quinoa seeds (Chenopodium quinoa Willd.) from Peruvian Altiplano. Food Chem. 183, 83–90. doi: 10.1016/j.foodchem.2015.03.029
Agati, G., Azzarello, E., Pollastri, S., and Tattini, M. (2012). Flavonoids as antioxidants in plants: Location and functional significance. Plant Sci. 196, 67–76. doi: 10.1016/j.plantsci.2012.07.014
Angeli, V., Miguel, S. P., Crispim, M. D., Khan, M. W., Hamar, A., Khajehei, F., et al. (2020). Quinoa (Chenopodium quinoa willd.): an overview of the potentials of the “Golden grain” and socio-economic and environmental aspects of its cultivation and marketization. Foods 9, 216. doi: 10.3390/foods9020216
Anguraj, V. A., Krysiak, K., Tian, G., and Dhaubhadel, S. (2018). Genome-wide identification and localization of chalcone synthase family in soybean (Glycine max [L]Merr). BMC Plant Biol. 18, 325. doi: 10.1186/s12870-018-1569-x
Bouhaddani, S. E., Houwing-Duistermaat, J., Salo, P., Perola, M., Jongbloed, G., and Uh, H. W. (2016). Evaluation of O2PLS in Omics data integration. BMC Bioinform. 17 Suppl 2, 11. doi: 10.1186/s12859-015-0854-z
Cao, Y., Zou, L., Li, W., Song, Y., Zhao, G., and Hu, Y. (2020). Dietary quinoa (Chenopodium quinoa Willd.) polysaccharides ameliorate high-fat diet-induced hyperlipidemia and modulate gut microbiota. Int. J. Biol. Macromol. 163, 55–65. doi: 10.1016/j.ijbiomac.2020.06.241
Chen, G., Li, D., Yao, P., Chen, F., Yuan, J., Ma, B., et al. (2024). Metabolic and transcriptional analysis reveals flavonoid involvement in the drought stress response of mulberry leaves. Int. J. Mol. Sci. 25 (13), 7417. doi: 10.3390/ijms25137417
Chen, Y., Zhang, R., Song, Y., He, J., Sun, J., Bai, J., et al. (2009). RRLC-MS/MS-based metabonomics combined with in-depth analysis of metabolic correlation network: finding potential biomarkers for breast cancer. Analyst 134, 2003–2011. doi: 10.1039/b907243h
Chong, J. and Xia, J. (2018). MetaboAnalystR: an R package for flexible and reproducible analysis of metabolomics data. Bioinformatics 34, 4313–4314. doi: 10.1093/bioinformatics/bty528
Daliri, H., Ahmadi, R., Pezeshki, A., Hamishehkar, H., Mohammadi, M., Beyrami, H., et al. (2021). Quinoa bioactive protein hydrolysate produced by pancreatin enzyme-functional and antioxidant properties. Lwt 150, 111853. doi: 10.1016/j.lwt.2021.111853
Dong, N. Q., Sun, Y., Guo, T., Shi, C. L., Zhang, Y. M., Kan, Y., et al. (2020). UDP-glucosyltransferase regulates grain size and abiotic stress tolerance associated with metabolic flux redirection in rice. Nat. Commun. 11, 2629. doi: 10.1038/s41467-020-16403-5
Eriksson, L., Johansson, E., Antti, H., and Holmes, E. (2005). “Multi-and megavariate data analysis: finding and using regularities in metabonomics data,” in Metabolomics in Toxicity Assessment (Taylor & Francis Group, Boca Raton), 263–335.
Feng, S., Yao, Y. T., Wang, B. B., Li, Y. M., Li, L., and Bao, A. K. (2023). Flavonoids are involved in salt tolerance through ROS scavenging in the halophyte Atriplex canescens. Plant Cell Rep. 43, 5. doi: 10.1007/s00299-023-03087-6
Fraga, C. G., Clowers, B. H., Moore, R. J., and Zink, E. M. (2010). Signature-discovery approach for sample matching of a nerve-agent precursor using liquid chromatography–mass spectrometry, XCMS, and chemometrics. Anal. Chem. 82, 4165–4173. doi: 10.1021/ac1003568
Gao, Q., Li, X., Xiang, C., Li, R., Xie, H., Liu, J., et al. (2023). EbbHLH80 enhances salt responses by up-regulating flavonoid accumulation and modulating ROS levels. Int. J. Mol. Sci. 24. doi: 10.3390/ijms241311080
García-Parra, M., Zurita-Silva, A., Stechauner-Rohringer, R., Roa-Acosta, D., and Jacobsen, S. E. (2020). Quinoa (Chenopodium quinoa Willd.) and its relationship with agroclimatic characteristics: A Colombian perspective. Chil. J. Agric. Res. 80, 290–302. doi: 10.4067/S0718-58392020000200290
Guo, Y., Wang, Q., Xie, H., Zhang, X., Huang, T., Zhang, P., et al. (2024). Analysis of root response mechanism of quinoa seedlings to waterlogging stress based on metabolome. J. Plant Growth Regul. 43, 2251–2264. doi: 10.1007/s00344-024-11260-8
Han, Y., Chi, J., Zhang, M., Zhang, R., Fan, S., Huang, F., et al. (2019). Characterization of saponins and phenolic compounds: antioxidant activity and inhibitory effects on alpha-glucosidase in different varieties of colored quinoa (Chenopodium quinoa Willd). Biosci. Biotechnol. Biochem. 83, 2128–2139. doi: 10.1080/09168451.2019.1638756
Han, Z., Zheng, Y., Zhang, X., Wang, B., Guo, Y., and Guan, Z. (2024). Flavonoid metabolism plays an important role in response to lead stress in maize at seedling stage. BMC Plant Biol. 24, 726. doi: 10.1186/s12870-024-05455-0
Hernandez, I., Alegre, L., Van Breusegem, F., and Munne-Bosch, S. (2009). How relevant are flavonoids as antioxidants in plants? Trends Plant Sci. 14, 125–132. doi: 10.1016/j.tplants.2008.12.003
Hichri, I., Barrieu, F., Bogs, J., Kappel, C., Delrot, S., and Lauvergeat, V. (2011). Recent advances in the transcriptional regulation of the flavonoid biosynthetic pathway. J. Exp. Bot. 62, 2465–2483. doi: 10.1093/jxb/erq442
Hong, B., Zhou, B., Peng, Z., Yao, M., Wu, J., Wu, X., et al. (2023). Tissue-specific transcriptome and metabolome analysis reveals the response mechanism of Brassica napus to waterlogging stress. Int. J. Mol. Sci. 24. doi: 10.3390/ijms24076015
Hossain, Z., Lopez-Climent, M. F., Arbona, V., Perez-Clemente, R. M., and Gomez-Cadenas, A. (2009). Modulation of the antioxidant system in Citrus under waterlogging and subsequent drainage. J. Plant Physiol. 166, 1391–1404. doi: 10.1016/j.jplph.2009.02.012
Iwashina, T. (2003). Flavonoid function and activity to plants and other organisms. Biol. Sci. Space 17, 24–44. doi: 10.2187/bss.17.24
Jayaraman, K., Sevanthi, A. M., Sivakumar, S. R., Viswanathan, C., Mohapatra, T., and Mandal, P. K. (2021). Stress-inducible expression of chalcone isomerase2 gene improves accumulation of flavonoids and imparts enhanced abiotic stress tolerance to rice. Environ. Exp. Bot. 190, 104582. doi: 10.1016/j.envexpbot.2021.104582
Jiang, L., Yang, X., Gao, X., Yang, H., Ma, S., Huang, S., et al. (2024). Multiomics analyses reveal the dual role of flavonoids in pigmentation and abiotic stress tolerance of soybean seeds. J. Agric. Food. Chem. 72, 3231–3243. doi: 10.1021/acs.jafc.3c08202
Jin, J., Zhang, H., Kong, L., Gao, G., and Luo, J. (2014). PlantTFDB 3.0: a portal for the functional and evolutionary study of plant transcription factors. Nucleic. Acids Res. 42, D1182–D1187. doi: 10.1093/nar/gkt1016
Kim, B., Shim, S., Zhang, H., Lee, C., Jang, S., Jin, Z., et al. (2023). Dynamic transcriptome changes driven by the mutation of OsCOP1 underlie flavonoid biosynthesis and embryogenesis in the developing rice seed. J. Plant Growth Regul. 42, 4436–4452. doi: 10.1007/s00344-023-10909-0
Kogenaru, S., Qing, Y., Guo, Y., and Wang, N. (2012). RNA-seq and microarray complement each other in transcriptome profiling. BMC Genomics 13, 629. doi: 10.1186/1471-2164-13-629
Lamothe, L. M., Srichuwong, S., Reuhs, B. L., and Hamaker, B. R. (2015). Quinoa (Chenopodium quinoa W.) and amaranth (Amaranthus caudatus L.) provide dietary fibres high in pectic substances and xyloglucans. Food Chem. 167, 490–496. doi: 10.1016/j.foodchem.2014.07.022
Li, B., Fan, R., Sun, G., Sun, T., Fan, Y., Bai, S., et al. (2021). Flavonoids improve drought tolerance of maize seedlings by regulating the homeostasis of reactive oxygen species. Plant Soil 461, 389–405. doi: 10.1007/s11104-020-04814-8
Li, J., Han, J., Hu, Y., and Yang, J. (2016). Selection of Reference Genes for Quantitative Real-Time PCR during Flower Development in Tree Peony (Paeonia suffruticosa Andr.). Front. Plant Sci. 7. doi: 10.3389/fpls.2016.00516
Li, Z., Jiang, H., Jiang, X., Zhang, L., and Qin, Y. (2023). Integrated physiological, transcriptomic, and metabolomic analyses reveal that low-nitrogen conditions improve the accumulation of flavonoids in snow chrysanthemum. Ind. Crops Prod. 197, 116574. doi: 10.1016/j.indcrop.2023.116574
Liang, Q., Dun, B., Li, L., Ma, X., Zhang, H., Su, Y., et al. (2023). Metabolomic and transcriptomic responses of Adiantum (Adiantum nelumboides) leaves under drought, half-waterlogging, and rewater conditions. Front. Genet. 14. doi: 10.3389/fgene.2023.1113470
Lijuan, C., Huiming, G., Yi, L., and Hongmei, C. (2015). Chalcone synthase EaCHS1 from Eupatorium adenophorum functions in salt stress tolerance in tobacco. Plant Cell Rep. 34, 885–894. doi: 10.1007/s00299-015-1751-7
Liu, H., Liu, S., Wang, H., Chen, K., and Zhang, P. (2022a). The flavonoid 3’-hydroxylase gene from the Antarctic moss Pohlia nutans is involved in regulating oxidative and salt stress tolerance. Biotechnol. Appl. Biochem. 69, 676–686. doi: 10.1002/bab.2143
Liu, W., Feng, Y., Yu, S., Fan, Z., Li, X., Li, J., et al. (2021). The flavonoid biosynthesis network in plants. Int. J. Mol. Sci. 22. doi: 10.3390/ijms222312824
Liu, Y., Liu, J., Kong, Z., Huan, X., Li, L., Zhang, P., et al. (2022b). Transcriptomics and metabolomics analyses of the mechanism of flavonoid synthesis in seeds of differently colored quinoa strains. Genomics 114, 138–148. doi: 10.1016/j.ygeno.2021.11.030
Liu, Z., Cheng, S., Liu, X. Q., Kuca, K., Hashem, A., Al-Arjani, A. F., et al. (2022c). Cloning of a CHS gene of Poncirus trifoliata and its expression in response to soil water deficit and arbuscular mycorrhizal fungi. Front. Plant Sci. 13. doi: 10.3389/fpls.2022.1101212
Livak, K. J. and Schmittgen, T. D. (2001). Analysis of relative gene expression data using real-time quantitative PCR and the 2(-Delta Delta C(T)) Method. Methods 25, 402–408. doi: 10.1006/meth.2001.1262
Loreti, E., van Veen, H., and Perata, P. (2016). Plant responses to flooding stress. Curr. Opin. Plant Biol. 33, 64–71. doi: 10.1016/j.pbi.2016.06.005
Luan, H., Guo, B., Pan, Y., Lv, C., Shen, H., and Xu, R. (2018). Morpho-anatomical and physiological responses to waterlogging stress in different barley (Hordeum vulgare L.) genotypes. Plant Growth Regul. 85, 399–409. doi: 10.1007/s10725-018-0401-9
Meng, D., Dong, B., Niu, L., Song, Z., Wang, L., Amin, R., et al. (2021). The pigeon pea CcCIPK14-CcCBL1 pair positively modulates drought tolerance by enhancing flavonoid biosynthesis. Plant J. 106, 1278–1297. doi: 10.1111/tpj.15234
Mudgil, P., Kilari, B. P., Kamal, H., Olalere, O. A., FitzGerald, R. J., Gan, C. Y., et al. (2020). Multifunctional bioactive peptides derived from quinoa protein hydrolysates: Inhibition of α-glucosidase, dipeptidyl peptidase-IV and angiotensin I converting enzymes. J. Cereal Sci. 96, 103130. doi: 10.1016/j.jcs.2020.103130
Nakabayashi, R., Yonekura-Sakakibara, K., Urano, K., Suzuki, M., Yamada, Y., Nishizawa, T., et al. (2014). Enhancement of oxidative and drought tolerance in Arabidopsis by overaccumulation of antioxidant flavonoids. Plant J. 77, 367–379. doi: 10.1111/tpj.12388
Nakatsuka, T., Saito, M., Yamada, E., Fujita, K., Kakizaki, Y., and Nishihara, M. (2012). Isolation and characterization of GtMYBP3 and GtMYBP4, orthologues of R2R3-MYB transcription factors that regulate early flavonoid biosynthesis, in gentian flowers. J. Exp. Bot. 63, 6505–6517. doi: 10.1093/jxb/ers306
Payne, C. T., Zhang, F., and Lloyd, A. M. (2000). GL3 encodes a bHLH protein that regulates trichome development in arabidopsis through interaction with GL1 and TTG1. Genetics 156, 1349–1362. doi: 10.1093/genetics/156.3.1349
Perez-Rodriguez, P., Riano-Pachon, D. M., Correa, L. G., Rensing, S. A., Kersten, B., and Mueller-Roeber, B. (2010). PlnTFDB: updated content and new features of the plant transcription factor database. Nucleic. Acids Res. 38, D822–D827. doi: 10.1093/nar/gkp805
Pietta, P. G. (2000). Flavonoids as antioxidants. J. Nat. Prod. 63, 1035–1042. doi: 10.1021/np9904509
Premathilake, A. T., Ni, J., Bai, S., Tao, R., Ahmad, M., and Teng, Y. (2020). R2R3-MYB transcription factor PpMYB17 positively regulates flavonoid biosynthesis in pear fruit. Planta 252, 59. doi: 10.1007/s00425-020-03473-4
Ren, C. G., Kong, C. C., Yan, K., Zhang, H., Luo, Y. M., and Xie, Z. H. (2017). Elucidation of the molecular responses to waterlogging in Sesbania cannabina roots by transcriptome profiling. Sci. Rep. 7, 9256. doi: 10.1038/s41598-017-07740-5
Singh, P., Arif, Y., Bajguz, A., and Hayat, S. (2021). The role of quercetin in plants. Plant Physiol. Biochem. 166, 10–19. doi: 10.1016/j.plaphy.2021.05.023
Tang, Y., Li, X., Zhang, B., Chen, P. X., Liu, R., and Tsao, R. (2015). Characterisation of phenolics, betanins and antioxidant activities in seeds of three Chenopodium quinoa Willd. genotypes. Food Chem. 166, 380–388. doi: 10.1016/j.foodchem.2014.06.018
Teng, Z., Chen, Y., Meng, S., Duan, M., Zhang, J., and Ye, N. (2023). Environmental stimuli: A major challenge during grain filling in cereals. Int. J. Mol. Sci. 24, 2255. doi: 10.3390/ijms24032255
Thevenot, E. A., Roux, A., Xu, Y., Ezan, E., and Junot, C. (2015). Analysis of the human adult urinary metabolome variations with age, body mass index, and gender by implementing a comprehensive workflow for univariate and OPLS statistical analyses. J. Proteome Res. 14, 3322–3335. doi: 10.1021/acs.jproteome.5b00354
Vilcacundo, R. and Hernández-Ledesma, B. (2017). Nutritional and biological value of quinoa (Chenopodium quinoa Willd.). Curr. Opin. Food Sci. 14, 1–6. doi: 10.1016/j.cofs.2016.11.007
Wang, X., Huang, M., Zhou, Q., Cai, J., Dai, T., Cao, W., et al. (2016). Physiological and proteomic mechanisms of waterlogging priming improves tolerance to waterlogging stress in wheat (Triticum aestivum L.). Environ. Exp. Bot. 132, 175–182. doi: 10.1016/j.envexpbot.2016.09.003
Wang, B. and LinHo (2002). Rainy season of the Asian–Pacific summer monsoon. J. Climate. 15, 386–398. doi: 10.1175/1520-0442(2002)015<0386:RSOTAP>2.0.CO;2
Wang, N., Xu, H., Jiang, S., Zhang, Z., Lu, N., Qiu, H., et al. (2017). MYB12 and MYB22 play essential roles in proanthocyanidin and flavonol synthesis in red-fleshed apple (Malus sieversii f. niedzwetzkyana). Plant J. 90, 276–292. doi: 10.1111/tpj.13487
Wang, Z., Yu, Q., Shen, W., El Mohtar, C. A., Zhao, X., and Gmitter, F. G. (2018). Functional study of CHS gene family members in citrus revealed a novel CHS gene affecting the production of flavonoids. BMC Plant Biol. 18, 1–13. doi: 10.1186/s12870-018-1418-y
Winkel-Shirley, B. (2001a). Flavonoid biosynthesis. A colorful model for genetics, biochemistry, cell biology, and biotechnology. Plant Physiol. 126, 485–493. doi: 10.1104/pp.126.2.485
Winkel-Shirley, B. (2001b). It takes a garden. How work on diverse plant species has contributed to an understanding of flavonoid metabolism. Plant Physiol. 127, 1399–1404. doi: 10.2307/4280205
Xing, G., Li, J., Li, W., Lam, S. M., Yuan, H., Shui, G., et al. (2021). AP2/ERF and R2R3-MYB family transcription factors: potential associations between temperature stress and lipid metabolism in Auxenochlorella protothecoides. Biotechnol. Biofuels 14, 22. doi: 10.1186/s13068-021-01881-6
Yao, P., Huang, Y., Dong, Q., Wan, M., Wang, A., Chen, Y., et al. (2020). FtMYB6, a light-induced SG7 R2R3-MYB transcription factor, promotes flavonol biosynthesis in Tartary buckwheat (Fagopyrum tataricum). J. Agric. Food. Chem. 68, 13685–13696. doi: 10.1021/acs.jafc.0c03037
Yu, Z., Dong, W., Teixeira, D. S. J., He, C., Si, C., and Duan, J. (2021). Ectopic expression of DoFLS1 from Dendrobium officinale enhances flavonol accumulation and abiotic stress tolerance in Arabidopsis thaliana. Protoplasma 258, 803–815. doi: 10.1007/s00709-020-01599-6
Zhang, X. M., Duan, S. G., Xia, Y., Li, J. T., Liu, L. X., Tang, M., et al. (2023). Transcriptomic, physiological, and metabolomic response of an alpine plant, rhododendron delavayi, to waterlogging stress and post-waterlogging recovery. Int. J. Mol. Sci. 24. doi: 10.3390/ijms241310509
Zhang, Y., Kong, X., Dai, J., Luo, Z., Li, Z., Lu, H., et al. (2017). Global gene expression in cotton (Gossypium hirsutum L.) leaves to waterlogging stress. PloS One 12, e185075. doi: 10.1371/journal.pone.0185075
Zhang, Z., Xiao, Y., Huang, P., Ji, H., Zhang, X., Zhang, Y., et al. (2024). Integrated metabolomics and transcriptomics analysis to characterize the formation mechanism of purple in Michelia spp. petals. Scientia Hortic. 330, 113047. doi: 10.1016/j.scienta.2024.113047
Zhang, Q., Zheng, G., Wang, Q., Zhu, J., Zhou, Z., Zhou, W., et al. (2022). Molecular mechanisms of flavonoid accumulation in germinating common bean (Phaseolus vulgaris) under salt stress. Front. Nutr. 9. doi: 10.3389/fnut.2022.928805
Zhou, W., Chen, F., Meng, Y., Chandrasekaran, U., Luo, X., Yang, W., et al. (2020). Plant waterlogging/flooding stress responses: From seed germination to maturation. Plant Physiol. Biochem. 148, 228–236. doi: 10.1016/j.plaphy.2020.01.020
Zhou, L. J., Geng, Z., Wang, Y., Wang, Y., Liu, S., Chen, C., et al. (2021). A novel transcription factor CmMYB012 inhibits flavone and anthocyanin biosynthesis in response to high temperatures in chrysanthemum. Hortic. Res. 8, 248. doi: 10.1038/s41438-021-00675-z
Zhou, B., Wang, Y., Zhan, Y., Li, Y., and Kawabata, S. (2013). Chalcone synthase family genes have redundant roles in anthocyanin biosynthesis and in response to blue/UV-A light in turnip (Brassica rapa; Brassicaceae). Am. J. Bot. 100, 2458–2467. doi: 10.3732/ajb.1300305
Keywords: quinoa, flooding stress, flavonoids, metabolome, transcriptome
Citation: Jiang G, Wang X, Jiang Q, Bai Y, Zhang L, Zhang P, Liu J, Li L, Li H, Huang L, Zhang S and Qin P (2025) Mechanisms of flavonoids in quinoa’s response to flooding stress in grain filling stage. Front. Plant Sci. 16:1565697. doi: 10.3389/fpls.2025.1565697
Received: 23 January 2025; Accepted: 27 April 2025;
Published: 21 May 2025.
Edited by:
Mohammad Shah Jahan, Sher-e-Bangla Agricultural University, BangladeshReviewed by:
Zunji Shi, Lanzhou University, ChinaDavid Jarvis, Brigham Young University, United States
Juan Pablo Rodriguez, Julius Kühn-Institut - Braunschweig, Germany
Shen Rao, Wuhan Polytechnic University, China
Copyright © 2025 Jiang, Wang, Jiang, Bai, Zhang, Zhang, Liu, Li, Li, Huang, Zhang and Qin. This is an open-access article distributed under the terms of the Creative Commons Attribution License (CC BY). The use, distribution or reproduction in other forums is permitted, provided the original author(s) and the copyright owner(s) are credited and that the original publication in this journal is cited, in accordance with accepted academic practice. No use, distribution or reproduction is permitted which does not comply with these terms.
*Correspondence: Peng Qin, d2hlYXQtcXVpbm9hQHluYXUuZWR1LmNu
†These authors have contributed equally to this work