 Jiawei Guo1
 Liguo Jia
 Yongqiang Wang
 Mingshou Fan
 Peng Liu
- 1College of Agronomy, Inner Mongolia Agricultural University, Hohhot, China
- 2Yinshanbeilu Grassland Eco-Hydrology National Observation and Research Station, China Institute of Water Resources and Hydropower Research, Beijing, China
- 3Institute of Water Resources for Pastoral Area Ministry of Water Resources, Hohhot, China
- 4Ulanqab City Inspection and Testing Center, Ulanqab, China
Introduction: The North China region is a major potato production area, but water scarcity and poor soil fertility limit potato growth. Biochar is a promising approach to improve soil quality and enhance crop productivity. However, the effects of different biochar pyrolysis temperatures and application rates on potato growth, economic benefits, quality, water and fertilizer use efficiency, and soil nutrient retention remain unclear.
Methods: A field experiment was conducted during 2023–2024 to evaluate the effects of biochar pyrolysis temperatures (T1: 300°C, T2: 500°C, T3: 700°C) and application rates (C1: 10 t ha−1, C2: 20 t ha−1, C3: 30 t ha−1) on comprehensive potato cultivation performance. A multi-level fuzzy comprehensive evaluation (PFCE) model was used to determine the optimal biochar application strategy.
Results: Potato growth indicators, water and fertilizer use efficiency, starch, and vitamin C content exhibited a parabolic trend, with the C2T2 treatment performing best. Net income was highest for the CK treatment in 2023 and for C2T2 in 2024. Reducing sugar content was lowest in C2T2; soil nitrate nitrogen accumulation was lowest in C3T2; soil available phosphorus was lowest in C1T3; and soil available potassium was lowest in CK. PFCE analysis indicated that C2T2 achieved multi-objective optimization for yield, quality, efficiency, and environmental sustainability.
Discussion: Based on PFCE results and practical production considerations, applying biochar at 400–500°C pyrolysis temperature and 18–20 t ha−1 application rate is recommended for North China to maximize comprehensive benefits.
1 Introduction
Globally, potatoes are one of the most essential non-cereal and high-yield horticultural crops, with an annual tuber production reaching 370 million tons (Canton, 2021). Potatoes are a nutritionally rich food and vegetable that play a significant role in providing nutritious food, ensuring food security, and promoting agricultural development. In North China’s arid and semi-arid regions, potatoes are an essential staple crop; however, water scarcity and poor soil fertility are critical factors limiting potato growth and yield (Wu et al., 2022). Local farmers often excessively use irrigation water and fertilizers in pursuit of high potato yields, resulted in decreasing water and nutrient use efficiency and soil structure degradation, ultimately reducing crop yield and quality. Therefore, optimizing agricultural production technologies to improve water and nitrogen use efficiency in North China’s arid and semi-arid regions is crucial for ensuring sustainable farmland utilization and crop production.
Biochar has been evaluated for its role in soil improvement in recent years. Numerous studies conducted through greenhouse experiments, pot trials, or field studies have assessed the effects of biochar on soil properties, plant growth, yield, and quality, while also exploring its potential to enhance economic and environmental benefits (Faloye et al., 2019; Han et al., 2023; Wang et al., 2023). Despite variations in results across different studies, a positive impact of biochar application on agricultural production is generally observed. Research by Jia et al. (2021) indicates that biochar has beneficial effects on improving soil health and increasing water and nutrient use efficiency. This is mainly attributed to its porous structure and high specific surface area, which enhance soil moisture and nutrients retention capacity, and reduce nitrogen leaching losses and ammonia volatilization (Alkharabsheh et al., 2021; Dey et al., 2023). Additionally, hydroxyl and carboxyl groups in biochar increase soil adhesion and cohesion, improving nutrient availability and promoting better plant growth and higher yields (Yu et al., 2019). The application rate of biochar is a crucial factor affecting crop productivity (Abukari et al., 2022; Gao et al., 2021; Singh et al., 2022). Multiple studies have shown that biochar, as a soil amendment, often requires substantial application rates, such as 10 to 50 t ha-1 (Dong et al., 2022; Yan et al., 2022; Medyńska-Juraszek et al., 2021), with some suggested optimal amount as high as 135.2 t ha-1 (Lehmann et al., 2003). However, other research indicates that excessive biochar application (≥20 t ha-1) can inhibit crop growth, reduce soil microbial activity, and hinder nutrient uptake (Gao et al., 2019; Liu et al., 2022). Moreover, the economic feasibility of high biochar application rates for farmers is also an important consideration. Currently, there is limited research on the effects of biochar on potato growth, tuber yield, water and nutrient use efficiency, and quality. For example, Mollick (2018) found that applying 7.5 t ha-1 of biochar can promote potato growth and achieve high yields. Wang et al. (2023) conducted pot experiments that demonstrated that the application of 7% biochar improves soil enzyme activity, increases plant chlorophyll and antioxidant content, ultimately enhancing potato quality and yield. Youssef et al. (2017) studied the effects of applying 5 t ha-1 of biochar under sandy soil conditions, concluding that it can increase net returns from potato production and reduce environmental pollution. It is worth noting that current research mainly focuses on the impact of biochar application rates on potato productivity. However, the effects of biochar’s functions and properties on soil and crops should not be overlooked (Ayaz et al., 2021; Brtnicky et al., 2021). Particularly under varying biochar application rates, the influence of biochar properties on the comprehensive aspects of potato growth, economics, quality, water and nutrient use, and environmental benefits in North China remains to be clarified.
The properties and functions of biochar are determined by its preparation processes and the types of raw materials used. Among these, pyrolysis temperature is one of the main factors influencing biochar properties (Janu et al., 2021; Ippolito et al., 2020; Hassan et al., 2020). The composition and forms of nutrients in biochar change with the variations in pyrolysis temperature (Guo et al., 2021). For instance, the specific surface area, porosity, pH, ash content, and carbon content of biochar increase with rising pyrolysis temperatures. In contrast, the O/C ratio and volatile matter content exhibit the opposite trend (Das et al., 2021). Changes in biochar properties and functions due to different pyrolysis temperatures can directly or indirectly affect crop growth. Li et al. (2019) found that biochar produced at temperatures of 400–500°C is most effective for increasing crop yields, whereas biochar produced at higher temperatures (especially >600°C) can reduce crop yields. Purakayastha et al. (2019) also concluded that exceeding a specific pyrolysis temperature range can diminish a crop’s ability to absorb soil nutrients, leading to reduced yields. However, some studies indicate that biochar produced at high pyrolysis temperatures (550°C and above) can be a desirable soil amendment due to its unique functional groups, which exhibit low toxicity to soil organisms and promote soil health and ecological balance. As a result, high-temperature biochar may improve the growth environment for crops better than low-temperature biochar (Tang et al., 2020). Therefore, to ensure sustainable agricultural practices, it is essential to consider the interactive effects of biochar pyrolysis temperature and application rate on potato growth, economics, quality, water and nutrient use, and environmental benefits. This will help identify the optimal biochar application strategy for potato fields in North China’s arid and semi-arid regions.
Multi-objective comprehensive evaluation methods effectively assess the strengths and weaknesses of various schemes, leading to reliable and reasonable evaluation results (Wang et al., 2019). The Analytic Hierarchy Process (AHP), which combines qualitative and quantitative analysis, is an effective decision-making tool for calculating the weights of evaluation indicators (Panchal and Shrivastava, 2022). However, the weight calculations in AHP are highly dependent on personal judgment, which can be influenced by biases and experiences, resulting in a lack of precision. In contrast, the Entropy Method (EP) minimizes the impact of subjectivity on weights, making the evaluation results more reflective of objective realities (Wang et al., 2021). Nevertheless, EP requires that input data be quantitative and has limited capability for handling qualitative indicators. Combining AHP and EP weighting methods can harness the advantages of both approaches, overcoming the limitations of individual techniques and enhancing the scientific and rational basis for decision-making (Xiao et al., 2021). Fuzzy Comprehensive Evaluation (FCE), based on fuzzy mathematics, transforms qualitative assessments into quantitative evaluations through membership theory. Determining indicator weights is fundamental to its methodology, directly impacting the reasonableness and reliability of evaluation results (Han et al., 2020). Thus, the multi-level fuzzy comprehensive evaluation optimization model (PFCE) framework integrates qualitative and quantitative data to improve evaluation accuracy, yielding broader and more accurate results. Furthermore, existing studies mainly select the best scheme based on evaluation results without further modeling analysis, often leading to inaccuracies (Wang et al., 2023). Therefore, the objectives of this study are: (1) to clarify the interactive effects of biochar pyrolysis temperature and application rate on potato dry matter accumulation, tuber yield, quality, water and nutrient use efficiency, soil nutrient retention and economics, through two years of field trials; (2) to establish a comprehensive evaluation system for the quality, water and nutrient use efficiency, environmental benefits, and economics of potatoes using the multi-level fuzzy comprehensive evaluation model (PFCE); (3) to identify the optimal biochar pyrolysis temperature and application rate for maximizing comprehensive benefits in potato fields in the arid and semi-arid regions of North China.
2 Materials and methods
2.1 Experimental site
Field experiments were conducted from 2023 to 2024 at the Kobuer Experimental Station in Chayouzhongqi, Ulanqab City, Inner Mongolia Autonomous Region (Latitude: 41°17′59.81″N, Longitude: 122°33′26.65″E). The experimental area is in an arid and semi-arid region with a temperate continental climate characterized by an average frost-free period of approximately 100 days and an annual mean temperature of 1.4°C. The long-term average wind speed is 4.8 m s-1, and the long-term average evaporation rate is about 2000 mm, while the average yearly precipitation is approximately 300 mm. Within the experimental area, a field micro-meteorological station (HOBO-U30) was established to record meteorological data automatically. The temperature, precipitation, average wind speed, and relative humidity during the potato growing season in 2023–2024 are shown in Supplementary Figure S1. The soil texture in the 0~60 cm layer is sandy loam, while below 60 cm, it is loamy sand. The initial soil properties (0~100 cm) are presented in Table 1.
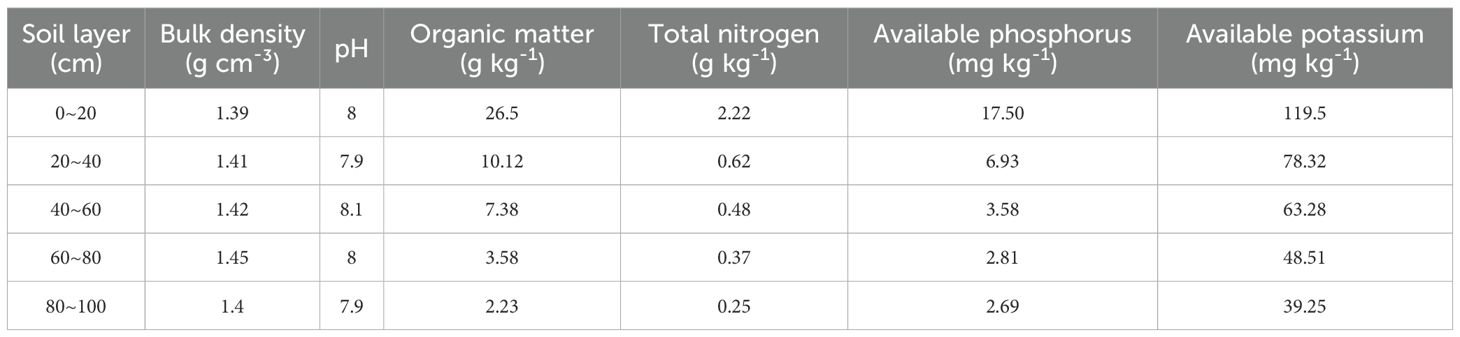
Table 1. Basic soil properties of the experimental area.
2.2 Experimental design
Biochar was purchased from Zhengzhou Haosen Environmental Protection Technology Co., Ltd., China. The preparation process was as follows: wheat straw was dried and crushed, then passed through a 200-mesh sieve before being placed in a rotary kiln. The temperature was increased at a rate of 10°C min-1 to 300°C, 500°C, and 700°C, respectively, and maintained for 0.5 hours. Based on the final temperature, the biochar types were classified as T1 (low temperature), T2 (medium temperature), and T3 (high temperature), respectively. The physicochemical properties of the biochar are detailed in Supplementary Table S1.
In 2023–2024, ten treatment schemes were established in the potato farmland, including one control group (CK) and interaction treatments of biochar at three different pyrolysis temperatures (300°C, 500°C, and 700°C) and three application rates (10 t ha-1, 20 t ha-1, and 30 t ha-1) (see Supplementary Table S2 for specific experimental design). Before planting in 2023, biochar was evenly spread over the soil surface of each plot, followed by thorough mixing with the top 0~20 cm of soil using a rotary tiller. Each plot measured 4 m × 5 m and was replicated three times. A completely randomized design was employed to arrange the positions of different plots, with a 1.5 m wide buffer zone established between adjacent plots to avoid cross-contamination during irrigation and fertilization.
2.3 Experimental layout
The potato variety used in the experiment was Jinshu 16, with planting dates of May 9 in both 2023 and 2024, and harvest dates of September 13 and 14, respectively. A ridge cultivation mode was adopted, with a row spacing of 90 cm, ridge height of 20 cm, plant spacing of 28 cm, ridge length of 23 m, and ridge width of 30 cm, as detailed in Figure 1. The irrigation method employed was drip irrigation, using drip tape with a wall thickness of 0.18 mm, a drip emitter spacing of 0.3 m, an emitter flow rate of 2.2 L h-1, and an operating pressure of 0.1 MPa. The irrigation and fertilization regime was developed based on local farmers’ practices, with specific irrigation amounts outlined in Supplementary Table S3. Fertilization utilized commonly used local fertilizers, with urea (N: 46%) applied at a rate of 652.2 kg ha-1, where 30% was broadcast at sowing, followed by top dressing of 30% of the total nitrogen during the tuber formation period and 40% during the bulking period. Calcium superphosphate (P2O5: 46%, application rate of 391.3 kg ha-1) and potassium sulfate (K2O: 45%, application rate of 666.6 kg ha-1) were used as base fertilizers, applied to the soil using a combined fertilization and planting machine.
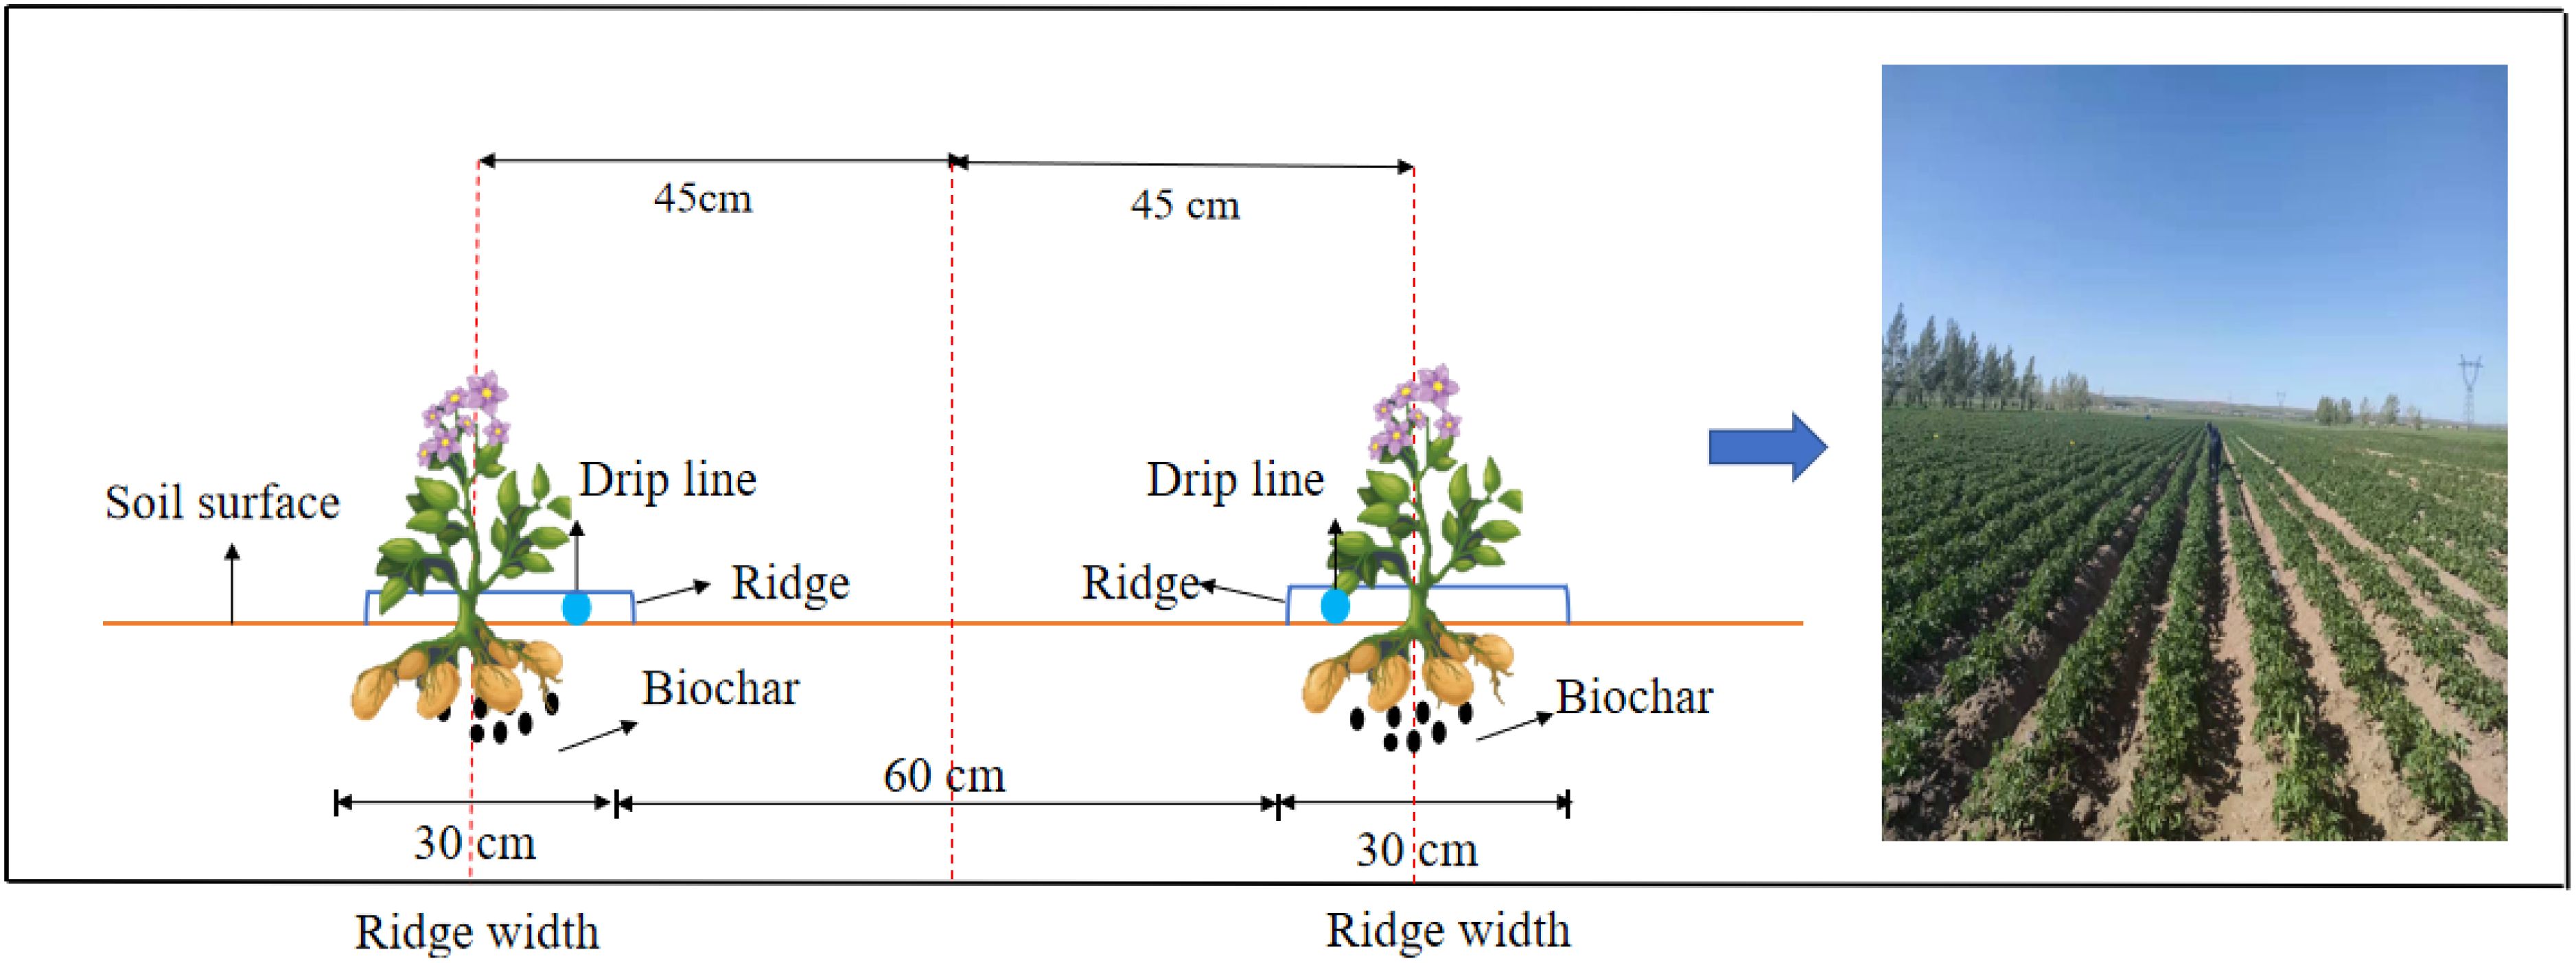
Figure 1. Experimental layout diagram.
2.4 Measurements and calculation
2.4.1 Growth, yield, and nutrient accumulation of potatoes
Three representative potato plants were randomly sampled from each experimental plot to measure the height, leaf area, dry matter weight, and nitrogen, phosphorus, and potassium accumulation at maturity. The specific methods are as follows:
Plant Height: Measured using a measuring stick with an accuracy of 0.1 cm.
Leaf Area Index (LAI): The leaf area was measured using a hole punch (10 cm diameter), and the LAI was calculated as the ratio of total leaf area to the area of land occupied (Watson, 1947) (See details in Equation 1).
Dry Matter Weight: The plant samples were decomposed and cleaned, and surface moisture was removed using absorbent paper. The samples were blanched at 105°C for 30 minutes and then dried at 75°C until a constant weight was reached. The dry matter weights of the leaves, stems, roots, and tubers were measured with an accuracy of 0.01 g (Wang et al., 2021).
Chlorophyll Content: Eighty days after planting, ten representative potato plants from each plot were selected, and the relative chlorophyll content in the leaves was measured using a handheld chlorophyll meter (Yan et al., 2021).
Nitrogen, Phosphorus, and Potassium Accumulation in Different Organs: Each organ’s dry matter was ground, passed through a 0.5 mm sieve, and digested using H2SO4-H2O2. Total nitrogen was measured using a Kjeldahl nitrogen analyzer, total phosphorus was analyzed using a continuous flow analyzer, and total potassium was measured using atomic absorption spectrophotometry (Wang et al., 2021).
Potato Yield: At harvest, fresh potatoes from an area of 2 m (length) × 1.8 m (width) were weighed, with each plot being weighed three times. The tuber yield for each plot was calculated based on the weighing results and converted to a per-hectare basis (Wang et al., 2021).
2.4.2 Net income and tuber quality
Net Income: Calculated as total income minus input costs (including seed, pesticide, water, electricity, chemical fertilizers, pipe network, and labor).
Tuber Quality: Three tubers were randomly selected from each plot for fresh sample measurement at harvest. Starch content was determined using the iodine colorimetric method, reducing sugar content was measured using the 3,5-dinitrosalicylic acid colorimetric method, and vitamin C content was determined using titration (Zhang et al., 2022).
2.4.3 Potato water and fertilizer utilization efficiency
Water Use Efficiency (WUE) of Potato (Equation 2):
Where WUE represents Water Use Efficiency (kg m-3); Y denotes crop yield (kg ha-1); ET refers to crop water consumption (mm, Equation 3).
Where P represents rainfall (mm); U denotes groundwater recharge (mm); I is the irrigation amount (mm); R indicates runoff (mm); ΔW refers to the change in soil moisture from the beginning to the end of the experiment (mm).
Given that the groundwater is deeply buried and the terrain is flat in the experimental area, both groundwater recharge and surface runoff are considered negligible. The change in soil moisture (ΔW) refers to the variation in soil water content within the 0–100 cm soil profile from sowing to harvest (Oweis et al., 2011).
The adequate rainfall P0=aP. When rainfall is less than 5 mm, a=0; when rainfall is between 5 mm and 50 mm, it ranges from 1.0 to 0.8; when rainfall exceeds 50 mm, it ranges from 0.70 to 0.80 (Guo, 1986). This can be simplified as Equation 4:
Where P0 represents adequate rainfall (mm), I denote the irrigation amount (mm), D represents the amount of deep percolation (mm).
ΔW refers to the change in soil moisture from the beginning to the end of the experiment (mm).
Fertilizer partial factor productivity (Equation 5):
Where PFP represents the fertilizer partial productivity (kg kg-1); FT denotes the total input of N, P2O5, and K2O (kg ha-1) (Cassman et al., 1996).
2.4.4 Accumulation of nitrate nitrogen, available phosphorus, and available potassium
During the potato harvest periods in 2023 and 2024, soil samples were collected from three locations within each plot (furrow, below the drip head, and in the middle of the ridge) at a 100 cm depth divided into five layers. A 5 g soil sample was extracted with 50 mL of 2 mol L-1 potassium chloride solution for nitrate nitrogen determination. The mixture was shaken for 0.5 hours and then filtered. The nitrate nitrogen content in the soil was measured using an AA3 continuous flow analyzer (Bran+Luebbe, Germany) (Bao, 2000). To measure available phosphorus, a 5 g soil sample was extracted with 0.5 mol L-1 sodium bicarbonate solution (pH = 8.5). After shaking and filtering, the available phosphorus content in the soil was determined using the molybdenum-antimony anti-colorimetric method (Bao, 2000). For available potassium, a 5 g soil sample was extracted using 1 mol L-1 neutral ammonium acetate, and the available potassium content was determined using the flame photometry method (Bao, 2000).
The accumulation of soil nitrate nitrogen (or available phosphorus or available potassium) can be calculated as follows (Yan et al., 2021, Equation 6):
Where C represents the accumulation of soil nitrate nitrogen (or available phosphorus or available potassium) (kg ha-1); M denotes the content of nitrate nitrogen (or available phosphorus or available potassium) in the soil (mg kg-1); H is the thickness of the soil layer (20 cm); and B is the soil bulk density (g cm-3).
2.5 Multi-level fuzzy comprehensive evaluation optimization model
2.5.1 Determination of factor weights using analytic hierarchy process
(1) Establishing a Comprehensive Performance Evaluation Index System
The Analytic Hierarchy Process (AHP), proposed by Saaty in 1980, aims to determine the overall evaluation objectives based on the evaluation purpose. The comprehensive evaluation system is divided into three levels: the top level is the goal level, the second level consists of the criteria for evaluating the objectives, and the third level includes specific indicators (Figure 2). Regarding the relationships among various factors in potato cultivation, the goal level is set as the interaction effect of biochar pyrolysis temperature and application rate on potato Yield, economic benefits, tuber quality, water and fertilizer utilization efficiency, and environmental benefits. The criteria level includes economic benefits, quality, water and fertilizer utilization efficiency, and ecological benefits of potatoes. The indicators level comprises specific indicators for evaluating the factors, forming a judgment matrix reflecting the hierarchical relationships within the comprehensive system.
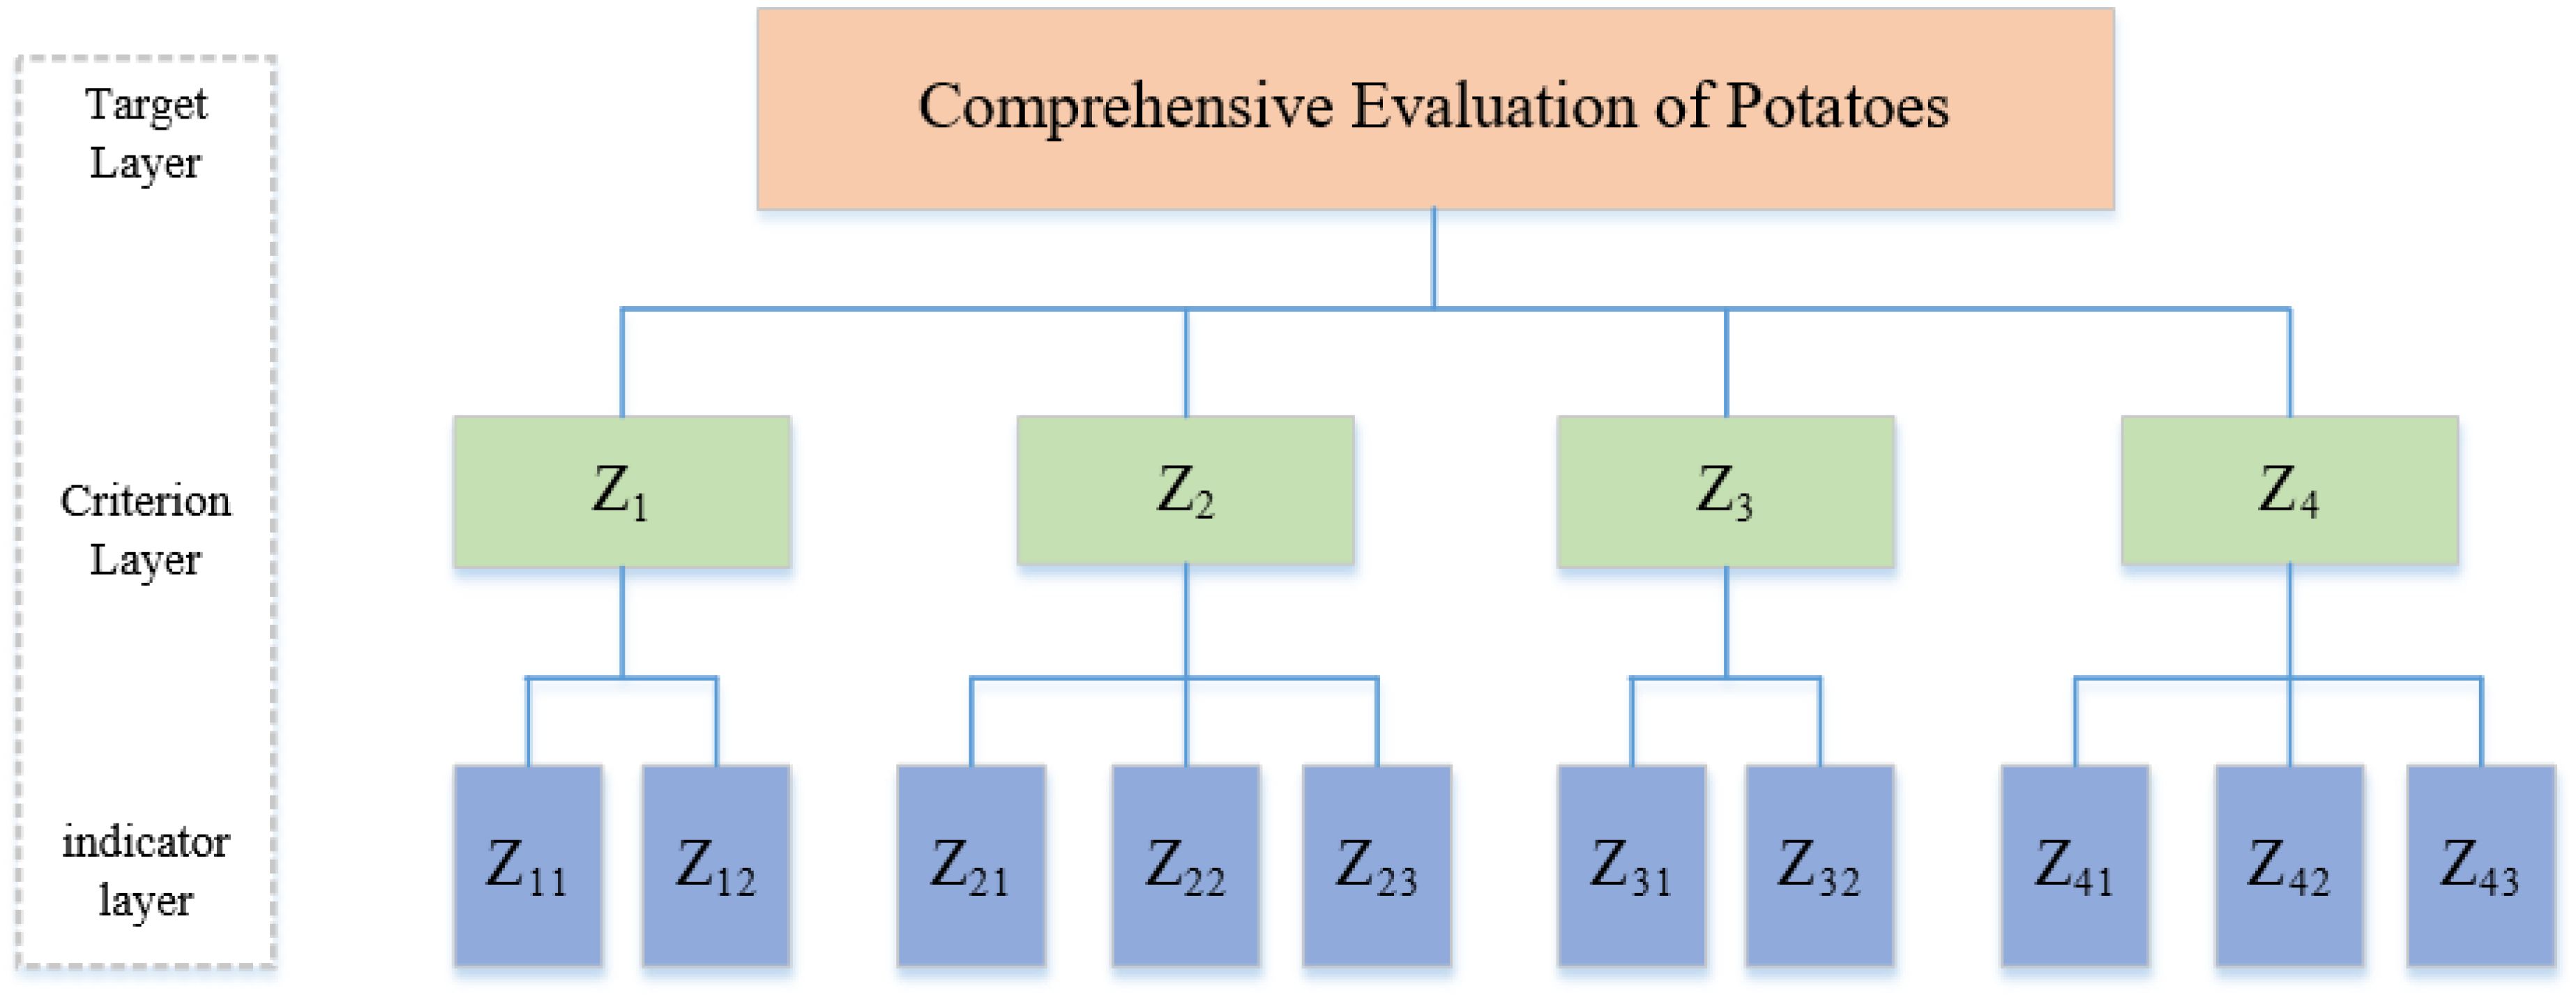
Figure 2. Comprehensive evaluation system for potatoes. Z1 is the economic benefit, Z11 is the potato Yield, Z12 is the net income, Z2 is the quality benefit, Z21 is the starch content, Z22 is the vitamin C content, and Z23 is the reducing sugar content. Z3 is water and fertilizer utilization efficiency, Z31 is water use efficiency, Z32 is fertilizer utilization efficiency; Z4 for environmental benefit, Z41, Z42, and Z43 for soil nitrate nitrogen, available phosphorus, and available potassium residue, respectively.
When constructing the matrix, five irrigation experts were interviewed using a questionnaire, and they compared the importance of several indicators based on Saaty’s 9-point scale (Table 2), forming the judgment matrix B(1−6). The subjective weights in constructing matrix A were calculated as follows:
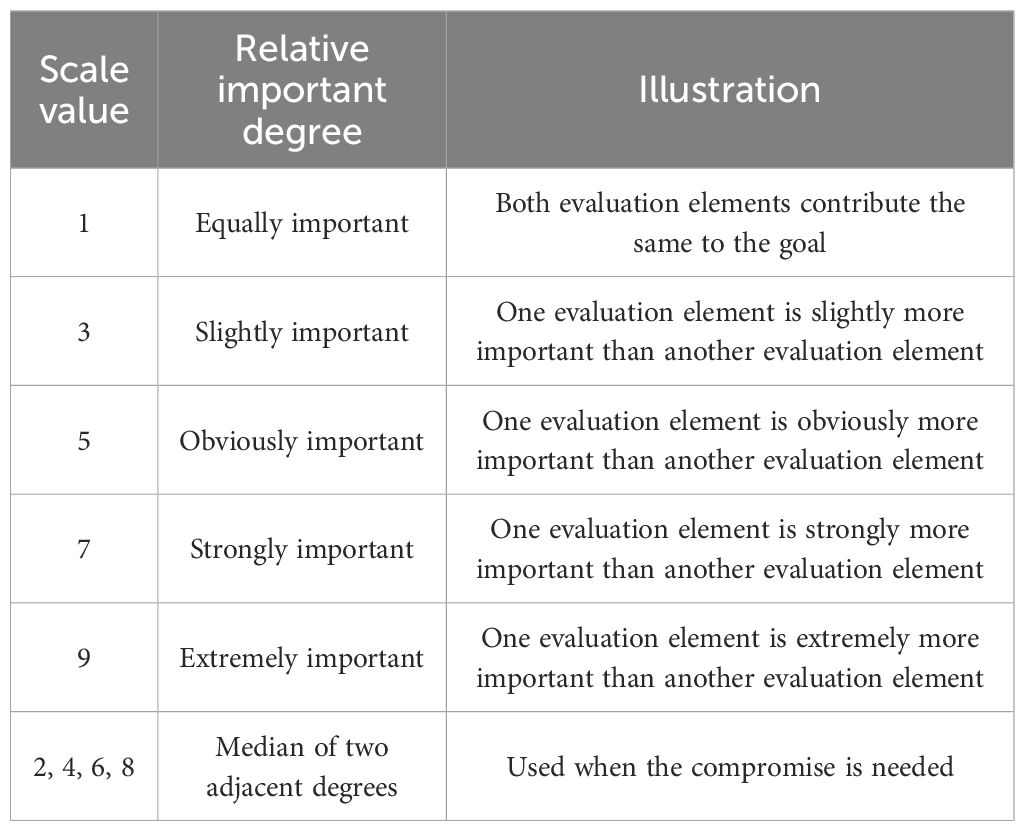
Table 2. The grading standards “1-9” at various levels and their reciprocal scale method.
(2) Construct the comparison judgment matrix (Equations 7, 8).
Where bij represents the importance of criterion layer Bi compared to criterion layer Bj in relation to the objective layer, with values determined using the “1–9 Scale Method “ outlined in Table 3, n is the number of indicators in the criterion layer, and the results are shown in Supplementary Tables S4-S8.
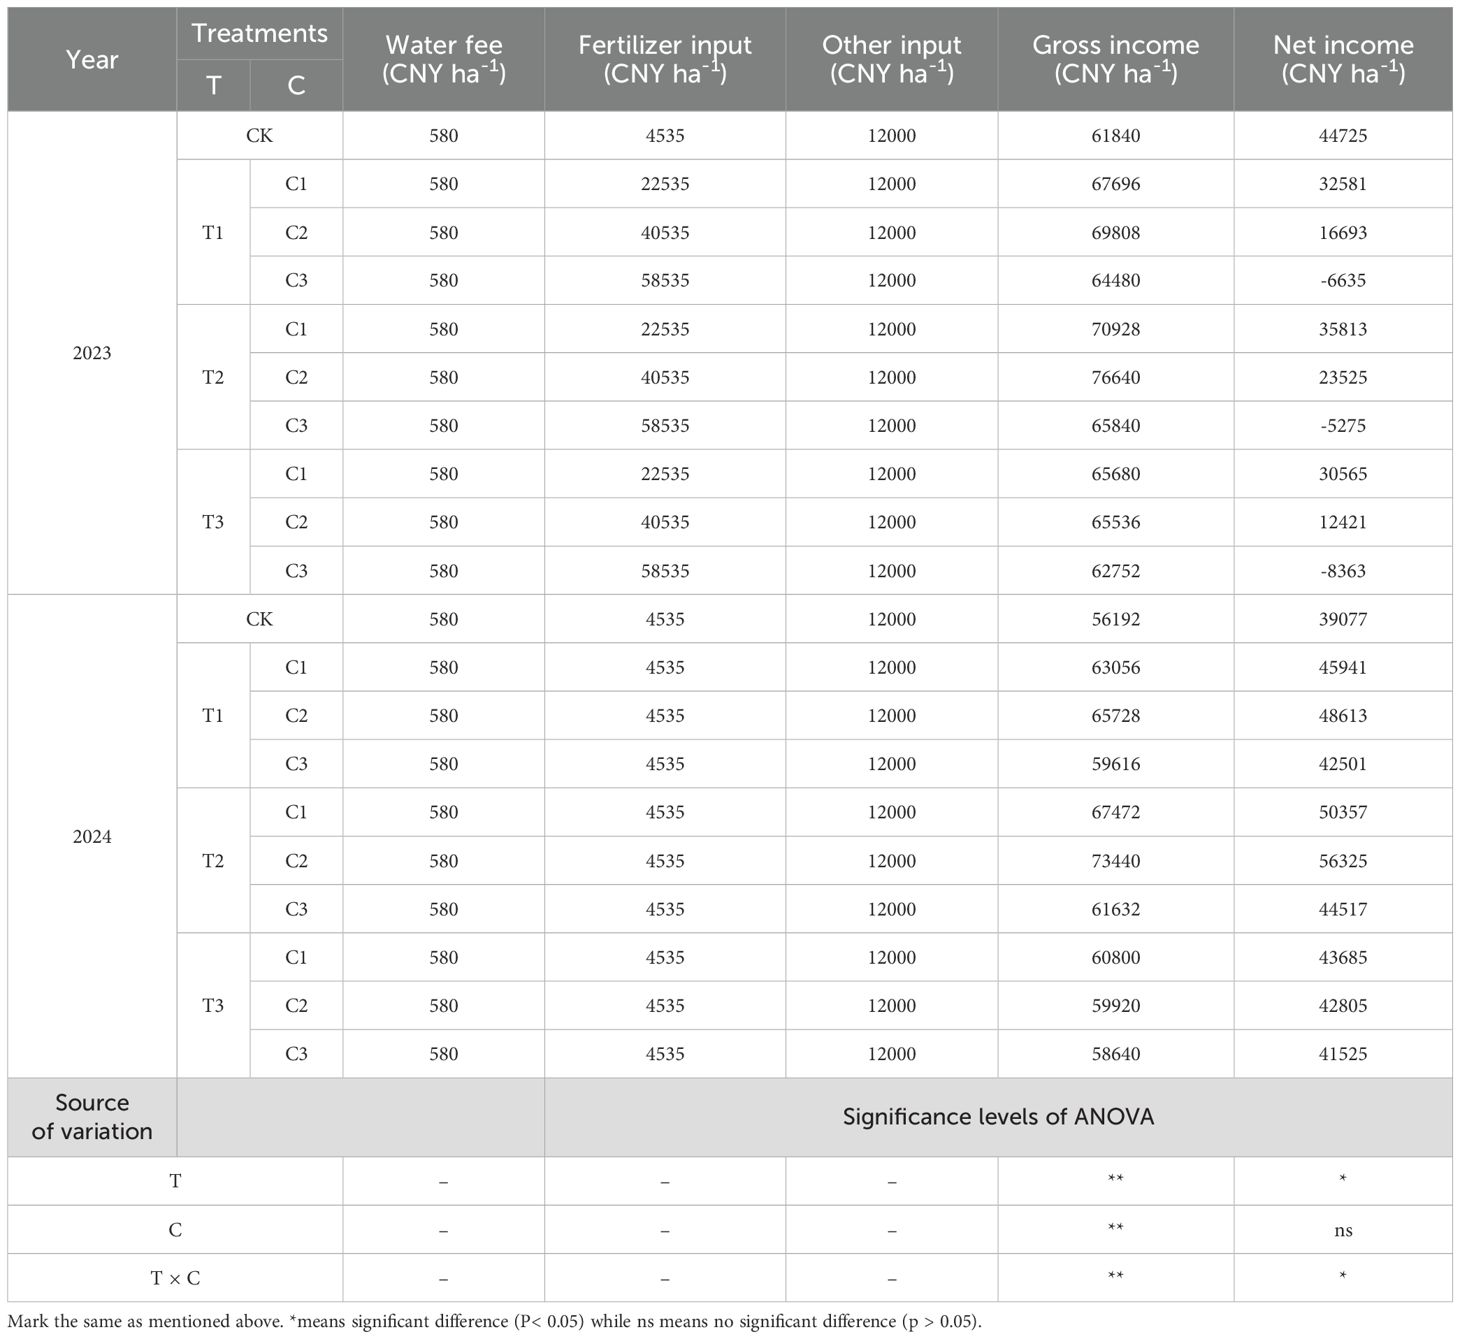
Table 3. Effects of biochar on net income of potatoes in 2023 and 2024.
(3) Calculation of Indicator Weights
The normalized weight coefficient Mi for the criterion layer indicator Bi is calculated using the following formula (Equations 9, 10):
Where Mi represents the product of the elements in each row of the judgment matrix, using the same method, the weights for the standard layer and the indicator layer are calculated to obtain the overall weights of the indicators.
Where WI represents the weight of the indicator relative to the standard layer, while WII denotes the weight of the secondary indicator relative to the objective layer, these two weights are derived from judgment matrices at different levels and are calculated using formulas (1-8), with results presented in Supplementary Table S9 (Equation 11).
(4) Consistency Check
The judgment matrix involves pairwise comparisons of multiple indicators, which may lead to contradictory situations and deteriorate consistency. Therefore, a consistency index is introduced (Equations 12–15).
Where λmax represents the maximum eigenvalue of the judgment matrix, and M is the order of the matrix.
Where λ is the characteristic root of the judgment matrix, Mi is the weight value, and RI is the average random consistency index, as shown in Table 4. If CR<0.1, the consistency check passes; otherwise, the judgment matrix must be adjusted.
Table 4. Average consistency random index value.
After the consistency check, each judgment matrix’s consistency index (CI) and consistency ratio (CR) are both less than 0.10, indicating satisfactory consistency among the judgment matrices. The priority order of the indicators is logically coherent.
2.5.2 Determination of sub-factor weights using the entropy method
The entropy method is a weighting approach based on the amount of information provided by each indicator, characterized by a high degree of objectivity, effectively mitigating the influence of subjective factors on the weights. This method can describe evaluation indicators’ information content and degree of dispersion. The greater the dispersion, the higher the subjective weight of the indicator. Data standardization is required to eliminate the impact of measurement units on the results (Equation 16).
(1) Calculate the normalized value of the i evaluation object under the j evaluation indicator (Equation 17).
(2) Calculate the entropy value of the j indicator (Equation 18).
(3) Calculate the deviation degree of the j indicator (Equation 19).
(4) Normalize the deviation degree of the j indicator, which is the weight given by (Equation 20):
2.5.3 Combination weighting method
A linear combination of objective weights and subjective weights can obtain the comprehensive weight (Equation 21):
where α1 and α2 are the combination coefficients, with α1, α2 > 0 and α1 + α2 = 1. In this study, W1 and W2 represent the AHP weight (Supplementary Table S9) and EM weight (Supplementary Table S10) as provided by Zhu et al. (2021), with the results shown in Supplementary Table S11.
The goal of establishing the objective function for optimization is to minimize the deviation of the comprehensive weights. Based on the properties of matrix differentiation, the model can be transformed as follows (Equation 22):
2.5.4 Fuzzy comprehensive evaluation method
This study established ten evaluation indicators and five comprehensive performance levels—”Excellent, Good, Average, Poor, and Very Poor”— n=10 and m=5, respectively. For positive indicators, a more significant value indicates a better performance, while for negative indicators, a smaller value is preferred (Supplementary Table S12).
The evaluation indicators are categorized into positive and negative indicators. The membership degrees are calculated using linear functions based on trapezoidal and triangular distributions. Then, a fuzzy comprehensive evaluation matrix R is constructed according to each membership degree.
Membership Function for Positive Indicators (Higher is Better):
Excellent level membership function (Equation 23):
Membership Functions for Good, Average, and Poor Levels (Equation 24):
Poor Level Membership Function (Equation 25):
For inverse indicators, where a smaller value indicates a better performance, the membership functions are defined as follows:
Excellent level membership function:
Membership Functions for Good, Average, and Poor Levels:
Poor Level Membership Function:
Based on the membership function formulas for each evaluation indicator, we construct the fuzzy comprehensive evaluation matrix R that reflects the degree of membership for each indicator to the evaluation levels.
The “weighted average-type” operator combines the weight matrix A obtained from the Analytic Hierarchy Process (AHP) and the Entropy Method with the fuzzy comprehensive evaluation matrix R to obtain the fuzzy comprehensive evaluation result vector B, expressed as follows (Equations 28, 29):
The maximum membership degree method is employed to rate the results of the fuzzy comprehensive evaluation (Equation 30):
2.5.5 Calculation of multi-level fuzzy evaluation values
The calculation formula for the fuzzy comprehensive evaluation result vector B is as follows (Equation 31):
Where R is the fuzzy comprehensive evaluation matrix, and b1,b2,…, and b5 represent the membership degrees of different evaluation levels.
To further analyze the results, the semantic scale (Excellent, Good, Average, Poor, Very Poor) is quantified and assigned values of 5, 4, 3, 2, and 1, respectively. These values are multiplied by B to obtain the comprehensive scores for each treatment.
2.6 Data processing and analysis
Data was statistically organized using Excel 2016, and calculations for the analytic hierarchy process (AHP) and entropy method were performed. SPSS 20.0 was utilized for multiple comparisons (Multiple Comparisons: Least Significant Difference), while Origin 2021 was used for plotting.
3 Results and analysis
3.1 Effects of biochar application on potato growth, yield and net income
The results of the two-way ANOVA indicated that the pyrolysis temperature and application rate of biochar, as well as their interaction, significantly affected various growth indices, yield, and net income of potatoes (P< 0.05; Tables 5, 3). During the 2023–2024 period, the dry matter weight, plant height, stem diameter, leaf area index (LAI), SPAD value, and yield of potatoes generally showed a trend of first increasing and then decreasing with increasing pyrolysis temperature and application rate of biochar. Among the treatments, the biochar produced at the medium pyrolysis temperature (500°C) applied at a rate of 20 t ha-1 performed best, resulting in a yield increase of 8.44% to 27.15% compared to other treatments (P< 0.05; average values for 2023 and 2024). In 2023, the net income from potatoes was highest under the treatment without biochar application (CK), whereas in 2024, applying the same temperature biochar (500°C) at a rate of 20 t ha-1 yield the highest net income. Overall, the average net income of potatoes in 2023 and 2024 under the C2T2 treatment was the most favorable, showing an increase of 2.83% to 159.85% compared to other treatments.
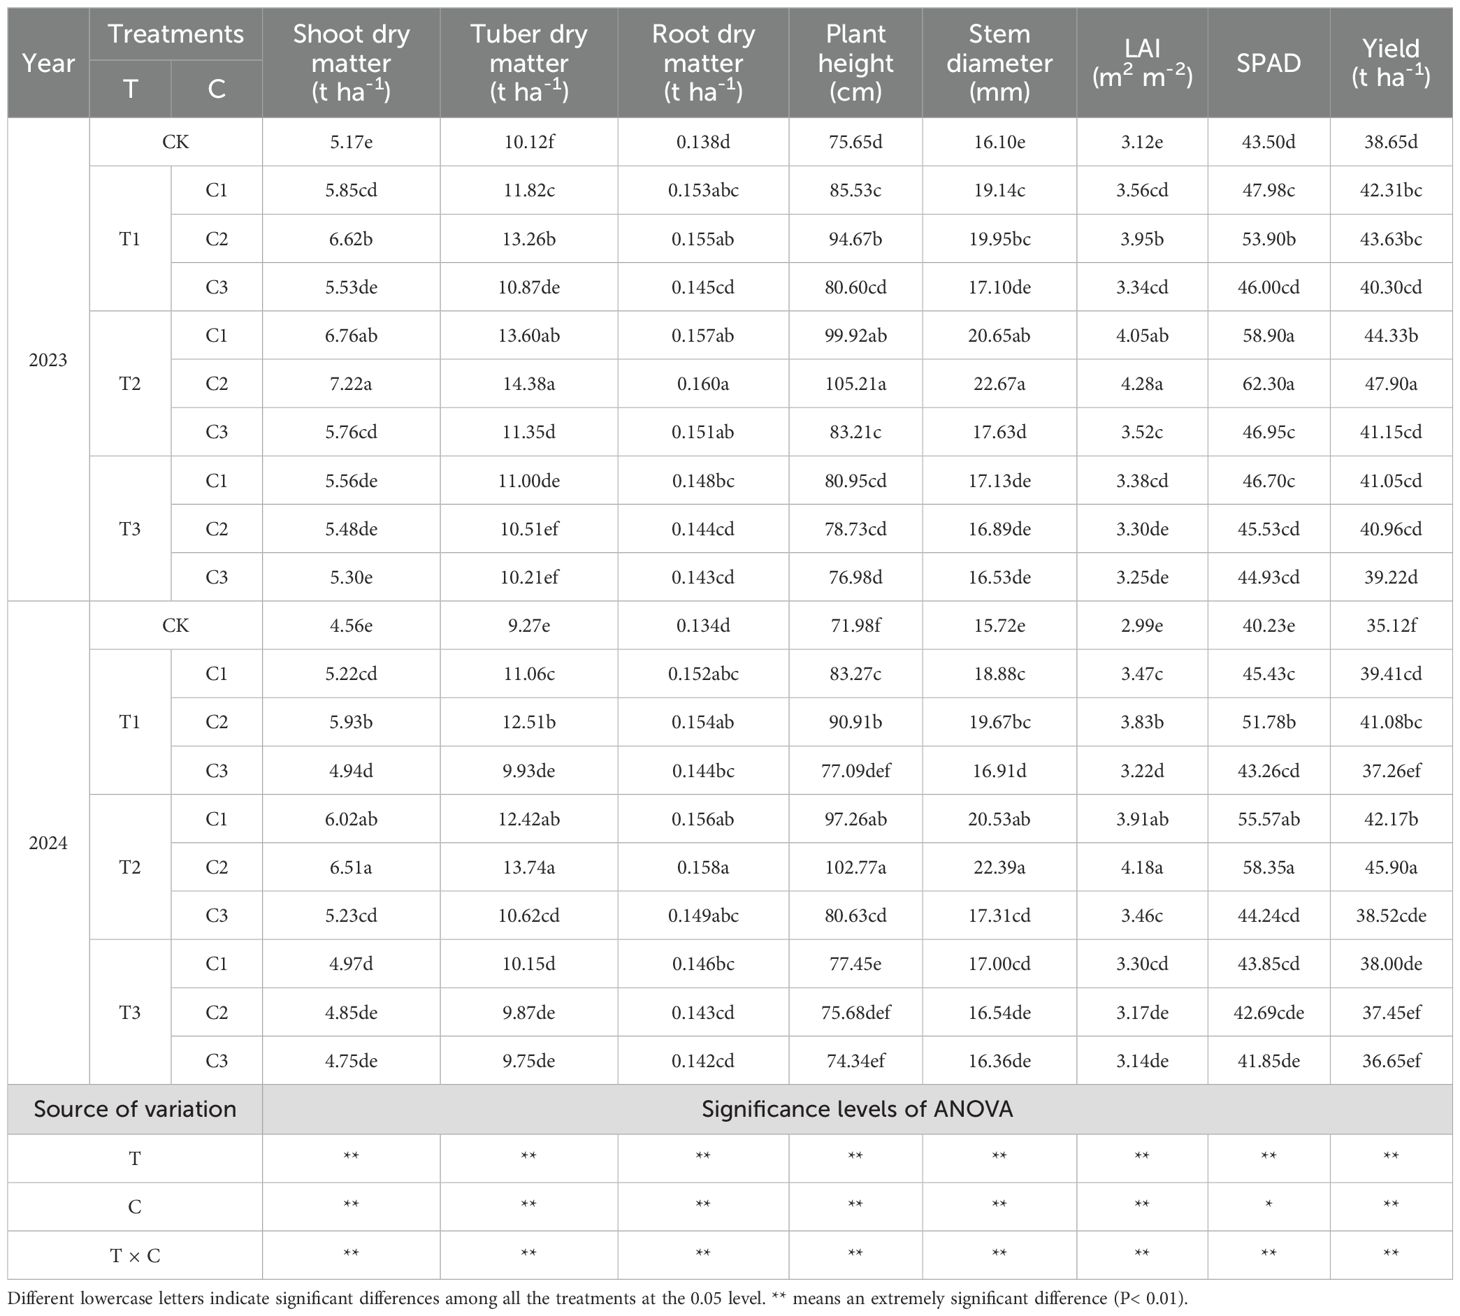
Table 5. Effects of biochar on aboveground dry matter, tuber dry matter, root dry matter, plant height, stem diameter, leaf srea index (LAI), SPAD value, and yield in 2023 and 2024.
3.2 Effects of biochar application on potato quality, accumulation of NPK in different organs, and water-nutrient use efficiency
The results of the two-way ANOVA indicated that the pyrolysis temperature and application rate of biochar, as well as their interaction, had significant effects on potato quality, nutrient accumulation in different organs, and water-nutrient use efficiency (P< 0.05; Tables 6, 7). During the 2023–2024 period, the starch content, vitamin C content, and nitrogen, phosphorus, and potassium accumulation in various organs of potatoes generally showed a trend of increasing and then decreasing with increasing biochar pyrolysis temperature and application rate. Among the treatments, biochar produced at the medium pyrolysis temperature (500°C) at an application rate of 20 t ha-1 performed best, with the C2T2 treatment showing starch content and vitamin C content higher by 2.50% to 19.38% and 1.97% to 23.30%, respectively (Table 6, average values for 2023 and 2024). The total accumulation of nitrogen, phosphorus, and potassium in the C2T2 treatment was higher by 5.67% to 45.49%, 1.57% to 30.96%, and 4.12% to 38.46%, respectively (Figure 3, average values for 2023 and 2024). Additionally, the water-nutrient use efficiency in the C2T2 treatment was significantly higher than in other therapies by 10.03% to 30.20% and 8.44% to 27.15% (Table 7, P< 0.05; average values for 2023 and 2024).
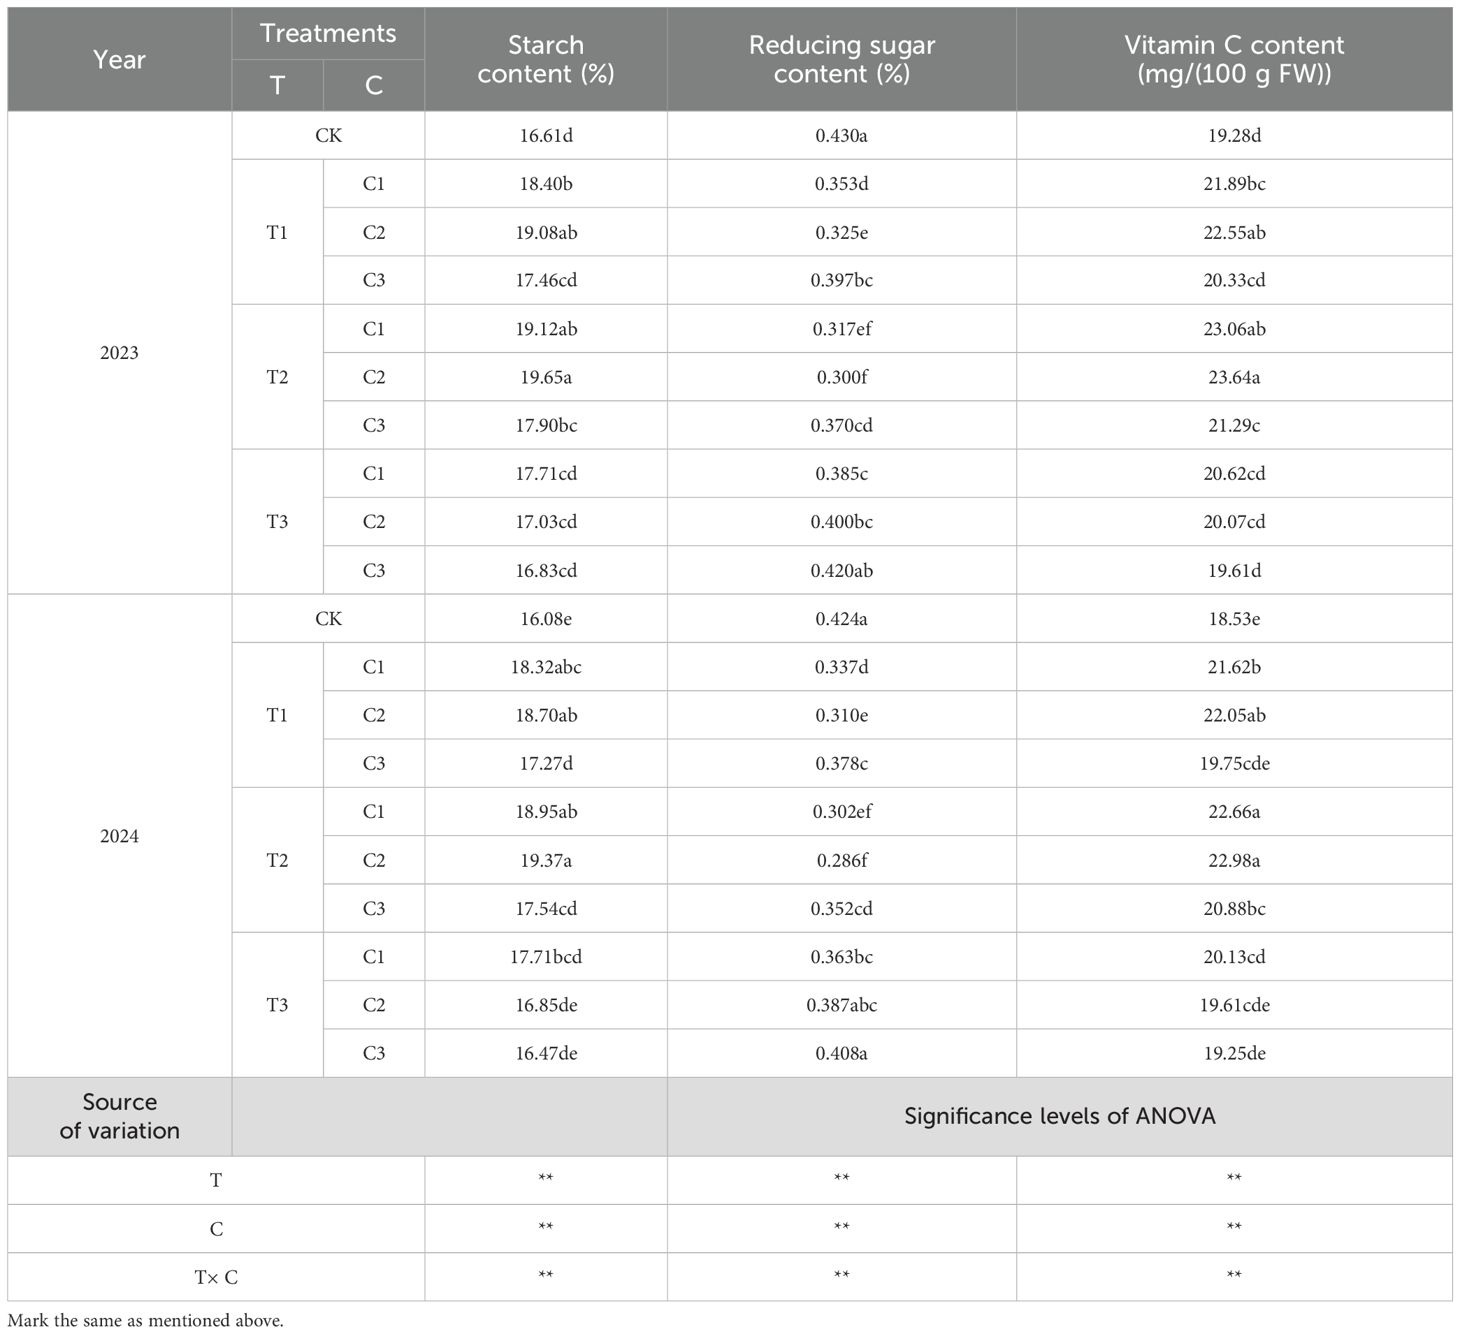
Table 6. Effects of biochar on potato quality in 2023 and 2024.
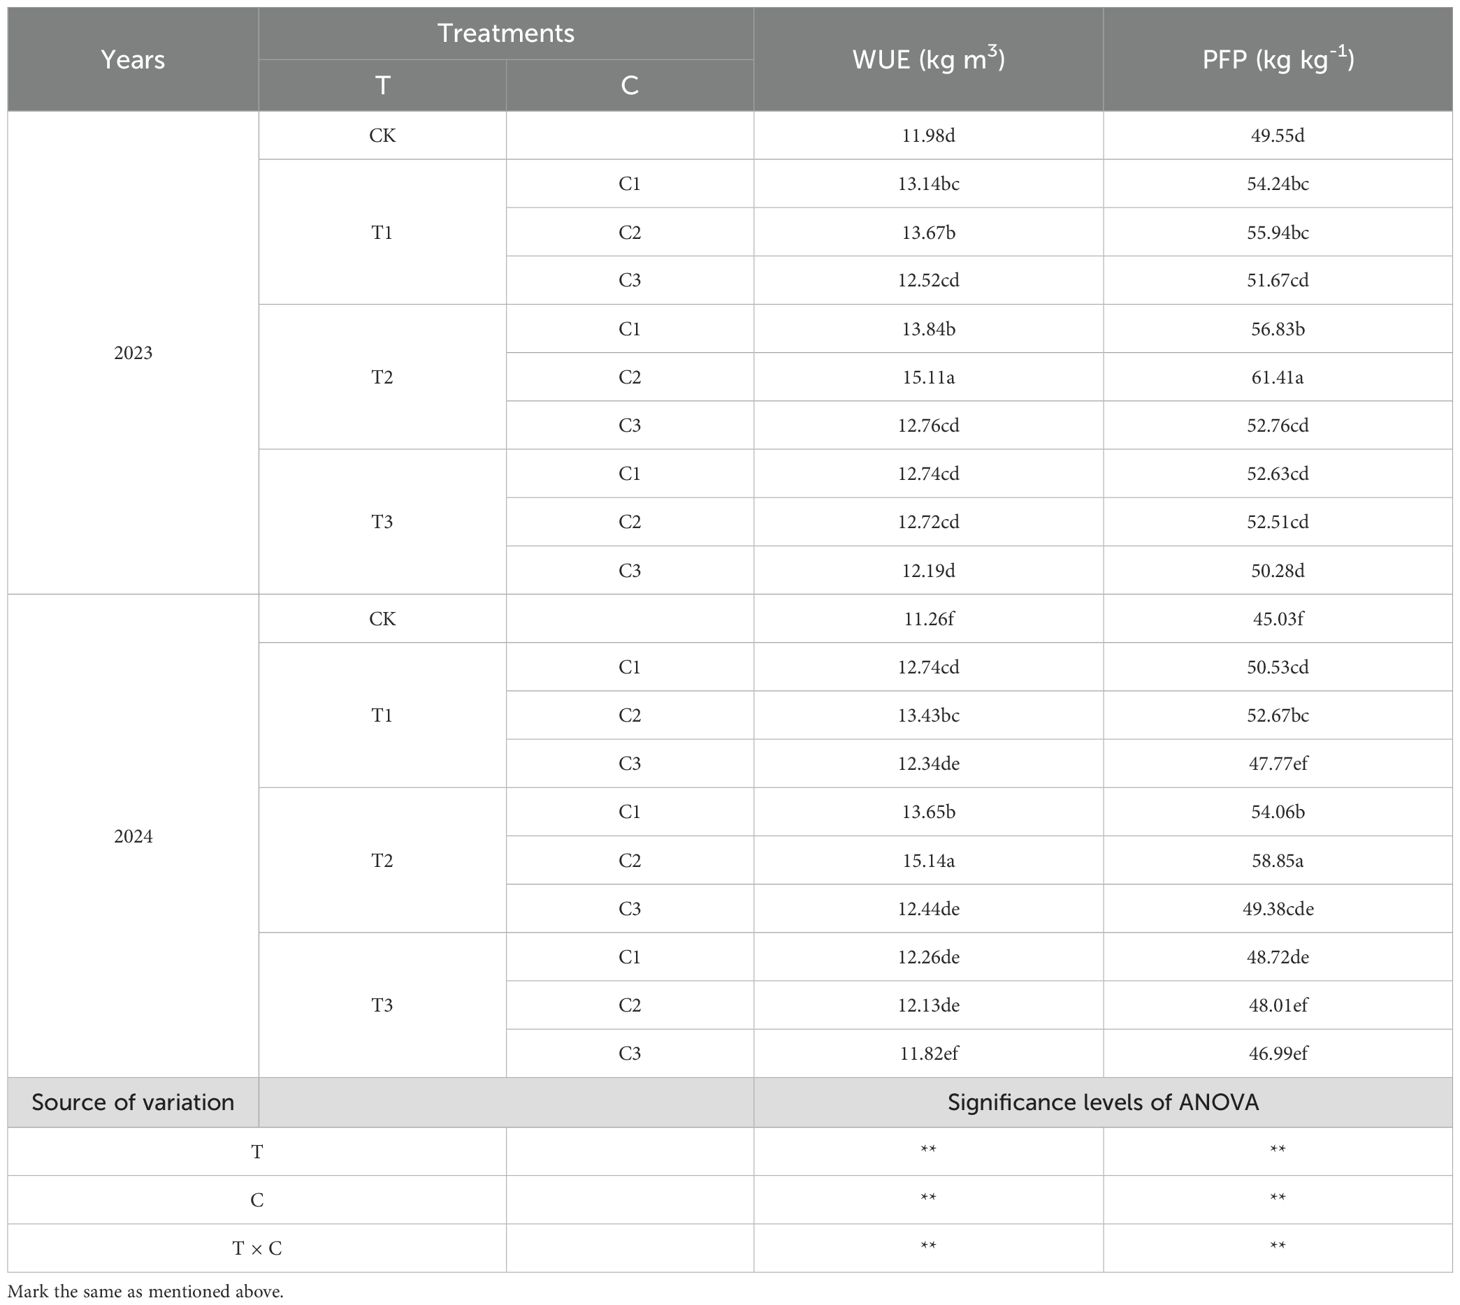
Table 7. Effects of biochar on water-nutrient use efficiency in potatoes in 2023 and 2024.
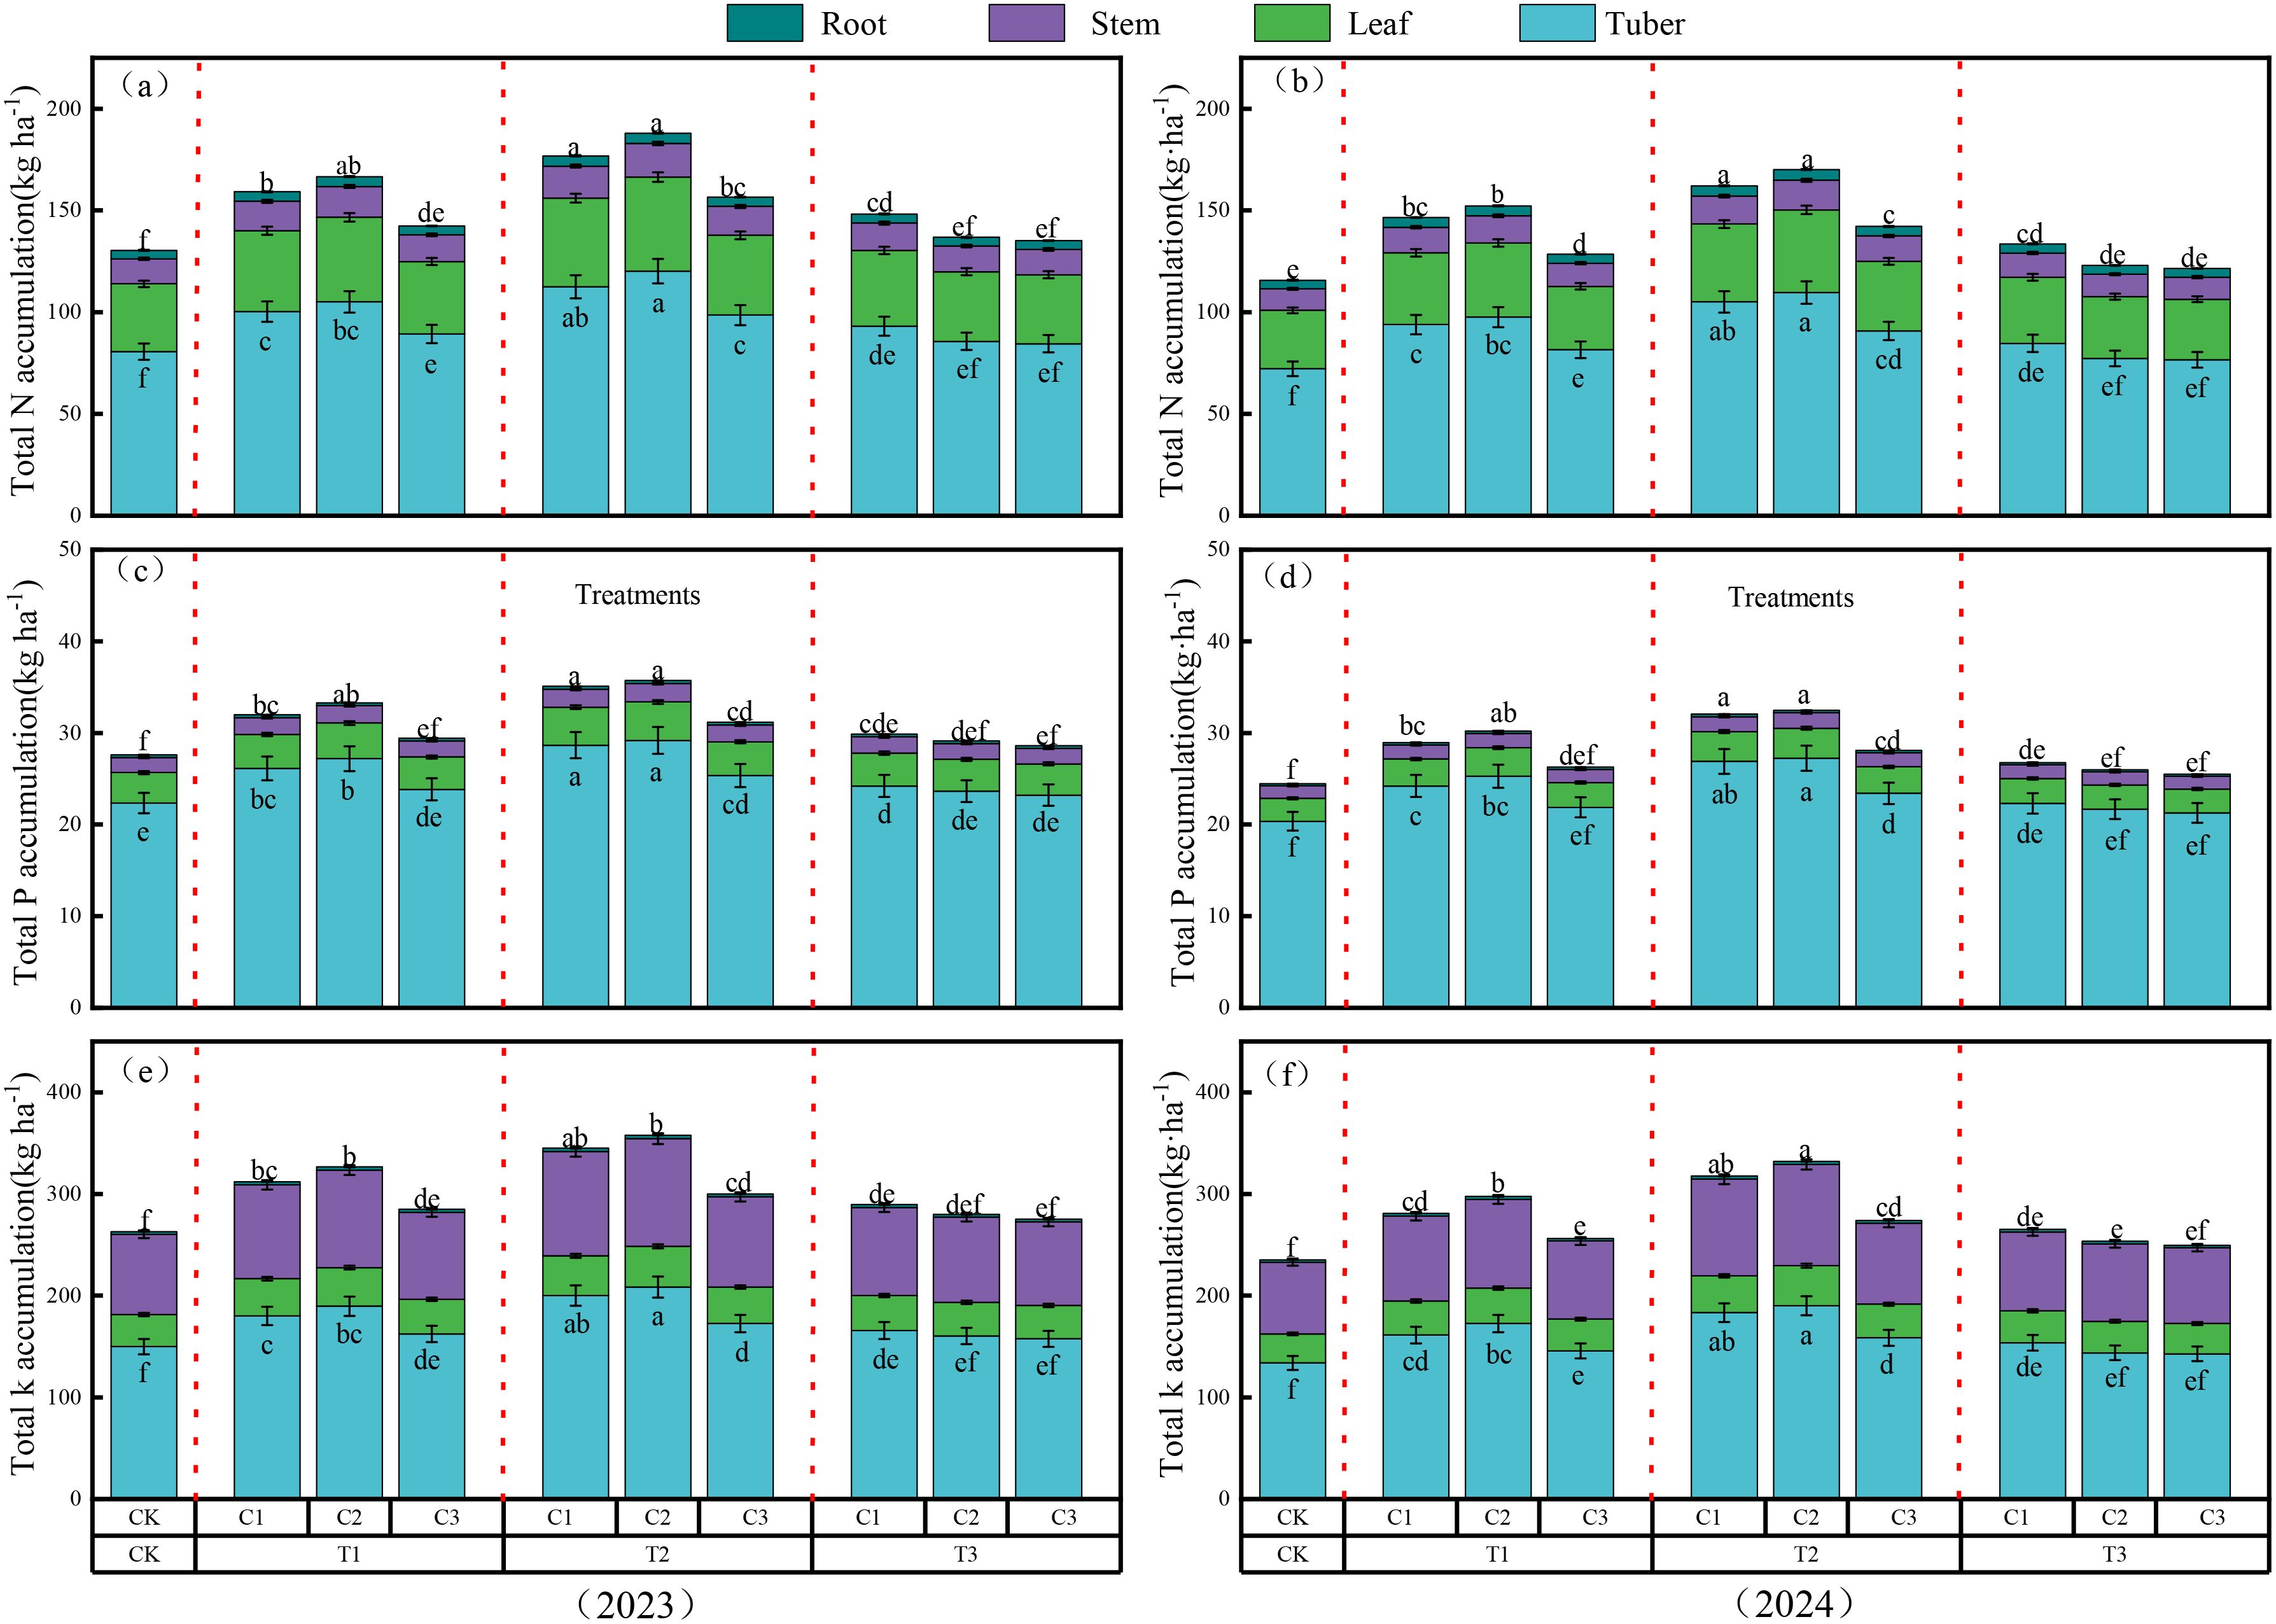
Figure 3. Bar charts showing the total accumulation of N, P, and K in different plant organs under varying pyrolysis temperatures and application rates in 2023 and 2024. Different letters above the bars indicate significant differences in the total N (a, b), P (c, d), and K (e, f) accumulation in the whole plant, while different letters below the bars indicate significant differences in N, P, and K accumulation in the tubers (P < 0.05).
In contrast, the reduced sugar content of the potatoes showed a declining trend. Under the medium pyrolysis temperature (500°C) and an application rate of 20 t ha-1, The reducing sugar content of the C2T2 treatment decreased by 5.33% to 31.38% compared to other treatments. (Table 6, average values for 2023 and 2024).
3.3 Effects of biochar application on soil nitrate nitrogen, available phosphorus, and available potassium accumulation
The results of the two-way ANOVA indicated that the pyrolysis temperature and application rate of biochar, as well as their interaction, significantly affected the accumulation of nitrogen, phosphorus, and potassium in the soil (P< 0.05; Figure 4). Between 2023 and 2024, the nitrate nitrogen content in the 0~100 cm soil profile showed a trend of first decreasing and then increasing with increasing biochar pyrolysis temperature, while it gradually decreased with increasing application rate. At a medium pyrolysis temperature (500°C), the nitrate nitrogen content at an application rate of 30 t ha-1 was relatively low, being higher by 3.28% to 49.89% compared to the C3T2 treatment (average values for 2023 and 2024).
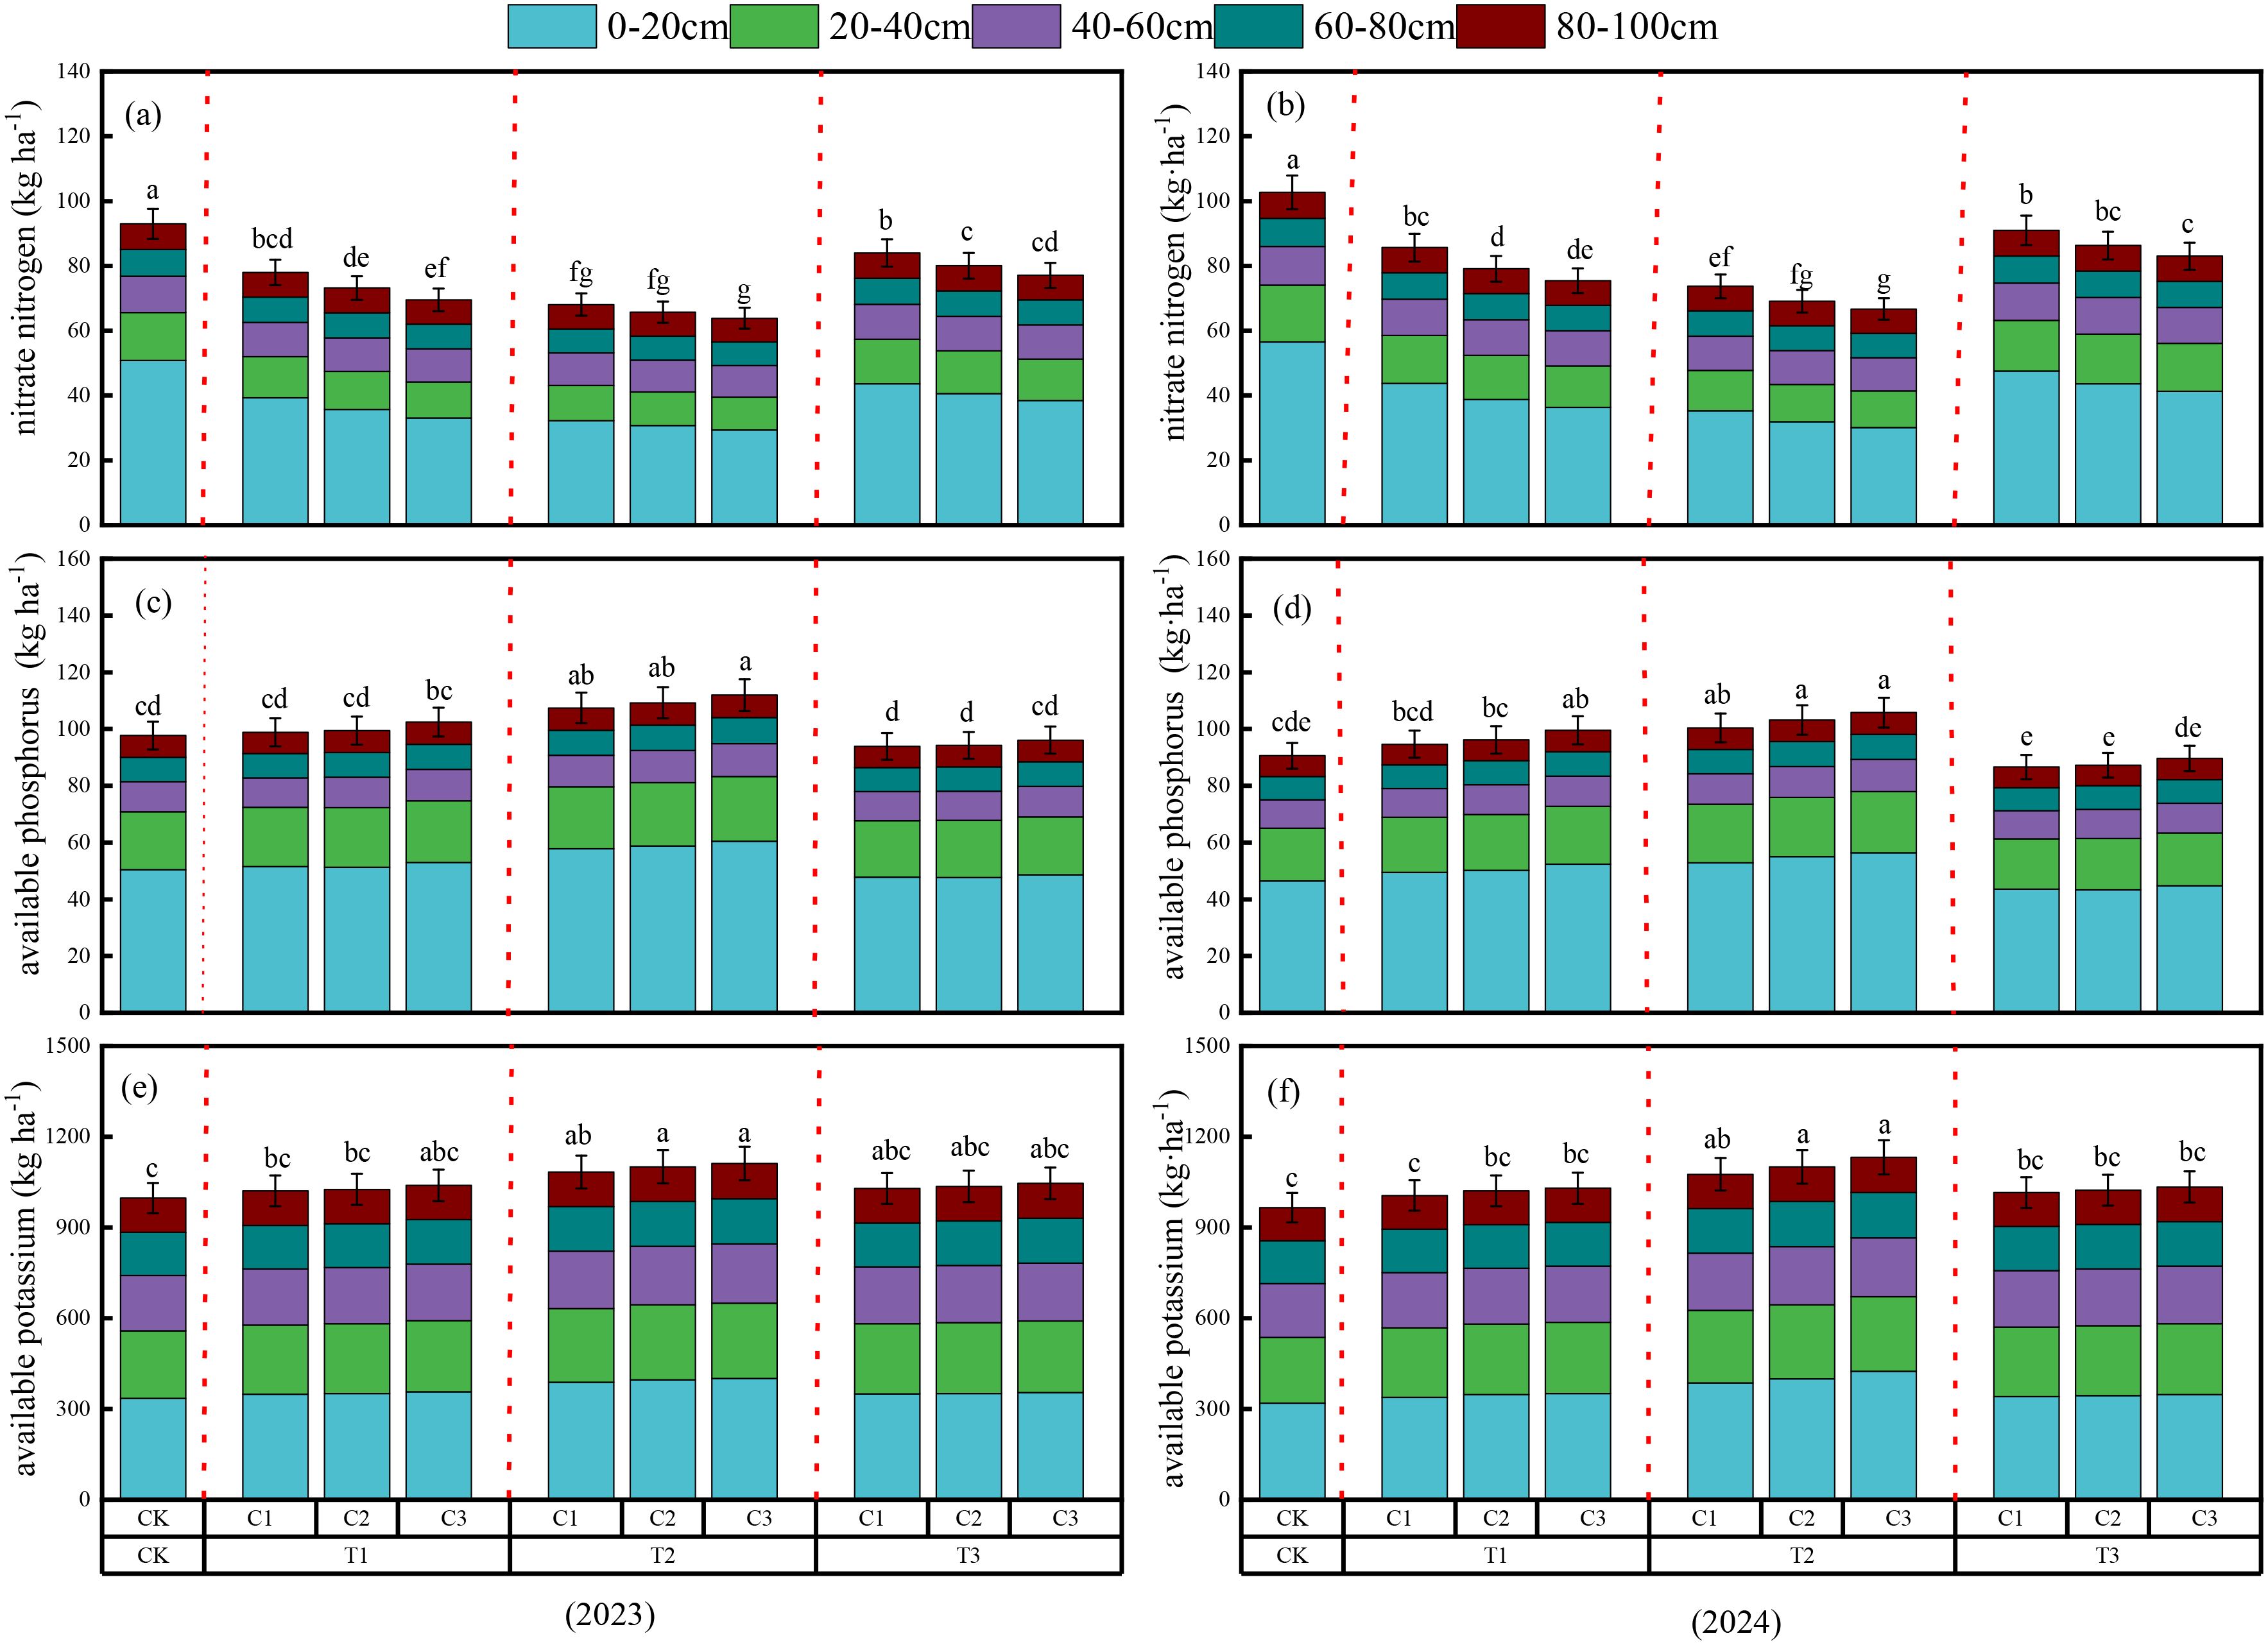
Figure 4. Accumulation of nitrate nitrogen (a, b), available phosphorus (c, d), and available potassium (e, f) in different soil layers (0–20 cm, 20–40 cm, 40–60 cm, 60–80 cm, and 80–100 cm) at harvest under various pyrolysis temperatures and application rates in 2023 and 2024. Different lowercase letters above the bars indicate significant differences in total accumulation (0–100 cm soil depth) among treatments according to Duncan’s multiple range test (P < 0.05).
The accumulation of available phosphorus and potassium in the soil showed a trend of increasing and then decreasing with increasing biochar pyrolysis temperature. In contrast, it gradually increased with increasing application rate. At a high pyrolysis temperature (700°C), the accumulation of available phosphorus at an application rate of 10 t ha-1 was low, while the accumulation of available potassium was lowest under control conditions. The accumulation of available phosphorus in all treatments was higher by 0.55% to 20.65% compared to the C1T3 treatment (average values for 2023 and 2024), and the accumulation of available potassium was significantly higher than the control treatment by 3.83% to 13.24% (average values for 2023 and 2024). Additionally, soil nitrate nitrogen, available phosphorus, and potassium accumulation were primarily concentrated in the 0~40 cm soil layer. This may be related to the duration of biochar application and soil incorporation depth.
3.4 Effects of the interaction between biochar pyrolysis temperature and application rate on the potato PFCE model
To comprehensively evaluate the feasibility of the ten treatments, a multi-level fuzzy comprehensive evaluation (PFCE) model was employed. Given that yield and economic returns are the primary concerns of farmers, tuber quality is essential for processing and consumption, soil nutrient residues reflect agricultural environmental impacts, and water and fertilizer use efficiency are critical for sustainable production in arid regions, ten evaluation indicators were selected: yield (Z11), net income (Z12), starch content (Z21), vitamin C content (Z22), reducing sugar content (Z23), water use efficiency (WUE, Z31), partial factor productivity of fertilizer (PFP, Z32), soil nitrate nitrogen accumulation (Z41), soil available phosphorus accumulation (Z42), and soil available potassium accumulation (Z43).
Subjective and objective weights were calculated using the AHP and Entropy Method (EM) (Supplementary Tables S9, S10). The reliability of WAHP was tested using Equation 15. Due to the data-driven nature of the entropy method, there were differences in WEM between the two years. Finally, WAHP and WEM were combined to form composite weights using Equation 21 and Equation 22 (Supplementary Table S11).
The multi-level fuzzy evaluation values are presented in Supplementary Table S13. In 2023, at the same level of biochar application, the composite evaluation value gradually increased when the pyrolysis temperature was below 500°C. Conversely, under the same pyrolysis temperature conditions, the evaluation value continuously decreased with increasing application rate In 2023, CK was more favorable for improving the comprehensive evaluation. In 2024, the comprehensive benefits of potatoes showed a trend of increasing and then decreasing with rising pyrolysis temperature and application rate. The maximum comprehensive benefit was achieved when the biochar pyrolysis temperature was 500°C, and the application rate was 20 t ha-1.
Based on the multi-level fuzzy evaluation values, the quadratic surface coefficients of determination (R²) established with biochar pyrolysis temperature and application rate were 0.82 and 0.80 for 2023 and 2024, respectively (Figure 5), indicating that the regression model effectively explains the impact of biochar pyrolysis temperature and application rate on the overall benefits of potatoes. Based on the comprehensive model from multi-level fuzzy evaluation and combined with actual production management, it was concluded that the optimal multi-objective comprehensive level is achieved when the biochar pyrolysis temperature is 400–500°C, and the application rate is 18–20 t ha-1.
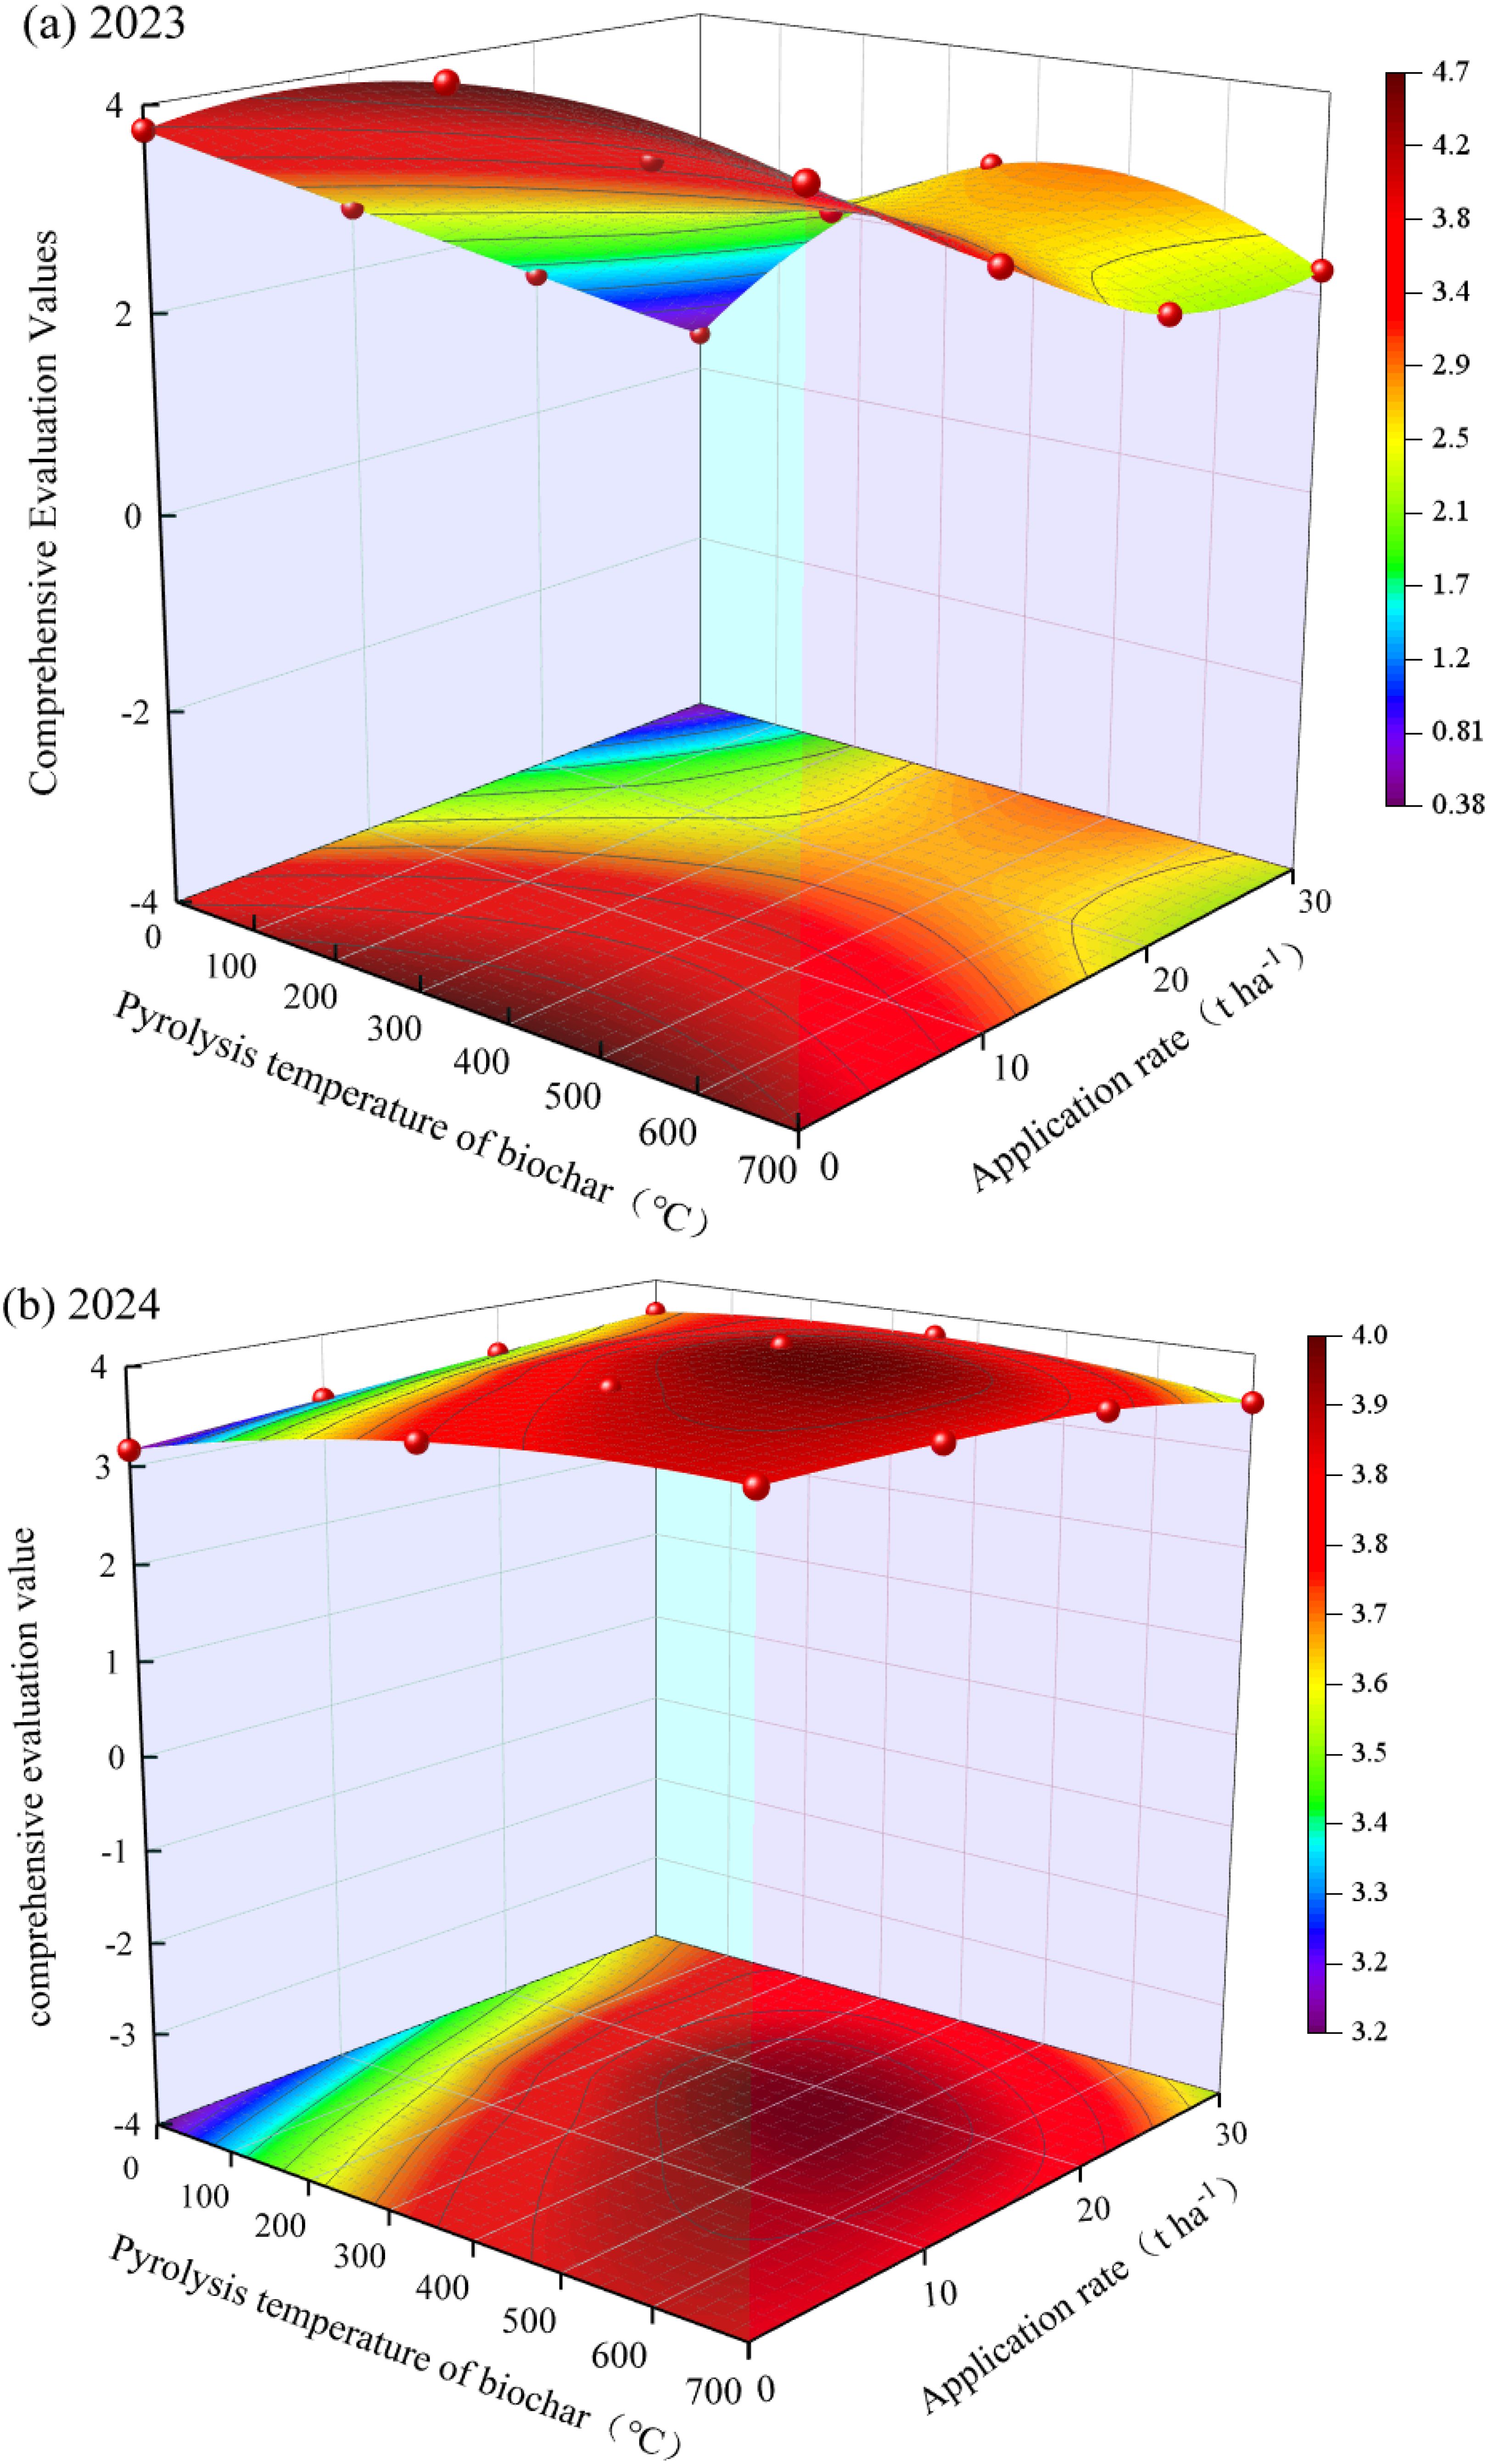
Figure 5. The Interactive Effects of Biochar Pyrolysis Temperature and Application Rate on the Comprehensive Evaluation Values of Potatoes in 2023 (a) and 2024 (b).
4 Discussion
4.1 Effects of biochar on potato growth, yield, and net income
Multiple studies have shown that the application of biochar can promote crop growth, increase dry matter quality, enhance the accumulation of nitrogen, phosphorus, and potassium in plants, and improve crop yield and quality (Alkharabsheh et al., 2021; Iqbal et al., 2019; Kapoor et al., 2022; Khan et al., 2021a, b). A recent meta-analysis pointed out that biochar produced at relatively low pyrolysis temperatures (≤400°C and 401-500°C) has a more favorable effect on crop productivity (Rehman et al., 2021). This study indicates that when the application rate of biochar is constant, potato dry matter, plant height, stem diameter, leaf area index (LAI), SPAD values, accumulation of nitrogen, phosphorus, and potassium in the plant, and tuber yield all initially increase and then decrease with rising biochar pyrolysis temperatures (Figure 3, Table 5). This trend may be attributed to biochar’s relatively stable aromatic structure produced at moderate pyrolysis temperatures, which contains more C=O and C-H functional groups that can serve as nutrient exchange sites (Tomczyk et al., 2020). This facilitates better retention of nutrients in the soil, thereby enhancing the crop’s absorption of nitrogen, phosphorus, and potassium from fertilizers (Tanure et al., 2019). Additionally, biochar produced at moderate pyrolysis temperatures has a higher content of essential nutrient elements (Na, K, Ca, and Mg) on its surface, which increases soil nutrient levels (Xi et al., 2020). In contrast, biochar produced at high pyrolysis temperatures releases excessive soluble nutrients, resulting in a decline in plant photosynthetic capacity and reduced crop yields (Gao et al., 2021). Moreover, biochar produced at high pyrolysis temperatures has a higher C/N ratio, which can reduce soil enzyme activity (Khadem and Raiesi, 2017) and negatively impact the soil microbial environment, inhibiting crop growth and ultimately lowering yields (Brtnicky et al., 2021). This study also found that when the pyrolysis temperature of biochar is constant, potato tuber yield increases with biochar application rates from 0 to 20 t ha-1, but further increases in application rates do not lead to higher yields and may even cause a decline (Table 5). This could be due to excessive biochar application leading to decreased microbial activity, thereby inhibiting the crop’s nutrient uptake (Xiang et al., 2021; Semida et al., 2019). Additionally, the economic cost associated with large-scale biochar application may limit its commercialization and use in agriculture (Farhangi-Abriz et al., 2021).
Two-way ANOVA indicated that the interaction between biochar pyrolysis temperature and application rate significantly affected potato dry matter, plant height, stem diameter, leaf area index (LAI), SPAD values, and yield (P<0.05) (Table 5). Therefore, selecting appropriate biochar pyrolysis temperatures and application rates is essential for maximizing potato yield. Overall, when the biochar pyrolysis temperature is set at 500°C and the application rate at 20 t ha-1, there is a significant increase in LAI, accumulation of dry matter in the stems and tubers, and promotion of root and canopy development, which enhances the root system’s ability to absorb water and nutrients, facilitates leaf formation, and ultimately results in significant yield benefits (Yang et al., 2022).
4.2 Effects of biochar on potato quality and water-fertilizer use efficiency
Biochar contains essential nutrients such as nitrogen, phosphorus, and potassium necessary for the physiological growth of potatoes. It can directly release soluble nutrients into the soil solution for crop uptake, thus influencing potato quality (Liu et al., 2018; Mokrani et al., 2018). Research by Jiao et al. (2018) indicates that adding biochar can absorb toxic antibiotics harmful to potato roots, increasing potatoes’ starch, fat, protein, and vitamin content, thereby enhancing tuber quality. Agegnehu et al. (2017) found that an appropriate amount of biochar can improve crop quality, while excessive application can lead to a decline in quality. Our study reached similar conclusions (Table 6), The excessive application of biochar may inhibit starch accumulation and reduce potato taste due to soil moisture excess or nutrient imbalance (Mahanjana, 2018). Suthar et al. (2018) found that fruits produced under low-temperature biochar (300°C) treatments were firmer, darker, and had higher sugar, acid, and vitamin C (ascorbic acid) content, leading to more excellent nutritional value. In contrast, our study indicates that biochar at a medium pyrolysis temperature (500°C) yields higher starch and vitamin content in potatoes. In comparison, reducing sugars are higher with low-temperature biochar treatment (300°C) (Table 6). These differences may be attributed to variations in soil texture, climatic conditions, and crop species.
This study indicates that the pyrolysis temperature and application rate of biochar and their interaction significantly affect water and nutrient use efficiency (Table 7). Overall, potato water and nutrient use efficiency show a trend of increasing and decreasing with the rise in biochar pyrolysis temperature and application rate, with C2T2 being optimal. This is consistent with the findings of Liu et al. (2022). As pyrolysis temperature increases, biochar’s surface area and porosity also increase, enhancing the soil’s ability to retain water and nutrients, thereby improving crop water and nutrient use efficiency (Tanure et al., 2019; Murtaza et al., 2021). However, excessively high pyrolysis temperatures can lead to increased hydrophobicity of biochar (Hassan et al., 2020), reducing its water retention capacity and inhibiting crop water uptake.
Additionally, high pyrolysis temperatures may cause excessive release of soluble nutrients, which can suppress photosynthetic capacity and decrease nutrient use efficiency (Gao et al., 2021). The application of biochar can significantly increase organic carbon content (Dong et al., 2016), demonstrating a compensatory effect in nutrient-deficient soils (Zhang et al., 2024), thereby enhancing nutrient efficiency and biomass in plants (Han et al., 2023). Furthermore, application rates exceeding 20 t ha-1 may inhibit soil microbial activity, negatively impacting dry matter accumulation and water and nutrient uptake and increasing input costs (Table 3). In summary, maintaining a moderate pyrolysis temperature (500°C) and an appropriate application rate (20 t ha-1) can maximize potato water and nutrient use efficiency and crop quality.
4.3 Effects of different pyrolysis temperatures and application rates on soil nitrate nitrogen, available phosphorus, and available potassium accumulation
Drought stress can inhibit potato plants’ nutrient absorption, leading to excessive nutrient residues in the soil (Rea et al., 2022). Research has shown that biochar can promote effective nutrient absorption while reducing nutrient residues and soil nutrient loss, decreasing the risk of nutrient leaching and groundwater contamination (El-Naggar et al., 2019). Our study found that as the pyrolysis temperature of biochar increases, soil NO3-N content initially decreases and then increases (Figure 4). This may be due to the larger specific surface area of biochar produced at higher temperatures, which provides more adsorption sites and spaces for nutrients, allowing for more effective adsorption of soil NO3-N (Zhang et al., 2021). However, excessively high pyrolysis temperatures significantly enhance the hydrophobicity of biochar surfaces, weakening their contact with NO3-N through hydrogen bonding (Sochacki et al., 2024).
Furthermore, applying high-temperature biochar may promote the decomposition of organic matter in the soil, releasing more ammonium nitrogen. As the supply of ammonium nitrogen increases, nitrifying bacteria convert more ammonium nitrogen into nitrate nitrogen, increasing soil nitrate nitrogen content (Dong et al., 2016). Under the same pyrolysis temperature conditions, the accumulation of soil nitrate nitrogen gradually decreases with increasing biochar application rates, primarily due to the strong adsorption capacity of the biochar itself (Mehmood et al., 2022). Additionally, the porous structure and larger specific surface area of biochar slow down the release of nutrient fertilizers (Das and Ghosh, 2023).
Our study found that the adequate phosphorus in the soil increased and then decreased with rising biochar pyrolysis temperatures, which is consistent with the findings of Khadem et al. (2021) (Figure 4). This may be because, as pyrolysis temperature increases, the volatile components of biochar decrease, pore size decreases, and porosity and specific surface area increase (Saghir et al., 2022). The porous structure of biochar provides a suitable habitat for microorganisms such as phosphate-solubilizing bacteria, which can help dissolve insoluble phosphates in the soil (Lu et al., 2023). However, despite the increased input of phosphorus from high-temperature biochar (700°C), the adequate phosphorus in the soil decreased. This may be due to the soil’s inability to effectively absorb the phosphorus added from biochar or the reaction of sufficient calcium in the soil with phosphorus, leading to its fixation and reduced availability (Lu et al., 2023). The trend in soil-effective potassium changes similarly to that of adequate phosphorus. This may be because, at lower pyrolysis temperatures, biochar retains more soluble potassium. When the pyrolysis temperature is moderate (500°C), potassium is more easily released from biochar into the soil, resulting in increased effective potassium content. However, as the pyrolysis temperature rises further, the mineral structure of biochar may change, particularly regarding potassium-related compounds, which may undergo chemical transformations to form less soluble or less available mineral forms, leading to a decrease in effective potassium content in the soil (Bilias et al., 2023). Gao et al. (2018) demonstrated that the soil’s adequate phosphorus and potassium levels increased with higher biochar application rates. Our study also found similar results (Figure 4). This is partly due to the inherent phosphorus and potassium content in biochar, which can be released into the soil; on the other hand, biochar’s high adsorption capacity not only helps retain phosphorus and potassium in the soil but also reduces the risk of these nutrients being lost due to leaching during rainfall or irrigation.
4.4 Multi-objective evaluation optimization
Many studies rely solely on subjective or objective single techniques to evaluate a particular indicator, lacking a comprehensive assessment of multiple indicators. Therefore, to overcome the shortcomings of previous research that only considers a single weight or a simple combination of subjective and objective weights, this study coordinated the impact of various indicators on the comprehensive benefits of potatoes. Firstly, this study employed the Analytic Hierarchy Process (AHP) and the Entropy Method to determine the factors and weights for economic, quality, water and fertilizer utilization efficiency, and environmental benefits of potatoes (S9 and S10). Subsequently, using principles of fuzzy mathematics, a multi-level fuzzy comprehensive evaluation was performed on the weights (Supplementary Table S13), concluding that the CK treatment in 2023 and the C2T2 treatment in 2024 were more beneficial for enhancing comprehensive benefits. In determining the weight indicators, this study considered the actual interests of local farmers, which resulted in a higher weight assigned to economic benefit indicators. Additionally, since biochar was only applied in the first year of the experiment, a high application rate significantly reduced the overall benefit value in the first year due to high costs. However, from a sustainable development perspective, the optimal treatment of C2T2 obtained through multi-level fuzzy comprehensive evaluation holds practical significance for actual production.
Moreover, existing research typically reflects the optimal treatment effects obtained under specific experimental conditions (Wang et al., 2021; Keabetswe et al., 2019). However, due to time and cost constraints, field experiments often involve a limited number of treatments, leading to insufficient accuracy and detail in the comprehensive evaluation results, which restricts a thorough understanding of treatment effects. To address this issue, we established a binary quadratic surface regression model for biochar pyrolysis temperature and potato application rates based on the evaluation results (Figure 5). Through model simulations, we found that combining pyrolysis temperatures between 400–500°C and application rates of 18–20 t ha-1 achieves the best multi-objective comprehensive outcomes.
5 Conclusions
1. Appropriate biochar pyrolysis temperature and application rate significantly promoted potato growth, enhanced the uptake and accumulation of nitrogen, phosphorus, and potassium, improved water use efficiency (WUE) and partial factor productivity (PFP), increased starch and vitamin C contents, and reduced the content of reducing sugars, thereby achieving a coordinated improvement in both potato yield and tuber quality.
2. Soil nutrient accumulation patterns varied across treatments: nitrate nitrogen accumulation was lowest under C3T2, available phosphorus under C1T3, and available potassium under CK. Notably, the optimal values for different indicators were not achieved under the same biochar pyrolysis temperature and application rate.
3. Multi-objective optimization using the Analytic Hierarchy Process (AHP), entropy weight method, and fuzzy comprehensive evaluation indicated that the C2T2 treatment achieved the best balance among high yield, quality, efficiency, and environmental benefits. A fitted model based on the results of the multi-level fuzzy comprehensive evaluation, combined with practical management considerations, showed that the optimal biochar pyrolysis temperature and application rate were 400–500 °C and 18–20 t·ha-1, respectively.
These findings provide a scientific basis and practical guidance for the rational application of biochar in potato farmland in the arid and semi-arid regions of northern China.
Data availability statement
The original contributions presented in the study are included in the article/Supplementary Material. Further inquiries can be directed to the corresponding authors.
Author contributions
JG: Conceptualization, Data curation, Software, Writing – original draft. HZ: Conceptualization, Formal analysis, Supervision, Writing – review & editing. LJ: Funding acquisition, Supervision, Visualization, Writing – review & editing. YW: Conceptualization, Funding acquisition, Supervision, Writing – review & editing. MF: Supervision, Validation, Writing – review & editing. MW: Conceptualization, Data curation, Formal analysis, Writing – review & editing. PL: Methodology, Software, Writing – review & editing. ZS: Data curation, Software, Writing – review & editing.
Funding
The author(s) declare that financial support was received for the research and/or publication of this article. This work was supported by the National Natural Science Foundation of China (32160511), Basic Scientific Research Funds for universities in Inner Mongolia (BR 22-13-01) and the Interdisciplinary Fund Project of Inner Mongolia Agricultural University:BR241401
Conflict of interest
The authors declare that the research was conducted in the absence of any commercial or financial relationships that could be construed as a potential conflict of interest.
Generative AI statement
The author(s) declare that no Generative AI was used in the creation of this manuscript.
Publisher’s note
All claims expressed in this article are solely those of the authors and do not necessarily represent those of their affiliated organizations, or those of the publisher, the editors and the reviewers. Any product that may be evaluated in this article, or claim that may be made by its manufacturer, is not guaranteed or endorsed by the publisher.
Supplementary material
The Supplementary Material for this article can be found online at: https://www.frontiersin.org/articles/10.3389/fpls.2025.1571305/full#supplementary-material
References
Abukari, A., Kaba, J. S., Dawoe, E., and Abunyewa, A. A. (2022). A comprehensive review of the effects of biochar on soil physicochemical properties and crop productivity. Waste Disposal Sustain. Energy 4, 343–359. doi: 10.1007/s42768-022-00114-2
Agegnehu, G., Srivastava, A. K., and Bird, M. I. (2017). The role of biochar and biochar-compost in improving soil quality and crop performance: A review. Appl. Soil Ecol. 119, 156–170. doi: 10.1016/j.apsoil.2017.06.008
Alkharabsheh, H. M., Seleiman, M. F., Battaglia, M. L., Shami, A., Jalal, R. S., Alhammad, B. A., et al. (2021). Biochar and its broad impacts in soil quality and fertility, nutrient leaching and crop productivity: A review. Agronomy 11, 993. doi: 10.3390/agronomy11050993
Ayaz, M., Feizienė, D., Tilvikienė, V., Akhtar, K., Stulpinaitė, U., and Iqbal, R. (2021). Biochar role in the sustainability of agriculture and environment. Sustainability 13, 1330. doi: 10.3390/su13031330
Bao, S. D. (2000). Soil and Agricultural Chemistry Analysis (Beijing, China: China Agriculture Press).
Bilias, F., Kalderis, D., Richardson, C., Barbayiannis, N., and Gasparatos, D. (2023). Biochar application as a soil potassium management strategy: A review. Sci. Total Environ. 858, 159782. doi: 10.1016/j.scitotenv.2022.159782
Brtnicky, M., Datta, R., Holatko, J., Bielska, L., Gusiatin, Z. M., Kucerik, J., et al. (2021). A critical review of the possible adverse effects of biochar in the soil environment. Sci. Total Environ. 796, 148756. doi: 10.1016/j.scitotenv.2021.148756
Canton, H. (2021). “Food and agriculture organization of the United Nations—FAO,” in The Europa Directory of International Organizations 2021. Eds. Jones, B. S. and Smith, R. Z. (London and New York: Routledge), 297–305.
Cassman, K. G., Gines, G. C., Dizon, M. A., Samson, M. I., and Alcantara, J. M. (1996). Nitrogen use efficiency in tropical lowland rice systems: contributions from indigenous and applied nitrogen. Field Crops Res. 47, 1–12. doi: 10.1016/0378-4290(95)00101-8
Das, S. K. and Ghosh, G. K. (2023). Developing biochar-based slow-release NPK fertilizer for controlled nutrient release and its impact on soil health and yield. Biomass Conv. Biorefinery 13, 13051–13063. doi: 10.1007/s13399-021-02069-6
Das, S. K., Ghosh, G. K., Avasthe, R. K., and Sinha, K. (2021). Compositional heterogeneity of different biochar: effect of pyrolysis temperature and feedstocks. J. Environ. Manage. 278, 111501. doi: 10.1016/j.jenvman.2020.111501
Dey, S., Purakayastha, T. J., Sarkar, B., Rinklebe, J., Kumar, S., Chakraborty, R., et al. (2023). Enhancing cation and anion exchange capacity of rice straw biochar by chemical modification for increased plant nutrient retention. Sci. Total Environ. 886, 163681. doi: 10.1016/j.scitotenv.2023.163681
Dong, X., Guan, T., Li, G., Lin, Q., and Zhao, X. (2016). Long-term effects of biochar amount on the content and composition of organic matter in soil aggregates under field conditions. J. Soils Sediments 16, 1481–1497. doi: 10.1007/s11368-015-1338-5
Dong, L., Wang, J., Shen, M., Zhang, H., Wang, L., Li, C., et al. (2022). Biochar combined with nitrogen fertilizer affects soil properties and wheat yield in medium-low-yield farmland. Soil Use Manage. 38, 584–595. doi: 10.1111/sum.12712
El-Naggar, A., El-Naggar, A. H., Shaheen, S. M., Sarkar, B., Chang, S. X., Tsang, D. C. W., et al. (2019). Biochar composition-dependent impacts on soil nutrient release, carbon mineralization, and potential environmental risk: a review. J. Environ. Manage. 241, 458–467. doi: 10.1016/j.jenvman.2019.02.044
Faloye, O., Alatise, T., Ajayi, M. O., and Ewulo, A. E. (2019). Effects of biochar and inorganic fertiliser applications on growth, yield and water use efficiency of maize under deficit irrigation. Agric. Water Manage. 217, 128–136. doi: 10.1016/j.agwat.2019.02.044
Farhangi-Abriz, S., Torabian, S., Qin, R., Noulas, C., Lu, Y., and Gao, S. (2021). Biochar effects on yield of cereal and legume crops using meta-analysis. Sci. Total Environ. 775, 145869. doi: 10.1016/j.scitotenv.2021.145869
Gao, T., Gao, M., Peng, J., and Li, N. (2018). “Effects of different amount of biochar on nitrogen, phosphorus and potassium nutrients in soil,” in IOP Conf. Ser.: Mater. Sci. Eng, vol. 394. (Bristol, United Kingdom: IOP Publishing), 022043.
Gao, Y., Shao, G., Yang, Z., Zhang, K., Lu, J., Wang, Z., et al. (2021). Influences of soil and biochar properties and amount of biochar and fertilizer on the performance of biochar in improving plant photosynthetic rate: A meta-analysis. Eur. J. Agron. 130, 126345. doi: 10.1016/j.eja.2021.126345
Gao, J., Zhao, Y., Zhang, W., Sui, Y., Jin, D., Xin, W., et al. (2019). Biochar prepared at different pyrolysis temperatures affects urea-nitrogen immobilization and N2O emissions in paddy fields. PeerJ 7, e7027. doi: 10.7717/peerj.7027
Guo, Y. (1986). Farmland Water Conservancy. 3rd ed (Beijing, China (in Chinese: China Water Power Press).
Guo, J., Zheng, L., Li, Z., Zhou, X., and Zhang, Q. (2021). Effects of various pyrolysis conditions and feedstock compositions on the physicochemical characteristics of cow manure-derived biochar. J. Cleaner Prod. 311, 127458. doi: 10.1016/j.jclepro.2021.127458
Han, M., Zhang, J., Zhang, L., and Wang, Z. (2023). Effect of biochar addition on crop yield, water and nitrogen use efficiency: A meta-analysis. J. Clean. Prod. 420, 138425. doi: 10.1016/j.jclepro.2023.138425
Han, Y., Zhou, R., Geng, Z., Bai, J., Ma, B., and Fan, Z. (2020). A novel data envelopment analysis cross-model integrating interpretative structural model and analytic hierarchy process for energy efficiency evaluation and optimization modeling: application to ethylene industries. J. Clean. Prod. 246, 118965. doi: 10.1016/j.jclepro.2019.118965
Hassan, M., Liu, Y., Naidu, R., Parikh, S. J., Du, J., Qi, F., et al. (2020). Influences of feedstock sources and pyrolysis temperature on the properties of biochar and functionality as adsorbents: A meta-analysis. Sci. Total Environ. 744, 140714. doi: 10.1016/j.scitotenv.2020.140714
Ippolito, J. A., Cui, L., Kammann, C., Wrage-Mönnig, N., Estavillo, J. M., Fuertes-Mendizabal, T., et al. (2020). Feedstock choice, pyrolysis temperature and type influence biochar characteristics: a comprehensive meta-data analysis review. Biochar 2, 421–438. doi: 10.1007/s42773-020-00067-x
Iqbal, M. T., Ortaş, I., Ahmed, I. A., Isik, M., and Islam, M. S. (2019). Rice straw biochar amended soil improves wheat productivity and accumulated phosphorus in grain. J. Plant Nutr. 42, 1605–1623. doi: 10.1080/01904167.2019.1628986
Janu, R., Mrlik, V., Ribitsch, D., Hofman, J., Sedláček, P., Bielská, L., et al. (2021). Biochar surface functional groups as affected by biomass feedstock, biochar composition and pyrolysis temperature. Carbon Resour. Conversion 4, 36–46. doi: 10.1016/j.crcon.2021.01.003
Jia, Y., Hu, Z., Ba, Y., and Qi, W. (2021). Application of biochar-coated urea controlled loss of fertilizer nitrogen and increased nitrogen use efficiency. Chem. Biol. Technol. Agric. 8, 1–11. doi: 10.1186/s40538-020-00205-4
Jiao, W., Du, R., Ye, M., Sun, M., Feng, Y., Wan, J., et al. (2018). ‘Agricultural Waste to Treasure’–Biochar and eggshell to impede soil antibiotics/antibiotic resistant bacteria (genes) from accumulating in Solanum tuberosum L. Environ. pollut. 242, 2088–2095. doi: 10.1016/j.envpol.2018.06.059
Kapoor, A., Sharma, R., Kumar, A., and Sepehya, S. (2022). Biochar as a means to improve soil fertility and crop productivity: A review. J. Plant Nutr. 45, 2380–2388. doi: 10.1080/01904167.2022.2027980
Keabetswe, L., Shao, G. C., Cui, J., Lu, J., and Stimela, T. (2019). A combination of biochar and regulated deficit irrigation improves tomato fruit quality: A comprehensive quality analysis. Folia Hortic. 31, 181–193. doi: 10.2478/fhort-2019-0013
Khadem, A. and Raiesi, F. (2017). Influence of biochar on potential enzyme activities in two calcareous soils of contrasting texture. Geoderma 308, 149–158. doi: 10.1016/j.geoderma.2017.08.004
Khadem, A., Raiesi, F., Besharati, H., and Khalaj, M. A. (2021). The effects of biochar on soil nutrients status, microbial activity and carbon sequestration potential in two calcareous soils. Biochar 2, 105–116. doi: 10.1007/s42773-020-00076-w
Khan, Z., Khan, M. N., Zhang, K., Luo, T., Zhu, K., and Hu, L. (2021a). The application of biochar alleviated the adverse effects of drought on the growth, physiology, yield and quality of rapeseed through regulation of soil status and nutrients availability. Ind. Crops Prod. 171, 113878. doi: 10.1016/j.indcrop.2021.113878
Khan, Z., Rahman, M. H. U., Haider, G., Amir, R., Ikram, R. M., Ahmad, S., et al. (2021b). Chemical and biological enhancement effects of biochar on wheat growth and yield under arid field conditions. Sustainability 13, 5890. doi: 10.3390/su13115890
Lehmann, J., Pereira da Silva, J., Steiner, C., Nehls, T., Zech, W., and Glaser, B. (2003). Nutrient availability and leaching in an archaeological Anthrosol and a Ferralsol of the Central Amazon basin: Fertilizer, manure and charcoal amendments. Plant Soil 249, 343–357. doi: 10.1023/a:1022833116184
Li, S., Harris, S., Anandhi, A., and Chen, G. (2019). Predicting biochar properties and functions based on feedstock and pyrolysis temperature: a review and data syntheses. J. Clean. Prod. 215, 890–902. doi: 10.1016/j.jclepro.2019.01.106
Liu, Y., Li, H., Hu, T., Mahmoud, A., Li, J., Zhu, R., et al. (2022). A quantitative review of the effects of biochar application on rice yield and nitrogen use efficiency in paddy fields: A meta-analysis. Sci. Total Environ. 830, 154792. doi: 10.1016/j.scitotenv.2022.154792
Liu, L., Tan, Z., Gong, H., and Huang, Q. (2018). Migration and transformation mechanisms of nutrient elements (N, P, K) within biochar in straw–biochar–soil–plant systems: a review. ACS Sustain. Chem. Eng. 7, 22–32. doi: 10.1021/acssuschemeng.8b04253
Lu, J., Liu, S., Chen, W., and Meng, J. (2023). Study on the mechanism of biochar affecting the effectiveness of phosphate solubilizing bacteria. World J. Microbiol. Biotechnol. 39, 87. doi: 10.1007/s11274-023-03533-3
Mahanjana, A. (2018). Examining links between soil fertility and various nutrient management regimes on yield and quality of sweet potato (Ipomoea batatas) (Doctoral dissertation) (Stellenbosch: Stellenbosch University).
Medyńska-Juraszek, A., Latawiec, A., Królczyk, J., Bogacz, A., Kawałko, D., Bednik, M., et al. (2021). Biochar improves maize growth but has a limited effect on soil properties: Evidence from a three-year field experiment. Sustainability 13, 3617. doi: 10.3390/su13073617
Mehmood, T., Khan, A. U., Dandamudi, K. P. R., Deng, S., Helal, M. H., Ali, H. M., et al. (2022). Oil tea shell synthesized biochar adsorptive utilization for the nitrate removal from aqueous media. Chemosphere 307, 136045. doi: 10.1016/j.chemosphere.2022.136045
Mokrani, K., Hamdi, K., and Tarchoun, N. (2018). Potato (Solanum tuberosum L.) response to nitrogen, phosphorus and potassium fertilization rates. Commun. Soil Sci. Plant Anal. 49, 1314–1330. doi: 10.1080/00103624.2018.1457159
Mollick, M. (2018). Effect of biochar on yield and quality of potato tuber (Dhaka: Doctoral dissertation, Department of Soil Science, Sher-e-Bangla Agricultural University), 1207.
Murtaza, G., Ahmed, Z., Usman, M., Tariq, W., Ullah, Z., Shareef, M., et al. (2021). Biochar induced modifications in soil properties and its impacts on crop growth and production. J. Plant Nutr. 44, 1677–1691. doi: 10.1080/01904167.2021.1871746
Oweis, T. Y., Farahani, H. J., and Hachum, A. Y. (2011). Evapotranspiration and water use of full and deficit irrigated cotton in the Mediterranean environment in northern Syria. Agric. Water Manage. 98, 1239–1248. doi: 10.1016/j.agwat.2011.02.009
Panchal, S. and Shrivastava, A. K. (2022). Landslide hazard assessment using analytic hierarchy process (AHP): A case study of National Highway 5 in India. Ain Shams Eng. J. 13, 101626. doi: 10.1016/j.asej.2021.10.021
Purakayastha, T. J., Bera, T., Bhaduri, D., Sarkar, B., Mandal, S., Wade, P., et al. (2019). A review on biochar modulated soil condition improvements and nutrient dynamics concerning crop yields: Pathways to climate change mitigation and global food security. Chemosphere 227, 345–365. doi: 10.1016/j.chemosphere.2019.03.170
Rea, R. S., Islam, M. R., Rahman, M. M., Nath, B., and Mix, K. (2022). Growth, nutrient accumulation, and drought tolerance in crop plants with silicon application: a review. Sustainability 14, 4525. doi: 10.3390/su14084525
Rehman, A., Arif, M. S., Tufail, M. A., Shahzad, S. M., Farooq, T. H., Ahmed, W., et al. (2021). Biochar potential to relegate metal toxicity effects is more soil driven than plant system: A global meta-analysis. J. Clean. Prod. 316, 128276. doi: 10.1016/j.jclepro.2021.128276
Saghir, S., Pu, C., Fu, E., Wang, Y., and Zao, Z. (2022). Synthesis of high surface area porous biochar obtained from pistachio shells for the efficient adsorption of organic dyes from polluted water. Surf. Interfaces 34, 102357. doi: 10.1016/j.surfin.2022.102357
Semida, W. M., Beheiry, H. R., Sétamou, M., Simpson, C. R., Abd El-Mageed, T. A., Rady, M. M., et al. (2019). Biochar implications for sustainable agriculture and environment: A review. South Afr. J. Bot. 127, 333–347. doi: 10.1016/j.sajb.2019.11.015
Singh, H., Northup, B. K., Rice, C. W., and Prasad, P. V. (2022). Biochar applications influence soil physical and chemical properties, microbial diversity, and crop productivity: A meta-analysis. Biochar 4, 8. doi: 10.1007/s42773-022-00138-1
Sochacki, A., Lebrun, M., Minofar, B., Pohořelý, M., Vithanage, M., Sarmah, A. K., et al. (2024). Adsorption of common greywater pollutants and nutrients by various biochars as potential amendments for nature-based systems: Laboratory tests and molecular dynamics. Environ. pollut. 343, 123203. doi: 10.1016/j.envpol.2023.123203
Suthar, R. G., Wang, C., Nunes, M. C. N., Chen, J., Sargent, S. A., Bucklin, R. A., et al. (2018). Bamboo biochar pyrolyzed at low temperature improves tomato plant growth and fruit quality. Agriculture 8, 153. doi: 10.3390/agriculture8100153
Tang, J., Zhang, S., Zhang, X., Chen, J., He, X., and Zhang, Q. (2020). Effects of pyrolysis temperature on soil-plant-microbe responses to Solidago canadensis L.-derived biochar in coastal saline-alkali soil. Sci. Total Environ. 731, 138938. doi: 10.1016/j.scitotenv.2020.138938
Tanure, M. M. C., da Costa, L. M., Huiz, H. A., Fernandes, R. B. A., Cecon, P. R., Junior, J. D. P., et al. (2019). Soil water retention, physiological characteristics, and growth of maize plants in response to biochar application to soil. Soil Tillage Res. 192, 164–173. doi: 10.1016/j.still.2019.05.007
Tomczyk, A., Sokołowska, Z., and Boguta, P. (2020). Biochar physicochemical properties: pyrolysis temperature and feedstock kind effects. Rev. Environ. Sci. Bio/Technol. 19, 191–215. doi: 10.1007/s11157-020-09523-3
Wang, H., Chen, S., Liu, H., Li, J., uz Zaman, Q., Sultan, K., et al. (2023). Maize straw biochar can alleviate heavy metals stress in potato by improving soil health. South Afr. J. Bot. 162, 391–401. doi: 10.1016/j.sajb.2023.09.024
Wang, H., Cheng, M., Zhang, S., Fan, J., Feng, H., Zhang, F., et al. (2021). Optimization of irrigation amount and fertilization rate of drip-fertigated potato based on Analytic Hierarchy Process and Fuzzy Comprehensive Evaluation methods. Agric. Water Manage. 256, 107130. doi: 10.1016/j.agwat.2021.107130
Wang, H., Wang, X., Bi, L., Wang, Y., Fan, J., Zhang, F., et al. (2019). Multi-objective optimization of water and fertilizer management for potato production in sandy areas of northern China based on TOPSIS. Field Crops Res. 240, 55–68. doi: 10.1016/j.fcr.2019.06.005
Watson, D. J. (1947). Comparative physiological studies in the growth of field crops. I: variation in net assimilation rate and leaf area between species and varieties, and within and between years. Ann. Bot. 11, 41–76. doi: 10.1093/oxfordjournals.aob.a083148
Wu, L., Li, L., Zhong, M., and Fan, M. (2022). Improving potato yield, water productivity and nitrogen use efficiency by managing irrigation based on potato root distribution. Int. J. Plant Prod. 16, 547–555. doi: 10.1007/s42106-022-00205-4
Xi, J., Li, H., Tan, S., Zheng, J., and Tan, Z. (2020). Effect of returning biochar from different pyrolysis temperatures and atmospheres on the growth of leaf-used lettuce. Environ. Sci. pollut. Res. 27, 35802–35813. doi: 10.1007/s11356-020-09840-8
Xiang, L., Liu, S., Ye, S., Yang, H., Song, B., Qin, F., et al. (2021). Potential hazards of biochar: The negative environmental impacts of biochar applications. J. Hazard. Mater. 420, 126611. doi: 10.1016/j.jhazmat.2021.126611
Xiao, C., Zou, H., Fan, J., Zhang, F., Li, Y., Sun, S., et al. (2021). Optimizing irrigation amount and fertilization rate of drip-fertigated spring maize in northwest China based on multi-level fuzzy comprehensive evaluation model. Agric. Water Manage. 257, 107157. doi: 10.1016/j.agwat.2021.107157
Yan, F., Zhang, F., Fan, X., Fan, J., Wang, Y., Zou, H., et al. (2021). Determining irrigation amount and fertilization rate to simultaneously optimize grain yield, grain nitrogen accumulation and economic benefit of drip-fertigated spring maize in northwest China. Agric. Water Manag. 243, 106440. doi: 10.1016/j.agwat.2020.106440
Yan, S., Zhang, S., Yan, P., and Aurangzeib, M. (2022). Effect of biochar application method and amount on the soil quality and maize yield in Mollisols of Northeast China. Biochar 4, 56. doi: 10.1007/s42773-022-00180-z
Yang, W., Feng, G., Jia, Y., Yang, Y., Gao, X., Gao, L., et al. (2022). Impact of single biochar application on maize growth and water-fertilizer productivity under different irrigation regimes. Front. Plant Sci. 13, 1006827. doi: 10.3389/fpls.2022.1006827
Youssef, M. E. S., Al-Easily, I. A. S., and Nawar, D. A. S. (2017). Impact of biochar addition on productivity and tubers quality of some potato cultivars under sandy soil conditions. Egypt. J. Horticult. 44, 199–217. doi: 10.21608/ejoh.2018.2149.1030
Yu, H., Zou, W., Chen, J., Chen, H., Yu, Z., Huang, J., et al. (2019). Biochar amendment improves crop production in problem soils: A review. J. Environ. Manage. 232, 8–21. doi: 10.1016/j.jenvman.2018.10.117
Zhang, K., Khan, Z., Khan, M. N., Luo, T., Luo, L., Bi, J., et al. (2024). The application of biochar improves the nutrient supply efficiency of organic fertilizer, sustains soil quality and promotes sustainable crop production. Food Energy Secur. 13 (1), e520. doi: 10.1002/fes3.520
Zhang, S., Fan, J., Zhang, F., Wang, H., Yang, L., Sun, X., et al. (2022). Optimizing irrigation amount and potassium rate to simultaneously improve tuber yield, water productivity and plant potassium accumulation of drip-fertigated potato in northwest China. Agric. Water Manag. 264, 107493. doi: 10.1016/j.agwat.2022.107493
Zhang, Y., Wang, J., and Feng, Y. (2021). The effects of biochar addition on soil physicochemical properties: A review. Catena 202, 105284. doi: 10.1016/j.catena.2021.105284
Keywords: biochar, pyrolysis temperature, potato, optimization, soil nutrient residues, comprehensive model
Citation: Guo J, Zhou H, Jia L, Wang Y, Fan M, Wang M, Liu P and Shang Z (2025) A multi-level fuzzy comprehensive evaluation model to optimize biochar application schemes for potato cultivation in North China. Front. Plant Sci. 16:1571305. doi: 10.3389/fpls.2025.1571305
Received: 05 February 2025; Accepted: 13 May 2025;
Published: 05 June 2025.
Edited by:
Amita Shakya, Amity University, IndiaReviewed by:
Jinping Zhao, Texas A and M University, United StatesChangjian Li, Institute of Soil and Water Conservation Northwest A & F University, China
Copyright © 2025 Guo, Zhou, Jia, Wang, Fan, Wang, Liu and Shang. This is an open-access article distributed under the terms of the Creative Commons Attribution License (CC BY). The use, distribution or reproduction in other forums is permitted, provided the original author(s) and the copyright owner(s) are credited and that the original publication in this journal is cited, in accordance with accepted academic practice. No use, distribution or reproduction is permitted which does not comply with these terms.
*Correspondence: Liguo Jia, bm5kamlhbGlndW9AMTYzLmNvbQ==; Yongqiang Wang, d2FuZ3lvbmdxaWFuZ0Bud2FmdS5lZHUuY24=