 Zhao Yan Hao1,2†Qian Feng1†Xu Yan Man3†Dong Qi Qi4Yu Shi Qing1Zhai Wei Yang1
 Mohssen Elbagory5Esam Sayed Kasem6
 Muhammad Yasir7*Jiang Yu Rong1*
- 1College of Advanced Agricultural Science, Zhejiang Agriculture and Forestry University, Hangzhou, China
- 2Agricultural Extension Department, Tonglu County Agricultural Technology Extension Center, Hangzhou, China
- 3Jixian Honors College, Zhejiang Agriculture and Forestry University, Hangzhou, China
- 4Financial Management Office of Sixi Town People's Government, Taishun County, Wenzhou, Zhejiang, China
- 5Health Specialties, Basic Sciences and Applications Unit, Applied College, King Khalid University, Mohail Assir, Saudi Arabia
- 6Soil, Water and Environment Research Institute, Agriculture Research Center, Giza, Egypt
- 7College of Tea Science and Tea Culture, Zhejiang Agriculture and Forestry University, Hangzhou, China
Heat shock proteins 90 (HSP90s) are conserved molecular chaperones essential for cellular homeostasis under abiotic stress. While several studies have been reported to elucidate the role of HSP90s in heat stress responses in cotton, their involvement in salt stress remains underexplored. Gossypium hirsutum L. is highly susceptible to salt stress. The Current study investigated the evolutionary aspects, expression patterns, and functional validation of HSP90 family members in cotton under salt stress. A comprehensive genomic analysis of G. hirsutum, G. raimondii, and G. arboreum, identified 56 HSP90 genes which were classified into three distinct phylogenetic groups. Gene structure and motifs analysis revealed a conserved nature of HSP90s within each group. Additionally, cis-acting elements suggested the potential roles of HSP90s in biotic and abiotic stresses. The Ka/Ks ratio of all genes was < 1 suggesting negative and purifying selection pressure during molecular evolution. Expression analysis demonstrated the potential role of HSP90 genes in salt tolerance. Notably, out of ten HSP90 genes five genes exhibited highly differential expression under salt stress, as confirmed by qRT-PCR analysis. Moreover, virus-induced silencing of the two salt stress-responsive genes, Ghir_D03G016230 and Ghir_D02G013530, which were upregulated under salt stress, resulted in a significant decrease in SOD, POD, and CAT, accompanied by a marked increase in MDA content in the salt-tolerant cotton cultivar. These findings provide novel insights into the functional roles of HSP90s in G. hirsutum under salt stress.
Introduction
Plants have evolved intricate mechanisms to survive abiotic stresses, including heat and salinity. These include stress avoidance, osmotic adjustment, antioxidant defense, stress signaling, symbiotic association, and epigenetic regulation. Rather than working independently, these mechanisms function in a coordinated way to improve plant resilience. For example, stress avoidance strategies like stomata closure and dormancy alongside stress tolerance mechanisms such as osmolyte accumulation and antioxidant production synergistically mitigate the effects of abiotic stress (Bandurska, 2022). Symbiotic association with endophytic fungi improves stress tolerance by inducing physiological and molecular changes in host plants (Rodriguez et al., 2008). Stress signaling, involving hormones like salicylic acid and abscisic acid modulates stress-responsive genes leading to the activation of various tolerance mechanisms simultaneously (Khan et al., 2015; Sha Valli Khan et al., 2014; Yasir et al., 2019). Epigenetic regulation through DNA methylation, histone modifications, and small RNAs further fine-tune gene expressions. These coordinated mechanisms suggest shared regulatory pathways and cross-talk between stress responses.
Among various molecular players mediating stress responses, heat shock proteins (HSP90) are critical. The HSP90 supports stress signaling pathways and assists in the proper functioning of stress-induced proteins. Recent studies have unraveled the potential of HSP90 family genes as targets for improving stress tolerance in crops, including cotton, which is susceptible to salinity. While heat shock protein (HSP) families are primarily involved in heat stress response, growing evidence suggests their involvement in salt tolerance as well. For instance, overexpression of ZmHsf01 and OsHsp20 in Arabidopsis thaliana enhanced tolerance to both heat and salt stress (Huang et al., 2022). Similarly, the maize gene ZmHsf11 negatively regulates heat stress tolerance by modulating oxidative stress-related genes, which are also implicated in salt stress response (Qin et al., 2022). Moreover, genes like OsRCI2–10 and PGR5, upregulated in salt-tolerant rice genotypes, are annotated for abiotic stress response, indicating their potential roles in both salt and heat tolerance (Razzaque et al., 2019). The Na+/H+ antiporter NHX1, known for salt tolerance by sequestering Na+ ions in vacuoles, also improves thermotolerance (Trono and Pecchioni, 2022). These findings highlight the existence of shared genetic networks and cross-tolerance mechanisms. When stimulated by various factors such as heat, plants produce highly conserved proteins known as heat shock proteins (HSPs) (Hsu et al., 2003; Queitsch et al., 2002; Robert, 2003). HSPs are well-characterized proteins that function as molecular chaperones, ensuring the proper folding and protection of cellular proteins (King & MacRae, 2015). HSPs have been identified across plants and animals (Xiong and Ishitani, 2006). These proteins have been categorized into several families based on their molecular weights, including the HSP100/ClpB family, HSP90 family, HSP70/DnaK family, chaperonin (HSP60/GroEL) family, and small heat-shock proteins (sHSP) family (Al-Whaibi, 2011; Caplan et al., 2003; Pratt and Toft, 2003; Wang et al., 2004).
The HSP90 gene family was initially discovered in Drosophila with a single gene, Hsp82. HSP90 chaperones are expressed constitutively in most organisms under normal conditions, however their expression increases significantly under stress. HSP90, as a class of chaperones, is involved in DNA repair, substrate activation, and initial stress signaling (Lachowiec et al., 2014; Shinozaki et al., 2006; Zuehlke and Johnson, 2010). It functions to prevent protein aggregation and facilitates the refolding of inactive proteins in both normal and stress conditions (Picard, 2002). When plants are exposed to stress, the upregulated HSP90 interacts with non-proteinaceous substances, repairing deformed proteins (Mukhopadhyay et al., 2003). HSP90 is highly expressed in plant cells, constituting about 1-2% of total protein in the cytoplasm, and is characterized by conserved amino acid sequences (Prasinos et al., 2004). HSP90 consists of three domains: an N-terminal ATP-binding motif, a middle domain, and a C-terminal domain (CTD) responsible for HSP90 dimerization. This protein family acts as a mediator in plant abiotic stress signal pathways however, the underlying mechanisms remain unclear (Liu and Ekramoddoullah, 2006).
Although the HSP90 protein is well studied in heat tolerance in, however, due to the integrated mechanism of stress tolerance in plants we hypothesized that this protein family has a potential role in salt tolerance in upland cotton. Previous studies identified 9, 7, and 21 HSP90 genes in Oryza sativa, Arabidopsis thaliana, and Nicotiana tabacum, respectively (Hu et al., 2009; Krishna and Gloor, 2001). To the best of our knowledge, no genome-wide study has yet explored the role of the HSP90 protein family in cotton under salt stress. Upland cotton is an important commercial crop that provides feed and food for animals and humans, and lint for the textile industry (Yasir et al., 2022). However, salt stress is one of the major challenges for sustainable cotton production. Therefore, breeding for salt tolerance is an important objective of cotton breeding. In this study, we conducted a genome-wide analysis of HSP90 family members, analyzing gene structures, evolutionary relationships, chromosomal locations, and conserved domains in detail using bioinformatics tools. Additionally, we investigated their expression patterns under salt stress through qRT-PCR and validated results through virus-induced gene silencing (VIGS), antioxidants scavenging enzymes (SOD, POD, CAT), and oxidative stress marker i.e., malondialdehyde (MDA). These results provide a foundation for understanding the genomic organization and functional role of the HSP90 gene family in G. hirsutum.
Materials and methods
Plant materials and stress treatments
Salt-tolerant cotton lines HNZ2019–2520 and salt-sensitive line HNZ2019-2521 were used for gene expression experiments. The seeds were surface sterilized with 10% sodium hypochlorite and three times rinsed with distilled water followed by planting in mixed soil (vermiculite: humus = 1:1) saturated with water, in trays in a greenhouse at 22°C with a 16 h/8 h (light/dark) photoperiod until complete unfolding of cotyledonary leaves. Seedlings were then shifted to hydroponic boxes and divided into two groups for control and salt treatment, each having three replications. Salt treatment of 300 mM NaCl (validated to cause significant stress in a pilot experiment) at two true leaf stages. Untreated control plants were grown normally. Samples were taken at 0, 3, 12, 24, and 48, hours post-treatment with three biological and three technical repeats. Leaf, stem, and root tissues were sampled to determine tissue-specific analyses. After collection, all samples were quickly frozen in liquid nitrogen and stored at −80°C for RNA isolation and downstream analysis like qRT-PCR, VIGS, and biochemical analysis. RNA-seq expression data of G. hirsutum accession TM-1 was retrieved from NCBI-Bioproject PRJNA490626 (Hu et al., 2019).
Identification of HSP90 genes
The Arabidopsis thaliana HSP90 protein sequences were retrieved from the TAIR databases (http://www.arabidopsis.org/) (Krishna and Gloor, 2001). The Oryza sativa and Triticum aestivum protein sequences were downloaded from NCBI (https://www.ncbi.nlm.nih.gov/) and G. hirsutum _HAU-AD1_v1.1 (TM-1), G. arboreum (A2) ‘SXY1’ genome CRI-updated_v1, and G. raimondii (D5) genome JGI_v2_a2.1 from cotton functional genomics database website (https://cottonfgd.net/). The Pfam (http://pfam.sanger.ac.uk/search) and SMART (http://smart.embl-heidelberg.de/) databases were employed to confirm each predicted HSP90 protein (Finn et al., 2015). Additional characteristics of HSP90 proteins, including amino acid (aa) or protein length and molecular weight (kDa), isoelectric points (pIs), grand average of hydropathy, and charge were analyzed using the Cotton Functional Genomic Database (http://www.cottonfgd.org/).
Phylogenetic analysis
Multiple sequence alignment of HSP90 was performed using ClustalW (Larkin et al., 2007). The MEGA 7.0 software was employed to construct an unrooted phylogenetic tree by the neighbor-joining (NJ) method (Kumar et al., 2016) with 1000 bootstraps for statistical reliability.
Chromosomal mapping of HSP90 family genes
The genomic locations of all HSP90 genes were obtained from the gff3 files of three cotton species available on the Cotton Functional Genomic Database (http://www.cottonfgd.org/). The TBtools software was employed to assess the chromosomal distribution and positions of HSP90 genes (Chen et al., 2020).
Gene structure motif analysis and sub-cellular localization of HSP90 family members
A diagrammatic sketch of the HSP90 gene structure was constructed using the Gene Structure Display Server (GSDS) (http://gsds.cbi.pku.edu.cn) (Hu et al., 2015) based on the alignment of the CDS with their corresponding genomic DNA sequences. The conserved motifs of the full length of HSP90 family proteins were analyzed using the online MEME tool (Multiple Expectation Maximization for Motif Elicitation, http://memesuite.org/tools/meme) (Bailey et al., 2006). The maximum motif search value was set at 10. Sub-cellular localization of proteins was determined using online bioinformatics tools Cell-Ploc (Chou and Shen, 2008), WoLF PSORT (Horton et al., 2007), and LocTree3 (Goldberg et al., 2014) with their protein sequences.
Quantitative RT-PCR expression analysis of HSP90 genes
Plant total RNA was extracted by the Total RNA Extraction Kit (R1200) (Beijing Solarbio Science & Technology Co., Ltd., Beijing, China). PrimeScript™ II 1st Strand cDNA Synthesis Kit (TAKARA, Dalian, China) was used for reverse transcription to obtain the first-strand cDNA for transcriptomic and RT qPCR analysis. The expression heatmap was visualized by TBtools. The fluorescent quantitative Taq Pro Universal SYBR qPCR Master Mix (Q712- 02) (Vazyme Biotech Co., Ltd, Nanjing China) kit was employed for the qRT-PCR reactions. The data were calculated according to the 2−ΔΔCT method (Livak and Schmittgen, 2001). According to the candidate gene sequence, a relatively specific primer for real-time fluorescence quantitative PCR was designed by Oligo 7 software Supplementary Table S1, and the amplification product was 150–300 bp (Rychlik 2007; Livak and Schmittgen, 2001).
Virus-induced gene silencing and stress treatment
The plasmid TRV2 (pYL156) and TRV1 (pYL192) were employed for VIGS (Supplementary Figure 1). The VIGS sequence was obtained using the SGN VIGS Tool (http://vigs.solgenomics.net/) and cloned into the TRV2 vector using the T4 DNA ligation cloning method. The lengths of the silencing fragments for Ghir_D03G016230 and Ghir_D02G013530 were 212 and 243 bp, respectively. The TRV-VIGS constructs were also transformed into A. tumefaciens strain GV3101. Then, strain GV3101, containing the different constructs of gene of interest, was infiltrated into 10-day-old cotton seedlings with fully expanded cotyledonary leaves according to the method described by Gao et al. (2011) TRV2:CLA1 (CLOROPLASTOS ALTERADOS 1) was utilized as the positive control and the empty vector TRV2:00 was the negative control (Gao et al., 2011). When the plants grew up to 2~3 true leaves stage they were shifted to hydroponic boxes. The primers list has been given in Supplementary Table S2. Two weeks after infection, the albino leaf phenotype appeared in plants transformed with the positive control gene CLA1. Subsequently, cotton plants containing TRV2: Ghir_D03G016230, TRV2: Ghir_D02G013530, and the negative control TRV2:00 were exposed to salt treatments at two true leaf stage with the same volume of water or salt solution (300 mM/L NaCl) (Supplementary Figure 2). The plants were observed and photographed during the treatment. Furthermore, the effect of gene silencing on SOD, POD, CAT, and MDA was observed.
Measurement of physiological indices
To determine the physiological indices variations, the candidate genes-silenced cotton leaves of the salt-tolerant cultivar were used to observe the activities of SOD, POD, CAT, and concentration of MDA after salt treatments. The SOD activity, CAT activity, and POD activities were detected according to the previous reports (Alici and Arabaci, 2016; Ullah et al., 2018). The MDA concentration was determined using thiobarbituric acid method (Schmedes and Hølmer, 1989). The absorbance was measured using a UV-2550 UV-vis spectrophotometer (SHIMADZU). Leaf relative water content and chlorophyl contents were measured as described in previous studies (Magwanga et al., 2019). All the samples were replicated three times.
Results
The assessment of salt tolerant and salt sensitive genotypes
The salt-tolerant and salt-sensitive genotypes were subjected to salt stress. The biochemical outcomes of SOD, POD, CAT, and MDA from different tissues such as leaf, root, and stem revealed that activities of SOD, POD, and CAT were significantly high in salt tolerant genotype however, the MDA expression was low in salt-tolerant and vice versa as shown in Figure 1. These results corroborated the findings of HNZ2019–2520 as salt tolerant genotype, which was further used for downstream experiments and validation results.
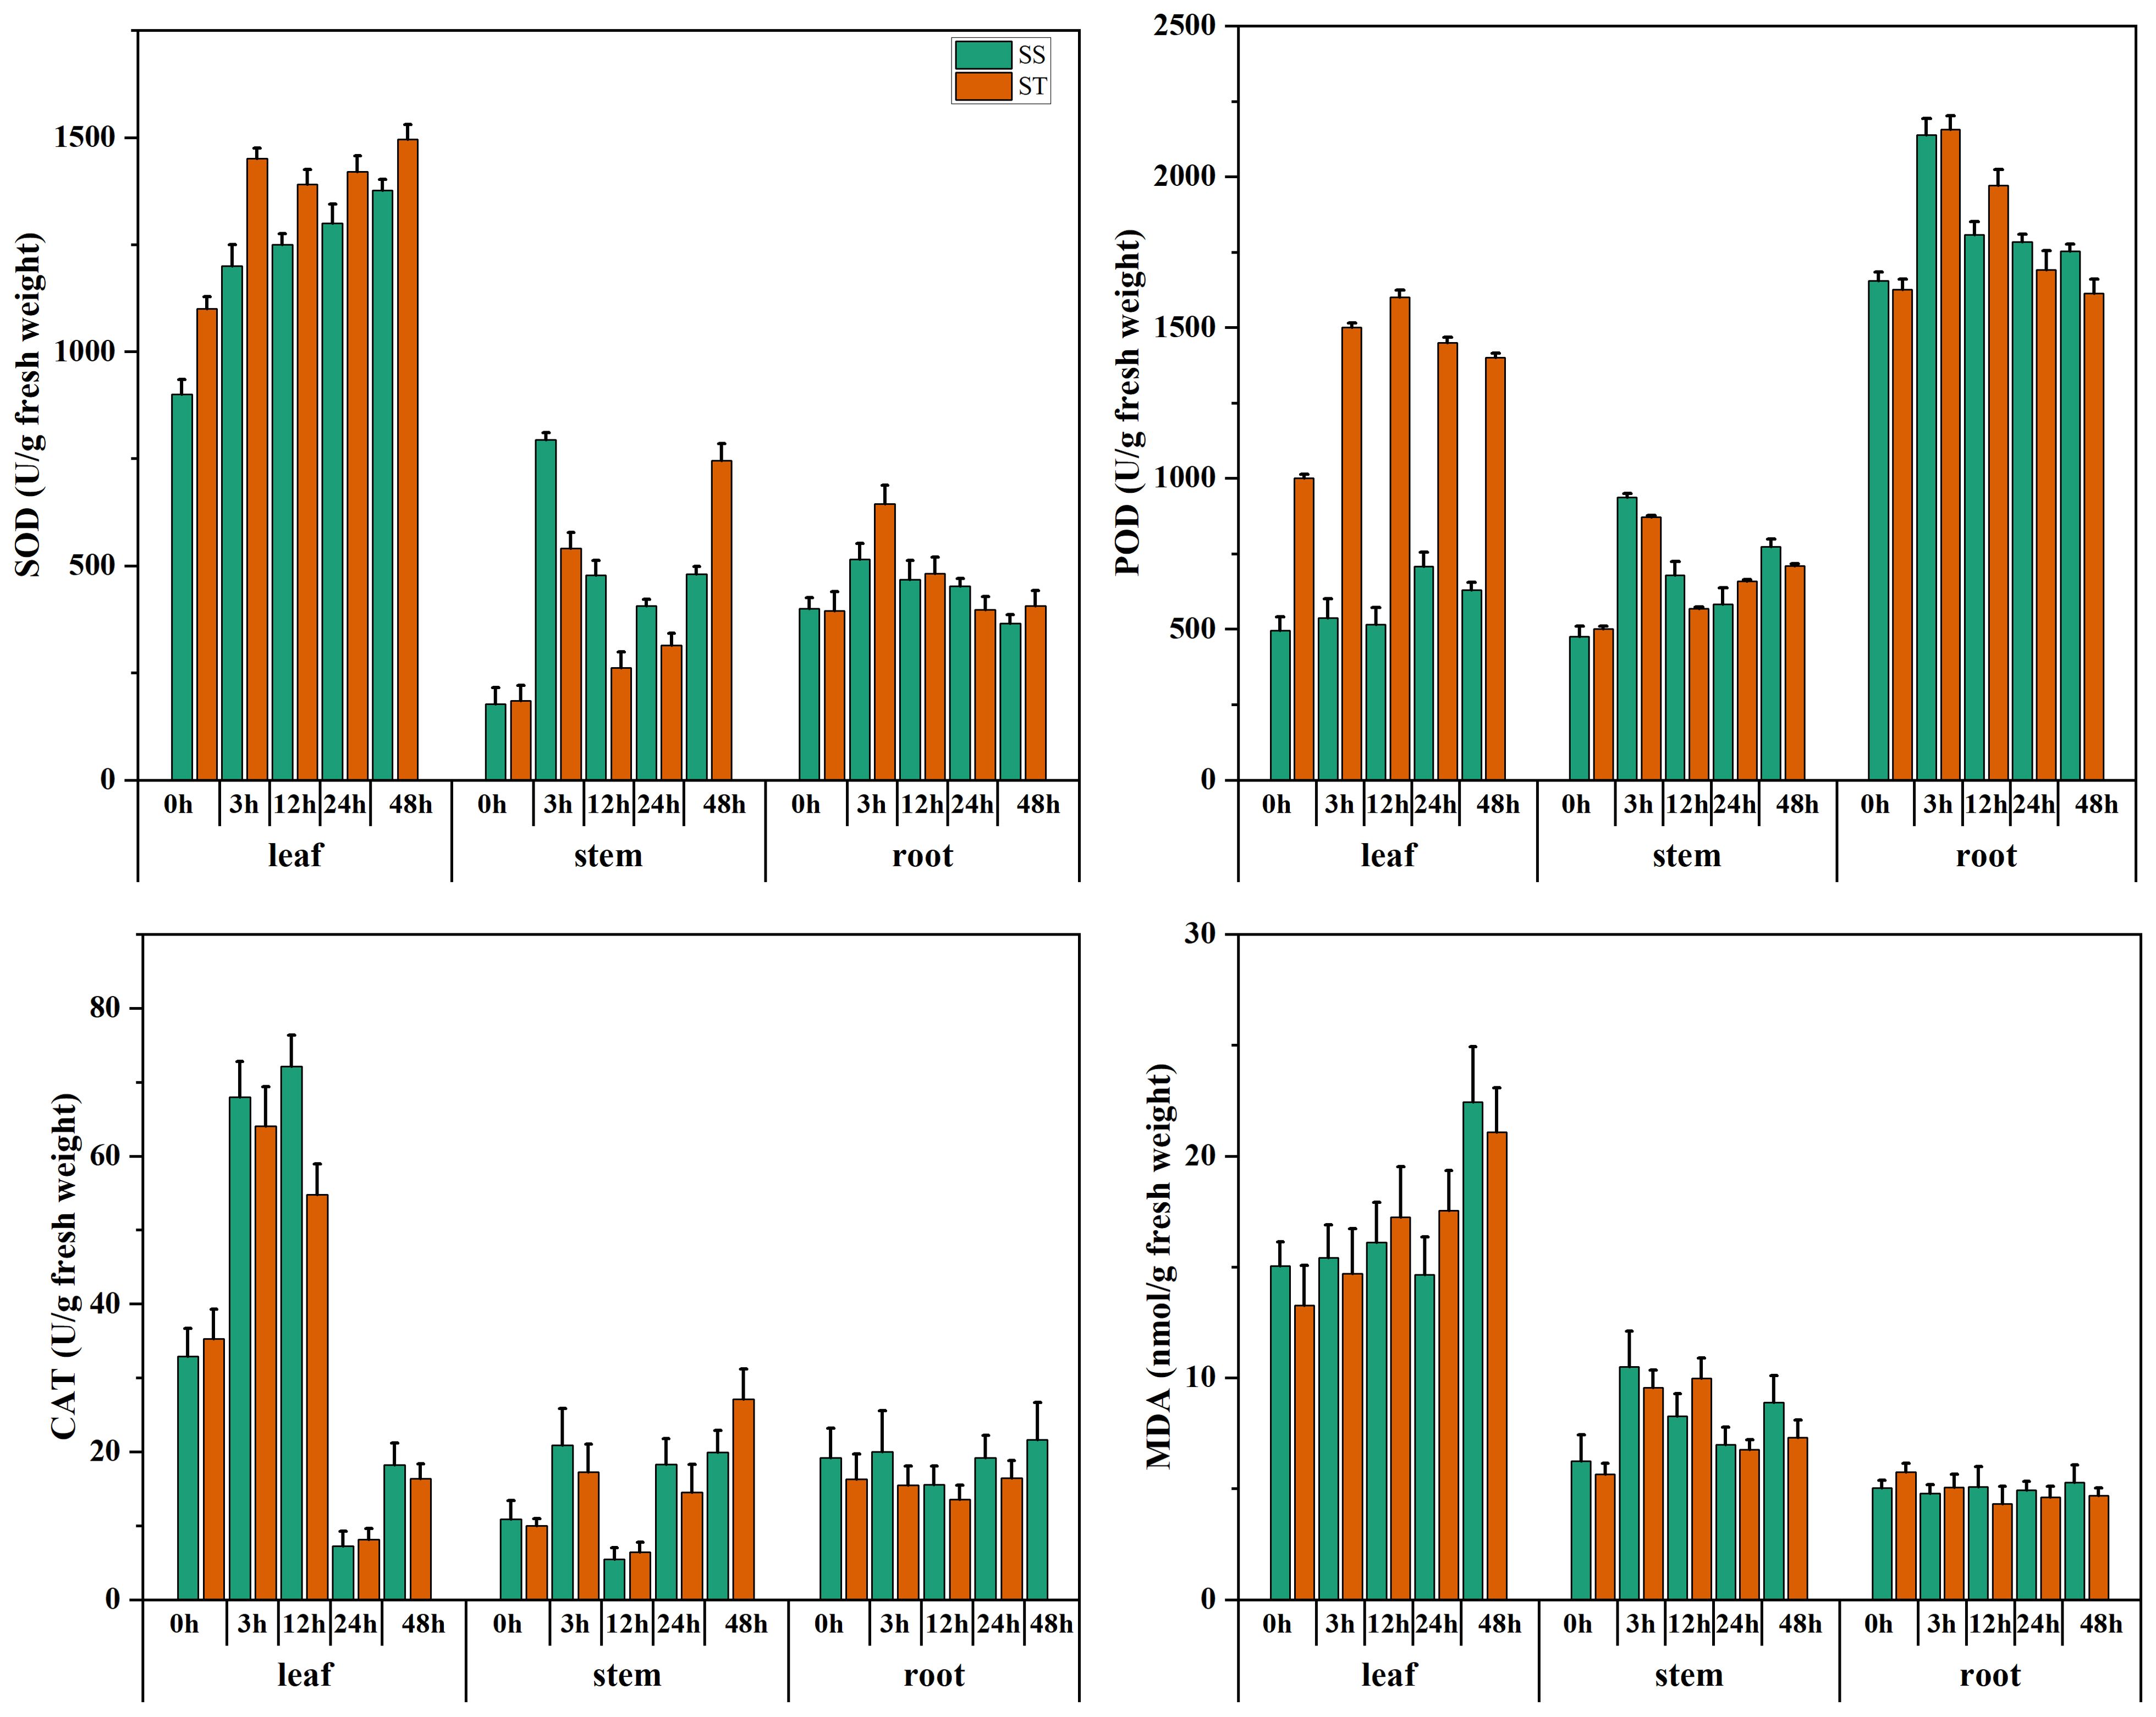
Figure 1. The assessment of salt tolerant and sensitive genotypes. The expression of SOD, POD, CAT and MDA of salt tolerant (ST) HNZ2019-2520, and salt sensitive (SS) HNZ2019-2521 genotypes. The red bar graph represents salt tolerant genotype whereas, green salt sensitive. Error bars represent the standard deviation of the triplicated data.
Genome-wide identification of HSP90 gene family members
A total of 28 G. hirsutum, 14 G. arboreum, and 14 G. raimondii genes were identified. The genomic, CDS, and protein features of the HSP90 genes of G. hirsutum were then identified, such as genomic length (bp), protein length (aa), CDS length (bp), locus ID with corresponding chromosome number, strand polarity, start and end points, predicted isoelectric points (PI), predicted masses, and protein molecular weights (MW), and charges as shown in Tables 1, 2. A comparative visualization of the protein length and molecular weight of HSP90 proteins has been shown in Figure 2. Retrieving the information of HSP90 genes revealed that Ga05G1968, which was detected on chromosome chr05 in G. arboreum, coded the smallest protein of 128 amino acids (aa), with a molecular weight of 14.527 kDa. Meanwhile, Gorai.010G003000, identified on chromosome chr10 in G. raimondii, coded the largest protein among all HSP90 members in three Gossypium species, having 1084 aa, with a molecular weight of 123.601 kDa as shown in Figure 2 and Table 2. The isoelectric point (PI) of the HSP90 genes ranged from 4.423 (Ghir_A05G018960) to 9.324 (Ghir_D11G023100). The theoretical isoelectric point of all the proteins except three proteins was > 7. Whereas, the grand average of hydropathy of all HSP90 proteins was negative. Moreover, in-silico analysis using Cell-Ploc, WoLF PSORT, and LocTree3 revealed that the highest number of genes were localized in the cytoplasm 26, 29, and 43 respectively, with the LocTree3 predicting the highest as given in Supplementary Table S4. Cell-Ploc and WoLF PSORT were significantly in agreement in terms of gene localization in the cytoplasm. The endoplasmic reticulum contained 14, 7, and 13 genes respectively, with WoLF PSORT predicting the most. The results of Cell-Ploc and LocTree3 were in compliance in terms of HSP90s localization to the endoplasmic reticulum.
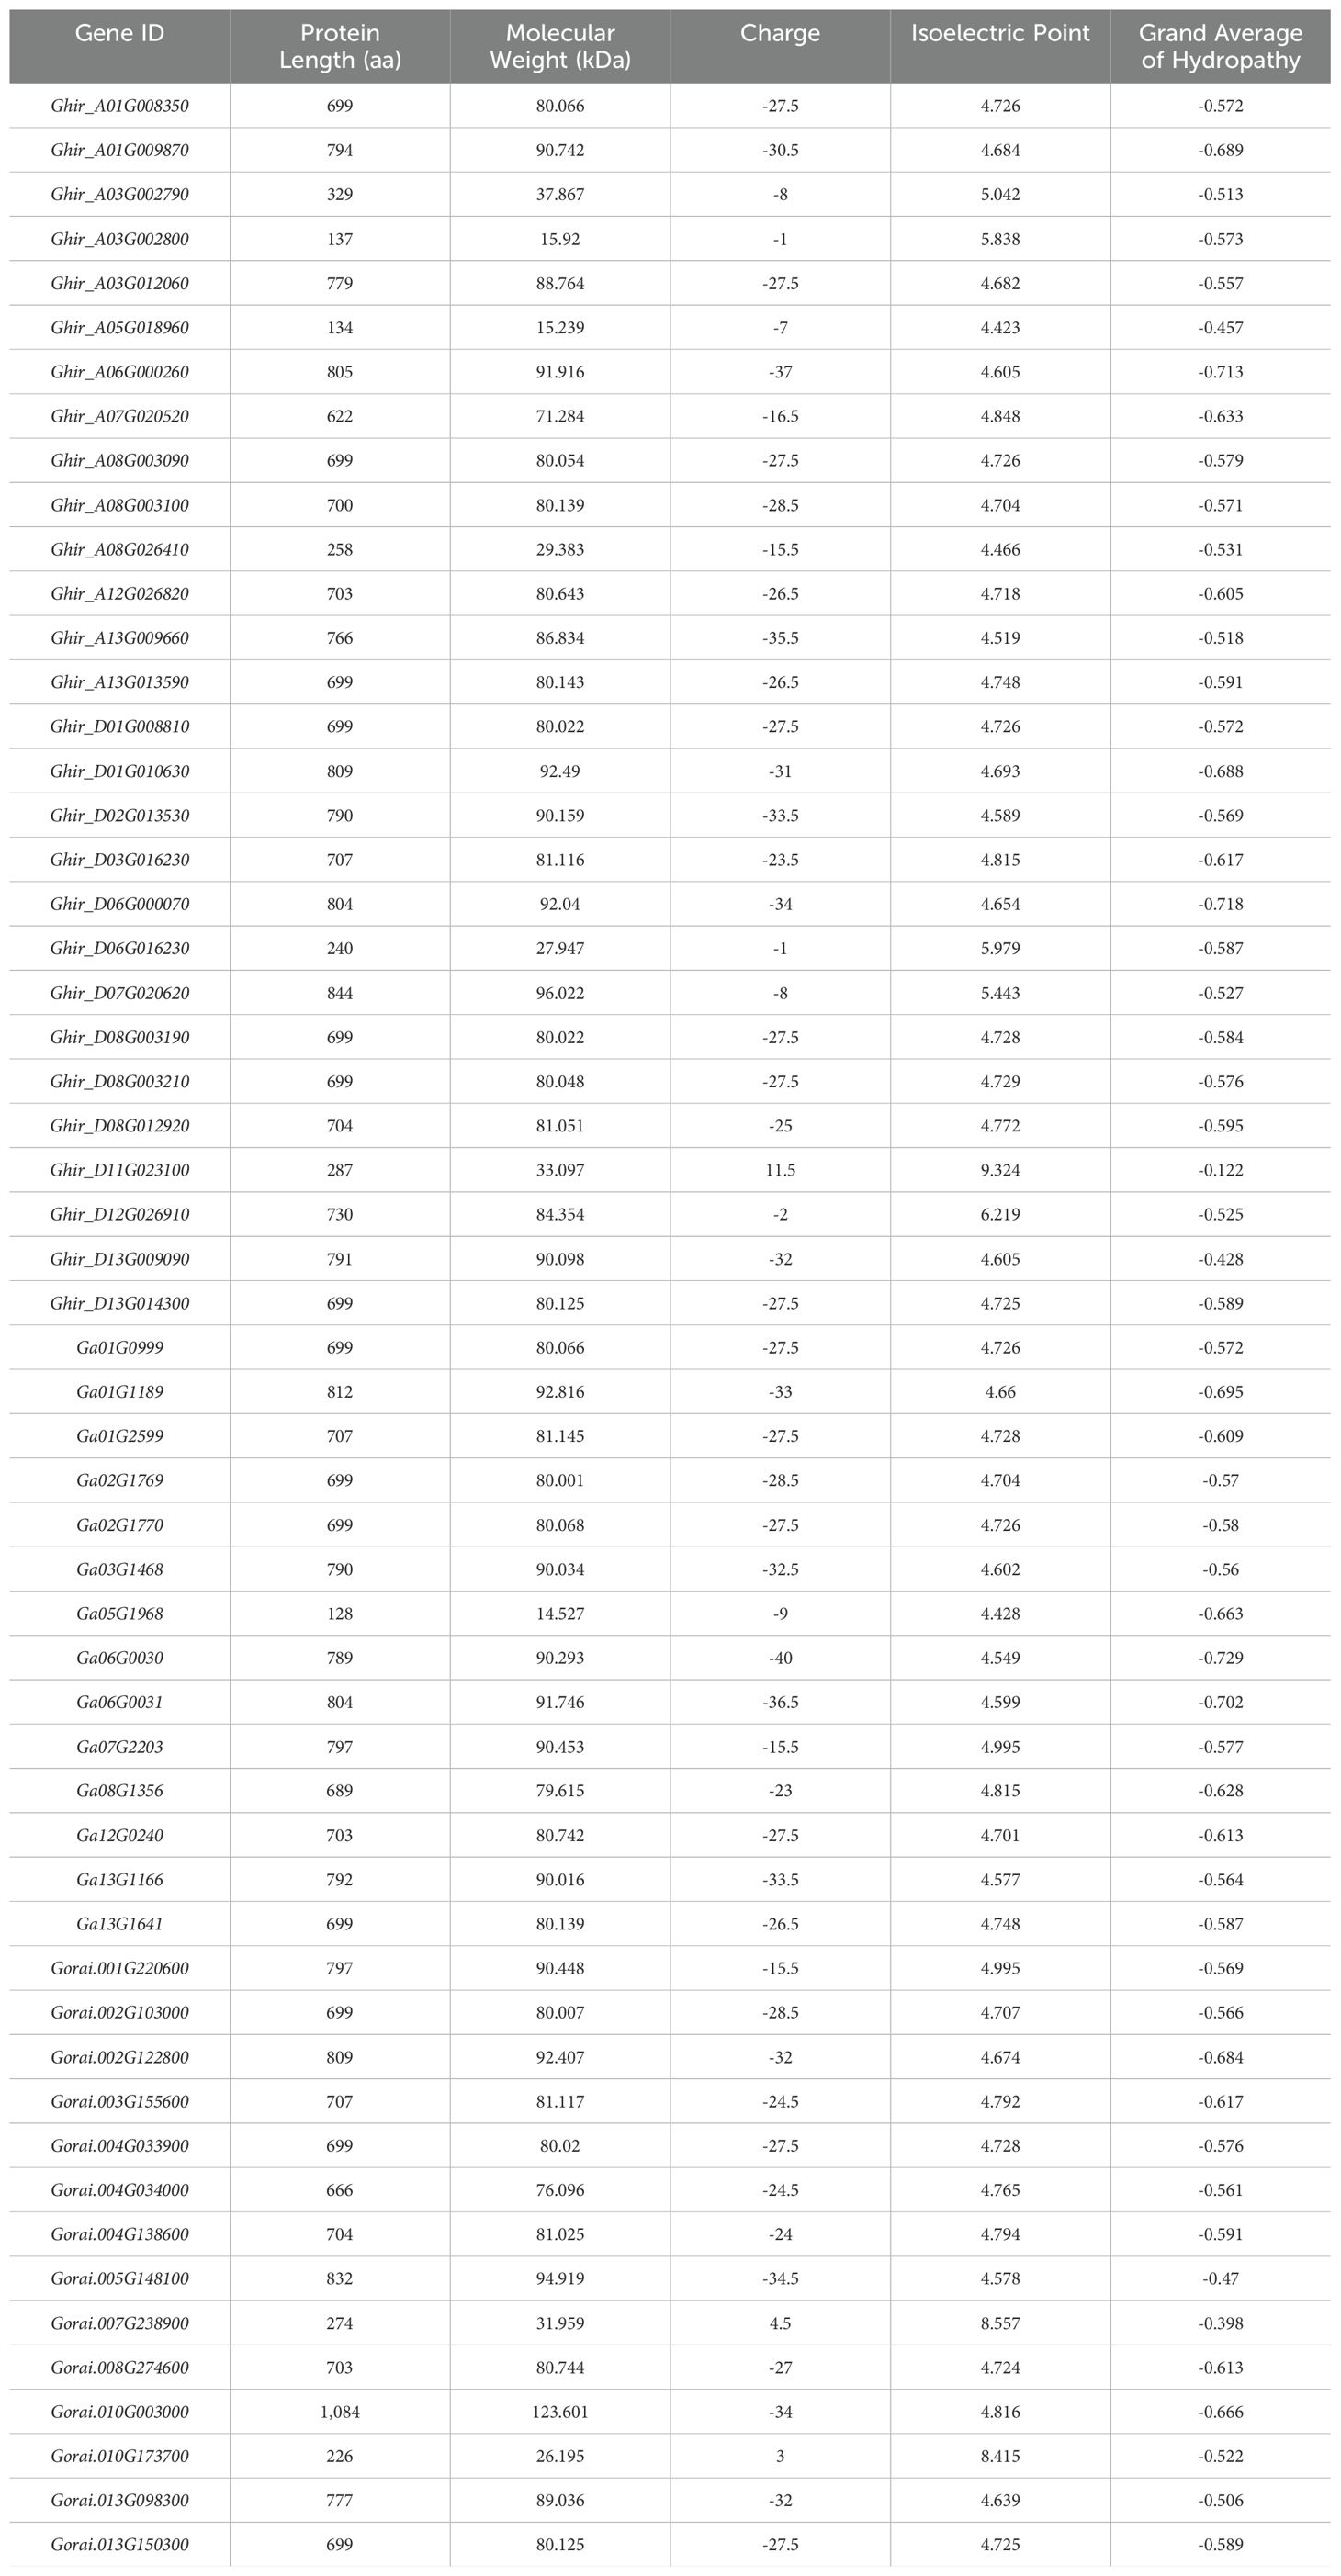
Table 1. Physichochemical properties of three cotton species.
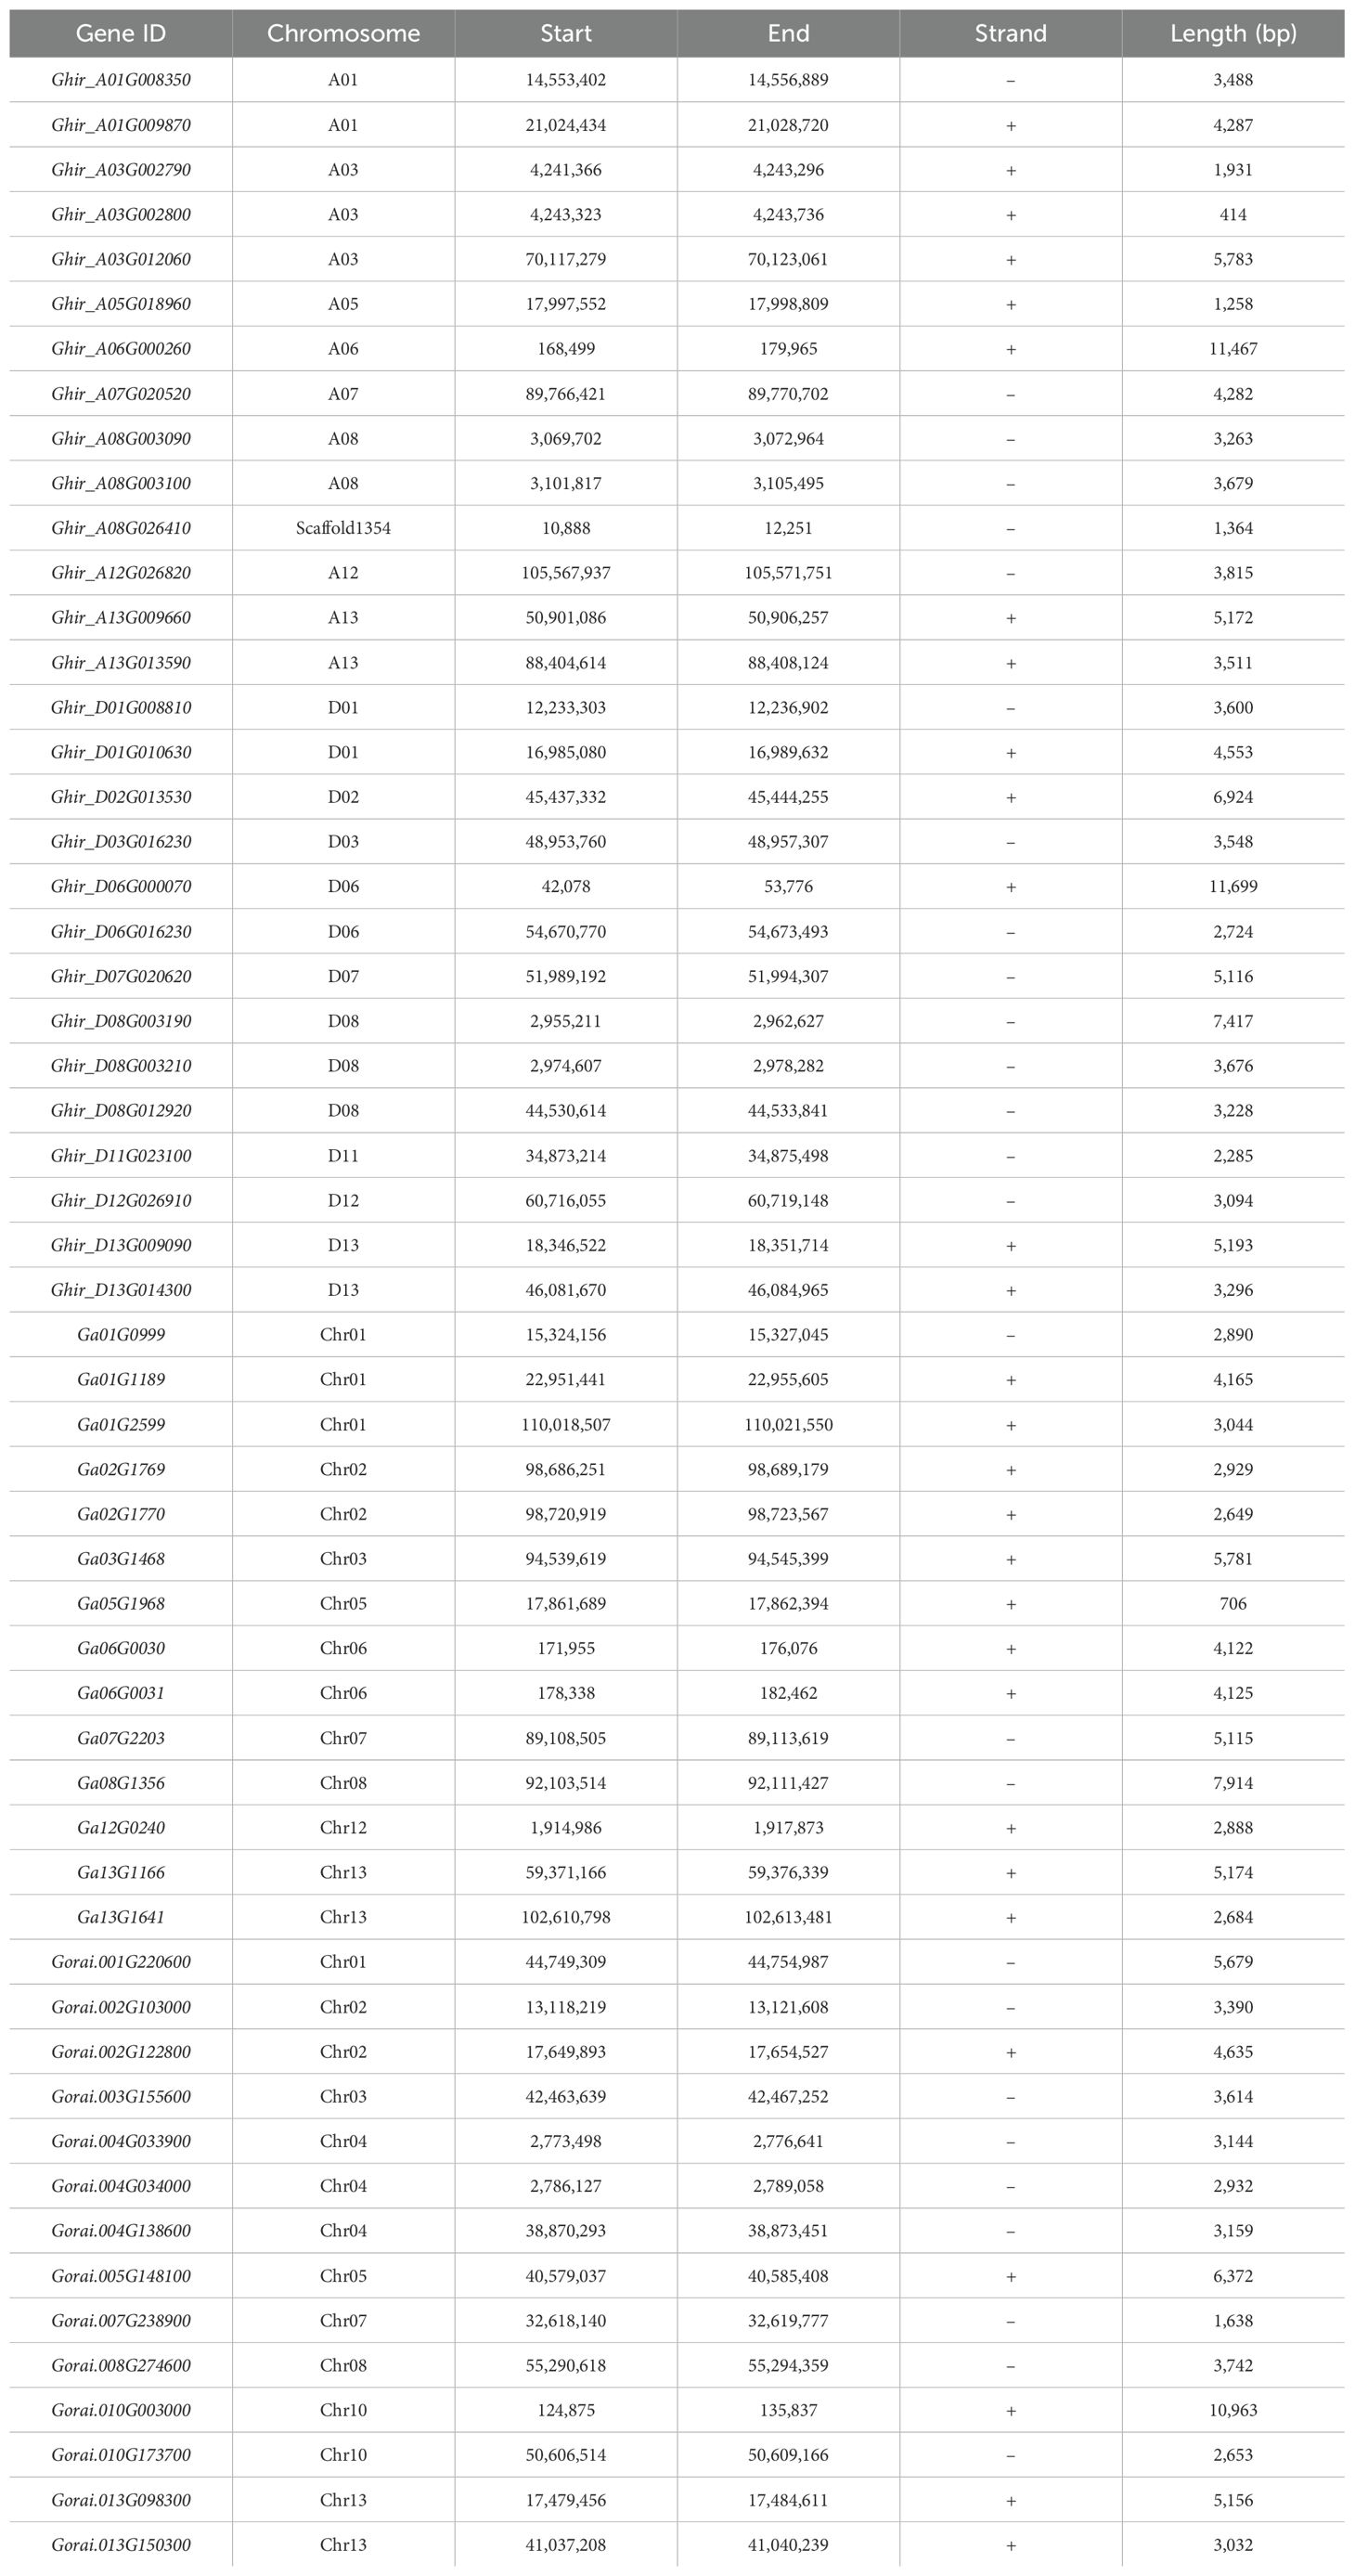
Table 2. Genomic features of three cotton species.
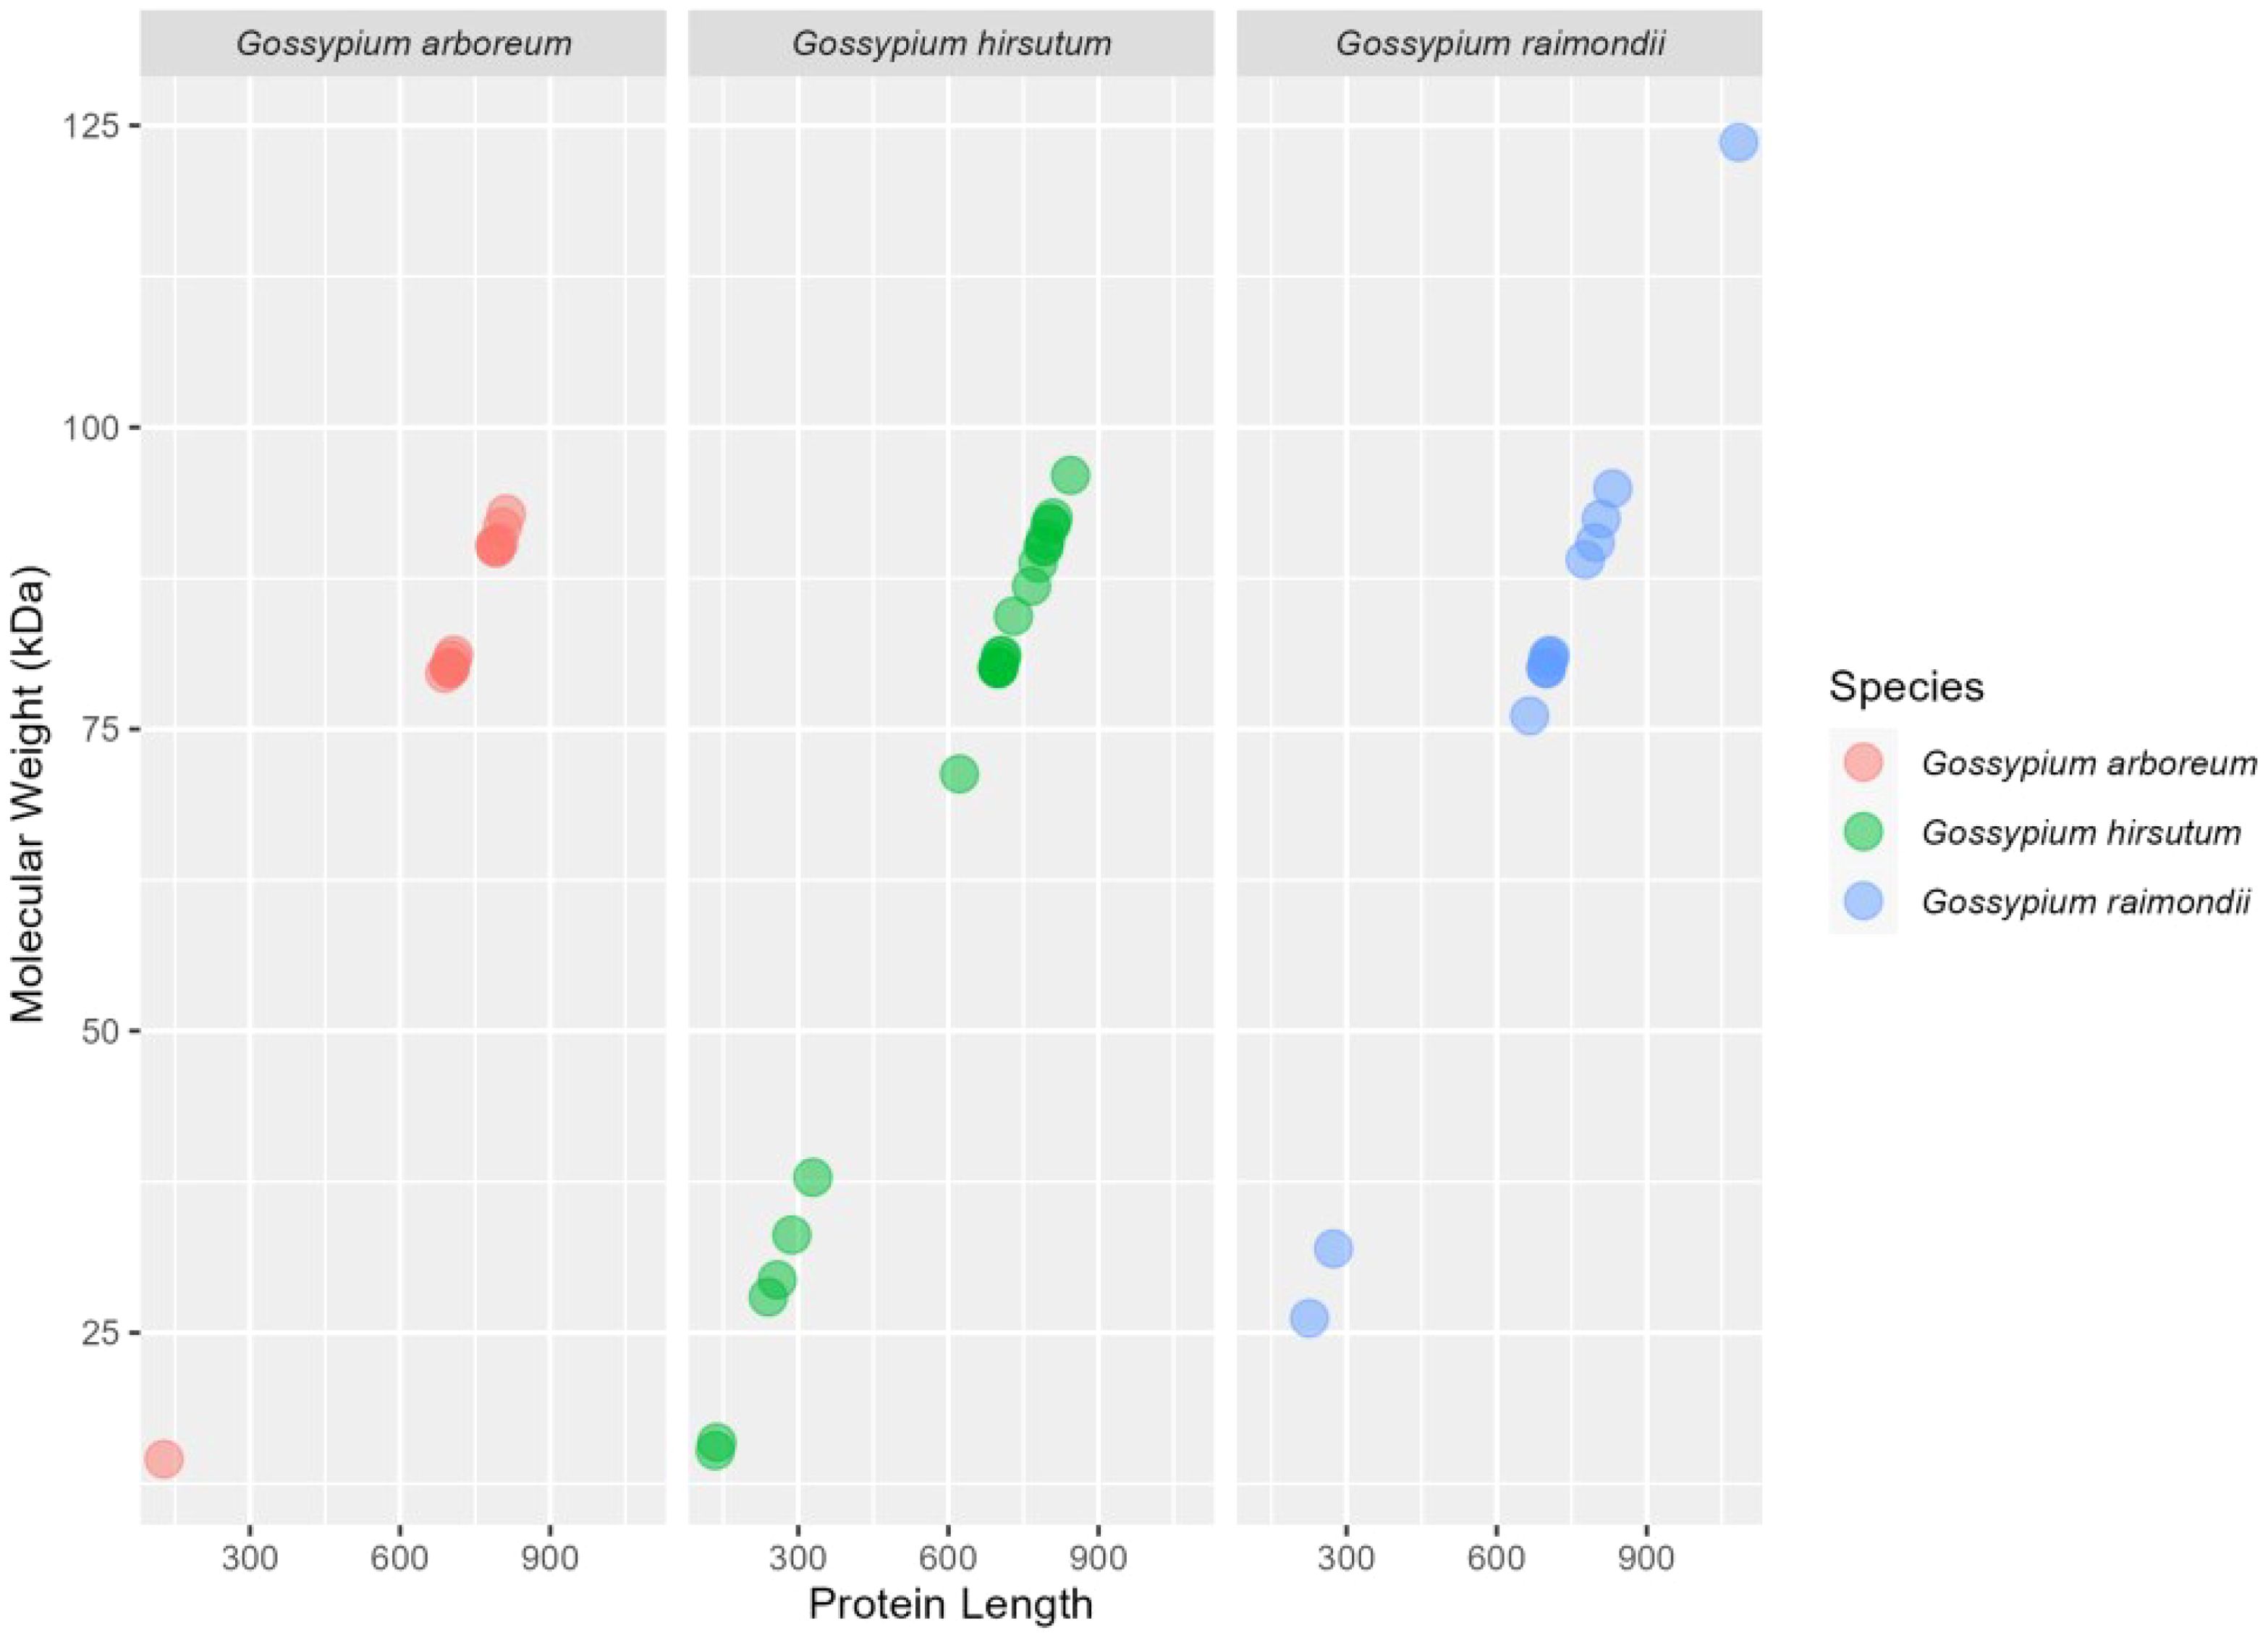
Figure 2. The plot depicts the estimation of the amino acids length on X-axis and molecular weight of HSP90 proteins on Y-axis.
Evolutionary relationship and classification of HSP90 family genes
To analyze the evolutionary relationships of the HSP90 genes, we constructed a neighbor-joining (NJ) phylogenetic tree based on multiple sequence alignments of 56 HSP90 proteins of Gossypium species (G. hirsutum (28), G. arboreum (14), and G. raimondii (14), 7 proteins of A. thaliana, 9 of Oryza sativa, and 18 of Triticum aestivum as shown in Figure 3A. To get further insights into the evolutionary relationship among the three cotton species under study, another phylogenetic tree was constructed as shown in Figure 3B. Both the phylogenetic trees were divided into three subgroups (Figures 3A, B). The Arabidopsis thaliana, Oryza sativa, and Triticum aestivum were exclusively present in clade III with Gossypium species whereas clade I and II contained only cotton genes. Ghir_A08G003100 and Ga02G1769 were present in clade I, whereas Ghir_D08G03190, Ghir_DO8G003210 of G. hirsutum, Gorai.004G033900 and Gorai.004G034000 of G. raimondii were present in clade II Figure 3A. A similar pattern was observed in the phylogenetic tree of cotton species as shown in Figure 3B.
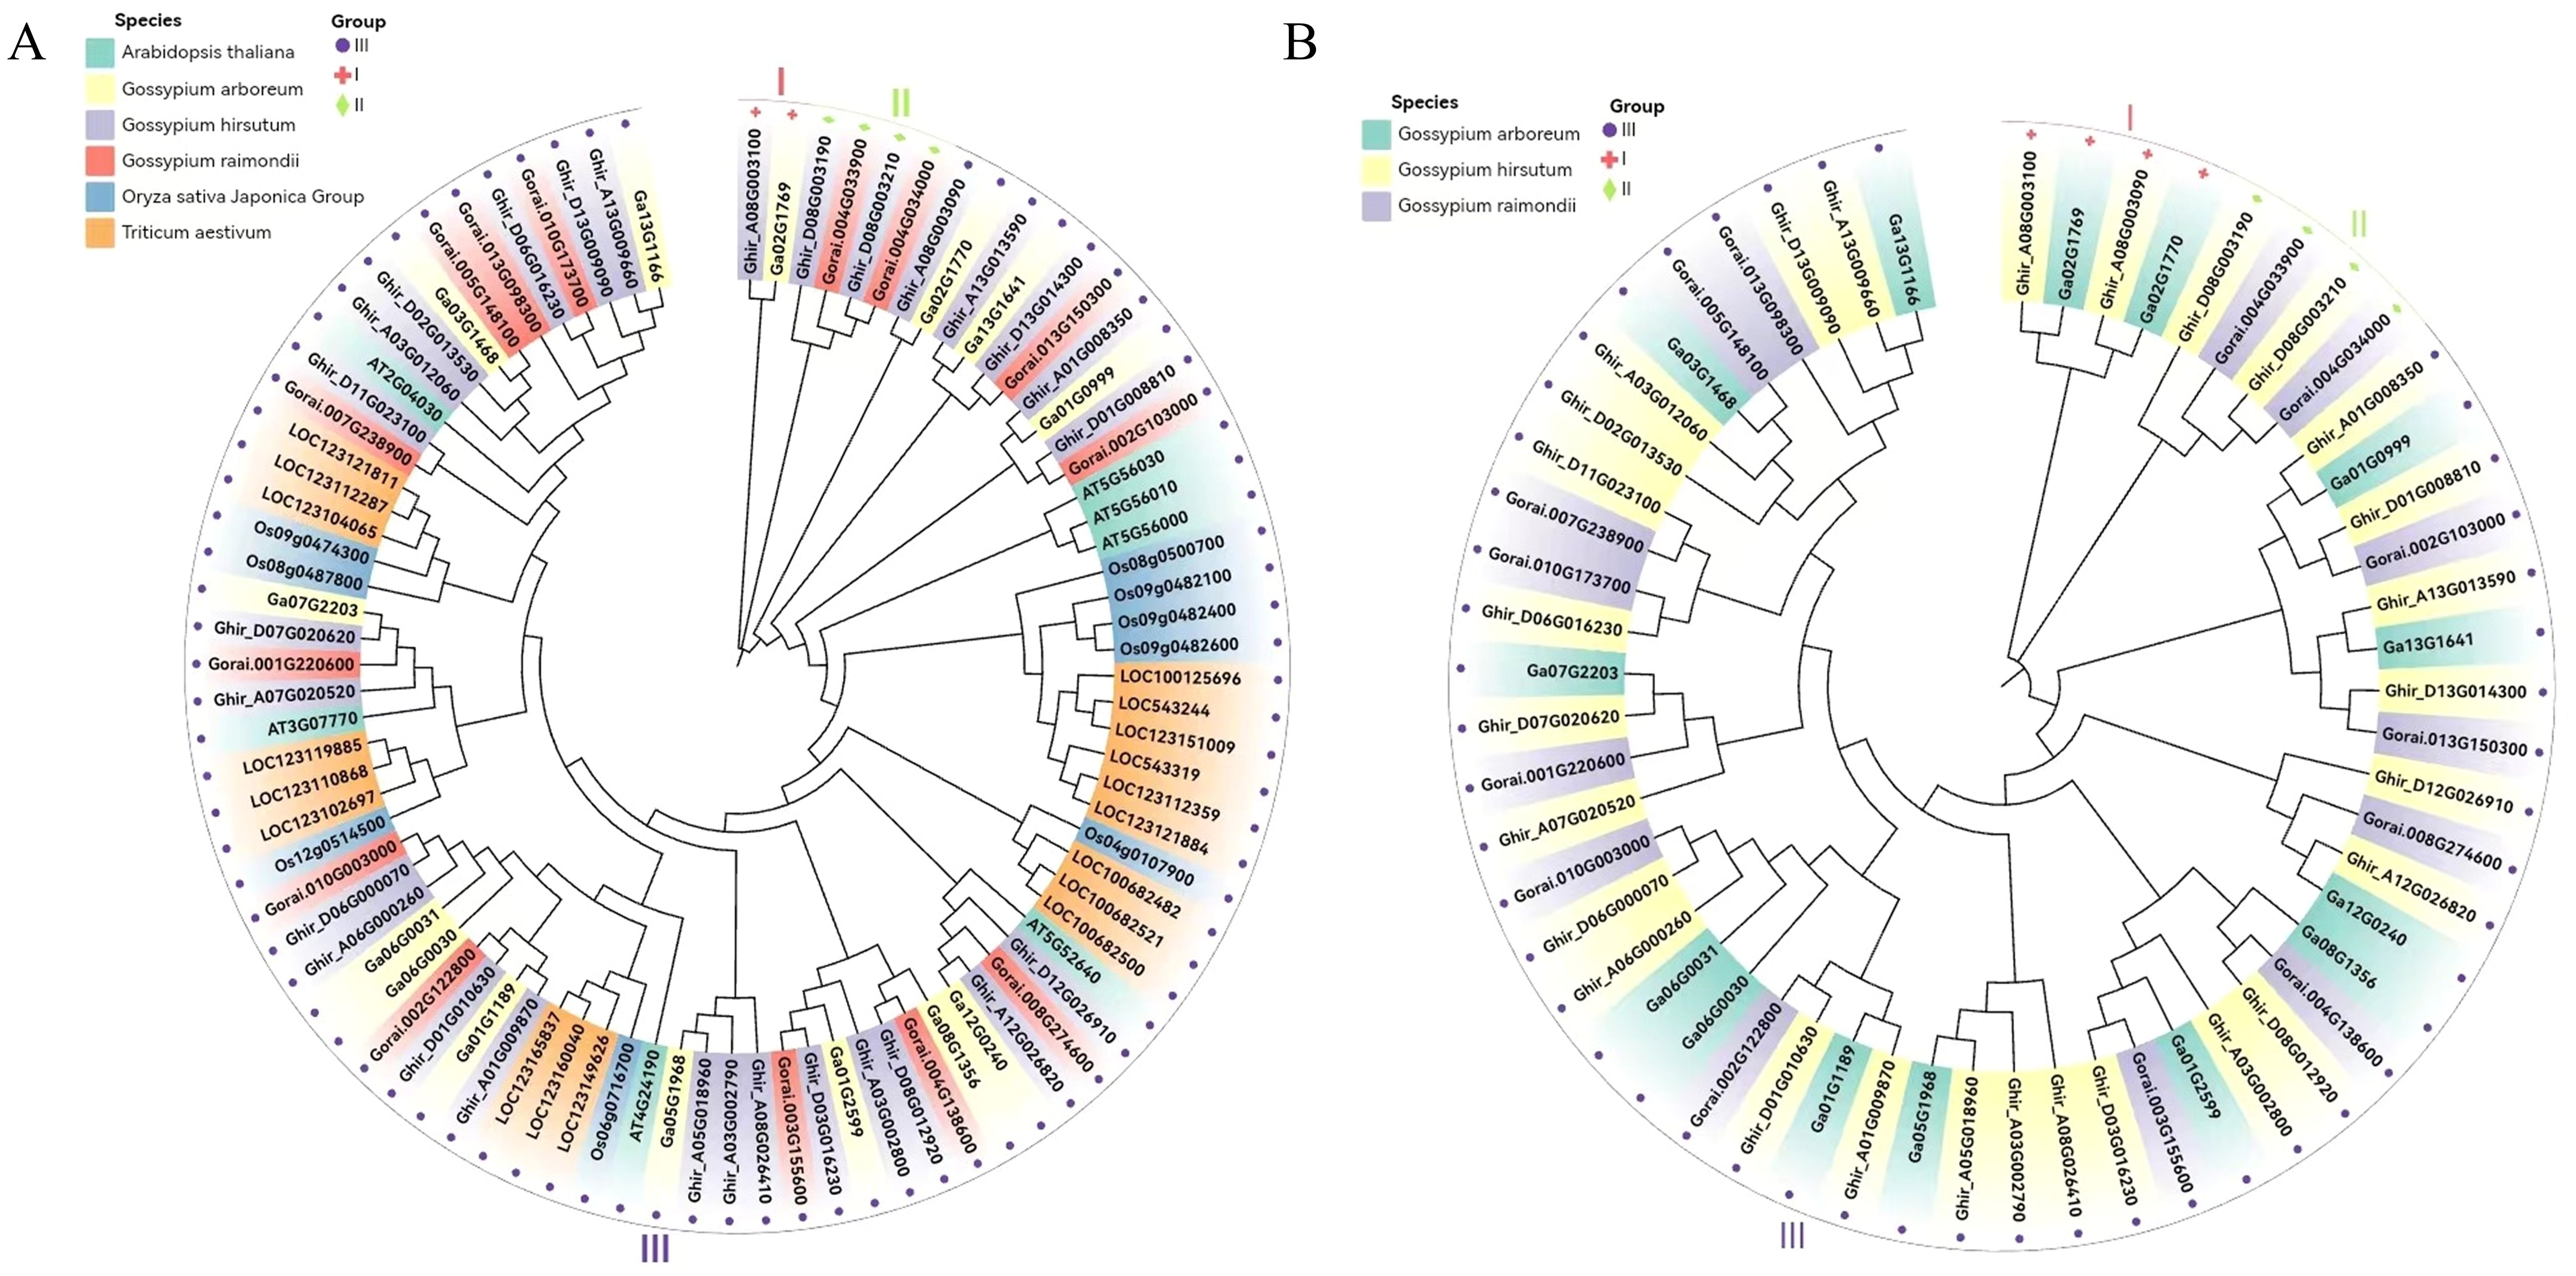
Figure 3. Phylogenetic analysis. (A) Neighbor-joining phylogenetic tree of 56 HSP90 genes of the three cotton species, model plant Arabidopsis thaliana, Oryza sativa, and Triticum aestivum. (B) Phylogenetic tree of three cotton species.
Chromosomal mapping
To determine the division of HSP90 genes on different chromosomes of cotton, we constructed the chromosomal map with information taken from three cotton genomes as demonstrated in Figure 4. The results showed that most of the 56 genes were scattered irregularly across 13 chromosomes, while one gene Ghir_A08G026410 was located on a scaffold. G. hirsutum was attributed with 13 genes distributed on A-subgenome whereas 14 genes were located on D-subgenome. Moreover, chromosomes A03 and D08 were found to have the highest number of HSP90 genes, having 3 genes on each chromosome, followed by chromosomes A01, A08, A13, D01, D06, and D13, with 2 genes each; the lowest number of genes 1 was found on chromosomes A05, A06, A07, A12, D02, D03, D07, D11 and D12. In G. arboreum, chromosome 01 had the highest number of gene 3, followed by 2 genes on chr 02, chr06, and chr13 the lowest number of gene 1 was found on chromosomes 03, chr05, chr07, chr08, and chr12. In G. raimondii, the highest number of genes were found on chromosome 04, with 3 genes, and the lowest number of genes only one HSP90 member was found on chromosomes chr01, chr03, chr05, chr07, and chr08. Moreover, to explore the selection pressure we calculated the Ka, Ks, and Ka/Ks values of identified genes. The ka/Ks > demonstrates a positive selection, whereas Ka/Ks = 1 denotes neutral selection and Ka/Ks <1 corresponds to the negative selection pressure. In the current study, the Ka/Ks values of all the HSP90 genes were < 1, suggesting that these gene pairs evolved under negative selection pressure in upland cotton as given in Supplementary Table S3.
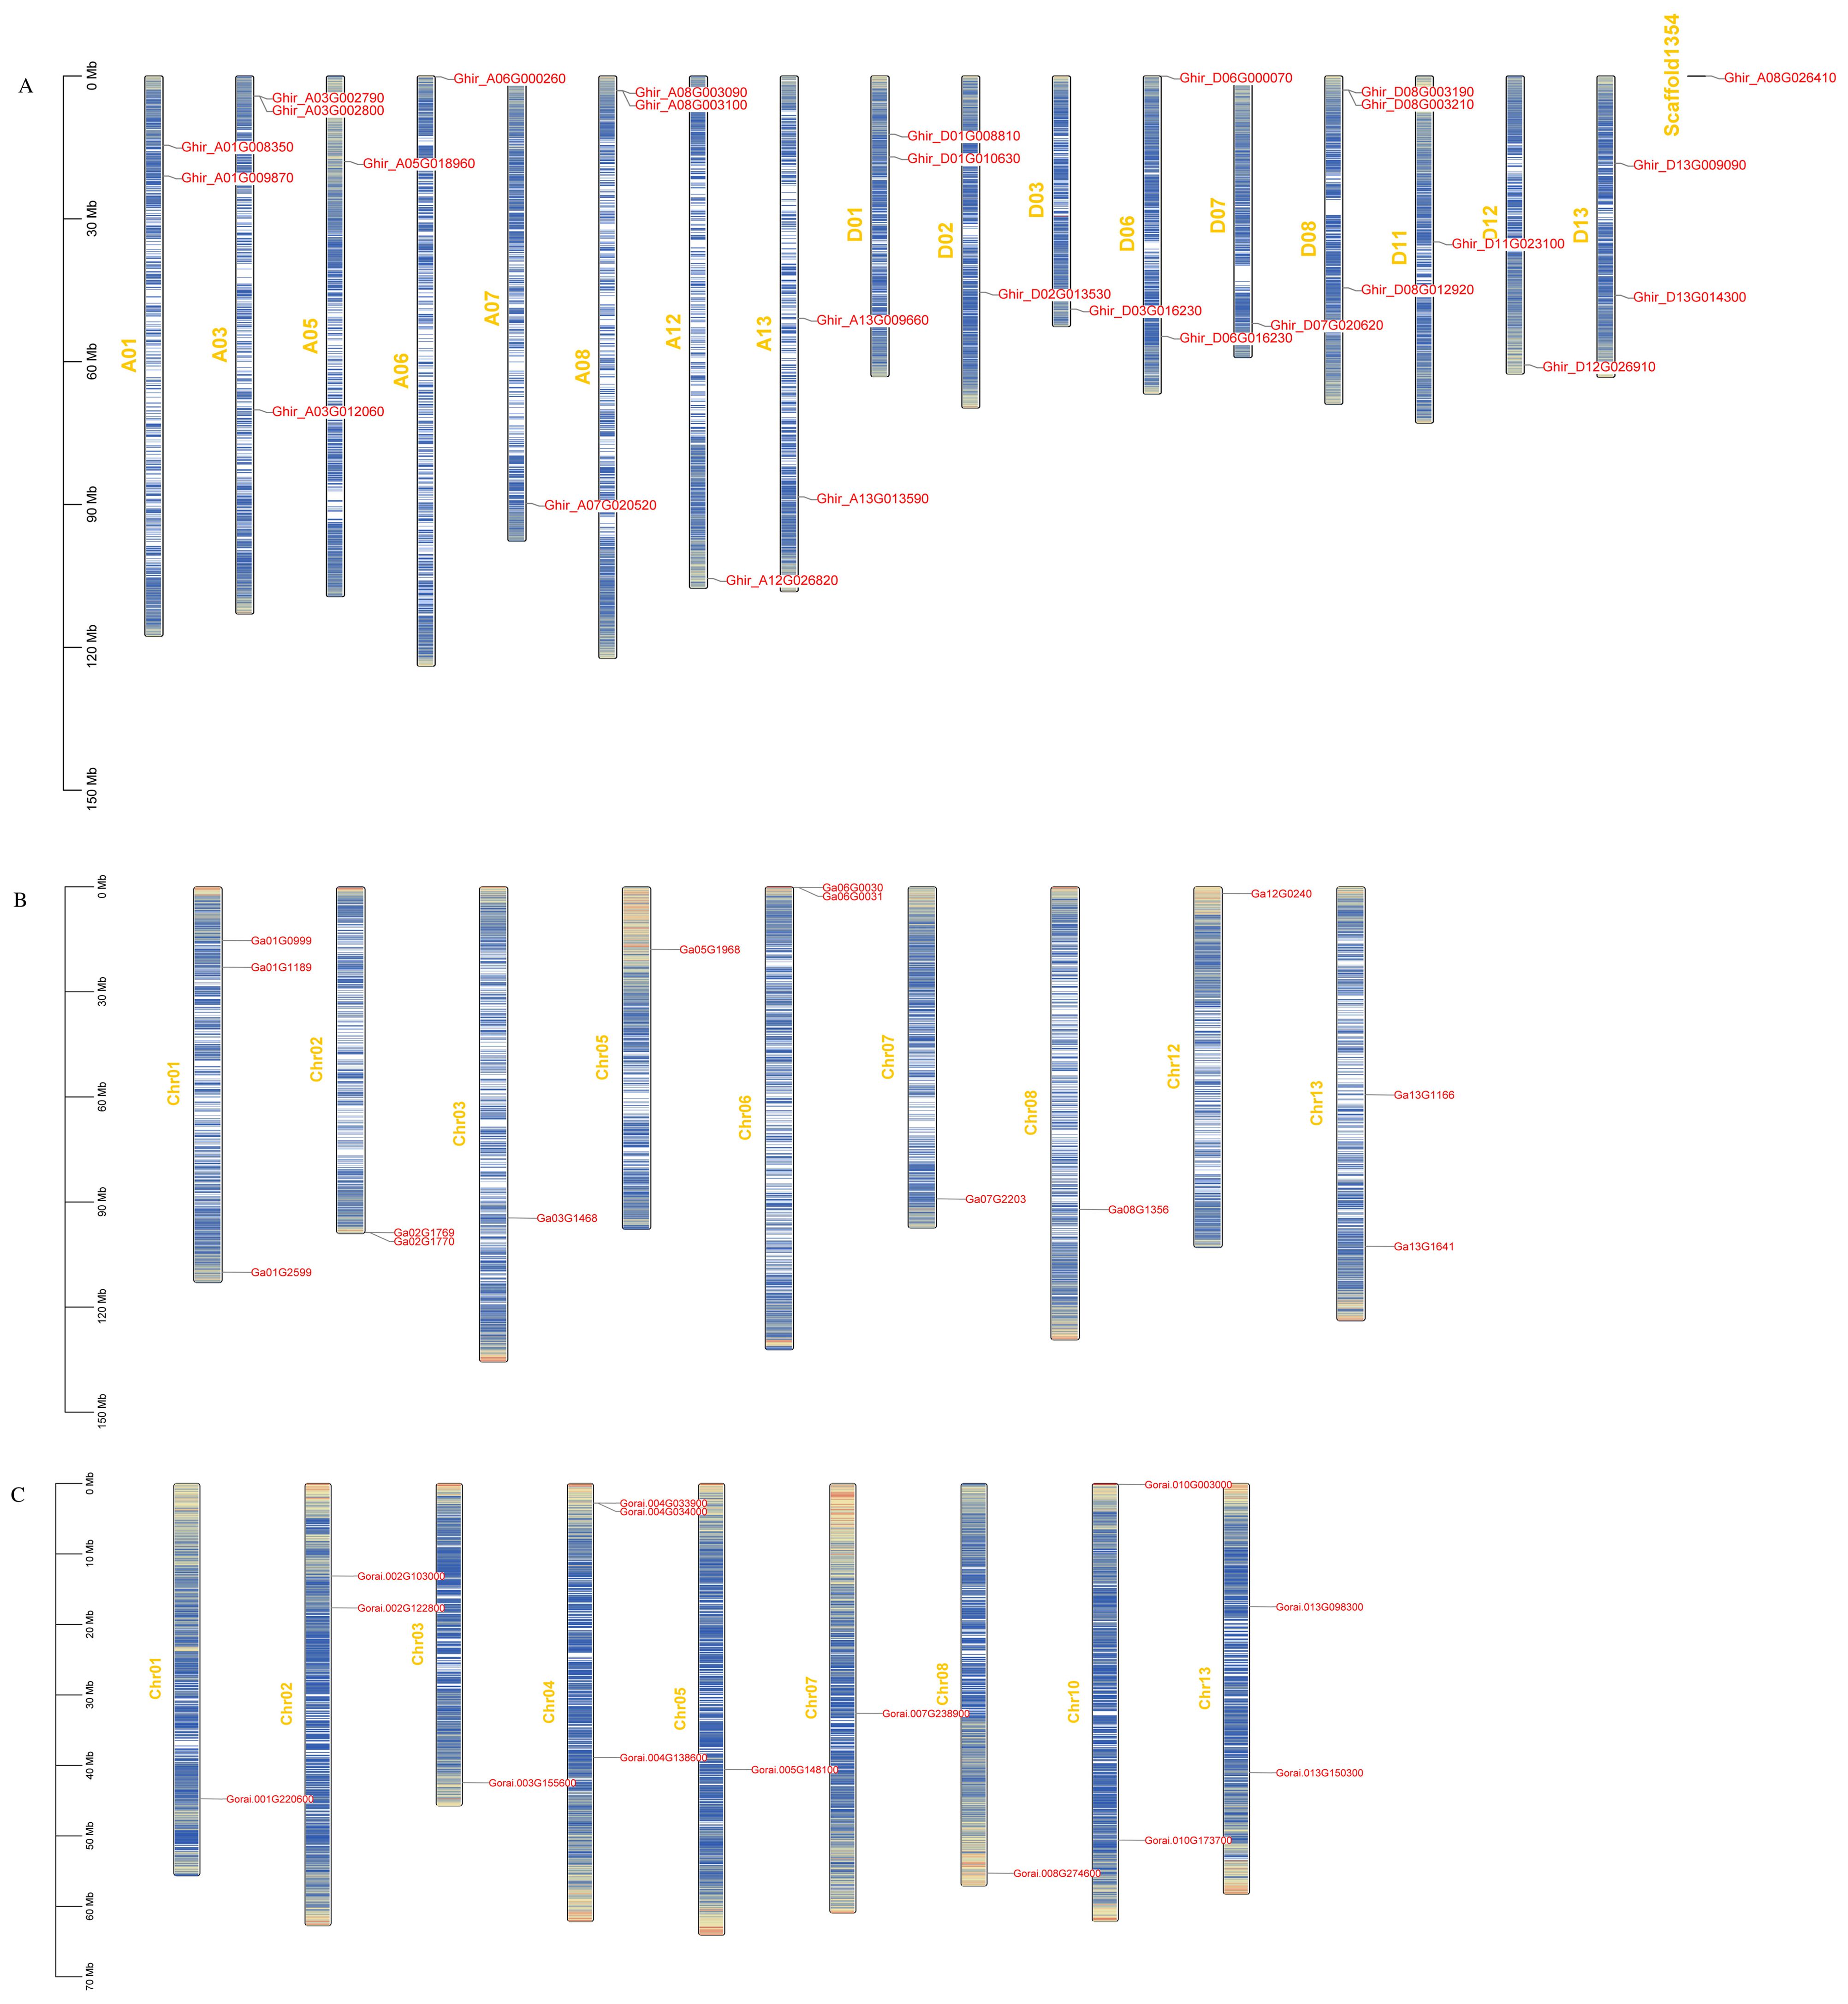
Figure 4. (A-C) Chromosomal mapping of HSP90 genes on chromosomes. The name of the chromosomes are on the left whereas, gene IDs are placed on the right (A) G. hirsutum, (B) G. arboreum, (C) G. raimondii.
Gene structure, conserved motifs, and Cis-regulatory elements
To determine the gene structures and evolutionary tree of HSP90 genes, the intron-exon structures of 56 cotton genes were analyzed using the TBtools software, as shown in Figures 5A, B. The analysis revealed that one gene Ghir_A03G002800 had only one exon, while the gene Gorai.010G003000 had the highest number of exons i.e., 22. Forty motifs were identified using (http://meme-suite.org/. Motifs 1 and 2 were found most conserved out of all 40 motifs as shown in Figure 5C. The cis-acting elements in the promoter region play important roles in the plant responses to stress, and, participate in the responses to drought, ABA, and other stresses (Yazaki and Kikuchi, 2005; Nakashima and Yamaguchi-Shinozaki, 2013). The twelve most abundant cis-acting elements detected in HSP90s were the abscisic acid-responsive, anaerobic induction, light responsive, Methyl jasmonate responsive, gibberellin responsive, drought inducibility, defense and stress-responsive, salicylic acid-responsive, auxin-responsive, low temperature responsive, wound responsive and anoxic specific inducibility. Light responsive, Meja responsive, and anaerobic induction has the largest number of cis-regulatory elements followed by low temperature responsive and auxin-responsive as shown in Figure 6.
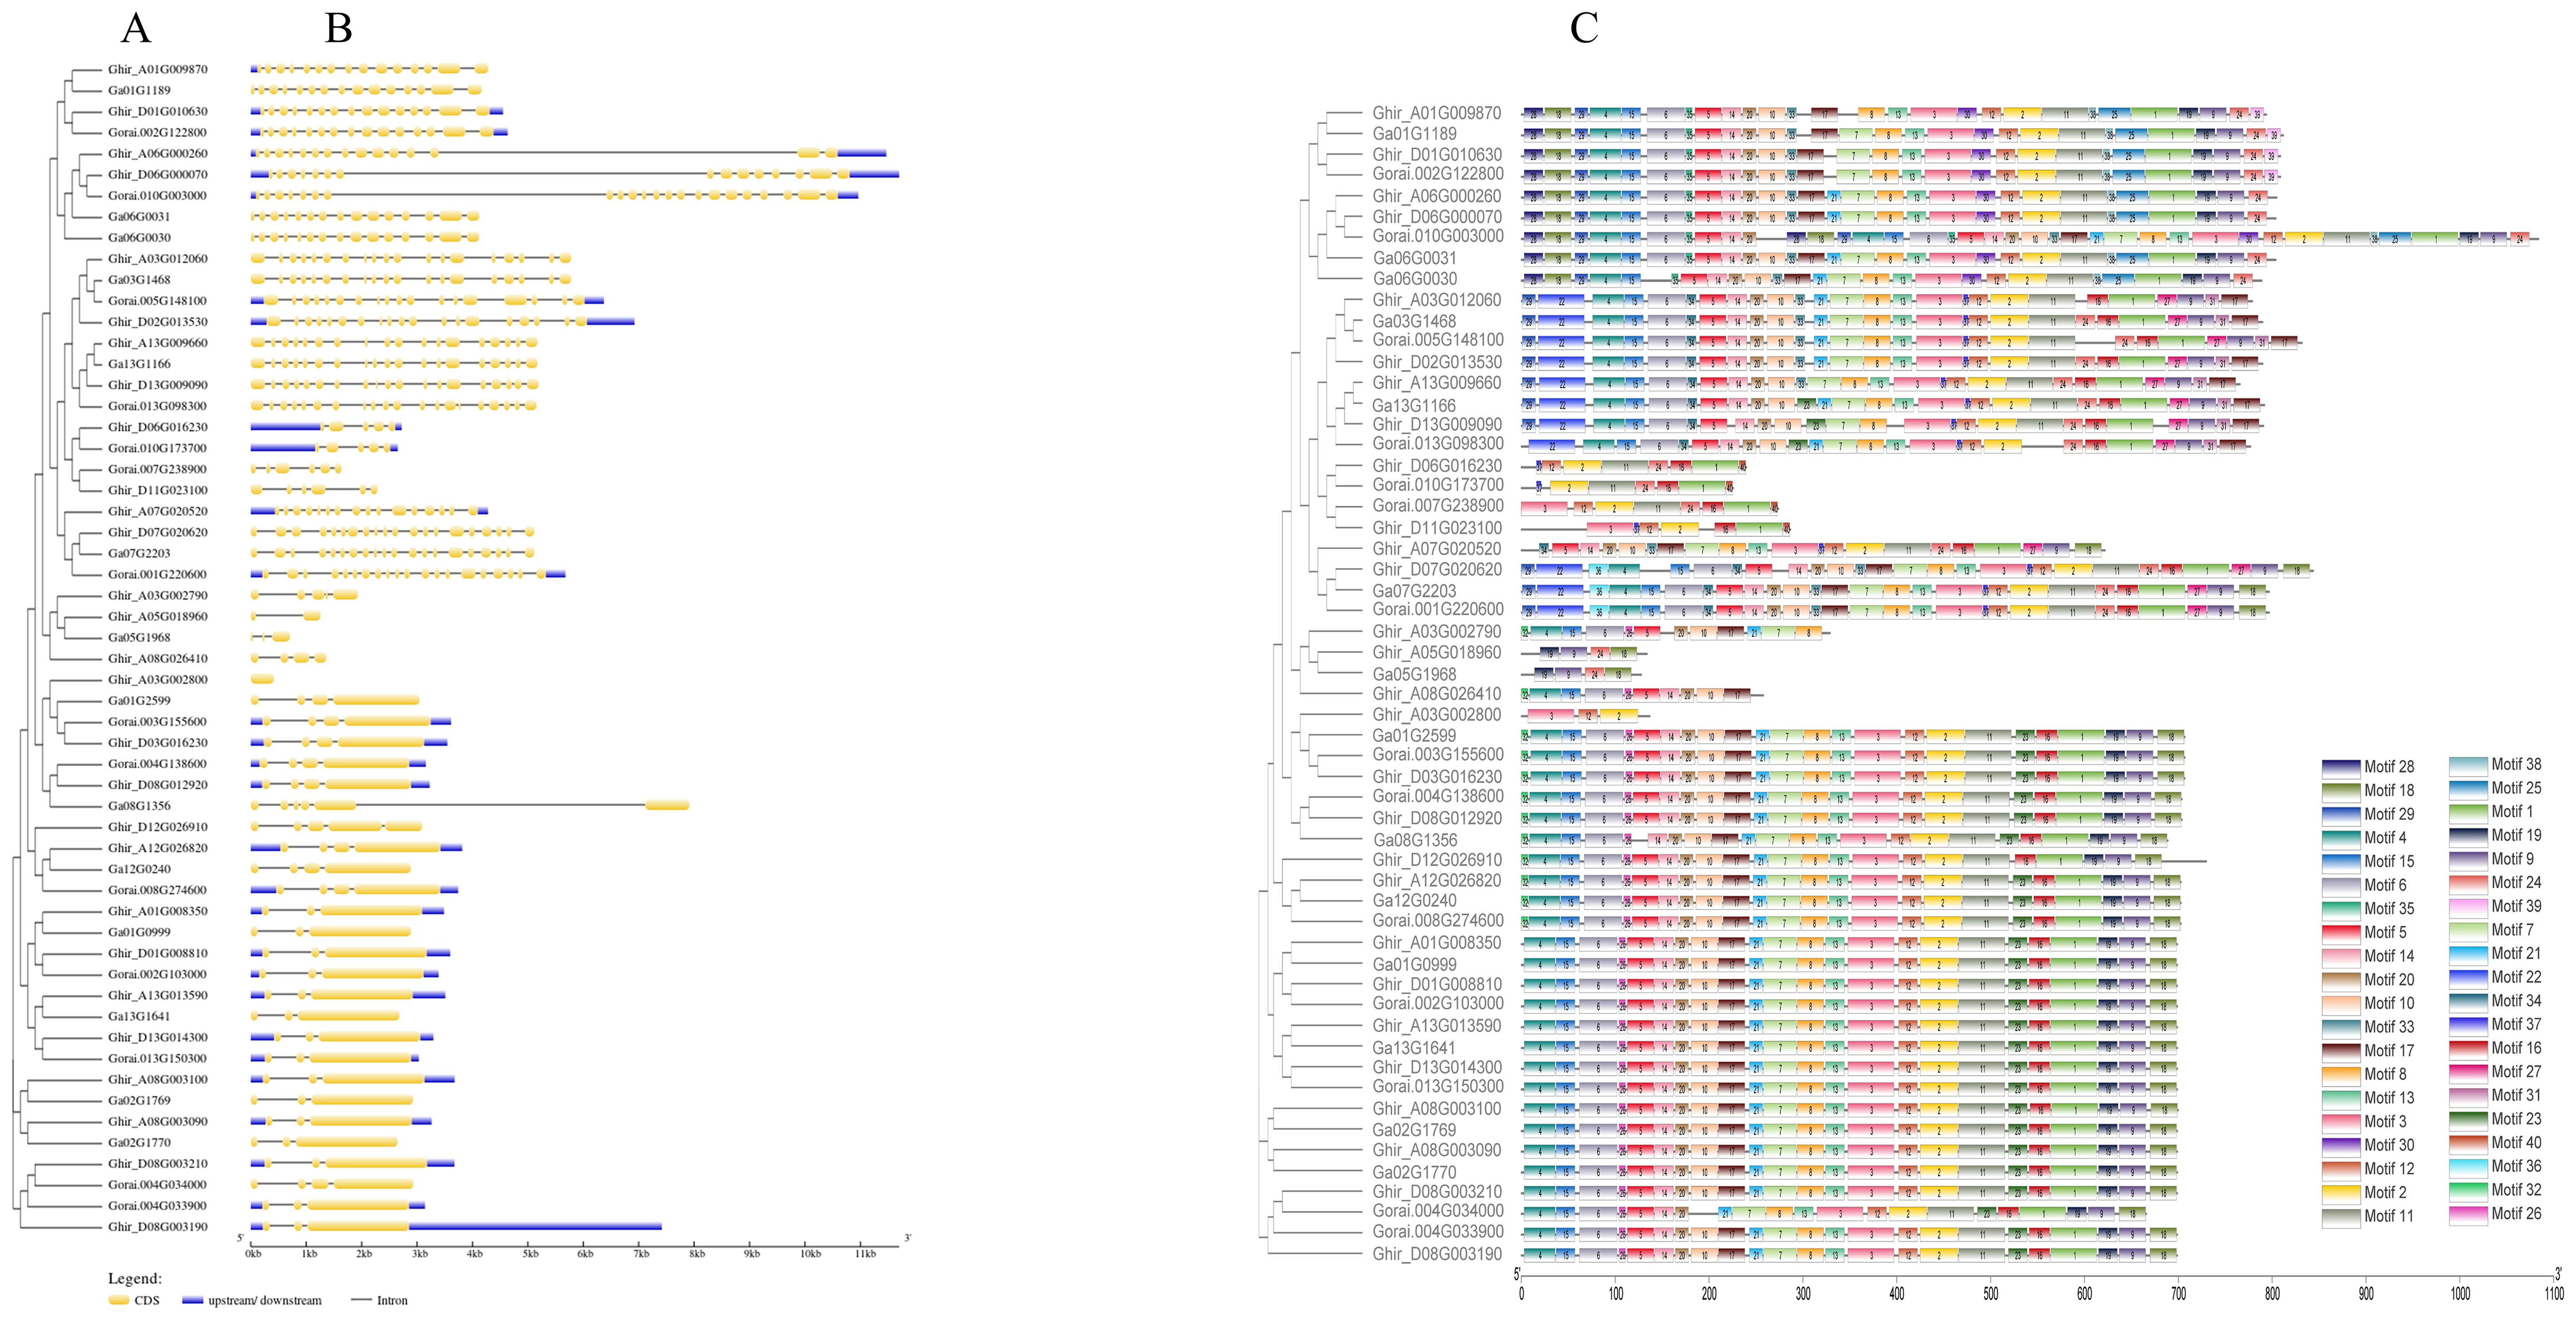
Figure 5. The phylogenetic tree, gene structure and conserved motif of HSP90 genes in three cotton species. (A) Multiple sequence alignment of candidate genes (B) Gene structure of HSP90s, the exons are represented by yellow boxes, intron by grey lines and upstream/downstream regions by purple boxes. (C) Conserved motifs of HSP90s. the motifs are displayed in different colors.
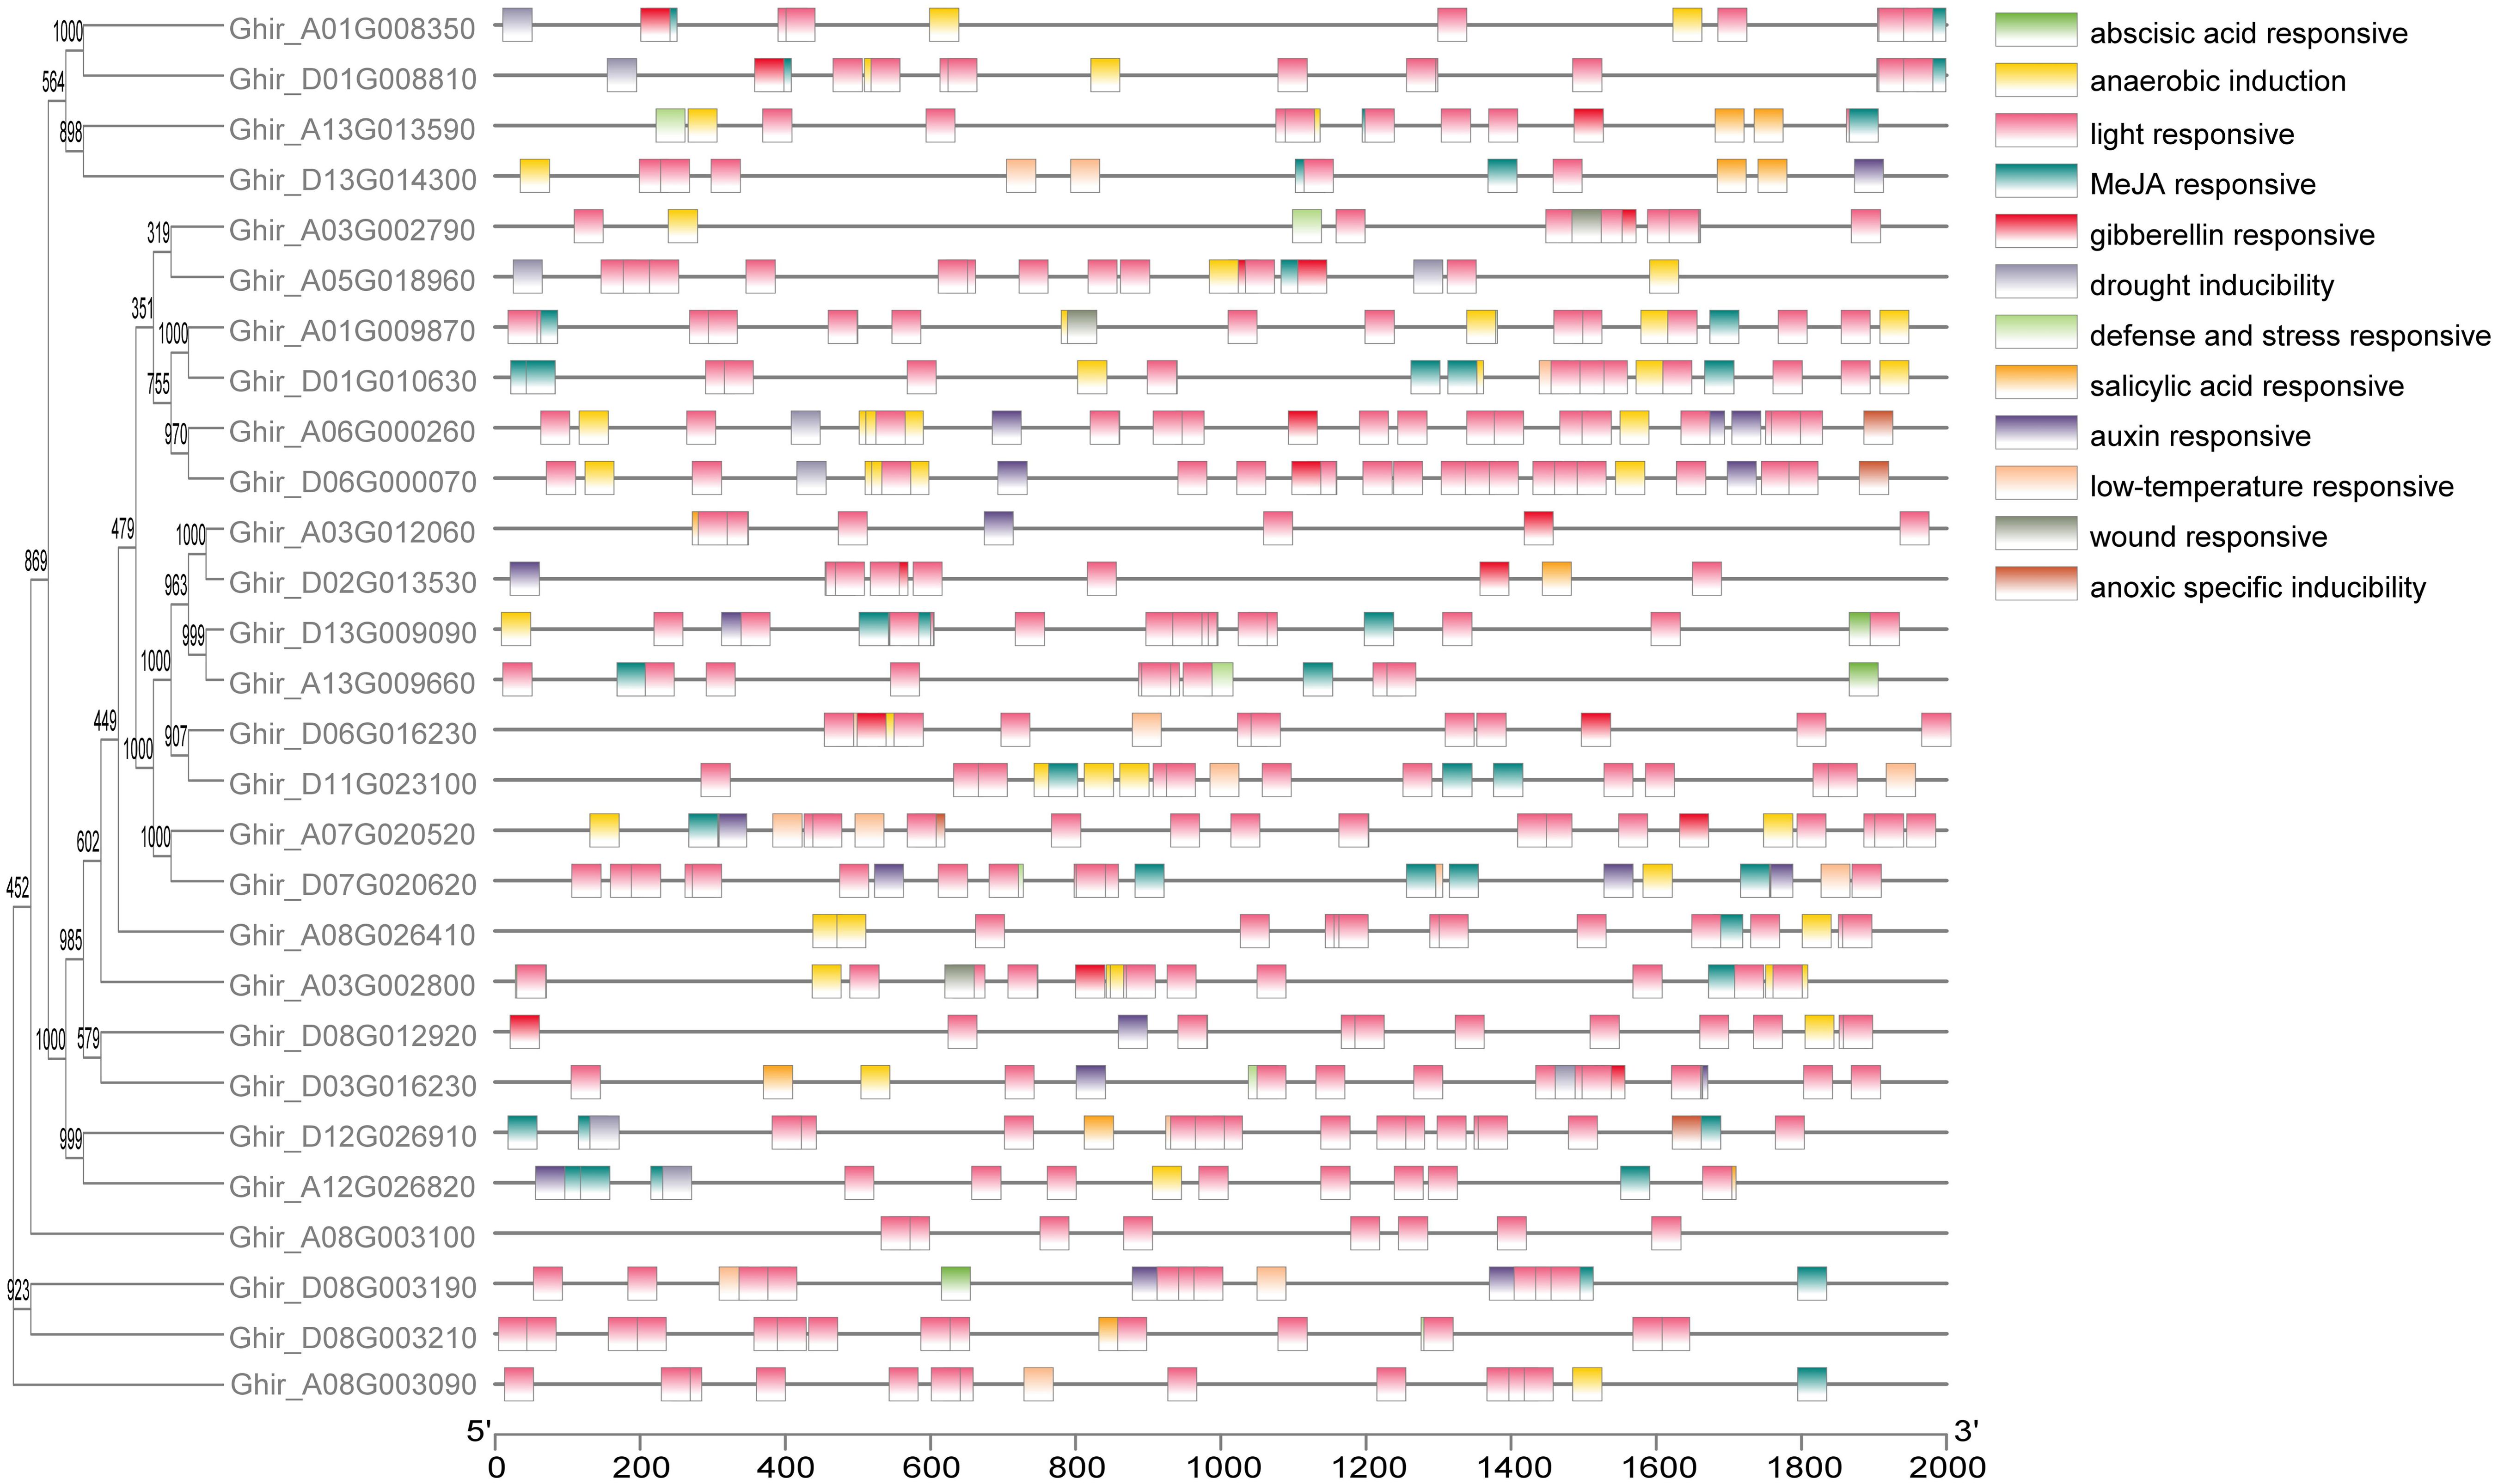
Figure 6. Cis-acting elements on promoter regions of HSP90 genes in G.hirsutum. The evolutionary tree and cis-acting elements of HSP90s. Different colors represent cis-acting elements mediating stress tolerance pathway.
Transcriptome profiling and qRT-PCR analysis
Publicly available transcriptomic data of Texas Marker-1 (TM-1) was employed to unravel the differential expression of HSP90 genes. Differential expression quantitative analysis FPKM (Fragments Per Kilobase of transcript per Million fragments mapped) refers to the number of fragments per thousand bases of a gene per million fragments, which is related to the length and expression level of transcripts, and can usually be used as transcript frequency or gene expression level (Zhao et al., 2021). The cluster analysis and heat-map visualization based on the level of expression of transcripts divided HSP90 genes into three groups A, B, and C. In A group which includes 28 genes, 6 were differentially expressed at 1, 3, 6, 12, and 24 hours after heat and salt stress application (Figure 7A). Notably, Ghir_D08G003210 and Ghir_A08G003090 depicted early differential expression following 1-hour heat treatment. Moreover, Ghir_A03G012060 and Ghir_D02G013530 were highly expressed after 6 and 12 hours of heat stress. Interestingly, Ghir_D08G003210 and Ghir_A08G003090 were also expressed during salt stress at 3, 6, 12, and 24 hours of salt stress. In the B group, Ghir_A13G013590 revealed high expression after 24-hour salt stress. In the C group, Ghir_A12G026820 exhibited high expression under 1h salt and 24h heat stress but the remaining members in this group showed significantly low expression. To validate these findings, ten genes were selected for qRT-PCR analysis. Among them, Ghir_A03G002790 was significantly upregulated at 48h salt treatment in salt-tolerant cultivar as compared to salt-sensitive cultivar (Figure 7B). Similarly, Ghir_D03G016230, Ghir_A07G020520, Ghir_D02G013530, and Ghir_D12G026910 depicted significant differential expression between salt-tolerant and salt-sensitive cotton cultivars. Finally, based on these qRT-PCR results, we selected two differentially expressed genes Ghir_D03G016230 and Ghir_D02G013530 for functional validation.
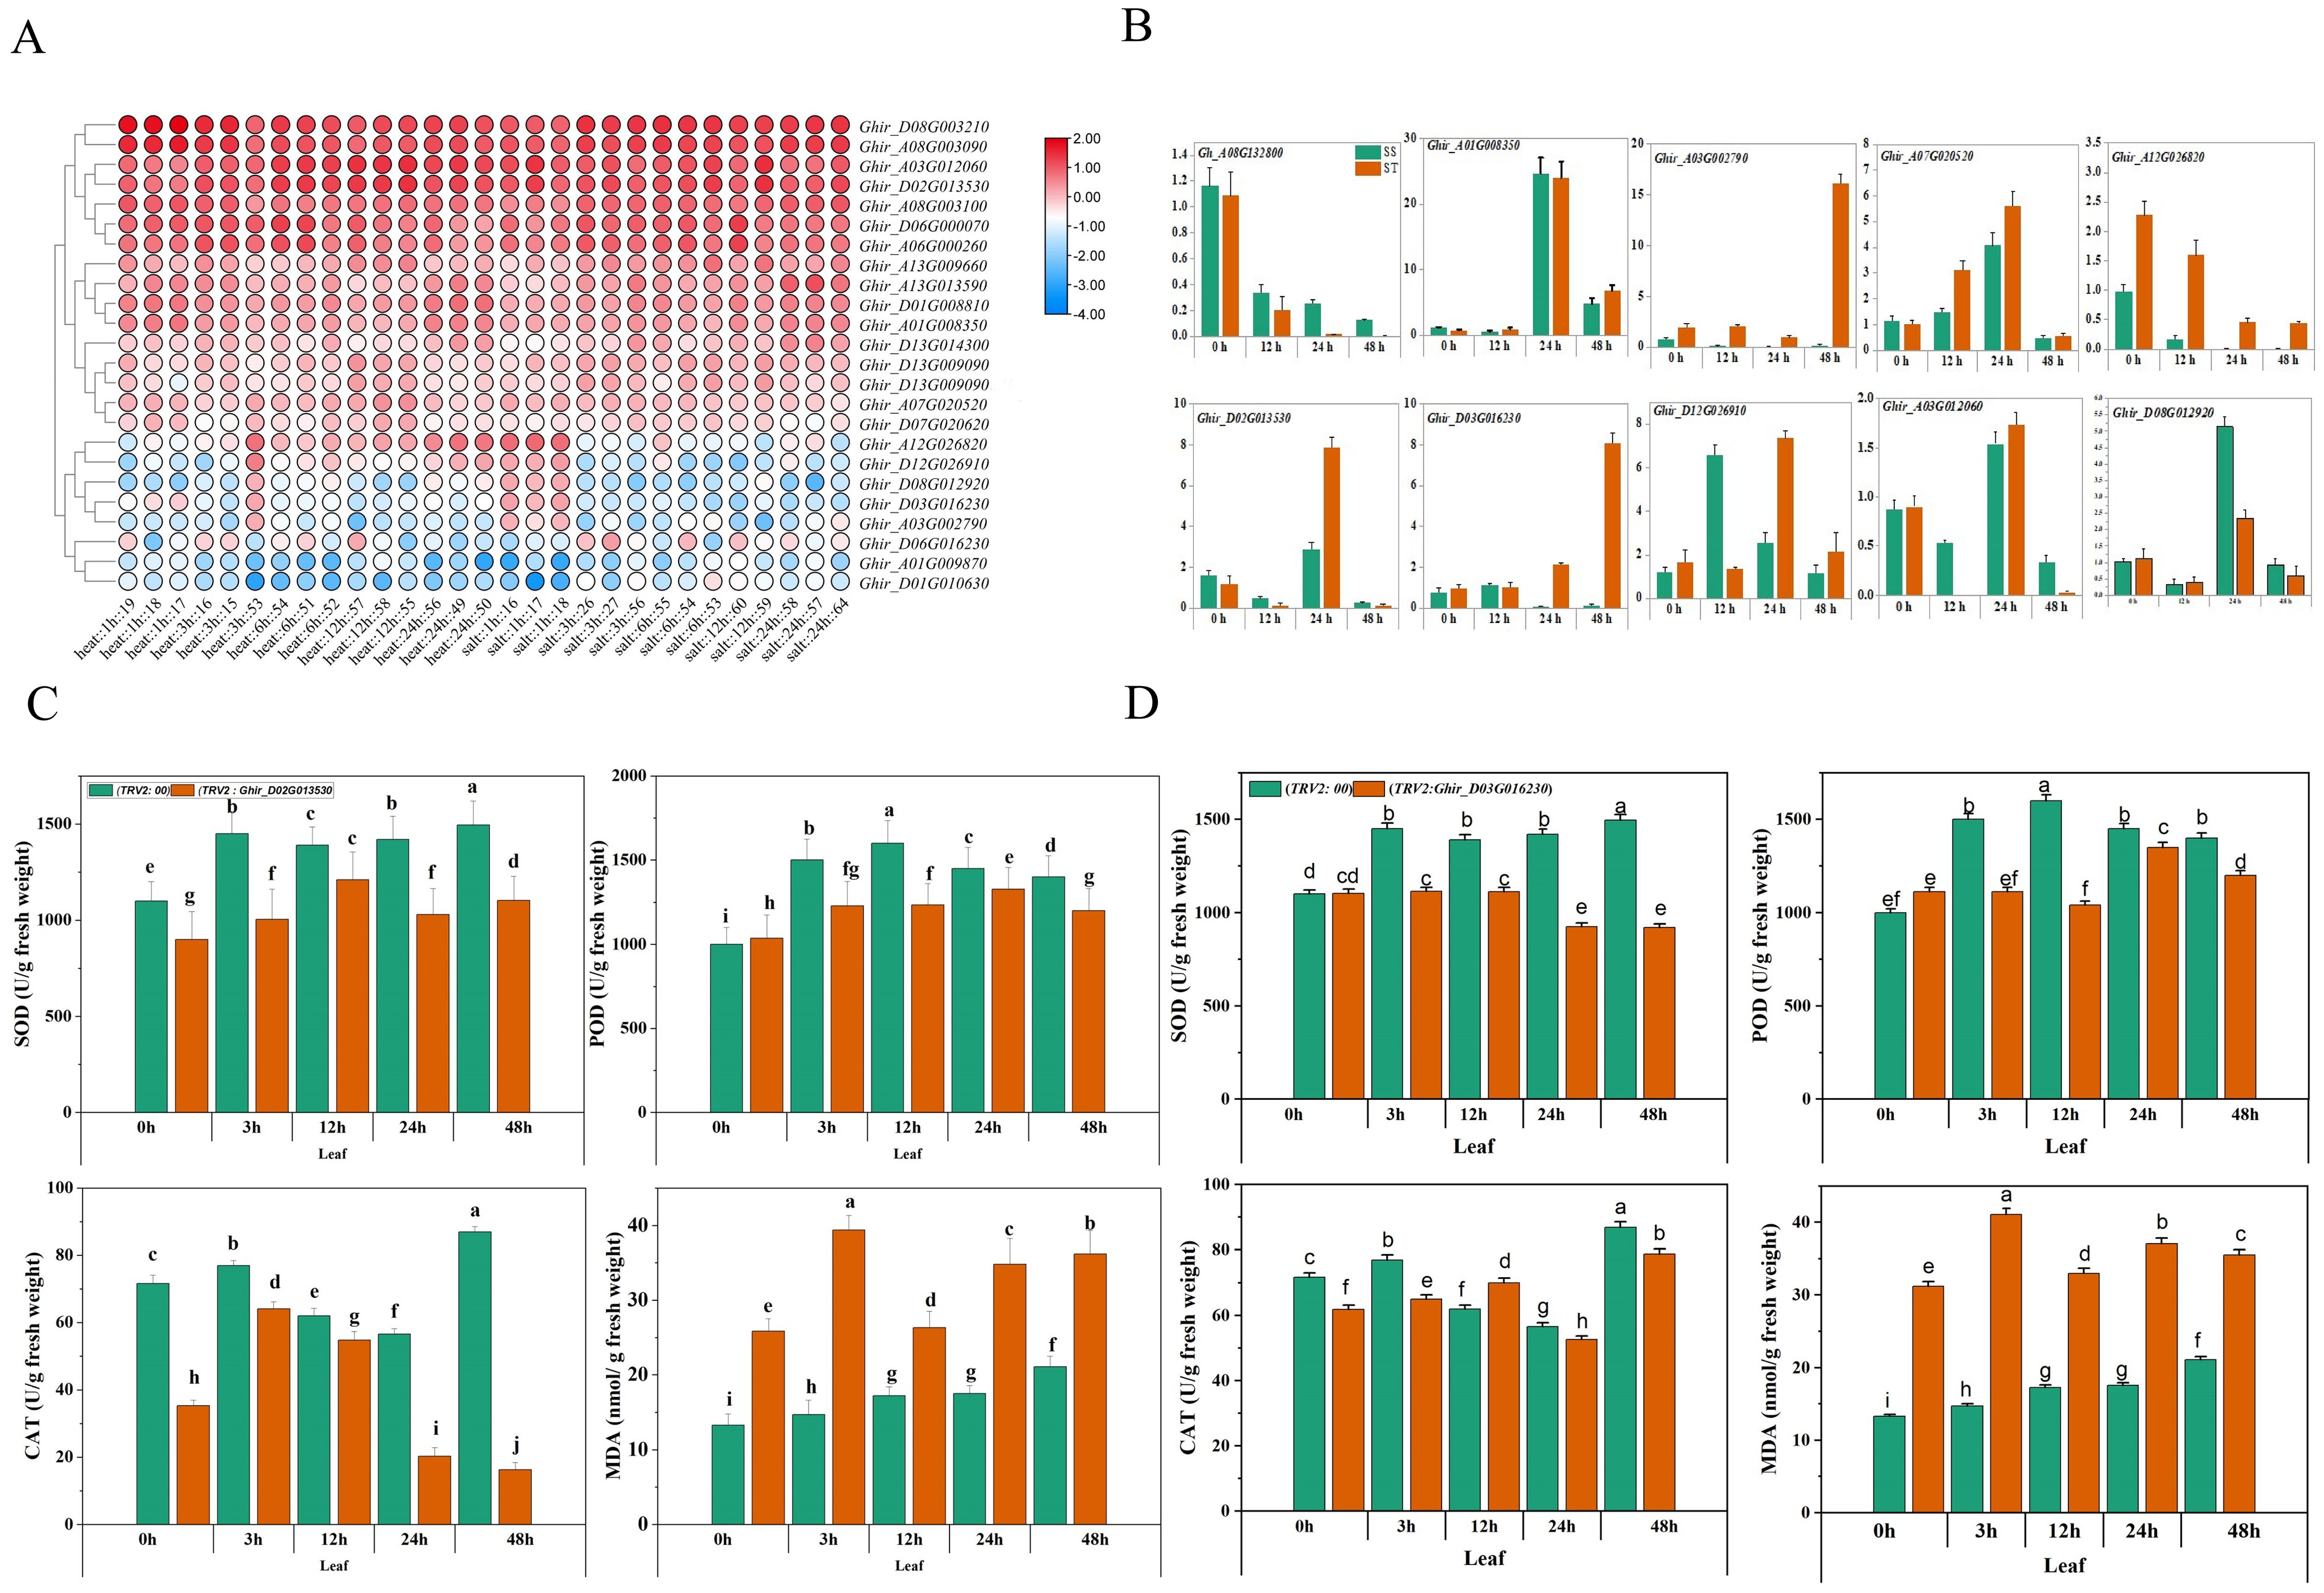
Figure 7. RNA expression profiling and qRT-PCR of HSP90 genes of G.hirsutum. (A) Heatmap showing expression of HSP90 genes under heat and salt stress at different time intervals. (B) qRT-PCR of ten genes under salt stress (C) Comparative expression of SOD, POD, CAT and MDA in leaf tissues of Ghir_D03G016530 and (D) Ghir_D02G013230 silenced plants of G.hirsutum. Different letters represent significant difference at p < 0.05.
Effect of gene silencing on ROS scavenging enzymes (SOD, POD, CAT), and lipid peroxidation marker MDA
Reactive oxygen species (ROS) scavenging enzymes such as SOD (Superoxide Dismutase) POD (Peroxidase) and, CAT (Catalase) play an imperative role in the plant’s defense mechanism against oxidative stress (Fujita and Hasanuzzaman, 2022). The silencing of Ghir_D02G013530 and Ghir_D03G016230 exhibited a significant difference in the expression of the scavenging enzymes and lipid peroxidation marker under salt stress at different time intervals. Figures 7C, D exhibits the contents of SOD, POD, CAT, and MDA in cotton seedlings subjected to the silencing of upregulated genes. The silencing of Ghir_D02G013530 exhibited an overall decrease of 23.43% in SOD content, 13.29% in POD content, and 49.53% in CAT contents of leaf tissue under salt stress. Moreover, a 93.71% increase in MDA content was observed. The lowest SOD, POD, and CAT contents -30.65%, -22.89%, and -85.61%, were found at 3h, 12h, and 24h time intervals respectively. Likewise, the highest MDA content 167.47% increase was found at a 3h time interval. Similarly, the silencing of Ghir_D03G016230 resulted in an average decrease of 24.50% in SOD expression, 16.32% in POD expression, and 7.30% in CAT expression in leaf tissue of the cotton seedlings under salt stress. Whereas, an overall 112.22% increase in MDA content was observed in Ghir_D03G016230 silenced plants, moreover highest differences of SOD, POD, and CAT contents -38.47%, -34.94%, and -15.45% were found at 48h, 12h, and 3h time intervals. In addition, leaf relative water contents and chlorophyl contents significantly reduced in cotton plants subjected to the silencing of Ghir_D03G016230 and Ghir_D02G013530 and subsequently treated with salt stress Figure 8.
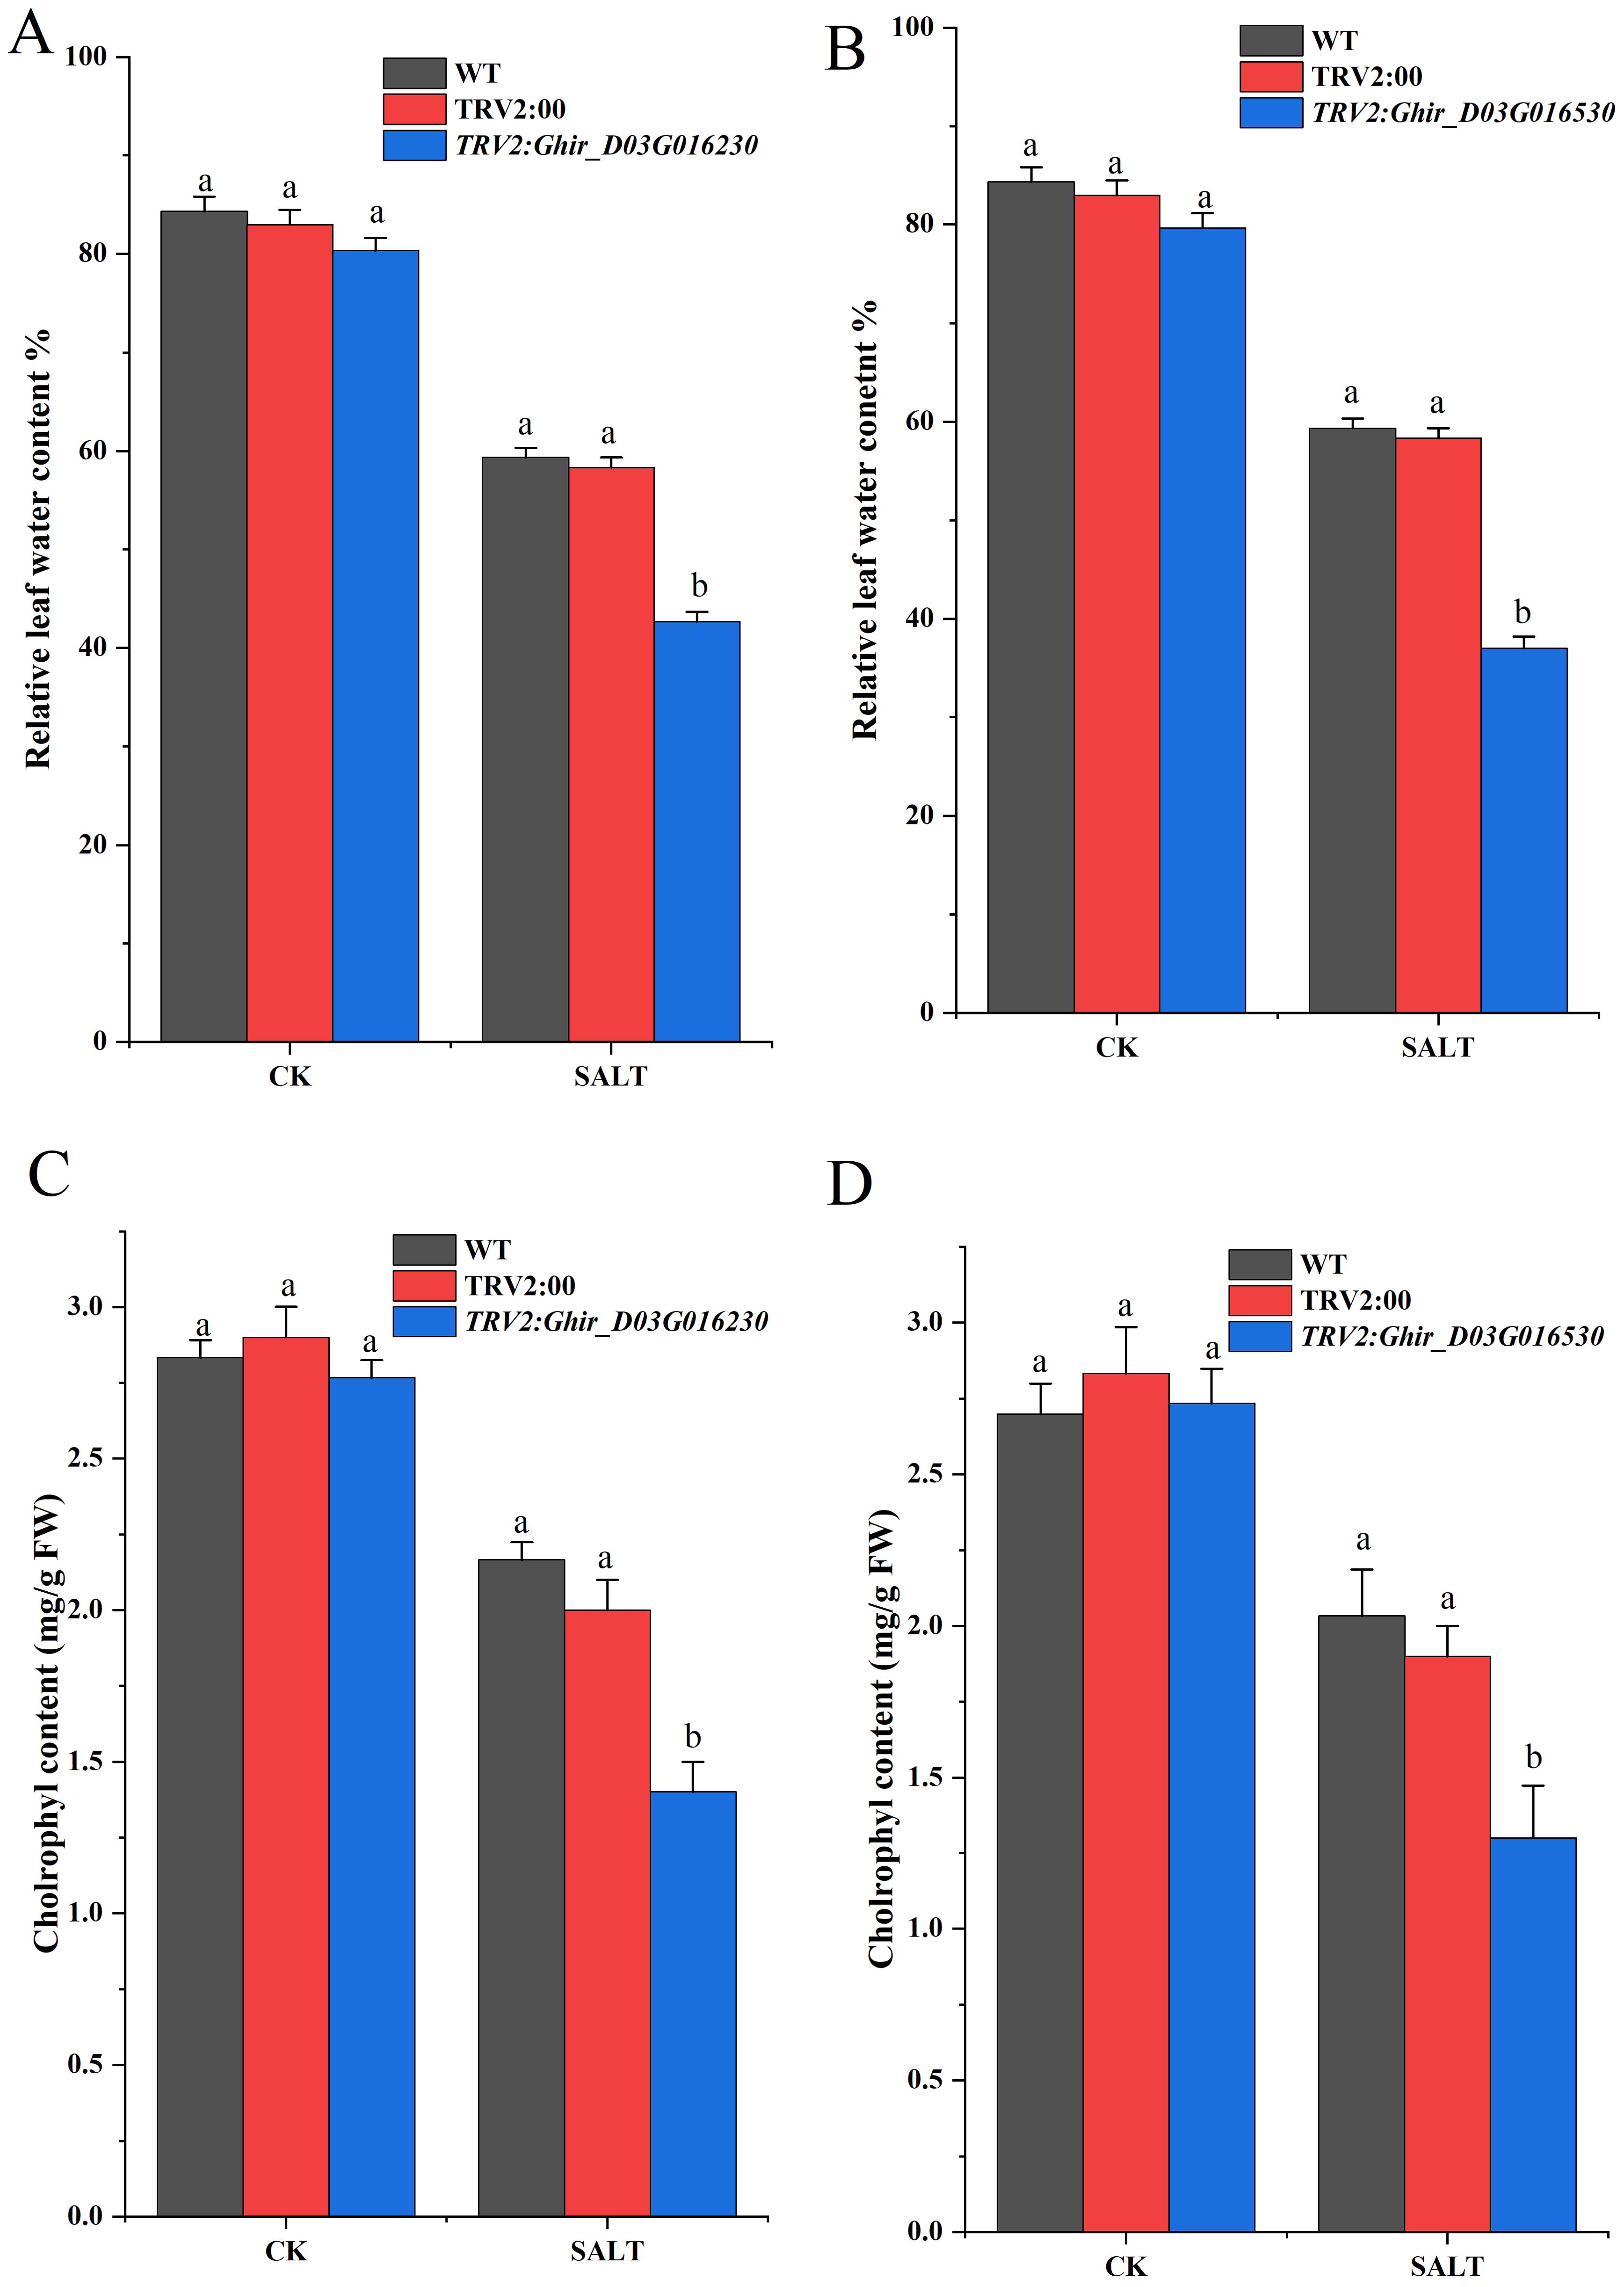
Figure 8. Quantitative determination of chlorophyl and leaf water contents. (A,B) Relative leaf water content of wild-type, control and Ghir_D02G013230 and Ghir_D03G016530 silenced plants (C,D) chlorophyl contents of wild-type, control and Ghir_D02G013230 and Ghir_D03G016530 silenced plants after 8-days of salt stress exposure. Letters depict significant differences (two-tailed, p < 0.01). each experiment was conducted in triplicate.
Discussion
Climate change is exacerbating the detrimental impact of high temperatures on crop growth, necessitating an intensified focus on investigating plant responses to heat stress to ensure optimal plant development (Shinozaki et al., 2006). Elevated temperatures, specifically a 5°C increase compared to normal conditions, impede physiological and biochemical reactions in organisms, leading to the inhibition of protein synthesis and mRNA transcription due to heat stress (Mittler et al., 2012). Under high-temperature stress, the expression of stress-related genes is often altered, with heat shock proteins (HSPs) being crucial for temperature acclimation. Heat shock proteins, such as HSP90, are rapidly synthesized in response to heat stress to facilitate temperature tolerance (Pearl and Prodromou, 2000; Tissiéres et al., 1974). In addition to heat stress, salt stress poses significant challenges to plant growth. Salinity, a prominent abiotic stress factor, primarily disrupts cellular homeostasis and ion distribution, leading to osmotic stress. Excessive salinity adversely affects multiple stages of plant development, causing growth retardation, biomass reduction, and leaf senescence (Munns and Tester, 2008; Parida and Das, 2005). Although heat shock protein HSP90 has been characterized in numerous plant species, limited information is available regarding HSP90 in cotton. Hence, in this study, we conducted a comprehensive analysis to identify and genetically examine the HSP90 gene family in Gossypium hirsutum. Furthermore, we investigated the expression patterns of these genes in response to salt and heat stress, thereby shedding light on their potential functions in G. hirsutum.
In contrast to the previously identified HSP90 gene families in other plant species, such as 7 in A. thaliana and 9 in rice (Krishna and Gloor, 2001), a significant increase in the number of HSP90 genes was observed in three cotton species, with a total of 56 genes identified. This substantial expansion in gene count could be attributed to the polyploidization event that occurred in Gossypium hirsutum following the hybridization of G. arboreum and G. raimondii (Wang et al., 2018). We identified 14 HSP90 genes each from Gossypium arboreum and G. raimondii, and 28 from G. hirsutum. This observation aligns with the known formation of allotetraploid G.hirsutum through the hybridization of G. arboreum and G. raimondii (Hu et al., 2019). The theoretical isoelectric points of all the proteins of G.arboreum were < 7, whereas all proteins of G.hirsutum were ascribed to have isoelectric points < 7 except for one protein. Only two proteins of G.raimondii have isoelectric point > 7. These results indicated that the HSP90 proteins of all the Gossypium species were acidic (Xia, 2007). Moreover, the grand average of hydropathy values of all proteins of cotton species was negative, indicating that all proteins were hydrophilic Table 1. The phylogenetic analysis of Gossypium and other plant species revealed that HSP90 genes in subgroup III have retained higher similarities in function and structure with non-cotton species. Moreover, subgroups I and II have likely undergone more lineage-specific evolution, indicating diversification among cotton species, probably adapting to certain specific environmental conditions and functional specialization exclusive to cotton as shown in Figure 3A. The phylogenetic analysis of three Gossypium species Figure 3B, further corroborated the results of a combined tree of cotton and other species. the phylogenetic tree of cotton species suggested that HSP90 genes among cotton species were not only conserved throughout evolution as subgroup III consists of genes of three cotton species showing a shared evolutionary pathway. More interestingly, it was observed that subgroup II has two genes from D subgenome of G.hirsutum grouped together with two genes of G.raimondii, which is an indication of the contribution of the special function genes from raimondii to hirsutum. These genes confirm that they have diverged from their progenitor (G.raimondii) to upland cotton. G.hirsutum is an allotetraploid species (2n= 4x=52) that originated from a hybridization event between A-genome species like G.arboreum or G.herbaceum and D genome progenitor-like G. raimondii. Comparative genomics analysis in previous studies has reported evidence of D-genome contribution from G.raimondii to G.hirsutum. Moreover, it can be inferred that during the inheritance of these genes there might still be some subtle evolutionary modifications that assisted G.hirsutum to adapt to new ecological niches or changing environmental patterns as compared to G.raimondii. These insights support our hypothesis that certain HSP90 genes mediating heat tolerance also play a key role in salt tolerance. Overall, It was found that the HSP90 genes in Gossypium species exhibited significant similarity and a monophyletic distribution within three phylogenetic subgroups, indicating a conserved evolutionary pattern of these genes.
In the current study, an examination of the gene structure in different groups revealed that the number of exons and the exon-intron arrangements of the HSP90 genes within each group were highly similar as shown in Figure 5B. Notably, three motifs (1, 2, and 3) as depicted in Figure 5C, were identified as being highly conserved, which might be due to selective pressure throughout the evolutionary time. They were present in all HSP90 genes across the three Gossypium species. Furthermore, the distribution of these motifs exhibited a consistent pattern among all HSP90 genes. The highly conserved motifs often indicate the crucial functional elements within genes. These motifs play key functional roles in several important processes such as DNA binding, enzymatic actions, and protein-protein interactions. The findings of conserved motifs are indicative of their key roles necessary for the adaptations and proper functioning of the plant. Motifs which are part of the regulatory regions, may be critical for the desired expression of the genes mediating key developmental phases and stress responses. These analyses provide evidence supporting the reliability of the evolutionary classification of HSP90 genes.
Excessive salinity, in particular, is a significant variable that adversely affects cotton production globally (Sharif et al., 2019). The analysis of cis-regulatory elements (CREs) revealed that the HSP90 genes possess a substantial enrichment of important cis-regulatory elements that play a crucial role in mitigating environmental stresses. In the current study, a diverse array of CREs such as abscisic acid-responsive elements (ABRE), anaerobic induction, light, Methyl jasmonate (MeJA), gibberellin, drought, defense, salicylic acid, auxin, low-temperature, wound responsive CREs were found across the three cotton species Figure 6. Among these cis-regulatory elements, several CREs play pertinent roles in the salt and heat stress tolerance of cotton plants. Among these CREs, ABREs and MeJA-responsive elements play a key role in salt tolerance in plants. Previous studies have reported that the ABA hormone accumulates under salt stress and binds to the receptors initiating the ABA signaling pathway (Feng et al., 2019). This binding results in the activation of basic leucine zipper bZIP transcription factors called ABRE binding factors ABFs (Shrestha et al., 2021). The ABFs resultantly bind to the ABREs present in the promoter region of their respective genes, thereby inducing their transcription (Bhat et al., 2024). Several ABFs encode proteins crucial for the salt tolerance mechanisms such as biosynthesis of proline and glycine betaine osmolytes to maintain osmotic balance. Moreover, activation of the antioxidant system and signaling of stress-responsive signaling cascades aid in the salt tolerance of plants. Similarly, MeJA enhances salt tolerance of plants in several ways such as regulating antioxidant systems and phytohormones levels, inducing stress-responsive genes thereby protecting cell organelles and interacting with other signaling pathways (Delgado et al., 2021; Yin et al., 2023; Zhang et al., 2023). The MeJA induces the activities of reactive oxygen species scavenging enzymes such as SOD, POD, and CAT to alleviate oxidative damage caused by salt stress. Moreover, a study reported that MeJA increases the levels of auxin and cytokinins to enhance plant growth and delay senescence under salt stress (Zhang et al., 2023). These findings further support our results of comparatively elevated levels of SOD, POD, and CAT in salt-tolerant genotype HNZ2019–2520 than salt-sensitive genotype HNZ2019-252, and the potential role of MeJA responsive elements in regulating salt tolerance mechanism.
Multiple studies have provided evidence of the involvement of HSP90 genes in response to abiotic stress (Panaretou, 1998; Pearl and Prodromou, 2000). Song et al. studied the dynamic expression levels of Nicotiana tabacum L. HSP90 genes under various abiotic stress conditions, including salt, ABA, drought, cold, and heat stresses. The results demonstrated that the expression of NtHSP90-4, NtHSP90-5, and NtHSP90–9 was up-regulated. Furthermore, the expression of NtHSP90 genes was induced by salt, ABA, drought, cold, and heat stresses, indicating their potential involvement in abiotic stress responses (Song et al., 2019).
The heatmap of publicly available data of HSP90 genes exhibited upregulation of most of the genes under heat and salt stress at different time intervals, which is indicative of the fact that HSP90 genes play a key role in salt and heat stress tolerance. Moreover, the qRT-PCR analysis of key candidate genes exhibited differential expression of the HSP90 genes in salt-tolerant and sensitive genotypes, which is an indication of the activity of HSP90 genes in the salt tolerance mechanism. A previous study of HSP90 genes in Brassica napus L. confirmed that HSP90 genes play a critical role in biotic and abiotic stress, particularly under salt stress (Wang et al., 2022). Zhang et al. reported that expression of HSP90 genes was prolonged or increased under salt stress in Brachypodium distachyon L (Zhang et al., 2017).
In the present study, an analysis of expression patterns revealed that the expressions of Ghir_D08G003210, Ghir_A08G003090, Ghir_A13G013590, and Ghir_A12G026820 were induced by salt stress. Additionally, in the qRT-PCR analysis, Ghir_A07G020520, Ghir_D02G013530, Ghir_D03G016230, and Ghir_D12G026910 exhibited significant differential expression between salt-sensitive and salt-tolerant genotypes of G.hirsutum. Significantly higher expression of certain HSP90 genes and elevated accumulation of SOD, POD and CAT enzymes in salt tolerant genotype explain the level of tolerance of cotton plants under salt stress. Moreover, the silencing of candidate genes Ghir_D02G013530, and Ghir_D03G016230 revealed that the expression of SOD, POD, and CAT was intertwined with the expression of potential candidate genes of HSP90s. The silencing of Ghir_D02G013530 and Ghir_D03G016230 significantly reduced the accumulation of ROSs scavenging enzymes under salt stress and elevated the accumulation of MDA in salt tolerant genotype. It is a clear indication of the damage caused by salt stress and no/low expression of the HSP90 candidate genes. Moreover, reduction in leaf relative water contents and chlorophyl contents paraded that silencing of the candidate genes significantly reduced the ability of cotton seedlings to tolerate the effects caused by the salt stress. These findings provide important insights into the potential role of HSP90 genes in the salt tolerance mechanism of cotton plants. However, further functional validation of candidate genes and the production pattern of SOD, POD, CAT, and MDA in a large collection of germplasm could help to understand the markers of salt tolerance mechanism in cotton plants. In agreement with the previous reports of the potential role of HSP90 genes in heat stress tolerance, the results of the current study revealed that HSP90 genes not only play a key role in heat tolerance but also the salt tolerance mechanism of plants due to shared genes of multiple stress tolerance pathways.
Data availability statement
The original contributions presented in the study are included in the article/Supplementary Material. Further inquiries can be directed to the corresponding author/s.
Author contributions
ZH: Conceptualization, Investigation, Methodology, Writing - original draft, Writing - review & editing: QF. Data curation and Formal analysis, Writing-original draft, Writing - review & editing. XM: Resources, Investigation, Software, Writing - original draft, Writing - review & editing. DQ: Formal analysis, Software, Writing - original draft. YQ: Validation, Visualization, Writing - original draft, Writing - review & editing. ZY: Visualization, Data curation, Writing - original draft, Writing - review and editing. ME: Resources, Writing - original draft, Writing - review and funding. EK: Visualization, Resources, Writing - original draft, Writing -review and funding. YM: Writing – original draft, Writing - review & editing. JR: Supervision, Writing - original draft, Writing - review & editing.
Funding
The author(s) declare that financial support was received for the research and/or publication of this article. This work was supported by the National Natural Science Foundation of China (Grant NO 31301372) and Zhejiang Provincial Natural Science Foundation (Grant NO LY21C13002) to YuRong Jiang. The research was supported jointly by College Students’ Innovative Research Projects of Zhejiang Agricultural and Forestry University (2023KX002, 2023KX011). The authors extend their appreciation to the Deanship of Research and Graduate Studies at King Khalid University for funding this work through a large research groups Project under grant number RGP2/118/45.
Acknowledgments
The authors extend their appreciation to the Deanship of Research and Graduate Studies at King Khalid University for funding this work through a large research groups Project under grant number RGP2/118/45.
Conflict of interest
The authors declare that the research was conducted in the absence of any commercial or financial relationships that could be construed as a potential conflict of interest.
The author(s) declared that they were an editorial board member of Frontiers, at the time of submission. This had no impact on the peer review process and the final decision.
Generative AI statement
The author(s) declare that no Generative AI was used in the creation of this manuscript.
Publisher’s note
All claims expressed in this article are solely those of the authors and do not necessarily represent those of their affiliated organizations, or those of the publisher, the editors and the reviewers. Any product that may be evaluated in this article, or claim that may be made by its manufacturer, is not guaranteed or endorsed by the publisher.
Supplementary material
The Supplementary Material for this article can be found online at: https://www.frontiersin.org/articles/10.3389/fpls.2025.1574604/full#supplementary-material
References
Alici, E. H. and Arabaci, G. (2016). Determination of SOD, POD, PPO and cat enzyme activities in Rumex obtusifolius L. Annu. Res. Rev. Biol. 11, 1–7. doi: 10.9734/ARRB/2016/29809
Al-Whaibi, M. H. (2011). Plant heat-shock proteins: A mini review. J. King. Saud. Univ. - Sci. 23, 139–150. doi: 10.1016/j.jksus.2010.06.022
Bailey, T. L., Williams, N., Misleh, C., and Li, W. W. (2006). MEME: discovering and analyzing DNA and protein sequence motifs. Nucleic Acids Res. 34, W369–W373. doi: 10.1093/nar/gkl198
Bandurska, H. (2022). Drought stress responses: coping strategy and resistance. Plants 11, 922. doi: 10.3390/plants11070922
Bhat, B. A., Mir, R. A., Mir, W. R., Hamdani, S. S., and Mir, M. A. (2024). Transcription factors-golden keys to modulate the plant metabolism to develop salinity tolerance. Plant Stress 11, 100409. doi: 10.1016/j.stress.2024.100409
Caplan, A. J., Jackson, S., and Smith, D. (2003). Hsp90 reaches new heights. EMBO Rep. 4, 126–130. doi: 10.1038/sj.embor.embor742
Chen, C., Chen, H., Zhang, Y., Thomas, H. R., Frank, M. H., He, Y., et al. (2020). TBtools: an integrative toolkit developed for interactive analyses of big biological data. Mol. Plant 13, 1194–1202. doi: 10.1016/j.molp.2020.06.009
Chou, K.-C. and Shen, H.-B. (2008). Cell-PLoc: a package of Web servers for predicting subcellular localization of proteins in various organisms. Nat. Protoc. 3, 153–162. doi: 10.1038/nprot.2007.494
Delgado, C., Mora-Poblete, F., Ahmar, S., Chen, J.-T., and Figueroa, C. R. (2021). Jasmonates and plant salt stress: molecular players, physiological effects, and improving tolerance by using genome-associated tools. Int. J. Mol. Sci. 22, 3082. doi: 10.3390/ijms22063082
Feng, R.-J., Ren, M.-Y., Lu, L.-F., Peng, M., Guan, X., Zhou, D.-B., et al. (2019). Involvement of abscisic acid-responsive element-binding factors in cassava (Manihot esculenta) dehydration stress response. Sci. Rep. 9, 12661. doi: 10.1038/s41598-019-49083-3
Finn, R. D., Coggill, P., Eberhardt, R. Y., Eddy, S. R., Mistry, J., Mitchell, A. L., et al. (2015). The Pfam protein families database: towards a more sustainable future. Nucleic Acids Res. 44, D279–D285. doi: 10.1093/nar/gkv1344
Fujita, M. and Hasanuzzaman, M. (2022). Approaches to enhancing antioxidant defense in plants. Antioxidants 11, 925. doi: 10.3390/antiox11050925
Gao, X., Britt, R. C., Jr., Shan, L., and He, P. (2011). Agrobacterium-mediated virus-induced gene silencing assay in cotton. JoVE 54), e2938. doi: 10.3791/2938
Goldberg, T., Hecht, M., Hamp, T., Karl, T., Yachdav, G., Ahmed, N., et al. (2014). LocTree3 prediction of localization. Nucleic Acids Res. 42, W350–W355. doi: 10.1093/nar/gku396
Horton, P., Park, K.-J., Obayashi, T., Fujita, N., Harada, H., Adams-Collier, C. J., et al. (2007). WoLF PSORT: protein localization predictor. Nucleic Acids Res. 35, W585–W587. doi: 10.1093/nar/gkm259
Hsu, A.-L., Murphy, C. T., and Kenyon, C. (2003). Regulation of aging and age-related disease by DAF-16 and heat-shock factor. Science 300, 1142–1145. doi: 10.1126/science.1083701
Hu, Y., Chen, J., Fang, L., Zhang, Z., Ma, W., Niu, Y., et al. (2019). Gossypium barbadense and Gossypium hirsutum genomes provide insights into the origin and evolution of allotetraploid cotton. Nat. Genet. 51, 739–748. doi: 10.1038/s41588-019-0371-5
Hu, W., Hu, G., and Han, B. (2009). Genome-wide survey and expression profiling of heat shock proteins and heat shock factors revealed overlapped and stress specific response under abiotic stresses in rice. Plant Sci. 176, 583–590. doi: 10.1016/j.plantsci.2009.01.016
Hu, B., Jin, J., Guo, A. Y., Zhang, H., Luo, J., and Gao, G. (2015). GSDS 2.0: an upgraded gene feature visualization server. Bioinformatics 31, 1296–1297. doi: 10.1093/bioinformatics/btu817
Huang, L.-Z., Zhou, M., Ding, Y.-F., and Zhu, C. (2022). Gene networks involved in plant heat stress response and tolerance. Int. J. Mol. Sci. 23, 11970. Available at: https://www.mdpi.com/1422-0067/23/19/11970.
Khan, M. I. R., Fatma, M., Per, T. S., Anjum, N. A., and Khan, N. A. (2015). Salicylic acid-induced abiotic stress tolerance and underlying mechanisms in plants. Front. Plant Sci. 6. doi: 10.3389/fpls.2015.00462
King, A. M. and MacRae, T. H. (2015). Insect Heat Shock Proteins During Stress and Diapause. Annual Review of Entomology 60(60), 59–75. doi: 10.1146/annurev-ento-011613-162107
Krishna, P. and Gloor, G. (2001). The Hsp90 family of proteins in Arabidopsis thaliana. Cell Stress Chaperones. 6, 238–246. doi: 10.1379/1466-1268(2001)006<0238:thfopi>2.0.co;2
Lachowiec, J., Lemus, T., Borenstein, E., and Queitsch, C. (2014). Hsp90 promotes kinase evolution. Mol. Biol. Evol. 32, 91–99. doi: 10.1093/molbev/msu270
Larkin, M. A., Blackshields, G., Brown, N. P., Chenna, R., McGettigan, P. A., McWilliam, H., et al. (2007). Clustal W and clustal X version 2.0. Bioinformatics 23, 2947–2948. doi: 10.1093/bioinformatics/btm404
Liu, J. J. and Ekramoddoullah, A. K. M. (2006). The family 10 of plant pathogenesis-related proteins: Their structure, regulation, and function in response to biotic and abiotic stresses. Physiol. Mol. Plant Pathol. 68, 3–13. doi: 10.1016/j.pmpp.2006.06.004
Livak, K. J. and Schmittgen, T. D. (2001). Analysis of relative gene expression data using real-time quantitative PCR and the 2–ΔΔCT method. Methods 25, 402–408. doi: 10.1006/meth.2001.1262
Magwanga, R. O., Lu, P., Kirungu, J. N., Dong, Q., Cai, X., Zhou, Z., et al. (2019). Knockdown of Cytochrome P450 Genes Gh_D07G1197 and Gh_A13G2057 on Chromosomes D07 and A13 Reveals Their Putative Role in Enhancing Drought and Salt Stress Tolerance in Gossypium hirsutum. Genes 10, 226. Available at: https://www.mdpi.com/2073-4425/10/3/226.
Mittler, R., Finka, A., and Goloubinoff, P. (2012). How do plants feel the heat? Trends Biochem. Sci. 37, 118–125. doi: 10.1016/j.tibs.2011.11.007
Mukhopadhyay, I., Nazir, A., Saxena, D. K., and Chowdhuri, D. K. (2003). Heat shock response: hsp70 in environmental monitoring. J. Biochem. Mol. Toxicol. 17, 249–254. doi: 10.1002/jbt.10086
Munns, R. and Tester, M. (2008). Mechanisms of salinity tolerance. Annu. Rev. Plant Biol. 59, 651–681. doi: 10.1146/annurev.arplant.59.032607.092911
Nakashima, K. and Yamaguchi-Shinozaki, K. ABA signaling in stress-response and seed development. Plant Cell Rep. (2013) 32, 959–970. doi: 10.1007/s00299-013-1418-1
Panaretou, B., Prodromou, C., Roe, S. M., O'Brien, R., Ladbury, J. E., Piper, P. W, et al. (1998). ATP binding and hydrolysis are essential to the function of the Hsp90 molecular chaperone in vivo. The EMBO Journal 17(16), 4829–4836. doi: 10.1093/emboj/17.16.4829
Parida, A. K. and Das, A. B. (2005). Salt tolerance and salinity effects on plants: a review. Ecotoxicol. Environ. Saf. 60, 324–349. doi: 10.1016/j.ecoenv.2004.06.010
Pearl, L. H. and Prodromou, C. (2000). Structure and in vivo function of Hsp90. Curr. Opin. Struct. Biol. 10, 46–51. doi: 10.1016/S0959-440X(99)00047-0
Picard, D. (2002). Heat-shock protein 90, a chaperone for folding and regulation. Cell. Mol. Life Sci. CMLS. 59, 1640–1648. doi: 10.1007/PL00012491
Prasinos, C., Krampis, K., Samakovli, D., and Hatzopoulos, P. (2004). Tight regulation of expression of two Arabidopsis cytosolic Hsp90 genes during embryo development. J. Exp. Bot. 56, 633–644. doi: 10.1093/jxb/eri035
Pratt, W. B. and Toft, D. O. (2003). Regulation of signaling protein function and trafficking by the hsp90/hsp70-based chaperone machinery. Exp. Biol. Med. 228, 111–133. doi: 10.1177/153537020322800201
Qin, Q., Zhao, Y., Zhang, J., Chen, L., Si, W., and Jiang, H. (2022). A maize heat shock factor ZmHsf11 negatively regulates heat stress tolerance in transgenic plants. BMC Plant Biol. 22, 406. doi: 10.1186/s12870-022-03789-1
Queitsch, C., Sangster, T. A., and Lindquist, S. (2002). Hsp90 as a capacitor of phenotypic variation. Nature 417, 618–624. doi: 10.1038/nature749
Razzaque, S., Elias, S. M., Haque, T., Biswas, S., Jewel, G. M. N. A., Rahman, S., et al. (2019). Gene Expression analysis associated with salt stress in a reciprocally crossed rice population. Sci. Rep. 9, 8249. doi: 10.1038/s41598-019-44757-4
Rychlik, W. (2007). OLIGO 7 Primer Analysis Software. In A. Yuryev (Ed.), PCR Primer Design Humana Press. 35–59. doi: 10.1007/978-1-59745-528-2_2
Robert, J. (2003). Evolution of heat shock protein and immunity. Dev. Comp. Immunol. 27, 449–464. doi: 10.1016/S0145-305X(02)00160-X
Rodriguez, R. J., Henson, J., Van Volkenburgh, E., Hoy, M., Wright, L., Beckwith, F., et al. (2008). Stress tolerance in plants via habitat-adapted symbiosis. ISME. J. 2, 404–416. doi: 10.1038/ismej.2007.106
Schmedes, A. and Hølmer, G. (1989). A new thiobarbituric acid (TBA) method for determining free malondialdehyde (MDA) and hydroperoxides selectively as a measure of lipid peroxidation. J. Am. Oil Chemists’. Soc. 66, 813–817. doi: 10.1007/BF02653674
Sharif, I., Aleem, S., Farooq, J., Rizwan, M., Younas, A., Sarwar, G., et al. (2019). Salinity stress in cotton: effects, mechanism of tolerance and its management strategies. Physiol. Mol. Biol. Plants 25, 807–820. doi: 10.1007/s12298-019-00676-2
Sha Valli Khan, P. S., Nagamallaiah, G. V., Dhanunjay Rao, M., Sergeant, K., and Hausman, J. F. (2014). “Chapter 2 - abiotic stress tolerance in plants: insights from proteomics,” in Emerging Technologies and Management of Crop Stress Tolerance. Eds. Ahmad, P. and Rasool, S. (Springer Singapore: Academic Press), 23–68. doi: 10.1016/B978-0-12-800875-1.00002-8
Shinozaki, F., Minami, M., Chiba, T., Suzuki, M., Yoshimatsu, K., Ichikawa, Y., et al. (2006). Depletion of hsp90β Induces multiple defects in B cell receptor signaling*. J. Biol. Chem. 281, 16361–16369. doi: 10.1074/jbc.M600891200
Shrestha, A., Cudjoe, D. K., Kamruzzaman, M., Siddique, S., Fiorani, F., Léon, J., et al. (2021). Abscisic acid-responsive element binding transcription factors contribute to proline synthesis and stress adaptation in Arabidopsis. J. Plant Physiol. 261, 153414. doi: 10.1016/j.jplph.2021.153414
Song, Z., Pan, F., Yang, C., Jia, H., Jiang, H., He, F., et al. (2019). Genome-wide identification and expression analysis of HSP90 gene family in Nicotiana tabacum. BMC Genet. 20, 35. doi: 10.1186/s12863-019-0738-8
Sudhir, K, Glen, S, and Koichiro, T. MEGA7: Molecular Evolutionary Genetics Analysis Version 7.0 for Bigger Datasets. Molecular Biology and Evolution. (2016) 33(7), 1870–1874. doi: 10.1093/molbev/msw054
Tissiéres, A., Mitchell, H. K., and Tracy, U. M. (1974). Protein synthesis in salivary glands of Drosophila melanogaster: Relation to chromosome puffs. J. Mol. Biol. 84, 389–398. doi: 10.1016/0022-2836(74)90447-1
Trono, D. and Pecchioni, N. (2022). Candidate genes associated with abiotic stress response in plants as tools to engineer tolerance to drought, salinity and extreme temperatures in wheat: an overview. Plants 11, 3358. Available at: https://www.mdpi.com/2223-7747/11/23/3358.
Ullah, A., Sun, H., Hakim, Yang, X., and Zhang, X. (2018). A novel cotton WRKY gene, GhWRKY6-like, improves salt tolerance by activating the ABA signaling pathway and scavenging of reactive oxygen species. Physiol. Plant. 162, 439–454. doi: 10.1111/ppl.12651
Wang, L., Liu, F., Ju, L., Xue, B., Wang, Y., Wang, D., et al. (2022). Genome Structures and Evolution Analysis of Hsp90 Gene Family in Brassica napus Reveal the Possible Roles of Members in Response to Salt Stress and the Infection of Sclerotinia sclerotiorum. Front. Plant Sci. 13. doi: 10.3389/fpls.2022.854034
Wang, W., Vinocur, B., Shoseyov, O., and Altman, A. (2004). Role of plant heat-shock proteins and molecular chaperones in the abiotic stress response. Trends Plant Sci. 9, 244–252. doi: 10.1016/j.tplants.2004.03.006
Wang, M., Wang, P., Lin, M., Ye, Z., Li, G., Tu, L., et al. (2018). Evolutionary dynamics of 3D genome architecture following polyploidization in cotton. Nat. Plants 4, 90–97. doi: 10.1038/s41477-017-0096-3
Xia, X. (2007). “Protein isoelectric point,” in Bioinformatics and the Cell: Modern Computational Approaches in Genomics, Proteomics and Transcriptomics. Springer Cham, Switzerland 207–219.
Xiong, L. and Ishitani, M. (2006). “Stress Signal Transduction: components, pathways and network integration,” in Abiotic stress tolerance in plants. Eds. Rai, A. K. and Takabe, T. (Springer Netherlands), 3–29. doi: 10.1007/1-4020-4389-9_1
Yasir, M., He, S., Sun, G., Geng, X., Pan, Z., Gong, W., et al. (2019). A Genome-wide association study revealed key SNPs/genes associated with salinity stress tolerance in upland cotton. Genes 10, 829. Available at: https://www.mdpi.com/2073-4425/10/10/829.
Yasir, M., Kanwal, H. H., Hussain, Q., Riaz, M. W., Sajjad, M., Rong, J., et al. (2022). Status and prospects of genome-wide association studies in cotton. Front. Plant Sci. 13. doi: 10.3389/fpls.2022.1019347
Yazaki, J., Kishimoto, N., Nagata, Y., Ishikawa, M., Fujii, F., Hashimoto, A, et al. (2003). Genomics Approach to Abscisic Acid- and Gibberellin-responsive Genes in Rice. DNA Research 10(6), 249–261. doi: 10.1093/dnares/10.6.249
Yin, Y., Yang, T., Li, S., Li, X., Wang, W., and Fan, S. (2023). Transcriptomic analysis reveals that methyl jasmonate confers salt tolerance in alfalfa by regulating antioxidant activity and ion homeostasis. Front. Plant Sci. 14. doi: 10.3389/fpls.2023.1258498
Zhang, X., Goatley, M., Wang, K., Conner, J., Brown, I., and Kosiarski, K. (2023). Methyl jasmonate enhances salt stress tolerance associated with antioxidant and cytokinin alteration in perennial ryegrass. Grass. Res. 3. doi: 10.48130/GR-2023-0006
Zhang, M., Shen, Z., Meng, G., Lu, Y., and Wang, Y. (2017). Genome-wide analysis of the Brachypodium distachyon (L.) P. Beauv. Hsp90 gene family reveals molecular evolution and expression profiling under drought and salt stresses. PloS One 12, e0189187. doi: 10.1371/journal.pone.0189187
Zhao, Y., Li, M.-C., Konaté, M. M., Chen, L., Das, B., Karlovich, C., et al. (2021). TPM, FPKM, or normalized counts? A comparative study of quantification measures for the analysis of RNA-seq data from the NCI patient-derived models repository. J. Trans. Med. 19, 269. doi: 10.1186/s12967-021-02936-w
Keywords: Gossypium hirsutum, Hsp90, salt stress, VIGS, cotton
Citation: Hao ZY, Feng Q, Man XY, Qi DQ, Qing YS, Yang ZW, Elbagory M, Kasem ES, Yasir M and Rong JY (2025) Genome-wide identification and characterization of HSP90 family gene in cotton and their potential role in salt stress tolerance. Front. Plant Sci. 16:1574604. doi: 10.3389/fpls.2025.1574604
Received: 11 February 2025; Accepted: 16 May 2025;
Published: 02 July 2025.
Edited by:
Kai-Hua Jia, Shandong Academy of Agricultural Sciences, ChinaReviewed by:
Salman Naveed, ORISE-USDA, United StatesHongliang Jian, Institute of Cotton Research (CAAS), China
Eryong Chen, Henan Institute of Science and Technology, China
Copyright © 2025 Hao, Feng, Man, Qi, Qing, Yang, Elbagory, Kasem, Yasir and Rong. This is an open-access article distributed under the terms of the Creative Commons Attribution License (CC BY). The use, distribution or reproduction in other forums is permitted, provided the original author(s) and the copyright owner(s) are credited and that the original publication in this journal is cited, in accordance with accepted academic practice. No use, distribution or reproduction is permitted which does not comply with these terms.
*Correspondence: Muhammad Yasir, MjAyMTQwMDhAemFmdS5lZHUuY24=; Jiang Yu Rong, anl1cm9uZ2ppYW5nNzQ2QDEyNi5jb20=
†These authors share first authorship