 Chaomin Meng
 Haojie Guo†
- College of Agriculture, Henan University of Science and Technology, Luoyang, China
Glycerophosphodiester phosphodiesterase (GDPD) catalyzes the hydrolysis of glycerophosphodiesters into sn-glycerol-3-phosphate (G-3-P) and corresponding alcohols, which is integral to various physiological processes in plants. However, our comprehension of the GDPD gene family in foxtail millet (Setaria italica L.) remains limited and unclear. This study aimed to identify and predict the function of GDPD gene family members in foxtail millet through a comprehensive genome-wide analysis.14 SiGDPD genes were identified in the foxtail millet genome. Phylogenetic analysis categorized SiGDPD proteins into five groups. Promoter regions of SiGDPD genes contained multiple cis-acting elements related to light response, hormone regulation, and stress response. Phylogenetic and collinearity analyses demonstrated conservation of GDPD proteins among foxtail millet, sorghum, rice, and maize, with the SiGDPD gene family undergoing purifying selection during evolution.Tissue differential expression analysis revealed distinct expression patterns of SiGDPD genes across various tissues, showing spatiotemporal expression characteristics. Under low phosphorus stress, the expression levels of SiGDPD3 and SiGDPD14 significantly increased, while SiGDPD1, SiGDPD5, SiGDPD6, and SiGDPD11 showed significant decreases.To identify the function of SiGDPD14, an over-expressed transgenic Arabidopsis was generated. The results showed that transgenic Arabidopsis thaliana plants over-expressing SiGDPD14 exhibited enhanced tolerance to low phosphorus stress.Taken together, the results of this study provide valuable information for further studies on candidate SiGDPD genes involved in the phosphate deficiency response in foxtail millet.
1 Introduction
Glycerophosphodiester phosphodiesterases (GDPDs), also referred to as GPX-PDEs, predominantly facilitate the catabolism of glycerophosphodiesters into sn-glycerol-3-phosphate (G-3-P) and their corresponding alcohol derivatives. These enzymes play a pivotal role in sustaining phosphate (Pi) homeostasis, particularly within phosphorus (P)-deficient environments (Ohshima et al., 2008; Cheng Y et al., 2011; Vander Rest et al., 2002). GDPDs specifically target glycerophosphodiesters—products arising from the deacylation of membrane phospholipids—including glycerophosphocholine (GPC), glycerophosphoethanolamine (GPE), glycerophosphoinositol (GPI), glycerophosphoserine (GPS), and glycerophosphoglycerol (GPG), contingent upon the nature of their head groups. In prokaryotes, they are produced by phospholipase A or B (Farn et al., 2001; Sitkiewicz et al., 2007), whereas in plants, glycerophosphodiesters are produced by lipid acyl hydrolases (LAH) from the deacylation of different membrane phospholipids, which are then substrates for GDPDs (Matos and Pham-Thi, 2009).
The initial identification of GDPD activity within plants was documented in the vacuoles and cell walls of carrot (Daucus carota), sycamore (Acer pseudoplatanus), and Arabidopsis thaliana cell suspension cultures. Following this discovery, GDPDs have been classified as a multigene family in Arabidopsis, delineated into two distinct groups: type A featuring a single GDPD domain (AtGDPD1-6) and type B characterized by two putative GDPD domains (AtGDPDL1-7). Type A GDPDs possess conserved catalytic residues akin to those found in E. coli GlpQ; conversely, type B GDPDs exclusive to plants exhibit diminished phosphodiesterase activity. Two GDPD genes, GPX-PDE1 and GPX-PDE2, were also found in white lupin (Lupinus albus), which are capable of hydrolyzing glycerophosphodiester and are markedly upregulated by Pi deficiency, suggesting their involvement in phosphorus acclimation (Cheng L et al., 2011). Silencing these GDPDs inhibited root hair development under phosphorus deprivation, confirming that they participate in membrane lipid remodeling and root development during phosphorus starvation in plants (Wang et al., 2018).
The GDPD gene family has been rigorously studied across diverse plant species, encompassing Arabidopsis, rice (Oryza sativa L.), corn (Zea mays L.), and sorghum (Sorghum bicolor L.) in past research endeavors. Nevertheless, a comprehensive analysis solely focusing on the GDPD genes in foxtail millet remains conspicuously absent in contemporary literature. In the present study, we conducted an exhaustive genome-wide analysis of the GDPD gene family in foxtail millet, identifying 14 distinct members. This investigation delved into their phylogenetic relationships, conserved motifs and domains, cis-regulatory elements, collinearity and syntenic relationships, as well as their expression profiles across diverse tissues and phosphorus gradients, aiming to elucidate their potential biological functions within foxtail millet. Additionally, the functional characterization of SiGDPD14 was undertaken through its over-expression in Arabidopsis. The insights garnered from this research augment our understanding of both genome-wide and functional analyses of the GDPD gene family.
2 Materials and methods
2.1 Plant materials and different treatment
Seeds of foxtail millet cultivar “Jigu13” were used in the present study. The seeds were sterilized in 75% ethanol for 5 min, dried, and germinated on moist plates for 3 days. Then, the seedlings of similar vigor were transferred into trays containing phosphorus-rich nutrient solution (Hoagland solution+1.0 mmol/L KH2PO4). The pH of the nutrient solution was adjusted to 5.8, and the solution was replaced every three days. The seedlings were grown in a chamber with a photoperiod of 12 h light/12 h dark, a day temperature of 28°C, and a night temperature of 22°C. When the seedlings were at the three-leaf stage, low phosphorus treatment was applied (Hoagland solution containing 1 μmol/L KH2PO4 + 1.0 mmol/L KCl), and the phosphorus-sufficient group was used as the control. To analyze the mRNA expression levels of SiGDPD gene, root samples were collected 8 h after treatment.
2.2 Identification of GDPD gene family in foxtail millet
Genome data and annotation files of foxtail millet were downloaded from MDSi (http://foxtailmillet.biocloud.net/home), and those of Arabidopsis were downloaded from TAIR (https://www.arabidopsis.org/) (Li et al., 2023). The query sequences were inputted from the protein sequences of AtGDPD family. TBtools was used to perform BLAST comparison in the total protein sequence of foxtail millet to identify candidate genes that belong to SiGDPD family with E-value < 1e−5 (Altschul et al., 1997). The HMM file of conserved domain of GDPD (PF03009) was downloaded from the Pfam database (http://pfam.xfam.org/) (Finn et al., 2011; Oelkers et al., 2008). The Simple HMM Search in TBtools software was used to screen the total protein sequence of foxtail millet to obtain the potential SiGDPDs genes. The candidate genes obtained by the two methods were merged to obtain the candidate genes of SiGDPD family. The candidate SiGDPD proteins containing GDPD domains were verified by SMART program (http://smart.embl-heidelberg.de/) and NCBI-CDD web server (https://www.ncbi.nlm.nih.gov/cdd/). The protein sequences containing functional domains identified by the two tools were cross-referenced, and the sequences without complete conserved domains were deleted to obtain the SiGDPD family members. Physicochemical properties including molecular weight and isoelectric point were analyzed by TBtools, and subcellular localization were predicted by WOLF (https://wolfpsort.hgc.jp/) (Chen et al., 2020).
2.3 Gene structure, conserved motifs, conserved domains and three-dimensional modeling analysis of GDPD genes in foxtail millet
The gene structure of the SiGDPD family was analyzed using the exon and intron information of GDPD family genes extracted from the foxtail millet genome annotation GFF file. Conserved motifs were identified through the MEME online tool (http://meme-suite.org/tools/meme), with a prediction value set to 12 (Bailey et al., 2009). The functions of domains and motifs in SiGDPDs were evaluated using the Batch Web CD-search. Furthermore, the gene structure view function of TBtools was employed to visually represent the distribution of conserved motifs, domains, and gene structures in SiGDPD. Additionally, tertiary structure prediction was conducted through homology modeling via SWISS-MODEL, available at http://swissmodel.expasy.org/interactive.
2.4 Phylogenetic tree construction, chromosomal localization and syntenic analysis of SiGDPDs
The full-length amino acid sequences of GDPD genes identified from A. thaliana, O. sativa, Z. mays, S. bicolor and S. italica were aligned using MEGA11 with default parameters. Subsequently, a phylogenetic tree was generated via the neighbor-joining method in MEGA11 with a bootstrap value of 1000 and default parameters (Rozewicki et al., 2019; Kumar et al., 2016). This evolutionary tree was further refined using the Evolview online tool, accessible at https://evolgenius.info/evolview/. The GTF/GFF3 format genome annotation file of S. italica was downloaded from the Phytozome database. TBtools software was used to depict the chromosomal localization of each SiGDPD gene. Interspecific and intraspecific collinearity analyses were conducted using GDPD protein sequences from Arabidopsis, rice, sorghum, maize, and foxtail millet. MCScanX software was used to analyze the gene duplication events in foxtail millet, and the results were visualized using TBtools.
2.5 Prediction of promoter cis−acting elements, protein-protein interaction and tissue expression pattern assay
The 2-kb upstream sequence of the foxtail millet GDPD gene was scrutinized using PlantCARE (http://bioinformatics.psb.ugent.be/webtools/plantcare/html) to identify cis-acting elements within the promoter region, including phosphorous responsive elements (e.g. PHR1 binding site),hormone regulatory, growth and development-related, and stress regulatory elements (Higo et al., 1999). The functional protein-protein interaction network model for GDPD proteins was developed utilizing the Web String database (https://string-db.org/), with a confidence parameter set to 0.400.Tissue-specific expression profiles of SiGDPDs were carefully investigated using the NCBI Short Read Archive database (https://www.ncbi.nlm.nih.gov/sra/) in different transcriptomic data cohorts. The heatmap analysis was performed with TBtools to generate gene expression heat maps on log2 scales.
2.6 qRT-PCR and expression analysis of SiGDPDs under low phosphorus stress
Total RNA was extracted from roots using trizol reagent (Invitrogen, USA) as directed by the manufacturer. First-strand cDNA was synthesized using Plant Reverse Transcription Kit (TIANGEN, China) and then diluted by tenfold to improve concentration accuracy. The corresponding primers were designed by Primer5 (Supplementary Data Sheet 1), and quantitative PCR was conducted on a fluorescent quantitative PCR instrument with three biological replicates and three technical replicates. The relative expression levels of RNA transcripts were calculated using the 2−ΔΔCT method.
2.7 Generation of transgenic plants
The complete coding sequence of SiGDPD14 was amplified, employing foxtail millet root cDNA as a template, and subsequently cloned into the pBI121-GFP plasmid. Transgenic Arabidopsis plants were then generated utilizing the inflorescence infection method. The regenerated plants underwent screening on a medium enriched with 50% hygromycin B and were cultivated under meticulously controlled conditions. Positive transgenic plants were ascertained through PCR, and their expression levels were quantified using qRT-PCR. Among the transgenic Arabidopsis lines, three overexpression lines of SiGDPD14 (OE#2, OE#3, and OE#4) showing high expression levels were selected for detailed functional characterization. The primers employed for PCR and RT-PCR are delineated in Supplementary Table S1.
2.8 Analysis of transgenic plants resistance to low phosphorus stress
Arabidopsis seeds were sterilized using 75% ethanol for a duration of 5 minutes, followed by rinsing with distilled water. The seeds were transferred to 1/2 MS medium plates supplemented with either normal phosphorus (NP, 1 mmol·L−1 KH2PO4) or low phosphorus (LP, 1 μmol·L−1 KH2PO4), sealed with parafilm, and cultivated in a growth chamber under controlled conditions (22°C, 16/8 h light/dark cycle). After 14 days, the germination rate, root length, and root surface area of the Arabidopsis were measured.
2.9 Data processing and analysis
All experimental data were statistically analyzed and visualized using GraphPad Prism 8.0 (version 8.0; GraphPad Software, San Diego, CA, USA). Three independent biological replicates were performed for each experimental group. Statistical significance between datasets was evaluated by Student’s t-test, with asterisks indicating the following *p*-values:*: 0.01<p ≤ 0.05, **: p ≤ 0.01.
3 Results
3.1 Identification of GDPD genes in foxtail millet
In the foxtail millet genome, 14 SiGDPD genes were identified, designated as SiGDPD1 through SiGDPD14. Table 1 encompasses a detailed overview of these genes, presenting aspects such as gene ID, chromosomal location, genome position, amino acid length, and notable physicochemical characteristics. The amino acid sequences exhibited lengths ranging from 309 in SiGDPD12 to an extensive 1097 in SiGDPD13. The isoelectric points (pI) spanned a spectrum from 5.02 for SiGDPD6 to 8.88 for SiGDPD12, thereby classifying them into 3 alkaline and 11 acidic proteins. When examining molecular weights, values ranged between 34.14 kDa for SiGDPD9 and 120.75 kDa for SiGDPD13. The analysis of GRAVY values revealed that 10 of the proteins possessed hydrophilic properties, in contrast to the remaining 4, which were hydrophobic. Further examination of subcellular localization indicated that 7 SiGDPDs were situated in the extracellular space, with the balance being found in the cytoplasm, plasma membrane, or nucleus. Signal peptide predictions highlighted the presence of signal peptides in 5 proteins within the GDPD family.
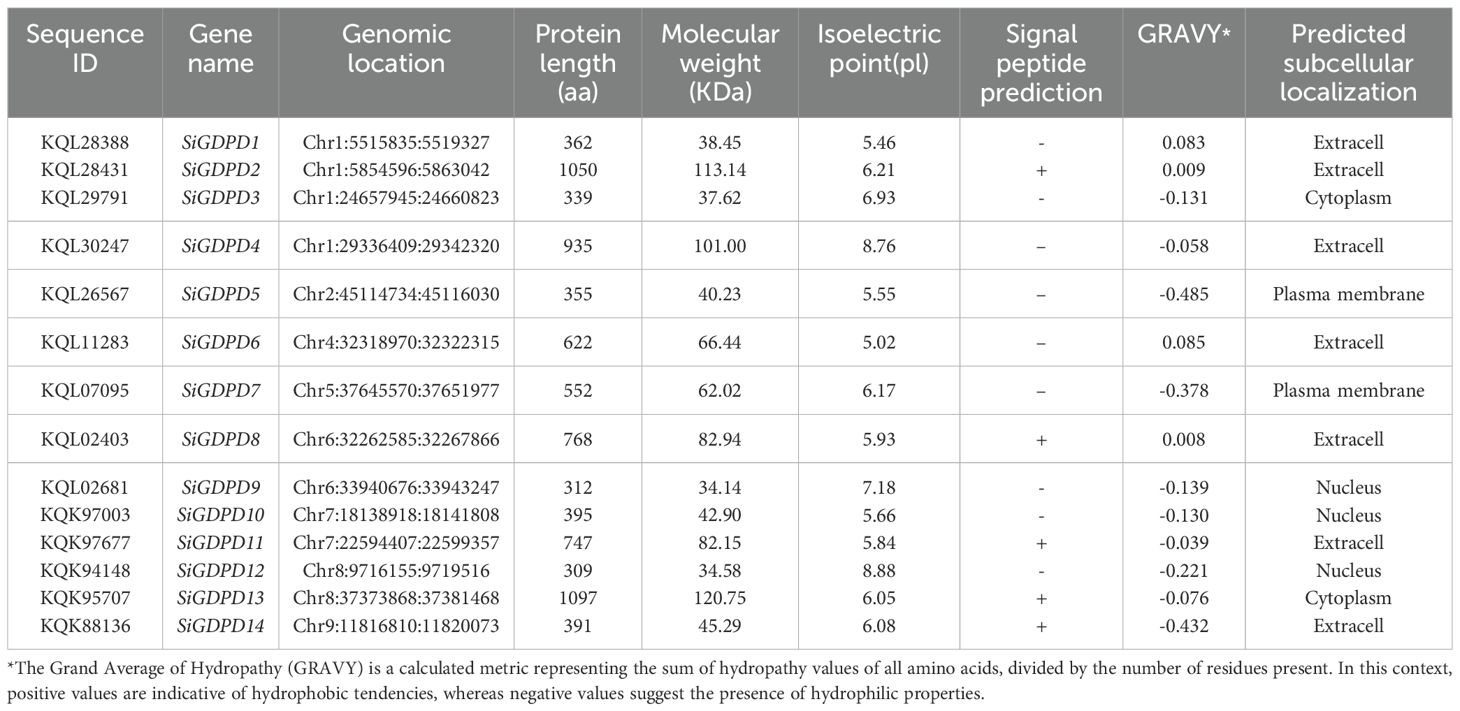
Table 1. Analysis of physicochemical properties of GDPD genes in foxtail millet.
3.2 Gene structure, conserved motif, conserved domain, and three-dimensional modeling analysis of GDPD genes in foxtail millet
Using GFF annotation file of foxtail millet genome and CDS information of SiGDPD gene family, conserved domains and motifs and gene architectures of 14 SiGDPDs were studied using TBtools software based on the phylogenetic tree of SiGDPD protein sequences (Figure 1). Twelve conserved motifs were discovered in SiGDPDs using MEME online tool. Motif 1 and 6 are located in N-terminal GDPD domain while motif 12 is present in C-terminal GDPD domain. Further, structural characteristics of SiGDPD gene family were studied to understand their potential role. Exon–intron structure of SiGDPD genes is shown in the right panel of Figure 1. SiGDPD2 has the highest number of introns (17) while SiGDPD5 has the least number of introns (2).
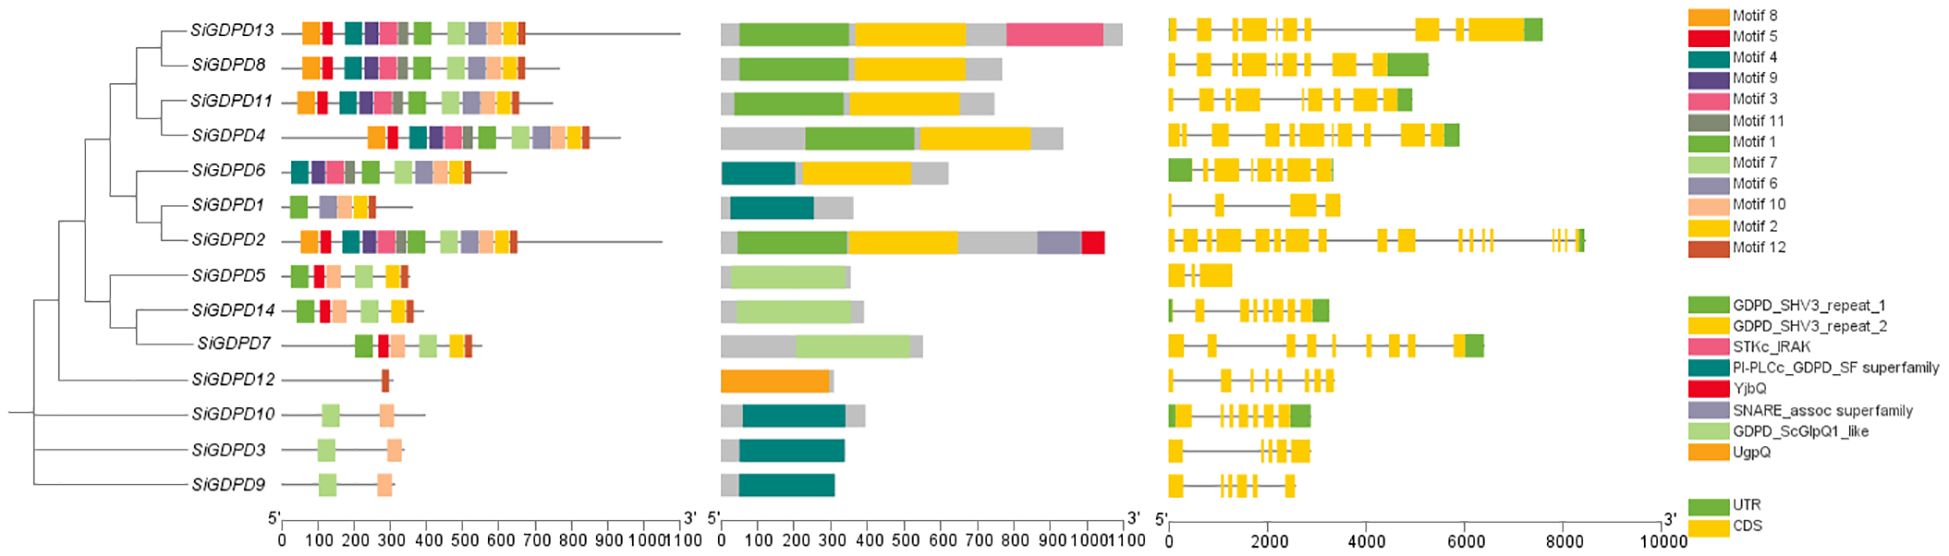
Figure 1. Conserved motifs, functional domain, and gene structure of 14 SiGDPD members in foxtail millet. These sizes could be estimated using the scale at bottom. (A) Gene tree. (B) Motif patterns.Conserved motifs in the SiGDPD peptides are presented by different colored boxes. (C) Conserved domain. GDPD domain is represented by box. (D) Gene structure. Coding sequences (CDS) and untranslated region (UTR) are represented by different colored boxes, and introns are represented by lines.
The three-dimensional structure modeling of SiGDPD proteins exposed the complexity of their folded structures, featuring alpha-helices, extended strands, beta-turns, and random coils (Figure 2). Despite the similar spatial configurations and conserved functional regions of all SiGDPD proteins, significant differences were noted in the sequences of N-terminal peptides. Those proteins closely related on the phylogenetic tree had similar motif compositions and gene structures (Figure 1), suggesting that they may perform similar functions in plant physiological processes as members of the same group.
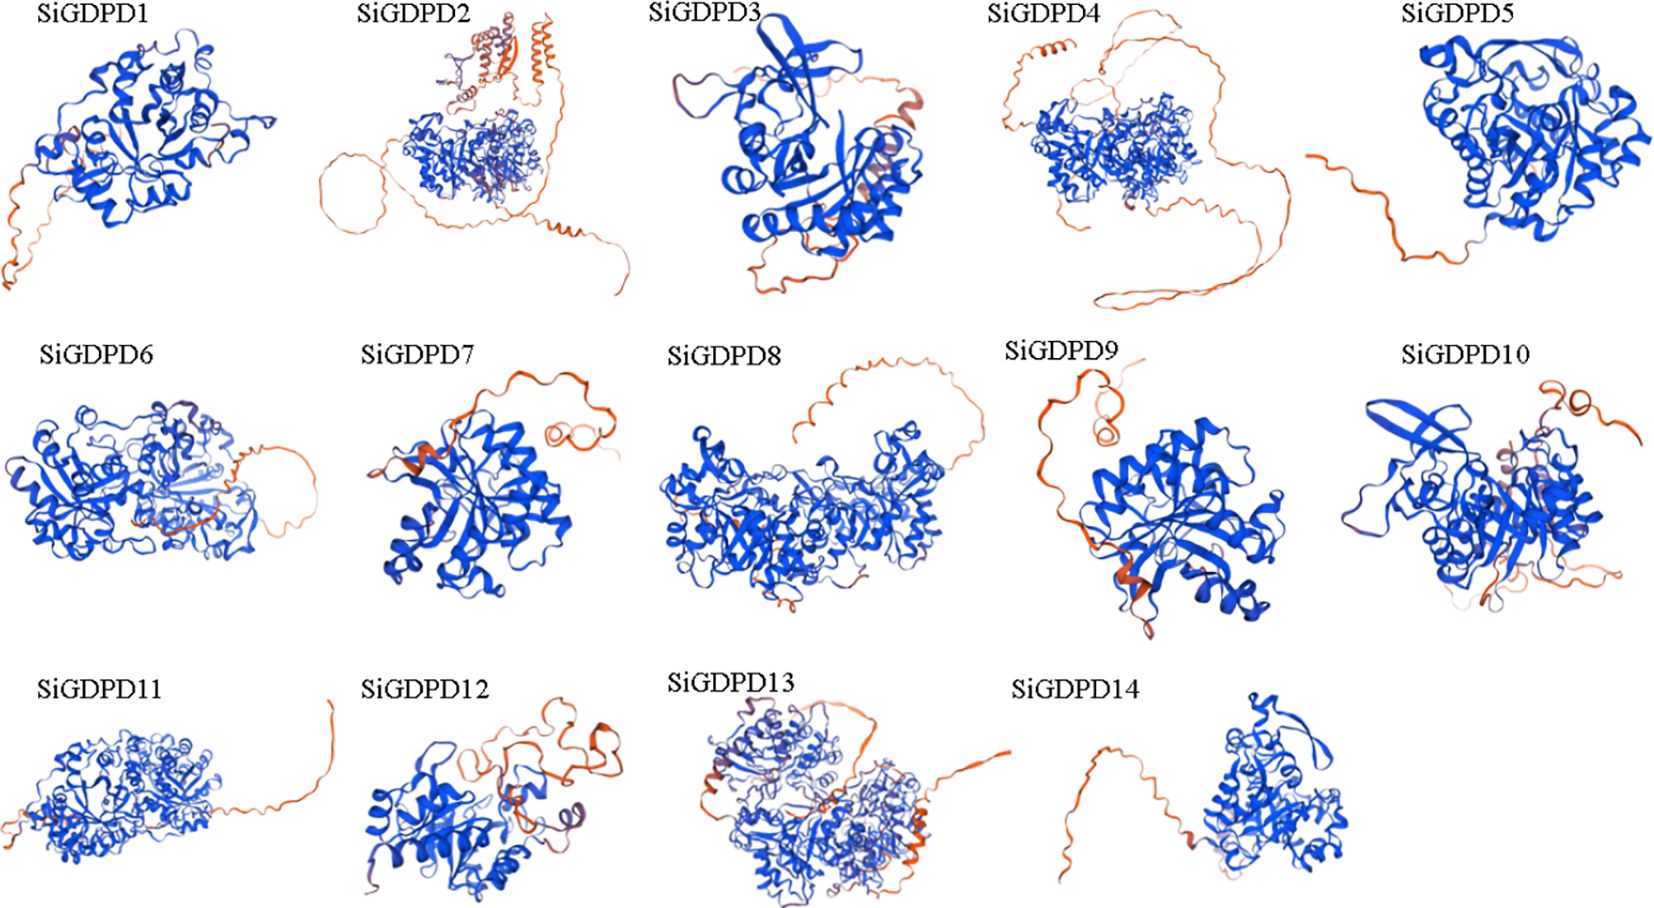
Figure 2. The three-dimensional models of GDPD proteins in foxtail millet. The red coloration indicates the α-helix or active site, while the blue coloration represents the β-sheet or positive charge region within the protein’s tertiary structure.
3.3 Phylogenetic tree analysis of the SiGDPDs
The evolutionary relationships of SiGDPDs in foxtail millet were explored using the full-length protein sequences of 13 GDPDs in Arabidopsis, 12 in rice, 14 in maize, 12 in sorghum, and 14 in foxtail millet, aligned with MEGA11. Figure 3 illustrates the classification of these 65 GDPD proteins into five subgroups: Group I (14 genes), Group II (15 genes), Group III (5 genes), Group IV (8 genes), and Group V (23 genes). It is noteworthy that Group III does not include members from Arabidopsis or sorghum, while Group IV does not contain any members from Arabidopsis. Generally, the GDPD genes of foxtail millet demonstrate a closer evolutionary affinity to rice homologs than to those of Arabidopsis. Moreover, GDPD genes with similar genetic structures tend to cluster together.
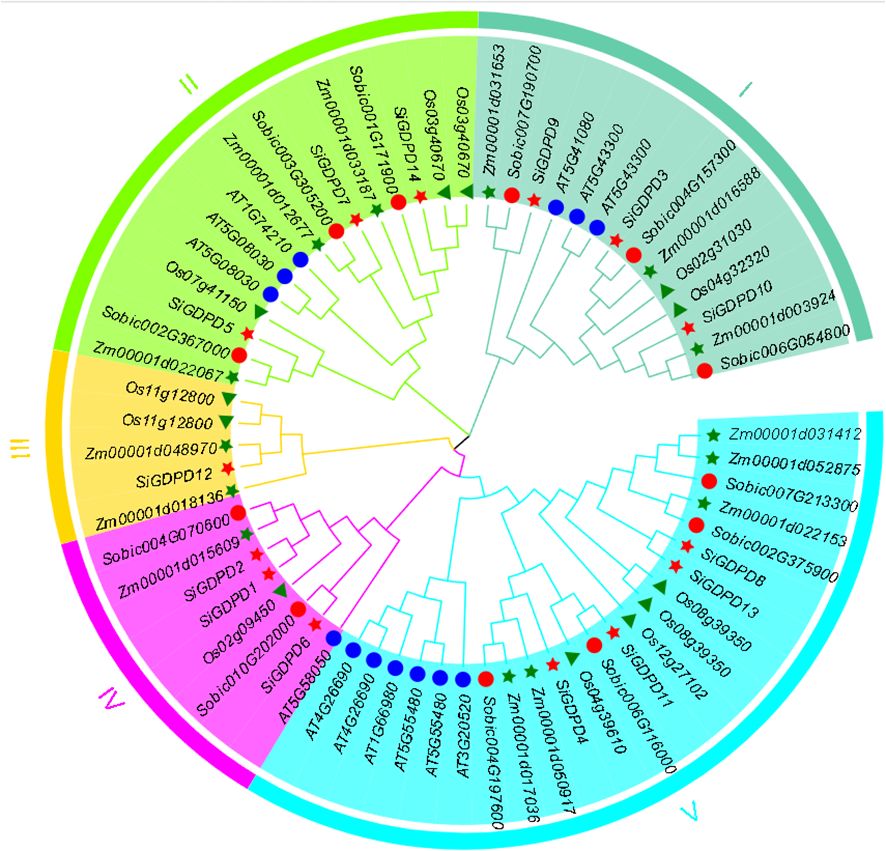
Figure 3. Phylogenetic relationships of GDPDs in Setaria italica (Si), Arabidopsis(AT), Oryza sativa (Os), Zea mays (Zm),and Sorghum bicolor (Sb).The phylogenetic tree was generated using the neighbor-joining method with MEGA 11 software. GDPDs in various species were marked with different labels and diverse subgroups of GDPDs were highlighted by different colors.
3.4 Chromosome localization, gene duplication and syntenic analysis of SiGDPDs
Analysis of chromosomal location revealed a non-uniform distribution of 14 SiGDPDs across eight of the nine chromosomes. Chromosome 1 had the highest number of SiGDPDs, comprising four members, while chromosomes 6, 7, and 8 each contained two genes. Chromosomes 2, 4, 5, and 9 were home to a single gene each, and chromosome 3 had none (Figure 4). Subsequent investigation focused on the duplication events of SiGDPDs in foxtail millet, identifying two duplicated gene pairs (SiGDPD1/SiGDPD6 and SiGDPD4/SiGDPD10) (Figure 5), suggesting ancient tetraploidy events or whole-genome duplication (segmental duplication) as plausible causes. To elucidate the phylogenetic mechanism of GDPD genes across species, a homology analysis was performed comparing foxtail millet with four representative species: the dicotyledonous plant- Arabidopsis, and three monocotyledonous plants - Oryza sativa, Zea mays, and Sorghum bicolor (Figure 6). The highest homology was found in Zea mays and Sorghum bicolor, with 14 gene pairs, followed by Oryza sativa with 11 pairs, and none in Arabidopsis. The lack of homologous genes between foxtail millet and Arabidopsis implies their divergence post the split of monocotyledonous and dicotyledonous plants. Notably, the GDPD genes in foxtail millet exhibited the greatest homology with those in Zea mays and Sorghum bicolor, suggesting a common ancestral origin for these highly homologous genes among different plants.
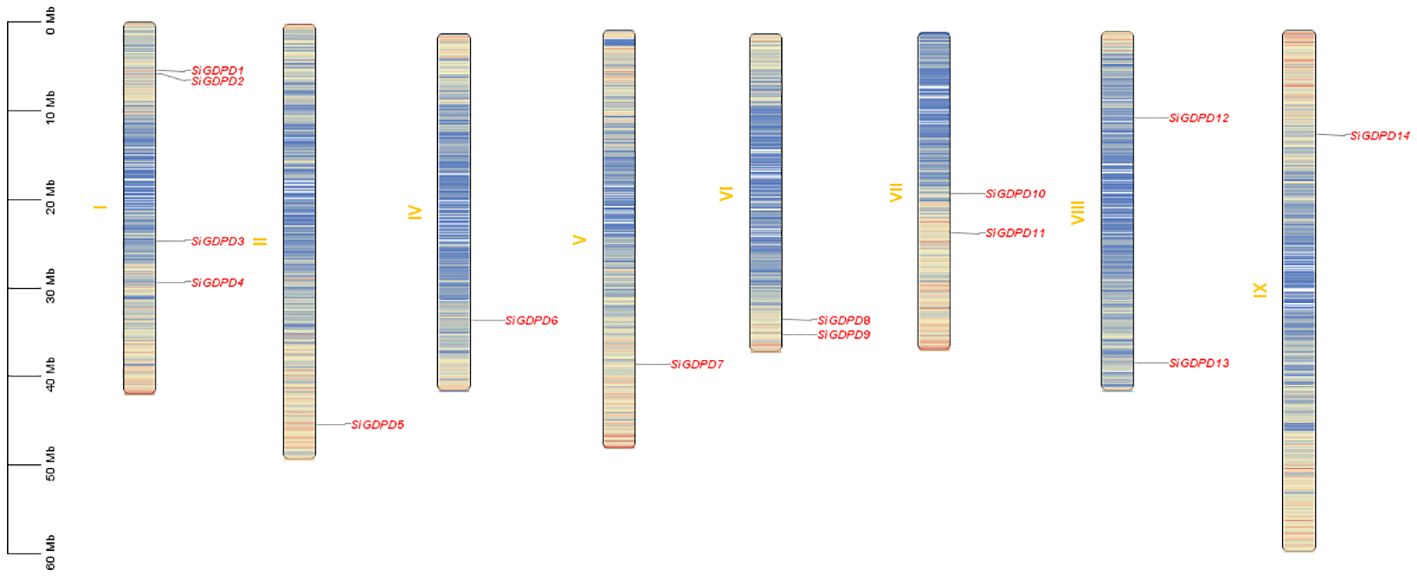
Figure 4. Distribution of 14 SiGDPD genes onto nine Setaria italica chromosomes. Graphical representation of physical locations for each SiGDPD gene on Setaria italica chromosomes. Chromosomal distances are given in Mb.
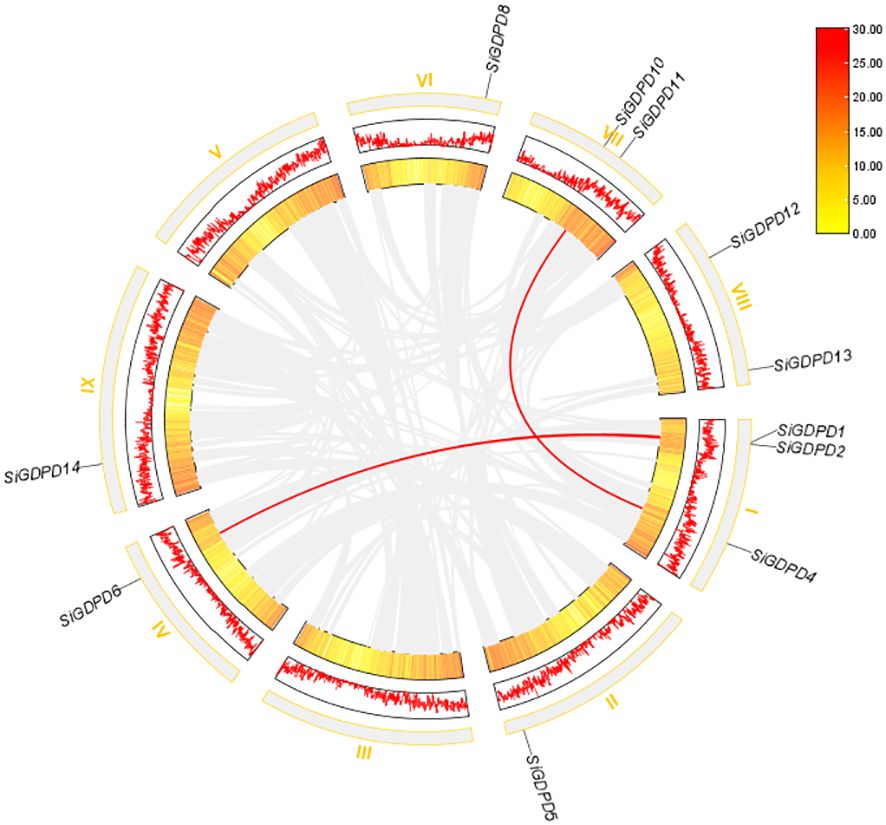
Figure 5. Gene duplication examination of SiGDPD genes.
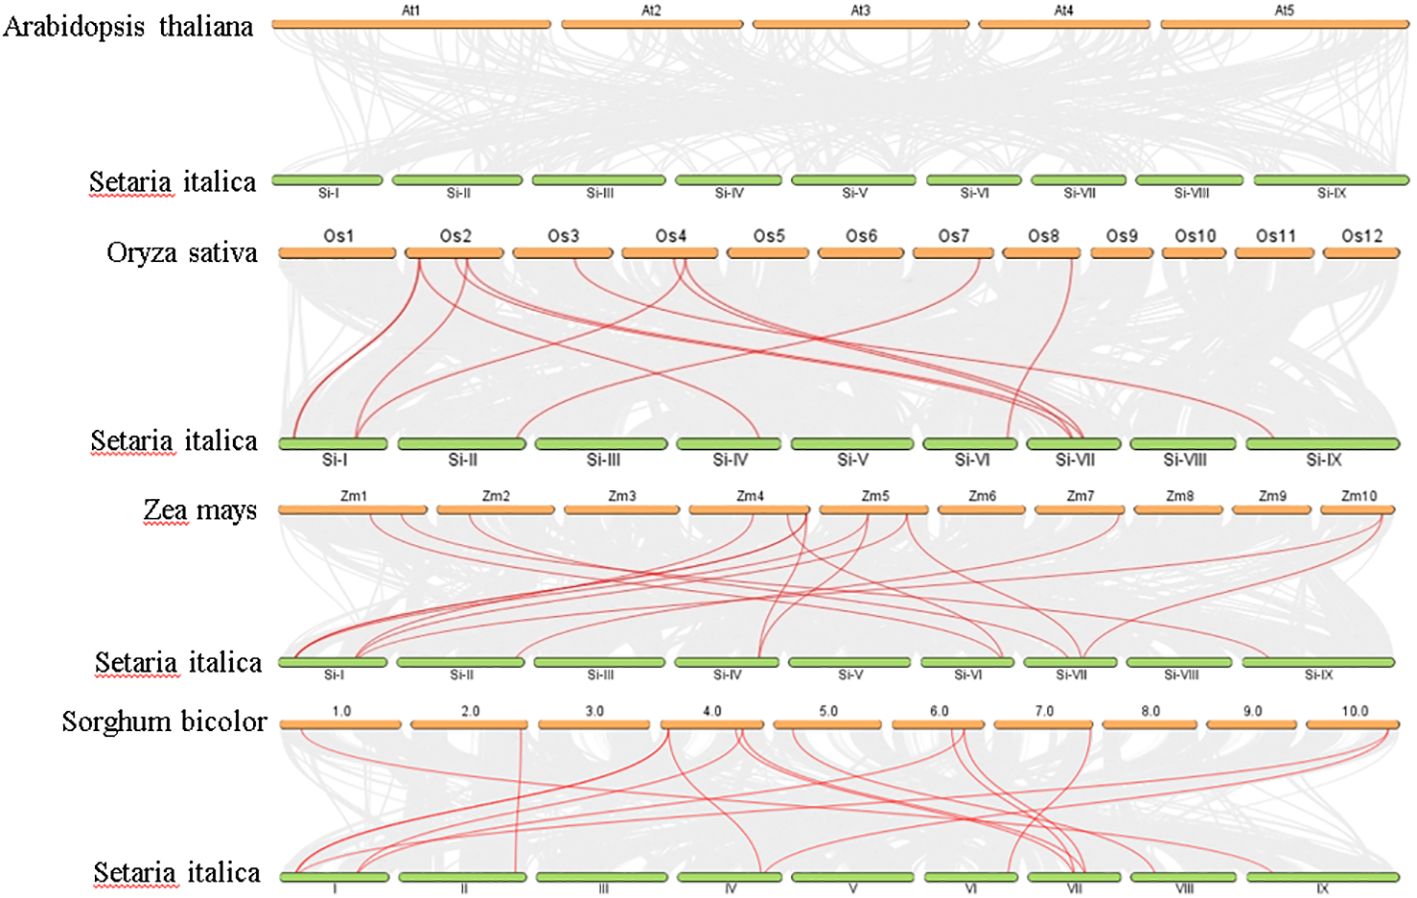
Figure 6. Synteny analysis of GDPD genes between Setaria italica, Arabidopsis, Sorghum bicolor, Oryza sativa, and Zea mays. Gray lines represent the collinear relationship between foxtail millet and four other species and red lines represent collinear GDPD gene pairs.
3.5 Analysis of cis-acting elements in SiGDPD promoters
To validate the regulatory roles of SiGDPDs, we analyzed the cis-acting elements in the promoter region (2000 bp upstream of the start codon of the SiGDPDs) (Figure 7). The cis-acting elements were categorized as light-responsive elements, hormone-responsive elements (auxin-, gibberellin-, abscisic acid- and salicylic acid-responsive elements), stress-responsive elements (low-temperature-, defense and stress- and drought-inducible elements) and development and growth-related elements. Although the different SiGDPD members had various cis-acting elements, there were photoresponsive elements in the promoters of all the SiGDPDs, suggesting that the SiGDPDs were light-inducible. Three SiGDPDs had low-temperature responsive elements, two had defense and stress responsive elements, and ten had drought responsive elements in their promoters, indicating that they might be involved in abiotic stress responses. A total of 14 SiGDPDs had at least one hormone response element in their promoters, which suggests that they might be regulated and expressed by multiple hormones. These results suggest that SiGDPDs are involved in many biological processes and play important roles in growth and stress responses in foxtail millet.
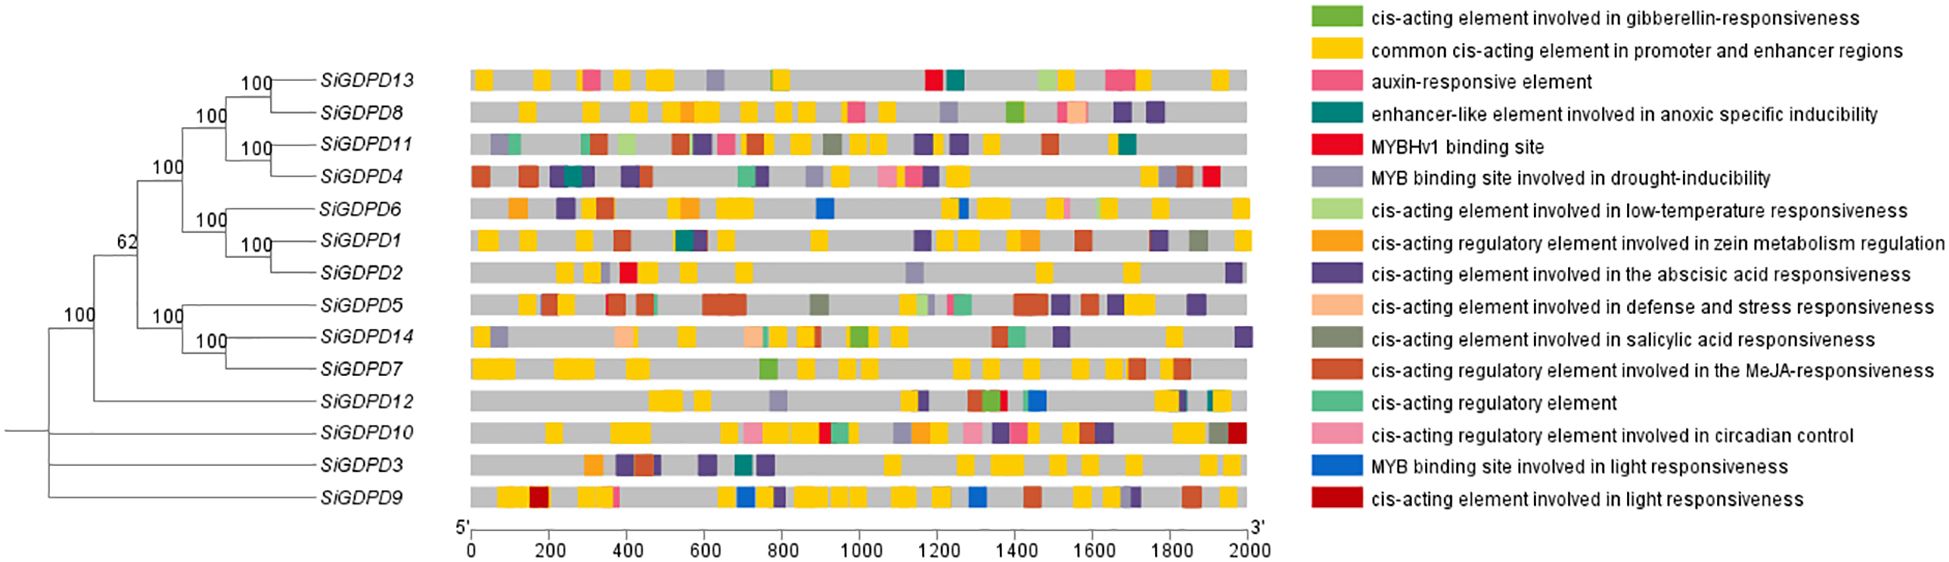
Figure 7. The cis-acting regulatory elements of the promoter region in the GDPD gene family. The different color blocks represent different types of cis-acting regulatory elements, and the gray lines refer to the upstream coding sequences.
3.6 Prediction and correlation analysis of interacting proteins
Protein interaction networks provide significant insights for the prediction of functional orthologs within sequence homology clusters, thereby contributing to our understanding of gene interactions and regulatory relationships. In this study, we utilized the STRING online database to scrutinize interactions among individual SiGDPDs. The resulting network analysis revealed the co-expression of 14 GDPD family members with six associated proteins (Figure 8). Of particular interest was the observation that K3Y5W8_SETIT interacted with all 14 SiGDPDs, suggesting its potential role as a central protein within the family. Furthermore, SiGDPD3, SiGDPD5, SiGDPD7, SiGDPD9, and SiGDPD10 were found to interact with each other, indicative of a potential functional correlation amongst these family proteins. These results offer valuable insights that can inspire further examinations aimed at eluci dating the roles of SiGDPD genes in diverse biological processes.
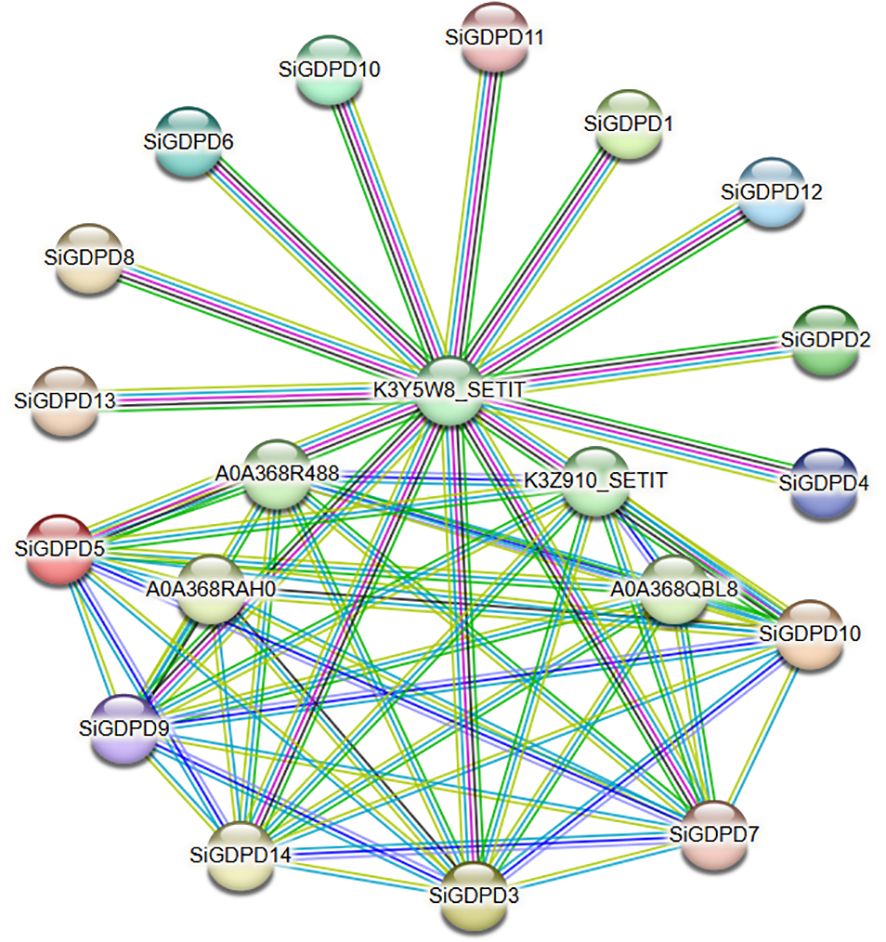
Figure 8. Prediction network of protein interactions for SiGDPDs. Each node represents a protein, and each edge represents an interaction.
3.7 Gene expression analysis of SiGDPDs in different organs
Transcriptome data were employed to scrutinize the expression patterns of SiGDPD genes in various organs. SiGDPD3, SiGDPD9, SiGDPD10, and SiGDPD14 consistently demonstrated high expression levels in all examined organs. In contrast, SiGDPD1, SiGDPD6, and SiGDPD11 exhibited uniformly low expression levels. Organ-specific expression patterns were observed for certain genes: SiGDPD2 and SiGDPD12 were predominantly expressed in roots, SiGDPD5 and SiGDPD4 in leaves, and SiGDPD4 and SiGDPD13 in stems. Meanwhile, SiGDPD7 and SiGDPD8 displayed moderate expression levels across all organs and tissues (Figure 9).
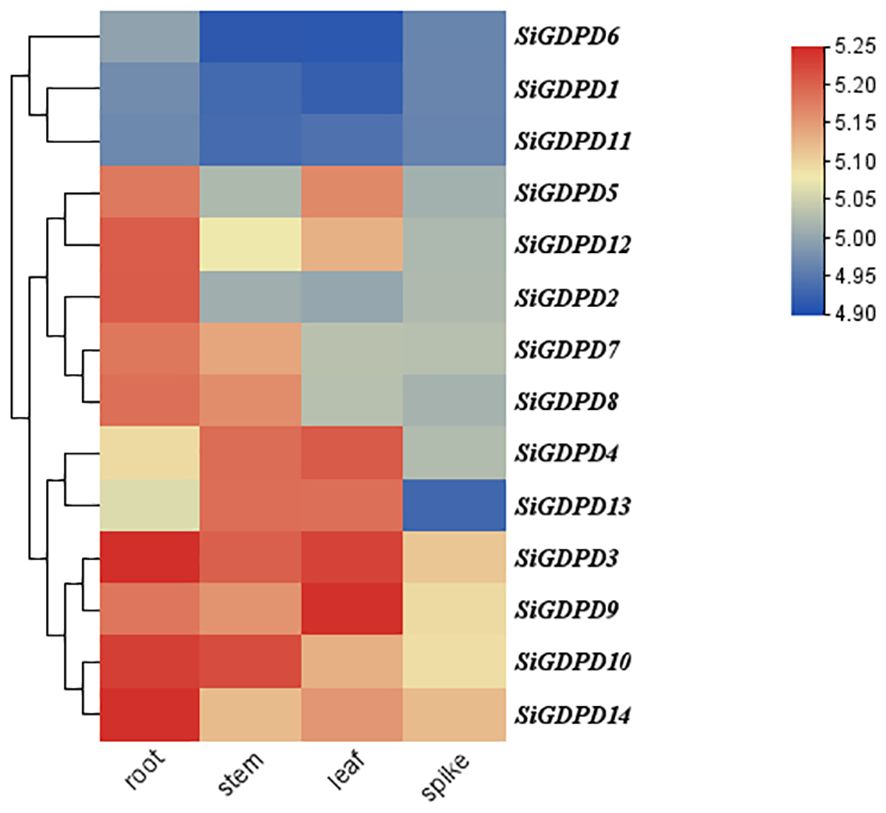
Figure 9. Heat map of SiGDPD genes expression patterns in different tissues. The red and blue blocks represent higher and lower expression levels of the genes, respectively.
3.8 Expression patterns of SiGDPD genes in response to low phosphorus stresses
The GDPD gene family’s expression profiles were scrutinized in response to low phosphorus stress, utilizing qRT-PCR to analyze the expression levels of 14 GDPD genes under phosphate-deficient conditions. All 14 GDPD genes demonstrated altered expression levels compared to the control. Specifically, mRNA levels of SiGDPD3 and SiGDPD14 escalated significantly by 2.70-fold and 2.90-fold respectively under low phosphorus stress. Conversely, mRNA levels of SiGDPD1, SiGDPD5, SiGDPD6, and SiGDPD11 decreased markedly by factors of 0.40-fold, 0.42-fold, 0.43-fold, and 0.41-fold respectively under phosphate-deficient conditions (p<0.05; Figure 10). These results suggest that SiGDPD3, SiGDPD14, SiGDPD1, SiGDPD5, SiGDPD6, and SiGDPD11 may play a pivotal role in regulating the response to phosphate deficiency in foxtail millet.
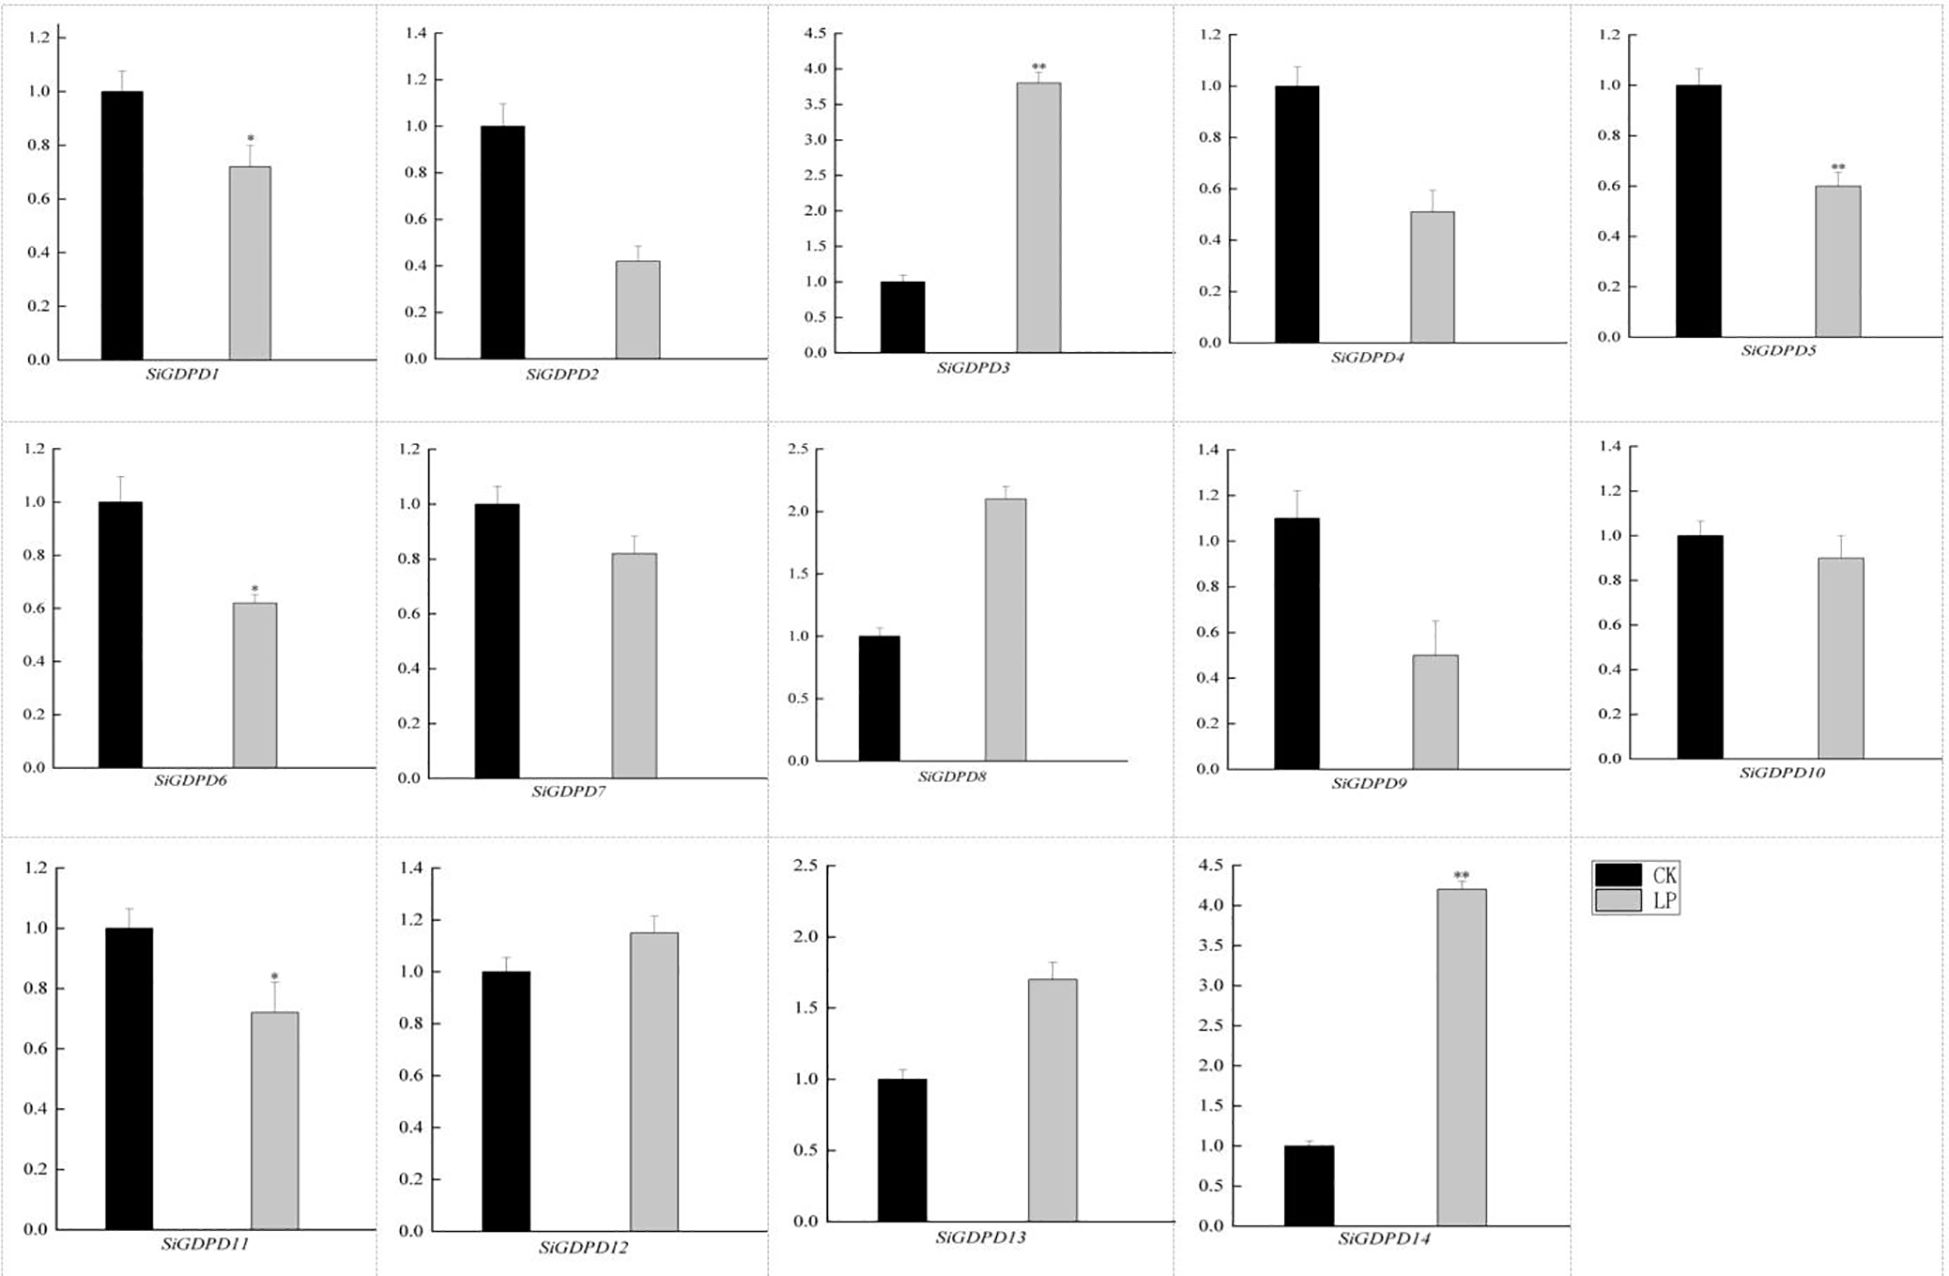
Figure 10. Gene expression analysis of the SiGDPD genes under low-phosphorus treatment. Black indicates the control group (CK) while Gray represents the low-phosphorus treatment group (LP). * and ** respectively indicate significant different (P < 0.05) and extremely significant different (P < 0.01) by student’s t test.
3.9 Response of transgenic Arabidopsis thaliana over-expressing to low phosphorus stress
To explore the significance of GDPD genes during stress response, SiGDPD14 was ectopic expression in Arabidopsis and three transgenic lines (OE#2, OE#3 and OE#4) were used to detect the response to low phosphorus stress (Supplementary Data S5, Figure 11). Under normal conditions, there was no discernible difference in seed germination between the wild-type and transgenic plants during the germination stage (Figure 12). However, under low phosphorus (LP) treatment, the seeds of the transgenic lines exhibited a significantly higher germination rate compared to the wild type. Specifically, only 30% of the wild-type seeds germinated, while the germination rates for the OE#2, OE#3, and OE#4 transgenic lines were 70%, 80%, and 40% respectively. Under normal conditions, there was no significant difference in root length and root surface area between the transgenic seedlings and the wild type (Figure 13). However, after 14 days of LP treatment, the average root length of the transgenic lines was 4.6 cm, which is 2.12 times longer than that of the wild-type plants. Similarly, the root surface area was 1.75 times larger than that of the wild-type. These results demonstrate the enhanced low phosphorus tolerance of the SiGDPD14 transgenic lines.
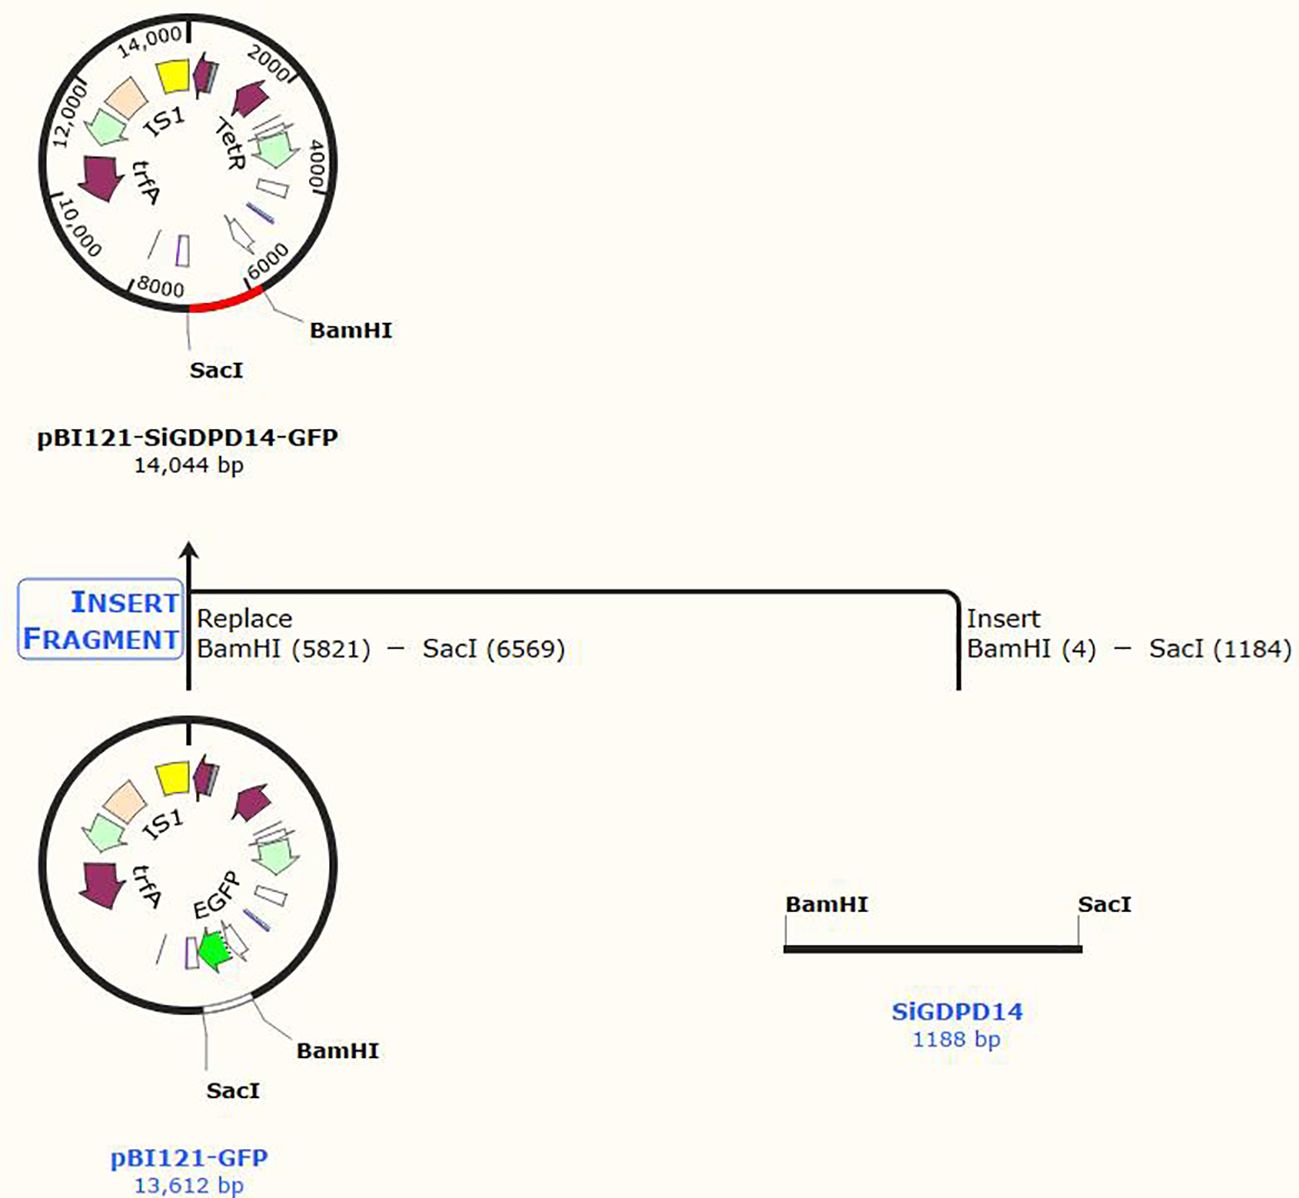
Figure 11. Genetic transformation of SiGDPD14 in Arabidopsis. pBI121-SiGDPD14-GFP fusion protein construct.
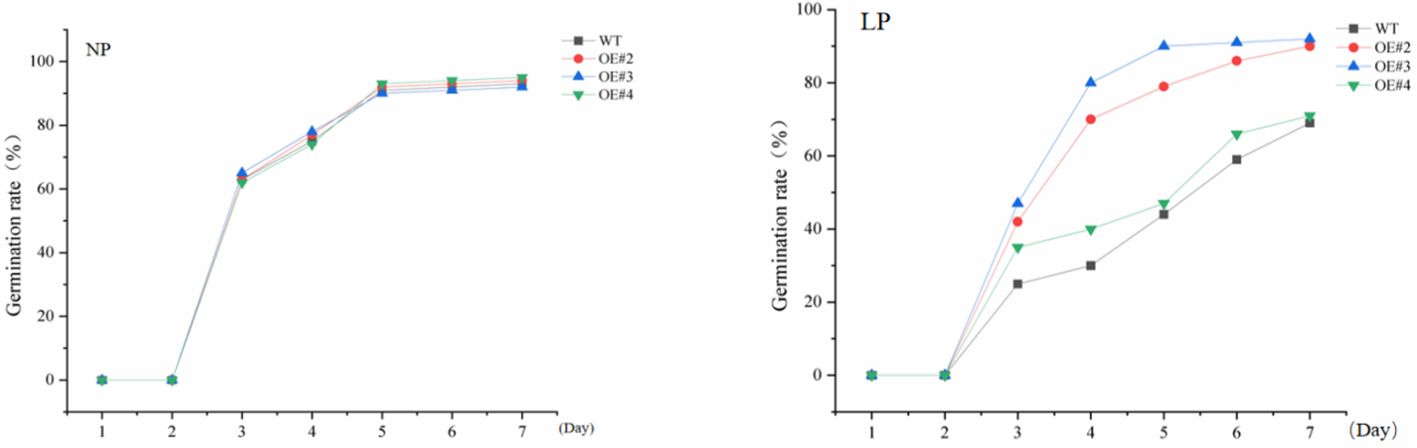
Figure 12. Germination rate of wild-type (WT) and SiGDPD14 transgenic lines (OE#2, OE#3, and OE#4). Data were quantified using three biological replicates of each cultivar. Each data point represents the mean (± SD) of three separate experiments (p < 0.05).
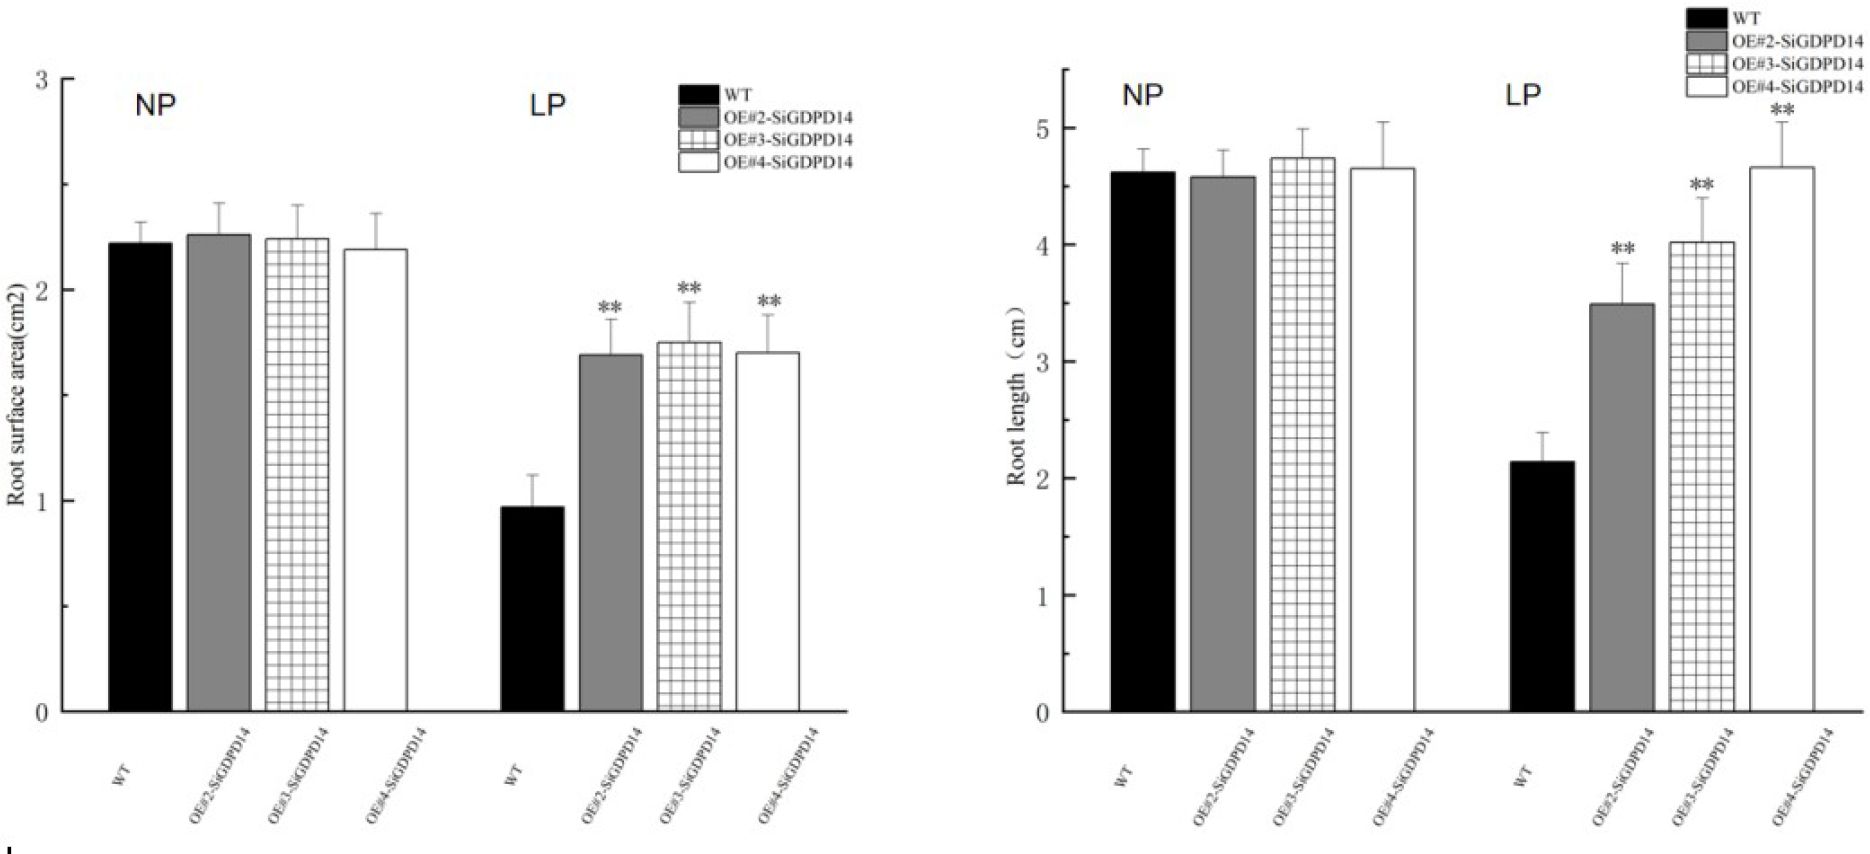
Figure 13. The primary root length and root surface area of WT and sigdpd14 transgenic line (OE#2, OE#3, OE#4) seedlings under NP and LP treatments were measured. All experiments included three replicates.Error bars represent standard deviations. Significant differences are indicated: ‘**’,p < 0.01 (Student’s t-test).
4 Discussion
Glycerophosphodiester phosphodiesterases (GDPDs), also known as GPX-PDEs, primarily catalyze the conversion of glycerophosphodiesters into sn-glycerol-3-phosphate (G-3-P) and their corresponding alcohols. These enzymes contribute significantly to maintaining phosphate (Pi) homeostasis, particularly in phosphorus (P)-deficient conditions (Ohshima et al., 2008; Cheng Y et al., 2011; Vander Rest et al., 2002; Cheng L et al., 2011). Despite this, there are no existing reports discussing the role of the SiGDPD gene in the emerging C4 model crop, foxtail millet. To address this gap, a systematic study of the SiGDPD gene is imperative. In this study, we identified 14 SiGDPD members and analyzed their gene structure, conserved motifs, phylogenetic evolution, chromosome localization, collinearity, cis-elements, and gene expression patterns. Simultaneously, the root-specific expression gene SiGDPD14 was heterologously transformed into the dicotyledonous model plant Arabidopsis thaliana. This provides insights into the role of the GDPD gene in plant growth and development, which can be beneficial in understanding its function in foxtail millet.
4.1 Identification and analysis of SiGDPD genes in foxtail millet
A total of 14 SiGDPD members were identified in this study. The physicochemical properties of 14 SiGDPD genes were analyzed, revealing that the relative molecular weight ranged from 34.14 to 120.75 kDa and the isoelectric point varied between 5.02 and 8.88. Based on the subcellular localization of the GDPD protein, the majority of SiGDPD proteins are present in the plasma membrane or extracellular space. Previous studies have suggested that GDPD transcription factors (TFs) are primarily localized to the nucleus, which is in contrast to our findings. This discrepancy may be attributed to potential transport mechanisms of TFs from the nucleus to the cytoplasm through nuclear transport signal domains within protein sequences, or post-translational modifications such as phosphorylation, acetylation, or methylation (Macfarlane et al., 1999). However, these hypotheses have not been confirmed for GDPD TFs. Furthermore, the bioinformatics-predicted subcellular localization of these TFs necessitates experimental validation. Analysis of conserved motifs (Figure 1B) revealed that all SiGDPD proteins, except SiGDPD12, contain motif 10, and the majority also possess motifs 7 and 12. This conservation indicates the functional significance of motifs 7, 10, and 12 across SiGDPD proteins. The arrangement of exon-intron structure contributes to the evolutionary dynamics of gene families, with introns enhancing protein diversity through exon shuffling and alternative splicing (Gorlova et al., 2014; Liu et al., 2019). Our analysis revealed that SiGDPD genes within the same group share similar exon-intron structures (Figure 1D), suggesting distinct biological functions for SiGDPD genes in different groups.
The gene promoter is the DNA sequence situated upstream of the gene coding region. It is composed of numerous cis-acting elements and functions as a specific binding site for proteins, which are accountable for initiating and regulating the transcription process (Hernandez-Garcia and Finer, 2014). The control of gene expression by cis-elements in the promoter region has emerged as the principal mechanism for organisms to adjust to diverse environments (Walther et al., 2007). In this study, we identified an array of cis-acting elements in 14 SiGDPD genes. The majority of these SiGDPD genes contain light response-related elements, hormones (including auxin, gibberellin, abscisic acid, and salicylic acid), stress response, and various other cis-acting elements related to growth and development within the SiGDPD promoter region. The phosphate starvation response is influenced by both internal and external factors, such as light and plant hormones. Prior research has highlighted the pivotal role of light as a signal to trigger the phosphate starvation response. Moreover, light is a key regulator of plant development and growth, impacting subterranean processes like phosphate uptake and assimilation (Liu et al., 2017; Sakuraba et al., 2018). Consequently, we hypothesize that the cis-acting elements associated with light response in the GDPD promoter could play a critical role in the adaptation mechanism of foxtail millet to phosphate starvation.
4.2 Evolution of SiGDPD genes
The majority of repetitive events in the foxtail millet genome are found in genome-wide replication events common to gramineous plants (Zhang et al., 2012). To investigate the evolutionary relationships within the GDPD gene family across different crops, we performed a collinearity analysis with foxtail millet, Arabidopsis, sorghum, maize, and rice. The analysis revealed that most GDPD genes exhibited syntenic relationships with genes in gramineous crops such as maize, sorghum, and rice. However, no collinearity was observed with Arabidopsis (Figure 6). Additionally, phylogenetic analysis showed a strong affinity between SiGDPD genes and their orthologs in ZmGDPD and SbGDPD genes (Figure 3). This indicates that the GDPD gene is highly conserved in gramineous plants and may experience various gene replication, loss, or functional differentiation events during the evolution of dicotyledonous and monocotyledonous plants (Lynch and Conery, 2000). To further elucidate the evolutionary constraints on the SiGDPD gene family, we analyzed non-synonymous and synonymous substitutions in SiGDPD. Our results show that the Ka/Ks ratio, a metric of selective pressure, was less than 1 for SiGDPD genes, indicating purifying selection. Taken together, these findings suggest the conservation and expansion of the GDPD gene family throughout evolution.
4.3 GDPD plays an important role in maintaining phosphorus homeostasis
A substantial body of evidence demonstrates the crucial role that GDPD TFs play in regulating phosphorus homeostasis in plants. Under conditions of phosphorus restriction, AtGDPD1 participates in the hydrolysis of deacyl phospholipases, such as glycerophosphoglycerophosphate, with the resultant G-3-P potentially being dephosphorylated via a GPP-mediated pathway to release phosphorus (Cheng Y et al., 2011). OsGDPD2 contributes to rice’s low-phosphorus tolerance by encouraging root growth and facilitating phosphorus release from cellular phosphorus pools (Poonam et al., 2019). Additionally, GDPD transcript levels have been observed to gradually accumulate during prolonged phosphorus deficiency in both rice and chickpea (Mehra et al., 2019; Zhang et al., 2007). Notably, most ZmGPX-PDE transcription levels are upregulated under phosphorus deficiency, a trend that is accompanied by an increase in ZmGPX-PDE activity (Wang et al., 2021). These findings suggest that phosphorus homeostasis is primarily maintained through the GDPD gene-mediated hydrolysis of phospholipids. Our research found that the over-expression of SiGDPD14 in Arabidopsis led to longer roots and increased fresh weight, suggesting that the GDPD gene family in foxtail millet may function similarly to that in Arabidopsis in maintaining phosphorus homeostasis.
5 Conclusion
This study identified 14 SiGDPDs via genome-wide analysis, examining their phylogenetic relationships, gene and protein structures, conserved motifs, chromosomal locations, gene duplication events, promoter cis-acting elements, and expression patterns under low phosphorus stress conditions. The findings suggest that the SiGDPD family can be divided into five groups, with an uneven distribution of the 14 SiGDPDs across eight chromosomes. Gene duplication analysis indicated tandem duplication as the primary mechanism driving SiGDPD family expansion, while purifying selection appears to be the main influence on the family’s evolution. The prediction of cis-acting elements unveiled several stress-responsive elements. Analysis of tissue specificity revealed different genes exhibiting varying levels of expression in different tissues (Figure 14). Results from qRT-PCR demonstrated significant changes in the expression levels of all 14 SiGDPD genes in root tissue following phosphorus starvation, particularly for SiGDPD3, SiGDPD1, SiGDPD5, SiGDPD6, SiGDPD11, and SiGDPD14. Furthermore, the heterologous expression of SiGDPD14 enhanced the tolerance to low phosphorus stress in transgenic Arabidopsis. These findings suggest that SiGDPD genes perform diverse biological functions and may regulate foxtail millet’s tolerance to low phosphorus stress. This comprehensive analysis of the SiGDPD gene family provides valuable insights for further understanding of their biological roles and identification of potential candidate genes for low-phosphorus tolerant breeding programs.
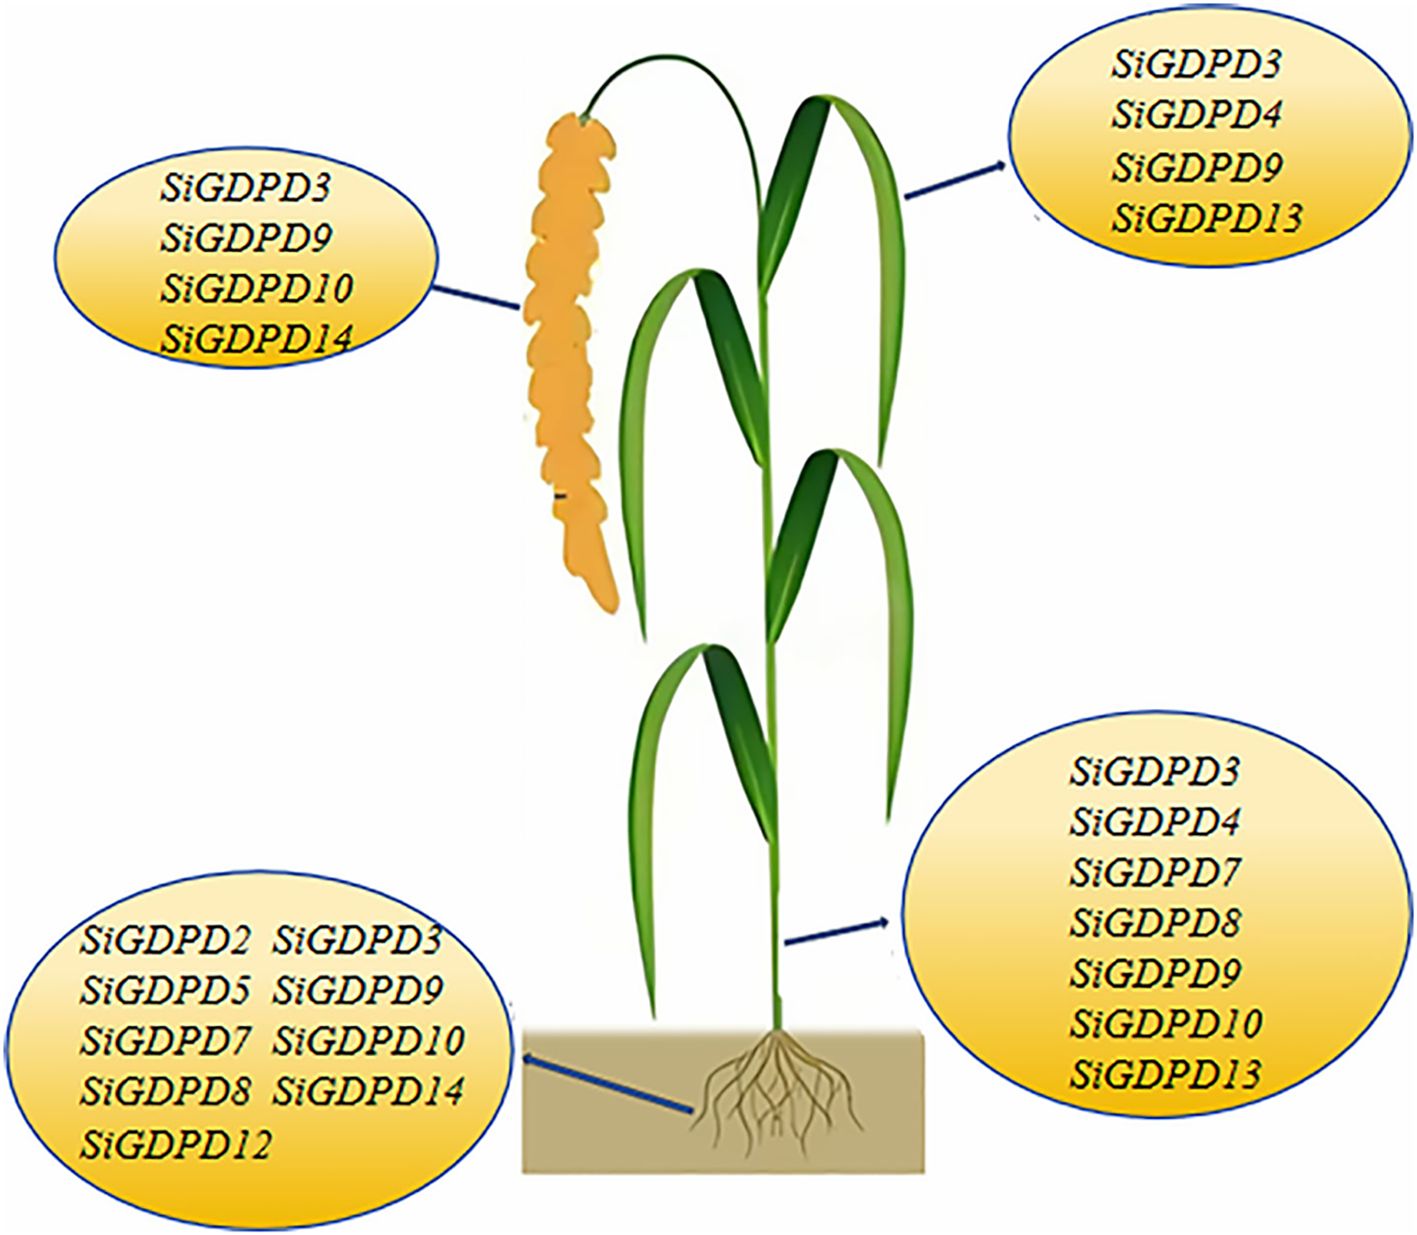
Figure 14. Model of the SiGDPD genes responding to low phosphorus stress in foxtail millet.
Data availability statement
The datasets presented in this study can be found in online repositories. The names of the repository/repositories and accession number(s) can be found in the article/Supplementary Material.
Author contributions
CM: Conceptualization, Funding acquisition, Project administration, Resources, Supervision, Writing – original draft, Writing – review & editing. HG: Data curation, Formal Analysis, Investigation, Methodology, Software, Validation, Visualization, Writing – original draft, Writing – review & editing. CW: Data curation, Investigation, Writing – original draft, Writing – review & editing. FY: Investigation, Software, Writing – review & editing. BD: Software, Writing – original draft, Writing – review & editing.
Funding
The author(s) declare that financial support was received for the research and/or publication of this article. This research was funded by Key Science and Technology Project of Henan Province, China (grant number: 242102110287); Dryland Smart Agriculture Science Group Project of Henan Province, China (grant number: 17100001).
Conflict of interest
The authors declare that the research was conducted in the absence of any commercial or financial relationships that could be construed as a potential conflict of interest.
Generative AI statement
The author(s) declare that no Generative AI was used in the creation of this manuscript.
Publisher’s note
All claims expressed in this article are solely those of the authors and do not necessarily represent those of their affiliated organizations, or those of the publisher, the editors and the reviewers. Any product that may be evaluated in this article, or claim that may be made by its manufacturer, is not guaranteed or endorsed by the publisher.
Supplementary material
The Supplementary Material for this article can be found online at: https://www.frontiersin.org/articles/10.3389/fpls.2025.1586547/full#supplementary-material
References
Altschul, S. F., Madden, T. L., Schäffer, A. A., Zhang, J., Zhang, Z., Miller, W., et al. (1997). Gapped BLAST and PSI-BLAST: a new generation of protein database search programs. Nucleic Acids Res. 25, 3389–3402. doi: 10.1093/nar/25.17.3389
Bailey, T. L., Boden, M., Buske, F. A., Frith, M., Grant, C. E., Ren, L. J., et al. (2009). MEME SUITE: tools for motif discovery and searching. Nucleic Acids Res. 37, W202–W208. doi: 10.1093/nar/gkp335
Chen, C., Chen, H., Zhang, Y., Thomas, H. R., Frank, M. H., He, Y., et al. (2020). TBtools: an integrative toolkit developed for interactive analyses of big biological data. Mol. Plant 13, 1194–1202. doi: 10.1016/j.molp.2020.06.009
Cheng, L., Bucciarelli, B. J., Liu, K., Zinn, S., Miller, J., Patton-Vogt, et al. (2011). White lupin cluster root acclimation to phosphorus deficiency and root hair development involve unique glycerophosphodiester phosphodiesterases. Plant Physiol. 156, 1131–1148. doi: 10.1104/pp.111.173724
Cheng, Y., Zhou, W. E., Sheery, N. I., Peters, C., Li, M., Wang, X., et al. (2011). Characterization of the Arabidopsis glycerophosphodiester phosphodiesterase (GDPD) family reveals a role of the plastid-localized AtGDPD1 in maintaining cellular phosphate homeostasis under phosphate starvation. Plant J. 66, 781–795. doi: 10.1111/j.1365-313X.2011.04538.x
Farn, J. L., Strugnell, R. A., Hoyne, P. A., Michalski, W. P., and Tennent, J. M. (2001). Molecular characterization of a secreted enzyme with phospholipase B activity from Moraxella bovis. J. Bacteriol. 183, 6717–6720. doi: 10.1128/jb.183.22.6717-6720.2001
Finn, R. D., Clements, J., and Eddy, S. R. (2011). HMMER web server: interactive sequence similarity searching. Nucleic Acids Res. 39, W29–W37. doi: 10.1093/nar/gkr367
Gorlova, O., Fedorov, A., Logothetis, C., Amos, C., and Gorlov, I. (2014). Genes with a large intronic burden show greater evolutionary conservation on the protein leve. BMC Evol. Biol. 14, 50. doi: 10.1186/1471-2148-14-50
Hernandez-Garcia, C. M. and Finer, J. J. (2014). Identification and validation of promoters and cis-acting regulatory elements. Plant Sci. 217–218, 109–119. doi: 10.1016/j.plantsci.2013.12.007
Higo, K., Ugawa, Y., Iwamoto, M., and Korenaga, T. (1999). Plant cis-acting regulatory DNA elements (PLACE) database: 1999. Nucleic Acids Res. 27, 297–300. doi: 10.1093/nar/27.1.297
Kumar, S., Stecher, G., and Tamura, K. (2016). MEGA7: molecular evolutionary genetics analysis version 7.0 for bigger datasets. Mol. Biol. Evol. 33, 1870–1874. doi: 10.1093/molbev/msw054
Li, X., Hou, S., Feng, M., Xia, R., Li, J., Tang, S., et al. (2023). MDSi: multi-omics database for setaria italica. BMC Plant Biol. 23, 223. doi: 10.1186/s12870-023-04238-3
Liu, W., Tang, X., Zhu, X., Qi, X., Zhang, N., and Si, H. (2019). Genome-wide identification and expression analysis of the E2 gene family in potato. Mol. Biol. Rep. 46, 777–791. doi: 10.1007/s11033-018-4533-9
Liu, Y., Xie, Y., Wang, H., Ma, X., Yao, W., and Wang, H. (2017). Light and ethylene coordinately regulate the phosphate starvation response through transcriptional regulation of PHOSPHATE STARVATION RESPONSE1. The Plant Cell. 29, 2269–2284. doi: 10.1105/tpc.17.00268
Lynch, M. and Conery, J. S. (2000). The evolutionary fate and consequences of duplicate genes. Science 290, 1151. doi: 10.1126/science.290.5494.1151
Macfarlane, W. M., McKinnon, C. M., Felton-Ed-kins, Z. A., Cragg, H., James, R. F., and Docherty, K. (1999). Glucose stimulates translocation of the homeodomain transcription factor PDX1 from the cytoplasm to the nucleus in pancreatic beta-cells. J. Biol. Chem. 274, 1011–1016. doi: 10.1074/jbc.274.2.1011
Matos, A. R. and Pham-Thi, A.-T. (2009). Lipid deacylating enzymes in plants: old activities,new genes. Plant Physiol. Biochem. 47, 491–503. doi: 10.1016/j.plaphy.2009.02.011
Mehra, P., Pandey, B. K., Verma, L., and Giri, J. (2019). A novel glycerophosphodiester phosphodiesterase improves phosphate deficiency tolerance in rice. Plant Cell Environ. 42, 1167–1179. doi: 10.1111/pce.13459
Oelkers, K., Goffard, N., Weiller, G. F., Gresshoff, P. M., Mathesius, U., and Frickey, T. (2008). Bioinformatic analysis of the CLE signaling peptide family. BMC Plant Biol. 8, 1–15. doi: 10.1186/1471-2229-8-1
Ohshima, N., Yamashita, S., Takahashi, N., Kuroishi, C., Shiro, Y., and Takio, K. (2008). Escherichia coli cytosolic glycerophosphodiester phosphodiesterase (UgpQ) requires Mg2+, Co2+, or Mn2+ for its enzyme activity. J. Bacteriol. 190, 1219–1223. doi: 10.1128/jb.01223-07
Poonam, M., K, B. P., Lokesh, V., and Giri, J. (2019). A novel glycerophosphodiester phosphodiesterase improves phosphate deficiency tolerance in rice. [J]. Plant Cell Environ. 42, 1167–1179. doi: 10.1111/pce.13459
Rozewicki, J., Li, S., M. Amada, K., Standley, D. M., and Katoh, K. (2019). MAFFT-DASH: integrated protein sequence and structural alignment. Nucleic Acids Res. 47, W5–W10. doi: 10.1093/nar/gkz342
Sakuraba, Y., Kanno, S., Mabuchi, A., Monda, K., Iba, K., and Yanagisawa, S. (2018). A phytochrome-B-mediated regulatory mechanism of phosphorus acquisition. Nat. Plants 4, 1089–1101. doi: 10.1038/s41477-018-0294-7
Sitkiewicz, I., Stockbauer, K. E., and Musser, J. M. (2007). Secreted bacterial phospholipase A2 enzymes: better living through phospholipolysis. Trends Microbiol. 15, 63–69. doi: 10.1016/j.tim.2006.12.003
Vander Rest, B., Boisson, A.-M., Gout, E., Bligny, R., and Douce, R. (2002). Glycerophosphocholine metabolism in higher plant cells. Evidence of a new glyceryl-phosphodiester phosphodiesterase. Plant Physiol. 130, 244–255. doi: 10.1104/pp.003392
Walther, D., Brunnemann, R., and Selbig, J. (2007). The regulatory code for transcriptional response diversity and its relation to genome structural properties in A.Thaliana. PloS Genet. 3, e11. doi: 10.1371/journal.pgen.0030011
Wang, J., Pan, W., Nikiforov, A., King, W., Hong, W., Li, W., et al. (2021). Identification of two glycerophosphodiester phosphodiesterase genes in maize leaf phosphorus remobilization. Crop J. 9, 95–108. doi: 10.1016/j.cj.2020.05.004
Wang, Z., Zheng, Z., Song, L., and Liu, D. (2018). Functional characterization of Arabidopsis PHL4 in plant response to phosphate starvation. Front. Plant Sci. 9. doi: 10.3389/fpls.2018.01432
Zhang, G., Liu, X., Quan, Z., Cheng, S., Xu, X., Pan, S., et al. (2012). Genome sequence of foxtail millet (Setaria italica) provides insights into grass evolution and biofuel potential. Nat. Biotechnol. 30, 549–554. doi: 10.1038/nbt.2195
Keywords: foxtail millet, GDPD, gene family, low phosphorus stress, over-expression, functional characterization
Citation: Meng C, Guo H, Wang C, Yang F and Du B (2025) Genome-wide identification of GDPD gene family in foxtail millet (Setaria italica L.) and functional characterization of SiGDPD14 under low phosphorus stress. Front. Plant Sci. 16:1586547. doi: 10.3389/fpls.2025.1586547
Received: 03 March 2025; Accepted: 26 May 2025;
Published: 18 June 2025.
Edited by:
Viswanathan Satheesh, Iowa State University, United StatesReviewed by:
Rakesh K. Upadhyay, Bowie State University, United StatesYifeng Wang, Chinese Academy of Agricultural Sciences, China
Copyright © 2025 Meng, Guo, Wang, Yang and Du. This is an open-access article distributed under the terms of the Creative Commons Attribution License (CC BY). The use, distribution or reproduction in other forums is permitted, provided the original author(s) and the copyright owner(s) are credited and that the original publication in this journal is cited, in accordance with accepted academic practice. No use, distribution or reproduction is permitted which does not comply with these terms.
*Correspondence: Chaomin Meng, Y2hhb21pbm1AaGF1c3QuZWR1LmNu
†These authors have contributed equally to this work